Embed Size (px)
Citation preview

Basics of Hypothesis
Testing8.2 Day 1

Introductory ActivityPut a tally mark next to the term that most accurately describes you:
Blue eyes:
Not blue eyes:
Dr. P. Sorita Soni at Indiana University claims that 35% of the American population has blue eyes. Do
you agree?

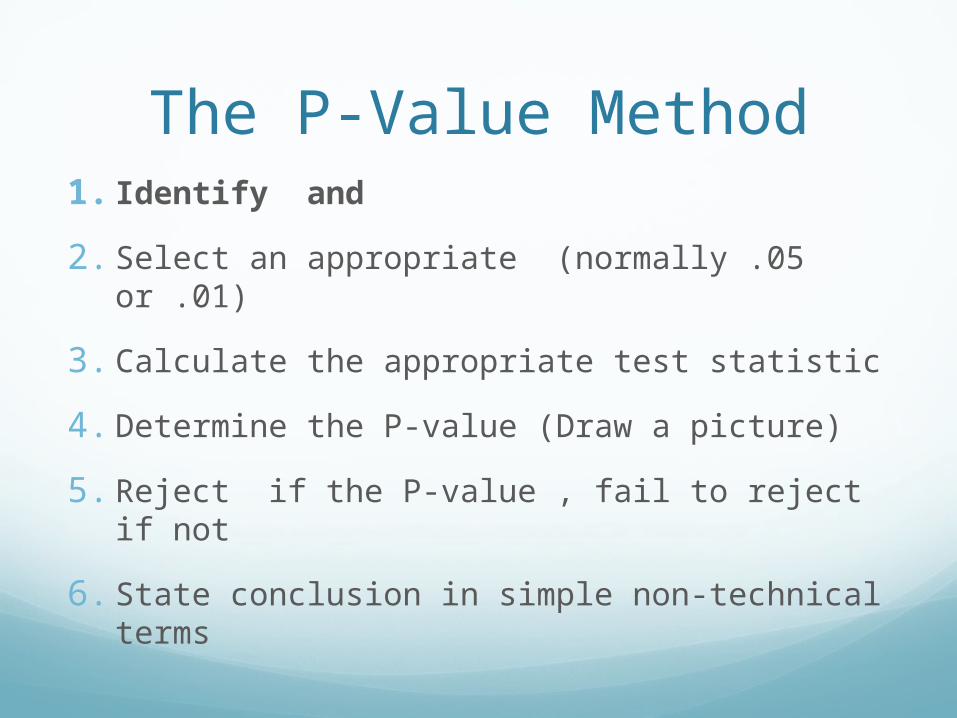
The P-Value Method1. Identify and
2. Select an appropriate (normally .05 or .01)
3. Calculate the appropriate test statistic
4. Determine the P-value (Draw a picture)
5. Reject if the P-value , fail to reject if not
6. State conclusion in simple non-technical terms
Not related to proportions!
The P-Value Method1. Identify and
2. Select an appropriate (normally .05 or .01)
3. Calculate the appropriate test statistic
4. Determine the P-value (Draw a picture)
5. Reject if the P-value , fail to reject if not
6. State conclusion in simple non-technical terms
Hypotheses, or the “null hypothesis,” is the accepted value
that is being challenged by the test.Always given by an equation for what the
parameter “should” be. Ex.
, or the “alternative hypothesis,” is what is being claimed to be true instead.Always given by an inequality that challenges the
null hypothesis. Ex.

ExampleThe Microsort company claims that their product
increases the probability that you will have a baby girl.
If a statistician were attempting to address this claim with a hypothesis test, what would they set as the null and alternative hypotheses?

Check Yo Self!
Identify Ho and H1. Be sure to use the correct symbol ( for the indicated
parameter.
The standard deviation of daily rainfall amounts in San Francisco is 0.66cm.

Check Yo Self!
Identify Ho and H1. Be sure to use the correct symbol ( for the indicated
parameter.
The mean weight of plastic discarded by households in one week is less than 1kg.

Check Yo Self!
Identify Ho and H1. Be sure to use the correct symbol ( for the indicated
parameter.
The proportion of homes with fire extinguishers is 0.80.

The P-Value Method1. Identify and
2. Select an appropriate (normally .05 or .01)
3. Calculate the appropriate test statistic
4. Determine the P-value (Draw a picture)
5. Reject if the P-value , fail to reject if not
6. State conclusion in simple non-technical terms

Setting the Significance Level
As it was in Chapter 7, we deal with confidence levels in our hypothesis testing.
We must now pay special attention to . represents the probability of a Type 1 Error
A type 1 error is when you reject a hypothesis that is actually true. If the impact of a type 1 error is severe, use If the impact is less severe, use

ExamplesDetermine what the statistician should use.
A statistician is testing the claim that the blast radius of a bomb is less than 1 square mile.
A statistician is testing the claim that the probability a student graduating high school is greater than 90%.

The P-Value Method1. Identify and
2. Select an appropriate (normally .05 or .01)
3. Calculate the appropriate test statistic
4. Determine the P-value (Draw a picture)
5. Reject if the P-value , fail to reject if not
6. State conclusion in simple non-technical terms

Choosing the Test StatisticWe must choose an appropriate test statistic in
order to find a “p-value” that will be used to analyze the null hypothesis. This all depends on what parameter is being tested. You may recognize aspects of these test statistics from past chapters. (pay attention to which distribution the test statistics come from).
Proportion:
Mean: or
Standard Deviation:
Note: The parameters () will come from the hypotheses, the test
statistics (, will come from whatever sample was collected to test
the claim.

ExampleConsider the Microsort example. The null
hypothesis is that p = 0.5. The sample that is returned shows that 13 out of 14 children whose parents used the product were girls.
Find the test statistic that would be used to challenge the null hypothesis.

Homeworkp.409:
Hypotheses: #9-13
Test Statistic: #27