Embed Size (px)
Citation preview

DRAFT – Helpful Hints: Basic Results 9-28-09
ClinicalTrials.gov “Basic Results” Database
HELPFUL HINTS
1. COMMON STUDY MODELS
a. Parallel Design (see example, pp. 5-11) The Protocol Registration System (PRS) defaults generally accommodate simple parallel design studies. The Arms information from the protocol section will be the default column headings for all tables in the results section (e.g., “Participant Flow: Overall Study” table on p. 6), although these can be changed, if appropriate (see “b. Crossover Design,” below).
b. Crossover Design (see example, pp. 12-20) Crossover studies generally require a few modifications to the default settings. For example, the column headings may not be the same for all tables. The attached example uses the randomized groups as the column headings for Participant Flow (pp. 12-13), but uses the overall group as a single column heading for the Baseline Characteristics (p. 14), and each separate intervention as column headings for the Outcome Measures (pp. 15-18). In addition, the Participant Flow is divided into three Periods to accurately reflect the different phases of the crossover study (p. 13).
c. Diagnostic Accuracy Studies (see example, pp. 21-29) Diagnostic accuracy studies are studies in which the results are generally displayed in a “2 x 2 table,” in which columns are displayed as “with disease” and “without disease” based on a reference standard; rows are “test positive” and “test negative” based on the experimental diagnostic test. The system can be used to create 2 x 2 tables, as illustrated in the attached example (e.g., “Measured Values” table on p. 25). In addition, the Participant Flow (p. 21) and the Baseline Characteristics (p. 22) may be reported for one group representing the entire study. Sensitivity (e.g., “Statistical Analysis 1…Using Threshold A” on p. 23) and specificity (e.g., “Statistical Analysis 2…Using Threshold A” on p. 24) can be entered as statistical analyses, based on each Outcome Measure (e.g., “Diagnostic Test for Disease Using Threshold A”). Separate Outcome Measures, with associated tables, can be defined based on the use of different thresholds (or positivity criteria) in order to display data that would underlie a ROC curve (e.g., “Threshold B” beginning on p. 24). The area under the curve can be reported as a statistical analysis after the last relevant 2 x 2 table, as illustrated (e.g., “Statistical Analysis 3…Using Threshold C” on p. 27).
d. Studies with Pharmacokinetic Outcome Measures (Bioequivalence Studies) Bioequivalence and other study types include Outcome Measures to assess the pharmacokinetics of an intervention. The system can accommodate pharmacokinetic outcome measures and specific examples are provided (pp. 30-
1

DRAFT – Helpful Hints: Basic Results 9-28-09
35). The Outcome Measure should be fully spelled out and any relevant description should be provided in the Outcome Measure Description. Generally, plasma blood samples are taken at regular time points to assess pharmacokinetics and the Time Frame data element should accurately reflect these time points. Many bioequivalence studies use a cross-over study design and it is recommended that the Crossover Design example (pp.12-20) be reviewed, if it applies.
2. MEASURES
a. Measure Type
i. Categorical Measures Most categorical measures will use the number of participants as the unit. (However, it is possible that a different unit, such as the number of knees examined, can be used.) The user can define the number of categories (two or more), and should use the data entry screens to fully characterize the categories and the measures that will be entered. Sometimes a dichotomous category is presented with only one of the two categories displayed (e.g., number improved). It is preferable to report both categories explicitly (e.g., number improved and number not improved). Note that it is possible to have a categorical measure with continuous data in each cell, such as mean blood pressure and standard deviation [SD] of participants in each of three baseline diagnostic categories (e.g., “Diastolic Blood Pressure” and “Systolic Blood Pressure” baseline measures on p. 14). In this situation, the unit of measurement will typically not be number of participants, but will be whatever units are used for the measurement (e.g., mm Hg for blood pressure). ii. Continuous Measures Continuous measures require a measure of central tendency (e.g., mean) and a measure of dispersion/uncertainty (e.g., standard deviation). These are selected from the pull down menus that are provided in the results section of the PRS. Note that confidence interval and standard error are measures of dispersion/uncertainty for Outcome Measures, but not for Baseline Measures. iii. Time to Event Measures At this time, time to event measures must be represented as either categorical measures (e.g., 5 year survival) or continuous measures (e.g., mean time to death) (e.g., “Time to Disease Progression” Outcome Measure on p. 7). If desired, a series of categories can be defined to represent time points on a survival curve.
2

DRAFT – Helpful Hints: Basic Results 9-28-09
b. Specific Measure Issues
Scales Outcomes may be evaluated and reported with a specific scale. In order for the measure and the outcome to be easily understood, users should describe the scale in the Outcome Measure Title, Description, and Units of Measure fields (e.g., “Mean score on the National Library of Medicine (NLM) Pain Scale” Outcome Measure below). Specific items to describe include the following:
Outcome Measure Title: Name of scale (e.g., mean score on NLM Pain Scale)
Outcome Measure Description: o What the scale measures (e.g., severity of pain) o Range and direction (e.g., 0 is no pain and 20 is severe pain) o Other information as appropriate (e.g., whether the scale is ordinal
or continuous). Units of Measure: expressed as “units on a scale,” “scores on a scale,” or
“points on a scale”
3

DRAFT – Helpful Hints: Basic Results 9-28-09
4
3. STATISTICAL ANALYSES Statistical analyses are tied to a specific Outcome Measure. The system allows for the entry of p-values and/or confidence intervals. There is no limit to the number of analyses that can be entered for a given Outcome Measure (e.g., four statistical analyses are associated with the Primary Outcome Measure on pp. 7-9). If a p-value is entered, the test used must be specified. Similarly, if a confidence interval is entered, the estimated parameter must be specified. Users are encouraged to use the free text boxes to provide more complete explanations of their analyses.
4. ADVERSE EVENTS The Adverse Event module is optional (until Sept 27, 2009). However, if one chooses to use the module, the required data elements must be provided (e.g., pp. 10-11). There are separate tables for Serious Adverse Events, and for Other Adverse Events (based on frequency). The same event(s) involving the same participants should not be listed in both tables.

DRAFT – Parallel Design Example – Public Display 9-28-09
Parallel Design Example
This study has been completed. Information provided by Test Organization
Study Type: Interventional
Study Design: Randomized, Double Blind (Subject, Investigator, Outcomes Assessor), Parallel Assignment
Interventions: Drug: Drug A Drug: Drug B Drug: Placebo
Participant Flow Recruitment Details
Key information relevant to the recruitment process for the overall study, such as dates of the recruitment period and locations
Participants were recruited from the waiting room of ABC Medical Clinic between January 2005 and January 2006
Pre-Assignment Details
Significant events and approaches for the overall study following participant enrollment, but prior to group assignment
Participants screened over 3 week period.
Reporting Groups
Description
Drug A 10mg Drug A administered twice daily
Drug B 20mg Drug B administered twice daily
Placebo Participants were given a single pill, twice daily.
5

DRAFT – Parallel Design Example – Public Display 9-28-09
Participant Flow: Overall Study
Drug A Drug B Placebo
STARTED 50 50 50
COMPLETED 48 49 47
NOT COMPLETED 2 1 3
Lost to Follow-up 1 0 2
Adverse Event 1 1 1
Baseline Characteristics Reporting Groups
Description
Drug A 10mg Drug A administered twice daily
Drug B 20mg Drug B administered twice daily
Placebo Participants were given a single pill, twice daily.
Baseline Measures
Drug A Drug B Placebo Total
Number of Participants [units: participants]
50 50 50 150
Age [units: participants]
<=18 years 0 0 0 0
Between 18 and 65 years
50 50 50 150
>=65 years 0 0 0 0
Age [units: years] Mean ± Standard Deviation
41 ± 12 42 ± 11 41 ± 11 41 ± 11
Gender [units: participants]
Female 25 23 28 76
Male 25 27 22 74
6

DRAFT – Parallel Design Example – Public Display 9-28-09
Outcome Measures 1. Primary Outcome Measure: Time to Disease Progression
Measure Type Primary
Measure Name Time to Disease Progression
Measure Description Disease progression was defined as >25% loss in hearing compared to baseline.
Time Frame 24 months
Safety Issue No
Hide Details
Population Description
Explanation of how the number of participants for analysis was determined. Includes whether analysis was per protocol, intention to treat, or another method. Also provides relevant details such as imputation technique, as appropriate.
The population analyzed included all participants receiving at least 1 dose of study intervention and at least 1 assessment post-baseline.
Reporting Groups
Description
Drug A 10mg Drug A administered twice daily
Drug B 20mg Drug B administered twice daily
Placebo Participants were given a single pill, twice daily.
Measured Values
Drug A Drug B Placebo
Number of Participants Analyzed [units: Participants]
50 50 50
Time to Disease Progression [units: Days] Log Mean ± Standard Deviation
4.94 ± 1.325.52 ± 1.284.78 ± 1.11
7

DRAFT – Parallel Design Example – Public Display 9-28-09
Statistical Analysis 1 for Time to Disease Progression
Groups [1] All groups
Method [2] ANOVA
P Value [3] 0.011
[1] Additional details about the analysis, such as null hypothesis and power calculation:
Omnibus analysis was performed. Number of observations=150; Root mean squared error (RMSE)=1.33; R squared = 0.059; Adjusted R squared=0.046
[2] Other relevant information, such as adjustments or degrees of freedom: No text entered. [3] Additional information, such as whether or not the p-value is adjusted for multiple
comparisons and the a priori threshold for statistical significance: p<0.05 considered significant Statistical Analysis 2 for Time to Disease Progression
Groups [1] Drug A vs. Drug B
Method [2] t-test, 2 sided
P Value [3] 0.017
Mean Difference (Net) [4] -0.672
95% Confidence Interval ( -1.224 to -0.119 )
[1] Additional details about the analysis, such as null hypothesis and power calculation: No text entered. [2] Other relevant information, such as adjustments or degrees of freedom: No text entered. [3] Additional information, such as whether or not the p-value is adjusted for multiple
comparisons and the a priori threshold for statistical significance: Pairwise comparisons were not corrected for multiple comparisons. [4] Other relevant estimation information: Mean difference=Drug A minus Drug B
8

DRAFT – Parallel Design Example – Public Display 9-28-09
Statistical Analysis 3 for Time to Disease Progression
Groups [1] Drug A vs. Placebo
Method [2] t-test, 2 sided
P Value [3] 0.825
Mean Difference (Net) [4] 0.059
95% Confidence Interval ( -0.475 to 0.594 )
[1] Additional details about the analysis, such as null hypothesis and power calculation:
No text entered.
[2] Other relevant information, such as adjustments or degrees of freedom:
No text entered.
[3] Additional information, such as whether or not the p-value is adjusted for multiple comparisons and the a priori threshold for statistical significance:
Not corrected for multiple comparisons.
[4] Other relevant estimation information:
Mean difference is Drug A minus Placebo
Statistical Analysis 4 for Time to Disease Progression
Groups [1] Drug B vs. Placebo
Method [2] t-test, 2 sided
P Value [3] 0.004
Mean Difference (Net) [4] 0.731
95% Confidence Interval ( 0.234 to 1.228 )
[1] Additional details about the analysis, such as null hypothesis and power calculation: No text entered. [2] Other relevant information, such as adjustments or degrees of freedom: Not adjusted for multiple comparisons [3] Additional information, such as whether or not the p-value is adjusted for multiple
comparisons and the a priori threshold for statistical significance: No text entered. [4] Other relevant estimation information: Mean difference is Drug B minus Placebo
9

DRAFT – Parallel Design Example – Public Display 9-28-09
2. Secondary Outcome Measure: Time to Symptom Y
Measure Type Secondary
Measure Name Time to Symptom Y
Measure Description
Time Frame 36 months
Safety Issue No
Results not yet posted Anticipated Posting Date: May 2010.
Reported Adverse Events Reporting Groups
Description
Drug A 10mg Drug A administered twice daily
Drug B 20mg Drug B administered twice daily
Placebo Participants were given a single pill, twice daily.
Time Frame 24 months
Additional Description A validated questionnaire was used to assess adverse events every 3 months.
Serious Adverse Events
Drug A Drug B Placebo Total # participants affected/at risk 0/50 0/50 0/50 Other Adverse Events Frequency Threshold Above which Other Adverse Events are Reported: 5%
Drug A Drug B Placebo Total # participants affected/at risk 16/50 4/50 13/50
Gastrointestinal disorders Nausea † # participants affected/at risk # events
4/50 (8%)
4
2/50 (4%)
2
2/50 (4%)
2
Nervous system disorders Headache † # participants affected/at risk number of events
12/50 (24%)
12
2/50 (4%)
2
11/50 (22%)
11 † Indicates events were collected by systematic assessment
10

DRAFT – Parallel Design Example – Public Display 9-28-09
11
More Information
Certain Agreements:
All Principal Investigators ARE employed by the organization sponsoring the study.
Limitations and Caveats
Limitations of the study, such as early termination leading to small numbers of participants analyzed and technical problems with measurement leading to unreliable or uninterpretable data
No text entered.
Results Point of Contact:
Name/Title: Jane Doe Organization: ABC Health Center phone: 123-456-7890 ext 123 e-mail: [email protected]
U.S. National Library of Medicine, Contact Help Desk U.S. National Institutes of Health, U.S. Department of Health & Human Services,
USA.gov, Copyright, Privacy, Accessibility, Freedom of Information Act

DRAFT – Crossover Study Example – Public Display 9-28-09
Crossover Study Example: Drug A vs. Placebo
This study has been completed. Information provided by Test Organization
Study Type: Interventional
Study Design: Randomized, Double Blind (Subject, Caregiver, Investigator), Placebo Control, Crossover Assignment
Interventions: Drug: Allopurinol
Participant Flow
Recruitment Details
Key information relevant to the recruitment process for the overall study, such as dates of the recruitment period and locations
Participants recruited from a specialty clinic at a hospital, in Fictional City, USA between October 2004 and January 2007.
Pre-Assignment Details
Significant events and approaches for the overall study following participant enrollment, but prior to group assignment
267 participants recruited; 186 screened, 56 excluded (36 did not meet inclusion criteria and 20 refused participation).
Reporting Groups
Description
Placebo First, then Drug A
Placebo twice daily in first intervention period and Drug A 25 mg twice daily in second intervention period (after washout period).
Drug A First, then Placebo
Drug A 25 mg twice daily in first intervention period and Placebo twice daily in second intervention period (after washout period).
12

DRAFT – Crossover Study Example – Public Display 9-28-09
Participant Flow for 3 periods
Period: First Intervention
Placebo First,then Drug A
Drug A First,then Placebo
STARTED 65 65
Received at Least One Dose of Drug 65 64
COMPLETED 65 63
NOT COMPLETED 0 2
Neutropenia 0 1
Withdrawal by Subject 0 1
Period: Washout Period of 2 Weeks
Placebo First,then Drug A
Drug A First,then Placebo
STARTED 65 63
COMPLETED 63 62
NOT COMPLETED 2 1
Disease relapse 2 1
Period: Second Intervention
Placebo First, then Drug A
Drug A First,then Placebo
STARTED 63 62
COMPLETED 60 62
NOT COMPLETED 3 0
Adverse Event 2 0
Lost to Follow-up 1 0
13

DRAFT – Crossover Study Example – Public Display 9-28-09
Baseline Characteristics Reporting Groups
Description
Entire Study Population Includes groups randomized to receive placebo first and Drug A first.
Baseline Measures
Entire Study Population
Number of Participants [units: participants]
130
Age [units: participants]
<=18 years 0
Between 18 and 65 years 130
>=65 years 0
Age [units: years] Mean ± Standard Deviation
40.3 ± 5.6
Gender, [units: participants]
Female 60
Male 70
diastolic blood pressure [units: mm Hg] Mean ± Standard Deviation
At enrollment 82 ± 9.3
Beginning of Placebo treatment 81 ± 9.1
Beginning of Drug A treatment 82 ± 9.2
systolic blood pressure[1] [units: mm Hg] Mean ± Standard Deviation
At enrollment 138 ± 21.2
Beginning of Placebo treatment 138 ± 18.6
Beginning of Drug A treatment 136 ± 19.7
weight [units: kg] Mean ± Standard Deviation
65 ± 11.2
[1]
Measurements were taken at baseline, at beginning of 1st and 2nd intervention periods, and end of 1st and 2nd intervention periods. Yielding baseline measurements for treatment with Placebo and Drug A.
14

DRAFT – Crossover Study Example – Public Display 9-28-09
Outcome Measures 1. Primary Outcome Measure: Change from Baseline in Diastolic Blood Pressure at 3 Months
Measure Type Primary
Measure Name Change from Baseline in Diastolic Blood Pressure at 3 Months
Measure Description Value at 3 months minus value at baseline.
Time Frame Baseline and 3 months
Safety Issue No
Hide Details
Population Description
Explanation of how the number of participants for analysis was determined. Includes whether analysis was per protocol, intention to treat, or another method. Also provides relevant details such as imputation technique, as appropriate.
Intent to treat analysis including only participants who had at least one post-baseline assessment.
Reporting Groups
Description
Placebo Placebo administered twice daily in either first intervention period or second intervention period.
Drug A Drug A 25 mg administered twice daily in either first intervention period or second intervention period.
Measured Values
Placebo Drug A
Number of Participants Analyzed [units: Participants]
127 127
Change in Diastolic Blood Pressure [units: mm Hg] Mean ( 95% Confidence Interval )
-2.3 ( -5.0to 1.0 )
-4.9 ( -8.2 to -3.0 )
15

DRAFT – Crossover Study Example – Public Display 9-28-09
Statistical Analysis 1 for Change from Baseline in Diastolic Blood Pressure at 3 Months
Groups [1] All groups
Method [2] Paired t-test
P Value [3] <0.04
[1] Additional details about the analysis, such as null hypothesis and power calculation:
125 participants required to detect 5 mm Hg difference in diastolic BP change, with 90% power. BP parameters not considered independent; 50% covariance assumed. Alpha level of 0.05.
[2] Other relevant information, such as adjustments or degrees of freedom:
No text entered.
[3] Additional information, such as whether or not the p-value is adjusted for multiple comparisons and the a priori threshold for statistical significance:
Two-sided 2. Primary Outcome Measure: Change from Baseline in Systolic Blood Pressure at 3 Months
Measure Type Primary
Measure Name Change in Systolic Blood Pressure
Measure Description Value at 3 months minus value at baseline.
Time Frame Baseline and 3 months
Safety Issue No
Hide Details Population Description
Explanation of how the number of participants for analysis was determined. Includes whether analysis was per protocol, intention to treat, or another method. Also provides relevant details such as imputation technique, as appropriate.
Total number of participants completing period with study intervention.
16

DRAFT – Crossover Study Example – Public Display 9-28-09
Reporting Groups
Description
Placebo Placebo administered twice daily in either first intervention period or second intervention period.
Drug A Drug A 25 mg administered twice daily in either first intervention period or second intervention period.
Measured Values
Placebo Drug A
Number of Participants Analyzed [units: Participants]
127 127
Change in Systolic Blood Pressure [units: mm Hg] Mean ( 95% Confidence Interval )
-2.1 ( -4.8 to 0.2 )
-7.2 ( -9.6 to -5.1 )
Statistical Analysis 1 for Change from Baseline in Systolic Blood Pressure at 3 Months
Groups [1] All groups
Method [2] Paired t-test
P Value [3] 0.007
[1] Additional details about the analysis, such as null hypothesis and power calculation:
125 participants required to detect 5 mm Hg difference in systolic BP change, with 90% power. BP parameters not considered independent; 50% covariance assumed. Alpha level of 0.05.
[2] Other relevant information, such as adjustments or degrees of freedom:
No text entered.
[3] Additional information, such as whether or not the p-value is adjusted for multiple comparisons and the a priori threshold for statistical significance:
Two-sided.
17

DRAFT – Crossover Study Example – Public Display 9-28-09
3. Secondary Outcome Measure: Plasma Level of Marker X
Measure Type Secondary
Measure Name Plasma Level of Marker X
Measure Description
Time Frame Baseline and 3 months
Safety Issue No
Results not yet posted Anticipated Posting Date: May 2010 4. Secondary Outcome Measure: Change from baseline in Weight at 3 Months
Measure Type Secondary
Measure Name Change in Weight
Measure Description
Time Frame Baseline and 3 months
Safety Issue No
Results not yet posted Anticipated Posting Date: May 2010
18

DRAFT – Crossover Study Example – Public Display 9-28-09
Reported Adverse Events Reporting Groups
Description
Placebo Placebo administered twice daily in either first intervention period or second intervention period.
Drug A Drug A 25 mg administered twice daily in either first intervention period or second intervention period.
Time Frame 3 months
Additional Description
Serious Adverse Events
Placebo Drug A
Total # participants affected/at risk 0/127 1/127
Blood and lymphatic system disorders
Neutropenia‡ # participants affected/at risk # events
0/127 (0%)
0
1/127 (0.79%)
1 ‡ Indicates events were collected by non-systematic methods. Other Adverse Events Frequency Threshold Above which Other Adverse Events are Reported: 5%
Placebo Drug A
Total # participants affected/at risk 5/127 10/127
Gastrointestinal disorders
Nausea ‡ # participants affected/at risk # events
5/127 (3.94%)
7
10/127 (7.87%)
12 ‡ Indicates events were collected by non-systematic methods.
19

DRAFT – Crossover Study Example – Public Display 9-28-09
20
More Information Certain Agreements:
Principal Investigators (PIs) are NOT employed by the organization sponsoring the study.
There IS an agreement between Principal Investigators and the Sponsor (or its agents) that restricts the PI’s rights to discuss or publish trial results after the trial is completed.
The agreement is:
The only disclosure restriction on the PI is that the sponsor can review results communications prior to public release and can embargo communications regarding trial results for a period that is less than or equal to 60 days. The sponsor cannot require changes to the communication and cannot extend the embargo.
The only disclosure restriction on the PI is that the sponsor can review results communications prior to public release and can embargo communications regarding trial results for a period that is more than 60 days but less than or equal to 180 days. The sponsor cannot require changes to the communication and cannot extend the embargo.
Other disclosure agreement that restricts the right of the PI to discuss or publish trial results after the trial is completed.
Limitations and Caveats
Limitations of the study, such as early termination leading to small numbers of participants analyzed and technical problems with measurement leading to unreliable or uninterpretable data
No text entered.
Results Point of Contact:
Name/Title: Dr. Clinical Trial Organization: Clinical Trial University e-mail: [email protected]
U.S. National Library of Medicine, Contact Help Desk U.S. National Institutes of Health, U.S. Department of Health & Human Services,
USA.gov, Copyright, Privacy, Accessibility, Freedom of Information Act

DRAFT – Diagnostic Test Accuracy Example – Public Display 9-28-09
Diagnostic Test Accuracy Example
This study has been completed. Information provided by Test Organization
Study Type: Interventional
Study Design: Open Label
Interventions: Procedure: comparison of screening methods Procedure: computed tomography colonography Procedure: screening colonoscopy
Participant Flow Recruitment Details
Key information relevant to the recruitment process for the overall study, such as dates of the recruitment period and locations
2700 participants were selected from multiple primary care sites across the country and all were healthy at baseline without symptoms of disease.
Pre-Assignment Details
Significant events and approaches for the overall study following participant enrollment, but prior to group assignment
100 participants were excluded because they did not properly observe the required pre-diagnostic test routine.
Reporting Groups
Description
Total Number of Participants All participants who received the reference test (i.e. the gold standard).
Participant Flow: Overall Study
Reference Test
STARTED 2600
COMPLETED 2500
NOT COMPLETED 100
Protocol Violation 100
21

DRAFT – Diagnostic Test Accuracy Example – Public Display 9-28-09
Baseline Characteristics Reporting Groups
Description
Total Number of Participants All participants who received the reference test (i.e. the gold standard).
Baseline Measures
Total Number of Participants
Number of Participants [units: participants]
2600
Age [units: participants]
<=18 years 0
Between 18 and 65 years 2600
>=65 years 0
Age [units: years] Mean ± Standard Deviation
57 ± 6
Gender [units: participants]
Female 1400
Male 1200
Region of Enrollment [units: participants]
United States 2600
Outcome Measures
1. Primary Outcome Measure: Diagnostic Test Data for Disease Using Threshold A
Measure Type Primary
Measure Name Diagnostic Test Data for Disease Using Threshold A
Measure Description Disease status was determined by results of reference test.
Time Frame 1 month
Safety Issue No
22

DRAFT – Diagnostic Test Accuracy Example – Public Display 9-28-09
Hide Details Population Description
Explanation of how the number of participants for analysis was determined. Includes whether analysis was per protocol, intention to treat, or another method. Also provides relevant details such as imputation technique, as appropriate.
No text entered.
Reporting Groups
Description
Participants With Disease Presence of disease defined by positive reference test
Participants Without Disease Absence of disease defined by negative reference test
Measured Values
Participants
With Disease Participants Without
Disease
Number of Participants Analyzed
[units: Participants] 450 2050
Diagnostic Test Data for Disease Using Threshold A [units: participants]
Positive diagnostic test for disease using threshold A 405 175
Negative diagnostic test for disease using threshold A 45 1875 Statistical Analysis 1 for Diagnostic Test Data for Disease Using Threshold A
Groups [1] Participants With Disease
Sensitivity [2] 0.90
95% Confidence Interval ( 0.87 to 0.93 )
[1] Additional details about the analysis, such as null hypothesis and power calculation:
No text entered.
[2] Other relevant estimation information:
Calculated as proportion of those with disease who had a positive test result.
23

DRAFT – Diagnostic Test Accuracy Example – Public Display 9-28-09
Statistical Analysis 2 for Diagnostic Test Data for Disease Using Threshold A
Groups [1] Participants Without Disease
Specificity [2] 0. 91
95% Confidence Interval ( 0.90 to 0.93 )
[1] Additional details about the analysis, such as null hypothesis and power calculation:
No text entered.
[2] Other relevant estimation information:
Specificity was calculated as the proportion of those without disease who had a negative test.
2. Primary Outcome Measure: Diagnostic Test Data for Disease Using Threshold B
Measure Type Primary
Measure Name Diagnostic Test Data for Disease Using Threshold B
Measure Description Disease status was determined by results of reference test.
Time Frame 1 month
Safety Issue No
Hide Details
Population Description
Explanation of how the number of participants for analysis was determined. Includes whether analysis was per protocol, intention to treat, or another method. Also provides relevant details such as imputation technique, as appropriate.
No text entered.
Reporting Groups
Description
Participants With Disease Presence of disease defined by positive reference test
Participants Without Disease Absence of disease defined by negative reference test
24

DRAFT – Diagnostic Test Accuracy Example – Public Display 9-28-09
Measured Values
Participants
With Disease Participants Without
Disease
Number of Participants Analyzed
[units: Participants] 450 2050
Diagnostic Test Data for Disease Using Threshold B [units: participants]
Positive diagnostic test for disease using threshold B 400 150
Negative diagnostic test for disease using threshold B 50 1900 Statistical Analysis 1 for Diagnostic Test Data for Disease Using Threshold B
Groups [1] Participants With Disease
Sensitivity [2] 0.89
95% Confidence Interval ( 0.84 to 0.95 )
[1] Additional details about the analysis, such as null hypothesis and power calculation:
No text entered.
[2] Other relevant estimation information:
No text entered. Statistical Analysis 2 for Diagnostic Test Data for Disease Using Threshold B
Groups [1] Participants Without Disease
Specificity [2] 0.93
95% Confidence Interval ( 0.87 to 0.99 )
[1] Additional details about the analysis, such as null hypothesis and power calculation:
No text entered.
[2] Other relevant estimation information:
No text entered.
25
DRAFT – Diagnostic Test Accuracy Example – Public Display 9-28-09
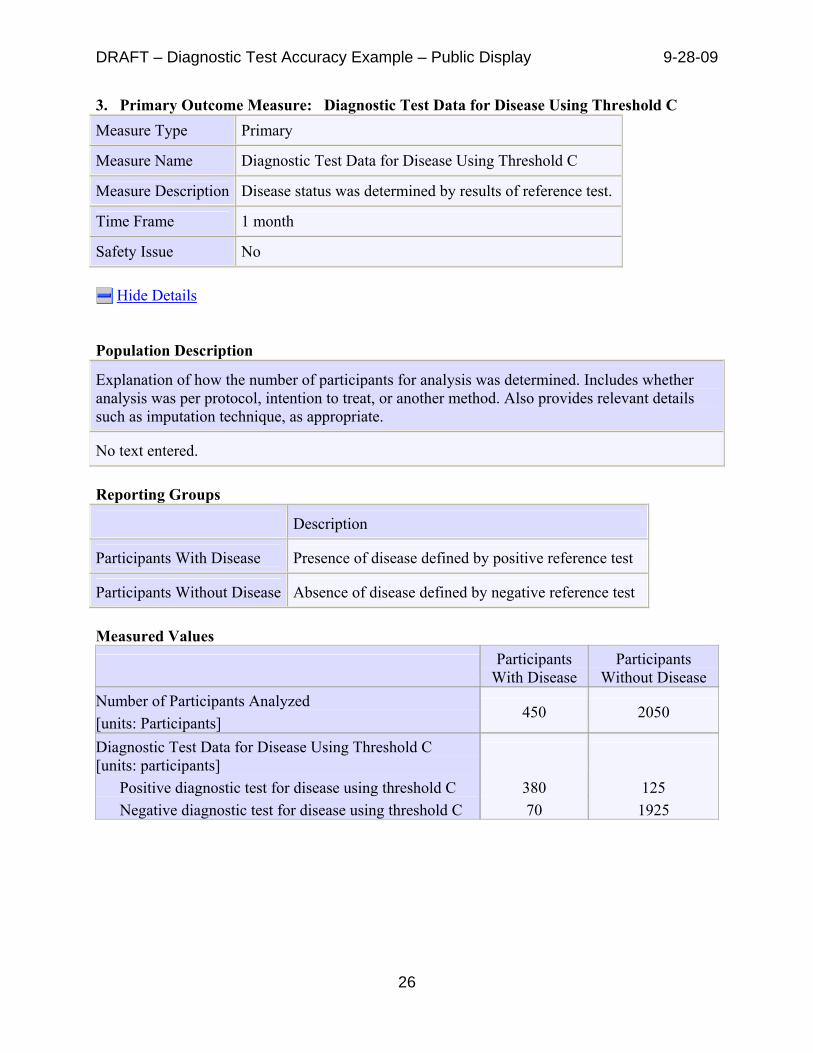
3. Primary Outcome Measure: Diagnostic Test Data for Disease Using Threshold C
Measure Type Primary
Measure Name Diagnostic Test Data for Disease Using Threshold C
Measure Description Disease status was determined by results of reference test.
Time Frame 1 month
Safety Issue No
Hide Details
Population Description
Explanation of how the number of participants for analysis was determined. Includes whether analysis was per protocol, intention to treat, or another method. Also provides relevant details such as imputation technique, as appropriate.
No text entered.
Reporting Groups
Description
Participants With Disease Presence of disease defined by positive reference test
Participants Without Disease Absence of disease defined by negative reference test
Measured Values
Participants
With Disease Participants
Without Disease
Number of Participants Analyzed
[units: Participants] 450 2050
Diagnostic Test Data for Disease Using Threshold C [units: participants]
Positive diagnostic test for disease using threshold C 380 125
Negative diagnostic test for disease using threshold C 70 1925
26

DRAFT – Diagnostic Test Accuracy Example – Public Display 9-28-09
Statistical Analysis 1 for Diagnostic Test Data for Disease Using Threshold C
Groups [1] Participants With Disease
Sensitivity [2] 0.84
95% Confidence Interval ( 0.80 to 0.88 )
[1] Additional details about the analysis, such as null hypothesis and power calculation:
No text entered.
[2] Other relevant estimation information:
No text entered. Statistical Analysis 2 for Diagnostic Test Data for Disease Using Threshold C
Groups [1] Participants Without Disease
Specificity [2] 0.94
95% Confidence Interval ( 0.89 to 0.99 )
[1] Additional details about the analysis, such as null hypothesis and power calculation:
No text entered.
[2] Other relevant estimation information:
No text entered. Statistical Analysis 3 for Diagnostic Test Data for Disease Using Threshold C
Groups [1] All groups
Area Under the Curve [2] 0.91
95% Confidence Interval ( 0.89 to 0.95 )
[1] Additional details about the analysis, such as null hypothesis and power calculation:
The Area Under the Curve was estimated based on the sensitivity and specificity measures for each of three thresholds (A, B, and C)
[2] Other relevant estimation information:
No text entered.
27

DRAFT – Diagnostic Test Accuracy Example – Public Display 9-28-09
Reported Adverse Events Reporting Groups
Description
Total Number of Participants All participants received the reference test (i.e. the gold standard).
Serious Adverse Events
Total Number of Participants
Total # participants affected/at risk 0/2500 Other Adverse Events Frequency Threshold Above Which Other Adverse Events are Reported: 5%
Total Number of Participants
Total # participants affected/at risk 128/2500
Gastrointestinal disorders
nausea # participants affected/at risk # events
128/2500 (5.12%)
130
More Information Certain Agreements:
Principal Investigators (PIs) are NOT employed by the organization sponsoring the study.
There is NOT an agreement between Principal Investigators and the Sponsor (or its agents) that restricts the PI’s rights to discuss or publish trial results after the trial is completed.
28

DRAFT – Diagnostic Test Accuracy Example – Public Display 9-28-09
29
Limitations and Caveats
Limitations of the study, such as early termination leading to small numbers of participants analyzed and technical problems with measurement leading to unreliable or uninterpretable data
Only the most experienced technologists participated and were asked to read the test results in this study. Results may not be applicable to those centers without technologists with extensive related experience.
Results Point of Contact:
Name/Title: Dr. Y Organization: Test Coop phone: 123-457-9087 ext 1234 e-mail: [email protected]
U.S. National Library of Medicine, Contact Help Desk
U.S. National Institutes of Health, U.S. Department of Health & Human Services, USA.gov, Copyright, Privacy, Accessibility, Freedom of Information Act

DRAFT – Bioequivalence Study Example – Public Display 9-28-09
Pharmacokinetic Outcome Measures (Bioequivalence Study) Example
This study has been completed. Information provided by Test Organization
Outcome Measures 1. Primary Outcome Measure: Maximum Observed Plasma Concentration (Cmax)
Measure Type Primary
Measure Name Maximum Observed Plasma Concentration (Cmax)
Measure Description
Time Frame 0, 1, 2, 3, 4, 6, 8, 12, 24, 48, 72, 96 hours post-dose
Safety Issue No
Hide Details
Population Description
Explanation of how the number of participants for analysis was determined. Includes whether analysis was per protocol, intention to treat, or another method. Also provides relevant details such as imputation technique, as appropriate.
Each participant received reference and test drug and is, therefore, included in the analysis population for both the reference and test drug.
Measured Values
Reference Drug 150 mg Test Drug 150 mg
Number of Participants
[units: Participants] 14 14
Maximum Observed Plasma Concentration (Cmax) [units: mcg/mL] Mean ± Standard Deviation
3.64 ± 0.79 3.75 ± 0.75
30

DRAFT – Bioequivalence Study Example – Public Display 9-28-09
Statistical Analysis 1 for Maximum Observed Plasma Concentration (Cmax)
Groups [1] Reference Drug 150 mg, Test Drug 150 mg
Method [2] ANOVA
P-Value [3] 0.087975
Other Estimated Parameter [Ratio of Cmax values] [4] 103.02
90% Confidence Interval (101.06 to 105.45)
[1] Additional details about the analysis, such as null hypothesis and power calculation: No text entered [2] Additional information, such as whether or not the p-value is adjusted for multiple comparisons and
the a priori threshold for statistical significance: No text entered. [3] Other relevant information, such as adjustments or degrees of freedom: No text entered. [4] Other relevant estimation information: Ratio of Cmax values = Test drug 150mg/Reference drug 150mg 2. Primary Outcome Measure: Time to Reach Maximum Observed Plasma Concentration (Tmax)
Measure Type Primary
Measure Name Time to Reach Maximum Observed Plasma Concentration (Tmax)
Measure Description
Time Frame 0, 1, 2, 3, 4, 6, 8, 12, 24, 48, 72, 96 hours post-dose
Safety Issue No
Hide Details
Population Description
Explanation of how the number of participants for analysis was determined. Includes whether analysis was per protocol, intention to treat, or another method. Also provides relevant details such as imputation technique, as appropriate.
Each participant received reference and test drug and is, therefore, included in the analysis population for both the reference and test drug.
31

DRAFT – Bioequivalence Study Example – Public Display 9-28-09
Measured Values
Reference Drug
150 mg Test Drug 150 mg
Number of Participants
[units: Participants] 14 14
Time to Reach Maximum Observed Plasma Concentration (Tmax)[units: hours] Mean ± Standard Deviation
2.96 ± 1.00 2.79 ± 1.26
3. Primary Outcome Measure: Area Under the Curve From Time Zero to Last Quantifiable Concentration [AUC (0-t)]
Measure Type Primary
Measure Name Area Under the Curve From Time Zero to Last Quantifiable Concentration [AUC (0-t)]
Measure Description AUC (0-t)= Area under the plasma concentration versus time curve from time zero (pre-dose) to time of last quantifiable concentration (0-t)
Time Frame 0, 1, 2, 3, 4, 6, 8, 12, 24, 48, 72, 96 hours post-dose
Safety Issue No
Hide Details
Population Description
Explanation of how the number of participants for analysis was determined. Includes whether analysis was per protocol, intention to treat, or another method. Also provides relevant details such as imputation technique, as appropriate.
Each participant received reference and test drug and is, therefore, included in the analysis population for both the reference and test drug.
Measured Values
Reference Drug
150 mg Test Drug 150
mg
Number of Participants 14 14
Area Under the Curve From Time Zero to Last Quantifiable Concentration [AUC (0-t)] [units: mcg*h/mL] Mean ± Standard Deviation
135.72 ± 29.52 137.30 ± 31.94
32

DRAFT – Bioequivalence Study Example – Public Display 9-28-09
Statistical Analysis 1 for Area Under the Curve From Time Zero to Last Quantifiable Concentration [AUC (0-t)]
Groups [1] Reference Drug 150 mg, Test Drug 150 mg
Method [2] ANOVA
P-Value [3] 0.715861
Other Estimated Parameter [Ratio of AUC(0-t) values] [4] 101.16
90% Confidence Interval (97.11 to 104.69)
[1] Additional details about the analysis, such as null hypothesis and power calculation:
No text entered
[2] Additional information, such as whether or not the p-value is adjusted for multiple comparisons and the a priori threshold for statistical significance:
No text entered.
[3] Other relevant information, such as adjustments or degrees of freedom:
No text entered.
[4] Other relevant estimation information:
Ratio of AUC(0-t) values = Test Drug 150mg/Reference Drug 150mg 4. Primary Outcome Measure: Area Under the Curve From Time Zero to Extrapolated Infinite Time [AUC (0 - ∞)]
Measure Type Primary
Measure Name Area Under the Curve From Time Zero to Extrapolated Infinite Time [AUC (0 - ∞)]
Measure Description AUC (0 - ∞)= Area under the plasma concentration versus time curve (AUC) from time zero (pre-dose) to extrapolated infinite time (0 - ∞). It is obtained from AUC (0 - t) plus AUC (t - ∞).
Time Frame 0, 1, 2, 3, 4, 6, 8, 12, 24, 48, 72, 96 hours post-dose
Safety Issue No
Hide Details
33

DRAFT – Bioequivalence Study Example – Public Display 9-28-09
Population Description
Explanation of how the number of participants for analysis was determined. Includes whether analysis was per protocol, intention to treat, or another method. Also provides relevant details such as imputation technique, as appropriate.
Each participant received reference and test drug and is, therefore, included in the analysis population for both the reference and test drug.
Measured Values
Reference Drug 150
mg Test Drug 150
mg
Number of Participants
[units: Participants] 14 14
Area Under the Curve From Time Zero to Extrapolated Infinite Time [AUC (0 - ∞)] [units: mcg*h/mL] Mean ± Standard Deviation
153.33 ± 35.96 154.45 ± 36.81
Statistical Analysis 1 for Area Under the Curve From Time Zero to Extrapolated Infinite Time [AUC (0 - ∞)]
Groups [1] Reference Drug 150 mg, Test Drug 150 mg
Method [2] ANOVA
P-Value [3] 0.784755
Other Estimated Parameter [Ratio of AUC (0 - ∞) values] [4] 100.73
90% Confidence Interval (97.96 to 103.36)
[1] Additional details about the analysis, such as null hypothesis and power calculation:
No text entered
[2] Additional information, such as whether or not the p-value is adjusted for multiple comparisons and the a priori threshold for statistical significance:
No text entered.
[3] Other relevant information, such as adjustments or degrees of freedom:
No text entered.
[4] Other relevant estimation information:
Ratio of AUC (0 - ∞) values = Test Drug 150mg/Reference Drug 150mg
34

DRAFT – Bioequivalence Study Example – Public Display 9-28-09
35
5. Primary Outcome Measure: Plasma Decay Half-Life (t1/2)
Measure Type Primary
Measure Name Plasma Decay Half-Life (t1/2)
Measure Description Plasma decay half-life is the time measured for the plasma concentration to decrease by one half.
Time Frame 0, 1, 2, 3, 4, 6, 8, 12, 24, 48, 72, 96 hours post-dose
Safety Issue No
Hide Details
Population Description
Explanation of how the number of participants for analysis was determined. Includes whether analysis was per protocol, intention to treat, or another method. Also provides relevant details such as imputation technique, as appropriate.
Each participant received reference and test drug and is, therefore, included in the analysis population for both the reference and test drug.
Measured Values
Reference Drug 150 mgTest Drug 150 mg
Number of Participants
[units: Participants] 14 14
Plasma Decay Half-Life (t1/2) [units: hours] Least Squares Mean ± Standard Deviation
29.99 ± 4.84 29.99 ± 4.34
U.S. National Library of Medicine, Contact Help Desk U.S. National Institutes of Health, U.S. Department of Health & Human Services,
USA.gov, Copyright, Privacy, Accessibility, Freedom of Information Act