Embed Size (px)
Citation preview
Abstract— Comparing probability density functions of ultimate
bending capacity of a “hybrid composite girder” with those of “composite girder”, it can be found that the hybrid composite girder shows higher reliability. In this paper, the numerical experiments based on Monte Calro simulation is carried out and the effect of the prior information is examined. The prior information easily given from testing is the average and variance of the strength, elasticity and other parameters of materials and of the dimensions of members. The result says that these information gives same capacity even under different assumptions for the probability density functions, while the reliability considerably changes. However, it is also found that the reliability of the hybrid composite girder is always much higher than the normal composite girder.
Index Terms—Limit State Design Method, Hybrid Composite Girder, Monte Carlo Simulation, reliability
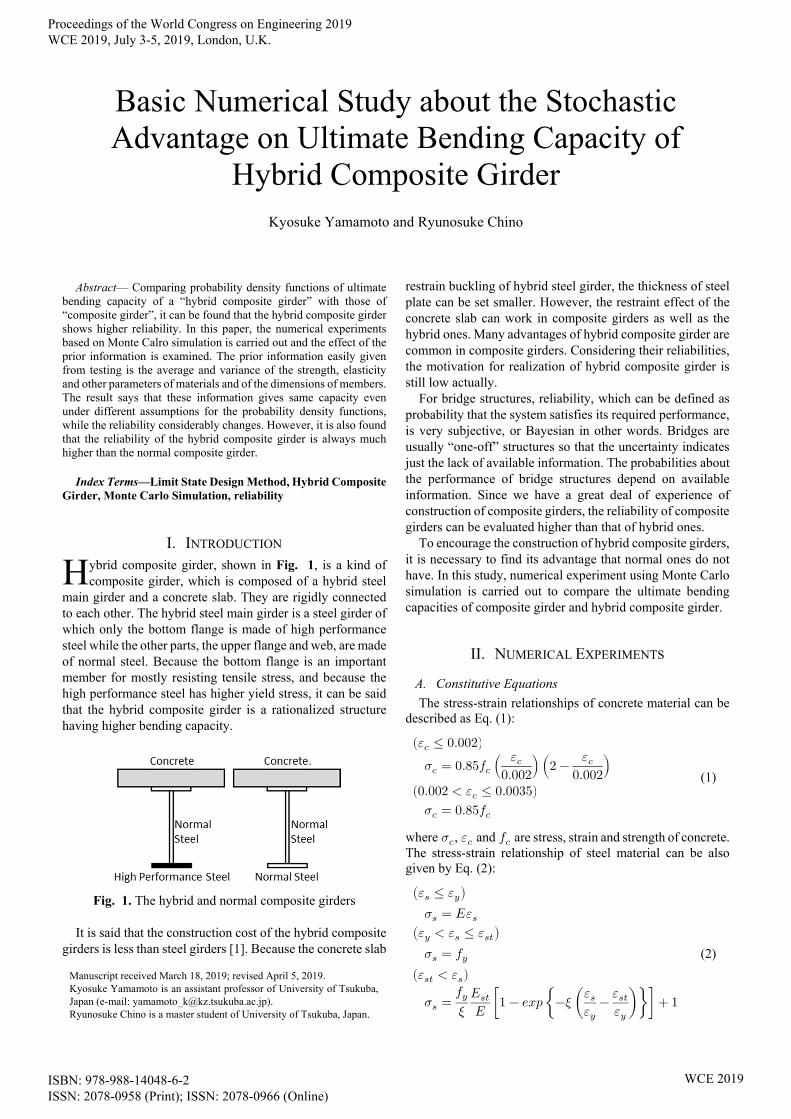
I. INTRODUCTION ybrid composite girder, shown in Fig. 1, is a kind of composite girder, which is composed of a hybrid steel
main girder and a concrete slab. They are rigidly connected to each other. The hybrid steel main girder is a steel girder of which only the bottom flange is made of high performance steel while the other parts, the upper flange and web, are made of normal steel. Because the bottom flange is an important member for mostly resisting tensile stress, and because the high performance steel has higher yield stress, it can be said that the hybrid composite girder is a rationalized structure having higher bending capacity.
Fig. 1. The hybrid and normal composite girders
It is said that the construction cost of the hybrid composite girders is less than steel girders [1]. Because the concrete slab
Manuscript received March 18, 2019; revised April 5, 2019. Kyosuke Yamamoto is an assistant professor of University of Tsukuba, Japan (e-mail: [email protected]). Ryunosuke Chino is a master student of University of Tsukuba, Japan.
restrain buckling of hybrid steel girder, the thickness of steel plate can be set smaller. However, the restraint effect of the concrete slab can work in composite girders as well as the hybrid ones. Many advantages of hybrid composite girder are common in composite girders. Considering their reliabilities, the motivation for realization of hybrid composite girder is still low actually. For bridge structures, reliability, which can be defined as probability that the system satisfies its required performance, is very subjective, or Bayesian in other words. Bridges are usually “one-off” structures so that the uncertainty indicates just the lack of available information. The probabilities about the performance of bridge structures depend on available information. Since we have a great deal of experience of construction of composite girders, the reliability of composite girders can be evaluated higher than that of hybrid ones. To encourage the construction of hybrid composite girders, it is necessary to find its advantage that normal ones do not have. In this study, numerical experiment using Monte Carlo simulation is carried out to compare the ultimate bending capacities of composite girder and hybrid composite girder.
II. NUMERICAL EXPERIMENTS
A. Constitutive Equations
The stress-strain relationships of concrete material can be described as Eq. (1):
(𝜀𝑐 ≤ 0.002)
𝜎𝑐 = 0.85𝑓𝑐 ( 𝜀𝑐0.002
)(2 − 𝜀𝑐0.002
)
(0.002 < 𝜀𝑐 ≤ 0.0035) 𝜎𝑐 = 0.85𝑓𝑐
(1)
where 𝜎𝑐, 𝜀𝑐 and 𝑓𝑐 are stress, strain and strength of concrete. The stress-strain relationship of steel material can be also given by Eq. (2):
(𝜀𝑠 ≤ 𝜀𝑦)
𝜎𝑠 = 𝐸𝜀𝑠
(𝜀𝑦 < 𝜀𝑠 ≤ 𝜀𝑠𝑡)
𝜎𝑠 = 𝑓𝑦
(𝜀𝑠𝑡 < 𝜀𝑠)
𝜎𝑠 =𝑓𝑦
𝜉𝐸𝑠𝑡𝐸
[1 − 𝑒𝑥𝑝 {−𝜉 (𝜀𝑠𝜀𝑦
− 𝜀𝑠𝑡𝜀𝑦
)}] + 1
(2)
Basic Numerical Study about the Stochastic Advantage on Ultimate Bending Capacity of
Hybrid Composite Girder Kyosuke Yamamoto and Ryunosuke Chino
H
Proceedings of the World Congress on Engineering 2019 WCE 2019, July 3-5, 2019, London, U.K.
ISBN: 978-988-14048-6-2 ISSN: 2078-0958 (Print); ISSN: 2078-0966 (Online)
WCE 2019
where 𝜎𝑠 , 𝜀𝑠 , 𝐸 , 𝜀𝑦 , 𝑓𝑦 , 𝜀𝑠𝑡 , 𝐸𝑠𝑡 and 𝜉 are stress, strain Young’s modulus, yield strain, yield strength, hardening strain, hardening elasticity and hardening curvature of steel, respectively. The constitutive equation is common in the normal steel and high performance steel. These curves of Eqs. (1) and (2) are shown in Fig. 2.
(a) Concrete
(b) Steel
Fig. 2. The stress-strain curve of materials The average and standard variance of each variable of concrete, steel and high performance steel used in Eqs. (1) and (2) are shown in TABLE I, II and III, respectively.
TABLE I THE PARAMETERS OF CONCRETE
Parameters Average 𝜇
Standard Variation
𝜎
Variation Coefficient
𝐶𝑉 Compressive Strength: 𝑓𝑐
(N/mm2) 30 1.2 0.04
Ultimate Strain 0.0035 0 0
TABLE II
THE PARAMETERS OF STEEL
Parameters Average 𝜇
Standard Variation
𝜎
Variation Coefficient
𝐶𝑉 Young's Modulus:
𝐸 (N/mm2) 200000 2000 0.010
Yield Strength: 𝑓𝑦 (N/mm2)
293.75 23.5 0.080
hardening strain: 𝜀
0.0185 0.0049 0.265
Hardening Coefficient:𝐸𝑠𝑡
(N/mm2) 4156 1342 0.323
Hardening Curvature: 𝜉
(N/mm2) 0.049 0.027 0.550
TABLE III
THE PARAMETERS OF HIGH PERFORMANCE STEEL
Parameters Average 𝜇
Standard Variation
𝜎
Variation Coefficient
𝐶𝑉 Young's Modulus:
𝐸 (N/mm2) 200000 2000 0.01
Yield Strength: 𝑓𝑦 (N/mm2)
549 36 0.0656
hardening strain: 𝜀
0.0082 0.0041 0.5
Hardening Coefficient:𝐸𝑠𝑡
(N/mm2) 2000 1170 0.585
Hardening Curvature: 𝜉
(N/mm2) 0.02 0.025 1.25
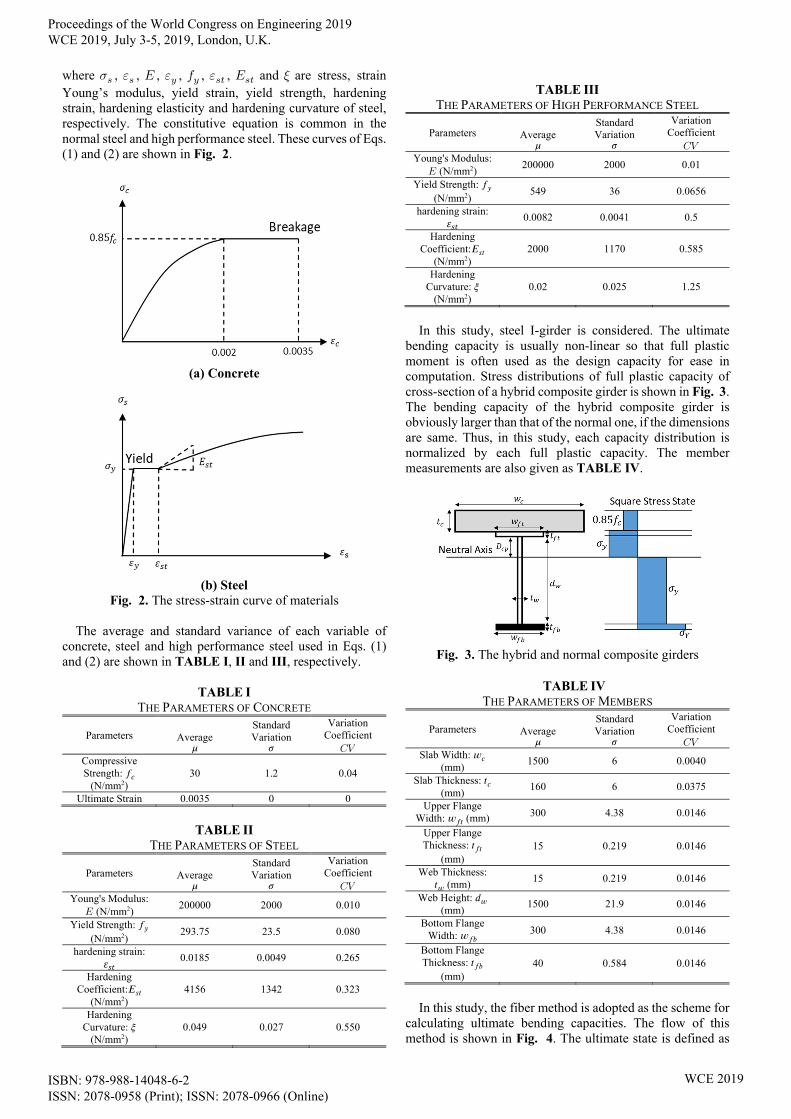
In this study, steel I-girder is considered. The ultimate bending capacity is usually non-linear so that full plastic moment is often used as the design capacity for ease in computation. Stress distributions of full plastic capacity of cross-section of a hybrid composite girder is shown in Fig. 3. The bending capacity of the hybrid composite girder is obviously larger than that of the normal one, if the dimensions are same. Thus, in this study, each capacity distribution is normalized by each full plastic capacity. The member measurements are also given as TABLE IV.
Fig. 3. The hybrid and normal composite girders
TABLE IV
THE PARAMETERS OF MEMBERS
Parameters Average 𝜇
Standard Variation
𝜎
Variation Coefficient
𝐶𝑉 Slab Width: 𝑤𝑐
(mm) 1500 6 0.0040
Slab Thickness: 𝑡𝑐 (mm)
160 6 0.0375
Upper Flange Width: 𝑤𝑓𝑡 (mm) 300 4.38 0.0146
Upper Flange Thickness: 𝑡𝑓𝑡
(mm) 15 0.219 0.0146
Web Thickness: 𝑡𝑤 (mm)
15 0.219 0.0146
Web Height: 𝑑𝑤 (mm)
1500 21.9 0.0146
Bottom Flange Width: 𝑤𝑓𝑏 300 4.38 0.0146
Bottom Flange Thickness: 𝑡𝑓𝑏
(mm) 40 0.584 0.0146
In this study, the fiber method is adopted as the scheme for calculating ultimate bending capacities. The flow of this method is shown in Fig. 4. The ultimate state is defined as
Proceedings of the World Congress on Engineering 2019 WCE 2019, July 3-5, 2019, London, U.K.
ISBN: 978-988-14048-6-2 ISSN: 2078-0958 (Print); ISSN: 2078-0966 (Online)
WCE 2019
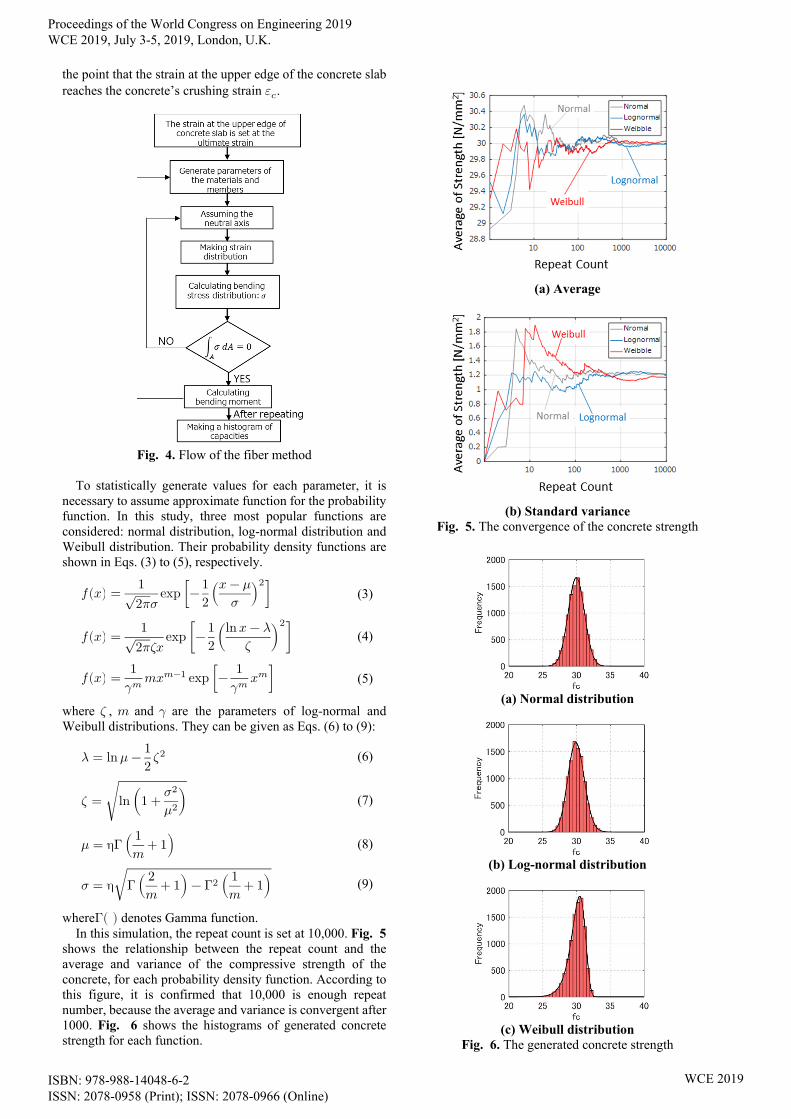
the point that the strain at the upper edge of the concrete slab reaches the concrete’s crushing strain 𝜀𝑐.
Fig. 4. Flow of the fiber method
To statistically generate values for each parameter, it is necessary to assume approximate function for the probability function. In this study, three most popular functions are considered: normal distribution, log-normal distribution and Weibull distribution. Their probability density functions are shown in Eqs. (3) to (5), respectively.
𝑓(𝑥) = 1√2𝜋𝜎
exp [− 12
(𝑥 − 𝜇𝜎
)2] (3)
𝑓(𝑥) = 1√2𝜋𝜁𝑥
exp [− 12
(ln 𝑥 − 𝜆𝜁
)2] (4)
𝑓(𝑥) = 1𝛾𝑚 𝑚𝑥𝑚−1 exp [− 1
𝛾𝑚 𝑥𝑚] (5)
where 𝜁 , 𝑚 and 𝛾 are the parameters of log-normal and Weibull distributions. They can be given as Eqs. (6) to (9):
𝜆 = ln 𝜇 − 12
𝜁2 (6)
𝜁 = √ln (1 + 𝜎2
𝜇2) (7)
𝜇 = ηΓ( 1𝑚
+ 1) (8)
𝜎 = η√Γ( 2𝑚
+ 1) − Γ2 ( 1𝑚
+ 1) (9)
whereΓ( ) denotes Gamma function. In this simulation, the repeat count is set at 10,000. Fig. 5 shows the relationship between the repeat count and the average and variance of the compressive strength of the concrete, for each probability density function. According to this figure, it is confirmed that 10,000 is enough repeat number, because the average and variance is convergent after 1000. Fig. 6 shows the histograms of generated concrete strength for each function.
(a) Average
(b) Standard variance
Fig. 5. The convergence of the concrete strength
(a) Normal distribution
(b) Log-normal distribution
(c) Weibull distribution
Fig. 6. The generated concrete strength
Proceedings of the World Congress on Engineering 2019 WCE 2019, July 3-5, 2019, London, U.K.
ISBN: 978-988-14048-6-2 ISSN: 2078-0958 (Print); ISSN: 2078-0966 (Online)
WCE 2019
B. Results and Discussion
The obtained histogram of normalized ultimate bending capacities are shown in Fig. 7. The statistics are also shown in TABLE V. If the value equals to 1, the capacity is same with full plastic moment. According to the result, because the average is very close to 1, it is confirmed that the full plastic moment is a proper feature quantity for design capacity of ultimate limit state of composite/hybrid composite girders. The average and standard variance of the results do not change, as the assumed probability function changes. If material and member data samples are available, it is difficult to determine the best fitting curve for the probability density function. This result shows that it is not necessary to think it so serious, if only average and variance is required to seek. However, what designers want to know the most is always the “reliability” of the structure. In this case, the reliability would be the probability under the load. If the load is fixed at 0.78, the fault probabilities of this composite girder are 0.0009, 0.0001 and 0.0050, for normal, log-normal and Weibull distributions, respectively. Each value is very small, while this difference is considerable and affective to design. The safest function, which is Weibull distribution in this case, must be adopted unless the best fitting function is determined. On the other hand, the standard variance of hybrid composite
girders is much improved from that of the composite girder. If the load is set at 0.78, regardless of assumed probability distributions for materials and members, all results about the fault probabilities are 0. This tendency of hybrid composite girder can be a positive advantage.
III. CONCLUSIONS In this study, the histogram of ultimate bending capacities of the composite/hybrid composite girders are generated by Monte Carlo simulation, assuming three probability density functions for materials and members. The difference of the assuming functions does not affect on the average and variance of the capacity, but much on the reliability. To implement this problem, it is efficient to adopt hybrid composite girder, because the variance of its capacity is much less than that of composite girder.
REFERENCES [1] Masatsugu Nagai, Takeshi Miyashita, Cuiping Liu, Naofumi Inaba
and Atsushi Homma: Design and applicability of steel and steel-concrete plate girder bridges with hybrid section, Journal of Japan Society of Civil Engineers A1, JSCE, Vol.68, No.1, pp.203-215, 2012. (in Japanese, only abstract is in English)
(a) Composite girder
(b) Hybrid composite girder
Fig. 7. The histogram of ultimate bending capacities
TABLE V THE STATISTICS OF OBTAINED CAPACITY DISTRIBUTIONS (A) COMPOSITE GIRDER
Parameters Normal
Distribution Log-Normal Distribution
Weibull Distribution
Average 0.993 0.992 0.993 Standard Variance
0.0630 0.0634 0.0645
Skewness -0.0345 0.14778 -0.696 Kurtosis 0.05971 0.0263013 0.87918
(B) HYBRID COMPOSITE GIRDER
Parameters Normal
Distribution Log-Normal Distribution
Weibull Distribution
Average 0.985 0.985 0.985 Standard Variance
0.0408 0.0405 0.0417
Skewness 0.00734 0.12656 -0.3685 Kurtosis -0.0427 0.0957261 0.27994
Proceedings of the World Congress on Engineering 2019 WCE 2019, July 3-5, 2019, London, U.K.
ISBN: 978-988-14048-6-2 ISSN: 2078-0958 (Print); ISSN: 2078-0966 (Online)
WCE 2019


![Hetero-deformation induced (HDI) hardening does not ... › ... › HDI-strain-gradient.pdfdifferences in strength and strain hardening capability across these in-terfaces [1–3,7–9]](https://img.dokumen.tips/doc/110x75/60be3da8ebceeb085022e776/hetero-deformation-induced-hdi-hardening-does-not-a-a-hdi-strain-.jpg)