Embed Size (px)
DESCRIPTION
How to forecast a weather before go boating.
Citation preview

Basic Marine Weather Forecasting Seminar
Reference Guide
Mark A. Thornton Email: [email protected]
Website: www.LakeErieWX.com
Forecasting Website: www.LakeErieWX.com/GreatLakes.html
It is impossible to predict the weather with total precision, but that doesn’t mean that the weather must be entirely unpredictable. The Basic Marine Weather Seminar will provide attendees with an
understanding of basic meteorological principles and explore the conditions favoring the development of severe weather.
_________________________________________________________ Mark A. Thornton --- www.LakeErieWX.com
© 2012
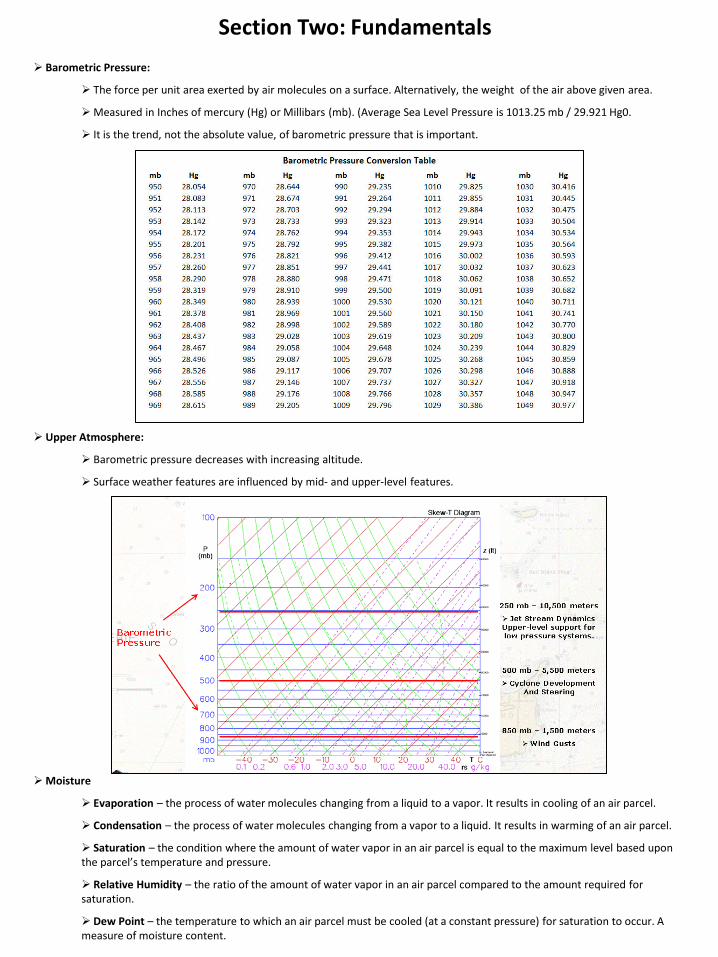
Section Two: Fundamentals Barometric Pressure:
The force per unit area exerted by air molecules on a surface. Alternatively, the weight of the air above given area.
Measured in Inches of mercury (Hg) or Millibars (mb). (Average Sea Level Pressure is 1013.25 mb / 29.921 Hg0.
It is the trend, not the absolute value, of barometric pressure that is important.
Moisture
Evaporation – the process of water molecules changing from a liquid to a vapor. It results in cooling of an air parcel.
Condensation – the process of water molecules changing from a vapor to a liquid. It results in warming of an air parcel.
Saturation – the condition where the amount of water vapor in an air parcel is equal to the maximum level based upon the parcel’s temperature and pressure.
Relative Humidity – the ratio of the amount of water vapor in an air parcel compared to the amount required for saturation.
Dew Point – the temperature to which an air parcel must be cooled (at a constant pressure) for saturation to occur. A measure of moisture content.
Upper Atmosphere:
Barometric pressure decreases with increasing altitude.
Surface weather features are influenced by mid- and upper-level features.

Atmospheric Instability - The tendency for air parcels to rise when they are lifted from their original position.
Instability is determined by assessing the temperature and moisture profile of a deep layer of the atmosphere.
Instability is a prerequisite for severe weather - the greater the instability, the greater the potential for severe thunderstorms.
Atmospheric Stability – An atmospheric condition where upward motion of air parcel is suppressed.
Limits the development of thunderstorms and severe weather.
Unstable Environments
A deep layer of cold air aloft over a layer of warm and moist air at the surface.
Rising air parcel remains warmer (less dense) than the surrounding environment.
Air parcels have a tendency to rise.
Upward motion promotes condensation, cloud development and precipitation.
Severe weather is associated with unstable environments.
Section Three: Interpreting Weather Graphics
Frontal Boundaries On Surface Charts
1. Cold Front 2. Warm Front 3. Stationary Front 4. Occluded Front
5. Trough 6. Squall Line 7. Dryline 8. Tropical Wave

Surface Weather Features:
Isobar: contour of constant sea level barometric pressure.
Cold Front: boundary between warm, moist air and cold, dry air.
Warm Front: boundary between warm, moist air and cool, moist air.
Stationary Front: boundary that is either stationary or moving at less than 5 knots.
Occluded Front: occurs when a cold front overtakes a warm front.
Trough: an elongated area of relatively low pressure.
Ridge: an elongated are of relatively high pressure.
Eastern Time GMT – 4 hours
0Z = 8 pm 6Z = 2 am
12Z = 8 am 18Z = 2 pm
Central Time GMT – 5 hours
0Z = 7 pm 6Z = 1 am
12Z = 7 am 18Z = 1 pm
During Summer
Initialized: Date & time the forecast was created.
Valid: Date & Time for which the forecast is intended
Meteorological Time

Section Four: Forces Controlling The Wind Controllers of The Wind
Pressure Gradient Force – the change in barometric pressure over a specified distance.
Coriolis Force – an apparent force due to the rotation of the Earth. In the northern hemisphere, the Coriolis Force imparts a shift to the right in a fluid.
Friction – slows the surface winds, reduces the Coriolis Force and creates a shift to the left. Influence is limited to the lowest 1 km.
Pressure Gradient Force (PGF) = Difference in Barometric Pressure / Distance Between Points.
Tightly-spaced isobars = higher PGF and faster winds.
Widely-spaced isobars = lower PGF and lighter winds.
PGF can be affected by building highs, deepening lows or systems moving relative to one another.

Section Five: Clouds and Precipitation
Cloud Formation Cloud Classification
Basic Shape Cirrus – thin, wispy clouds that are generally composed of ice crystals. Stratus – layered, featureless cloud deck. Cumulus – lumpy or heaped clouds that display vertical development.
Cloud Height Cirrus – prefix given to high clouds with bases above 20,000 feet. Alto – prefix given to mid-level clouds that from 6,000 to 20,000 feet. May be comprised of ice crystals or water droplets. No designation for low clouds.
Miscellaneous Nimbo – added as prefix or suffix indicates that the cloud is producing precipitation.
Clouds in stable environments tend to be wider than they are tall. Clouds in unstable environments are typically taller than they are wide.
Probability of Precipitation (PoP) used in National Weather Service Forecasts
PoP Percent Expressions of Uncertainty Equivalent Areal Qualifiers (convective only)
10 percent none used isolated, or few
20 percent slight chance widely scattered
30-40-50 percent chance scattered
60-70 percent likely numerous (or none used)
80-90-100 percent (categorical) none used none used
Probability of Precipitation (PoP) Is NOT the portion of the day in which it will rain. Is NOT the portion of the forecast area where rain will occur. According to the NWS, it IS the potential (expressed as a percent) of a measurable amount of liquid precipitation (.01 inch) during a specified period of time (usually 12 hours) at any given point in the forecast area.

Section Six: Low Pressure Systems
Warm Sector
Forming a Low Pressure System
Step 1 Step 2 Step 3
Step 5 Step 4
Reminder: Mid-Level Support Is Critical To The Life Cycle

Parameter Before Passing While Passing After Passing
Wind South to southwest
Gusty and shifting West to northwest
Temperature Warm Sudden drop Steadily dropping
Barometric Pressure Steadily falling Reaches minimum before rising sharply
Steadily rising
Clouds Increasing cloudiness
Towering cumulus or cumulonimbus
General clearing
Precipitation Scattered showers (except for pre-frontal troughs)
Heavy rain or snow, thunderstorms
Precipitation diminishes
Dew Point Relatively high Sudden drop Decreasing
Cold Fronts
Parameter Before Passing While Passing After Passing
Wind South to southwest Variable South to southwest
Temperature Cool but slowly warming
Steady increase Warming
Barometric Pressure Typically falling Steady Slight rise
Clouds High clouds following by lowering heights
Stratus Deck Clearing with scattered cumulus
Precipitation Typically light but steady
Typically light Precipitation diminishes
Dew Point Steady increase Steady Rises
Warm Fronts
Cloud Patterns Associated With Low Pressure Systems
Cold Front Warm Front

Section Seven: Observational Tools
Measuring Reflectivity
The amount of energy backscattered to the radar site is measured in decibels or dBZ.
The value of dBZ generally represents the rate of precipitation.
Can be dramatically affected by precipitation type (snow, hail, etc.)
Measuring Velocity – by measuring the Doppler effect, velocity imagery displays the speed and direction of movement of hydrometeors (wind speed, wind direction and storm motion can be inferred).
Base velocity imagery displays hydrometeor motion relative to the radar site.
Storm-relative velocity imagery subtracts storm motion. This allows rotation within a storm, such as a rotating updraft or tornado to be identified.
Caution – Radar Imagery Is Not Live
Visible Satellite Imagery
Easily identifies cloudy and cloud-free regions.
Relies upon reflected sunlight therefore it is only available during the daytime.
Infrared Satellite Imagery
Discerns between high and low-level clouds by measuring the level of emitted radiation..
Colder cloud tops (taller storms) are shown in brighter colors.
Not limited to daylight hours.
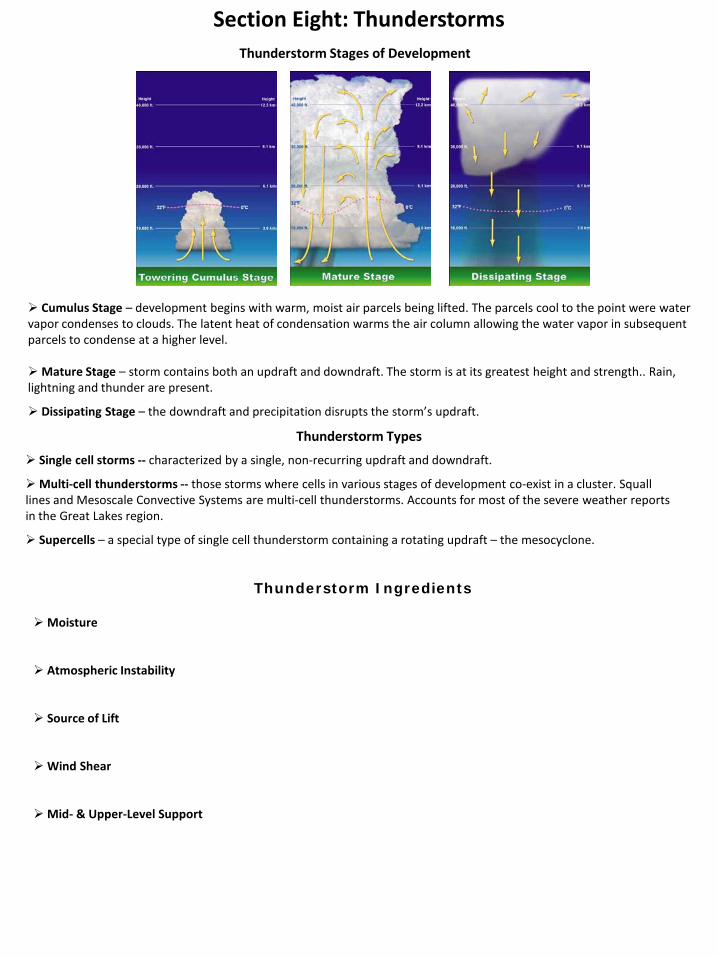
Section Eight: Thunderstorms Thunderstorm Stages of Development
Single cell storms -- characterized by a single, non-recurring updraft and downdraft.
Multi-cell thunderstorms -- those storms where cells in various stages of development co-exist in a cluster. Squall lines and Mesoscale Convective Systems are multi-cell thunderstorms. Accounts for most of the severe weather reports in the Great Lakes region.
Supercells – a special type of single cell thunderstorm containing a rotating updraft – the mesocyclone.
Thunderstorm Types
Cumulus Stage – development begins with warm, moist air parcels being lifted. The parcels cool to the point were water vapor condenses to clouds. The latent heat of condensation warms the air column allowing the water vapor in subsequent parcels to condense at a higher level.
Mature Stage – storm contains both an updraft and downdraft. The storm is at its greatest height and strength.. Rain, lightning and thunder are present.
Dissipating Stage – the downdraft and precipitation disrupts the storm’s updraft.
Thunderstorm Ingredients
Moisture
Atmospheric Instability
Source of Lift
Wind Shear
Mid- & Upper-Level Support

Storm Prediction Center Expressing Probability and Risk
Three Risk Categories
Slight: well-organized storms are expected, but in small numbers and/or low coverage. Approximately 5-25 reports of large hail, 5-25 damaging wind reports and/or 1 to 5 tornadoes.
Moderate: a greater concentration of severe thunderstorms and greater magnitude of severe weather.
High: a major severe weather outbreak is expected with the potential for very damaging wind gusts and/or 20 or more tornadoes.
NWS Marine Products
Near Shore Marine Forecast -- Issued for waters within 5 nautical miles from shore.
Off-shore Marine Forecast – Issued for waters beyond 5 nautical miles from shore.
Small Craft Advisory -- Regional variations exist. Generally issued when the sustained wind or frequent gusts are between 22 and 33 knots and/or waves greater than 4 feet.
Gale Warning – Issued when sustained wind speeds are expected to be from 34 to 47 knots.
Storm Warning – Issued when sustained wind speeds are expected to be from 48 to 63 knots.
Hazardous Weather Outlook – A narrative statement produced by the National Weather Service, frequently issued on a routine basis, to provide information regarding the potential of significant weather expected during the next 1 to 5 days.
Marine Weather Statement -- A National Weather Service product to provide mariners with details on significant or potentially hazardous conditions not otherwise covered in existing marine warnings and forecasts. Marine weather statements are also used to supplement special marine warnings.
Marine Weather Warning -- issued for potentially hazardous weather conditions usually of short duration (up to 2 hours) producing sustained marine thunderstorm winds or associated gusts of 34 knots or greater; and/or hail 3/4 inch or more in diameter; and/or waterspouts.

Handouts courtesy of Wegman, Hessler & Vanderburg, LPA
Notes