Embed Size (px)
Citation preview

Basic Introduction to Elasticity
Ted Mitchell

These slides identify
• The 3 basic uses of price elasticity• The basic definition of elasticity• The 3 basic types of price elasticity• Original Point Elasticity• Average point Elasticity• Arc Elasticity• The Flaw in Basic Approximation of Elasticity

Elasticity comes in many flavors
• Advertising Elasticity• Coupon Elasticity• Sales Force Call Elasticity, etc., etc.• The Best Known Flavor is Price Elasticity, Eqp
aka Demand Elasticity

Price Elasticity = -1
Price per Unita/2b
Quantity
Sold
a/2
TJM
Maximum Revenue
-0.5 -0.75 -1 -1.25 -1.5 -1.75

Revenue looks like R = aP - bP2
Revenue
Price0
TJM
-0.5 -0.75 -1 - 1.25 -1.5 -1.75Price Elasticity
Optimal price, Pr = a/2b

Sample Price Elasticities
• Restaurant meals -2.3• Foreign travel, long-run - 4.0• Airline travel, long-run -2.4• Fresh green peas -2.8• Automobiles, short-run -1.2 to - 1.5• Chevrolet automobiles -4.0• Fresh tomatoes -4.6

Three Classic Uses of the Elasticity Index
• 1) for comparing the sensitivity of changes in a variables across situations using different units of measure (e.g., apple and orange markets)
• 2) for estimating the consequences of making a change in one variable (price) on another variable (quantity sold)
• 3) for estimating the direction a variable (price) should be changed if an outcome (revenue) is to be maximized
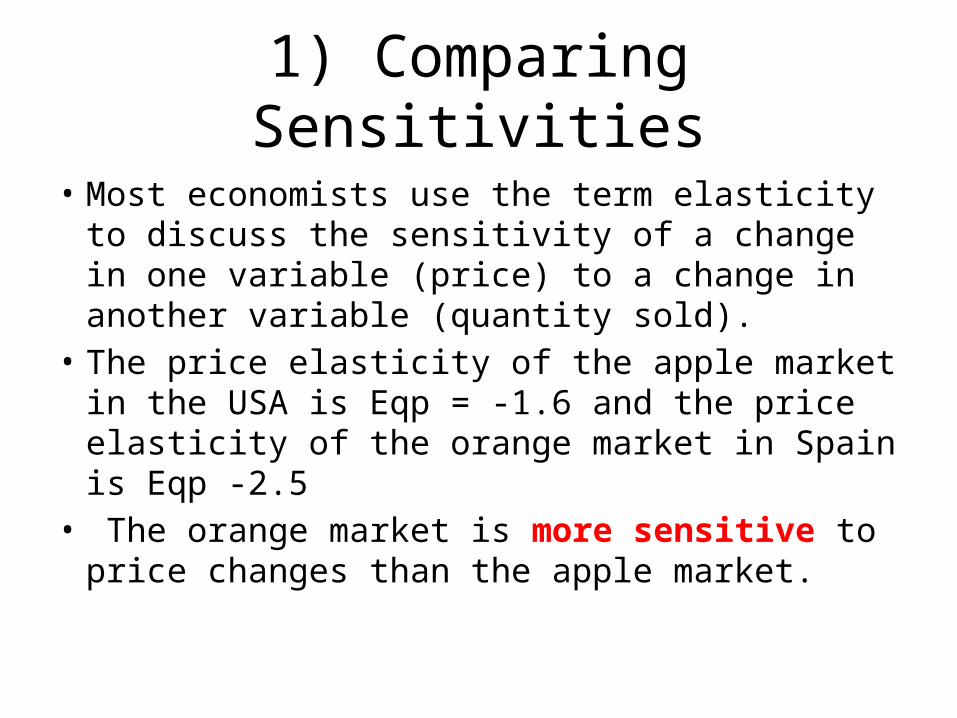
1) Comparing Sensitivities
• Most economists use the term elasticity to discuss the sensitivity of a change in one variable (price) to a change in another variable (quantity sold).
• The price elasticity of the apple market in the USA is Eqp = -1.6 and the price elasticity of the orange market in Spain is Eqp -2.5
• The orange market is more sensitive to price changes than the apple market.

2) Calculating consequences of a price change
• The price elasticity of the apple market in the USA is Eqp = -1.6 and the price elasticity of the orange market in Spain is Eqp = -2.5
• Elasticity of -1.6 means that a 1% change in price will cause a 1.6% change in the quantity of apples that are sold
• Elasticity of -2.5 means that a 1% change in price will cause a 2.5% change in the quantity of oranges that are sold
• The two can be compared because elasticity is an index and an index is unit neutral.

3) Elasticity indicates the direction for improved revenues
• for a change in price to increase revenue• If the elasticity is between 0 and -0.99 then a
increase in price increases revenues• If the elasticity is more negative than -1.0 then
reduce the price to maximize utility• If elasticity is -0.1 then you have the price that
maximizes revenue

If my elasticity is calculated as -0.5 then I should raise my price to get more revenue
Revenue
Price0
TJM
-0.5 -0.75 -1 - 1.25 -1.5 -1.75Price Elasticity
Increase price if elasticity is - 0.50

Point Elasticity of Price is defined as
• The ratio of the percentage change in quantity sold to the percentage change in price from one period to another
• Point Elasticity of Price = %∆Q/%∆P• Percentage change in price = (P2-P1)/P1• Percentage change in quantity = (Q2-Q1)/Q1• Point Eqp = (∆Q/Q)/(∆P/P)

You often see Point Elasticity
• Point Eqp = (∆Q/Q)/(∆P/P) • Written as• Point EQP = P(∆Q)/Q(∆P)• To avoid writing multiple ratios• Note the approximation to impact analysis • Impact of quantity change = I∆Q = P(∆Q)• Impact of price change = I∆P = Q(∆P)

Elasticity is easy
• If you know the details of the demand curve • Q = a-bP• Then using calculus to find the point elasticity,
Eqp, is straight forward• Eqp = -bP/(a-bP)• and very accurate

BUT!!!
• You don’t know the details of demand curve!• You have only observations of last period and
the current period• You are making an approximation to the point
elasticity

Price per UnitP1=$5
Quantity
Sold
Q1 = 2,500
TJM
X
Q2 = 3,000 X
P2 =$4

Price per UnitP1 = $5
Quantity
Sold
Q1 = 2,500
TJM
X
Q2 = 3,000 X
P2 = $4
Demand Curve=Q = a-bP

Price per UnitP1 = $5
Quantity
Sold
Q1 = 2,500
TJM
X
Q2 = 3,000 X
P2 = $4
Area = Revenue = P x Q

There are many different ways
• to calculate elasticity. They all depend on what value is used as the denominator in the percentage changes
• 1) Original Point Elasticity is the classic• 2) Average Elasticity is to avoid the flaw in
point calculation• 3) Arc Elasticity is a better way to avoid the the
flaw in point

Point Elasticity
• 1) Point Elasticity = percentage change from the original quantity divided by the percentage change from the original price, Point Eqp = (%∆Qoriginal)/(%∆Priceoriginal)
• Perfect: if you use calculus to find the slope at a point
• Flawed in its Approximation: You get two different numbers depending on which is considered the original point

Calculating Point Elasticity from the Original Point
Original point
New point Change from original
%∆ based on original point
Quantity, Q 3,000 2,500 ∆Q= -500 %∆Qoriginal =500/3,000 =0.1667 =16.67%
Price, P $4 $5 ∆P = $1 %∆Poriginal =-$1/$4 =-0.25 = 25%
Revenue $12,000 $12,500 ∆R= $500
Point Price Elasticity = (%∆Qoriginal)/%∆Poriginai) Point Price Elasticity = 16.67%/25% = -0.67

Price per Unit $5
Quantity
Sold
2,500
TJM
X
3,000 X
$4
Elasticity at the original point = -
0.667
-0.5 -0.75 -1 -1.25 -1.5 -1.75
Elasticity at the original point on the demand curve

The Flaw in Point Elasticity
• A calculation of Elasticity at the original point is Eqp = -0.667
• implies an increase in price would increase revenue
• BUT my price is now at the optimal $5 price and any increase would decrease my revenue

Price per Unit $5
Quantity
Sold
2,500
TJM
X
3,000 X
$4
Elasticity at the point = -0.667
-0.5 -0.75 -1 -1.25 -1.5 -1.75
Elasticity at the point = -1.0

Average Elasticity
• To avoid the flaw in point elasticity• 2) Average Elasticity = average percentage
change from the average quantity divided by the average percentage change from the average price, Average Eqp = (%∆Qaverage)/(%∆Priceaverage)

For the Exam: know Arc Elasticity
• A better way of avoiding the flaw• Arc elasticity for marketing managers is
calculated by using the Minimum of the two choices for the denominator in the % changes
• 3) Arc Elasticity = percentage change from the minimum quantity divided by the percentage change from the minimum price, Arc Eqp = (%∆Qmin)/(%∆Pricemin)

Period 1 Period 2 Change %∆ based on minimums
Quantity, Q 3,000 2,500 ∆Q= -500 %∆Qmin =500/2,500 =0.20 =20%
Price, P $4 $5 ∆P = $1 %∆Pmin =-$1/4 =-0.25 = 25%
Revenue $12,000 $12,500 ∆R= $500
Arc Price Elasticity = %∆Qmin/%∆Pmin Arc price Elasticity = 20%/25% = -0.8

Period 1 Period 2 Change %∆ based on minimums
Quantity, Q 3,000 2,500 ∆Q= -500 %∆Qmin =500/2,500 =0.20 =20%
Price, P $4 $5 ∆P = $1 %∆Pmin =-$1/4 =-0.25 = 25%
Revenue $12,000 $12,500 ∆R= $500
Arc Price Elasticity = %∆Qmin/%∆Pmin Arc price Elasticity = 20%/25% = -0.8

Period 1 Period 2 Change %∆ based on minimums
Quantity, Q 3,000 2,500 ∆Q= -500 %∆Qmin =500/2,500 =0.20 =20%
Price, P $4 $5 ∆P = $1 %∆Pmin =-$1/4 =-0.25 = 25%
Revenue $12,000 $12,500 ∆R= $500
Arc Price Elasticity = %∆Qmin/%∆Pmin Arc price Elasticity = 20%/25% = -0.8

Period 1 Period 2 Change %∆ based on minimums
Quantity, Q 3,000 2,500 ∆Q= -500 %∆Qmin =500/2,500 =0.20 =20%
Price, P $4 $5 ∆P = $1 %∆Pmin =-$1/4 =-0.25 = 25%
Revenue $12,000 $12,500 ∆R= $500
Arc Price Elasticity = %∆Qmin/%∆Pmin Arc price Elasticity = 20%/25% = -0.8

Period 1 Period 2 Change %∆ based on minimums
Quantity, Q 3,000 2,500 ∆Q= -500 %∆Qmin =500/2,500 =0.20 =20%
Price, P $4 $5 ∆P = $1 %∆Pmin =-$1/4 =-0.25 = 25%
Revenue $12,000 $12,500 ∆R= $500
Arc Price Elasticity = %∆Qmin/%∆Pmin Arc Price Elasticity = 20%/25% = -0.8

Price per Unit $5
Quantity
Sold
2,500
TJM
X
3,000 X
$4
Elasticity at the point = -0.667
Elasticity at the point = -1.0
Arc Elasticity = -0.8

With the Arc Elasticity the starting point is irrelevant
• There is no such thing as an ideal measure of arc elasticity
• Many Economists like to use the averages of the two points to have an average denominator
• Marketing managers like using the minimum values for denominators because it is consistent with Impact Analysis

Sample exam questions

What are the Three Classic Uses of Elasticity?
• 1) for comparing the sensitivity of changes in a variables across situations using different units of measure (e.g., apple and orange markets)
• 2) for estimating the consequences of making a change in one variable (price) on another variable (quantity)
• 3) for estimating the direction a variable (price) should be changed if an outcome (revenue) is to be maximized

Exam Question #1
• If the car market has a price elasticity of -2.5 and the housing market has a price elasticity of -1.7, then which one is more sensitive to a price change?
• A) the car market• B) the housing market• C) not enough information to know?

Exam Question #1
• If the car market has a price elasticity of -2.5 and the housing market has a price elasticity of -1.7, then which one is more sensitive to a price change?
• A) By definition the car market is correct• B) the housing market• C) not enough information to know?

Three Classic Uses of the Elasticity Index
• 1) for comparing the sensitivity of changes in a variables across situations using different units of measure (e.g., apple and orange markets)
• 2) for estimating the consequences of making a change in one variable (price) on another variable (quantity)
• 3) for estimating the direction a variable (price) should be changed if an outcome (revenue) is to be maximized

Exam Question #2
• If the price elasticity in your market is -2.5 and you decrease your price by 2%, then you can expect your sales volume to increase by 5%. True or False?
• True• False

Exam Question #2
• If the price elasticity in your market is -2.5 and you decrease your price by 2%, then you can expect your sales volume to increase by 5%. True or False?
• True is correct• %∆Q = (Elasticity of Price) x (%∆P)• %∆Q = (-2.5) x (-2%) = 5% increase in quantity

Three Classic Uses of the Elasticity Index
• 1) for comparing the sensitivity of changes in a variables across situations using different units of measure (e.g., apple and orange markets)
• 2) for estimating the consequences of making a change in one variable (price) on another variable (quantity)
• 3) for estimating the direction a variable (price) should be changed if an outcome (revenue) is to be maximized

Exam Question #3
• If the price elasticity of your market is -2.75, then an increase in your selling price will decrease your revenue. True or false?
• A) True• B) False

Exam Question #3
• If the price elasticity of your market is -2.75, then an increase in your selling price will decrease your revenue. True or false?
• A) True is the correct answer• B) False

Price Elasticity = -1
Price per Unita/2b
Quantity
Sold
a/2
TJM
Maximum Revenue
-0.5 -0.75 -1 -1.25 -1.5 -1.75

Price Elasticity = -1
Price per Unita/2b
Quantity
Sold
a/2
TJM
Maximum Revenue
-0.5 -0.75 -1 -1.25 -1.5 -1.75
Less Revenue

Revenue looks like R = aP - bP2
Revenue
Price0
TJM
-0.5 -0.75 -1 - 1.25 -1.5 -1.75Price Elasticity
Optimal price, Pr = a/2b

We remember that the price
• That maximizes revenueis the first derivative of the revenue function
• R = P(a-bP)• R = aP – bP2
• dR/dP = a – 2bP• Set equal to zero to solve for the optimal price• a - 2bP = 0• P = a/2b

Convenient to consider price elasticity constant in the current region
P
Q
P
Q
Q = a-bPQ = kPe
e is the price elasticityand it is same for every price
k is a scaling constant