Embed Size (px)
Citation preview

Basic Graphs
TrigonometryMATH 103
S. Rook
Overview
• Section 4.1 in the textbook:– The sine graph– The cosine graph– The tangent graph– The cosecant graph– The secant graph– The cotangent graph– Even and odd functions
2

The Sine Graph

The Sine Graph
• Recall how to graph a line by using a table of values:– e.g. y = 2x– Pick values for x and then
calculate y for y = sin x• e.g.
– All points on the sine graph can be written as (x, sin x)• Obtained from the known
values on the Unit Circle
4
2,
4
7,
2
3,
4
5,,
4
3,2,4,0x

The Sine Graph (Continued)
• Finally, plot the points
• At this point, you should mainly be concerned with recognizing the shape of the graphs of the six trigonometric functions
5

The Sine Graph and the Unit Circle
• Recall that on the Unit Circle, (x, y) corresponds to (cos θ, sin θ)
• For the sine graph, we are only concerned with the value of y:– QI: y increases to 1– QII: y decreases to 0– QIII: y decreases to -1– QIV: y increases to 0
6

Period
• Given a function f(x), the period is the smallest value p such that f(x + p) = f(x), for all x in f– i.e. when the graph starts to repeat – the length of ONE cycle – All six trigonometric functions are periodic (repeat in an
infinite number of cycles)• One cycle of y = sin x consists of tracing out the Unit Circle as θ
varies from 0 to 2π– The graph of y = sin x does not repeat in this interval
• When θ ≥ 2π, the graph of y = sin x starts to repeat• Therefore, the period of y = sin x is 2π
p = 2π
7
Period and Extending Graphs
• To extend the graph of a trigonometric function:– Utilize its period– By adding 2π to each x in the previous table of values, we
obtain the next cycle of the sine graph– By adding 2πk (where k is an integer) to each x in the
previous table of values, we obtain the same y-value in another cycle of the sine graph
k can be negative meaning the cycles extend infinitely in both directions
8

The Sine Graph (Example)
Ex 1: Extend the table of values for y = sin x to include the next cycle (i.e. 0 ≤ x ≤ 4π)
9

The Cosecant Graph

The Cosecant Graph
• Recall the relationship between y = sin x and y = csc x:
• Thus, we take the reciprocal of the values from the sine graph to obtain the cosecant graph
• Note that some of the reciprocals will have a 0 in the denominator:– Will be undefined (e.g. π)– The graph will have a vertical asymptote at
these points11
xxysin
1csc

The Cosecant Graph (Continued)
• Plot the points• Again, be able to
recognize the shape• Because y = sin x and y = csc x are reciprocals, y = csc x also has a period of 2π
• We can use the same method to extend the cosecant graph as we did to extend the sine graph
12

The Cosine Graph

The Cosine Graph
• All points on the cosine graph can be written as (x, cos x)– Obtained from the known values on
the Unit Circle• When drawing the cosine graph, we trace
out the entire Unit Circle as θ varies from 0 to 2π without the graph repeating
– Therefore, the period of the cosine graph is 2π
• By adding 2πk to each x, we get the same y-value in another cycle of the cosine graph
14

The Cosine Graph (Continued)
• Plot the points • Again, be able to
recognize the shape of the graph
• We can extend the cosine graph just like how like how we extended the sine graph
15

The Cosine Graph and the Unit Circle
• Recall that on the Unit Circle, (x, y) corresponds to (cos θ, sin θ)
• For the cosine graph, we are only concerned with the value of x:– QI: x decreases to 0– QII: x decreases to -1– QIII: x increases to 0– QIV: x increases to 1
16
The Cosine Graph (Example)
Ex 2: Extend the table of values for y = cos x to include the previous cycle (i.e. -2π ≤ x ≤ 2π)
17

The Secant Graph
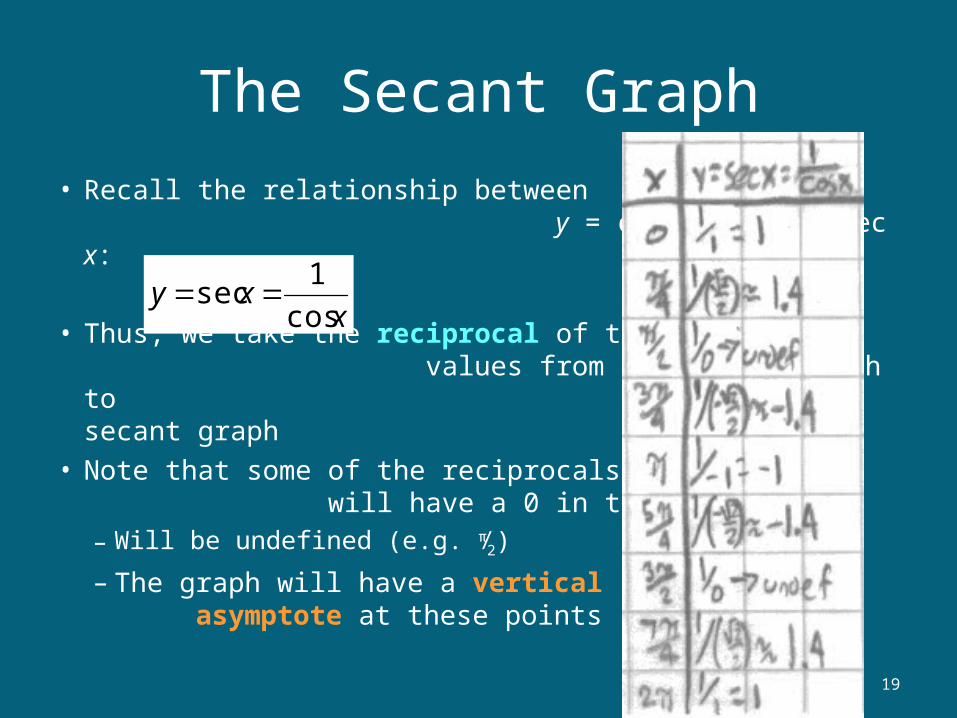
The Secant Graph
• Recall the relationship between y = cos x and y = sec x:
• Thus, we take the reciprocal of the values from the cosine graph to obtain the secant graph
• Note that some of the reciprocals will have a 0 in the denominator:– Will be undefined (e.g. π⁄2)
– The graph will have a vertical asymptote at these points
19
xxycos
1sec
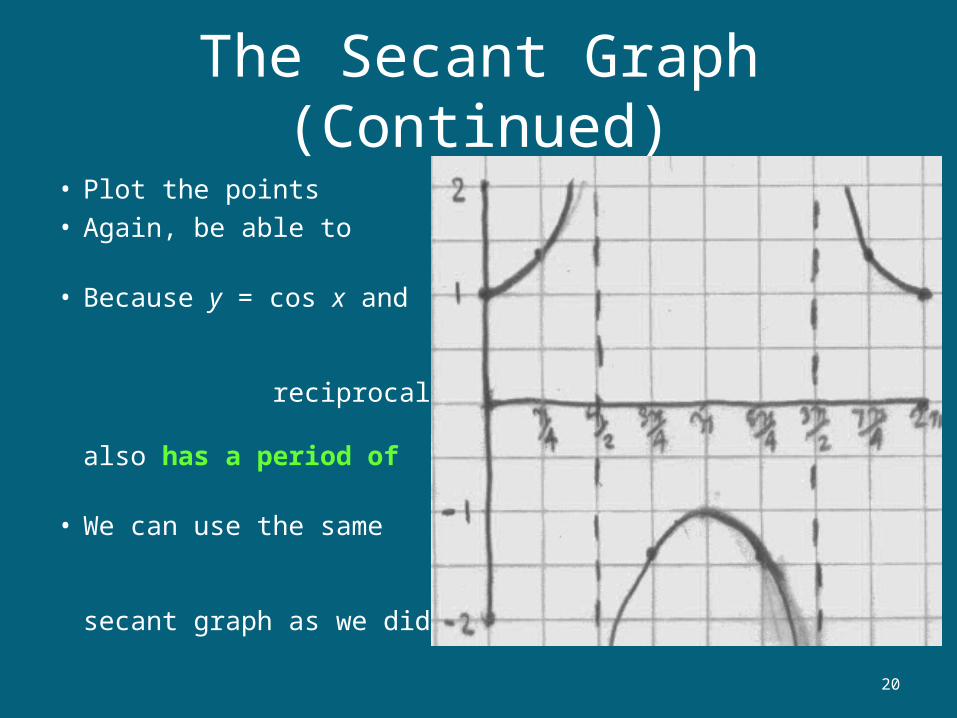
The Secant Graph (Continued)
• Plot the points• Again, be able to
recognize the shape• Because y = cos x and y = sec x are reciprocals, y = sec x also has a period of 2π
• We can use the same method to extend the secant graph as we did to extend the other graphs
20

The Tangent Graph

The Tangent Graph
• Recall the relationship of tan x between sin x and cos x:
• Remember that on the Unit Circle, (x, y) corresponds to (cos θ, sin θ):– Thus we can create a table of values
• Again, the graph will have a vertical asymptote where the tangent is undefined
22
x
xxycos
sintan

The Tangent Graph (Continued)
• Plot the points• Notice that the period of the
tangent graph is π, NOT 2π– The graph in QI & QII will be the
SAME as the graph in QIII & QIV (in reference to the unit circle)
• To extend the tangent graph, add kπ to each value in the previous table– Yields the same y-values in
another cycle23
The Tangent Graph (Example)
Ex 3: Extend the tangent graph from -π ≤ x ≤ 2π
24
The Cotangent Graph

The Cotangent Graph
• Recall the relationship between y = tan x and y = cot x:
• Thus, we take the reciprocal of the values from the tangent graph to obtain the cotangent graph
• Like the tangent graph, the cotangent graph has a period of π
26
xxy
tan
1cot

The Cotangent Graph (Continued)
• Plot the points• As with all the other
graphs, be able to recognize the shape
• Can extend the graph like the others
27

Even and Odd Functions

Even and Odd Functions
• Recall the definition of even and odd functions:– If f(-x) = f(x), f(x) is an even function– If f(-x) = -f(x), f(x) is an odd function
• Examine the Unit Circle at the right:
cos(-θ) = cos θ meaning?sin(-θ) = -sin θ meaning?
– Using identities, we can infer whether the remaining trigonometric functions are even or odd
29

Even and Odd Functions (Example)
Ex 4: Show or evaluate the following:
a)
b) Show that cot(-θ) is an odd function
c) cos(-θ) tan θ = sin θ
30
4
7csc

Summary
• After studying these slides, you should be able to:– Recognize the shape of the graphs of the six
trigonometric functions– State the period for each trigonometric function– Work with even and odd functions
• Additional Practice– See the list of suggested problems for 4.1
• Next lesson– Amplitude, Reflection, and Period (Section 4.2)
31