Embed Size (px)
Citation preview

OUTLINE11-111-21 i-311-4
11-511-611-711-811-911-10
Background informationGenerating an ac voltageRate of changeIntroductory information summary regarding acsine-wave signalsSome basic sine-wave waveform descriptorsPeriod and frequencyPhase relationshipsImportant ac sine-wave current and voltage valuesThe purely resistive nc circuitOther periodic woveforms
OBJECTIVES
After studying this chapter, you should be able to:
1. Draw a graphic illustrating an ac waveform2. Define cycle, alternation, period, peak-
to-peak, and effective value (rms)3. Compute effective, peak, and peak-to-peak val-
ues of ac voltage and current4. Explain average with reference to one-half cycle
of sine-wave ac5. Explain average with reference to nonsinusoidal
waves
6. Define and calculate frequency and period7. Draw a graph illustrating phase relationships of
two sine waves8. Describe the phase relationships of Vand /in a
purely resistive ac circuit9. Label keyparameters of nonsinusoidal
wave forms10. Use the computer to solve circuit problems
CHAPTER 11
Basic AC Quantities
c
L
301

PREVIEW
revious chapters have discussed dc voltages, currents, and related quantities. As youhave learned, direct current (dc) flows in one direction through the circuit. Your knowl-
edge of dc and your practice in analyzing dc circuits will help you as you now investi-gate alternating current (ac)--current that periodically reverses direction.
In this chapter, you will become familiar with some of the basic terms used to defineimportant ac voltage, current, and Waveform quantities and characteristics. Knowledgeof these terms and values, plus their relationships to each other, form the critical foun-dation on which you will build your knowledge and skills in working with ac, both as atrainee and as a technician.
Studying this chapter, you will learn how ac is generated; how it is graphically repre-sented; how its various teatures are described; and how specific important values, orquantities are associated with these features.
In the next chapter, you will study a powerful test instrument, called the oscilloscope,which will enable you to visually observe the ac characteristics you will study in thischapter.
I(EY TERMS
Ac Hertz (Hz) Phase angle(O)Alternation Instantaneous value PhasorAverage value Magnitude QuadrantsCoordinate system Peak-to-peak value (Vp-p) Rectangular waveCycle Peak value (Vp or Sawtooth waveDuty cycle maximum value, Vmox) Sine waveEffective value (rms) Period (T) Square waveFrequency (f) Vector
1 l-I Background Information
The Difference between DC and AC
Whereas direct current is unidirectional and has a constant value, or magnitude, alternatingcurrent, as the name suggests, alternates in direction and is bidirectional. Also, ac differs fromdc in that it is continuously changing in amplitude or value, as well as periodically changingin polarity.
In Figure 11-1, you see how both a simple dc circuit and a simple ac circuit may be rep-resented diagrammatically. You are already familiar with the symbols in the dc circuit shownin Figure 11-1a. Notice the symbol used to represent the ac source in the ac circuit shown inFigure 1 l-lb. You will be seeing this symbol used throughout the remainder of the book. Thewiggly line in the center of the symbol represents a sine-wave waveform, which you willstudy shortly.
Figure 11-1 also highlights the comparisons and contrasts between dc and ac voltagecharacteristics, using their graphical representations. As you proceed in the chapter, you willbe focusing your attention on learning important specifics about the sine wave and other acwaveforms.
Alternating Current Used for Power Transmission
Alternating current (ac) has certain advantages over dc when transporting dectrical powerfrom one point to another point. A key advantage is its ability to be "stepped up" or "steppeddown" in value. Again, you will study more about this later in the text. These advantages arewhy power is brought to your home in the form of ac rather than dc.
Some interesting contrasts between dc and ac are shown in Figure 11-2. This ac electri-cal power is produced by alternating-current generators. A simple discussion about generat-ing ac voltage will be covered shortly. However, some groundwork will now be presented.

CHAPTER 11 . Basic AC Quantities 303
dc [I IOV-j--
sourceÿ it I
10V +
-(----- Time
Current through circuit]in only one direction
Graphic "representation i.... " iof dc voltage !
(a) FIGURE 11-1 Graphiccomparing dc and acwaveforms
ac i(,sourcel \
+"ÿ 10V I <
rms I1 <
14.14V +
0
14.14V -
ctive "
Time
Current through circuit "alternates" iin direction every half cycle _
-Graphic representationi
of ac voltage ÿ i
(b)
CHARACTERISTIC DESCRIPTOR AC ÿ: i '!ÿ :i: ::pc: i
Current in one direction only
Current periodically alternates in direction--one-
half the time in each direction
Voltage can be "stepped up" or "stepped down" bytransformer action
Yes '. ÿ: No :
: ' " > i
Is an efficient means to transport power over longdistances
Useful for all purposes
: :; Yes- : !.i -No
Yes No
)
Defining Angular Motion and the Coordinate System'As we deal with ac quantities, it is helpful to understand how angular relationships are com-monly depicted. Refer to Figures 11-3a (angular motion) and 11-3b (the coordinate system)as you study the following discussions.
FIGURE 11-2 Similaritiesand differences betweendc and ac power
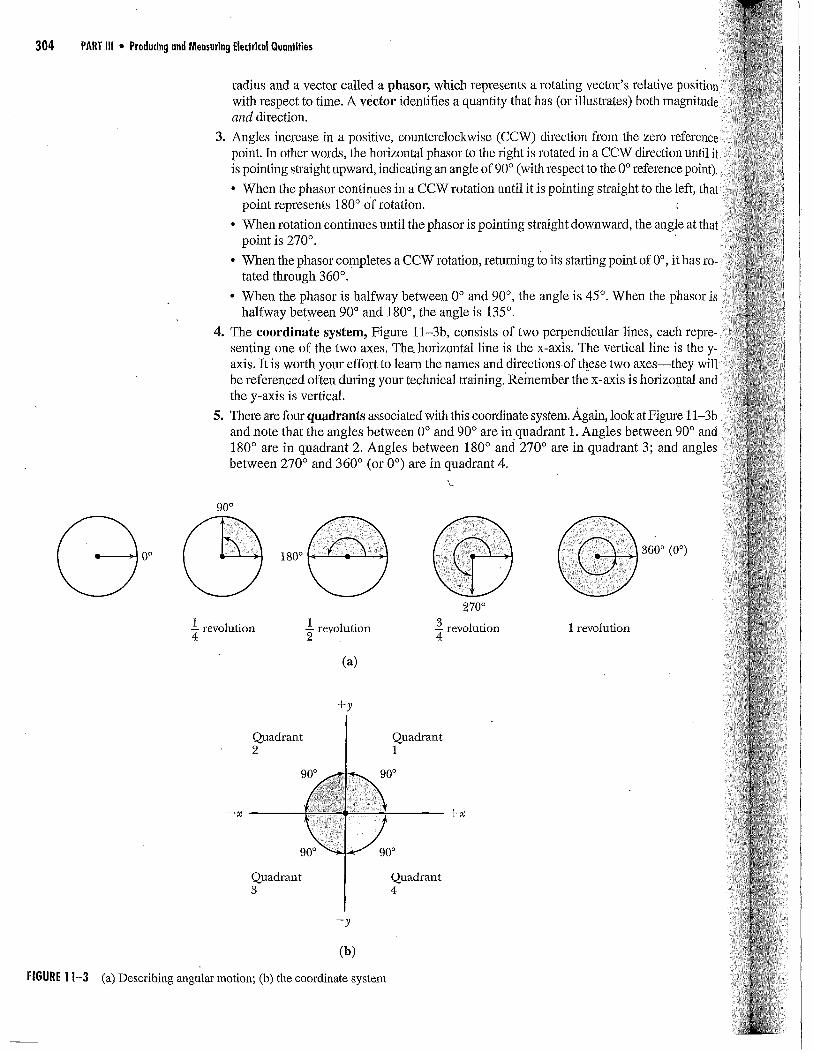
Mathematical and Graphic Conceptsabout AC1. Angular motion is defined in terms of a 360° circle oi" a four-quadrant coordinate system.
2. The zero degree (starting or reference plane) is a horizontal line or arrow extending to theright, Figure 11-3a. NOTE: Other terms you might see for this line or arrow are a rotating
304 PART iU • Producing .nd Measuring Electrical Quantities
radius and a vector called a phasor, which represents a rotating vector's relative positionwith respect to time. A vector identifies a quantity that has (or illustrates) both magnitudeand direction.
3. Angles increase in a positive, counterclockwise (CCW) direction fl'om the zero referencepoint. In other words, the horizontal phasor to the right is rotated in a CCW dh'ection until itis pointing straight upward, indicating an angle of 90° (with respect to the 0° reference point).
• When the phasor continues in a CCW rotation until it is pointing straight to the left, thatpoint represents 180° of rotation.
• When rotation continues until the phasor is pointing straight downward, the angle at thatpoint is 270°.
• When the phasor completes a CCW rotation, returning to its statÿing point of 0°, it has ro-tated through 360°.
• When the phasor is halfway between 0° and 90°, the angle is 45°. When the phasor ishalfway between 90° and 180°, the angle is 135°,
4. The coordinate system, Figure 11-3b, consists of two perpendicular lines, each repre-senting one of the two axes. The horizontal line is the x-axis. The vertical line is the y-axis. It is worth your effort to learn the names and directionsof these two axes--they willbe referenced often during your technical training. Remember the x-axis is horizontal andthe y-axis is vertical.
5. There are four quadrants associated with this coordinate system. Again, look at Figure 11-3band note that the angles between 0° and 90° are inquadrant 1. Angles between 90° and180° are in quadrant 2. Angles between 180° and 270° are in quadrant 3; and anglesbetween 270° and 360° (or 0°) are in quadrant 4.
k_
90o
180°
I revolution 1 revolution4 2
270°
3 revolution 1 revolution4
360o (0°)
(a)
+y
Quadrant2
Quadrant1
Quadrant3
Quadrant4
-y
(b)
(a) Describing angular motion; (b) the coordinate system
-}-X
FIGURE 11-3

CHAPTER 11 . Basic AC Quanlilies 305
6. When the phasor moves in a clockwise (CW) direction, the various anglepositions are describedas negative values. For example, the location halfway between 360° (0°) and 270° (-90°) inquadrant 4 (the same location as the +315° point) can be described as either -45° or +315°.
[] IN-PROCESS LEARNING CHECK 1
1. Define the difference between dc and ac.
2. Which direction is the reference, or 0° position, when describing angular motion? __
3. Is the y-axis the horizontal or vertical axis? __
4. Is the second quadrant between 0° and 90°, 90° and 180°, 180° and 270°, or 270° and360°?
5. Define the term vector.
6. Define the termphasor __ []
Keeping in mind these thoughts about defining angles in degrees and a reference point on thecoordinate system, let's move to a brief explanation of how an ac sine-wave voltage is generated.
] 1-2 Generating an AC Voltage
As a quick review, recall that generating a dc voltage is accomplished by means of rotating con-ductors (e.g., armature coil wires) cutting or linking lines of flux in a magnetic field. Observethat by means of a split-ring commutator and brushes, dc output voltage is delivered from therotating armature to the load, and the de is in the form of a pulsating dc, Figure 11-4a and b.
Refer to Figure 11-4c and note the elementary concepts of an ac generator. The simpli-fied generator consists of a magnetic field through which a conductor is rotated. As youwould expect when the maximum number of magnetic field flux lines are being cut (orlinked) by the rotating conductor, maximum voltage is induced. Recall that if 108 flux linesare cut by a single conductor in one second, the induced voltage is one volt. Conversely, whenminimum (or zero) flux lines are cut, minimum (or zero) voltage is induced.
Slip rings (sometimes called collector rings), are electrical contacting devices designedto make contact between stationary and rotating electrical junctures. As you can see inFigure 11-4c, the brushes are in a stationary position, and make contact between the ex-ternal load resistance and the slip rings. The slip tings are connected to, and rotate alongwith, the rotating conductors. The outside surfaces of the slip rings, however, are in con-tinuous sliding electrical contact with the brushes. The conductors, which are rotatingthrough the magnetic field, are connected so that the same end of each conductor is al-ways connected to the same slip ring.
Also, observe that the slip rings and brushes connect the external circuit load to the rotat-ing loop so each end of the load is always connected to the same end of the rotating conduc-tor. Thus, if the polarity of the induced voltage in the conductor changes, the voltage felt bythe load through the brushes and the slip tings also changes.
Figure 11-4d shows the graphical representation of the changing magnitude and polarityof generator output felt by the load throughout one complete 360° rotation of the conductorloop(s). As we stated earlier, this graphic representation of the changing amplitude and po-larity of the output voltage over time is called a waveform. In this case, the waveform is thatof one full cycle of an ac sine-wave signal. A cycle is often defined as one complete sequenceof a series of recurring events. There are many examples of cycles. The 24-hour day, the 12-hourclock face, one revolution of a wheel, and so on. In Figure 11-4d, you can see how at anygiven instant or point throughout the cycle, the signal's amplitude can be related to theangular degrees of rotation of the generator. Figure !1-5 again relates sine-wave amplitudeand polarity to degrees throughout 360°. For a sineÿwave, you can see that maximum posi-tive amplitude occurs at 90°. Maximum negative amplitude occurs at 270°. And, the sine-wavesignal is at zero level at 0°, 180°, and 360° (assuming we start the waveform analysis at thezero point, with the signal progressing in a positive direction).
Practical NotesAs you will see inupcoming studies, we donot always have to analyzean ac sine-wave cycle as
starting at zero amplitudelevel, and a cycle beingcompleted at zeroamplitude. We can defineone complete cycle asstarting at any point alongthe sine wave, and beingcompleted at the next pointalong the waveform that isat the same amplitude andchanging in the samedirection. (That is, thepoint at which the sequenceof recurring events startsagain.)

306 PART III • Prod.ucing and Measuring Electrical Quantities
Flux Currentflmv
commutator
Currerÿtflow
Flux
Carbonbrushes -----+
(a)
i zero
dc outputvoltage,V
0
Peak v0itageI
Zerol i PeakvoltageI
1 1 3
,Zerol
I
1 Revolution 71
(b)
Rotation
1-ÿ T Maximum volts
90°AS
+
Slip rings 3°
1T Time
180°T360°
External load resistance Maximum volts/4-34 T
270°1T = Period = f = Time for 1 cycle
(c) (d)
. FIGURE 11-4 Basic concepts of an ac generator

CHAPTER 11 . Basic AC Quantities 307
The Sine WaveThis unique, single-frequency waveform reflects a quantity that constantly changes in am-plitude and periodically reverses in direction.
Radians of Angular MeasureYou have been introduced to the fact that sine-wave signals are often analyzed in terms of an-gular measure. The radian is another angular measure of importance, as many of the mathe-matics associated with ac analysis often use this measure.
As you might surmise from the word radian itself, there is a relationship between the termradius (of a circle) and the term radian (used in circular angular measure). One definition fora radian (sometimes abbreviated "tad") is: "In a circle, the angle included within an arc equalto the radius of the circle." In Figure 11-6, you can see that the angle included by an arc ofthis length is about 57.3°.
The thing that makes the radian of particular interest, mathematically, is that there are ex-actly 2re radians in 360°. If you divide 360° by 57.3°, you will see that it would take 6.28(or 2n) radians to make up a complete 360° circle. Observe Figure 11-7 and note the rela-tionships between the degrees and radians around the circle. It is important to remember thatone complete cycle of ac (360°) equals 27r radians, that half a cycle (180°) equals in radian,and so on. See Figure 11-7b. The waveform in Figure 11-7b is called a sine wave becausethe amplitude (amount) of voltage at any given moment is directly related to the sine func-tion, used in trigonometry. That is, the trigonometric sine (sin) value for any given angle (0ortheta), represented along the sine wave, relates directly to the voltage amplitude at that same
+y90°
120ÿ--"ÿ 4, ÿ"ÿ60°
0o//',, /\ 0o/'-.. ', /x..J\t '-.. ,'€" i
180o
1t" 0 \ÿ".ÿ.. 0°, 360°, +x. 1/ I° \\\\\ ,'ÿ'/
Rotate CCW ÿ 270°
+R
0o 30° 60° 90° 120° 150°
P10t of projections on they-axis versus angle
80 270° 36TII11\ : /1
-
-R-y
FIGURE 11-5/
Arc = Radius = 1 Radian
Projections of sine-wave amplitudes in relation to various angles
['rr]2 radians i90°
i2qr radians ÿl270°
13- radians', 2
FIGURE 11-6 Illustration of.the radian angularmeasurement
(a)
FIGURE | 1-7 Degrees and radians of angular measure
r radians ÿi2
90°
qr radians I
2ÿ" radians
\270° 360°
1IIII
13ÿr radians,ÿ 2
(b)

308 PART III • Producing and Measuring Electrical Quantities
For angle A:1. The side opposite the right angle is called
the hypotenuse ( c).2. The side opposite angle A is called the
opposite side ( a).3. The side of angle A which is not the
hypotenuse is called the adjacent side (b).
Sine (sin) of angleopposite side : a-n -ypotenuse ; sin A -
C
Cosine (cos) of angle
Tangent (tan) of angle
adjacent side b= ; cos A -
hypotenuse c
opposite side ÿ a- ' tanA - -adjacent side ' b
sin Acos A
FIGURE 11-8 The tight triangle
0 90°
bAdjacent side
a
Oppositeside
angle. NOTE: The sine of a given angle, using a right triangle as the basis of analysis, is equalto the ratio of the opposite side to the hypotenuse, Figure 11-8.
Also observe in Figure 11-8 that we have shown the side relationships that are importantin computing the cosine (cos) and the tangent (tan) trig function values for the selected acuteangle in the right triangle. As you can see, the cosine (cos) equals the ratio of the side that isadjacent (to the angle of interest) to the hypotenuse. The tangent (tan) equals the ratio of theside opposite to the side adjacent for the angle of interest. You will be studying and usingthese trig functions in later studies in this text, along with the sine (sin) function, which hasbeen introduced in this chapter.
Pra c ica To find the sine of an angle using your calculator, be sure your calculator is in the degrees(DEG) mode of operation, rather than the RAD or GRAD mode. Recall that the units forangular measurement are as follows: a degree = 1/360 of a circle; a radian = 1/2ÿ orapproximately 0.159 of a circle (about 57.3°); and a grad = 1/400 of a circle, or about 0.9°.(This means that 90° = 100 grads.)
Once your calculator is in the degrees mode, simply input the value of the angle (e.g., 30, for30°), press the [SIN] function button, and read the value of the sine. In our example of 30°, thevalue of the sine is 0.5. The key sequence again is as follows: (the angle value), then the trigfunction key. The answer shows the value of the trig function.
To go the other way, that is, if you know that the ratio of the opposite side to the hypotenuseequals 0.5, and you want to find the angle whose sine value is 0.5: input 0.5, then press the rÿd]and [SIN-1] keys. On some calculators, you press [lÿ], then [SIN]. By pressing the ÿ and [SIN-1] (orVffq], [SIN]) keys, you are telling the calculator you want to know the angle whose sin is 0.5. Whenyou do this, you should see 30 in the readout of the calculator. This means the angle whose sine is0.5 is 30°. The key sequence again is: (the trig function value), the [gÿ or ÿ key, then the trigfunction key (i.e., the [SlN-ÿ] or [SIN] key). The answer shows the value of the angle.
You can use the same techniques to find the value for cosines and tangents and/or theangles involved. That is, to find the trig function value when the angle is known, input thevalue of the angle, then press the correct trig function key to get your answer. In the case ofthe cosine, if you input 30 (for 30°), then press the [BOB] button, the readout will indicate thatthe value of the cosine for an angle of 30° is 0.866. If you input 30, then press the [TAN] button,you find the tangent of an angle of 30° is 0.577. Going the other way, input the trig functionvalue, then the ÿ or riffq] key, then the appropriate trig function key (e.g., [SIN-ÿ] or [SIN] key,as appropriate). The answer is the angle involved.
CHAPTER 11 . Basic AC Quantities 309
Direction of rotation
Resistor lead"A" is alwaysconnected tosame end of loopthroughout itsendre rotation.Likewise forResistor lead "B".
Voltmeter
Load
Magnetic field
• )
> >
(a) (b) (c) (d) (e)
+
70.7%of !maximum.
0
I II II II II I
Back at/ ! ÿ position (a) lt
I .... ÿ ! ÿ - and point for l
/ , ' . \ starting next !
.0°\ .0o /I II I• i 1
I 1
-ÿ Cycle
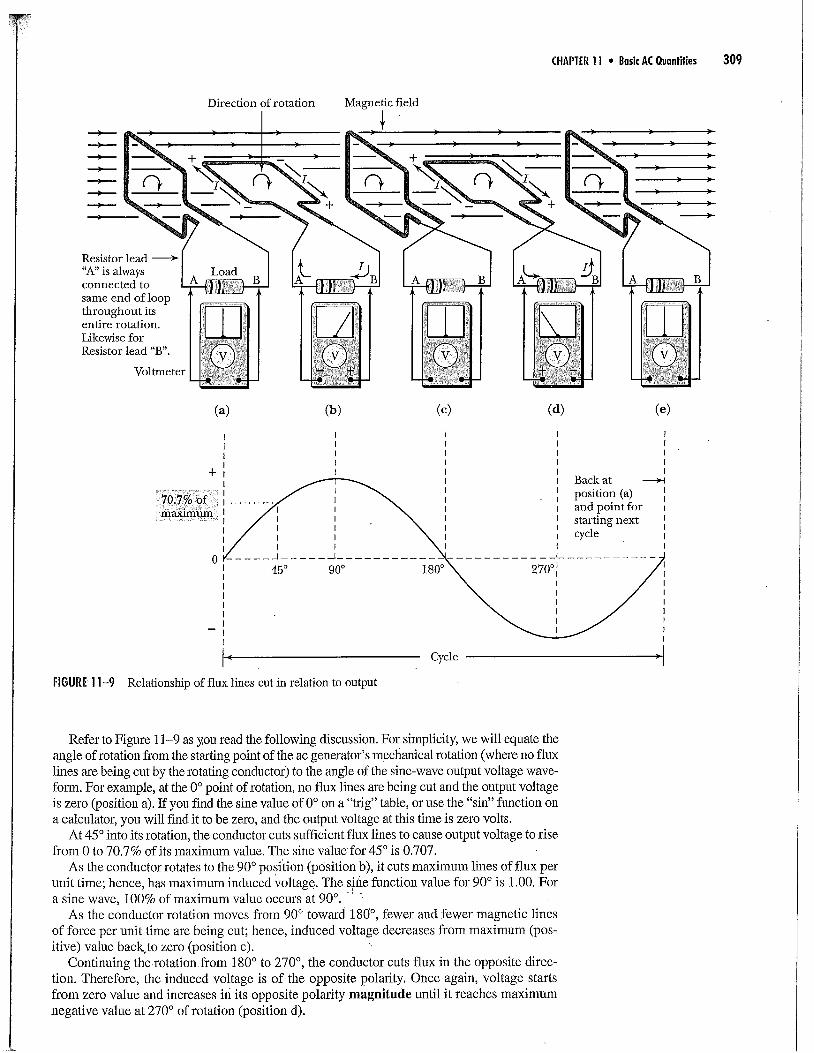
FIGURE 11-9 Relationship of flux lines cut in relation to output
Refer to Figure 11-9 as you read the following discussion. For simplicity, we will equate theangle of rotation from the starting point of the ac generator's mechanical rotation (where no fluxlines are being cut by the rotating conductor) to the angle of the sine-wave output voltage wave-fonn. For example, at the 0° point of rotation, no flux lines are being cut and the output voltageis zero (position a). If you find the sine value of 0° on a "trig" table, or use the "sin" function ona calculator, you will find it to be zero, and the output voltage at this time is zero volts.
At 45° into its rotation, the conductor cuts sufficient flux lines to cause output voltage to risefrom 0 to 70.7% of its maximum value. The sine valuefor 45° is 0.707.
As the conductor rotates to the 90° position (position b), it cuts maximum lines of flux perunit time; hence, has maximum induced voltage. The @fie function value for 90° is 1.00. Fora sine wave, 100% of maximum value occurs at 90°. "
As the conductor rotation moves from 90° toward 180°, fewer and fewer magnetic linesof force per unit time are being cut; hence, induced voltage decreases from maximum (pos-itive) value back, to zero (position c).
Continuing the rotation from 180° to 270°, the conductor cuts flux in the opposite direc-tion. Therefore, the induced voltage is of the opposite polarity. Once again, voltage startsfrom zero value and increases in its opposite polarity magnitude until it reaches maximumnegative value at 270° of rotation (position d).

310 PART III • Producing and Measuring Electrical Quantities
From 270° to 360°, the output voltage decreases from its maximum negative value backto zero (position e). This complete chain of events of the sine wave is a cycle. If rotation iscontinued, the cycle is repeated.
(NOTE: A cycle can start from any point on the waveform. That particular cycle con-tinues until that same polarity and magnitude point is reached again. At that point, repe-tition of the recurring events begins again, and a new cycle is started.)
11-3 Rate of Change
Starting at one of the zero points, voltage increases from zero to maximum positive, thenback to zero, on to maximum negative value, and then back to zero. As you can see, the sinewave of voltage continuously changes in amplitude and periodically reverses in polarity.
Let's look at another interesting aspect of the sine wave of voltage. The sine-wave wave-form is nonlinear. That is, there is not an equal change in amplitude in one part of the wave-form for a given amount of time, compared with the change in amplitude for another equaltime segment at a different portion of the waveform. Therefore, the rate of change of voltageis different over different portions of the sine wave.
[] EXAMPLE Notice in Figure 11-10 the voltage is either increasing or decreasing in am-plitude at its most rapid rate near the zero points of the sine wave (i.e., the largest amplitudechange for a given amount of time).
Also, notice that near the maximum positive and negative areas of the sine wave, specifically,near the 90° and 270° points, the rate of change of voltage is minimum. This rate of change hasmuch less change in amplitude per unit time. Knowledge of this rate of change (with respect totime) will be helpful to you in some later discussions, s.o try to retain this knowledge. []
Change from450-90°
Change from00_45°
i i i
t A i
j i i Jr : : :"
: I II I I
7 4 -i0 oL- i: : : : :
i i iII¢'z
l i L i
:. : : :
,'i i i i/i t t .1
/ J d-'l I
//ÿ" Most rapid rate[ =ÿ) of changE near ;
zero points
\
m
i'
J
O i Least rapid rate i' of change near ipeak amplitudes •
T = time for one cycle. This is known as the "period" of the waveform.
FIGURE 11-10 Different rates of change of voltage at various parts of sine wave

CHAPTER i I • Basic AC Quantities 311
11-4 Introductory Information Summary RegardingAC Sine-Wave Signals
1. A sine-wave signal is an ac signal whose amplitude characteristics can be related to thetrigonometric sine function.
2. An ac sine-wave signal continuously varies in amplitude and periodically changes polarity.
3. One complete cycle of an ac signal can be measured in terms of 360° and/or 2re radians(a radian = 57.3°).
4. When a signal's 0° starting point is considered to be at zero amplitude, it is common tothink of that signal's maximum positive point occurring at 90°, the next zero point beingat 180°, the maximum negative point being at 270°, and the cycle being completed at 360°,at zero amplitude, ready to start the next cycle.
5. One cycle of a sine-wave signal can be measured from any starting point along the wave-form to the next point along the waveform that matches it, and starts another similar wave-form sequence in terms of amplitude and direction variations.
6. The "rate of change" of the sine-wave waveform is greatest at the zero amplitude points,and least at the maximum amplitude points of the waveform.
.
2.
=ÿ_. PrACTI(E PROBLEMS !Use a calculator or trig table and determine the sine of 35°.
Indicate on the following drawing at what point cycle 1 ends and cycle 2 begins, if thestarting point for the first cycle is point A.
B H P
I vTM s
T
3. Which points on the drawing above represent areas of maximum rate of change of the sinewave(s)?
]-5 Some Basic Sine-Wave Waveform Descriptors
Refer to Figure 11-11. The horizontal line (x-axis) divides the sine wave into two parts--oneabove the zero reference line, representing positive values, and one below the zero reference line,representing negative values. Each half of the sine wave is an alternation. Naturally, the upper
Cycle
Peak-to-peak Peak
Half cycle iA_ r
FIG[IRE l 1-11 Several important descriptors of sine-wave ac

312 PART III * Producing and Measuring Electrical Quantities
half is the "positive alternation," or positiye half cycle. The lower half of the wave is the "nega-tive alternation," or negative half cycle. With zero as the staa'ting point, an alternation is the vari-ation of an ac waveform from zero to a maximmn value, then back to zero (in either polarity).
Examine Figure 11-11 again, and learn what is meant by positive peak, negative peak, andpeak-to-peak values of the sine wave. Also, note in this illustration how a cycle is depicted.
Generalizing, a cycle, whether in electronics or any other physical phenomena, is one com-plete set of recurring events. Examples of this are one complete revolution of a wheel, and the24-hour day (representing one complete revolution of the earth).
] 1-6 Period and Frequency
Periodic WavesPeriodic waves are those that repeat themselves regularly in time and form. Most ac signalsand waves that you will study as a technician fall into this class. The period, or time of in-terest, for such waves is the time it takes for one complete cycle of that waveform. Let's seehow the sine wave we have been discussing is defined in this regard.
PeriodThe ac sine-wave waveform has been described in terms of amplitude and polarity and hasbeen referenced to various angles. It should be emphasized that the sine wave occurs overtime--it does not instantaneously vary through all its amplitude values. The household ac,with which you are familiar, takes 1/60 of a second to complete a cycle. Look at Figure 11-12and observe how the sine-wave illustrations have been labeled. Notice that time is along thehorizontal axis. In Figure 11-12a, a one-cycle-per-second signal is represented. If this wave-
form represented one cycle of the 60-cycle ac house current, the time, or period (T) of a cy-cle would be 1/60 of a second, rather than the one second shown for the one-cycle signal.Learn the term period! Again, period is the time required for one cycle.
FrequencyThe number of cycles occurring in one second is the frequency (f) of the ac. Refer again toFigure 11-12. The period of one cycle is inversely related to frequency. That is, the periodequals the reciprocal of frequency, or 1If The letter T represents period; that is, T is time ofone cycle. Therefore:
1FORMULA 11-1 T(s) = --f(Hz)
One cycle in one second equalsa "frequency" of one hertz
(a)
FIGIJRE 11-12 Comparing two frequencies
!Period
i: r I-1-------- One second
Two cycles in one second equalsa "frequency" of two hertz
(b)

CHAPTER 11 ,, Bask AC Quantities 313
Restated, the period of one cycle (in seconds) equals 1 divided by the frequency in cycles persecond. Rather than saying "cycles per second" when talking about frequency, we use a unitcalled the Hertz (Hz), named for the famous scientist Heinrich Hertz. For example, 1 Hzequals 1 cycle per second; 10 Hz equal 10 cycles per second; 1 kHz equals 1,000 cycles persecond; and 1 MHz equals 1 million cycles per second. Notice the abbreviation for Hertz(Hz) starts with a capital H and is abbreviated Hz to prevent confusion with another electri-cal quantity you will study later--the henry, which is abbreviated with a capital H.
[ÿ EXAMPLE1" The peri°d °f a 100-Hz sine wave is --ÿ1 °f a sec°nd' (T = f)"100
2. The period of a 1,000-Hz signal is --1 of a second, IT = f).1,000
[]
Relationship of Frequency and PeriodConverse to calculating the period of one cycle by taking the reciprocal of the frequency (i.e.,T= l/f), the formula is transposed to find the frequency, if you know the time it takes for onecycle. The formula is:
1FORMULA 11-2 f(Hz) =--T(s)
This indicates the period is inverse to the frequency, and vice versa. That is, the higher (orgreater) the frequency, the less time required for one cycle (the shorter the period), or thelonger (or greater) the period, the lower the frequency must be. In other words, if TI", thenf,[,; and iff'l', then T.I,. NOTE: Again the ÿ function on your calculator is useful.
[] EXAMPLE1. A signal with a period of 0.0001 seconds indicates a signal with a frequency of
2. A signal with a period of 0.005 seconds indicates a signal with a frequency of
Practical NotesUse the [ÿ3 (or x-1)reciprocal function of yourcalculator for this typeof calculation.
[] IN-PROCESS LEARNING CHECK 2
1. Determine the frequency of an ac signal whose period is 0.0001 second. __
2. What is the period for a frequency of 400 Hz? __
3. What time does one alternation for a frequency of 10 kHz take?
4. Does the y-axis represent time or amplitude in wavefotTns? __
5. For waveforms, at what angular points does the amplitude equal 70.7% of the positivepeak value? At what angular points is the sine wave at a 70.7% level dufng the negativealternation?
6. In the coordinate system, in which quadrants are all the angles represented by the positivealternation of a sine wave?
7. What is the period of a frequency of 15 MHz? __
8. What freqnency has a period of 25 ms? __
9. As frequency increases, does Tincrease, decrease, or remain the same?
10. The longer a given signal's period, the __ the time for each alternation.[]

314 PART Ill • Producing and Measuring Electrical Quantities-,
Another meaningful measurement related to-frequency is wavelength. (In this case, it is an inverserelationship; i.e., the higher the frequency the shorter the wavelength.) In your later studies, youwill be likely to deal more with this measurement. You will be learning more details of the variousfrequency spectrums, such as audio frequencies, radio frequencies, optics, mad x-rays.
Wavelength is the distance a given signal's energy travels in the time it takes for one cycleof that energy. Incidentally, the symbol used to represent wavelength is the Greek letterlambda (ÿ). Basically, two factors determine the wavelength of any given frequency. Thespeed at which the signal's energy moves through its propagation medium, and the length oftime for one cycle (or the period) of the specific frequency. For example, radio waves andlight waves travel through space at a speed of about 186,000 miles per second, whichtranslates to about 300 million meters per second. Signals in the audio spectrum, however,travel at around 1,130 feet per second. As you might surmise, the higher the frequency, theless time there is in one period (one cycle); hence, the less distance the wave travels in thattime, and the shorter its wavelength.
The formula that describes the above data is:
7ÿ = velocity/frequency, or 3ÿ = v/f
For frequencies (radio frequencies, etc.) that travel at the speed of light, the formula is:
300x106 300)ÿ (wavelength) = or
Freq. (Hz) f(MHz)
For example, the wavelength of a 2-MHz signal would be 300/2 = 150 meters. You can alsofind a frequency, if you know its wavelength. That is, Frequency = v/)ÿ. In our example,Frequency (in MHz) = 300 x 106/150 = 2 MHz.
1 I-7 Phase Relationships
Alternating current (ac) voltages and currents can be inphase or out ofphase with each otherby a difference in angle. This is called phase angle and is represented by the Greek lettertheta (0). When two sine waves are the same frequency and their waveforms pass throughzero at different times, and when they do not reach maximum positive amplitude at the sametime, they are out of phase with each other.
On the other hand, when two sine waves are the same frequency, and when their wave-forms pass through zero and reach maximum positive amplitude at the same time, they arein phase with each other.
Look at Figure 11-13 and note the following:
lo
o
Sine waves a and b are in phase with each other because they cross the zero points andreach their maximum positive levels at the same time (shown on the x-axis). Zero pointsare at times to, t2, and t4, and the positive peak at time tl.
Sine waves b and c are out of phase with each other because they do not pass through thezero points and reach peak values at the same time. In fact, sine wave b reaches the peakpositive point (at tl) of its waveform 90° before sine wave c does (at tz). It can be said thatsine wave c "lags" sine wave b (and also sine wave a) by 90°. Conversely, it can be saidthat sine wave b "leads" sine wave c by 90°. In other words, when viewing waveforms oftwo equal-frequency ac signals, the signal reaching maximum positive first is leading theother signal, in phase. "First" refers to the peak that is closest to the y-axis; thus, showingan occurrence at an earlier time.
Obviously, ac signals can be out of phase by different amounts. This is illustrated by sine-wave waveforms and phasor diagrams, Figure 11-14. Figure 11-14a shows two signals that

CHAPTER 11 ,, BasicACQuantitles 315
: to t] i t2i t3 t4i
(a)
(b)
(c)
/ I ÿ i I I/ I \ i I
/ I \t l i
i iN i /i I \ i
I II II I
1...... T ...... "f -
i i \ i / i
i / I \ i ii / I \ i I
............. • -[
FIGURE 11-13 Phaserelationships
0°
!t0it
(Time zero);
I I II I I I
90° 180° 270° 360°
tll it2 ! t3i t4ÿ
AB
I 45°
\ ', /I
t/" ÿ,'/ B
(A as reference)
(b)
\\'X% /¢,/g'
180°
' ?ÿ (A as reference) FIGURE 11-14 Diagramsdepicting out-of-phase signals
(c)A
(B as reference)
are 45° out of phase. Which signal is leading the other one by 45°? The answer, of course, isA is leading B by 45°.
In Figure 11-14b, waveforms A and B are 1;80° out of phase. If these signals were of equalamplitude, they would cancel each other ouL
In Figure 11-14c, you see two signals that are 90° out of phase.Notice how the phasors in Figm'e 11=14 illustrate both magnitude and relative phase for
several conditions. Observe that the length of the phasors can represent amplitude values ofthe two waveforms. Both phasors must represent the same relative point or quantity for eachof the two waveforms being compared.
I," \1 x / t .'
F X10° 90°\180°1x,, /1270 zI \ i'ÿ/i ," ,

316 PART III * Producing and Measuring Electrical Quantities
PRA(TKE PROBLEMS 21. Illustrate two equal-frequency sine waves that are 60° out of phase with each other. Label
the leading wave as A, and the lagging wave as B. Also, show the A waveform stm'ting atthe 0° point!
2. Assume the signals in problem 1 are eqnal in amplitude. Draw and label a diagram usingphasors to show the conditions described in problem 1. Also, show the B phasor as thehorizontal vector !
l 1-8 Important AC Sine-Wave Current and Voltage Values
The importance of learning the relationships between the various values used to measure andanalyze ac ctments and voltages cannot be over(mphasized! These values are defined in thissection. Learn these relationships well, since you will use them extensively in your trainingand work from this point on.
Brief Review of TermsLook at Figure 11-15 and recall that the maximum positive or negative amplitude (height)of one alternation of a sine wave is called peak value. For voltage, this is called Vp, or VM;for current, this is called Ip, or IM.
Also, remember the total amplitude from the peak positive point to the peak negative pointis called peak-to-peak value, sometimes abbreviated as Vp.p when speaking of voltage values.
In other words, for a symmetric!l waveform:
vp=lxvp.p, and Vp.p = 2x Vp
I I I1 I II + I, I
Average value =0.637 × peak forone alternationAverage value = 0over onecomplete cycle(NOTE: Average valuenot normally used inac calculations)
+Peak ormaximum
Peak-t0-
peak
90°
-Peak or "
maximum
• Dotsindicateinstantaneousvalues
FIGURE 1 l-I 5 Important values related to sine-wave waveforms

CHAPTER 11 * Bask AC Quantities 317
Some New Terms and Values
Refer again to Figure 11-15 as you study the following discussions:
1. Since a given amount of current through a component in either direction causes the sameamount of voltage drop, power dissipation, heating effect, and so on, the effects of an acvoltage or current are analyzed on a single alternation. For example, the positive alterna-tion causes the same amount of current through a component (like a resistor) as the neg-ative alternation, and vice versa.
2. The most frequently used value related to ac is called the effective value (rms). This isthat value of ac voltage or currentproducing the same heating effect as an equal value ofdc voltage or current. That is, it produces the same power:
V2!ÿR or --
R
For example, an effective value of ac current of two amperes through a given resis-tor produces the same heating effect as two amperes of dc current through that sameresistor.
Effective value is also commonly termed the root-mean-square value. The root-mean-square term comes from the mathematical method used to find its value. It is derived fromtaking the square root of the mean (average) of all the squares of the sine values. Thus, ef-fective value (rms) is 0.707 times maximum or peak value. Again, the reason effectivevalue is greater than half of the maximum value relates to the nonlinearity of the rate ofchange of voltage or current throughout the alternation.
FORMULA 11-3 Effective value (rms) = 0.707 x Peak value
[] EXAMPLE Again, assuming 1-V peak value for the waveform in Figure 11-15,Vrms = 0.707 X 1 = 0.707 V. []
. Although average value only has meaningful significance as it relates to the subject of rec-tification of ac (changing of ac to dc), we will simply introduce you to the concepts here.This awareness will then become useful in your later studies. If you compute the averageamplitude or level under the waveform outline of one-half cycle or one alternation of anac waveform, the result is the average value equals 0.637 (63.7%) of the maximum (orpeak) value. Again, the reason the average value is more than 50% of the peak value is be-cause the rate of change is slower near peak value than it is near the zero level. That meansthe voltage level is above 50% of maximum level for a longer time than it is below 50%of maximum level.
In other words, the sine wave is a nonlinear waveform. Therefore, the average is not halfof the peak value. Incidentally, when you "average" over the entire cycle, rather than forone alternation, the result is zero, since the positive and negative alternations are symmetri-cal, equal in amplitude and time, and opposite in polalJty. However, computing only one al-ternation or half cycle, the formula is:
FORMULA 11-4 Average value = 0.637 x Peak value
[] EXAMPLE If the peak value in Figure. 11-15 were 1 V, V, vg (one-half cycle) =0.637 × 1.0 = 0.637 V. []
Summary of Relationships for Common AC Values(for Sinusoidai Waveforms)
1. Effective value (rrns) = 0.707 times peak value, or 0.3535 times peak-to-peak value.
2. Average value = 0.637 times peak value. (NOTE: It also = 0.9 times effective value, since0.637 is approximately 9/10 of 0.707.)
Most voltmeters andcurrent meters used bytechnicians are calibratedto measure effective, orrms, ac values. This
includes VOMs, DMMs,and clip-on current andvolt-meters.
In ac, power (heatingeffect) is computed inpurely resistivecomponents or circuits byusing the effective voltageor current values. That is,P = Vÿmÿ x Iÿ, orP = I2R, or P = V2/R.

318 PART III , Producing and Measuring Electrical Quantities
3. Peak value = maximum amplitude within one alternation. Since effective value (rms) is0.707 of peak value, it follows that peak value equals 1/0.707, or is 1.414 times effectivevalue. That is, Vp = 1.414 × rms value. (NOTE: It also equals 0.5 times peak-to-peakvalue.)
4. Peak-to-peak value = two times peak value and is the total sine-wave amplitude from pos-itive peak to negative peak. It follows then, thateffective value (rms) is 0.3535 of the peak-to-peak value (or half of 0.707). That is, Vp_p equals 1/0.3535, or peak-to-peak value equals2.828 times effective value.
With the knowledge of these various relationships, try the following practice problems.
PRA(TI(E NIOBLEIVlS 31. The peak value of a sine-wave voltage is 14.14 V. What is the rms voltage value?
2. For the voltage described in question 1, what is the V, vg value over one alternation?
3. Approximately what percentage of effective value computed in question 1 is the averagevalue computed in question 2?
4. Does frequency affect the rms value of a sine-wave voltage?
5. Are the results from calculating ac values from the negative alternation the same as ac val-ues calculated from the positive alternation?
6. The peak-to-peak voltage of a sine-wave signal is 342 V. Calculate the following:
a. acrms (effective) voltage value
b. peak voltage value
e. instantaneous voltage value at 45°
d. instantaneous voltage value at 90°'
e. ac average voltage value (over one-half cycle)
11-9 The Purely Resistive AC Circuit
Earlier, we discussed in-phase and out-of-phase ac quantities. In purely resistive ac circuits,the ac voltage across a resistance is in phase with the current through the resistance,Figure 11-16. It is logical that when maximum voltage is applied to the resistor, maximumcurrent flows through the resistor. Also, when the instantaneous ac voltage value is at thezero point, zero current flows and so forth. Ohm's law is just as useful in ac circuits as it hasbeen in dc circuits. (NOTE: Instantaneous values are expressed as e or v for instantaneousvoltage and i for instantaneous current.)
[] EXAMPLE Applying Ohm's law'to the circuit in Figure 11-16, if the rms ac voltage is100 V, what is the effective value of ac current through the 10-fÿ resistor? If you answered10 A, you are correct! That is,
V 100 VI ..... 10A []R 10ÿ
FIGURE 11-16 Basic acresistive circuit
dÿ OOV(rms)
V
In phase
CHAPTER 11 . Basic AC Quantities 319
In ac circuits where voltage and current are in phase, the calculations to find V,/, andP are the same as they are in a dc circuit. Generally, effective (rms) values are usedin these computations, unless otherwise indicated.
If you want to determine the instantaneous voltage at the 30° point of the sinewave, the value would equal the sine of 30° times the maximum value. In our sam-ple case, the sine of 30° = 0.5. Therefore, if the maximum voltage (Vm,x or Vp) is141.4 volts, the instantaneous value at 30° = 0.5 × 141.4 = 70.7 V.
FORMULA 11-5 v = Vp sin 0
where v = instantaneous voltage valueVp = maximum voltage value
sin 0= sine of the angle value
The analyses you have been using for dc circuits also applies to purely resistivecircuits with more than one resistor. The only difference is that you typically willdeal with ac effective values (rms). When you know only peak or peak-to-peak val-ues, you have to use the factors you have been studying to find the rms value(s). Inlater chapters, you will study what happens when out-of-phase quantities are intro-duced into circuits via "reactive" components.
Try to apply your new knowledge of ac quantities and relationships to the fol-lowing practice problems.
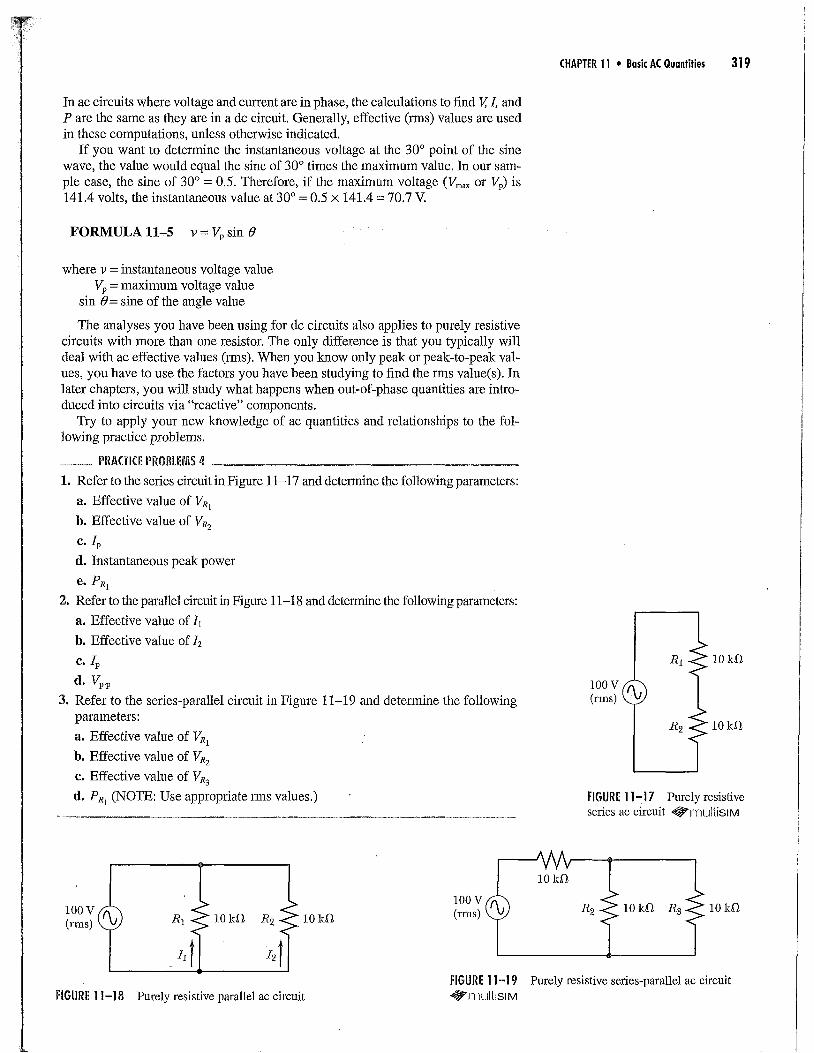
= PRA(TI(E PROBLEMS 41, Refer to the series circuit in Figure 11-17 and determine the following parameters:
a. Effective value of VR1
b. Effective value of VR2
C. Ip
d. Instantaneous peak power
e. PR1
2. Refer to the paralM circuit in Figure 11-18 and determine the following parameters:
a. Effective value of 1i
b. Effective value of 12
e. Ip
d. Vpp
3. Refer to the series-paralM circuit in Figure 11-19 and determine the followingparameters:
a. Effective value of VR1
b. Effective value of VR2
e. Effective value of VR3
d. PRI (NOTE: Use appropriate rms values.) FIGURE 11-17 Purely resistiveseries ac circuit -*ÿ'mtJKiSIM
'! tR1 10 kÿ R2 10 kfÿ
li I2
10o V(rms)
lO kfÿ
R2 10 kÿ R3 10
FIGURE I 1-19FIGURE 11-18 Purely resistive parallel ac circuit ÿ'n ÿL.ÿIL:sIM
Purely resistive series-parallel ac circuit

320 PART III • Producing and Measuring Electrical Quantities
l |-| 0 Other Periodic Waveforms
Important WaveshapesAlthough the sine wave is a fundamental ac waveform, there are nonsinusoidal waveformsthat are important for the technician to lÿnow and understand. Modern digital electronicssystems, such as computers, data communications, radar, and pulse systems, and circuitsrequiring ramp waveforms, require that the technician become familiar with their features.It is not necessary in this chapter to deal in-depth with these various waveforms, but it isimportant to at least introduce you to them.
The most important waveforrns include the Square wave, the rectangular wave, and thesawtooth (ramp-shaped) wave. Refer to Figure 11-20 and note the comparative characteristicof each waveform with the sine wave in tells of period, wave shape, and peak-to-peak values.
How Nonsinusoidal Waveshapes Are FormedIt is interesting to note that a pure ac sine wave is comprised of one single frequency. Non-sinusoidal signal waveforms can be mathematically shown to be composed of a "funda-mental" frequency sine wave-plus a number of multiples of that frequency, called"harmonics." In other words, if the waveform is not sinusoidal, it indicates the presence ofharmonics. For example, the square wave is composed of a fundamental sine-wave fre-
quency and a large number of odd harmonic signals. The greater the number of odd har-monic signals that are added, or present, the closer to an ideal square wave the resultantcomplex waveform becomes (see Figure 11-21). Odd harmonics are those that represent
I(I, i
(a) Sine 0wave
iPer[od}
____ _._PÿP_!_ amplitude
(b) Square 0wave
,]1Il
P-iamplitude
Rectangular ÿ--ÿ
wave 0
FIGURE 11-20 Comparison ofsinusoidal and nonsinusoidalwaveforms in terms ofwaveshape and peak-to-peakvalues
IIII
7I
(c)t P-p amplitudeIt_A
(d) Sawtooth 0IIwaveIII
P-p amplitude
I

F
CHAPTER 11 . Bask AC Quantities 321
frequencies of 3 times, 5 times, 7 times, and so on, the fundamental frequency. For exam-ple, if the fundamental frequency is 100 Hz, then the third harmonic is 300 Hz, the fifth har-monic is 500 Hz, and so on.
Other nonsinusoidal waveforms may be created by the addition of even harmonic signals,or a mixture of even and odd harmonics, Figure 11-22. Even harmonics are even multiplesof the fundamental frequency involved. That is, 200 Hz is the second harmonic of a funda-mental frequency of 100 Hz; 400 Hz is the fourth harrnonic frequency, and so on.
Important Parameters for Nonsinusoidal Waveforms
As you have already seen, the period of a nonsinusoidal waveform is determined in thesame way the period is determined for a sine-wave signal; that is, the time it takes for onecomplete cycle of the signal, Figure 11-20. You have also seen that the peak-to-peak am-plitude of nonsinusoidal signals is determined in a similar fashion to the sine-wave signal.That is, from the top-most point of the waveform to the bottom-most point on the wave-form, Figure 11-20. Let's look at some more parameters of interest for these nonsinusoidalwaveforms. NOTE: Some formulas used for sine-wave values are not useful for nonsinu-soidal waves (i.e., 0.707 × VpK, etc.).
Pulse-Width, Duty Cycle, and Average ValuesNotice how the pulse width is identified in the series of cycles of rectangular waves shown inFigure 11-23. By comparing the pulse width with the time for one period, we can determine the
+25 --tSquare wave _2ÿ 77t" .............
Fundamental sine wave
Resultant waveform(fundamental + 3rd harmonic)
3rd harmonic
FIGURE 11-21 Graphicillustration of the forming of asquare wave
Resultant waveform(fundamental + 3rd + 5th harmonic)
5th harmonic
Triangular wave Smvtooth wave
FIGURE 11-22 Sample ofother nonsinusoidal waveforms
Pulse width(tw) •
(7")
Baseline
FIGURE 11-23 Pulsewidthand period of a pulse-typewaveform

322 PART III • Producing and Measuring Electrical Quantities
duty cycle. That is, the duty cycle equals the pulse width divided by the time for one peÿqod. Sinceduty cycle is generally expressed in percentage, we then take this decimal number times 100%to find the percentage duty cycle:
FORMULA 11-6 % duty cycle - tw (Pulse width) × 100%T (Time for 1 period)
[] EXAMPLE K the time for one period of this repetitive pulse signal is 20 gs and the pulsewidth is 4 gs, then the percentage duty cycle is:
% duty cycle 4 gs= -- x 100% = 0.2 x 100 = 20% duty cycle []20 gs
__ PItAGI(E Pr0BL[ÿ/i5 5
What is the duty cycle of a repetitive pulse waveform if T = 15 gs and the tw = 1 ÿts?
Finding Average Value for a Nonsinusoidal Waveform
In a number of situations in electronic circuits, these nonsinusoidal waveforms are not sym-metrically balanced above and below the zero reference line. Many times a dc component ispurposely added to "offset" the waveform, for operational purposes. To find the averagevalue of voltage (Vavg) of such waveforms, it is necessary to understand where the "baseline"of the waveform is considered to be, and be able to determine the duty cycle and amplitudeof the signal. The basic formula for finding V,ÿg is:
FORMULA 11-7 V, vg = Baseline value + (duty cycle x p-p amplitude)
[] EXAMPLES In Figure 11-24a, you can see that the baseline has been defined as beingat the 0 V level. Also, you can observe that the peak-to-peak amplitude of the waveform is 5volts. The duty cycle can be calculated as being 0.1 (or 10%). Thus,
Vavg=0+(0.1×5)=0+0,5=0.5V
In Figure 11-24b, the conditions, are changed so that the baseline is now at +2 V. What hap-pens to Vaÿg in this case?
Vavg = 2 + (0.1× 5) = 2, + (0.1 × 5) = 2 + 0.5 = 2.5 V []
__. PI1/ÿ(II(E PR0[ILEblS 6
1. Refer to Figure 11-24c and determine the Vavg for these conditions.
2. What would Vaÿg be if the waveform were symmetrical above and below the referencepoint (i.e., if the baseline were -3 V, in this case)?
Later in your studies, you will be studying more details about pulse-type signals. Topicssuch as waveshaping and the waveform characteristics of ramp, slope, and so on will be stud-ied at the time you can apply them to circuits you are studying. At this time, we simplywanted to introduce you to the fact that there are ac signals other than sine waves, and fa-miliarize you with some of their basic characteristics.

rCHAPTER 11 . Basic AC Quantities 323
....
+0.5 V ...........
OV ÿ---- 10 ms -'---ÿ Baseline
(a)
_ql+_
+2.5 v -&r_d--}+2vI ', iov{ , ,
lores
--- Baseline
(b)
ms+6V _ÿ
OVI,
Baseline30 ms ÿ
(c)
FIGURE 11-24 Finding V.vg for a rectangular waveform
I .....
Summary• Alternating current (ac) varies continually in magnitude
and periodically reverses in direction (polarity).
° Whereas ac is bidirectional, dc is unidirectional. Also, acalternates in polarity, but dc has only one polarity. Further-more, ac can be transformed or stepped up or down viatransformer action, whereas dc cannot.
o The sine wave is Mated to angular motionin degrees, and anygiven point's value throughout the sine wave Mates to thetrigonometric sine function. Maximum values occur at 90°and 270° @90°) points of the sine wave. Zero values occur at0°, 180°, and 360° points of each cycle (assuming the wave isstated at the zero level).
o A sine-wave voltage is generated by relative motion be-tween conductor(s) and a magnetic field, assuming theconductor(s) links the flux lines via a rotating motion. The
ac generator output is typically delivered to the load viaslip rings and brushes.
o Quantities having magnitude and direction are frequently rep-resented by lines or an'ows called vectors. A vector's lengthand relative direction illustrate the quantity's value and angle.
• When representing angles relative to ac quantities, the zeroreference point is horizontal and to the right. Angles in-crease positively from that reference plane in a counter-clockwise (CCW) direction.
• When representing angles relative to the coordinate sys-tem; angles between 0° and 90° are in quadrant 1; anglesbetween 90° and 180° are in quadrant 2; angles between180° and 270° are in quadrant 3; and angles between 270°and 360° are in quadrant 4. These positive angles applywith CCW rotation of the phasor.

324 PART III • Producing and Measuring Electrical Quantities
• A cycle represents one complete set of recurring events orvalues. In ac, the completion of a positive alternation (halfcycle) and a negative alternation (or vice versa) completesa cycle.
• A period is the time it takes for one cycle. It is calculaiedby the formula T = 1If
• Frequency is the number of cycles per second, and Hertz(Hz) indicates cycles per second. Frequency is calculatedusing the formula f= l/T, if the time for one cycle (period)
' is known. Frequency and period are inversely related.
• Referring to a sine wave, rate of change indicates howmuch amplitude changes for a given amount of time. Thisrate of change is maximum near the zero level points andminimum near the maximum level points.
• In purely resistive ac circuits, voltage and current are inphase with each other.
• When ac quantities are out of phase, they do not reach thesame relative levels at the same time. A generalization isthat the waveform that reaches maximum positive levelfirst is leading the other quantity in phase.
• • Phase angle is the difference in angle (time difference) be-
tween two equal-frequency sine waves. If sine waves A andB are in phase, there is zero phase angle between them. Ifsine wave A reaches maximum positive level 1/4 cycle be-fore sine wave B, sine wave A is leading sine wave B by90°. Thus, the two signals are out of phase by that amount.If sine wave A reaches maximum positive level 1/8 cyclebefore sine wave B, sine wave A is leading sine wave B inphase by 45°.
• Average value of ac voltage or current is the average levelunder one altemation's waveform. Average value is equal
to 0.637 times peak value. (NOTE: Average value of asymmetrical waveform over a complete cycle equals zero.)
• Effective value (rms) of ac voltage or current is the valuethat causes the same heating effect as an equal value of dcvoltage or current. Effective value is computed as 0.707times peak value, or 0.3535 times peak-to-peak value, or1.11 times average value.
Peak value (maximum positive or negative value) of acvoltage or current is 1.414 times the effective value. It canalso be calculated as being half the peak-to-peak value.
• Peak-to-peak value is the total difference in voltage or cur-rent between the positive and negative maximum values.Peak-to-peak value is calculated as two times peak value,or 2.828 times effective value.
• In ac resistive circuits, average power is calculated with theeffective values (rms) of I and V.
J
• Several nonsinusoidal waveforms are the square wave, rec-
tangular wave, and sawtooth wave.
• The period, frequency, and peak-to-peak amplitude valuesof nonsinusoidal waveforms (square, triangular, rectangu-lar, and sawtooth) are determined in the same fashion asthe period, frequency, and peak-to-peak amplitude of a• sine wave are identified.
• The duty cycle of repetitive pulse-type waveforms is foundby dividing the pulse width by the time for one period. Thisis typically multiplied by 100 to find the percentage dutycycle.
• The average voltage value (Vavg) of pulse-type waveformsis determined by adding the baseline voltage to the productof the duty cycle and the peak-to-peak amplitude of thewaveform.

CHAPTER 1 ! * Basic AC guantitles 325
Formulas and Sample Calculator Sequences
1Formula 11-1 T(s) = --(To find the f(Hz)period of 1 cycle frequency in hertz,for a givenfrequency)
1Formula 11-2 f (Hz) = --(To find the T(s)frequency for asignal havhÿg aspeeified periodtime)
time for one cycle in seconds, [!ÿ
Formula 11-3(To find effectivevalue when peakvalue is lowwn)
Effective value (rms) = 0.707 x Peak value
0.707, [-x-I, peak value of voltage, []
Formula 11--4(To find average valuefor one-half cyclewhen peak vahte isknown)
Formula 11-6(To find percentageduty cycle of a pulse-type wavefornO
Formula 11-7(To find the averagevoltage value for apulse-type waveform)
Formula 11-5(To find instantaneousvoltage value whenV peak is known)
Average value = 0.637 x Peak value
0.637, [ÿ], peak value of voltage, []
v = Vp sin 0
Vpeak value, [k-], angle value, [SIN], []
% duty cycle = tÿ (Pulse width) x 100%T (Time for 1 period)
pulse-width time value, [ÿ, time for one cycle,/ff], 100, []
V,ÿg = Baseline value + (duty cycle x p-p amplitude)
baseline value, [ÿ, [ÿ, duty cycle decimal value, N], p-p value, [S], []
EXCEL AUTOMATED FORMULAS
calculations of formulas.

326 PART III • Producing agd Measuring Electrical Quantities
Using ExcelBasic AC Quantities Formulas(Excel file reference: FOB l_01.xls)
DON'T FORGET! It is not neces-smy to retype formulas once theyare entered on the worksheet! Justinput new parameters data for eachnew problem using that fornmla, asneeded.
• Use the Formula 11-2 spread-sheet sample and solve forfrequency if the time for oneperiod of the signal is 0.0025seconds.
s o -f<
]jJArlal . lO.JZÿ III jÿ=-ÿ=---ÿ_-JÿJÿ % , .*oÿ+.'ÿ]%ÿ----ÿJi-<P-+-A*! :'
3 fl --IA B C J D E I F G Ii I 1 t ,
__I Eozm.,.ÿ:/.-r(s):y++ÿ+zL ........... ! ................ i ............ ! .......... ÿ ....... ! ............ ! +.2 [Using the parameter values shown in the Example under Formula 11-1 in text)! + ' +-- [(Bz) T(see) .<==Column headings to use i ! f _ t j
-+ __IForm@a !1zz ((!z) =Jfl_ (s) ......... ! .......... [ ........ + .................... +
7 ÿJsinglhpparpmetervalu+esebpwnin+E++amplelunde[formulall'+))te+xt)_ ! ...... ..... ! +
g 0.00131 :: 100001<=:=Formu a in Cell Bg is: =1//x9 ! +
12_2 Using the p_aLa+m._eter values shown in Example under Formula 11-3 in text) i13 0.707 Pk (V) :rms IV) iÿColumn headingsto use ! ':
.......................... .......... 0.70-7-:-ÿ::::+-Fo r m ul-- a in C aÿl+Ci 4 in--a-At 4ÿ,iÿiÿ4qÿ- ........ ! --14 0.707[ 1
1ÿ :er,n+__ula 11-:5: e = Vp s!+n. O ....... : I i *...... L ...... ,'+ ........ _+ ..... i ...... i ....17 +,amusing conditions: maximun voltage = 141+ Angle = 30 degrees; Find instantaneous voltage value: i1--8 qpk 'Angle Sin of angle V instant. '4/=ÿ Column headings to use i
19 141[ 381 0.5ÿ 70.5i ÿ Formula in Cell D19 is: =A19"019 i
Iÿ k' 8heetl Sheet2 Sheet.3 -JZI ...... ! N
' Ready ................... J ÿ1ÿ ÿ : ..... - .... It:,ouble ÿiÿto openl' m ..... + ............... ÿ ........ t++ms;ÿ]lI + + [] m-+ ,, Jlm,.,,=,,oo,,+-,,+,- +++'oa°"Wo" I ,+,AM
j ............... +'[
Using ExcelBask AC Quantities Formulas(Ex¢el file refereme: FOB 1_01.xls)
DON'T FORGET! It is not neces-smy to retype forntulas once theyare entered on the worksheet] Justh+put new parameters data for eachnew problem using that formula, asneeded.
• Use the Formula 11-5 spread-sheet sample and solve for theinstantaneous voltage valueassuming conditions of 200 Vpeak and an angle of 40°.
[jim,_3 Bÿ+ ÿ_d,t v_ÿw ÿ.rÿt G,,,+t ÿooÿ:ÿ, ÿoumÿ w_mow Ue+; - '
r + + O m ÿ ÿ + .:: . ÿ " A "
A I e I c I O I E ! F I o ! HÿFormulall-5: U=Vpslnÿ ......... ÿ ........ j ...... , ....... i_ I :ÿ
conditione:maximunvoltage=141;Angle=30degrees Fi_ndin_sta_ntanaou_s'm.]tagevalu.e: _ ; ............
Angle S n of angle V l_nÿa.n_t+- ,<ÿ Colu_rnn headings_to use ............141J 3Oi 0.51 70.5i <== Formula in Cell D19 ia: =A19"C19 +
-ermula114h %dutycycle=t,v(pulsewidthllT(lhneforlperied) x10Om + i ' .... + l
(Using the parameter values shown in the Example under Figure 11-23 in text) i ! i i i J........... , IT for 1 perL(us)_+ '% du_ÿ CYcle .... __<ÿ__C ° !u m_n._ h__e_a_ din g s ÿ?+ ÿ _e_ ..... J___ ---ÿ
,4i 20+ 20+ <;=ÿFormula in Cell 025 is: =A25/B25"100 '
Formula 11-7: V=vs = Baseline value + (duly cycle x p-p am )Utude) i i :.
(Using parameter values shown in figure 11-24(@ in text) ,, .............................................+ ............. . ............
Baseline value duly cyF!e_ . 'p-p 9mplitude .... iV avg ...... ÿ Column headings t£use ........... 2 .....01 0.11 51 O.5)f,:=ÿFormula in Cell [330 is: =A30ÿB30*C30)

CHAPTER 11 . Basic AC Quantities 327
Review Questions1. AC generator output is delivered via:
a. brushes alone.
b. commutator segments and brushes.
e. magnetic linkage.
d. slip rings and brushes.
2. The zero reference point often used to graphically repre-sent angles for ac quantities on the coordinate system is:
a. vertical -90° upward from the horizontal plane.
b. horizontal, to the right.
e. horizontal, to the left.
d. vertical -90° downward from the horizontal plane.
3. Angles represented on the coordinate system increase pos-itively from the zero reference point in a:
a. clockwise direction.
b. counterclockwise direction.
e. either CW or CCW direction.
4. When using the coordinate system, angles between 90°and 180° are represented:
a. in quadrant 1.
b. in quadrant 2.
e. in quadrant 3.
d. in quadrant 4.
5. In an ac sine wave, an alternation represents:
a. a full cycle.
b. a half cycle.
e. a quarter cycle.
d. two cycles.
6. A period is the time it takes for:
a. one-fourth cycle.
b. one-half cycle.
e. one cycle.
d. none of the above.
7. The formula for calculating a period is:
a. T= ÿAIf.
b.T=¼1fc. T= l/f
d. none of the above.
8. Frequency may be defined as:
a. the number of cycles per second, and is expressed inradians.
b. the number of cycles per second, and is expressed inHertz.
c. the number of cycles per second, and is expressedin CPS.
d. none of the above.
9. As frequency is increased:
a. period increases.
19. period decreases.
c. period does not change.
d. none of the above.
10. The rate of change of an ac sinusoidal waveform is max-imum at:
a. waveform maximum points.
b. waveform median points.
c. waveform zero points.
d. none of the above,
11. By convention, when two graphically represented sine-wave waveforms are not in phase:
a. the waveform that reaches maximum positive levelfirst is considered leading.
b. the waveform that reaches maximum negative levelfirst is considered leading.
c. the waveform that reaches the zero point first is con-sidered leading.
d. none of the above.
12. Phase angle between two equal-frequency sine wavesrepresents the:
a. difference in amplitude.
b. difference in time.
c. difference in both amplitude and time.
d. none of the above.
13. The average value of ac voltage or current is its averagelevel over:
a. one complete cycle.
b. two complete cycles.
c. one alternation.
d. two alternations.

328 PART III ,, Producing and Mensuring Electrical Quantities
14. The effective value of ac voltage or current may be cal-culated as:
a. 0.707 x peak value.
b. 0.3535 × peak-to-peak value.
e. both of the above.
d. none of the above.
15. Peak-to-peak value represents the total difference be-tween:
a. zero and positive peak value.
b. zero and negative peak value.
e. positive peak to negative peak value.
d. both (a) and (b) above.16. Explain the terms fundamental and harmonic.
17. Define the termpet4odic wave.
18. Wavelength of a signal is affected by:
a. the speed the signal travels and the fi'equency of thesignal.•
b. the speed the signal travels and the amplitude of thesignal.
c. the time of day the signal is propagated and the signalstrength.
d. none of the above.
19. A square wave is composed of:a. a fundamental sine wave and a great number of even
harmonics.
b. a fundamental sine wave and a great number of oddharmonics.
c. a distorted sine wave.
d. none of the above.
20. The period, frequency, and peak-to-peak amplitude val-ues of square waves, triangular waves, and rectangularwaveforms can be determined:
a. in a slightly different manner than for regular sinewaves.
b. in a completely different manner than for regular sinewaves.
c. in the same manner as for regular sine waves.
d. cannot be determined.
Problems1. What is the period of a 2-kHz voltage?
2. What is the frequency of an ac having a period of 0.2 gs?
3. How much time does one alternation of 60-Hz ac require?
4. The peak value of a sine wave is 169.73 volts. What isthe rms value?
5. What is the frequency of a signal having one-fourth theperiod of a signal whose T equals 0.01 seconds?
6. What is the peak-to-peak voltage across a 10-kÿ2 resistorthat dissipates 50 mW?
77 If the rms value of an ac voltage doubles, the peak-to-peak value must __
8. The ac effective voltage across a given resistor doubles.What happens to the power dissipated by the resistor?
9. The period of an ac signal triples. What must have hap-pened to the frequency of the signal?
10. The rms value of a given ac voltage is 75 volts. What isthe peak value? What is the peak-to-peak value?
11. What time is needed for one alternation of a 500-Hz acsignal?
12. One alternation of a signal takes 500 gs. What is its fre-quency? What is the time of two periods? (Use a calcu-lator to find answers.)
13. Draw the diagram of a three-resistor series-pai'allel cir-cuit having a 10-kO resistor (labeled R1) in series withthe source, and two 100-k£2 resistors (labeled R2 and R3)in parallel with each other and in series with Rv Assumea 120-V ac source. Calculate the following parametersand appropriately label them on the diagram.
a. VR1
b° IRI
C. Pal
d. lR2
e. VR3
f. 0between V applied and I total
14. What is the wavelength of a radio signal with a frequencyof 1 MHz?
15. If the frequency of a signal is lowered to one-third itsoriginal frequency, what happens to its wavelength? Bespecific.

CHAPTER i 1 . Basic AC Quantities 329
Analysis Questions1. What are two differences between ac and dc?
2. Draw an illustration showing one cycle of a 10-V (rms),1-MHz ac signal. Identify and appropriately label thepositive alternation, the period, the peak value, the peak-to-peak value, the effective value, and points on the sinewave representing angles of 30°, 90°, and 215°.
3. The rms value of a given ac voltage is 100 V. What is thepeak value? What is the peak-to-peak value?
Refer to Figure 11-25 and answer questions 4 to 8.
4. Which waveform illustrates the signal with the longestperiod?
5. What is the peak-to-peak voltage value of waveform B?
6. What is the effective value of voltage waveform A?
7. If the period of waveformA equals 0.002 ms, what is thefrequency represented by waveform B ?
8. If the peak-to-peak value of waveform A changes to60 V, what is the new effective voltage value?
9. a. Draw a graphic illustration of one and one-half cyclesof a rectangular wave. Assume the amplitude is 10 V,
the baseline is +3 V, the period is 25 ms, and the dutycycle is 25%. Label all appropriate parameters on thedrawing.
b. Determine the Vavg for the signal described in ques-tion 9a.
10. Draw one cycle of a sine wave and a cosine wave on thesame "baseline." Assume each maximum value is 10
units. Appropriately label the diagram to show the fol-lowing information:a. Angles of 0°, 45°, 90°, 135°, 180°, 225°, 270°, 315°,
and 360°, marked on the x-axis.
b. Amplitude values of the sine wave at 45° and 90°, re-spectively. (Use a calculator to determine values.)
e. Amplitude values of the cosine wave at 0°, 45°, and90°, respectively. (Use a calculator to determinevalues.)
d. Indicate which wave is leading in phase, and byhow much.
A
25 V (rms)
11I
< Time ÿ I
B
FIGURE 11-25
\