Embed Size (px)
Citation preview

CONS1011-11 NASA TM-73766
N78-20021BASELINE TESTS OF THEI NASA-TN-73766) iVOLKSWAGEN TRANSPORTER ELECTRIC DELIVERY VAN
(NASA) 56 p HC AO4NF A01 CSCL 13F Unclas
G385 08665
BASELINE TESTS OF THE VOLKSWAGEN TRANSPORTER ELECTRIC DELIVERY VAN
Richard F Soltis Edward McBrien Jfin M Bozek and Francis Gourash National Aeronautics and Space Administration Lewis Research Center Cleveland Ohio 44135
January 1978
Prepared for
DEPARTMENT OF ENERGY Division of Transportation Energy Conservation Under Interagency Agreement EC-77-A-31-1011
httpsntrsnasagovsearchjspR=19780012078 2018-06-23T231126+0000Z
NOTICE
This report was prepared to docunent work sponsored by
the United States Government Neither the United States
nor its agent the United States Energy Research and
Development Administration nor any Federal employees
nor any of their contractors subcontractors or their
employees makes any warranty express or implied ox
assumes any legal liability or responsibility for the
accuracy completeness or usefulness of any informashy
tion apparatus product or process disclosed or
represents that its use would not infringe privately
owned rights
I Report No 2 Government Accession No 3 Recipients Catalog No
NASA TM-73766 4 Title and Subtitle 5 Report Date
BASELINE TESTS OF THE VOLKSWAGEN TRANSPORTER January 1978 ELECTRIC DELIVERY VAN 6 Performing Organization Code
7 Author(s) 8 Performing Organization Report No
Richard F Soltis Edward McBrien John M Bozek E-9506 and Francis Gourash 10 Work Unit No
9 Performing Organization Name and Address
National Aeronautics and Space Administration 11 Contract or Grant No
Lewis Research Center Cleveland Ohio 44135 13 Type of Report and Period Covered
12 Sponsoring Agency Name and Address Technical Memorandum Department of Energy Division of Transportation Energy Conservation 14 Sponsoring Agency e Report No Washmgton DC 20545 CONS101l-11
15 SUpplementary Notes
Prepared under Interagency Agreement EC-77-A-31-1011
16 Abstract
The Volkswagen Transporter an electric delivery van manufactured by Volkswagen Werk AG of West Germany was tested at the Transportation Research Center Test Track in East Liberty Ohio between May 10 and June 23 1977 The tests are part of an Energy Research and Develshyopment Admimstration (ERDA) project to characterize the state-of-the-art of electric vehicles The Volkswagen vehicle performance test results are presented in this report The Volkswagen Transporter is a standard Volkswagen van that has been converted to an electric vehicle It is powered by a 144-volt traction battery A direct-current (DC) chopper controller actuated by a conventional accelerator pedal regulates the voltage or power applied to the 16-kilowatt (21-hp) motor The braking system uses conventional hydraulic braking in combination with an
electric regenerative braking system
17 Key Words (Suggested by Author(s)) 18 Distribution Statement
Electric vehicle Unclassified - unlimited
Car STAR Category 85 Test and evaluation DOE Category UC-96 Battery
19 Security Classif (of this report) 20 Security Classif (of this page) 21 No of Pages 22 Price
Unclassified Unclassified
For sale by the National Technical Information Service Springfield Virginia 22161
The Electric and Hybrid Vehicle Program
was conducted under the guidance of the
then Energy Research and Development
Administration (ERDA) now part of the
Department of Energy
BASELINE TESTS OF THE VOLKSWAGEN TRANSPORTER
ELECTRIC DELIVERY VAN
Richard F Soltis Edward McBrien John M Bozek and Francis Gourash
Lewis Research Center
SUMMARY
The Volkswagen Transporter an electric delivery van manufactured by Volkswagen Werk AG of West Germany was tested at the Transportation Research Center Test Track in East Liberty Ohio between May 10 and June 23 1977 The tests are part of an Energy Research and Development Administration (ERDA) pro3ect to characterize the state-of-the-art of electric vehicles The Volkswagen vehicle performance test results are presented in this report
The Volkswagen Transporter is a standard Volkswagen van that has been converted to an electric vehicle It is powered by a 144-volt traction battery A direct-current (DC) chopper controller actuated by a conventional accelerator pedal regulates the voltage or power applied to the 16-kilowatt (21-hp) motor The braking system uses conventional hydraulic braking in combination with an electric regenerative braking system
All tests were run at the gross vehicle weight of 3075 kilograms (6780 lbm) The results of the tests are as follows
Test condition (constant speed or
Type of test
driving schedule) Range Road Road energy Energy consumption
kmh mph km mile power kW MJkm kWhmile MJkm kWhmile
40 25 1175 730 75 067 030 123 055
56 35 870 541 115 74 33 145 65
69 43 632 392 150 80 36 166 74
Ba 715 445 ---- 212 94
Bb 678 421 ---- 200 90 Ca 475 295 - 233 104
Cb 472 293 ---- ---- 233 104
aWith regenerative braking
bwithout regenerative braking
The Volkswagen Transporter was able to accelerate from 0 to 32 kilometers per hour (0 to 20 mph) in 7 seconds and from 0 to 48 kilometers per hour (0 to 30 mph) in 14 seconds The gradeability limit was 14 percent
Measurements were made to assess the performance of the vehicle components The performance was as follows
Charger efficiency over a complete 78 to 87 charge cycle percent
Battery efficiency with 10 percent 77 overcharge percent
INTRODUCTION
The vehicle tests and the data presented in this report are in support of Public Law 94-413 enacted by Congress on September 17 1976 The law requires the Energy Research and Development Administration (ERDA) to develop data characterizing the state-of-the-art of electric and hybrid vehicles The data so developed are to serve as a baseline (1) to compare improvements in electric and hybrid vehicle technologies (2) to assist in establishing performance standards for electric and hybrid vehicles and (3) to help guide future research and development activities
The National Aeronautics and Space Administration (NASA) under the direction of the Electric and Hybrid Research Development and Demonstration Office of the Division of Transportation Energy Conservation of ERDA has conducted track tests of electric vehicles to measure their performance characteristics and vehicle component efficiencies The tests were conducted according to ERDA Electric and Hybrid Vehicle Test and Evaluation Procedure described in appendix E of reference 1 This procedure is based on the Society of Automotive Engineers (SAE) J227a procedure (ref 2) Seventeen electric vehicles have been tested under this phase of the program 12 by NASA 4 by ERADCOM and 1 by the Canadian government
The assistance and cooperation of Jens-Peter Altendorf of Volkswagen Werk AG and Peter Breuer of Siemens AG in conducting these tests are greatly appreciated The Energy Research and Development Administration provided funding support and guidance during this project
US customary units were used in the collection and reduction of data The units were converted to the International System of Units for presentation in this report US customary units are presented in parentheses The parameters symbols units and unit abbreviations used
2
in this report are listed here for the convenience of the reader
Parameter Symbol SI units U S customary units
Unit Abbrevia- Unit Abbreviashytion tion
Acceleration
Area
a
---
meter per second squared
square meter
ms2
m 2
mile per hour per second square foot square inch
mphs ft
2 in
2
Energy --- mega]oule MJ kilowatt hour kwh Energy consumption E megajoule per kilometer NJkm kilowatt hour per mile kWhmile Energy economy --- megajoule per kilometer NJkm kilowatt hour per mile kWhile Force P newton N pound force lbf
Integrated Current --- ampere hour Ah ampere hour Ah
Length --- meter m inch foot mile in ft Mass weight W kilogram kg pound mass lhm
Power P kilowatt kW horsepower hp Pressure --- klopascal kPa pound per square inch psi Range --- kilometer km mile ---
Specific energy megajoule per kilogram Nkg watt hour per pound Whibm
Specific power --- kilowatt per kilogram kmkg kilowatt per pound kWibm Speed
Volume V ---
kilometer per hour
cubic meter knh m 3
mile per hour cubic inch cubic foot
mph in
3 ft
3
OBJECTIVES
The ob3ectives of the tests were to measure the maximum speed range at constant speed range over stop-and-go driving schedules maximum acceleration gradeability gradeability limit road energy consumption road power indicated energy consumption braking capability battery charger efficiency battery characteristics controller efficiency and motor efficiency of the Volkswagen Transporter electric delivery van
TEST VEHICLE DESCRIPTION
The Volkswagen Transporter is a German-built electric delivery van that can carry three passengers and a payload of 800 kilograms (1763 ibm) The vehicle is shown in figure 1 and described in appendix A The vehicle is powered by a separately excited shunt-wound DC motor that was specially developed by Siemens AG of West Germany A DC chopper controller is used to control power to the electric motor The motor is bolted directly to the transaxle of the vehicle eliminating the need for a clutch A forward-or-reverse switch to control the direction of the vehicle is located on the dashboard The lead-acid traction battery is made up of 24 VARTA 6-volt modules connected in series to form a 144-volt battery This battery is located
3 ORGINAL -PAGE IS
OFPOO QUALITY
under the cargo area It is removed by opening the side door on the passenger side of the vehicle and sliding the battery pack out with a special manually operated fixture (fig 2) In addition to standard hydraulic brakes the vehicle is equipped with an electric regenerative braking system which may be disconnected by a switch on the dashboard When the brake pedal is depressed the regenerative braking is initiated first followed by the hydraulic braking Regenerative braking is effective down to zero speed An off-board charger manufactured by VARTA 3atterie AG charges the traction battery It is controlled by an external timer The charger is a 380-volt three-phase 50-hertz alternating-current (AC) charger It fully recharges the vehicle batteries in approximately 12 hours A separate 12-volt battery powers the vehicles auxiliary electrical system and the regulators electronics This battery is continuously charged by the 144-volt battery with a 144-volt to 12-volt DC-to-DC converter
INSTRUMENTATION
Measurements taken during the performance testing of the Volkswagen Transporter included vehicle speed vehicle distance battery voltage battery current and ampere-hours from the traction battery Battery voltage and current were recorded on one strip-chart recorder vehicle speed and distance were recorded on another The recorders were two-channel Honeywell Electronik 195 recorders The battery current was measured with a 250-ampere 60-millivolt shunt (fig 3) This same shunt was also used to measure the integrated battery current for the battery pack An on-board current integrator Curtiss Model SHR-C3 was used for this measurement Its output was recorded manually after each test
The strip-chart recorders and the integrator were operated from a Tripp Lite DC-to-AC power inverter The inverter was powered by a separate 12-volt battery that was fully charged before each test
A Nucleus Corporation Model NC-7 precision speedometer (fifth wheel) was used to measure the vehicle speed and distance traveled Auxiliary equipment used with the fifth wheel included -a Model ERP-X1 electronic pulser for distance measurement a Model NC-PTE pulse totalizer a Model ESSE expanded-scale speedometer and a programmable digital attenuator The fifth-wheel assembly was calibrated for every constant-speed range test by using an electronic pulse generator to simulate rotation of the fifth wheel The accuracy of the distance and velocity readings were within +10 percent of the readings
4
The strip-chart recorders and current integrators were calibrated every two or three days For these calibrations a Hewlett-Packard Model 6920B meter calibrator was used This meter has an accuracy of 02 percent of reading and a usable voltage range of 001 to 1000 volts
After the overall performance testing of the Volkswagen Transporter was completed the strip-chart recorders were removed and a 14-channel frequency-modulated (FM) magnetic tape recorder was installed within the vehicle in order to obtain additional component data These tests and the data and results obtained will be described in a later report
The current and voltage into the battery and the energy into the battery charger were measured while the battery was being recharged after each test The current and voltage were measured on a Honeywell strip-chart recorder The current measurement used a 500-ampere-per-100-millivolt current shunt Power into the charger was initially measured by an Ohio Semitronics Inc Model WM-365 wattmeter When an industrial kilowatt-hour meter (for 380 V) was obtained it was substituted for the wattmeter The kilowatt-hour meter was a General Electric high-voltage V-65-S meter that was capable of handling 480-volt 60-cycle three-phase current
For the charger efficiency tests the Model WM-365A wattmeter was used in conjunction with Hall-effect current sensors manufactured by Ohio Semitronics Inc
TEST PROCEDURES
The tests described in this report were conducted at the Transportation Research Center Test Track a three-lane 12-kilometer (75-mile) track located in East Liberty Ohio A description of the track is given in appendix B When the vehicle was delivered to the test track the pretest checks described in appendix C were conducted The first test was a formal shakedown to familiarize the driver with the operating characteristics of the vehicle to check out all instrumentation systems and to determine the vehicles maximum speed (appendix C) All tests were run in accordance with ERDA Electric and Hybrid Vehicle Test And Evaluation Procedure ERDA-EHV-TEP (appendix E of ref 1) at the gross weight of the vehicle 3075 kilograms (6780 lbm)
Range Tests at Constant Speed
The vehicle speed for the highest constant-speed range test was determined during checkout tests of the vehicle It was specified as 95 percent of the minimum speed the
5
vehicle could maintain on the test track when it was traveling at full power This speed was 69 kilometers per hour (43 mph) for the Volkswagen Transporter
Range tests were run at constant speeds of 40 56 and 69 kilometers per hour (25 35 and 43 mph) The speed was held constant within +16 kilometers per hour (I mph) and the test was terminated when the vehicle could no longer maintain 95 percent of the test speed The range tests were run at least twice at all speeds
Range Tests under Driving Schedules
Both the 32-kilometer-per-hour (20-mph) schedule B stop-and-go driving cycle and the 48-kilometer-per-hour (30-mph) schedule C stop-and-go driving cycle shown in figure 4 were run with this vehicle A complete description of cycle tests is given in appendix E of reference 1 A special instrument called a cycle timer was developed at the Lewis Research Center to assist in accurately running these tests Details of the cycle timer are given in appendix C The cycle tests were terminated when the vehicle was unable to accelerate rapidly enough to reach the test speed in the prescribed time
Acceleration and Coast-Down Tests
The maximum acceleration of the vehicle was measured on a level road with the battery fully charged and 40 and 80 percent discharged Four runs two in each direction were conducted at each of these three states of charge Depth of discharge was determined from the number of ampere-hours removed from the batteries Coast-down data were taken with the drive switch in neutral after the acceleration tests and with fully charged batteries in order to start the coast-down runs from the maximum attainable vehicle speed
Braking Tests
Braking tests on the vehicle were conducted
(1) To determine the minimum stopping dkstance in a straight-line emergency stop
(2) To determine the controllability of the vehicle while braking in a turn on both wet and dry pavement
(3) To determine the brake recovery after the venicle was driven through 015 meter (6 in) of water at 8 kilometers per hour (5 mph) for 2 minutes
6
(4) To determine the parking brake effectiveness on an incline
Instrumentation used during the braking test included a fifth wheel programmed to determine stopping distance a brake pedal force transducer and a decelerometer A complete description of the braking tests is given in the discussion of test results and in appendix E of reference 1
Tractive Force Tests
The maximum grade climbing capability of the test vehicle was determined from tractive force tests by towing a second vehicle The driver of the towed vehicle by applying the footbrake maintained a speed of about 3 kilometers per hour (2 mph) while the test vehicle was being driven with a wide-open throttle The force was measured by a 13 000-newton (3000-lbf) load cell attached to the tow chain between the vehicles The test was run with the batteries fully charged and 40 and 80 percent discharged
Charger Efficiency Tests
Two methods were used to determine charger efficiency as a function of charge time In the first method the GE V-65-S industrial kilowatt-hour meter was used to measure input power to the charger by counting rotations of the disk and applying the meter manufacturers calibration factor The charger output power was determined by multiplying the average value of current by the average value of voltage Industrial kilowatt-hour meters are calibrated for sinusoidal waves only The error in measuring input power depends on the wave shape and may be as high as 5 percent The method of determining output power is correct only when either the voltage or the current is a constant during each charging pulse The battery voltage does change during each charging pulse which introduces a small error The current shunts used to measure current are inaccurate for pulsing current The error depends on frequency and wave shape and may exceed 10 percent
In the other method used for determining charger efficiency a 50-kilowatt power meter was used on both the input and output of the charger and a Hall-effect current probe was used for current measurements To minimize errors the same meter and current probe were used for both the input measurement and the output measurement The average power measured was about 6 percent of full scale The influence of these inaccuracies on the determination of charger efficiency is discussed in the component section of this report
7
TEST RESULTS
Range
The data collected from all the range tests are summarized in table I Shown in the table are the test date the type of test the environmental conditions the range test results the ampere-hours into and out of the battery the energy into the charger and the instrument used in its measurement These data were used to determine vehicle range battery efficiency and energy consumption
The maximum speed of the vehicle was measured during the checkout tests It is defined as the average speed that could be maintained on the track under full power The measured maximum speed was 74 kilometers per hour (46 mph) for this vehicle This differs from the maximum speed used in the range tests
Four constant-speed range tests were run at 40 kilometers per hour (25 mph) two at 56 kilometers per hour (35 mph) and three at 69 kilometers per hour (43 mph) In addition four schedule B range tests and four schedule C range tests were run two each with regenerative braking and two each without regenerative braking These test results are shown in table I The constant-speed range test results are plotted in figure 5 Most of the range test results were within +5 percent of the mean
Maximum Acceleration
The maximum acceleration of the vehicle was determined with the batteries fully charged and 40 and 80 percent discharged Vehicle speed as a function of time is shown in figure 6 and table II The average acceleration a was calculated for the time period tn- to tn wherenthe vehicle speed increased from Vn_ 1 to Vn from the equation
vn -Vn_ - n Vn-1
n tn -tn 1
and the average speed of the vehicle V from the equation
V +2Vn-i
Maximum acceleration as a function of speed is shown in figure 7 and table III
8
Gradeability
The maximum specific grade in percent that a vehicle can climb at an average vehicle speed V was determined from maximum acceleration tests by using the equations
G = 100 tan (sin 01026 a ) for V in kmh
in SI units
or
G = 100 tan (sin-100455 a n) for V in mph
in US customary units
where an is average acceleration in meters per second squared (mphsec) The maximum grade the Volkswagen Transporter can negotiate as a function of speed is shown in figure 8 and table IV
Gradeability Limit
Gradeability limit is defined by the SAE J227a procedure as the maximum grade on which the vehicle can just move forward The limit was determined by measuring the tractive force with a load cell while towing a second vehicle at about 3 kilometers per hour (2 mph) It was calculated from the equations
s i nGradeability limit in percent = 100 tan
in SI units
or
-Gradeability limit in percent = 100 tan (sIn 1 )
in US customary units
9
where
P tractive force N (flbf)
W gross vehicle weight kg (Ibm)
The Volkswagen Transporter was capable of exerting the following tractive forces for three states of battery discharge
(1) Fully charged 4270 newtons (960 lbf)
(2) 40 Percent discharged 3870 newtons (870 lbf)
(3) 80 Percent discharged 3470 newtons (780 lbf)
At a vehicle weight of 3075 kilograms (6780 ibm) the resulting gradeability limits were
(1) Fully charged 143 percent
(2) 40 Percent discharged 129 percent
(3) 80 Percent discharged 116 percent
Road Energy Consumption
Road energy is a measure of the energy consumed per unit distance in overcoming the vehicles aerodynamic and rolling resistance plus the energy consumed in the differential drive shaft and the portion of the transmission rotating when in neutral It was obtained during coast-down tests when the differential was being driven by the wheels and thus may be different than the energy consumed when the differential is being driven by the motor
Road energy consumption En was calculated from the following equations
E 278xl0-4W Vn-1 n MJkmn tn - n -1
or
E 0x1-5W Vn-i - n E= 907x10 W V - kWhmile n t n - n-i
10
V
where
vehicle mass kg (ibm)
vehicle speed kmh (mph)
t time s
Vehicle coast-down tests were conducted both with and without the drive train (differential transmission and electric motor) connected to the wheels In normal operation the electric motor cannot be declutched (disconnected) from the wheels It was mechanically disconnected by disconnecting the drive shafts between the wheels and the differential The drive shafts were wired in place so they did not drag
With the drive shafts connectedr the vehicle was self-powered When they were disconnected it was necessary to tow the vehicle to speed before starting the coast-down tests
The coast-down data used to calculate road energy were averaged and plotted as vehicle deceleration versus vehicle speed in figure 9(a) with the drive shafts connected and in figure 9(b) with them disconnected Coast-down time increases significantly when the drive train is disconnected from the wheels
The results of the road energy calculations are shown in figure 10(a) and table V(a) for the vehicle with the drive train connected and in figure 10(a) and table V(b) with it disconnected
Road Power Requirements
The calculation of road power is analogous to the calculation of road energy It is a measure of the power needed to overcome vehicle aerodynamic and rolling resistance plus the power losses from the differential the drive shaft and a portion of the transmission The road power Pn required to propel a vehicle at various speeds is a-lso determined from the coast-down tests The following equations are used
V2 v 2
P 386xlO-W n- n kWn n nshy
ii
or
2 i -V2
V Pn= n608x1-5J W n-1 n hpn - tn-i
The results of road power calculations are shown in figure 11(a) and table VI(a) with the drive train connected to the wheels and in figure 11(b) and table VI(b) with it disconnected Both road energy and road power are significantly lower when the drive train is disconnected
Indicated Energy Consumption
The vehicle indicated energy consumption is defined as the energy required to recharge the battery after a test divided by the vehicle range achieved during the test where the energy is the input to the battery charger
Initially the indicated energy consumption was measured by using a wattmeter and integrating over the charge time Then when the [igh-voltage three-phase kilowatt-hour meter became available it was used to measure the energy input to the battery charger after each range test The results derived from both methods on the same tests were all within 3 percent Some overcharge of the battery was usually required in order to assure that all battery cells were fully charged and that the pack was equalized The reported energy usage may be higher than would be experienced with normal vehicle field operation Indicated energy consumption as a function of vehicle speed is presented in figure 12 for the constant-speed tests and in table VII for the constant-speed and driving cycle tests
Braking Capability
Simplified braking capability tests were conducted according to the procedure outlined in appendix E of reference 1 in order to provide a preliminary evaluation of the vehicles braking capabilities The procedure also includes tests for handling which at ERDAs direction were not conducted on this vehicle
Straight-line stops - Six straight-line stops from 48 kilometers per hour (30 mph) were made three from each direction Stopping distance varied from 225 meters (74 ft) to 265 meters (87 ft) Six stops were also made from 69 kilometers per hour (43 mph) again three from each
12
direction Stopping distances varied from 396 meters (130 ft) to 451 meters (148 ft)
Stops on a curve - Three stops were made going into a 03-g curve from 69 kilometers per hour (43 mph) on dry pavement turning right and three stops were made on the same curve turning left No difficulties were encountered in stopping within the 36-meter (12-ft) lane The stopping distance varied from 301 meters (99 ft) to 384 meters (126 ft) The tests were repeated in a 02-g turn on wet pavement Again the vehicle stopped smoothly with no problems The stopping distances varied from 301 meters (99 ft) to 402 meters (132 ft)
Wet brake recovery - Three baseline stops were made from 48 kilometers per hour (30 mph) with dry brakes decelerating at 3 meters per second squared (10 ftsec 2 ) The average pedal force was 231 newtons (52 lbf) After the vehicle was driven through 015 meter (6 in) of water at 8 kilometers per hour (5 mph) for 2 minutes the tests were repeated The stopping distances and pedal force were essentially the same indicating that the brakes had recovered on the first stop
Parking brake - Tests were conducted to determine parking brake effectiveness The vehicle did not pass the parking brake test even after the brakes were adjusted and the tests repeated The parking brakes would not hold the vehicle on the 30-percent slope with the vehicle in either position on the grade when a force of 400 newtons (90 lbfi) was applied to the brake lever
COMPONENT PERFORMANCE AND EFFICIENCY
Battery Charger
The battery charger for the Volkswagen Transporter is an off-board charger made by VARTA It is a 380-volt 50-hertz three-phase AC charger with a peak current input of 30 amperes A thyrister bridge circuit controls the usage rate to maintain a constant average battery voltage Timer 1 is started when the charge is started and terminates the charge in approximately 12 hours In normal operation the charger takes about 14 hours with a 50-hertz supply to charge the battery With the 60-hertz supply available in the United States the charge time was reduced accordingly Timer 2 begins running only when the battery reaches the gassing voltage This timer can be set for zero to 4 hours Charging can be terminated by either timer depending on the condition of the battery and the users requirements Both timers are automatically restored to their starting positions upon completion of charge
13
Battery charger efficiency test data are presented in table VIIi and in figure 13 The indicated efficiencies of the charger as calculated from the readings on the industrial kilowatt-hour meter and the average values of charger output voltages and currents are generally slightly higher than the efficiencies that were calculated from wattmeter readings Which set of values is more nearly correct has not been determined However most readings are within 3 percent of each other Since the power efficiency is fairly constant over the entire time period the energy efficiency is approximately equal to the average of the power efficiencies
Slight changes in the applied voltage or slight variations in the battery voltage (due to temperature age etc) can adversely affect the charging current and the time required to attain full charge Consequently the amount of energy that is delivered to the battery is largely determined by the judgment of the operator During the track tests the battery was always purposely overcharged
Battery
Manufacturers data - The battery supplied with the Volkswagen Transporter vehicle was composed of twenty-four 6-volt VARTA L800V3 lead-acid batteries connected in series Each VARTA 6-volt battery is rated at 185 ampere-hours at the 5-hour discharge rate Characteristics supplied by the battery manufacturer are shown in table IX
The battery manufacturers discharge data are presented in figures 14 and 15 Discharge current and voltage are shown as a function of time in figure 14 The battery can deliver 37 amperes for 5 hours (185 Ah) or 350 amperes for 025 hour (875 Ab) At a discharge current of 37 amperes the cell voltage is 201 volts at a discharge current of 350 amperes the cell voltage drops to 177 volts
Specific power versus the specific energy available for the 6-volt battery is shown in figure 15 At a low specific power of 67 watts per kilogram the available energy is 0126 megajoule per kilogram (35 Whkg) At a higher specific power of 60 watts per kilogram the available energy decreases to 0054 megajoule per kilogram (15 Whkg)
Battery acceptance - Before the vehicle was road-tested the battery supplied by the vehicle manufacturer was tested for terminal integrity and battery capacity as specified in appendix E of reference 1
14
An electronic load bank was used to discharge the battery for the terminal test and the capacity check since the load bank was limited to a discharge voltage of 120 volts the Volkswagen Transporter battery pack was discharged in two subpacks each with a nominal voltage of 72 volts
The terminal integrity test (300 A) and the capacity check were performed during a single discharge The results of these tests are presented in figure 16 The capacity removed is plotted as a function of battery voltage for both the front 72-volt and rear 72-volt battery subpacks The froht battery subpack (fig 16(a)) was discharged at 300 amperes followed by a 72-ampere discharge to a voltage of 615 volts The rear battery subpack (fig 16(b)) was discharged at 300 amperes followed by a 36-ampere discharge to a voltage of 618 volts The average capacity removed from both subpacks was 163 ampere-hours As this is 88 percent of the rated capacity the battery was acceptable
The terminal temperature as measured by a thermocouple after the 300-ampere test varied from 30 C to 130 C above ambient The battery passed both tests
Battery performance at constant vehicle speed - During the track tests motor current and voltage were constantly monitored Presented in figures 17 to 19 are the battery current voltage and power respectively measured during the 40- 56- and 69- kilometer-per-hour (25- 35- and 43-mph) range tests The average battery current voltage and power during the first and last 25 percent of the vehicle range test are shown in table X Battery power decreased toward the end of the test probably because of the reduced power requirements as the temperature of the mechanical drive train components tires and associated lubricants increased during the test
General battery performance - Battery data for selected driving tests are shown in table XI The electrolyte specific gravities ranged from 1266 to 1280 for the fully charged battery and from 1130 to 1135 for the discharged battery The ampere-hour overcharge varied from 26 percent to 43 percent While the overcharge was necessary to equalize the cells and assure full charge for every cell it increased the total energy consumption A charge cycle that results in only a 10-percent overcharge is more desirable
The battery temperature had a tendency to increase from ambient at the start of the test to an average of 7 degrees Celsius (13 deg F) above ambient at the end of the test
15
Battery efficiency - One complete battery charge was analyzed to determine battery efficiency This charge followed the 69-kilometer-per-hour (43-mph) constant-speed test conducted on 52777
Battery charger output voltage current and power are presented in figure 20 as a function of time Total energy input to the battery during charging was 302 kilowatt-hours the energy removed during the test was 179 kilowatt-hours The battery energy efficiency is therefore 59 percent However as shown in table X the ampere-hour overcharge was 43 percent for this test Correcting for a more desirable overcharge of 10 percent reduces the battery charge energy to 232 kilowatt-hours-and increases the battery energy efficiency to 77 percent A similar analysis performed for the 40-kilometer-per-hour (25-mph) range test run on 6877 shows an uncorrected battery energy efficiency of 62 percent with a 35 percent overcharge and a corrected energy efficiency of 77 percent with a 10 percent overcharge
Controller
The Volkswagen Transporter controller is a DC chopper controller manufactured by Siemens AG It controls the electric motor power in accordance with the desired driving conditions The Siemens controller has a nominal rating of 144 volts and 321 amperes and weighs 50 kilograms (311 ibm) It is easily accessible through a small door located at the rear of the vehicle (fig 21) As this vehicle is powered by a separately excited shunt-wound DC motor the controller consists of both an armature current control capable of handling armature currents of up to 320 amperes and a transistorized field control current regulator In addition to maintaining the desired vehicle speed the controller provides the following features
1 If either the motor or controller overheats the amount of power supplied to the motor is reduced
2 If the battery voltage drops to a specified minimum value the battery current is reduced
3 If the battery voltage exceeds a specified limit during deceleration regenerative braking is reduced
4 Overcurrent protection in the armature cuts off motor current
5 If any of the braking or driving control wires fail all motor power is automatically cut off
16
For speed regulation the Volkswagen Transporter has armature control up to 22 kilometers per hour (14 mph) it then employs field control to a maximum speed of about 70 kilometers per hour Figure 21 shows the controller installed in the rear of the vehicle
Motor
The Volkswagen Transporter vehicle is powered by a separately excited shunt-wound DC motor that was specially developed for the vehicle by Siemens AG The motor is designed to be easily serviced It is light in weight with a power-to-weight ratio of 0188 kilowatt per kilogram The motor is equipped with a forced-ventilation system in which a fan blows air in through the controller cooling fans and forces it axially through the motor The blower becomes operative when the ignition key is turned on It is powered by the main traction battery (144 V) characteristics are
The motor
Maximum continuous rating kW (hp) 16 (23)
Maximum peak rating kW 32
Maximum speed rpm 6700
Maximum torque at 2200 rpm N-m 160
Number of poles 4
VEHICLE RELIABILITY
No major problems were encountered that prevented completion of the tests although some minor problems occurred that delayed some tests These problems were mostly related to the controller On one occasion the 12-volt accessory battery was not being charged so the 12-volt charger module in the controller had to be repaired Another delay occurred when the vehicle would not operate over 22 kilometers per hour (14 mph) A malfunction in the field control circuit was limiting the vehicle speed Some transistors were defective and had to be replaced
Another problem was encountered when the battery was being recharged The charger operates at too high a current when charging a fully discharged battery As a result the battery overheated and would not cool down in time for the next scheduled test The problem was corrected by passing cool air from an air conditioner over the battery after the charge was finished in order to reduce the cooling time Other than these problems the Volkswagen proved to be reliable throughout the test period
17
DRIVER REACTION AND VEHICLE SERVICEABILITY
The vehicle was a comfortable easy-to-handle vehicle at all speeds Although it was seldom required the removal of the propulsion battery is easy and can be accomplished in less than 5 minutes The armature control field control logic components DC-to-DC converter and fuses are located in one unit on a slide-in tray that can be easily removed from the vehicle to simplify repairs
18
APPENDIX A
VEHICLE SUMMARY DATA SHEET
10 Vehicle manufacturer Volkswagen Werk AG Wolfsburg West Germany
20 Vehicle conversion of standard VW Transporter (type 2)
30 Price and availability on request
40 Vehicle weight and load
41 Curb weight kg (Ibm) 2268 (5000)
42- Gross vehicle weight kg (ibm) 3075 (6780)
43 Cargoweight kg(lbm) - 603 (1330)
44- Number-of passengers 3
45 Payload kg (ibm) 807 (1780)
50 Vehicle size 51 Wheelbase m (in) 242 (955)
52 Length m (ft) 444 (147)
53 Width m (ft) 175 (57)
54 Height m (in)
55 Head room m (in) 095 (375)
56 Leg room m (in) 066 (26) 257 Frontal area m (ft2)
58 Road clearance m (in) 59 Number of seats 2 (1 single 1 double)
60 Auxiliaries and options
61 Lights (nuhber type and function) 2 head 2 park and tail 2 brake 2 front parking turn signals
19
62 Windshield wipers 2 on front windshield 63 Windshield washers yes 64 Defroster gasoline-electric (from heater) 65 Heater gasoline-electric
66 Radio yes
67 Fuel gage
68 Amperemeter 69 Tachometer 610 Speedometer
611 Odometer
no
yes
no yes
yes in
in
kin
kmh
612 Right- or left-hand drive left 613 Transmission no 614 Regenerative braking yes
615 Mirrors 3 rearview 616 Power steering no 617 Power brakes no
618 Other
7 0 Battery 71 Propulsion battery
711 Type and manufacturer 6 V lead acid series connected VARTA Batterie AG
712 Number of modules 24 7 13 Total number of cells 72
714 Operatingvoltage V 144
715 Capacity Ah 180
716 Overallbattery size m (in) height 030 (118) width 0933 (367) length 1454 (572)
717 Weight kg (Ibm) 850 (1874) 718 History (age number of cycles etc)
72 Auxiliary battery 721 Type and manufacturer lead acid SLI VARTA
Batterie AG
722 Number of cells 6
20
7 2 3 Operating voltage V 12
7 24 Capacity Ah 36 7 25 Size in (in) height 0178 (7) width 0165 (65)
726 Weight kg(lbm) 204 (45)
8 0 Controller 81 Type and manufacturer DC chopper Siemens AG
82 Voltage rating V 144 82 Current rating A 320 8 4 Size m (in) height 024 (95) width 056 (220)
length 081 (320)
85 Weight kg (ibm) 50 (1102)
90 Propulsion motor 91 Type and manufacturer DC shunt wound Siemens AG
9 2 Insulation class IP R 24 93 Voltage rating V 130 94 Current rating A 150 (1-h rating) 95 Horsepower (rated) kW (hp) 16 (213) continuous (max peak
32 (426))
96 Size me(in) diameter 0364 (143) length 0454 (178) 97 Weight kg (Ibm) 87 (192) 98 Speed (rated) rpm 6700 (max 8370)
10 0 Battery charger 10 1 Manufacturer VARTA Batterie AG
10 2 Type off board 10 3 Input voltage required V 380 AC (3 phase) 104 Peak current demand A 30 105 Recharge time h 12
21
106 Size me(in) height 0864 (340) width 0406 (160)
length 0559 (220)
107 Weight kg abm) 108 Automatic turnoff feature- timer
110 Body 111 Manufacturer and type Volkswagen Transporter (type 2)
11 2 Materials steel
11 3 Number of doors and type 2 regular 2 sliding
114 Number of windows and type 7 plus windshield glass
11 5 Number of seats and type 1 bucket 1 double bucket
11 6 Cargo space volume m3 (ft3 ) 53 (1872)
11 7 Cargo space dimensions m (in) 280x154x123 (102x606x484)
12 0 Chassis
121 Frame
12 11 Type and manufacturer Volkswagen Transporter (type 2)
121 2 Materials steel
1213 Modifications battery compartment under cargo area
122 Springs and shocks 12 21 Type andmanufacturer not specified
12 2 2 Modifications none 12 3 Axles
12 31 Manufacturer not specified
123 2 Front
123 3 Rear
124 Transmission 1241 Type andmanufacturer none
22
1242 Gear ratios
1243 Driveline ratioshy
125 Steering 12 5 1 Type and manufacturer
1252 Turning ratio
1253 Turning diameter m (it) 119 (39)
126 Brakes 1261 Front disk
1262 Rear drum
12 63 Parking mechanical on rear wheels
1264 Regenerative yes
12 7 Tires
127 1 Manufacturer and type steel-belted radial
12 72 Size 185R14
1273 Pressure kPa (psi) Front 271 (45)
Rear 319 (53)
1274 Rolling radius m (in) 0316 (1245)
1275 Wheel weight kg (Ibm) Without drum
With drum 1276 Wheel track m (in)
Front
Rear
130 Performance
131 Manufacturer-specified maximum speed (wide-open throttle) kmh (mph) 708 (44)
132 Manufacturer-recommended maximum cruise speed (wide-open throttle)
kmh (mph)
133 Tested atcruise speed kmh (mph) 69 (43) 56 (35) 40 (25)
23
APPENDIX B
DESCRIPTION OF VEHICLE TEST TRACK
All the tests were conducted at the Transportation Research Center (TRC) of Ohio (fig B-1) This facility was built by the State of Ohio and is now operated by a contractor and supported by the state It is located 72 kilometers (45 miles) northwest of Columbus along US route 33 near East Liberty Ohio
The test track is a 12-kilometer (75-mile) continuous loop 16 kilometers (1 mile) wide and 56 kilometers (35 miles) long Three concrete lanes 11 meters (36 ft) wide in the straightaways and 13 meters (42 ft) wide in the curves make up the high-speed test area The lanes were designed for speeds of 129 177 and 225 kilometers per hour (80 110 and 140 mph) with zero lateral acceleration in the curves The 3-kilometer- (188-mile-) long straightaways are connected to the constant 731-meter- (2400-ft-) radius curves by a short variable-radius transition section Adjacent to the inside concrete lane is a 366-metershy(12-ft-) wide asphalt berm This berm is only banked slightly to provide a drainage slope An additional asphalt lane 366 meters (12 ft) wide is located adjacent to the outside lane on the straightaways The constant-speed and cycle tests were conducted on the inside asphalt lane because all tests were at relatively low speeds The acceleration and coast-down tests were conducted on the straight outside asphalt lanes because these were more alike than the two iside asphalt lanes and because it was the portion of the track least likely to encounter traffic interference The track has a constant 0228 percent north-to-south downslope The TRC complex also has a 20-hectare (50-acre) vehicle dynamics area and a 2740-metershy(9000-ft-) long skid pad for the conduct of braking and handling tests
24
APPENDIX C
VEHICLE PREPARATION AND TEST PROCEDURE
Vehicle Preparation
When the vehicle arrived at the test track a number of checks were made to assure that it was ready for performance tests These checks were recorded on a vehicle preparation check sheet such as the one shown in figure C-i The vehicle was examined for physical damage when it was removed from the transport truck and before it was accepted from the shipper Before the vehicle was operated a complete visual check was made of the entire vehicle including wiring batteries motor and controller The vehicle was weighed and compared with the manufacturers specified curb weight The gross vehicle weight (GVW) was determined from the vehicle sticker GVW If the manufacturer did not recommend a GVW it was determined by adding 68 kilograms (150 lbm) per passenger plus any payload weight to the vehicle curb weight
The wheel alignment was checked compared and corrected to the manufacturers recommended alignment values The battery was charged and specific gravities taken to determine if the batteries were equalized If not an equalizing charge was applied to the batteries The integrity of the internal interconnections and the battery terminals was checked by drawing either 300 amperes or the vehicle manufacturers maximum allowed current load from the battery through a load bank for 5 minutes If the temperature of the battery terminals or interconnections rose more than 60 degrees Celsius above ambient the test was terminated and the terminal was cleaned or the battery replaced The batteries were then recharged and a battery capacity check was made The battery was discharged in accordance with the battery manufacturers recommendations To pass this test the capacity must be within 20 percent of the manufacturers published capacity at the published rate
The vehicle manufacturer was contacted for his recommendations concerning the maximum speed of the vehicle tire pressures and procedures for driving the vehicle The vehicle was photographed head-on with a 270-millimeter telephoto lens from a distance of about 305 meters (100 ft) in order to determine the frontal area
Test Procedure
Each day before a test a test checklist was used Two samples of these checklists are shown in figure C-2
25
The first item under driver instructions on the test checklist is to complete the pretest checklist (fig C-3)
Data taken before during and after each test were entered on the vehicle data sheet (fig C-4) These data include
(1) Average specific gravity of the battery
(2) Tire pressures
(3) Fifth-wheel tire pressure
(4) Test weight of the vehicle
(5) Weather information
(6) Battery temperatures
(7) Time the test was started
(8) Time the test was stopped
(9) Ampere-hours out of the battery
(10) Fifth-wheel distance count
(11) Odometer readings before and after the tests
The battery charge data taken during the charge cycle were also recorded on this data sheet These data include the average specific gravity of the battery after the test the kilowatt-hours and ampere-hours put into the battery during the charge and the total time of the charge
To prepare for a test the specific gravities were first measured for each cell and recorded The tire pressures were measured and the vehicle was weighed The weight was brought up to the GVW by adding sandbags The instrumentation was connected and power from the instrumentation battery was applied All instruments were turned on and warmed up The vehicle was towed to the starting point on the track The fifth-wheel distance counter and ampere-hour integrator counter were reset to zero The test was started and was carried out in accordance with the test checklist When the test was terminated the vehicle was brought to a stop and the post-test checks were made in accordance with the post-test checklist (fig C-5) The driver recorded on the vehicle data sheet the time the odometer reading the ampere-hour integrator reading and the fifth-wheel distance reading
26
At the end of the test weather data were recorded on the vehicle data sheet All instrumentation power was turned off the instrumentation battery was disconnected and the fifth wheel was raised The vehicle was then towed back to the garagethe post-test specific gravities measured for all cells and the vehicle was placed on charge
After the test the engineer conducting the test completed a test summary sheet (fig C-6) This data sheet provides a brief summary of the pertinent information received from the test Another data sheet the engineers data sheet (fig C-7) was also filled out This data sheet summarizes the engineers evaluation of the test and provides a record of problems malfunctions changes to instrumentation etc that occurred during the test
Weather data - Wind velocity and direction and ambient temperature were measured at the beginning and at the end of each test These data were obtained from the control tower which was located in the center of the test track The wind anemometer was located about 18 meters (6 ft) from the ground near the southern straight section of the track The ambient temperature readings were taken at the instrumentation trailer near the west curve of the track During most of the test period the winds were under 11 kilometers per hour (7 mph)
Determination of maximum speed - The maximum speed of the vehicle was determined in the following manner The vehicle was fully charged and loaded to gross vehicle weight After one warmup lap the vehicle was driven at wide-open throttle for three laps around the track The minimum speed for each lap was recorded and the average was calculated This average was called the vehicle maximum speed This speed takes into account track variability and maximum vehicle loading This quantity was then reduced by 5 percent and called the recommended maximum cruise test speed
Cycle timer - The cycle timer (fig C-8) was designed to assist the vehicle driver in accurately driving SAE schedules B C and D The required test profile is permanently stored on a programmable read-only memory (PROM) which is the heart of the instrument This profile is continuously reproduced on one needle of a dual-movement analog meter shown in the figure The second needle is connected to the output of the fifth wheel and the driver matches needles to accurately drive the required schedule
One second before each speed transition (eg acceleration to cruise or cruise to coast) an audio signal
27
sounds to forewarn the driver of a change A longer duration audio signal sounds after the idle period to emphasize the start of a new cycle The total number of test cycles driven is stored in a counter and can be displayed at any time with a pushbutton (to conserve power)
28
REFERENCES
1 Sargent Noel B Maslowski Edward A Soltis Richard F and Schuh Richard M Baseline Tests of the C H Waterman DAF Electric Passenger Vehicle NASA TM-73757 1977
2 Society of Automotive Engineers Inc Electric Vehicle Test Procedure - SAE J227a Feb 1976
29
9P IR1 - SLZ24UU OF TEST RESLTS FOR O3LX iAV J TRANSFOER
(a) SI units
Test date Test condition (constant speed
Wind velocity
1btr ature
Range km
Cycle life
Capacity out of
apacity into
Eergy into
Indicated energy
kiVh or drmivng schedule)
h oC nttelr of cycles
batterie Ah
batteres Ah
charger M
cnswrpticn MJim
51177 402 8 19 1102 - 1563 208 9 --- -
52477 40 2 8 27 1247 - 1622 213 5 1422 114
6177 a4 02 3 2 - 145 23 1167 - 163 3 2205 -- -shy
6877 402 64 - 129 16 118 7 - 162 5 2196 j51 132
51277 563 96 23 890 - 147 3 201 2 - -shy
53177 563 129 - 161 23 851 -- 1315 1856 123 8 145
51677 69 2 8 25 571 3--18 175 3 ---- -shy
52377 692 48 22 607 --- - 1004 1 66
52777 692 48 22 71 8 - 132 0 1888 -
52677 Bo 8 22 71 1 197 162 7 2006 1303 1 83
6777 Bc 8 - 16 1 14 645 193 154 8 2016 b140 7 2 17
51777 Bd
96 27 685 179 1638 2155 - - -shy
51877 Bd
8 29 758 215 1704 -- 1443 195 6977 3d 129 - 16 1 13 705 207 165 6 230 3 b1616 228 6277 do 113 19 481 81 1357 170 0 - - -
6377 Cc 8 14 463 78 122 5 1913 1080 233
52077 Cd
3 2 27 467 75 1278 -- -- -
52577 Cd 113 25 48 4 78 132 2 1682 112 7 2 33
(b) U S cuesfaxy units
Test date Test onditon (cstant speed HPh o driving
schedule)
wind veocity
nph
Taper-attre
OF
Rangenles
Cycle life
nmtder of cycles
Capacity out of
batters Ah
Capacity into
battene Ah
Energyinto
charger JAn
Indicated energy
conslpt Jlnle
51177 25 5 66 68 5 - 1563 208 9 - -shy
52477 25 5 81 775 - 1622 2135 395 0 51
6177 a25 2 - 9 73 725 - 163 3 2205 -- -6877 25 4 - 8 60 738 - 1625 219 5 b431 59
51277 35 6 74 55 3 - 147 3 2016 - -shy
53177 35 8 - 10 74 629 - 131 5 185 6 34 4 65
51677 43 5 77 355 - 1118 1753 - -
52377 43 3 72 377 - - -- 279 74 52777 43 3 71 44 6 -- 1320 188 8 - -
52677 BF 5 71 442 197 1627 2006 362 82
6777 Bc
5- 10 58 401 193 1548 2016 b391 97
51777 Bd 6 81 425 179 1638 2155 - -
51877 Bd 5 84 471 215 1704 - 401 87
6977
6277 Bd
Cc
8 - 10 7
56 66
438 299
207 81
1656 1357
2303 1700
b449 --
102 -
6377 Cc
5 57 288 78 1225 1913 300 104
52077 Cd 2 80 290 75 1278 - - _
52577 C 7 77 301 78 1322 168 2 313 104
aspeed controlled wth potentaometer
brad th industrial kaltwat-hour iter
WJthnutregenerative braking6 With regererative braking
ORIGINAL PAGE IS OF POOR QUALITY
30
TABLE I - ACCELERATION TIMES FOR TABLE III - ACCELERATION CHARACTERISTICS FOR VOLKSWAGEN
VOLKSWAGEN TRANSPORTER TRANSPORTER
Vehicle speed Amount of discharge percent Vehicle speed Amount of discharge percent
kmh mph 0 40 80 kmh mph 0 40 80
Tame to reach designated Acceleration vehile speed s ms 2
ms2mphs mphs ms 2 mphs 0 0 0 0 0 20 12 8 6 6 0 0 0 0 0 0 0 0 40 25 13 11 11 20 12 9 19 11 24 11 24 60 37 18 16 15 40 25 11 25 12 27 13 30 80 50 22 19 20 60 37 14 30 15 33 13 29
100 62 26 22 23 80 50 14 31 17 38 14 32 120 75 30 27 27 100 62 13 29 14 31 15 34 140 87 34 31 31 120 75 13 30 13 30 14 31 160 99 38 35 35 140 87 16 35 14 31 15 33 180 112 41 39 39 160 99 17 37 14 31 14 31 200 124 45 42 44 180 112 16 35 15 33 13 28 220 137 49 45 46 200 124 15 33 18 40 16 37 240 149 54 5 0 50 220 137 13 28 16 35 17 38 260 162 59 56 55 240 149 11 25 10 24 12 27 280 174 63 62 60 260 162 13 28 10 22 11 25 300 187 68 68 6 7 280 174 13 29 9 20 10 22 320 199 75 75 74 300 187 9 21 8 9 8 18 340 211 80 82 81 320 199 9 21 8 18 8 17 360 224 89 92 88 340 211 9 20 7 15 8 18 380 236 95 101 97 360 224 8 17 6 14 7 17 400 249 103 107 107 380 236 8 17 8 17 6 14 420 261 113 119 116 400 249 6 14 7 15 6 13 440 274 123 128 127 420 261 6 13 6 12 6 12 460 286 133 136 137 440 274 5 12 7 15 5 12 480 298 145 150 149 460 286 5 11 5 12 5 11 500 311 158 162 164 480 298 4 10 4 9 4 9 520 323 172 172 178 500 311 | 9 5 11 4 9 540 336 187 183 194 520 323 9 5 12 4 8
560 348 203 200 212 540 336 8 4 9 3 7 580 361 221 219 232 560 348 3 7 3 7 3 7 600 373 241 243 257 580 361 3 6 3 6 3 6 620 385 266 265 282 600 373 3 6 2 5 2 5 640 398 293 289 313 620 385 2 5 5 2 4
660 410 318 322 346 640 398 2 5 4 2 4 680 423 ---- 356 383 660 410 2 5 4 2 4
--680 423 4 1 3
TABLE IV - GRADEABILITY OF VOLKSWAGEN
TRANSPORTER
Vehicle speed Amount of discharge percent
kmh mph 0 40 80
Gradeabillty percent
0 0 0 0 0 20 12 88 109 109 40 25 115 124 140 60 37 141 155 134 80 50 144 176 147
100 62 134 146 158 120 75 137 137 147 140 87 161 141 152 160 99 172 143 142 180 112 162 153 129 200 124 151 186 170 220 137 130 163 176
240 149 115 110 126 260 162 131 100 115 280 174 135 90 100 300 187 96 87 83 320 199 97 83 79 340 211 91 69 81 360 224 77 62 75 380 236 80 78 63 400 249 65 69 59 420 261 59 57 57 440 274 56 69 55
460 286 51 55 51 480 298 46 43 42 500 311 43 53 40 520 323 39 55 38 540 336 36 42 34 560 348 34 32 31
580 361 30 27 26 600 373 26 25 23 620 385 22 25 20 640 398 22 20 18
660 410 2 17 16 680 423 ---- 17 15
32
TABLE V - ROAD ENERGY CONSUMPTION FOR VOLKSWAGEN TRANSPORTER
(a) With rear axle connected (b) With rear axle disconnected
Vehicle speed Road energy consumed Vehicle speed Road energy consumed
kmh mph MJkm kWhmile kmh mph MJkm kWhmile
680 423 0 0 720 447 0 0 660 410 81 36 700 435 62 28 640 398 84 38 680 423 59 26 620 385 90 40 660 410 57 25 600 373 80 36 640 398 56 25 580 360 72 32 620 385 57 26 560 348 74 33 600 373 47 21 540 336 82 37 580 360 43 19 520 323 81 36 560 348 52 23 500 311 72 32 540 336 54 24 480 298 70 31 520 323 55 25 460 286 72 32 500 311 56 25 440 273 74 33 480 298 54 24 420 261 70 31 460 286 46 20 400 249 67 30 440 273 44 20 380 236 67 30 420 261 48 21 360 224 68 30 400 249 43 19 340 211 65 29 380 236 34 15 320 199 64 28 360 224 37 17 300 186 62 28 340 211 41 18 280 174 57 26 320 199 41 19 260 162 55 24 300 186 41 18 240 149 55 24 280 174 34 15 220 137 55 24 260 162 30 18 200 124 54 24 240 149 30 13 180 112 52 28 220 137 32 14 160 99 45 20 200 124 35 16 140 87 42 19 180 112 34 15 120 75 43 19 160 99 30 13 100 62 43 19 140 87 31 14 80 50 40 18 120 75 30 13 60 37 38 17 100 62 29 13 40 25 36 16 80 40 31 14 20 12 39 18 60 37 31 14
40 25 29 13 20 12 29 13
OIGVIAL PAGE IS
OF POOR QUALITY33
TABLE VI - ROAD POWER REQUIREMENTS OF VOLKSWAGEN TRANSPORTER
(a) With rear axle connected (b) With rear axle disconnected
Vehicle speed Rzoad power required Vehicle speed Road power required
kmh mph kW hp kmh mph kW hp
680 423 0 0 720 447 0 0
660 410 148 199 700 435 120 161
640 398 150 201 680 423 111 149
620 385 155 207 660 410 104 139
600 373 134 180 640 398 100 134 620 385 101 136580 360 117 156
560 348 114 153 600 373 78 105 580 360 69 93540 336 123 165
157 560 348 81 109520 323 117 134 540 336 82 109500 316 109
480 298 94 125 520 323 80 107
460 286 92 123 500 311 77 104
440 273 80 121 480 298 72 96
420 261 82 109 460 286 58 78
400 249 74 99 440 273 54 73 380 236 70 94 420 261 56 75 360 224 68 91 400 249 48 64
340 211 61 82 380 236 36 48 320 199 57 76 360 224 37 50 300 186 52 70 340 211 39 52 280 174 44 60 320 199 37 49 260 162 40 53 300 186 34 46
240 149 36 49 280 174 27 36 220 137 33 45 260 162 21 29 200 124 30 40 240 149 20 27 180 112 26 35 220 137 19 26 160 99 20 27 200 124 19 26 140 87 16 22 180 112 17 22 120 75 14 19 160 99 13 18 100 62 12 16 140 87 12 16 80 50 9 12 120 75 10 13 60 37 6 8 100 62 8 11 40 25 4 5 80 50 7 9 20 12 2 3 60 37 5 7
40 25 3 4 2 220 12
34
TABLE VII - INDICATED ENERGY CONSUMPTION FOR
VOLKSWAGEN TRANSPORTER
Test condition Indicated energy consumption (constant speed or driving schedule) MJkm kWhmile
kmh mph
402 25 114 051
563 35 145 65
692 43 166 74
Ba 200 95
Eb 211- 89 Ca 233 104
Cb 233 104
aWth regenerative braking
bwithout regenerative braking
ORIGNAL PAGE IS OF POOR QUALITY
35
TABLE VIII - CHARGER EFFICIENCY TEST DATA FOR VOLKSWAGEN TRANSPORTER
Time Input power from kilowatt-hour meter
Pin
kW
Output power calculated from
Vav x 1 av P out kW
Energy efficiency percent
Input power from watt-meter PIn kW
Output power from watt-meter Pout
kW
Power efficiency percent
Deviation percent
645 am 363 296 815 330 260 788 33 745 353 291 824 316 256 810 17 845 341 267 783 323 252 780 4 945
1045 339
327 279
275
823
841
310
310
254
245
819
790
5
60 1145 313 268 856 294 239 813 50 1245 pm 298 252 846 280 225 804 49 145 280 238 850 244 207 848 2 245 252 215 853 224 186 833 23 345 229 199 869 200 171 853 18 445 227 196 863 197 165 838 29 545 227 193 850 186 162 869 22 645 234 202 863 201 172 857 7
TABLE IX - CHARACTERISTICS OF VARTA LB0OV3
BATTERY MODULES USED IN VW TRANSPORTER
Length cm (in) 24 (94)
Width cm (in) 19 (75)
Height cm (in) 27 (106)
Weight kg (ibm) 30 (66)
TABLE X - AVERAGE BATTERY PERFORMANCE DURING CONSTANT-SPEED TESTS OF
VOLKSWAGEN TRANSPORTER
Test speed Initial 25 percent of test Final 25 percent of test
kmh mph Current Voltage Power Current Voltage Power A V kW A V kW
40 25 56 147 82 58 130 77
56 35 87 144 124 90 123 116
69 43 138 141 194 122 120 159
TABLE XI - VOLKSWAGEN TRANSPORTER BATTERY VEHICLE TEST DATA
Test condition Test date Battery capacity Overcharge Electrolyte Average battery (constant speed or Ah percent specific gravity temperature 0 C driving schedule)
eIput Output Before After Before After
kmh mph test test test test
69 45 52777 189 132 43 1266 1135 32 38
56 35 53177 185 132 40 1272 1130 24 30
C 6277 170 135 26 1278 1135 32 41
Z0 [ 25 6877 220 163 35 1270 1130 33 32 B 6977 230 166 1 9 1280 1o30 32 35
ORIGINAL PAGE IS OF POOR QUALITY
37
~C-17-ISI2
Figure 1 - Volkswagen Transporter electric delivery van
Figure a - Side view of VW Transporter showing special fixture for removal of battery pack
38 ORIGIAL rAGE IS OF pOOR QUALITY
Battery current 250 A160 mV
Battery to
voltage 144V -
Z Transistor Motor control armature
Motor field
Figure 3 - Wiring diagram of VW Transporter showing instrumentation locations
V
1tJ
-- ta -- -tcr tb -ti -
TIME s
S -TEST PARAMETER SAEO SCHEDULES
MAX SPEED V mph 20 30 45 ACCEL tiME ta s 19 18 28 CRUISETIME tcr 19 20 50 COASTTIME tco 4 8 10 BRAKETIME t 5 9 9 IDLEIME ti 25 25 25
Figure - SAE J227a driving cycle schedules
39
VEHICLE PERFORMANCE V W TRRNSPURTER
9322F
2X
80
90 KM
Figure 5 -shy ag tcnsatsed
0 10 20
0 1Fo
30 HO pound0 KMH 30
GO 7
Lib
no0 90
ampo 6
100
b2 I
w
XO
EO
90 30
ICHajRg4
-
-VEHICLE SPEED
FigureS -Rangeat constantspe
VEIH ICLE PERFIJRMRNCE DATE RECDR5ED V N TANSEJRTERdUNE I01977
5L
HE SB
- 72
tagre-ni 32celraton
200
-WX0 DISCIHRGE
X-q0X DIaCHRRSM
-BOX oS-RVEH ICLE PERFJRMRNCE DTE RECRHDED IUNE lo 1977V WITRRNSPORTER
711 Hi l I I I I
ES
EE E5= 2S
3s
I L pound_x O
2R2 RH
HH Am x
1 22 32 3o EM 7 0g g2 2oTo I KMH
06 IS 20 30 qOe EBE2I1 MIPH
VEHICLE SPEED
Figure 7 - Acceleration as afunction of speed
0K DirCRRE X940X DISCHRR3E
-SOX DSC-M VEHICLE PERFfRHINCE DHTE RECURDED
V W TRRNSpFIRTER UNE mi1977
I I I I
24
HX ZJE X H ~a XX0
-I HXM H 0
w12j2-Nox 0 RH
LU x g~cn x
0 1E2 3 0 0S 70 0 9N 100 KNH
MPH VEHICLE SPEED
FIgure 8- Gradeability as afunction of speed
41 ORIGINAt pAE 18
qtuoo 2 TY
2
Ba81
9m1
04L171
2EHoa
0
=
LIIi 62
~ 2 2 0
40
0-0
12 IS
E1
a)With rear axle cannectedt
n0 I
testdate June 10 191
497
(a)With rear axle connected test date June 10 1977
Fr -e e a rVs na r 0 L
10
q0
0
0
HIP
2 0 60 2 0 120ilI qIlfI M9110200 TIMEt SECONDS
0)With rear axle disconnected test date June 21 1977
Figure 9 - Vehicle deceleration for Volkswagen Transporter
0
~ O -
10I202 H q 0E270E0El i0f10 KMHl
0 12 20 1 4 5 Ea 2 IN MPH
VEHICLE SPEED
9)) With rear axle disconnected test date June 21 1977
Figure 10 - Road energy as afunction of speed for Volkswagen Transporter
29 IJ
4
q - [I
0
Zq-4
1
Lo
L 12shy=0B=lz
rp a)With rear axle connected test date June 10 1977
It
C
DCC
-
-
B H- I[l
0 ItA
0~
2-shy
t
VEHICLE PERFORMHlNCE V W TRHNSPORIER
4 05 10 3 0 0 6 0 O 9 0 E0 03 5 o os 02
jc CIO Sl]10i 20] 30 1
MPHVEHICLE SPEED
a)With rear axle disconnected test date June 21 1977
Go 1332 0l 10]
Figure 12
21D 0 13 L ~l1NEb E05
MPHVEHICLE PEED
- Energy consumptin as a function of speed
I~E
Figure 11 - Road power as a function of speed for Volkswagen Transporter
0 Method L Iav x Vav o Method Z Wattmeter
oO o o 0
0 0
10 15 20
OUTPUT CURRENT A
Figure 13 -Battery charger effhciency as a function of output current for Volkswagen IjJN Transporter
10 15t 600H
2P0
C20
15 8C
4-Pm N 4 111
2 i-
Idoli2 0 W10- i 1I
DISCHARGE CURRENT A SPECIFIC ENERGY MNikg
Figure 14 - Discharge characterishcsof Figure 15 - Energylpower relation-VARTA L800V3 battery ship for VARTA L80OV3 three-cell
battery
44
80 I CURRENT
A 1270
0
gt (a)Front subpack
go
70O3
0 20 40 60 80 100 120 140 160 180
CAPACITY REMOVED Ah
1)Rear subpack
Figure 16 - Battery qualification test data for VARTA L80OV3
alt 2 oDs c E COMP ONENT PERFIRM NCE X gt 7S DISCI~i-bRGE V W TRHBNPORER_ DATE RECORDED
Y -dUN Bi 1377
ISO
120shy
2EE
I0 20B 39 50 50 70 00 90 100W KMH20 30 q 752 go SO ampE0 I
MPH VEHICLE SPEED
- Current as afunction of speedFigure 17
orIampVAL ppB Ir4Of-- PO YL 45
o- lt2cg 015iCHR Z COMPONENT PERFRMRNCE V N TRRNSPRTER DHTE RECORDED
MHY II-dUN 8 1977
lEOtimes
Iq
120x
I100
40
0 0 -
U 10 20 3 40 ll EO 70 80 90 10KKH EbI
I 2 A I pound
$PH VEHICLE SPEED
Figure 18 - Voltage as a function of speed
COMIPONENT FERFORI4RNE V N TRRNSPORTER DRTE RECORDED
X- gt 2 r 01 1IM
NAY ll-dUN O 1977
IEK
K
O 9 0 3 L10 amp0 60EZ70 00 9-0 100
0 1 20 JE gg IG 2
MPH VEHICLE SPEED
Figure 19 - Power as afunction of speed
46
Figure 21 - Controller installed in Volkswagen Transporter
r0 730 km R (045 mile)
S 56km 16km Ile O) (15 miles) (10 mile)
30 km O8 - Weather station and miles)
0223 Traffic entry and exit 0
control tower
Percent slope
t 022 Percentslope
I Traff icdirection
Figure B-1 - Characteristics of Transportation Research Center Test Track East Libety Ohio
48
COMPONENT PERFORMANCE DATE RECOED
V WTRANSPORTER R 271 1977
VOLTAGE
173 3
(a)Voltage and current
i Z 3 4I SS S 7 S 35 1n1 11 17 13 1 4 IE 17 1i TIME h
0) Power
Figure 20 - Battery charger output voltage current and power
ORIGINAL PAQIl1 or PooR QUAVIW
47
- PAGE OF POOR QUALITy
1 Vehicle L Date received 3Checked for damage - date amp Wheel alignment - date 5 Battery checked and equalized - date 6 Curb weight determined Ibm Date
7 Gross vehicle weight Ibm 8 31)-Ampere test -date 9 Manufacturers recommendationsamp
Maximum speed mph
Tire pressures psi Front _ Rear Driving procedures
Figure C-1 - Vehicle preparation check sheet
Vehicle mph range test _ _ gear
Driver Instructions 1 Complete pretest checklist 2 While on track rechecL
Integrator - light on in operate position zeroed Speedometer - set on mph center Distance - on reset lighted Attenuator - on reset lighted
3 At signal from control center accelerate moderately to _ mph
4 Maintain _+I mph with minimal accelerator movement 5 When vehicle is no longer able to maintain _ mph brake moderately to full stop
6 Complete post-test checklistand other documentation
Recrdfint 1 Set oscillograph zeros at Channel Zero In
3 30 4 45 6 50
10 75 12 11 13 12 14 20
2 Record all channels on magnetic tape Check inputs at beginning of test to verify recording
3 Run cals on all channels
4 Remove all channels from oscillograph except 3and4 5 Start recording 15 sbefore start of test at oscillograph speed of 01 inis and tape speed
of ins
6 After 15 min Into test connect channels 6 10 12 13 and 14 to oscillograph and record aburst at 100 Inds while vehicle is in chopper mode
7Remove channels 610 12 13 and 14 from oscillograph and continue test at 01 Inrs with channels 3and 4only
amp Document all ambient conditions at beginning once every hour and at the end of the test Items recorded shall Include temperature wind speed and direction significant wind gusts and corrected barometric pressure
(al Constant-speed test
Figure C-2 - Test checklists 49
Vehicle cycle test _gear 1 Record specific gravity readings after removing vehicle from charge and disconnect charger Instrumentation Fill In charge data portion of data sheet from previous
Driver Instructions test Add water to batteries as necessary recording amount added Check and reshy1 Complete pretest checklist cord 5th wheel tire pressure and vehicle tire pressure
2 While an track recheck 2 Connect (Connect alligator clips to Instrumentation battery last) Integrator - light on in operate position zeroed (a)Inverter to instrument battery Speedometer - set on _ mph center (b)Integrator input lead Distance - on reset lighted ic)Integrator power to Inverter Attenuator - on reset selector on 100 ad)Starred () 5th wheel jumper cable Cycle timer - verify scheduled timing with stop watch t) Cycle timer power and speed signal Input cables Check times
3 At signal from control center perform cycle test using cycle timer as basis for deter- it) Spin up and calibrate 5th wheel mining length of each phase of performance cycle Use programmed stop watch as 3 Record test weight - Includes driver and ballast with 5th wheel raised backup device Cycle consists of
Accelerate to _ mph in _ s 4 Turn on
s(a) Inverter motor speed sensor thermocouple reference junctions integratorCruIse at _ mph for sr and digital voltmeter Set integrator on Operate Ln Coast for s O)Ffth wheel readout and switching Interface units (2) (Selectdistancefor exshy0 Brake to complete stop in _ s panded scale range I
Hold in stop position for __ s 5 Tow vehicle onto track with 5th wheel raised Repeat entire cycle until vehicle Is unable to meet acceleration time Moderately brake Precallbrations to acomplete stop Tape data system
Oscillograph4 Complete post-test checklist and other documentation Reset Recording 5th wheel distance 1 Record all channels on magnetic tape at Ins Check al channels to verify Ampere-hour meter
input at beginning of test Thermocouple readout switches on Record Turn on thermocouple reference junctions
2 Record speed and distance on osclllograph at mIns Lower 5th wheel Set hub loading
3 Start recordingdata 15 s before beginning test 6 Be sure data sheet is properly filled out to this point Check watch time with control 4 Document ambient conditions atbeginning once every hour and at the end of the test 6owerw
Items recorded shall include temperature wind speed and direction significant windgusts and corrected barometric pressure 7 Proceed with test
N3)Driving cycle test Figure C-3 - Pretest checklist
Figure C-2 - Concluded
Vehicle Battery system Test Date Track data Driwer Navigator Average pretest specific gravity Open-ircuit voltage V Tire pressure before test psi
Right front _ Left front _Right rear Left rear__ Tire pressure after test psh
Rightfront__ Left front Right rear Left rear Fifth-wheel pressure psi (calibrat __ psi) Weather Initial Duringtest Final
Temperature OF Wind speed mph -- --__ Wind direction Pressure in Hg
Battery temperature OF Before After Mttr temperature O Before After
Time Start StopOdometer reading miles Start___ Stop__ Current out Al __ Current in (regenerativel Ah __ Fifth wheel
Basis for termination ottests
Charge data Average post-test specific gravity Open-circuit voltage V Charger used Charger Input voltage V Battery temperature OF Beforecharge After charge Power kWh Start End Total Time Start _ End Total charge time min Current input Ah Average specific gravity after charge
Approval
Figure C-4 -Track and chargedata
1 Record time immediately at completion oftest Turn offkey switch
2 Complete track data sheet (a)Odometer stop b) Ampere-hour integrator (c) 5th wheel distance i) Read temperature (e)Calibrate data system Mf)Record veather data
3 Turn off Inverter thermocouple reference junctions
4 Disconnect 12-volt instrument battery red load
5 Raise 5th wheel
6 Tow vehicle off track
7 Start charge procedure (specific gravities)
8 Check specific gravity on Instrument battery If less than 12M0 remove from vehicle and charge to full capacity
9 Check water level in accessory batteries Add water as necessary
Figure C-5 - Post-test checklist
ORIGINAL PAG IS 01 POOR QUATTW
51
Vehicle Test Date
Test conditions Temperature OF _ Wind speed mph _ at
Barometer reading in Hg Other
Test results Test time h
Range miles
Cycles Current out of battery Ah
Current into battery Ah
Charge time h
Power into battery kWh
Magnetic tape
No _ Speed ints
Comments
FigureC-6 -Test summary sheet
Vehicle Test Date
Engineer Reason for test (checkout component check scheduled test etc I
Limitation on test (malfunction data system problem brake drag etc)
Changes to vehicle prior to test (repair change batteries etc )
Other comments
Evaluation of test Range miles
Current out Ah
Current in Ah
Power in kWh Energy consumption kWhimile
Was planned driving cycle followed
General comments
Figure C-7 - Engineers data sheet
52
Figure C-8 - Cycle timer
ORIGINAL PAGE Io OF POOR QUALIT
53
NATIONAL AERONAUTICS AND SPACE ADMINISTRATION WASHINGTON DC 20546 PQSTAqg AND FEES PAID
ANDAERONAUTICS OFFICIAL BUSINESS S~EA~NSRTO
NATIONAL PENALTY FOR PRIVATE USE $300 SPECIAL FOURTH-CLASS RATE SA
SPACE ADMINISTRATION L IBOOK A
IfUndeliverable (Section 158 POSTMASTER Postal Mnnual) Do Not Return
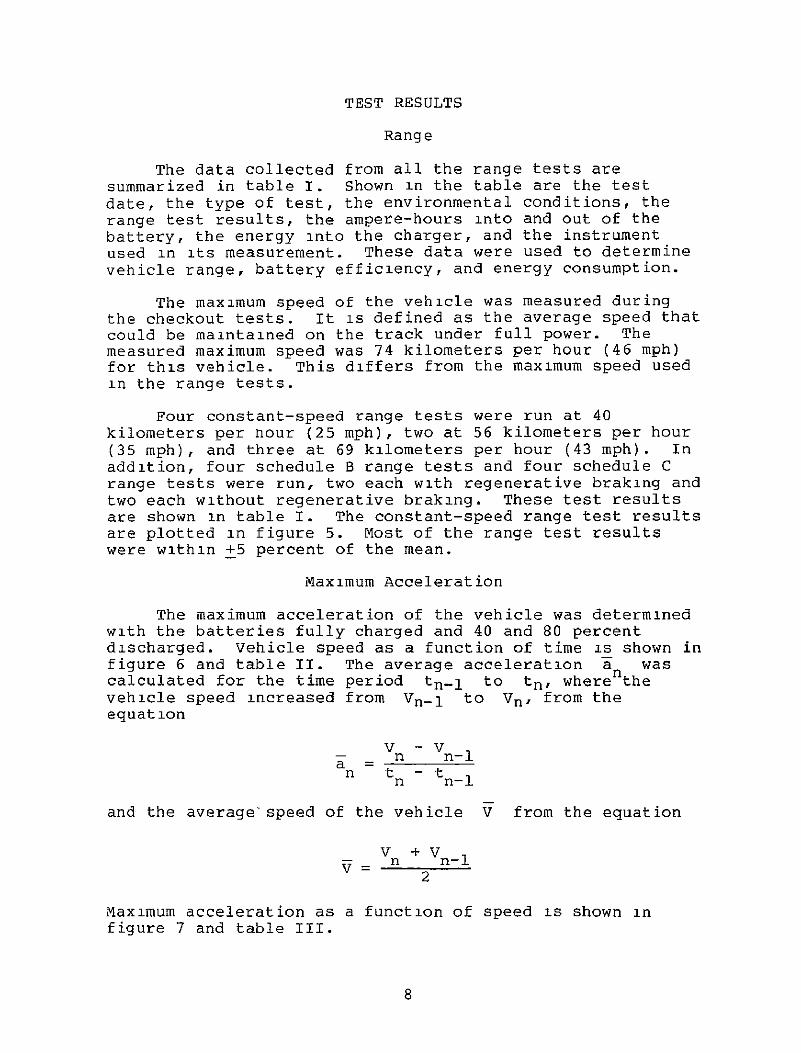

where
P tractive force N (flbf)
W gross vehicle weight kg (Ibm)
The Volkswagen Transporter was capable of exerting the following tractive forces for three states of battery discharge
(1) Fully charged 4270 newtons (960 lbf)
(2) 40 Percent discharged 3870 newtons (870 lbf)
(3) 80 Percent discharged 3470 newtons (780 lbf)
At a vehicle weight of 3075 kilograms (6780 ibm) the resulting gradeability limits were
(1) Fully charged 143 percent
(2) 40 Percent discharged 129 percent
(3) 80 Percent discharged 116 percent
Road Energy Consumption
Road energy is a measure of the energy consumed per unit distance in overcoming the vehicles aerodynamic and rolling resistance plus the energy consumed in the differential drive shaft and the portion of the transmission rotating when in neutral It was obtained during coast-down tests when the differential was being driven by the wheels and thus may be different than the energy consumed when the differential is being driven by the motor
Road energy consumption En was calculated from the following equations
E 278xl0-4W Vn-1 n MJkmn tn - n -1
or
E 0x1-5W Vn-i - n E= 907x10 W V - kWhmile n t n - n-i
10
V
where
vehicle mass kg (ibm)
vehicle speed kmh (mph)
t time s
Vehicle coast-down tests were conducted both with and without the drive train (differential transmission and electric motor) connected to the wheels In normal operation the electric motor cannot be declutched (disconnected) from the wheels It was mechanically disconnected by disconnecting the drive shafts between the wheels and the differential The drive shafts were wired in place so they did not drag
With the drive shafts connectedr the vehicle was self-powered When they were disconnected it was necessary to tow the vehicle to speed before starting the coast-down tests
The coast-down data used to calculate road energy were averaged and plotted as vehicle deceleration versus vehicle speed in figure 9(a) with the drive shafts connected and in figure 9(b) with them disconnected Coast-down time increases significantly when the drive train is disconnected from the wheels
The results of the road energy calculations are shown in figure 10(a) and table V(a) for the vehicle with the drive train connected and in figure 10(a) and table V(b) with it disconnected
Road Power Requirements
The calculation of road power is analogous to the calculation of road energy It is a measure of the power needed to overcome vehicle aerodynamic and rolling resistance plus the power losses from the differential the drive shaft and a portion of the transmission The road power Pn required to propel a vehicle at various speeds is a-lso determined from the coast-down tests The following equations are used
V2 v 2
P 386xlO-W n- n kWn n nshy
ii
or
2 i -V2
V Pn= n608x1-5J W n-1 n hpn - tn-i
The results of road power calculations are shown in figure 11(a) and table VI(a) with the drive train connected to the wheels and in figure 11(b) and table VI(b) with it disconnected Both road energy and road power are significantly lower when the drive train is disconnected
Indicated Energy Consumption
The vehicle indicated energy consumption is defined as the energy required to recharge the battery after a test divided by the vehicle range achieved during the test where the energy is the input to the battery charger
Initially the indicated energy consumption was measured by using a wattmeter and integrating over the charge time Then when the [igh-voltage three-phase kilowatt-hour meter became available it was used to measure the energy input to the battery charger after each range test The results derived from both methods on the same tests were all within 3 percent Some overcharge of the battery was usually required in order to assure that all battery cells were fully charged and that the pack was equalized The reported energy usage may be higher than would be experienced with normal vehicle field operation Indicated energy consumption as a function of vehicle speed is presented in figure 12 for the constant-speed tests and in table VII for the constant-speed and driving cycle tests
Braking Capability
Simplified braking capability tests were conducted according to the procedure outlined in appendix E of reference 1 in order to provide a preliminary evaluation of the vehicles braking capabilities The procedure also includes tests for handling which at ERDAs direction were not conducted on this vehicle
Straight-line stops - Six straight-line stops from 48 kilometers per hour (30 mph) were made three from each direction Stopping distance varied from 225 meters (74 ft) to 265 meters (87 ft) Six stops were also made from 69 kilometers per hour (43 mph) again three from each
12
direction Stopping distances varied from 396 meters (130 ft) to 451 meters (148 ft)
Stops on a curve - Three stops were made going into a 03-g curve from 69 kilometers per hour (43 mph) on dry pavement turning right and three stops were made on the same curve turning left No difficulties were encountered in stopping within the 36-meter (12-ft) lane The stopping distance varied from 301 meters (99 ft) to 384 meters (126 ft) The tests were repeated in a 02-g turn on wet pavement Again the vehicle stopped smoothly with no problems The stopping distances varied from 301 meters (99 ft) to 402 meters (132 ft)
Wet brake recovery - Three baseline stops were made from 48 kilometers per hour (30 mph) with dry brakes decelerating at 3 meters per second squared (10 ftsec 2 ) The average pedal force was 231 newtons (52 lbf) After the vehicle was driven through 015 meter (6 in) of water at 8 kilometers per hour (5 mph) for 2 minutes the tests were repeated The stopping distances and pedal force were essentially the same indicating that the brakes had recovered on the first stop
Parking brake - Tests were conducted to determine parking brake effectiveness The vehicle did not pass the parking brake test even after the brakes were adjusted and the tests repeated The parking brakes would not hold the vehicle on the 30-percent slope with the vehicle in either position on the grade when a force of 400 newtons (90 lbfi) was applied to the brake lever
COMPONENT PERFORMANCE AND EFFICIENCY
Battery Charger
The battery charger for the Volkswagen Transporter is an off-board charger made by VARTA It is a 380-volt 50-hertz three-phase AC charger with a peak current input of 30 amperes A thyrister bridge circuit controls the usage rate to maintain a constant average battery voltage Timer 1 is started when the charge is started and terminates the charge in approximately 12 hours In normal operation the charger takes about 14 hours with a 50-hertz supply to charge the battery With the 60-hertz supply available in the United States the charge time was reduced accordingly Timer 2 begins running only when the battery reaches the gassing voltage This timer can be set for zero to 4 hours Charging can be terminated by either timer depending on the condition of the battery and the users requirements Both timers are automatically restored to their starting positions upon completion of charge
13
Battery charger efficiency test data are presented in table VIIi and in figure 13 The indicated efficiencies of the charger as calculated from the readings on the industrial kilowatt-hour meter and the average values of charger output voltages and currents are generally slightly higher than the efficiencies that were calculated from wattmeter readings Which set of values is more nearly correct has not been determined However most readings are within 3 percent of each other Since the power efficiency is fairly constant over the entire time period the energy efficiency is approximately equal to the average of the power efficiencies
Slight changes in the applied voltage or slight variations in the battery voltage (due to temperature age etc) can adversely affect the charging current and the time required to attain full charge Consequently the amount of energy that is delivered to the battery is largely determined by the judgment of the operator During the track tests the battery was always purposely overcharged
Battery
Manufacturers data - The battery supplied with the Volkswagen Transporter vehicle was composed of twenty-four 6-volt VARTA L800V3 lead-acid batteries connected in series Each VARTA 6-volt battery is rated at 185 ampere-hours at the 5-hour discharge rate Characteristics supplied by the battery manufacturer are shown in table IX
The battery manufacturers discharge data are presented in figures 14 and 15 Discharge current and voltage are shown as a function of time in figure 14 The battery can deliver 37 amperes for 5 hours (185 Ah) or 350 amperes for 025 hour (875 Ab) At a discharge current of 37 amperes the cell voltage is 201 volts at a discharge current of 350 amperes the cell voltage drops to 177 volts
Specific power versus the specific energy available for the 6-volt battery is shown in figure 15 At a low specific power of 67 watts per kilogram the available energy is 0126 megajoule per kilogram (35 Whkg) At a higher specific power of 60 watts per kilogram the available energy decreases to 0054 megajoule per kilogram (15 Whkg)
Battery acceptance - Before the vehicle was road-tested the battery supplied by the vehicle manufacturer was tested for terminal integrity and battery capacity as specified in appendix E of reference 1
14
An electronic load bank was used to discharge the battery for the terminal test and the capacity check since the load bank was limited to a discharge voltage of 120 volts the Volkswagen Transporter battery pack was discharged in two subpacks each with a nominal voltage of 72 volts
The terminal integrity test (300 A) and the capacity check were performed during a single discharge The results of these tests are presented in figure 16 The capacity removed is plotted as a function of battery voltage for both the front 72-volt and rear 72-volt battery subpacks The froht battery subpack (fig 16(a)) was discharged at 300 amperes followed by a 72-ampere discharge to a voltage of 615 volts The rear battery subpack (fig 16(b)) was discharged at 300 amperes followed by a 36-ampere discharge to a voltage of 618 volts The average capacity removed from both subpacks was 163 ampere-hours As this is 88 percent of the rated capacity the battery was acceptable
The terminal temperature as measured by a thermocouple after the 300-ampere test varied from 30 C to 130 C above ambient The battery passed both tests
Battery performance at constant vehicle speed - During the track tests motor current and voltage were constantly monitored Presented in figures 17 to 19 are the battery current voltage and power respectively measured during the 40- 56- and 69- kilometer-per-hour (25- 35- and 43-mph) range tests The average battery current voltage and power during the first and last 25 percent of the vehicle range test are shown in table X Battery power decreased toward the end of the test probably because of the reduced power requirements as the temperature of the mechanical drive train components tires and associated lubricants increased during the test
General battery performance - Battery data for selected driving tests are shown in table XI The electrolyte specific gravities ranged from 1266 to 1280 for the fully charged battery and from 1130 to 1135 for the discharged battery The ampere-hour overcharge varied from 26 percent to 43 percent While the overcharge was necessary to equalize the cells and assure full charge for every cell it increased the total energy consumption A charge cycle that results in only a 10-percent overcharge is more desirable
The battery temperature had a tendency to increase from ambient at the start of the test to an average of 7 degrees Celsius (13 deg F) above ambient at the end of the test
15
Battery efficiency - One complete battery charge was analyzed to determine battery efficiency This charge followed the 69-kilometer-per-hour (43-mph) constant-speed test conducted on 52777
Battery charger output voltage current and power are presented in figure 20 as a function of time Total energy input to the battery during charging was 302 kilowatt-hours the energy removed during the test was 179 kilowatt-hours The battery energy efficiency is therefore 59 percent However as shown in table X the ampere-hour overcharge was 43 percent for this test Correcting for a more desirable overcharge of 10 percent reduces the battery charge energy to 232 kilowatt-hours-and increases the battery energy efficiency to 77 percent A similar analysis performed for the 40-kilometer-per-hour (25-mph) range test run on 6877 shows an uncorrected battery energy efficiency of 62 percent with a 35 percent overcharge and a corrected energy efficiency of 77 percent with a 10 percent overcharge
Controller
The Volkswagen Transporter controller is a DC chopper controller manufactured by Siemens AG It controls the electric motor power in accordance with the desired driving conditions The Siemens controller has a nominal rating of 144 volts and 321 amperes and weighs 50 kilograms (311 ibm) It is easily accessible through a small door located at the rear of the vehicle (fig 21) As this vehicle is powered by a separately excited shunt-wound DC motor the controller consists of both an armature current control capable of handling armature currents of up to 320 amperes and a transistorized field control current regulator In addition to maintaining the desired vehicle speed the controller provides the following features
1 If either the motor or controller overheats the amount of power supplied to the motor is reduced
2 If the battery voltage drops to a specified minimum value the battery current is reduced
3 If the battery voltage exceeds a specified limit during deceleration regenerative braking is reduced
4 Overcurrent protection in the armature cuts off motor current
5 If any of the braking or driving control wires fail all motor power is automatically cut off
16
For speed regulation the Volkswagen Transporter has armature control up to 22 kilometers per hour (14 mph) it then employs field control to a maximum speed of about 70 kilometers per hour Figure 21 shows the controller installed in the rear of the vehicle
Motor
The Volkswagen Transporter vehicle is powered by a separately excited shunt-wound DC motor that was specially developed for the vehicle by Siemens AG The motor is designed to be easily serviced It is light in weight with a power-to-weight ratio of 0188 kilowatt per kilogram The motor is equipped with a forced-ventilation system in which a fan blows air in through the controller cooling fans and forces it axially through the motor The blower becomes operative when the ignition key is turned on It is powered by the main traction battery (144 V) characteristics are
The motor
Maximum continuous rating kW (hp) 16 (23)
Maximum peak rating kW 32
Maximum speed rpm 6700
Maximum torque at 2200 rpm N-m 160
Number of poles 4
VEHICLE RELIABILITY
No major problems were encountered that prevented completion of the tests although some minor problems occurred that delayed some tests These problems were mostly related to the controller On one occasion the 12-volt accessory battery was not being charged so the 12-volt charger module in the controller had to be repaired Another delay occurred when the vehicle would not operate over 22 kilometers per hour (14 mph) A malfunction in the field control circuit was limiting the vehicle speed Some transistors were defective and had to be replaced
Another problem was encountered when the battery was being recharged The charger operates at too high a current when charging a fully discharged battery As a result the battery overheated and would not cool down in time for the next scheduled test The problem was corrected by passing cool air from an air conditioner over the battery after the charge was finished in order to reduce the cooling time Other than these problems the Volkswagen proved to be reliable throughout the test period
17
DRIVER REACTION AND VEHICLE SERVICEABILITY
The vehicle was a comfortable easy-to-handle vehicle at all speeds Although it was seldom required the removal of the propulsion battery is easy and can be accomplished in less than 5 minutes The armature control field control logic components DC-to-DC converter and fuses are located in one unit on a slide-in tray that can be easily removed from the vehicle to simplify repairs
18
APPENDIX A
VEHICLE SUMMARY DATA SHEET
10 Vehicle manufacturer Volkswagen Werk AG Wolfsburg West Germany
20 Vehicle conversion of standard VW Transporter (type 2)
30 Price and availability on request
40 Vehicle weight and load
41 Curb weight kg (Ibm) 2268 (5000)
42- Gross vehicle weight kg (ibm) 3075 (6780)
43 Cargoweight kg(lbm) - 603 (1330)
44- Number-of passengers 3
45 Payload kg (ibm) 807 (1780)
50 Vehicle size 51 Wheelbase m (in) 242 (955)
52 Length m (ft) 444 (147)
53 Width m (ft) 175 (57)
54 Height m (in)
55 Head room m (in) 095 (375)
56 Leg room m (in) 066 (26) 257 Frontal area m (ft2)
58 Road clearance m (in) 59 Number of seats 2 (1 single 1 double)
60 Auxiliaries and options
61 Lights (nuhber type and function) 2 head 2 park and tail 2 brake 2 front parking turn signals
19
62 Windshield wipers 2 on front windshield 63 Windshield washers yes 64 Defroster gasoline-electric (from heater) 65 Heater gasoline-electric
66 Radio yes
67 Fuel gage
68 Amperemeter 69 Tachometer 610 Speedometer
611 Odometer
no
yes
no yes
yes in
in
kin
kmh
612 Right- or left-hand drive left 613 Transmission no 614 Regenerative braking yes
615 Mirrors 3 rearview 616 Power steering no 617 Power brakes no
618 Other
7 0 Battery 71 Propulsion battery
711 Type and manufacturer 6 V lead acid series connected VARTA Batterie AG
712 Number of modules 24 7 13 Total number of cells 72
714 Operatingvoltage V 144
715 Capacity Ah 180
716 Overallbattery size m (in) height 030 (118) width 0933 (367) length 1454 (572)
717 Weight kg (Ibm) 850 (1874) 718 History (age number of cycles etc)
72 Auxiliary battery 721 Type and manufacturer lead acid SLI VARTA
Batterie AG
722 Number of cells 6
20
7 2 3 Operating voltage V 12
7 24 Capacity Ah 36 7 25 Size in (in) height 0178 (7) width 0165 (65)
726 Weight kg(lbm) 204 (45)
8 0 Controller 81 Type and manufacturer DC chopper Siemens AG
82 Voltage rating V 144 82 Current rating A 320 8 4 Size m (in) height 024 (95) width 056 (220)
length 081 (320)
85 Weight kg (ibm) 50 (1102)
90 Propulsion motor 91 Type and manufacturer DC shunt wound Siemens AG
9 2 Insulation class IP R 24 93 Voltage rating V 130 94 Current rating A 150 (1-h rating) 95 Horsepower (rated) kW (hp) 16 (213) continuous (max peak
32 (426))
96 Size me(in) diameter 0364 (143) length 0454 (178) 97 Weight kg (Ibm) 87 (192) 98 Speed (rated) rpm 6700 (max 8370)
10 0 Battery charger 10 1 Manufacturer VARTA Batterie AG
10 2 Type off board 10 3 Input voltage required V 380 AC (3 phase) 104 Peak current demand A 30 105 Recharge time h 12
21
106 Size me(in) height 0864 (340) width 0406 (160)
length 0559 (220)
107 Weight kg abm) 108 Automatic turnoff feature- timer
110 Body 111 Manufacturer and type Volkswagen Transporter (type 2)
11 2 Materials steel
11 3 Number of doors and type 2 regular 2 sliding
114 Number of windows and type 7 plus windshield glass
11 5 Number of seats and type 1 bucket 1 double bucket
11 6 Cargo space volume m3 (ft3 ) 53 (1872)
11 7 Cargo space dimensions m (in) 280x154x123 (102x606x484)
12 0 Chassis
121 Frame
12 11 Type and manufacturer Volkswagen Transporter (type 2)
121 2 Materials steel
1213 Modifications battery compartment under cargo area
122 Springs and shocks 12 21 Type andmanufacturer not specified
12 2 2 Modifications none 12 3 Axles
12 31 Manufacturer not specified
123 2 Front
123 3 Rear
124 Transmission 1241 Type andmanufacturer none
22
1242 Gear ratios
1243 Driveline ratioshy
125 Steering 12 5 1 Type and manufacturer
1252 Turning ratio
1253 Turning diameter m (it) 119 (39)
126 Brakes 1261 Front disk
1262 Rear drum
12 63 Parking mechanical on rear wheels
1264 Regenerative yes
12 7 Tires
127 1 Manufacturer and type steel-belted radial
12 72 Size 185R14
1273 Pressure kPa (psi) Front 271 (45)
Rear 319 (53)
1274 Rolling radius m (in) 0316 (1245)
1275 Wheel weight kg (Ibm) Without drum
With drum 1276 Wheel track m (in)
Front
Rear
130 Performance
131 Manufacturer-specified maximum speed (wide-open throttle) kmh (mph) 708 (44)
132 Manufacturer-recommended maximum cruise speed (wide-open throttle)
kmh (mph)
133 Tested atcruise speed kmh (mph) 69 (43) 56 (35) 40 (25)
23
APPENDIX B
DESCRIPTION OF VEHICLE TEST TRACK
All the tests were conducted at the Transportation Research Center (TRC) of Ohio (fig B-1) This facility was built by the State of Ohio and is now operated by a contractor and supported by the state It is located 72 kilometers (45 miles) northwest of Columbus along US route 33 near East Liberty Ohio
The test track is a 12-kilometer (75-mile) continuous loop 16 kilometers (1 mile) wide and 56 kilometers (35 miles) long Three concrete lanes 11 meters (36 ft) wide in the straightaways and 13 meters (42 ft) wide in the curves make up the high-speed test area The lanes were designed for speeds of 129 177 and 225 kilometers per hour (80 110 and 140 mph) with zero lateral acceleration in the curves The 3-kilometer- (188-mile-) long straightaways are connected to the constant 731-meter- (2400-ft-) radius curves by a short variable-radius transition section Adjacent to the inside concrete lane is a 366-metershy(12-ft-) wide asphalt berm This berm is only banked slightly to provide a drainage slope An additional asphalt lane 366 meters (12 ft) wide is located adjacent to the outside lane on the straightaways The constant-speed and cycle tests were conducted on the inside asphalt lane because all tests were at relatively low speeds The acceleration and coast-down tests were conducted on the straight outside asphalt lanes because these were more alike than the two iside asphalt lanes and because it was the portion of the track least likely to encounter traffic interference The track has a constant 0228 percent north-to-south downslope The TRC complex also has a 20-hectare (50-acre) vehicle dynamics area and a 2740-metershy(9000-ft-) long skid pad for the conduct of braking and handling tests
24
APPENDIX C
VEHICLE PREPARATION AND TEST PROCEDURE
Vehicle Preparation
When the vehicle arrived at the test track a number of checks were made to assure that it was ready for performance tests These checks were recorded on a vehicle preparation check sheet such as the one shown in figure C-i The vehicle was examined for physical damage when it was removed from the transport truck and before it was accepted from the shipper Before the vehicle was operated a complete visual check was made of the entire vehicle including wiring batteries motor and controller The vehicle was weighed and compared with the manufacturers specified curb weight The gross vehicle weight (GVW) was determined from the vehicle sticker GVW If the manufacturer did not recommend a GVW it was determined by adding 68 kilograms (150 lbm) per passenger plus any payload weight to the vehicle curb weight
The wheel alignment was checked compared and corrected to the manufacturers recommended alignment values The battery was charged and specific gravities taken to determine if the batteries were equalized If not an equalizing charge was applied to the batteries The integrity of the internal interconnections and the battery terminals was checked by drawing either 300 amperes or the vehicle manufacturers maximum allowed current load from the battery through a load bank for 5 minutes If the temperature of the battery terminals or interconnections rose more than 60 degrees Celsius above ambient the test was terminated and the terminal was cleaned or the battery replaced The batteries were then recharged and a battery capacity check was made The battery was discharged in accordance with the battery manufacturers recommendations To pass this test the capacity must be within 20 percent of the manufacturers published capacity at the published rate
The vehicle manufacturer was contacted for his recommendations concerning the maximum speed of the vehicle tire pressures and procedures for driving the vehicle The vehicle was photographed head-on with a 270-millimeter telephoto lens from a distance of about 305 meters (100 ft) in order to determine the frontal area
Test Procedure
Each day before a test a test checklist was used Two samples of these checklists are shown in figure C-2
25
The first item under driver instructions on the test checklist is to complete the pretest checklist (fig C-3)
Data taken before during and after each test were entered on the vehicle data sheet (fig C-4) These data include
(1) Average specific gravity of the battery
(2) Tire pressures
(3) Fifth-wheel tire pressure
(4) Test weight of the vehicle
(5) Weather information
(6) Battery temperatures
(7) Time the test was started
(8) Time the test was stopped
(9) Ampere-hours out of the battery
(10) Fifth-wheel distance count
(11) Odometer readings before and after the tests
The battery charge data taken during the charge cycle were also recorded on this data sheet These data include the average specific gravity of the battery after the test the kilowatt-hours and ampere-hours put into the battery during the charge and the total time of the charge
To prepare for a test the specific gravities were first measured for each cell and recorded The tire pressures were measured and the vehicle was weighed The weight was brought up to the GVW by adding sandbags The instrumentation was connected and power from the instrumentation battery was applied All instruments were turned on and warmed up The vehicle was towed to the starting point on the track The fifth-wheel distance counter and ampere-hour integrator counter were reset to zero The test was started and was carried out in accordance with the test checklist When the test was terminated the vehicle was brought to a stop and the post-test checks were made in accordance with the post-test checklist (fig C-5) The driver recorded on the vehicle data sheet the time the odometer reading the ampere-hour integrator reading and the fifth-wheel distance reading
26
At the end of the test weather data were recorded on the vehicle data sheet All instrumentation power was turned off the instrumentation battery was disconnected and the fifth wheel was raised The vehicle was then towed back to the garagethe post-test specific gravities measured for all cells and the vehicle was placed on charge
After the test the engineer conducting the test completed a test summary sheet (fig C-6) This data sheet provides a brief summary of the pertinent information received from the test Another data sheet the engineers data sheet (fig C-7) was also filled out This data sheet summarizes the engineers evaluation of the test and provides a record of problems malfunctions changes to instrumentation etc that occurred during the test
Weather data - Wind velocity and direction and ambient temperature were measured at the beginning and at the end of each test These data were obtained from the control tower which was located in the center of the test track The wind anemometer was located about 18 meters (6 ft) from the ground near the southern straight section of the track The ambient temperature readings were taken at the instrumentation trailer near the west curve of the track During most of the test period the winds were under 11 kilometers per hour (7 mph)
Determination of maximum speed - The maximum speed of the vehicle was determined in the following manner The vehicle was fully charged and loaded to gross vehicle weight After one warmup lap the vehicle was driven at wide-open throttle for three laps around the track The minimum speed for each lap was recorded and the average was calculated This average was called the vehicle maximum speed This speed takes into account track variability and maximum vehicle loading This quantity was then reduced by 5 percent and called the recommended maximum cruise test speed
Cycle timer - The cycle timer (fig C-8) was designed to assist the vehicle driver in accurately driving SAE schedules B C and D The required test profile is permanently stored on a programmable read-only memory (PROM) which is the heart of the instrument This profile is continuously reproduced on one needle of a dual-movement analog meter shown in the figure The second needle is connected to the output of the fifth wheel and the driver matches needles to accurately drive the required schedule
One second before each speed transition (eg acceleration to cruise or cruise to coast) an audio signal
27
sounds to forewarn the driver of a change A longer duration audio signal sounds after the idle period to emphasize the start of a new cycle The total number of test cycles driven is stored in a counter and can be displayed at any time with a pushbutton (to conserve power)
28
REFERENCES
1 Sargent Noel B Maslowski Edward A Soltis Richard F and Schuh Richard M Baseline Tests of the C H Waterman DAF Electric Passenger Vehicle NASA TM-73757 1977
2 Society of Automotive Engineers Inc Electric Vehicle Test Procedure - SAE J227a Feb 1976
29
9P IR1 - SLZ24UU OF TEST RESLTS FOR O3LX iAV J TRANSFOER
(a) SI units
Test date Test condition (constant speed
Wind velocity
1btr ature
Range km
Cycle life
Capacity out of
apacity into
Eergy into
Indicated energy
kiVh or drmivng schedule)
h oC nttelr of cycles
batterie Ah
batteres Ah
charger M
cnswrpticn MJim
51177 402 8 19 1102 - 1563 208 9 --- -
52477 40 2 8 27 1247 - 1622 213 5 1422 114
6177 a4 02 3 2 - 145 23 1167 - 163 3 2205 -- -shy
6877 402 64 - 129 16 118 7 - 162 5 2196 j51 132
51277 563 96 23 890 - 147 3 201 2 - -shy
53177 563 129 - 161 23 851 -- 1315 1856 123 8 145
51677 69 2 8 25 571 3--18 175 3 ---- -shy
52377 692 48 22 607 --- - 1004 1 66
52777 692 48 22 71 8 - 132 0 1888 -
52677 Bo 8 22 71 1 197 162 7 2006 1303 1 83
6777 Bc 8 - 16 1 14 645 193 154 8 2016 b140 7 2 17
51777 Bd
96 27 685 179 1638 2155 - - -shy
51877 Bd
8 29 758 215 1704 -- 1443 195 6977 3d 129 - 16 1 13 705 207 165 6 230 3 b1616 228 6277 do 113 19 481 81 1357 170 0 - - -
6377 Cc 8 14 463 78 122 5 1913 1080 233
52077 Cd
3 2 27 467 75 1278 -- -- -
52577 Cd 113 25 48 4 78 132 2 1682 112 7 2 33
(b) U S cuesfaxy units
Test date Test onditon (cstant speed HPh o driving
schedule)
wind veocity
nph
Taper-attre
OF
Rangenles
Cycle life
nmtder of cycles
Capacity out of
batters Ah
Capacity into
battene Ah
Energyinto
charger JAn
Indicated energy
conslpt Jlnle
51177 25 5 66 68 5 - 1563 208 9 - -shy
52477 25 5 81 775 - 1622 2135 395 0 51
6177 a25 2 - 9 73 725 - 163 3 2205 -- -6877 25 4 - 8 60 738 - 1625 219 5 b431 59
51277 35 6 74 55 3 - 147 3 2016 - -shy
53177 35 8 - 10 74 629 - 131 5 185 6 34 4 65
51677 43 5 77 355 - 1118 1753 - -
52377 43 3 72 377 - - -- 279 74 52777 43 3 71 44 6 -- 1320 188 8 - -
52677 BF 5 71 442 197 1627 2006 362 82
6777 Bc
5- 10 58 401 193 1548 2016 b391 97
51777 Bd 6 81 425 179 1638 2155 - -
51877 Bd 5 84 471 215 1704 - 401 87
6977
6277 Bd
Cc
8 - 10 7
56 66
438 299
207 81
1656 1357
2303 1700
b449 --
102 -
6377 Cc
5 57 288 78 1225 1913 300 104
52077 Cd 2 80 290 75 1278 - - _
52577 C 7 77 301 78 1322 168 2 313 104
aspeed controlled wth potentaometer
brad th industrial kaltwat-hour iter
WJthnutregenerative braking6 With regererative braking
ORIGINAL PAGE IS OF POOR QUALITY
30
TABLE I - ACCELERATION TIMES FOR TABLE III - ACCELERATION CHARACTERISTICS FOR VOLKSWAGEN
VOLKSWAGEN TRANSPORTER TRANSPORTER
Vehicle speed Amount of discharge percent Vehicle speed Amount of discharge percent
kmh mph 0 40 80 kmh mph 0 40 80
Tame to reach designated Acceleration vehile speed s ms 2
ms2mphs mphs ms 2 mphs 0 0 0 0 0 20 12 8 6 6 0 0 0 0 0 0 0 0 40 25 13 11 11 20 12 9 19 11 24 11 24 60 37 18 16 15 40 25 11 25 12 27 13 30 80 50 22 19 20 60 37 14 30 15 33 13 29
100 62 26 22 23 80 50 14 31 17 38 14 32 120 75 30 27 27 100 62 13 29 14 31 15 34 140 87 34 31 31 120 75 13 30 13 30 14 31 160 99 38 35 35 140 87 16 35 14 31 15 33 180 112 41 39 39 160 99 17 37 14 31 14 31 200 124 45 42 44 180 112 16 35 15 33 13 28 220 137 49 45 46 200 124 15 33 18 40 16 37 240 149 54 5 0 50 220 137 13 28 16 35 17 38 260 162 59 56 55 240 149 11 25 10 24 12 27 280 174 63 62 60 260 162 13 28 10 22 11 25 300 187 68 68 6 7 280 174 13 29 9 20 10 22 320 199 75 75 74 300 187 9 21 8 9 8 18 340 211 80 82 81 320 199 9 21 8 18 8 17 360 224 89 92 88 340 211 9 20 7 15 8 18 380 236 95 101 97 360 224 8 17 6 14 7 17 400 249 103 107 107 380 236 8 17 8 17 6 14 420 261 113 119 116 400 249 6 14 7 15 6 13 440 274 123 128 127 420 261 6 13 6 12 6 12 460 286 133 136 137 440 274 5 12 7 15 5 12 480 298 145 150 149 460 286 5 11 5 12 5 11 500 311 158 162 164 480 298 4 10 4 9 4 9 520 323 172 172 178 500 311 | 9 5 11 4 9 540 336 187 183 194 520 323 9 5 12 4 8
560 348 203 200 212 540 336 8 4 9 3 7 580 361 221 219 232 560 348 3 7 3 7 3 7 600 373 241 243 257 580 361 3 6 3 6 3 6 620 385 266 265 282 600 373 3 6 2 5 2 5 640 398 293 289 313 620 385 2 5 5 2 4
660 410 318 322 346 640 398 2 5 4 2 4 680 423 ---- 356 383 660 410 2 5 4 2 4
--680 423 4 1 3
TABLE IV - GRADEABILITY OF VOLKSWAGEN
TRANSPORTER
Vehicle speed Amount of discharge percent
kmh mph 0 40 80
Gradeabillty percent
0 0 0 0 0 20 12 88 109 109 40 25 115 124 140 60 37 141 155 134 80 50 144 176 147
100 62 134 146 158 120 75 137 137 147 140 87 161 141 152 160 99 172 143 142 180 112 162 153 129 200 124 151 186 170 220 137 130 163 176
240 149 115 110 126 260 162 131 100 115 280 174 135 90 100 300 187 96 87 83 320 199 97 83 79 340 211 91 69 81 360 224 77 62 75 380 236 80 78 63 400 249 65 69 59 420 261 59 57 57 440 274 56 69 55
460 286 51 55 51 480 298 46 43 42 500 311 43 53 40 520 323 39 55 38 540 336 36 42 34 560 348 34 32 31
580 361 30 27 26 600 373 26 25 23 620 385 22 25 20 640 398 22 20 18
660 410 2 17 16 680 423 ---- 17 15
32
TABLE V - ROAD ENERGY CONSUMPTION FOR VOLKSWAGEN TRANSPORTER
(a) With rear axle connected (b) With rear axle disconnected
Vehicle speed Road energy consumed Vehicle speed Road energy consumed
kmh mph MJkm kWhmile kmh mph MJkm kWhmile
680 423 0 0 720 447 0 0 660 410 81 36 700 435 62 28 640 398 84 38 680 423 59 26 620 385 90 40 660 410 57 25 600 373 80 36 640 398 56 25 580 360 72 32 620 385 57 26 560 348 74 33 600 373 47 21 540 336 82 37 580 360 43 19 520 323 81 36 560 348 52 23 500 311 72 32 540 336 54 24 480 298 70 31 520 323 55 25 460 286 72 32 500 311 56 25 440 273 74 33 480 298 54 24 420 261 70 31 460 286 46 20 400 249 67 30 440 273 44 20 380 236 67 30 420 261 48 21 360 224 68 30 400 249 43 19 340 211 65 29 380 236 34 15 320 199 64 28 360 224 37 17 300 186 62 28 340 211 41 18 280 174 57 26 320 199 41 19 260 162 55 24 300 186 41 18 240 149 55 24 280 174 34 15 220 137 55 24 260 162 30 18 200 124 54 24 240 149 30 13 180 112 52 28 220 137 32 14 160 99 45 20 200 124 35 16 140 87 42 19 180 112 34 15 120 75 43 19 160 99 30 13 100 62 43 19 140 87 31 14 80 50 40 18 120 75 30 13 60 37 38 17 100 62 29 13 40 25 36 16 80 40 31 14 20 12 39 18 60 37 31 14
40 25 29 13 20 12 29 13
OIGVIAL PAGE IS
OF POOR QUALITY33
TABLE VI - ROAD POWER REQUIREMENTS OF VOLKSWAGEN TRANSPORTER
(a) With rear axle connected (b) With rear axle disconnected
Vehicle speed Rzoad power required Vehicle speed Road power required
kmh mph kW hp kmh mph kW hp
680 423 0 0 720 447 0 0
660 410 148 199 700 435 120 161
640 398 150 201 680 423 111 149
620 385 155 207 660 410 104 139
600 373 134 180 640 398 100 134 620 385 101 136580 360 117 156
560 348 114 153 600 373 78 105 580 360 69 93540 336 123 165
157 560 348 81 109520 323 117 134 540 336 82 109500 316 109
480 298 94 125 520 323 80 107
460 286 92 123 500 311 77 104
440 273 80 121 480 298 72 96
420 261 82 109 460 286 58 78
400 249 74 99 440 273 54 73 380 236 70 94 420 261 56 75 360 224 68 91 400 249 48 64
340 211 61 82 380 236 36 48 320 199 57 76 360 224 37 50 300 186 52 70 340 211 39 52 280 174 44 60 320 199 37 49 260 162 40 53 300 186 34 46
240 149 36 49 280 174 27 36 220 137 33 45 260 162 21 29 200 124 30 40 240 149 20 27 180 112 26 35 220 137 19 26 160 99 20 27 200 124 19 26 140 87 16 22 180 112 17 22 120 75 14 19 160 99 13 18 100 62 12 16 140 87 12 16 80 50 9 12 120 75 10 13 60 37 6 8 100 62 8 11 40 25 4 5 80 50 7 9 20 12 2 3 60 37 5 7
40 25 3 4 2 220 12
34
TABLE VII - INDICATED ENERGY CONSUMPTION FOR
VOLKSWAGEN TRANSPORTER
Test condition Indicated energy consumption (constant speed or driving schedule) MJkm kWhmile
kmh mph
402 25 114 051
563 35 145 65
692 43 166 74
Ba 200 95
Eb 211- 89 Ca 233 104
Cb 233 104
aWth regenerative braking
bwithout regenerative braking
ORIGNAL PAGE IS OF POOR QUALITY
35
TABLE VIII - CHARGER EFFICIENCY TEST DATA FOR VOLKSWAGEN TRANSPORTER
Time Input power from kilowatt-hour meter
Pin
kW
Output power calculated from
Vav x 1 av P out kW
Energy efficiency percent
Input power from watt-meter PIn kW
Output power from watt-meter Pout
kW
Power efficiency percent
Deviation percent
645 am 363 296 815 330 260 788 33 745 353 291 824 316 256 810 17 845 341 267 783 323 252 780 4 945
1045 339
327 279
275
823
841
310
310
254
245
819
790
5
60 1145 313 268 856 294 239 813 50 1245 pm 298 252 846 280 225 804 49 145 280 238 850 244 207 848 2 245 252 215 853 224 186 833 23 345 229 199 869 200 171 853 18 445 227 196 863 197 165 838 29 545 227 193 850 186 162 869 22 645 234 202 863 201 172 857 7
TABLE IX - CHARACTERISTICS OF VARTA LB0OV3
BATTERY MODULES USED IN VW TRANSPORTER
Length cm (in) 24 (94)
Width cm (in) 19 (75)
Height cm (in) 27 (106)
Weight kg (ibm) 30 (66)
TABLE X - AVERAGE BATTERY PERFORMANCE DURING CONSTANT-SPEED TESTS OF
VOLKSWAGEN TRANSPORTER
Test speed Initial 25 percent of test Final 25 percent of test
kmh mph Current Voltage Power Current Voltage Power A V kW A V kW
40 25 56 147 82 58 130 77
56 35 87 144 124 90 123 116
69 43 138 141 194 122 120 159
TABLE XI - VOLKSWAGEN TRANSPORTER BATTERY VEHICLE TEST DATA
Test condition Test date Battery capacity Overcharge Electrolyte Average battery (constant speed or Ah percent specific gravity temperature 0 C driving schedule)
eIput Output Before After Before After
kmh mph test test test test
69 45 52777 189 132 43 1266 1135 32 38
56 35 53177 185 132 40 1272 1130 24 30
C 6277 170 135 26 1278 1135 32 41
Z0 [ 25 6877 220 163 35 1270 1130 33 32 B 6977 230 166 1 9 1280 1o30 32 35
ORIGINAL PAGE IS OF POOR QUALITY
37
~C-17-ISI2
Figure 1 - Volkswagen Transporter electric delivery van
Figure a - Side view of VW Transporter showing special fixture for removal of battery pack
38 ORIGIAL rAGE IS OF pOOR QUALITY
Battery current 250 A160 mV
Battery to
voltage 144V -
Z Transistor Motor control armature
Motor field
Figure 3 - Wiring diagram of VW Transporter showing instrumentation locations
V
1tJ
-- ta -- -tcr tb -ti -
TIME s
S -TEST PARAMETER SAEO SCHEDULES
MAX SPEED V mph 20 30 45 ACCEL tiME ta s 19 18 28 CRUISETIME tcr 19 20 50 COASTTIME tco 4 8 10 BRAKETIME t 5 9 9 IDLEIME ti 25 25 25
Figure - SAE J227a driving cycle schedules
39
VEHICLE PERFORMANCE V W TRRNSPURTER
9322F
2X
80
90 KM
Figure 5 -shy ag tcnsatsed
0 10 20
0 1Fo
30 HO pound0 KMH 30
GO 7
Lib
no0 90
ampo 6
100
b2 I
w
XO
EO
90 30
ICHajRg4
-
-VEHICLE SPEED
FigureS -Rangeat constantspe
VEIH ICLE PERFIJRMRNCE DATE RECDR5ED V N TANSEJRTERdUNE I01977
5L
HE SB
- 72
tagre-ni 32celraton
200
-WX0 DISCIHRGE
X-q0X DIaCHRRSM
-BOX oS-RVEH ICLE PERFJRMRNCE DTE RECRHDED IUNE lo 1977V WITRRNSPORTER
711 Hi l I I I I
ES
EE E5= 2S
3s
I L pound_x O
2R2 RH
HH Am x
1 22 32 3o EM 7 0g g2 2oTo I KMH
06 IS 20 30 qOe EBE2I1 MIPH
VEHICLE SPEED
Figure 7 - Acceleration as afunction of speed
0K DirCRRE X940X DISCHRR3E
-SOX DSC-M VEHICLE PERFfRHINCE DHTE RECURDED
V W TRRNSpFIRTER UNE mi1977
I I I I
24
HX ZJE X H ~a XX0
-I HXM H 0
w12j2-Nox 0 RH
LU x g~cn x
0 1E2 3 0 0S 70 0 9N 100 KNH
MPH VEHICLE SPEED
FIgure 8- Gradeability as afunction of speed
41 ORIGINAt pAE 18
qtuoo 2 TY
2
Ba81
9m1
04L171
2EHoa
0
=
LIIi 62
~ 2 2 0
40
0-0
12 IS
E1
a)With rear axle cannectedt
n0 I
testdate June 10 191
497
(a)With rear axle connected test date June 10 1977
Fr -e e a rVs na r 0 L
10
q0
0
0
HIP
2 0 60 2 0 120ilI qIlfI M9110200 TIMEt SECONDS
0)With rear axle disconnected test date June 21 1977
Figure 9 - Vehicle deceleration for Volkswagen Transporter
0
~ O -
10I202 H q 0E270E0El i0f10 KMHl
0 12 20 1 4 5 Ea 2 IN MPH
VEHICLE SPEED
9)) With rear axle disconnected test date June 21 1977
Figure 10 - Road energy as afunction of speed for Volkswagen Transporter
29 IJ
4
q - [I
0
Zq-4
1
Lo
L 12shy=0B=lz
rp a)With rear axle connected test date June 10 1977
It
C
DCC
-
-
B H- I[l
0 ItA
0~
2-shy
t
VEHICLE PERFORMHlNCE V W TRHNSPORIER
4 05 10 3 0 0 6 0 O 9 0 E0 03 5 o os 02
jc CIO Sl]10i 20] 30 1
MPHVEHICLE SPEED
a)With rear axle disconnected test date June 21 1977
Go 1332 0l 10]
Figure 12
21D 0 13 L ~l1NEb E05
MPHVEHICLE PEED
- Energy consumptin as a function of speed
I~E
Figure 11 - Road power as a function of speed for Volkswagen Transporter
0 Method L Iav x Vav o Method Z Wattmeter
oO o o 0
0 0
10 15 20
OUTPUT CURRENT A
Figure 13 -Battery charger effhciency as a function of output current for Volkswagen IjJN Transporter
10 15t 600H
2P0
C20
15 8C
4-Pm N 4 111
2 i-
Idoli2 0 W10- i 1I
DISCHARGE CURRENT A SPECIFIC ENERGY MNikg
Figure 14 - Discharge characterishcsof Figure 15 - Energylpower relation-VARTA L800V3 battery ship for VARTA L80OV3 three-cell
battery
44
80 I CURRENT
A 1270
0
gt (a)Front subpack
go
70O3
0 20 40 60 80 100 120 140 160 180
CAPACITY REMOVED Ah
1)Rear subpack
Figure 16 - Battery qualification test data for VARTA L80OV3
alt 2 oDs c E COMP ONENT PERFIRM NCE X gt 7S DISCI~i-bRGE V W TRHBNPORER_ DATE RECORDED
Y -dUN Bi 1377
ISO
120shy
2EE
I0 20B 39 50 50 70 00 90 100W KMH20 30 q 752 go SO ampE0 I
MPH VEHICLE SPEED
- Current as afunction of speedFigure 17
orIampVAL ppB Ir4Of-- PO YL 45
o- lt2cg 015iCHR Z COMPONENT PERFRMRNCE V N TRRNSPRTER DHTE RECORDED
MHY II-dUN 8 1977
lEOtimes
Iq
120x
I100
40
0 0 -
U 10 20 3 40 ll EO 70 80 90 10KKH EbI
I 2 A I pound
$PH VEHICLE SPEED
Figure 18 - Voltage as a function of speed
COMIPONENT FERFORI4RNE V N TRRNSPORTER DRTE RECORDED
X- gt 2 r 01 1IM
NAY ll-dUN O 1977
IEK
K
O 9 0 3 L10 amp0 60EZ70 00 9-0 100
0 1 20 JE gg IG 2
MPH VEHICLE SPEED
Figure 19 - Power as afunction of speed
46
Figure 21 - Controller installed in Volkswagen Transporter
r0 730 km R (045 mile)
S 56km 16km Ile O) (15 miles) (10 mile)
30 km O8 - Weather station and miles)
0223 Traffic entry and exit 0
control tower
Percent slope
t 022 Percentslope
I Traff icdirection
Figure B-1 - Characteristics of Transportation Research Center Test Track East Libety Ohio
48
COMPONENT PERFORMANCE DATE RECOED
V WTRANSPORTER R 271 1977
VOLTAGE
173 3
(a)Voltage and current
i Z 3 4I SS S 7 S 35 1n1 11 17 13 1 4 IE 17 1i TIME h
0) Power
Figure 20 - Battery charger output voltage current and power
ORIGINAL PAQIl1 or PooR QUAVIW
47
- PAGE OF POOR QUALITy
1 Vehicle L Date received 3Checked for damage - date amp Wheel alignment - date 5 Battery checked and equalized - date 6 Curb weight determined Ibm Date
7 Gross vehicle weight Ibm 8 31)-Ampere test -date 9 Manufacturers recommendationsamp
Maximum speed mph
Tire pressures psi Front _ Rear Driving procedures
Figure C-1 - Vehicle preparation check sheet
Vehicle mph range test _ _ gear
Driver Instructions 1 Complete pretest checklist 2 While on track rechecL
Integrator - light on in operate position zeroed Speedometer - set on mph center Distance - on reset lighted Attenuator - on reset lighted
3 At signal from control center accelerate moderately to _ mph
4 Maintain _+I mph with minimal accelerator movement 5 When vehicle is no longer able to maintain _ mph brake moderately to full stop
6 Complete post-test checklistand other documentation
Recrdfint 1 Set oscillograph zeros at Channel Zero In
3 30 4 45 6 50
10 75 12 11 13 12 14 20
2 Record all channels on magnetic tape Check inputs at beginning of test to verify recording
3 Run cals on all channels
4 Remove all channels from oscillograph except 3and4 5 Start recording 15 sbefore start of test at oscillograph speed of 01 inis and tape speed
of ins
6 After 15 min Into test connect channels 6 10 12 13 and 14 to oscillograph and record aburst at 100 Inds while vehicle is in chopper mode
7Remove channels 610 12 13 and 14 from oscillograph and continue test at 01 Inrs with channels 3and 4only
amp Document all ambient conditions at beginning once every hour and at the end of the test Items recorded shall Include temperature wind speed and direction significant wind gusts and corrected barometric pressure
(al Constant-speed test
Figure C-2 - Test checklists 49
Vehicle cycle test _gear 1 Record specific gravity readings after removing vehicle from charge and disconnect charger Instrumentation Fill In charge data portion of data sheet from previous
Driver Instructions test Add water to batteries as necessary recording amount added Check and reshy1 Complete pretest checklist cord 5th wheel tire pressure and vehicle tire pressure
2 While an track recheck 2 Connect (Connect alligator clips to Instrumentation battery last) Integrator - light on in operate position zeroed (a)Inverter to instrument battery Speedometer - set on _ mph center (b)Integrator input lead Distance - on reset lighted ic)Integrator power to Inverter Attenuator - on reset selector on 100 ad)Starred () 5th wheel jumper cable Cycle timer - verify scheduled timing with stop watch t) Cycle timer power and speed signal Input cables Check times
3 At signal from control center perform cycle test using cycle timer as basis for deter- it) Spin up and calibrate 5th wheel mining length of each phase of performance cycle Use programmed stop watch as 3 Record test weight - Includes driver and ballast with 5th wheel raised backup device Cycle consists of
Accelerate to _ mph in _ s 4 Turn on
s(a) Inverter motor speed sensor thermocouple reference junctions integratorCruIse at _ mph for sr and digital voltmeter Set integrator on Operate Ln Coast for s O)Ffth wheel readout and switching Interface units (2) (Selectdistancefor exshy0 Brake to complete stop in _ s panded scale range I
Hold in stop position for __ s 5 Tow vehicle onto track with 5th wheel raised Repeat entire cycle until vehicle Is unable to meet acceleration time Moderately brake Precallbrations to acomplete stop Tape data system
Oscillograph4 Complete post-test checklist and other documentation Reset Recording 5th wheel distance 1 Record all channels on magnetic tape at Ins Check al channels to verify Ampere-hour meter
input at beginning of test Thermocouple readout switches on Record Turn on thermocouple reference junctions
2 Record speed and distance on osclllograph at mIns Lower 5th wheel Set hub loading
3 Start recordingdata 15 s before beginning test 6 Be sure data sheet is properly filled out to this point Check watch time with control 4 Document ambient conditions atbeginning once every hour and at the end of the test 6owerw
Items recorded shall include temperature wind speed and direction significant windgusts and corrected barometric pressure 7 Proceed with test
N3)Driving cycle test Figure C-3 - Pretest checklist
Figure C-2 - Concluded
Vehicle Battery system Test Date Track data Driwer Navigator Average pretest specific gravity Open-ircuit voltage V Tire pressure before test psi
Right front _ Left front _Right rear Left rear__ Tire pressure after test psh
Rightfront__ Left front Right rear Left rear Fifth-wheel pressure psi (calibrat __ psi) Weather Initial Duringtest Final
Temperature OF Wind speed mph -- --__ Wind direction Pressure in Hg
Battery temperature OF Before After Mttr temperature O Before After
Time Start StopOdometer reading miles Start___ Stop__ Current out Al __ Current in (regenerativel Ah __ Fifth wheel
Basis for termination ottests
Charge data Average post-test specific gravity Open-circuit voltage V Charger used Charger Input voltage V Battery temperature OF Beforecharge After charge Power kWh Start End Total Time Start _ End Total charge time min Current input Ah Average specific gravity after charge
Approval
Figure C-4 -Track and chargedata
1 Record time immediately at completion oftest Turn offkey switch
2 Complete track data sheet (a)Odometer stop b) Ampere-hour integrator (c) 5th wheel distance i) Read temperature (e)Calibrate data system Mf)Record veather data
3 Turn off Inverter thermocouple reference junctions
4 Disconnect 12-volt instrument battery red load
5 Raise 5th wheel
6 Tow vehicle off track
7 Start charge procedure (specific gravities)
8 Check specific gravity on Instrument battery If less than 12M0 remove from vehicle and charge to full capacity
9 Check water level in accessory batteries Add water as necessary
Figure C-5 - Post-test checklist
ORIGINAL PAG IS 01 POOR QUATTW
51
Vehicle Test Date
Test conditions Temperature OF _ Wind speed mph _ at
Barometer reading in Hg Other
Test results Test time h
Range miles
Cycles Current out of battery Ah
Current into battery Ah
Charge time h
Power into battery kWh
Magnetic tape
No _ Speed ints
Comments
FigureC-6 -Test summary sheet
Vehicle Test Date
Engineer Reason for test (checkout component check scheduled test etc I
Limitation on test (malfunction data system problem brake drag etc)
Changes to vehicle prior to test (repair change batteries etc )
Other comments
Evaluation of test Range miles
Current out Ah
Current in Ah
Power in kWh Energy consumption kWhimile
Was planned driving cycle followed
General comments
Figure C-7 - Engineers data sheet
52
Figure C-8 - Cycle timer
ORIGINAL PAGE Io OF POOR QUALIT
53
NATIONAL AERONAUTICS AND SPACE ADMINISTRATION WASHINGTON DC 20546 PQSTAqg AND FEES PAID
ANDAERONAUTICS OFFICIAL BUSINESS S~EA~NSRTO
NATIONAL PENALTY FOR PRIVATE USE $300 SPECIAL FOURTH-CLASS RATE SA
SPACE ADMINISTRATION L IBOOK A
IfUndeliverable (Section 158 POSTMASTER Postal Mnnual) Do Not Return

V
where
vehicle mass kg (ibm)
vehicle speed kmh (mph)
t time s
Vehicle coast-down tests were conducted both with and without the drive train (differential transmission and electric motor) connected to the wheels In normal operation the electric motor cannot be declutched (disconnected) from the wheels It was mechanically disconnected by disconnecting the drive shafts between the wheels and the differential The drive shafts were wired in place so they did not drag
With the drive shafts connectedr the vehicle was self-powered When they were disconnected it was necessary to tow the vehicle to speed before starting the coast-down tests
The coast-down data used to calculate road energy were averaged and plotted as vehicle deceleration versus vehicle speed in figure 9(a) with the drive shafts connected and in figure 9(b) with them disconnected Coast-down time increases significantly when the drive train is disconnected from the wheels
The results of the road energy calculations are shown in figure 10(a) and table V(a) for the vehicle with the drive train connected and in figure 10(a) and table V(b) with it disconnected
Road Power Requirements
The calculation of road power is analogous to the calculation of road energy It is a measure of the power needed to overcome vehicle aerodynamic and rolling resistance plus the power losses from the differential the drive shaft and a portion of the transmission The road power Pn required to propel a vehicle at various speeds is a-lso determined from the coast-down tests The following equations are used
V2 v 2
P 386xlO-W n- n kWn n nshy
ii
or
2 i -V2
V Pn= n608x1-5J W n-1 n hpn - tn-i
The results of road power calculations are shown in figure 11(a) and table VI(a) with the drive train connected to the wheels and in figure 11(b) and table VI(b) with it disconnected Both road energy and road power are significantly lower when the drive train is disconnected
Indicated Energy Consumption
The vehicle indicated energy consumption is defined as the energy required to recharge the battery after a test divided by the vehicle range achieved during the test where the energy is the input to the battery charger
Initially the indicated energy consumption was measured by using a wattmeter and integrating over the charge time Then when the [igh-voltage three-phase kilowatt-hour meter became available it was used to measure the energy input to the battery charger after each range test The results derived from both methods on the same tests were all within 3 percent Some overcharge of the battery was usually required in order to assure that all battery cells were fully charged and that the pack was equalized The reported energy usage may be higher than would be experienced with normal vehicle field operation Indicated energy consumption as a function of vehicle speed is presented in figure 12 for the constant-speed tests and in table VII for the constant-speed and driving cycle tests
Braking Capability
Simplified braking capability tests were conducted according to the procedure outlined in appendix E of reference 1 in order to provide a preliminary evaluation of the vehicles braking capabilities The procedure also includes tests for handling which at ERDAs direction were not conducted on this vehicle
Straight-line stops - Six straight-line stops from 48 kilometers per hour (30 mph) were made three from each direction Stopping distance varied from 225 meters (74 ft) to 265 meters (87 ft) Six stops were also made from 69 kilometers per hour (43 mph) again three from each
12
direction Stopping distances varied from 396 meters (130 ft) to 451 meters (148 ft)
Stops on a curve - Three stops were made going into a 03-g curve from 69 kilometers per hour (43 mph) on dry pavement turning right and three stops were made on the same curve turning left No difficulties were encountered in stopping within the 36-meter (12-ft) lane The stopping distance varied from 301 meters (99 ft) to 384 meters (126 ft) The tests were repeated in a 02-g turn on wet pavement Again the vehicle stopped smoothly with no problems The stopping distances varied from 301 meters (99 ft) to 402 meters (132 ft)
Wet brake recovery - Three baseline stops were made from 48 kilometers per hour (30 mph) with dry brakes decelerating at 3 meters per second squared (10 ftsec 2 ) The average pedal force was 231 newtons (52 lbf) After the vehicle was driven through 015 meter (6 in) of water at 8 kilometers per hour (5 mph) for 2 minutes the tests were repeated The stopping distances and pedal force were essentially the same indicating that the brakes had recovered on the first stop
Parking brake - Tests were conducted to determine parking brake effectiveness The vehicle did not pass the parking brake test even after the brakes were adjusted and the tests repeated The parking brakes would not hold the vehicle on the 30-percent slope with the vehicle in either position on the grade when a force of 400 newtons (90 lbfi) was applied to the brake lever
COMPONENT PERFORMANCE AND EFFICIENCY
Battery Charger
The battery charger for the Volkswagen Transporter is an off-board charger made by VARTA It is a 380-volt 50-hertz three-phase AC charger with a peak current input of 30 amperes A thyrister bridge circuit controls the usage rate to maintain a constant average battery voltage Timer 1 is started when the charge is started and terminates the charge in approximately 12 hours In normal operation the charger takes about 14 hours with a 50-hertz supply to charge the battery With the 60-hertz supply available in the United States the charge time was reduced accordingly Timer 2 begins running only when the battery reaches the gassing voltage This timer can be set for zero to 4 hours Charging can be terminated by either timer depending on the condition of the battery and the users requirements Both timers are automatically restored to their starting positions upon completion of charge
13
Battery charger efficiency test data are presented in table VIIi and in figure 13 The indicated efficiencies of the charger as calculated from the readings on the industrial kilowatt-hour meter and the average values of charger output voltages and currents are generally slightly higher than the efficiencies that were calculated from wattmeter readings Which set of values is more nearly correct has not been determined However most readings are within 3 percent of each other Since the power efficiency is fairly constant over the entire time period the energy efficiency is approximately equal to the average of the power efficiencies
Slight changes in the applied voltage or slight variations in the battery voltage (due to temperature age etc) can adversely affect the charging current and the time required to attain full charge Consequently the amount of energy that is delivered to the battery is largely determined by the judgment of the operator During the track tests the battery was always purposely overcharged
Battery
Manufacturers data - The battery supplied with the Volkswagen Transporter vehicle was composed of twenty-four 6-volt VARTA L800V3 lead-acid batteries connected in series Each VARTA 6-volt battery is rated at 185 ampere-hours at the 5-hour discharge rate Characteristics supplied by the battery manufacturer are shown in table IX
The battery manufacturers discharge data are presented in figures 14 and 15 Discharge current and voltage are shown as a function of time in figure 14 The battery can deliver 37 amperes for 5 hours (185 Ah) or 350 amperes for 025 hour (875 Ab) At a discharge current of 37 amperes the cell voltage is 201 volts at a discharge current of 350 amperes the cell voltage drops to 177 volts
Specific power versus the specific energy available for the 6-volt battery is shown in figure 15 At a low specific power of 67 watts per kilogram the available energy is 0126 megajoule per kilogram (35 Whkg) At a higher specific power of 60 watts per kilogram the available energy decreases to 0054 megajoule per kilogram (15 Whkg)
Battery acceptance - Before the vehicle was road-tested the battery supplied by the vehicle manufacturer was tested for terminal integrity and battery capacity as specified in appendix E of reference 1
14
An electronic load bank was used to discharge the battery for the terminal test and the capacity check since the load bank was limited to a discharge voltage of 120 volts the Volkswagen Transporter battery pack was discharged in two subpacks each with a nominal voltage of 72 volts
The terminal integrity test (300 A) and the capacity check were performed during a single discharge The results of these tests are presented in figure 16 The capacity removed is plotted as a function of battery voltage for both the front 72-volt and rear 72-volt battery subpacks The froht battery subpack (fig 16(a)) was discharged at 300 amperes followed by a 72-ampere discharge to a voltage of 615 volts The rear battery subpack (fig 16(b)) was discharged at 300 amperes followed by a 36-ampere discharge to a voltage of 618 volts The average capacity removed from both subpacks was 163 ampere-hours As this is 88 percent of the rated capacity the battery was acceptable
The terminal temperature as measured by a thermocouple after the 300-ampere test varied from 30 C to 130 C above ambient The battery passed both tests
Battery performance at constant vehicle speed - During the track tests motor current and voltage were constantly monitored Presented in figures 17 to 19 are the battery current voltage and power respectively measured during the 40- 56- and 69- kilometer-per-hour (25- 35- and 43-mph) range tests The average battery current voltage and power during the first and last 25 percent of the vehicle range test are shown in table X Battery power decreased toward the end of the test probably because of the reduced power requirements as the temperature of the mechanical drive train components tires and associated lubricants increased during the test
General battery performance - Battery data for selected driving tests are shown in table XI The electrolyte specific gravities ranged from 1266 to 1280 for the fully charged battery and from 1130 to 1135 for the discharged battery The ampere-hour overcharge varied from 26 percent to 43 percent While the overcharge was necessary to equalize the cells and assure full charge for every cell it increased the total energy consumption A charge cycle that results in only a 10-percent overcharge is more desirable
The battery temperature had a tendency to increase from ambient at the start of the test to an average of 7 degrees Celsius (13 deg F) above ambient at the end of the test
15
Battery efficiency - One complete battery charge was analyzed to determine battery efficiency This charge followed the 69-kilometer-per-hour (43-mph) constant-speed test conducted on 52777
Battery charger output voltage current and power are presented in figure 20 as a function of time Total energy input to the battery during charging was 302 kilowatt-hours the energy removed during the test was 179 kilowatt-hours The battery energy efficiency is therefore 59 percent However as shown in table X the ampere-hour overcharge was 43 percent for this test Correcting for a more desirable overcharge of 10 percent reduces the battery charge energy to 232 kilowatt-hours-and increases the battery energy efficiency to 77 percent A similar analysis performed for the 40-kilometer-per-hour (25-mph) range test run on 6877 shows an uncorrected battery energy efficiency of 62 percent with a 35 percent overcharge and a corrected energy efficiency of 77 percent with a 10 percent overcharge
Controller
The Volkswagen Transporter controller is a DC chopper controller manufactured by Siemens AG It controls the electric motor power in accordance with the desired driving conditions The Siemens controller has a nominal rating of 144 volts and 321 amperes and weighs 50 kilograms (311 ibm) It is easily accessible through a small door located at the rear of the vehicle (fig 21) As this vehicle is powered by a separately excited shunt-wound DC motor the controller consists of both an armature current control capable of handling armature currents of up to 320 amperes and a transistorized field control current regulator In addition to maintaining the desired vehicle speed the controller provides the following features
1 If either the motor or controller overheats the amount of power supplied to the motor is reduced
2 If the battery voltage drops to a specified minimum value the battery current is reduced
3 If the battery voltage exceeds a specified limit during deceleration regenerative braking is reduced
4 Overcurrent protection in the armature cuts off motor current
5 If any of the braking or driving control wires fail all motor power is automatically cut off
16
For speed regulation the Volkswagen Transporter has armature control up to 22 kilometers per hour (14 mph) it then employs field control to a maximum speed of about 70 kilometers per hour Figure 21 shows the controller installed in the rear of the vehicle
Motor
The Volkswagen Transporter vehicle is powered by a separately excited shunt-wound DC motor that was specially developed for the vehicle by Siemens AG The motor is designed to be easily serviced It is light in weight with a power-to-weight ratio of 0188 kilowatt per kilogram The motor is equipped with a forced-ventilation system in which a fan blows air in through the controller cooling fans and forces it axially through the motor The blower becomes operative when the ignition key is turned on It is powered by the main traction battery (144 V) characteristics are
The motor
Maximum continuous rating kW (hp) 16 (23)
Maximum peak rating kW 32
Maximum speed rpm 6700
Maximum torque at 2200 rpm N-m 160
Number of poles 4
VEHICLE RELIABILITY
No major problems were encountered that prevented completion of the tests although some minor problems occurred that delayed some tests These problems were mostly related to the controller On one occasion the 12-volt accessory battery was not being charged so the 12-volt charger module in the controller had to be repaired Another delay occurred when the vehicle would not operate over 22 kilometers per hour (14 mph) A malfunction in the field control circuit was limiting the vehicle speed Some transistors were defective and had to be replaced
Another problem was encountered when the battery was being recharged The charger operates at too high a current when charging a fully discharged battery As a result the battery overheated and would not cool down in time for the next scheduled test The problem was corrected by passing cool air from an air conditioner over the battery after the charge was finished in order to reduce the cooling time Other than these problems the Volkswagen proved to be reliable throughout the test period
17
DRIVER REACTION AND VEHICLE SERVICEABILITY
The vehicle was a comfortable easy-to-handle vehicle at all speeds Although it was seldom required the removal of the propulsion battery is easy and can be accomplished in less than 5 minutes The armature control field control logic components DC-to-DC converter and fuses are located in one unit on a slide-in tray that can be easily removed from the vehicle to simplify repairs
18
APPENDIX A
VEHICLE SUMMARY DATA SHEET
10 Vehicle manufacturer Volkswagen Werk AG Wolfsburg West Germany
20 Vehicle conversion of standard VW Transporter (type 2)
30 Price and availability on request
40 Vehicle weight and load
41 Curb weight kg (Ibm) 2268 (5000)
42- Gross vehicle weight kg (ibm) 3075 (6780)
43 Cargoweight kg(lbm) - 603 (1330)
44- Number-of passengers 3
45 Payload kg (ibm) 807 (1780)
50 Vehicle size 51 Wheelbase m (in) 242 (955)
52 Length m (ft) 444 (147)
53 Width m (ft) 175 (57)
54 Height m (in)
55 Head room m (in) 095 (375)
56 Leg room m (in) 066 (26) 257 Frontal area m (ft2)
58 Road clearance m (in) 59 Number of seats 2 (1 single 1 double)
60 Auxiliaries and options
61 Lights (nuhber type and function) 2 head 2 park and tail 2 brake 2 front parking turn signals
19
62 Windshield wipers 2 on front windshield 63 Windshield washers yes 64 Defroster gasoline-electric (from heater) 65 Heater gasoline-electric
66 Radio yes
67 Fuel gage
68 Amperemeter 69 Tachometer 610 Speedometer
611 Odometer
no
yes
no yes
yes in
in
kin
kmh
612 Right- or left-hand drive left 613 Transmission no 614 Regenerative braking yes
615 Mirrors 3 rearview 616 Power steering no 617 Power brakes no
618 Other
7 0 Battery 71 Propulsion battery
711 Type and manufacturer 6 V lead acid series connected VARTA Batterie AG
712 Number of modules 24 7 13 Total number of cells 72
714 Operatingvoltage V 144
715 Capacity Ah 180
716 Overallbattery size m (in) height 030 (118) width 0933 (367) length 1454 (572)
717 Weight kg (Ibm) 850 (1874) 718 History (age number of cycles etc)
72 Auxiliary battery 721 Type and manufacturer lead acid SLI VARTA
Batterie AG
722 Number of cells 6
20
7 2 3 Operating voltage V 12
7 24 Capacity Ah 36 7 25 Size in (in) height 0178 (7) width 0165 (65)
726 Weight kg(lbm) 204 (45)
8 0 Controller 81 Type and manufacturer DC chopper Siemens AG
82 Voltage rating V 144 82 Current rating A 320 8 4 Size m (in) height 024 (95) width 056 (220)
length 081 (320)
85 Weight kg (ibm) 50 (1102)
90 Propulsion motor 91 Type and manufacturer DC shunt wound Siemens AG
9 2 Insulation class IP R 24 93 Voltage rating V 130 94 Current rating A 150 (1-h rating) 95 Horsepower (rated) kW (hp) 16 (213) continuous (max peak
32 (426))
96 Size me(in) diameter 0364 (143) length 0454 (178) 97 Weight kg (Ibm) 87 (192) 98 Speed (rated) rpm 6700 (max 8370)
10 0 Battery charger 10 1 Manufacturer VARTA Batterie AG
10 2 Type off board 10 3 Input voltage required V 380 AC (3 phase) 104 Peak current demand A 30 105 Recharge time h 12
21
106 Size me(in) height 0864 (340) width 0406 (160)
length 0559 (220)
107 Weight kg abm) 108 Automatic turnoff feature- timer
110 Body 111 Manufacturer and type Volkswagen Transporter (type 2)
11 2 Materials steel
11 3 Number of doors and type 2 regular 2 sliding
114 Number of windows and type 7 plus windshield glass
11 5 Number of seats and type 1 bucket 1 double bucket
11 6 Cargo space volume m3 (ft3 ) 53 (1872)
11 7 Cargo space dimensions m (in) 280x154x123 (102x606x484)
12 0 Chassis
121 Frame
12 11 Type and manufacturer Volkswagen Transporter (type 2)
121 2 Materials steel
1213 Modifications battery compartment under cargo area
122 Springs and shocks 12 21 Type andmanufacturer not specified
12 2 2 Modifications none 12 3 Axles
12 31 Manufacturer not specified
123 2 Front
123 3 Rear
124 Transmission 1241 Type andmanufacturer none
22
1242 Gear ratios
1243 Driveline ratioshy
125 Steering 12 5 1 Type and manufacturer
1252 Turning ratio
1253 Turning diameter m (it) 119 (39)
126 Brakes 1261 Front disk
1262 Rear drum
12 63 Parking mechanical on rear wheels
1264 Regenerative yes
12 7 Tires
127 1 Manufacturer and type steel-belted radial
12 72 Size 185R14
1273 Pressure kPa (psi) Front 271 (45)
Rear 319 (53)
1274 Rolling radius m (in) 0316 (1245)
1275 Wheel weight kg (Ibm) Without drum
With drum 1276 Wheel track m (in)
Front
Rear
130 Performance
131 Manufacturer-specified maximum speed (wide-open throttle) kmh (mph) 708 (44)
132 Manufacturer-recommended maximum cruise speed (wide-open throttle)
kmh (mph)
133 Tested atcruise speed kmh (mph) 69 (43) 56 (35) 40 (25)
23
APPENDIX B
DESCRIPTION OF VEHICLE TEST TRACK
All the tests were conducted at the Transportation Research Center (TRC) of Ohio (fig B-1) This facility was built by the State of Ohio and is now operated by a contractor and supported by the state It is located 72 kilometers (45 miles) northwest of Columbus along US route 33 near East Liberty Ohio
The test track is a 12-kilometer (75-mile) continuous loop 16 kilometers (1 mile) wide and 56 kilometers (35 miles) long Three concrete lanes 11 meters (36 ft) wide in the straightaways and 13 meters (42 ft) wide in the curves make up the high-speed test area The lanes were designed for speeds of 129 177 and 225 kilometers per hour (80 110 and 140 mph) with zero lateral acceleration in the curves The 3-kilometer- (188-mile-) long straightaways are connected to the constant 731-meter- (2400-ft-) radius curves by a short variable-radius transition section Adjacent to the inside concrete lane is a 366-metershy(12-ft-) wide asphalt berm This berm is only banked slightly to provide a drainage slope An additional asphalt lane 366 meters (12 ft) wide is located adjacent to the outside lane on the straightaways The constant-speed and cycle tests were conducted on the inside asphalt lane because all tests were at relatively low speeds The acceleration and coast-down tests were conducted on the straight outside asphalt lanes because these were more alike than the two iside asphalt lanes and because it was the portion of the track least likely to encounter traffic interference The track has a constant 0228 percent north-to-south downslope The TRC complex also has a 20-hectare (50-acre) vehicle dynamics area and a 2740-metershy(9000-ft-) long skid pad for the conduct of braking and handling tests
24
APPENDIX C
VEHICLE PREPARATION AND TEST PROCEDURE
Vehicle Preparation
When the vehicle arrived at the test track a number of checks were made to assure that it was ready for performance tests These checks were recorded on a vehicle preparation check sheet such as the one shown in figure C-i The vehicle was examined for physical damage when it was removed from the transport truck and before it was accepted from the shipper Before the vehicle was operated a complete visual check was made of the entire vehicle including wiring batteries motor and controller The vehicle was weighed and compared with the manufacturers specified curb weight The gross vehicle weight (GVW) was determined from the vehicle sticker GVW If the manufacturer did not recommend a GVW it was determined by adding 68 kilograms (150 lbm) per passenger plus any payload weight to the vehicle curb weight
The wheel alignment was checked compared and corrected to the manufacturers recommended alignment values The battery was charged and specific gravities taken to determine if the batteries were equalized If not an equalizing charge was applied to the batteries The integrity of the internal interconnections and the battery terminals was checked by drawing either 300 amperes or the vehicle manufacturers maximum allowed current load from the battery through a load bank for 5 minutes If the temperature of the battery terminals or interconnections rose more than 60 degrees Celsius above ambient the test was terminated and the terminal was cleaned or the battery replaced The batteries were then recharged and a battery capacity check was made The battery was discharged in accordance with the battery manufacturers recommendations To pass this test the capacity must be within 20 percent of the manufacturers published capacity at the published rate
The vehicle manufacturer was contacted for his recommendations concerning the maximum speed of the vehicle tire pressures and procedures for driving the vehicle The vehicle was photographed head-on with a 270-millimeter telephoto lens from a distance of about 305 meters (100 ft) in order to determine the frontal area
Test Procedure
Each day before a test a test checklist was used Two samples of these checklists are shown in figure C-2
25
The first item under driver instructions on the test checklist is to complete the pretest checklist (fig C-3)
Data taken before during and after each test were entered on the vehicle data sheet (fig C-4) These data include
(1) Average specific gravity of the battery
(2) Tire pressures
(3) Fifth-wheel tire pressure
(4) Test weight of the vehicle
(5) Weather information
(6) Battery temperatures
(7) Time the test was started
(8) Time the test was stopped
(9) Ampere-hours out of the battery
(10) Fifth-wheel distance count
(11) Odometer readings before and after the tests
The battery charge data taken during the charge cycle were also recorded on this data sheet These data include the average specific gravity of the battery after the test the kilowatt-hours and ampere-hours put into the battery during the charge and the total time of the charge
To prepare for a test the specific gravities were first measured for each cell and recorded The tire pressures were measured and the vehicle was weighed The weight was brought up to the GVW by adding sandbags The instrumentation was connected and power from the instrumentation battery was applied All instruments were turned on and warmed up The vehicle was towed to the starting point on the track The fifth-wheel distance counter and ampere-hour integrator counter were reset to zero The test was started and was carried out in accordance with the test checklist When the test was terminated the vehicle was brought to a stop and the post-test checks were made in accordance with the post-test checklist (fig C-5) The driver recorded on the vehicle data sheet the time the odometer reading the ampere-hour integrator reading and the fifth-wheel distance reading
26
At the end of the test weather data were recorded on the vehicle data sheet All instrumentation power was turned off the instrumentation battery was disconnected and the fifth wheel was raised The vehicle was then towed back to the garagethe post-test specific gravities measured for all cells and the vehicle was placed on charge
After the test the engineer conducting the test completed a test summary sheet (fig C-6) This data sheet provides a brief summary of the pertinent information received from the test Another data sheet the engineers data sheet (fig C-7) was also filled out This data sheet summarizes the engineers evaluation of the test and provides a record of problems malfunctions changes to instrumentation etc that occurred during the test
Weather data - Wind velocity and direction and ambient temperature were measured at the beginning and at the end of each test These data were obtained from the control tower which was located in the center of the test track The wind anemometer was located about 18 meters (6 ft) from the ground near the southern straight section of the track The ambient temperature readings were taken at the instrumentation trailer near the west curve of the track During most of the test period the winds were under 11 kilometers per hour (7 mph)
Determination of maximum speed - The maximum speed of the vehicle was determined in the following manner The vehicle was fully charged and loaded to gross vehicle weight After one warmup lap the vehicle was driven at wide-open throttle for three laps around the track The minimum speed for each lap was recorded and the average was calculated This average was called the vehicle maximum speed This speed takes into account track variability and maximum vehicle loading This quantity was then reduced by 5 percent and called the recommended maximum cruise test speed
Cycle timer - The cycle timer (fig C-8) was designed to assist the vehicle driver in accurately driving SAE schedules B C and D The required test profile is permanently stored on a programmable read-only memory (PROM) which is the heart of the instrument This profile is continuously reproduced on one needle of a dual-movement analog meter shown in the figure The second needle is connected to the output of the fifth wheel and the driver matches needles to accurately drive the required schedule
One second before each speed transition (eg acceleration to cruise or cruise to coast) an audio signal
27
sounds to forewarn the driver of a change A longer duration audio signal sounds after the idle period to emphasize the start of a new cycle The total number of test cycles driven is stored in a counter and can be displayed at any time with a pushbutton (to conserve power)
28
REFERENCES
1 Sargent Noel B Maslowski Edward A Soltis Richard F and Schuh Richard M Baseline Tests of the C H Waterman DAF Electric Passenger Vehicle NASA TM-73757 1977
2 Society of Automotive Engineers Inc Electric Vehicle Test Procedure - SAE J227a Feb 1976
29
9P IR1 - SLZ24UU OF TEST RESLTS FOR O3LX iAV J TRANSFOER
(a) SI units
Test date Test condition (constant speed
Wind velocity
1btr ature
Range km
Cycle life
Capacity out of
apacity into
Eergy into
Indicated energy
kiVh or drmivng schedule)
h oC nttelr of cycles
batterie Ah
batteres Ah
charger M
cnswrpticn MJim
51177 402 8 19 1102 - 1563 208 9 --- -
52477 40 2 8 27 1247 - 1622 213 5 1422 114
6177 a4 02 3 2 - 145 23 1167 - 163 3 2205 -- -shy
6877 402 64 - 129 16 118 7 - 162 5 2196 j51 132
51277 563 96 23 890 - 147 3 201 2 - -shy
53177 563 129 - 161 23 851 -- 1315 1856 123 8 145
51677 69 2 8 25 571 3--18 175 3 ---- -shy
52377 692 48 22 607 --- - 1004 1 66
52777 692 48 22 71 8 - 132 0 1888 -
52677 Bo 8 22 71 1 197 162 7 2006 1303 1 83
6777 Bc 8 - 16 1 14 645 193 154 8 2016 b140 7 2 17
51777 Bd
96 27 685 179 1638 2155 - - -shy
51877 Bd
8 29 758 215 1704 -- 1443 195 6977 3d 129 - 16 1 13 705 207 165 6 230 3 b1616 228 6277 do 113 19 481 81 1357 170 0 - - -
6377 Cc 8 14 463 78 122 5 1913 1080 233
52077 Cd
3 2 27 467 75 1278 -- -- -
52577 Cd 113 25 48 4 78 132 2 1682 112 7 2 33
(b) U S cuesfaxy units
Test date Test onditon (cstant speed HPh o driving
schedule)
wind veocity
nph
Taper-attre
OF
Rangenles
Cycle life
nmtder of cycles
Capacity out of
batters Ah
Capacity into
battene Ah
Energyinto
charger JAn
Indicated energy
conslpt Jlnle
51177 25 5 66 68 5 - 1563 208 9 - -shy
52477 25 5 81 775 - 1622 2135 395 0 51
6177 a25 2 - 9 73 725 - 163 3 2205 -- -6877 25 4 - 8 60 738 - 1625 219 5 b431 59
51277 35 6 74 55 3 - 147 3 2016 - -shy
53177 35 8 - 10 74 629 - 131 5 185 6 34 4 65
51677 43 5 77 355 - 1118 1753 - -
52377 43 3 72 377 - - -- 279 74 52777 43 3 71 44 6 -- 1320 188 8 - -
52677 BF 5 71 442 197 1627 2006 362 82
6777 Bc
5- 10 58 401 193 1548 2016 b391 97
51777 Bd 6 81 425 179 1638 2155 - -
51877 Bd 5 84 471 215 1704 - 401 87
6977
6277 Bd
Cc
8 - 10 7
56 66
438 299
207 81
1656 1357
2303 1700
b449 --
102 -
6377 Cc
5 57 288 78 1225 1913 300 104
52077 Cd 2 80 290 75 1278 - - _
52577 C 7 77 301 78 1322 168 2 313 104
aspeed controlled wth potentaometer
brad th industrial kaltwat-hour iter
WJthnutregenerative braking6 With regererative braking
ORIGINAL PAGE IS OF POOR QUALITY
30
TABLE I - ACCELERATION TIMES FOR TABLE III - ACCELERATION CHARACTERISTICS FOR VOLKSWAGEN
VOLKSWAGEN TRANSPORTER TRANSPORTER
Vehicle speed Amount of discharge percent Vehicle speed Amount of discharge percent
kmh mph 0 40 80 kmh mph 0 40 80
Tame to reach designated Acceleration vehile speed s ms 2
ms2mphs mphs ms 2 mphs 0 0 0 0 0 20 12 8 6 6 0 0 0 0 0 0 0 0 40 25 13 11 11 20 12 9 19 11 24 11 24 60 37 18 16 15 40 25 11 25 12 27 13 30 80 50 22 19 20 60 37 14 30 15 33 13 29
100 62 26 22 23 80 50 14 31 17 38 14 32 120 75 30 27 27 100 62 13 29 14 31 15 34 140 87 34 31 31 120 75 13 30 13 30 14 31 160 99 38 35 35 140 87 16 35 14 31 15 33 180 112 41 39 39 160 99 17 37 14 31 14 31 200 124 45 42 44 180 112 16 35 15 33 13 28 220 137 49 45 46 200 124 15 33 18 40 16 37 240 149 54 5 0 50 220 137 13 28 16 35 17 38 260 162 59 56 55 240 149 11 25 10 24 12 27 280 174 63 62 60 260 162 13 28 10 22 11 25 300 187 68 68 6 7 280 174 13 29 9 20 10 22 320 199 75 75 74 300 187 9 21 8 9 8 18 340 211 80 82 81 320 199 9 21 8 18 8 17 360 224 89 92 88 340 211 9 20 7 15 8 18 380 236 95 101 97 360 224 8 17 6 14 7 17 400 249 103 107 107 380 236 8 17 8 17 6 14 420 261 113 119 116 400 249 6 14 7 15 6 13 440 274 123 128 127 420 261 6 13 6 12 6 12 460 286 133 136 137 440 274 5 12 7 15 5 12 480 298 145 150 149 460 286 5 11 5 12 5 11 500 311 158 162 164 480 298 4 10 4 9 4 9 520 323 172 172 178 500 311 | 9 5 11 4 9 540 336 187 183 194 520 323 9 5 12 4 8
560 348 203 200 212 540 336 8 4 9 3 7 580 361 221 219 232 560 348 3 7 3 7 3 7 600 373 241 243 257 580 361 3 6 3 6 3 6 620 385 266 265 282 600 373 3 6 2 5 2 5 640 398 293 289 313 620 385 2 5 5 2 4
660 410 318 322 346 640 398 2 5 4 2 4 680 423 ---- 356 383 660 410 2 5 4 2 4
--680 423 4 1 3
TABLE IV - GRADEABILITY OF VOLKSWAGEN
TRANSPORTER
Vehicle speed Amount of discharge percent
kmh mph 0 40 80
Gradeabillty percent
0 0 0 0 0 20 12 88 109 109 40 25 115 124 140 60 37 141 155 134 80 50 144 176 147
100 62 134 146 158 120 75 137 137 147 140 87 161 141 152 160 99 172 143 142 180 112 162 153 129 200 124 151 186 170 220 137 130 163 176
240 149 115 110 126 260 162 131 100 115 280 174 135 90 100 300 187 96 87 83 320 199 97 83 79 340 211 91 69 81 360 224 77 62 75 380 236 80 78 63 400 249 65 69 59 420 261 59 57 57 440 274 56 69 55
460 286 51 55 51 480 298 46 43 42 500 311 43 53 40 520 323 39 55 38 540 336 36 42 34 560 348 34 32 31
580 361 30 27 26 600 373 26 25 23 620 385 22 25 20 640 398 22 20 18
660 410 2 17 16 680 423 ---- 17 15
32
TABLE V - ROAD ENERGY CONSUMPTION FOR VOLKSWAGEN TRANSPORTER
(a) With rear axle connected (b) With rear axle disconnected
Vehicle speed Road energy consumed Vehicle speed Road energy consumed
kmh mph MJkm kWhmile kmh mph MJkm kWhmile
680 423 0 0 720 447 0 0 660 410 81 36 700 435 62 28 640 398 84 38 680 423 59 26 620 385 90 40 660 410 57 25 600 373 80 36 640 398 56 25 580 360 72 32 620 385 57 26 560 348 74 33 600 373 47 21 540 336 82 37 580 360 43 19 520 323 81 36 560 348 52 23 500 311 72 32 540 336 54 24 480 298 70 31 520 323 55 25 460 286 72 32 500 311 56 25 440 273 74 33 480 298 54 24 420 261 70 31 460 286 46 20 400 249 67 30 440 273 44 20 380 236 67 30 420 261 48 21 360 224 68 30 400 249 43 19 340 211 65 29 380 236 34 15 320 199 64 28 360 224 37 17 300 186 62 28 340 211 41 18 280 174 57 26 320 199 41 19 260 162 55 24 300 186 41 18 240 149 55 24 280 174 34 15 220 137 55 24 260 162 30 18 200 124 54 24 240 149 30 13 180 112 52 28 220 137 32 14 160 99 45 20 200 124 35 16 140 87 42 19 180 112 34 15 120 75 43 19 160 99 30 13 100 62 43 19 140 87 31 14 80 50 40 18 120 75 30 13 60 37 38 17 100 62 29 13 40 25 36 16 80 40 31 14 20 12 39 18 60 37 31 14
40 25 29 13 20 12 29 13
OIGVIAL PAGE IS
OF POOR QUALITY33
TABLE VI - ROAD POWER REQUIREMENTS OF VOLKSWAGEN TRANSPORTER
(a) With rear axle connected (b) With rear axle disconnected
Vehicle speed Rzoad power required Vehicle speed Road power required
kmh mph kW hp kmh mph kW hp
680 423 0 0 720 447 0 0
660 410 148 199 700 435 120 161
640 398 150 201 680 423 111 149
620 385 155 207 660 410 104 139
600 373 134 180 640 398 100 134 620 385 101 136580 360 117 156
560 348 114 153 600 373 78 105 580 360 69 93540 336 123 165
157 560 348 81 109520 323 117 134 540 336 82 109500 316 109
480 298 94 125 520 323 80 107
460 286 92 123 500 311 77 104
440 273 80 121 480 298 72 96
420 261 82 109 460 286 58 78
400 249 74 99 440 273 54 73 380 236 70 94 420 261 56 75 360 224 68 91 400 249 48 64
340 211 61 82 380 236 36 48 320 199 57 76 360 224 37 50 300 186 52 70 340 211 39 52 280 174 44 60 320 199 37 49 260 162 40 53 300 186 34 46
240 149 36 49 280 174 27 36 220 137 33 45 260 162 21 29 200 124 30 40 240 149 20 27 180 112 26 35 220 137 19 26 160 99 20 27 200 124 19 26 140 87 16 22 180 112 17 22 120 75 14 19 160 99 13 18 100 62 12 16 140 87 12 16 80 50 9 12 120 75 10 13 60 37 6 8 100 62 8 11 40 25 4 5 80 50 7 9 20 12 2 3 60 37 5 7
40 25 3 4 2 220 12
34
TABLE VII - INDICATED ENERGY CONSUMPTION FOR
VOLKSWAGEN TRANSPORTER
Test condition Indicated energy consumption (constant speed or driving schedule) MJkm kWhmile
kmh mph
402 25 114 051
563 35 145 65
692 43 166 74
Ba 200 95
Eb 211- 89 Ca 233 104
Cb 233 104
aWth regenerative braking
bwithout regenerative braking
ORIGNAL PAGE IS OF POOR QUALITY
35
TABLE VIII - CHARGER EFFICIENCY TEST DATA FOR VOLKSWAGEN TRANSPORTER
Time Input power from kilowatt-hour meter
Pin
kW
Output power calculated from
Vav x 1 av P out kW
Energy efficiency percent
Input power from watt-meter PIn kW
Output power from watt-meter Pout
kW
Power efficiency percent
Deviation percent
645 am 363 296 815 330 260 788 33 745 353 291 824 316 256 810 17 845 341 267 783 323 252 780 4 945
1045 339
327 279
275
823
841
310
310
254
245
819
790
5
60 1145 313 268 856 294 239 813 50 1245 pm 298 252 846 280 225 804 49 145 280 238 850 244 207 848 2 245 252 215 853 224 186 833 23 345 229 199 869 200 171 853 18 445 227 196 863 197 165 838 29 545 227 193 850 186 162 869 22 645 234 202 863 201 172 857 7
TABLE IX - CHARACTERISTICS OF VARTA LB0OV3
BATTERY MODULES USED IN VW TRANSPORTER
Length cm (in) 24 (94)
Width cm (in) 19 (75)
Height cm (in) 27 (106)
Weight kg (ibm) 30 (66)
TABLE X - AVERAGE BATTERY PERFORMANCE DURING CONSTANT-SPEED TESTS OF
VOLKSWAGEN TRANSPORTER
Test speed Initial 25 percent of test Final 25 percent of test
kmh mph Current Voltage Power Current Voltage Power A V kW A V kW
40 25 56 147 82 58 130 77
56 35 87 144 124 90 123 116
69 43 138 141 194 122 120 159
TABLE XI - VOLKSWAGEN TRANSPORTER BATTERY VEHICLE TEST DATA
Test condition Test date Battery capacity Overcharge Electrolyte Average battery (constant speed or Ah percent specific gravity temperature 0 C driving schedule)
eIput Output Before After Before After
kmh mph test test test test
69 45 52777 189 132 43 1266 1135 32 38
56 35 53177 185 132 40 1272 1130 24 30
C 6277 170 135 26 1278 1135 32 41
Z0 [ 25 6877 220 163 35 1270 1130 33 32 B 6977 230 166 1 9 1280 1o30 32 35
ORIGINAL PAGE IS OF POOR QUALITY
37
~C-17-ISI2
Figure 1 - Volkswagen Transporter electric delivery van
Figure a - Side view of VW Transporter showing special fixture for removal of battery pack
38 ORIGIAL rAGE IS OF pOOR QUALITY
Battery current 250 A160 mV
Battery to
voltage 144V -
Z Transistor Motor control armature
Motor field
Figure 3 - Wiring diagram of VW Transporter showing instrumentation locations
V
1tJ
-- ta -- -tcr tb -ti -
TIME s
S -TEST PARAMETER SAEO SCHEDULES
MAX SPEED V mph 20 30 45 ACCEL tiME ta s 19 18 28 CRUISETIME tcr 19 20 50 COASTTIME tco 4 8 10 BRAKETIME t 5 9 9 IDLEIME ti 25 25 25
Figure - SAE J227a driving cycle schedules
39
VEHICLE PERFORMANCE V W TRRNSPURTER
9322F
2X
80
90 KM
Figure 5 -shy ag tcnsatsed
0 10 20
0 1Fo
30 HO pound0 KMH 30
GO 7
Lib
no0 90
ampo 6
100
b2 I
w
XO
EO
90 30
ICHajRg4
-
-VEHICLE SPEED
FigureS -Rangeat constantspe
VEIH ICLE PERFIJRMRNCE DATE RECDR5ED V N TANSEJRTERdUNE I01977
5L
HE SB
- 72
tagre-ni 32celraton
200
-WX0 DISCIHRGE
X-q0X DIaCHRRSM
-BOX oS-RVEH ICLE PERFJRMRNCE DTE RECRHDED IUNE lo 1977V WITRRNSPORTER
711 Hi l I I I I
ES
EE E5= 2S
3s
I L pound_x O
2R2 RH
HH Am x
1 22 32 3o EM 7 0g g2 2oTo I KMH
06 IS 20 30 qOe EBE2I1 MIPH
VEHICLE SPEED
Figure 7 - Acceleration as afunction of speed
0K DirCRRE X940X DISCHRR3E
-SOX DSC-M VEHICLE PERFfRHINCE DHTE RECURDED
V W TRRNSpFIRTER UNE mi1977
I I I I
24
HX ZJE X H ~a XX0
-I HXM H 0
w12j2-Nox 0 RH
LU x g~cn x
0 1E2 3 0 0S 70 0 9N 100 KNH
MPH VEHICLE SPEED
FIgure 8- Gradeability as afunction of speed
41 ORIGINAt pAE 18
qtuoo 2 TY
2
Ba81
9m1
04L171
2EHoa
0
=
LIIi 62
~ 2 2 0
40
0-0
12 IS
E1
a)With rear axle cannectedt
n0 I
testdate June 10 191
497
(a)With rear axle connected test date June 10 1977
Fr -e e a rVs na r 0 L
10
q0
0
0
HIP
2 0 60 2 0 120ilI qIlfI M9110200 TIMEt SECONDS
0)With rear axle disconnected test date June 21 1977
Figure 9 - Vehicle deceleration for Volkswagen Transporter
0
~ O -
10I202 H q 0E270E0El i0f10 KMHl
0 12 20 1 4 5 Ea 2 IN MPH
VEHICLE SPEED
9)) With rear axle disconnected test date June 21 1977
Figure 10 - Road energy as afunction of speed for Volkswagen Transporter
29 IJ
4
q - [I
0
Zq-4
1
Lo
L 12shy=0B=lz
rp a)With rear axle connected test date June 10 1977
It
C
DCC
-
-
B H- I[l
0 ItA
0~
2-shy
t
VEHICLE PERFORMHlNCE V W TRHNSPORIER
4 05 10 3 0 0 6 0 O 9 0 E0 03 5 o os 02
jc CIO Sl]10i 20] 30 1
MPHVEHICLE SPEED
a)With rear axle disconnected test date June 21 1977
Go 1332 0l 10]
Figure 12
21D 0 13 L ~l1NEb E05
MPHVEHICLE PEED
- Energy consumptin as a function of speed
I~E
Figure 11 - Road power as a function of speed for Volkswagen Transporter
0 Method L Iav x Vav o Method Z Wattmeter
oO o o 0
0 0
10 15 20
OUTPUT CURRENT A
Figure 13 -Battery charger effhciency as a function of output current for Volkswagen IjJN Transporter
10 15t 600H
2P0
C20
15 8C
4-Pm N 4 111
2 i-
Idoli2 0 W10- i 1I
DISCHARGE CURRENT A SPECIFIC ENERGY MNikg
Figure 14 - Discharge characterishcsof Figure 15 - Energylpower relation-VARTA L800V3 battery ship for VARTA L80OV3 three-cell
battery
44
80 I CURRENT
A 1270
0
gt (a)Front subpack
go
70O3
0 20 40 60 80 100 120 140 160 180
CAPACITY REMOVED Ah
1)Rear subpack
Figure 16 - Battery qualification test data for VARTA L80OV3
alt 2 oDs c E COMP ONENT PERFIRM NCE X gt 7S DISCI~i-bRGE V W TRHBNPORER_ DATE RECORDED
Y -dUN Bi 1377
ISO
120shy
2EE
I0 20B 39 50 50 70 00 90 100W KMH20 30 q 752 go SO ampE0 I
MPH VEHICLE SPEED
- Current as afunction of speedFigure 17
orIampVAL ppB Ir4Of-- PO YL 45
o- lt2cg 015iCHR Z COMPONENT PERFRMRNCE V N TRRNSPRTER DHTE RECORDED
MHY II-dUN 8 1977
lEOtimes
Iq
120x
I100
40
0 0 -
U 10 20 3 40 ll EO 70 80 90 10KKH EbI
I 2 A I pound
$PH VEHICLE SPEED
Figure 18 - Voltage as a function of speed
COMIPONENT FERFORI4RNE V N TRRNSPORTER DRTE RECORDED
X- gt 2 r 01 1IM
NAY ll-dUN O 1977
IEK
K
O 9 0 3 L10 amp0 60EZ70 00 9-0 100
0 1 20 JE gg IG 2
MPH VEHICLE SPEED
Figure 19 - Power as afunction of speed
46
Figure 21 - Controller installed in Volkswagen Transporter
r0 730 km R (045 mile)
S 56km 16km Ile O) (15 miles) (10 mile)
30 km O8 - Weather station and miles)
0223 Traffic entry and exit 0
control tower
Percent slope
t 022 Percentslope
I Traff icdirection
Figure B-1 - Characteristics of Transportation Research Center Test Track East Libety Ohio
48
COMPONENT PERFORMANCE DATE RECOED
V WTRANSPORTER R 271 1977
VOLTAGE
173 3
(a)Voltage and current
i Z 3 4I SS S 7 S 35 1n1 11 17 13 1 4 IE 17 1i TIME h
0) Power
Figure 20 - Battery charger output voltage current and power
ORIGINAL PAQIl1 or PooR QUAVIW
47
- PAGE OF POOR QUALITy
1 Vehicle L Date received 3Checked for damage - date amp Wheel alignment - date 5 Battery checked and equalized - date 6 Curb weight determined Ibm Date
7 Gross vehicle weight Ibm 8 31)-Ampere test -date 9 Manufacturers recommendationsamp
Maximum speed mph
Tire pressures psi Front _ Rear Driving procedures
Figure C-1 - Vehicle preparation check sheet
Vehicle mph range test _ _ gear
Driver Instructions 1 Complete pretest checklist 2 While on track rechecL
Integrator - light on in operate position zeroed Speedometer - set on mph center Distance - on reset lighted Attenuator - on reset lighted
3 At signal from control center accelerate moderately to _ mph
4 Maintain _+I mph with minimal accelerator movement 5 When vehicle is no longer able to maintain _ mph brake moderately to full stop
6 Complete post-test checklistand other documentation
Recrdfint 1 Set oscillograph zeros at Channel Zero In
3 30 4 45 6 50
10 75 12 11 13 12 14 20
2 Record all channels on magnetic tape Check inputs at beginning of test to verify recording
3 Run cals on all channels
4 Remove all channels from oscillograph except 3and4 5 Start recording 15 sbefore start of test at oscillograph speed of 01 inis and tape speed
of ins
6 After 15 min Into test connect channels 6 10 12 13 and 14 to oscillograph and record aburst at 100 Inds while vehicle is in chopper mode
7Remove channels 610 12 13 and 14 from oscillograph and continue test at 01 Inrs with channels 3and 4only
amp Document all ambient conditions at beginning once every hour and at the end of the test Items recorded shall Include temperature wind speed and direction significant wind gusts and corrected barometric pressure
(al Constant-speed test
Figure C-2 - Test checklists 49
Vehicle cycle test _gear 1 Record specific gravity readings after removing vehicle from charge and disconnect charger Instrumentation Fill In charge data portion of data sheet from previous
Driver Instructions test Add water to batteries as necessary recording amount added Check and reshy1 Complete pretest checklist cord 5th wheel tire pressure and vehicle tire pressure
2 While an track recheck 2 Connect (Connect alligator clips to Instrumentation battery last) Integrator - light on in operate position zeroed (a)Inverter to instrument battery Speedometer - set on _ mph center (b)Integrator input lead Distance - on reset lighted ic)Integrator power to Inverter Attenuator - on reset selector on 100 ad)Starred () 5th wheel jumper cable Cycle timer - verify scheduled timing with stop watch t) Cycle timer power and speed signal Input cables Check times
3 At signal from control center perform cycle test using cycle timer as basis for deter- it) Spin up and calibrate 5th wheel mining length of each phase of performance cycle Use programmed stop watch as 3 Record test weight - Includes driver and ballast with 5th wheel raised backup device Cycle consists of
Accelerate to _ mph in _ s 4 Turn on
s(a) Inverter motor speed sensor thermocouple reference junctions integratorCruIse at _ mph for sr and digital voltmeter Set integrator on Operate Ln Coast for s O)Ffth wheel readout and switching Interface units (2) (Selectdistancefor exshy0 Brake to complete stop in _ s panded scale range I
Hold in stop position for __ s 5 Tow vehicle onto track with 5th wheel raised Repeat entire cycle until vehicle Is unable to meet acceleration time Moderately brake Precallbrations to acomplete stop Tape data system
Oscillograph4 Complete post-test checklist and other documentation Reset Recording 5th wheel distance 1 Record all channels on magnetic tape at Ins Check al channels to verify Ampere-hour meter
input at beginning of test Thermocouple readout switches on Record Turn on thermocouple reference junctions
2 Record speed and distance on osclllograph at mIns Lower 5th wheel Set hub loading
3 Start recordingdata 15 s before beginning test 6 Be sure data sheet is properly filled out to this point Check watch time with control 4 Document ambient conditions atbeginning once every hour and at the end of the test 6owerw
Items recorded shall include temperature wind speed and direction significant windgusts and corrected barometric pressure 7 Proceed with test
N3)Driving cycle test Figure C-3 - Pretest checklist
Figure C-2 - Concluded
Vehicle Battery system Test Date Track data Driwer Navigator Average pretest specific gravity Open-ircuit voltage V Tire pressure before test psi
Right front _ Left front _Right rear Left rear__ Tire pressure after test psh
Rightfront__ Left front Right rear Left rear Fifth-wheel pressure psi (calibrat __ psi) Weather Initial Duringtest Final
Temperature OF Wind speed mph -- --__ Wind direction Pressure in Hg
Battery temperature OF Before After Mttr temperature O Before After
Time Start StopOdometer reading miles Start___ Stop__ Current out Al __ Current in (regenerativel Ah __ Fifth wheel
Basis for termination ottests
Charge data Average post-test specific gravity Open-circuit voltage V Charger used Charger Input voltage V Battery temperature OF Beforecharge After charge Power kWh Start End Total Time Start _ End Total charge time min Current input Ah Average specific gravity after charge
Approval
Figure C-4 -Track and chargedata
1 Record time immediately at completion oftest Turn offkey switch
2 Complete track data sheet (a)Odometer stop b) Ampere-hour integrator (c) 5th wheel distance i) Read temperature (e)Calibrate data system Mf)Record veather data
3 Turn off Inverter thermocouple reference junctions
4 Disconnect 12-volt instrument battery red load
5 Raise 5th wheel
6 Tow vehicle off track
7 Start charge procedure (specific gravities)
8 Check specific gravity on Instrument battery If less than 12M0 remove from vehicle and charge to full capacity
9 Check water level in accessory batteries Add water as necessary
Figure C-5 - Post-test checklist
ORIGINAL PAG IS 01 POOR QUATTW
51
Vehicle Test Date
Test conditions Temperature OF _ Wind speed mph _ at
Barometer reading in Hg Other
Test results Test time h
Range miles
Cycles Current out of battery Ah
Current into battery Ah
Charge time h
Power into battery kWh
Magnetic tape
No _ Speed ints
Comments
FigureC-6 -Test summary sheet
Vehicle Test Date
Engineer Reason for test (checkout component check scheduled test etc I
Limitation on test (malfunction data system problem brake drag etc)
Changes to vehicle prior to test (repair change batteries etc )
Other comments
Evaluation of test Range miles
Current out Ah
Current in Ah
Power in kWh Energy consumption kWhimile
Was planned driving cycle followed
General comments
Figure C-7 - Engineers data sheet
52
Figure C-8 - Cycle timer
ORIGINAL PAGE Io OF POOR QUALIT
53
NATIONAL AERONAUTICS AND SPACE ADMINISTRATION WASHINGTON DC 20546 PQSTAqg AND FEES PAID
ANDAERONAUTICS OFFICIAL BUSINESS S~EA~NSRTO
NATIONAL PENALTY FOR PRIVATE USE $300 SPECIAL FOURTH-CLASS RATE SA
SPACE ADMINISTRATION L IBOOK A
IfUndeliverable (Section 158 POSTMASTER Postal Mnnual) Do Not Return
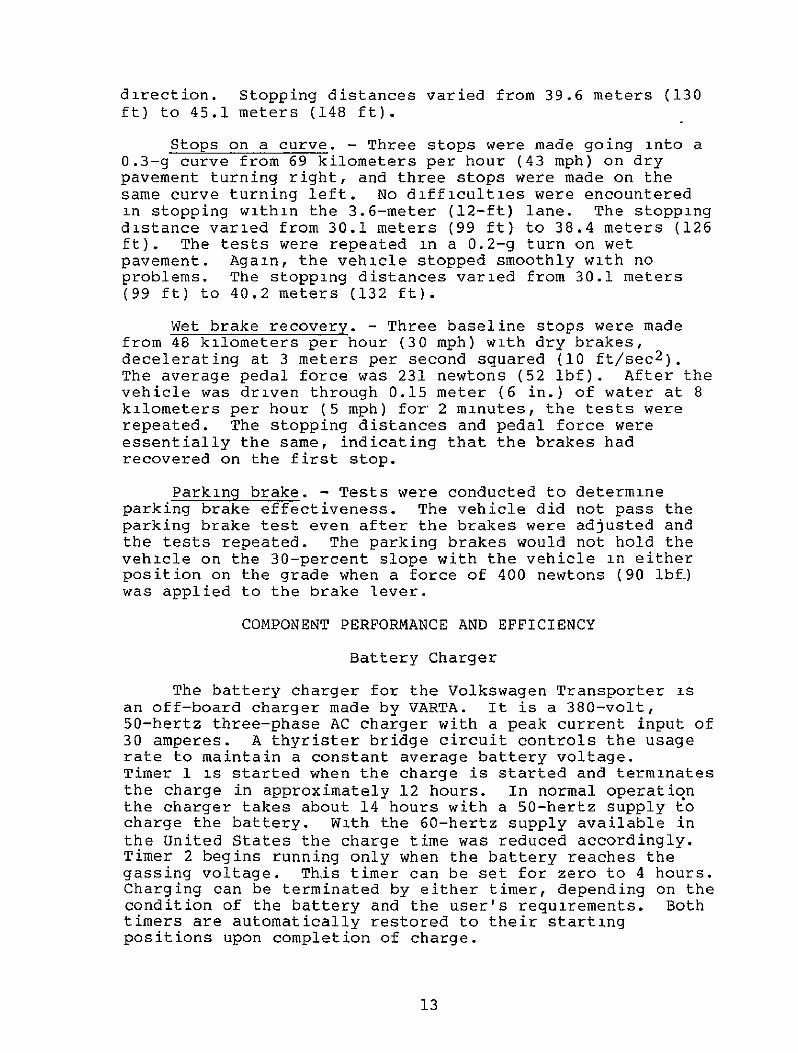
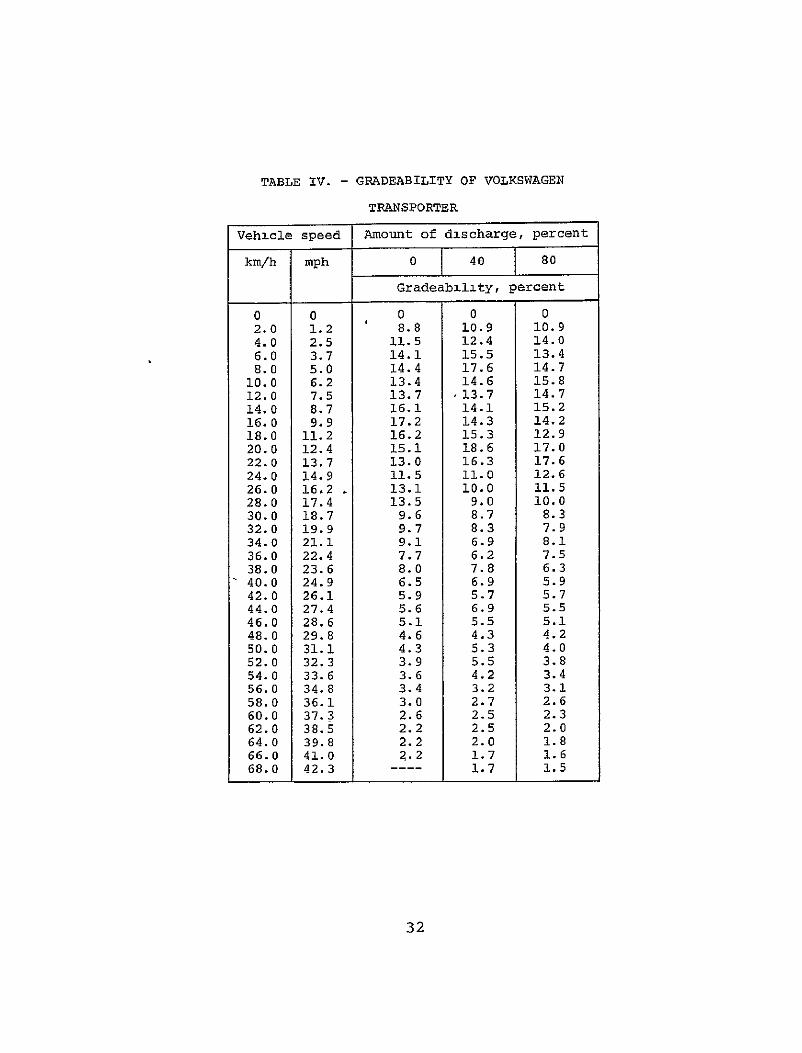
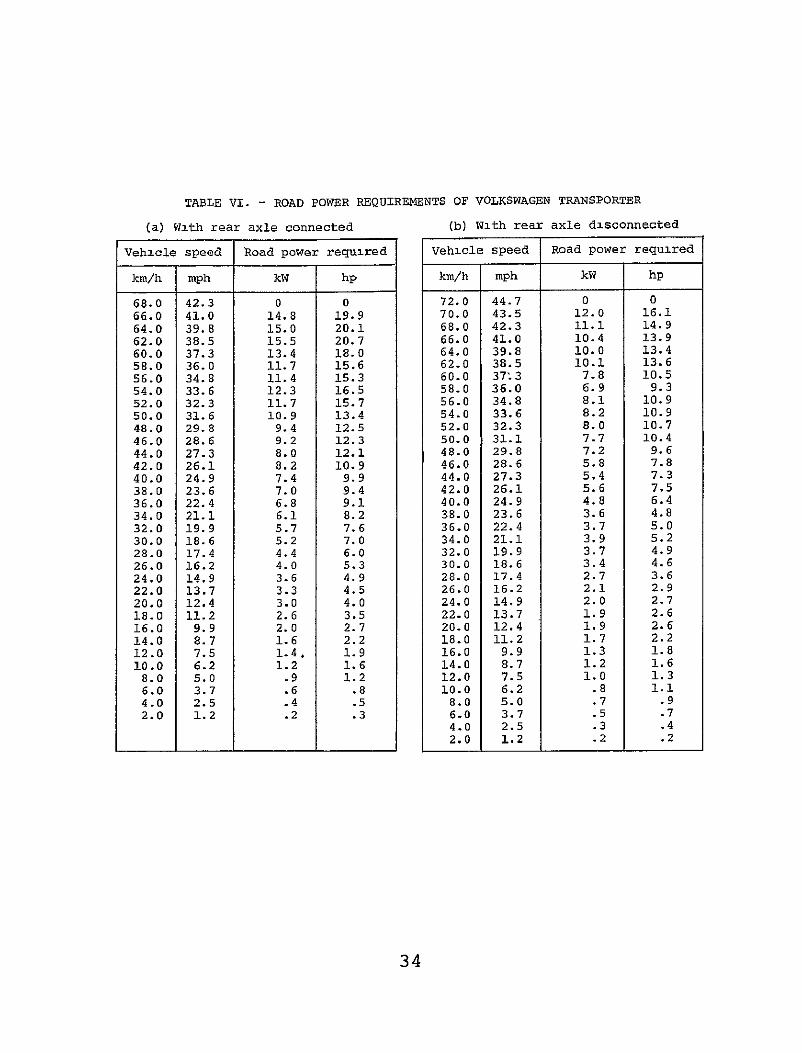

Vehicle Test Date
Test conditions Temperature OF _ Wind speed mph _ at
Barometer reading in Hg Other
Test results Test time h
Range miles
Cycles Current out of battery Ah
Current into battery Ah
Charge time h
Power into battery kWh
Magnetic tape
No _ Speed ints
Comments
FigureC-6 -Test summary sheet
Vehicle Test Date
Engineer Reason for test (checkout component check scheduled test etc I
Limitation on test (malfunction data system problem brake drag etc)
Changes to vehicle prior to test (repair change batteries etc )
Other comments
Evaluation of test Range miles
Current out Ah
Current in Ah
Power in kWh Energy consumption kWhimile
Was planned driving cycle followed
General comments
Figure C-7 - Engineers data sheet
52
Figure C-8 - Cycle timer
ORIGINAL PAGE Io OF POOR QUALIT
53
NATIONAL AERONAUTICS AND SPACE ADMINISTRATION WASHINGTON DC 20546 PQSTAqg AND FEES PAID
ANDAERONAUTICS OFFICIAL BUSINESS S~EA~NSRTO
NATIONAL PENALTY FOR PRIVATE USE $300 SPECIAL FOURTH-CLASS RATE SA
SPACE ADMINISTRATION L IBOOK A
IfUndeliverable (Section 158 POSTMASTER Postal Mnnual) Do Not Return
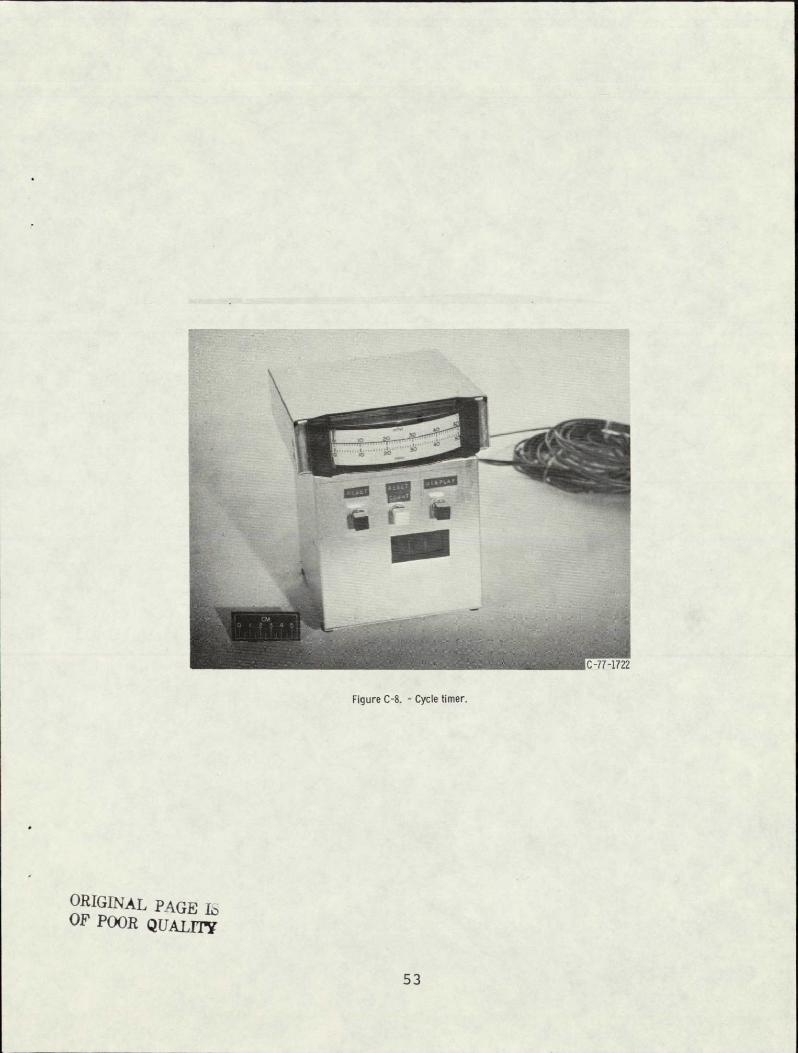

NATIONAL AERONAUTICS AND SPACE ADMINISTRATION WASHINGTON DC 20546 PQSTAqg AND FEES PAID
ANDAERONAUTICS OFFICIAL BUSINESS S~EA~NSRTO
NATIONAL PENALTY FOR PRIVATE USE $300 SPECIAL FOURTH-CLASS RATE SA
SPACE ADMINISTRATION L IBOOK A
IfUndeliverable (Section 158 POSTMASTER Postal Mnnual) Do Not Return