Embed Size (px)
Citation preview

BASELINE RESEARCH FOR THE INTEGRATED SUSTAINABLE MANAGEMENTOF MEDITERRANEAN SENSITIVE COASTAL ECOSYSTEMS
A manual for coastal managers, scientists and all those studyingcoastal processes and management in the Mediterranean
RECHERCHE DE BASE POUR UNE GESTION DURABLEDES ÉCOSYSTÈMES SENSIBLES CÔTIERS DE LA MÉDITERRANÉE
Un manuel pour les aménageurs, les scientifiques et les étudiants des côtes sensibles méditerranéennes
Istituto Agronomico per l’Oltremare
Felicita Scapini (Editor)and the partners of the MECO project

© 2002 Ministry of Foreign AffairsIstituto Agronomico per l’OltremareVia A. Cocchi, 450131 Florence - ItalyTel.: 0039 055 50611e-mail: [email protected]://www.iao.florence.it
All rights reserved. No part of this publication may be reproduced, stored in a retrievalsystem, or transmitted in any form or by any means, electronic, mechanical, photocopying,recording or otherwise, without the prior permission of the copyright owner.
Realization
Società Editrice Fiorentinavia G. Benivieni 1 - 50132 Florence - Italytel. 0039 055 5532924 - fax 0039 055 5532085e-mail: [email protected]
Graphics
Lisa Mammì, Società Editrice Fiorentina
Cover picture - Illustration de couverture
Luigi Scapini
table of contents - table des matières
The MECO partners – list of participants p. 9
Acknowledgements 11
introduction (Felicita Scapini) 13
Chapter 1 - frameworks for planning and managementfor sensitive coastal area environments 17
1.1 Planning and management framework (Louis F. Cassar and Josienne Vassallo) 191.1.1 Introduction 191.1.2 Integrated coastal area management 201.1.3 Planning approach 211.1.4 Economics of conservation areas 231.1.5 Biodiversity corridors 231.1.6 References 24
1.2 Geomorphological framework. Le cadre géomorphologique:epargner aux plages le danger de l’érosion marine (Ameur Oueslati) 251.2.1 Introduction 251.2.2 Des formes qui ne se limitent pas à la seule bande sableuse sur laquelle
s’étendent d’habitude les baigneurs 251.2.3 Des formes à profils très changeants 261.2.4 Des espaces ouverts et dépendants de la dynamique des milieux qui les encadrent 271.2.5 Des formes capables de s’adapter aux caprices de la nature 281.2.6 De quelles informations a-t-on besoin? 29
1.3 Biological framework 321.3.1 Introduction (Felicita Scapini) 321.3.2 Diversity and Biodiversity (João C. Marques) 331.3.3 References 36
1.4 Socio-economic framework – A framework for the analysis of socio-economicimpacts on beach environments (Alison Caffyn, Bob Prosser and Guy Jobbins) 371.4.1 Human impacts 371.4.2 Physical impacts on beach environments 391.4.3 An integrative framework for analysis 411.4.4 Key issues for socio-economic impacts 42
a. Issues of scales 42b. Stakeholders 42c. Levels of development 44d. Seasonality 45
1.4.5 Key concepts for planning and management p. 46a. Carrying capacity 46b. Limits of acceptable change 46c. Recreation Opportunity Spectrum 47d. Principles for an approach to sustainable tourism 48e. Summary 49
1.4.6 References 49
Chapter 2 - presentation and characterization of the sites 51
2.1 Le site de Zouara Tunisie 532.1.1 Présentation morphologique (Ameur Oueslati) 53
a. Une plage étendue 53b. Un champ dunaire à morphologie variée et complexe 53c. Des repères pour la reconstitution de l’histoire de l’homme
et des paysages ainsi que pour la connaissance des tendancesrécentes de l’évolution de l’environnement 53
d. Une plage en moins bon état qu’il y a quelques décennieset à risques dans l’avenir 55
e. On insistera en particulier sur 562.1.2 Présentation biologique (Faouzia Charfi) 58
a. Plage et dunes bordières: espace convoité 58b. La forêt littorale naturelle unique en son genre 59c. Le barrage et son entourage: zone humide pour les oiseaux d’eau 61
2.2 Le site des Kneiss, Tunisie: géomorphologie et aptitudes à l’aménagement(Moncef Gueddari et Ameur Oueslati) 632.2.1 Variété et originalité du paysage morphologique 632.2.2 Une érosion marine menaçante et des rivages à haut risque avec
une variation positive du niveau marin 652.2.3 Une érosion hydrique dégradante dans le continent et à impacts
multiples dans le domaine marin 672.2.4 De l’intérêt des géosystèmes en cours de formation au pied des falaises 682.2.5 Les constructions éoliennes sur les berges des sebkhas:
des géosystèmes en danger 682.2.6 Quelles recommandations pour l’aménagement? 702.2.7 Références 71
2.3 Case-study: Zouara and Îles Kneiss, Tunisia(Louis F. Cassar, Edwin Lanfranco, Josienne Vassallo, Paul Gattand Ewan W. Anderson) 722.3.1 Background 72
Chott-el Zouara 72Kneiss Islands 73
2.3.2 Site characterization 73Zouara 73Bessila Islet 74General discussion 74
2.3.3 Field survey methods 75Assessment of landscape features 75Profile plotting and field observations 76
2.3.4 Observations on sand dunes and surrounding habitats at Zouara 78
4 table of contents - table des matières
2.3.5 Vegetation p. 81Zouara 81Ile de Kneiss (El Bessila) and adjacent mainland 83
2.3.6 Diptera fauna 862.3.7 Conclusion 87
Environmental issues and impacts 87
2.4 Case-study: Malta sites characterization(Josienne Vassallo, Michelle Borg and Louis F. Cassar) 892.4.1 Background 892.4.2 Site characterization 89
a. Ghadira 89Characterization 89Vegetation cover 91
b. Ramla tat-Torri 91Characterization 91Vegetation cover 91
c. Armier 92Characterization 92Vegetation cover 92
d. Ramla tal-Mixquqa 92Characterization 92Vegetation cover 94
e. Ramla l-Hamra 94Characterization 94Vegetation cover 95
2.4.3 Management Options for Ghadira, Ramla tal-Mixquqa, Armier, Ir-Ramlatat-Torri and Ramla l-Hamra 95Introduction 95Existing uses and activities 96Proposed solutions 96Existing structures 97
2.5 Case-study: Smir Lagoon, MoroccoLes marais de Smir: un milieu fragile d’intérêt remarquable(Abdellatif Bayed et Mohammed-Aziz El Agbani) 982.5.1 Les marais les plus occidentales du bassin méditerranéen 982.5.2 Un bassin versant côtier 992.5.3 Lieu de rencontre entre eaux continentales et eaux marines 992.5.4 Lieu de fortes diversités biologiques, d’habitats et de productivités 1012.5.5 Aménagements et impacts des activités humaines 1032.5.6 Plan d’aménagement et de gestion, revitalisation et équilibre des systèmes 1052.5.7 Les oiseaux indicateurs de la qualité du milieu 105
Chapter 3 - techniques for ecological characterization of sitesand eco-audits: estimating the state of coastalecosystems – how to measure diversity 107
Introduction (Felicita Scapini) 109
3.1 Measures of biodiversity based on arthropod communities(Isabella Colombini, Mario Fallaci and Lorenzo Chelazzi) 110
table of contents - table des matières 5

3.1.1 Rationale p. 1103.1.2 Sampling procedure 1103.1.3 Data analysis 1123.1.4 A case study-Results and interpretation 1143.1.5 References 119
3.2 Bioassays for estimation of beach stability and ecosystem quality(Felicita Scapini and Elfed Morgan) 120
3.3 Genetic indicators 1233.3.1 Variation in isoenzymes – Protein electrophoresis
(Valerio Ketmaier and Elvira De Matthaeis) 123a. Principles 123b. Procedures: electrophoretic analysis 124c. Data analysis 124d. A case study - Pattern of genetic divergence and variability in
Mediterranean talitrids (Crustacea, Amphipoda) basedon allozyme data 125
Introduction 125Material and methods 126Results and discussion 129
e. Conclusions 131f. Support 132g. References 132
3.3.2 DNA variation - molecular markers as tool for environmental impactevaluation (Angela Scialpi, Maria Carmela Intrieri and Marcello Buiatti) 133a. Introduction 133b. The strategy 134c. Equipment needed 138d. References 138
3.4 Behavioural changes as indicators of beach stability 140Introduction (Elfed Morgan and Felicita Scapini) 1403.4.1 Variation in orientation of sandhoppers removed from their burrows
during the day (Felicita Scapini, Mohamed El Gtari andGiovanni M. Marchetti) 140a. Rationale 140b. Procedure 141c. Data analysis 142d. Results of orientation experiments and discussion 144e. Analysis of factors influencing orientation using multiple regression 144f. Results of multiple regression analysis and discussion 146g. Support 147h. References 147
3.4.2 Variation in the period of the biological clock(Mariella Nardi and Elfed Morgan) 148a. Rationale 148b. A case study - Procedure 148c. Results and interpretation 150d. Support 153e. References 153
6 table of contents - table des matières
3.5 Integration and interpretation of ecological data at population level(João C. Marques and Pedro Anastacio) p. 155Introduction 1553.5.1 Identifying qualitative inter-site variations through population
dynamics studies 155a. Scope and objectives of population dynamics studies 155b. Field sampling protocol for Talitrus saltator or other
sandhoppers population dynamics 156c. Laboratory procedures for biometric and biological analysis 157
3.5.2 Data analysis 158a. Length – weight relationships 158b. Cohorts identification and tracking 159c. Influence of environmental physicochemical factors 159d. Production estimates 160
3.5.3 Modelling sandhoppers population dynamics 1603.5.4 Implications for integrated planning and management 1633.5.5 Necessary support - Expertise 1643.5.6 References 164
3.6 General evaluation of bioassays (Felicita Scapini) 165
Chapter 4 - socio-economic analysis of sites 167
4.1 Indicators of change (Alison Caffyn, Bob Prosser and Guy Jobbins) 169
4.2 Monitoring methods (Alison Caffyn, Bob Prosser and Guy Jobbins) 174Introduction 1744.2.1 Use of secondary information and statistics 1754.2.2 SWOT analysis 1754.2.3 Beach usage - counts and observations 1784.2.4 Stakeholder analyses 1804.2.5 Visitor surveys 1814.2.6 Basic economic estimates 1824.2.7 Wider assessments 1844.2.8 Sharing information 1844.2.9 References 184
Chapter 5 - developing a management planplans d’aménagement 185
5.1 Plan de gestion de zones sensibles: lignes directrices (A.P.A.L.) 187Cadre générale du programme en Tunisie 187Objectifs du programme 187Consistance du programme 187Procédure d’élaboration du plan de gestion 188
Phase 1: Caractérisation de la zone 188Phase 2: Elaboration des scénarios de gestion 189Phase 3: Schéma de gestion 189
5.2 Diagnostique des sites tunisiens - les fiches des experts 1915.2.1 Zouara 1915.2.2 Kneiss 195
table of contents - table des matières 7

5.3 Étude de cas: Plan de gestion du site de Zouara-Nefza et du sitedes îles Kneiss (Tunisie) (Habib Ben Moussa, Fadhel Baccar, Lassad Douffani,Anissa Ksia, Mohamed Hedi Sfar et Sihem Slim) p. 1995.3.1 Premier cas: Le site de Zouara 199
a. Rappel des facteurs de sensibilité du site 199b. Les aptitudes du site de Zouara à l’aménagement 200c. Les orientations de protection et de valorisation 201d. Le projet d’aménagement 204
5.3.2 Deuxième cas: Le site des Îles Kneiss 208a. Rappel des facteurs de sensibilité des Îles Kneiss 208b. Les aptitude du site de Kneiss à l’aménagement 210c. Les orientations de protection et de valorisation 210d. Les mesures de protection 210e. Le projet d’aménagement 212
5.3.3 Conclusion 217
Chapter 6 - integration in monitoring and management(Alison Caffyn and Guy Jobbins) 221
8 table of contents - table des matières
the meco partners
General co-ordinator and co-ordinator of the Italian team Prof. Felicita Scapini, Consorzio Nazionale Interuniversitario per le Scienze del Mare - Uni-
tà Locale di Ricerca di Firenze, Dipartimento di Biologia Animale e Genetica, Università diFirenze
Italian teamProf. Marcello Buiatti, Dipartimento di Biologia Animale e Genetica, Università di FirenzeDr. Lorenzo Chelazzi, Istituto per lo Studio degli Ecosistemi, CNR, Firenze Dr. Isabella Colombini, Consorzio Nazionale Interuniversitario per le Scienze del Mare - Uni-
tà Locale di Ricerca di FirenzeProf. Elvira De Matthaeis, Dipartimento di Biologia Animale e dell’Uomo, Università di
Roma “La Sapienza”Dr. Mario Fallaci, Consorzio Nazionale Interuniversitario per le Scienze del Mare - Unità
Locale di RicercaDr. Maria Carmela Intrieri, Dipartimento di Biologia Animale e Genetica, Università di
FirenzeDr. Valerio Ketmaier, Dipartimento di Biologia Animale e dell’Uomo, Università di Roma
“La Sapienza”Prof. Giovanni M. Marchetti, Dipartimento di Statistica, Università di FirenzeDr. Mariella Nardi, Dipartimento di Biologia Animale e Genetica, Università di FirenzeDr. Angela Scialpi, Consorzio Nazionale Interuniversitario per le Scienze del Mare - Unità
Locale di Ricerca di Firenze
Maltese teamCo-ordinator Mr. Louis F. Cassar, International Environment Institute, University of MaltaProf. Ewan W. Anderson, Centre for Middle Eastern and Islamic Studies, University of Dur-
ham, UKMs. Rosemary P. Baillon, Centre for Middle Eastern and Islamic Studies, University of Dur-
ham, UKMr. Charles Galea Bonavia, Planning Authority, MaltaMs. Michelle Borg, Planning Authority, MaltaMr. Alan Deidun, International Environment Institute, University of MaltaMr. Paul Gatt, International Environment Institute, University of MaltaMr. Edwin Lanfranco, International Environment Institute, University of MaltaMr. Adrian Mallia, Planning Authority, MaltaProf. Patrick Schembri, International Environment Institute, University of MaltaMr. Darrin Stevens, Environment Protection Department, MaltaMs. Josienne Vassallo, International Environment Institute, University of Malta

Moroccan team
Co-ordinator Prof. Abdellatif Bayed, Institut Scientifique, Université Mohamed V, RabatProf. Mohamed Ater, Faculté des Sciences de TetouanMr. Abdellatif Chaouti, Institut Scientifique, Université Mohamed V, RabatProf. Mohamed Dakki, Institut Scientifique, Université Mohamed V, RabatProf. Mohammed-Aziz El Agbani, Institut Scientifique, Université Mohamed V, RabatProf. Bouchta El Fellah, Institut Scientifique, Université Mohamed V, RabatMr. Said Hajib, Administration des Eaux et Fore^ts et de la Conservation des Sols, RabatProf. Abdellatif Khattabi, Ecole Nationale Forestière d’Ingénieurs, Salé
Portugese team
Co-ordinator Prof. João Carlos Marques, Istituto do Mar, Department of Zoology, Universityof Coimbra
Dr. Pedro Anastácio, Istituto do Mar, Department of Ecology, University of EvoraDr. Júlio Fonseca, Istituto do Mar, CoimbraDr. Silvia Gonçalves, Istituto do Mar, Coimbra.Dr Miguel Ângel Pardal, Istituto do Mar, Coimbra
Tunisian team – Agence de Protection et d’Aménagement du Littoral
Co-ordinator Mr. Habib Ben Moussa, Agence de Protection et d’Aménagement du Littoral, TunisMr. Adel Abdouli, Agence de Protection et d’Aménagement du Littoral, Tunis Mr. Fadhel Baccar, Agence de Protection et d’Aménagement du Littoral, TunisMr. Lassaad Douffani, Agence de Protection et d’Aménagement du Littoral, TunisMs. Anissa Ksia, Agence de Protection et d’Aménagement du Littoral, TunisMr. Mohamed Hedi Sfar, Agence de Protection et d’Aménagement du Littoral, TunisMrs. Sihem Slim, Agence de Protection et d’Aménagement du Littoral, TunisProf. Zeinab Ghrabi (consultant), Département d’Agronomie de l’Université de TunisMs. Sarra Mbazaa (consultant)Prof. Jeanne Zaouali (consultant), Département d’Agronomie de l’Université de Tunis
Tunisian team - Université de Tunis
Co-ordinator Prof. Faouzia Charfi-Cheikhrouha, Département de Biologie, Faculté desSciences, Tunis
Mr. Mohamed Aouini, Département de Géographie, Faculté de Sciences Sociales et Humai-nes, Tunis
Mr. Mohamed Fadhel Bouslama, Département de Biologie, Faculté des Sciences, TunisMr. Mohamed El Gtari, Département de Biologie, Faculté des Sciences, TunisProf. Moncef Gueddari, Département de Géologie, Faculté des Sciences, TunisDr. Karima Nasri, Département de Biologie, Faculté des Sciences, TunisProf. Ameur Oueslati, Département de Géographie, Faculté de Sciences Sociales et Humaines,
Tunis
United Kingdom team
Co-ordinator Ms. Alison Caffyn, Centre for Urban and Regional Studies, University of Bir-mingham
Mr. Derek Green, School of Biosciences, University of BirminghamMr. Guy Jobbins, Centre for Urban and Regional Studies, University of BirminghamDr. Elfed Morgan, School of Biosciences, University of BirminghamDr. Bob Prosser, Centre for Urban and Regional Studies, University of Birmingham
10 the meco partners

Acknowledgements
The MECO partners would like to acknowledge the help and support provided to fieldworkteams during the MECO project. In particular:
Mr. Adel Louati, Chef de Triage des Forêts Graiba, Sfax, TunisiaMr. Ammar Ben Hassine Fariq Tebinet, boatman and warden responsible for Kneiss islets, Sfax,
TunisiaThe Local Authority of Nefza-Zouara, TunisiaThe Local Authority of M’diq-Restinga-Smir, MoroccoThe Direction of the Maremma Regional Park, Tuscany, ItalyThe Direction of the Migliarino-San Rossore-Massaciuccoli Regional Park, Tuscany, Italy.
The MECO project ERB-IC-18-CT-98-0270 was funded by the European CommissionINCO-DC Programme.
“baseline research for the integrated sustainable management…” 11

introduction
Felicita Scapini
The key words in this manual are diversity and integration. The subjects of studyare diverse: the Mediterranean coasts, low or high, with different exposure, small orwide tidal ranges, beaches stretching for kilometres or small pocket beaches, degrad-ed or pristine… Sandy beaches are sometimes peaceful resorts, ideal for sun bathingand relaxing, at other times they are terrifying places because of the force of windsand waves. The seasonal differences in the Mediterranean region are often dramatic,from summer droughts to heavy winter rainfall and floods (Braudel, 1985). Alsodiverse are the uses of beaches, with fishing villages, coastal cities, ports, naturalreserves, mass tourism resorts or élite tourism enclaves. We would like to add marineresearch stations to this list, but there are not many in the Mediterranean, particu-larly on the southern coasts.
Modern tourists are largely peaceful but tourism itself creates much damage to theenvironment. This is in contrast to travellers and explorers in the past who may havecarried guns for their own defence but did little damage (Leed, 1995). Activitieslinked to tourism can be as harmful to the environment as conflicts and wars used tobe. Tourism often reduces diversity, construction along coasts destroys natural andcultural heritage. When we speak of the Mediterranean, we must specify which coast,northern, southern, eastern, western, European, non European, Arabic speaking,French, Italian, Spanish, Greek…, and be aware of the cultural and natural diversity.
The Mediterranean is the only internal sea bordered by different continents,Europe, Africa and Asia. These three continents are thus separated or linked, depend-ing on the point of view, by the same sea. The threefold origin of lands explains thediversity of fauna and flora, as well of civilisations. There is one particular plant com-mon on each side of the Mediterranean, the olive tree. Interestingly, this plant is oneof the most ancient symbols of peace. The ancient wisdom used to say that theMediterranean consists of the places where olive trees grow (Matvejevic, 1987).Nowadays a common feature of the influence of the Mediterranean sea is the diffu-sion of plastic debris on the coasts, either abandoned by beach users or deposited bythe sea during storms (Löfgren, 2001). Such plastic debris appears as a unifying cul-ture. But such culture is a poor one, less diversified than the ancient ones, which usedto exchange valuable products such as silk, olive oil and spices.
Looking back to the past history of the region, it appears that major threats topeace in the region have been the attempts of unification, either starting from the
northern coast or from the south, for example the ancient Roman and Punic con-flicts. The concept of integration should take the place of unification. In the past theMediterranean experienced the Greek-Roman cultural integration and the Arabicone. The current Mediterranean heritage takes much from both. Systems theoryexplains how integration is achieved. In a complex system diverse elements interactand integrate without losing their characteristics to the advantage of the system. Awell integrated system is buffered against disturbing factors. But a system becomesweak as elements get fewer and interactions are disrupted.
The purpose of this manual is to make environmental managers and policy mak-ers aware of the existing diversity in Mediterranean sandy and low coasts, environ-ments highly threatened by economic development, and of the value of coastal diver-sity in view of sustainable development. This manual proposes concrete tools andpractical methods. It shows that the conservation of natural heritage is not onlyimportant theoretically but also feasible in reality. The manual presents the experi-ence of the three year “MECO project”. This project (1998-2001) was financiallysupported by the European Commission in the framework of the International Co-operation Programme with Mediterranean Partner Countries. The project was enti-tled Bases for the Integrated Sustainable Management of Mediterranean Sensitive CoastalEcosystems. The acronym MECO takes the initials of the key words, MEditerranean,COasts and ECOsystem, its meaning is thus manifold. Manifold are also the bases orperspectives, geographic, geomorphological, biological and socio-economic. Thepartnership is composed of scientists with different cultural backgrounds and ofcoastal managers. The partner countries included Italy, Malta, Morocco, Portugal,Tunisia and the United Kingdom. Based on a multidisciplinary starting point, theMECO partnership conducted integrated research. Practical integration was achievedin the field, where scientists with different backgrounds came together and interact-ed, each taking advantage of the experience of the others.
It was important for this purpose to focus on a few specific study sites. These willbe described in detail in the manual (Chapter 2). Their diversity will appear clearly,the choice being not theoretically guided, but dictated by practical reasons. Partnersin Morocco, Tunisia and Malta, each proposed one or two local case-study sites,which were of interest for the country, as well as representative of the Mediterraneandiversity and issues. In a second phase, integration was practically achieved throughmeetings in each country, near the study site, where the different baseline studieswere discussed and synthesised. The value, weaknesses, potentialities, constraints andmanagement of each study site were studied. A major challenge was the diversity oflanguages, not only the national languages, which were in great measure shared bythe partnership, but by the discipline specific languages. Geographers, geologists,biologists, socio-economists and coastal managers had to explain specific conceptsand methods to each other; each participant had to understand other points of viewand spatial scales.
The methods, achievements and guidelines developed from the research are pre-sented in this manual and represent a baseline starting point for the sustainablecoastal management in the Mediterranean. Managers and policy makers often
14 introduction
urgently ask scientists for inputs. Sometimes such inputs take considerable time orare not in a suitable format. Scientific recommendations are not always developed inan easily applicable format for practical implementation. This manual responds tothis problem. It has two target readers, coastal managers and scientists willing to con-tribute to a sustainable coastal management. The manual is also recommended foruse in degree and masters courses in coastal management in the Mediterraneanregion.
The manual starts with a framework section (Chapter 1) to establish key conceptsand perspectives. Coastal managers are then taken through practical site characteri-zation (Chapter 2), audits which will be useful in relation to sustainability (Chapter3), the competencies that will be necessary and, last but not least, what support isavailable in the Mediterranean to apply the proposed methodology (this informationis at the end of each section of Chapter 3 on techniques). Relevant specific conceptsare explained in each section. Scientists will learn how different disciplines can con-tribute to site characterization, audits and identifying indicators of change (Chapters3 and 4), the type of information coastal managers need to develop managementplans and how a management plan is done in practice (Chapter 5). Real examples areused in the manual including specific methodologies used at particular sites; thechoice of the concepts presented was dictated by their usefulness; the methods pro-posed have been proven to achieve useful results.
Diversity is still present in the manual: diversity of languages, points of view andstyles of presentation. We are giving to readers a product of the Mediterranean her-itage. Such diversity should be the base for future developments and integration. Infact, we hope that this manual is not an end point, but will be the baseline for fur-ther evolution. Readers are asked to contact us and pose their criticisms and sharetheir different experiences.
References
Braudel F. (1985) La Mediterranée, Flammarion, Paris. Trad. It: Il Mediterraneo, Bompiani,Milano, 1997.
Leed E. (1995) Shores of discovery. How expeditionaries have constructed the world, Basic Books,Harper Collons Publishers, New York. Trad. It: Per mare e per terra, Il Mulino, Bologna,1996.
Löfgren O. (2001) On Holiday : A History of Vacationing, University of California Press, Berke-ley (USA); Trad. it. Storia delle vacanze, Bruno Mondadori, Milano.
Matvejevic P. (1987) Mediteranski Brevijar, GZH Zagabria; trad. it: Mediterraneo, un nuovo bre-viario, Garzanti, Milano, 1998.
“baseline research for the integrated sustainable management…” 15

chapter 1
frameworks for planning and managementfor sensitive coastal area environments

1.1 planning and management framework
Louis F. Cassar and Josienne Vassallo
1.1.1 Introduction
Beaches are dynamic coastal environments much dependent on the accumulationof sediments. The availability and subsequent transport and deposition of these sed-iments, often of sand size and larger, depend on a number of physical factors andprocesses. These may involve elements such as the geophysical characteristics of thestratigraphy within a given area and the processes of erosion acting upon the rockyexposures that make up nearby headlands and exposed rocky shorelines. Sedimentmay also originate from nearby beaches in the form of recycled materials, as a resultof accelerated erosion. Moreover, seabed topography and bathymetry of the immedi-ate embayment as well as the physical aspect of terrestrial drainage sources, includingvalley systems and associated watershed, often have a significant influence on beachdevelopment.
Depending on the type and source of beach sediments, as well as the existingtopography of the coastal region in question, a beach will develop and evolve accord-ingly. Equally important is land-use. Projects of an infrastructural nature and modi-fications of the landscape, say for agriculture, have over the years had an impact oncoastal regions. This is especially true for sandy beaches with accompanying sanddune sites. Numerous Mediterranean coastal dune sites have suffered degradationand subsequent decline as a result of new infrastructure and development along thelittoral, but also much further inland.
Dunes, being dynamic formations, are a prime example of complex and inter-connected processes involving geomorphology, including erosion, sediment transportand deposition; hydrological regimes and micro-climate; topography and landscape;sea currents and bathymetry; terrestrial vegetation cover; and land-uses. In particular,land-uses, both on the coast proper as well as in hinterland areas, may affect dunal,as well as beach development in various ways. Perhaps a classic example of a mega-project, which was carried out much further afield of the Mediterranean coast but hassignificantly influenced an entire coastal region near Alexandria, is the Aswan HighDam construction project. Beach development may be considered a product of therate of alongshore supply of sediment. Natural interruptions in sediment supply maybe spatial, causing displacements of the input sites or changes in the direction of sed-iment transport, or they may be temporal, that is, related to the sequences of sedi-ment availability at a particular location. Variation in beach sediment budgets may
encompass both spatial and temporal changes, thereby increasing the complexity ofcoastal beach and dunal assemblages.
When considering coastal dune development, the importance of foredunes (thatis, that portion of the beach/dune profile that is actively exchanging sediment withthe beach) cannot be overstressed. Compared to the vast range of existing dune types,the coastal foredune is a unique morphological assemblage in that it has a restrictedspatial association, and is defined by the dynamics which characterize the beach zoneas well as the ‘traditional’ dynamics of aeolian processes that give rise to subsequentdune forms. Coastal foredune development is thus closely related to sediment bud-get variation in the dune and beach components of the profile.
1.1.2 Integrated coastal area management
Sectoral planning as well as narrow and poorly coordinated environmental man-agement practices have induced various environmental problems and often broughtabout untenable situations. This is especially the case in coastal areas, where the com-plexity and dynamics that govern such regions are not fully understood and, as aresult, mismanaged. Through an integrated approach to environmental management,decisions that pertain to policy and the management of resources can be taken on thebasis of long-term goals based on strategic assessment and on the concept of sustain-able utilization of resources.
Since environmental concerns cut across interdisciplinary boundaries, it maysometimes be difficult to tackle certain issues without involving specialists from dif-ferent disciplines (Barrow, 1999). Moreover, some areas are, by their very nature,multidisciplinary. In this respect, therefore, a holistic approach to decision-makingand resource management is of paramount importance in view of the complex inter-actions that involve the land and sea interface within the coastal zone. Thus, Inte-grated Coastal Area Management (ICAM), which recognises the interconnectednessof coastal regions and aims to provide a strategic approach to planning, may be theappropriate response to balance the demand for coastal resources and resolve conflictsof use. ICAM must be seen as a proactive mechanism that promotes environmentalsound technologies that are likely to minimise risk and, where possible, seek toappraise existing problems in their totality (rather than tackle issues in a sectoralmanner) through strategic assessment.
ICAM is a continuous and iterative process, designed to promote the sustainableuse of resources in coastal areas. Long-term ICAM seeks to balance the socio-eco-nomic benefits derived from economic development and human uses. This processinvolves the integration of objectives and instruments needed to meet these objectives(Commission of the European Communities, 1999; Trumbic and Bjelica, 2001). Inprinciple, ICAM caters for “planning” in its broadest sense, that is, adopting a linetowards strategic policy development; and “management” options which comprisethe assemblage of information, monitoring and evaluation for review, and imple-mentation. The participation and involvement of key stakeholders in ICAM is a cru-
20 frameworks for planning and management
cial element for any eventual decision-making, especially where trade-offs are con-cerned.
The development and execution of an ICAM programme can be conducted in a3-phase approach, involving (i) the initial setting of objectives, (ii) the planning stages,and (iii) implementation (Trumbic and Bjelica, 2001). In applying such method,which stems from the basic steps to plan-making, i.e., “Survey-Analysis-Plan”, it needsto be ensured that its focus, on issues pertaining environmental planning and man-agement, is broadened to integrate socio-developmental concerns. For environmentalstrategies to be implemented with a fair degree of success, in addition to sound tech-nical and economic analysis, an understanding of the nature of the area on whichchange is being proposed is equally important. This information component is a pre-requisite to strategic planning and should precede the stages of policy-making and iden-tification of priority actions. Successful strategies involve three elements:
� identifying priority problems� defining priority actions� ensuring effective implementation
The first phase, therefore, consists of initiation of the process whereby problems andissues are identified and analysed. This is followed by policy formulation and priority-setting as well as budgetary considerations. The second phase shall involve various stagesin the planning process, ranging from preliminary planning to site plan analysis and fore-casting. Moreover, management goals will be fine-tuned during this phase and strategiesimproved. The third and final phase involves implementation. This consists of the day-to-day running of the programme and should ensure monitoring and evaluation for sub-sequent review and revision through adequate feedback mechanisms. Ultimately, aneffective Integrated Coastal Area Management programme is facilitated through theactive cooperation of key actors and is driven by communication and participation.
1.1.3 Planning approach
As discussed earlier, environmental planning and management is not a stand-alone discipline. It is a conglomeration of attributes, which require a fair amount ofconfluence prior to attempting to ‘plan’ as it were, using raw facts (data), processeddata (information) and available methods for collecting and processing the formertwo components (techniques). It requires the input of different specialisms, depend-ing on the nature of the changes and activities being proposed. In the case of plan-ning a conservation strategy for coastal areas including beach environments and asso-ciated habitats such as sand dunes, it may be said, from the onset, that a land-useplanning approach would be much too conservative and narrow in scope. A planningmethod concerned with the natural/rural system as a whole is thought to have a widerscope and therefore be more appropriate, since this would consider the complexity andrationality and the re-distributional effects of the system in its entirety.
The classic systems approach, a more conservative view to planning and one which
“baseline research for the integrated sustainable management…” 21
was quite commonly adopted throughout Europe until mid-twentieth century andeven later, consists of the breakdown of all known components into categories. Intheory, this approach advocates that if one should be capable of describing the ‘inter-est area’, then one should be able to plan. However, since the future is unpredictableand uncertain, and considering that there are many other factors, which may over-come plans and predictions, in particular when these relate to the natural environ-ment, habitats or ecosystems, then this approach may prove, in practice, too rigid.Theoretically, there are some elements over which the planner has some control, suchas knowledge of major unique locations and constraints on land-use; planners mayalso influence other variables such as social facilities, land supply policies and, hous-ing and transportation policies. However, in a situation that involves a natural coastalhabitat, where ecosystem vulnerability, economic viability and the social fabric musteach (individually and holistically) be taken into account, a comprehensive broad-based management approach is deemed most appropriate.
The Mediterranean coastal zone, where, among other important habitats, beach-es and sand dunes occur, is a region exposed to a multitude of pressures. At a timewhen a fair proportion of the region’s coast has been taken up by development or isaffected by it, and when nature conservation appears to rank highly on national andmultilateral agendas, the approach must be two-pronged:
� Goal-oriented (goal-specific)� Problem-solving (incremental)
Under optimum conditions System Planning, a cyclical planning-type process,would probably fit best into the evolution of a ‘protected coastal area programme’.However, there is no hard and fast rule as to which planning approach should be con-sidered. Given that the Mediterranean Basin is a region of contrasts, with diverse socio-political and economic opportunities, it may well be the case to amalgamate, say, twomodes of planning, for example, System Monitoring and Evolutionary. Although these,at first, may seem to oppose one another, since System Monitoring tends to advocate a‘minimize change approach’ while Evolutionary (a future-oriented mode of planning)is more for stimulating change, the integration of modified planning functions wouldmake different planning modes complementary of one another in a complex coastalzone scenario. Whichever planning mode is adopted, the process may be addressedthrough a strategic plan, or as an appendage of a national biodiversity strategy, with aview to minimizing constraints, particularly at the implementation level.
The first important steps in environmental planning include problem identificationand the setting of priorities, and subsequently, the identification of underlying causes, ofwhich, the identification of underlying causes is crucial to formulating appropriate poli-cies and targeting interventions, and requires an understanding of the link between causeand effect of a specific environmental problem affecting coastal habitats. In ideal cir-cumstances this initial phase ought to be followed by the ranking of environmentalactions, a process that encourages the maximization of net benefits and involves (i) esti-mation of control costs; and, (ii) valuation of benefits from conservation actions(Lampietti and Subramanian, 1995). Clearly, a multi-faceted plan must come into play,
22 frameworks for planning and management

“baseline research for the integrated sustainable management…” 23
bringing together nature conservation, the management of natural resources throughexisting legislation, and the socio-economic requirements of the stakeholders. As muchas possible, every effort should be made to seek common ground, although often diffi-cult, among opposing interest groups, since neither nature conservation nor economicactivity can be efficiently managed without a certain amount of interaction between thetwo. Furthermore, the planning process must also consider that land-use priorities ofany one site may vary with time and that its potential benefits may be greater in thefuture. The ideal situation, therefore, would be to apply a fair amount of restraint ondevelopment and, in cases where endangered coastal habitats are concerned, decision-makers may even consider placing proposed plans, likely to result in irreversible andlarge scale land-use change, in abeyance. In other words, it is better to err on the side ofcaution when in doubt about the possible implications a project may have on the envi-ronment. In so doing, the rights of future generations are not compromised!
There is, of course, no single correct way of implementing a strategy, and manypossible versions of the above approach exist. The objective is to be pragmatic andincremental - aiming not for perfection but for constant improvement. The accenton participation, in the strategy, cannot be overstressed. This needs to be both wideand deep, involving as many people as possible from all sectors of society.
1.1.4 Economics of conservation areas
The dominant economic model in the world today is predicated on the assumptionsthat national economies and markets must continually grow if humankind is to pros-per and progress (Tisdell, 1993), usually at the expense of the natural environment.“The Gross National Product (GNP) is usually considered an adequate measure of thisgrowth even though it does not take into account the loss of natural wealth or qualityof life” (Romero, 1993). Such assumptions have led governments of less developednations to institute unsustainable and exploitative policies, as they endeavour to ‘devel-op’ their countries along the same economic model as that of industrialized nations.
Conservationists argue that, aspiring to the levels of consumption (and pollution)of industrialized countries is unattainable and undesirable. The conservation lobbythus advocates a reduced rate of growth as well as national accountability of the ‘true’value of natural resources. However, the difficulty with accountability lies in valuingthe numerous contributions coastal protected areas make to a national or local econ-omy, since value is generally assessed in monetary terms and not all natural functionsand services lend themselves to a monetary value. This is especially the case of cost-benefit analysis (CBA), which demonstrates serious limitations in that, this approachhas difficulty in reconciling monetary valuation with social and environmental issues.
1.1.5 Biodiversity corridors
In locations where rare or endangered coastal habitat-types are scattered through-out a region and subjected to anthropogenic pressures from unsustainable activities,
24 frameworks for planning and management
some form of physical ‘contact’ between them needs to be ensured. It is widelyacknowledged that species preserved in isolation in scattered conservation areas mayeventually die out from lack of genetic diversity needed to maintain strong popula-tions. Without the natural dispersal of genetic material afforded by contiguous nat-ural zones, protected species are more vulnerable to effects (natural and human) thatcould eradicate whole populations.
In an effort to allow communities to adapt to certain changes, the planner, inplanning conservation areas programmes, should seek to design biodiversity corridorsto ‘connect’ the various habitats so as to ascertain natural genetic dispersal. To ensurethat biodiversity corridors are respected, it is not enough to delineate their bound-aries and embark on a buffer zone management programme, it is imperative that thecooperation of local resource users is sought. This can only be achieved, long-term,through an intensive environmental education programme coupled by a vigorouswardening system. In the end, conservation area system plans should be the productof informed consensus among all interested parties.
Notwithstanding the fact that coastal habitats need to be afforded adequate con-servation measures, foremost to any management plan is the concept that no protect-ed area is an island. It must be acknowledged that beach environments are connect-ed to their surroundings in a myriad of ways - ecologically, socially, economically andculturally - and are part of a larger landscape linked to a diverse range of factors thatinteract with them, and the elements of those linkages are dynamic not static.
1.1.6 References
Barrow C.J. (1999) Environmental management: principles and practice, Routledge, London andNew York.
Cassar L.F. (1996) Coastal dunes: form and process. Geomorphology, ecology and planning andmanagement for conservation. Unpublished MSc dissertation in Environmental Planning andManagement, International Environment institute, University of Malta, Malta.
Commission of the European Communities (1999) Towards a European Integrated Coastal ZoneManagement (ICZM) strategy ~ general principles and policy options, European Communities,Office for Official Publications of the European Communities, Luxembourg.
Lampietti J.A. and Subramanian U. (1995) Taking stock of national environmental strategies, TheWorld Bank, Washington.
Romero A. (1993) Economic contribution of Venezuelan protected areas: the tragedy of thecommons and perspectives. In: Parks and Progress. Proceedings of the IV World Congress onNational Parks and Protected Areas, Caracas, Venezuela. IUCN, Gland.
Tisdell C. (1993) Conservation, protected areas and the global economic system: how debt,trade, exchange rates, inflation and macroeconomic policy affect biological diversity. In: Parksand Progress. Proceedings of the IV World Congress on National Parks and Protected Areas, Cara-cas, Venezuela. IUCN, Gland.
Trumbic I. and Bjelica A. (2001) Institutional arrangements for implementing IntegratedCoastal Area Management. In: Cassar, L.F. (Ed.), Integrated Coastal Area Management ~ Train-ing Package. Part one: Training Manual, ICS-UNIDO, Vienna.

1.2 geomorphological frameworkle cadre gémorphologique:
epargner aux plages le dangerde l’érosion marine
Ameur Oueslati
1.2.1 Introduction
Les interventions, dans toute unité naturelle, qui se veulent rationnelles et sansgrands risques doivent s’appuyer à une définition précise et rigoureuse ainsi qu’à unetrès bonne connaissance de la dynamique, de l’histoire et des tendances de l’évolutiond’une telle unité. Ces conditions sont d’autant plus impératives que l’unité en que-stion est ouverte et entretient des échanges avec d’autres unités et milieux. Tel estle cas des plages sableuses qui, en plus, sont aujourd’hui particulièrement convoi-tées par les aménageurs et appelées à affronter une conjoncture difficile à causenotamment du recul de leur budget sédimentaire et de l’élévation du niveau marinprévue pour les prochaines décennies.
Pour parer aux risques que pourrait entraîner une telle conjoncture, notammentl’érosion marine, et aux formes de déséquilibres et de dégradation pouvant résulterdes aménagements, les plages doivent être considérées comme étant:
– Des formes qui ne se limitent pas à la seule bande sableuse sur laquelle s’étendentd’habitude les baigneurs;
– Des formes à profils très changeants; – Des espaces ouverts et dépendants de la dynamique des milieux qui les encadrent;– Des formes capables de s’adapter aux caprices de la nature.
1.2.2 Des formes qui ne se limitent pas à la seule bande sableuse sur laquelle s’éten-dent d’habitude les baigneurs
Une plage est une forme d’accumulation formée par les vagues, au contact de lamer et de la terre ferme et dont le modelé peut porter l’empreinte d’une activitéeolienne importante. Elle a une constitution assez complexe avec trois domaines: l’a-vant plage, le bas de plage et le haut de plage (Fig. 1.2.1).
Ce dernier correspond généralement à un bourrelet appelé aussi dune bordière ouavant-dune. Son développement est, en partie, favorisé par des plantes adaptées àl’environnement littoral et capables de fixer le sable poussé par le vent depuis le basde plage.

1.2.3 Des formes à profils très changeants
Si le spécialiste de la géomorphologie littorale insiste sur la trilogie “avant plage,bas de plage et dune bordière” c’est parce que ces domaines sont très complémentai-res et solidaires l’un de l’autre. Ceci apparaît en particulier à travers les échanges sédi-mentaires qui s’y opèrent (Fig. 1.2.2) et qui constituent pour la plage un moyen d’au-todéfense lors des moments difficiles. Ces échanges témoignent, en même temps, durôle capital de réserve en sédiments que peut jouer la dune bordière et du caractèrejamais définitif du profil de la plage.
26 frameworks for planning and management
Fig. 1.2.1 Les grandes subdivisions d’une plage sabbleuse
Fig. 1.2.2 Une plage évoluant à l'état naturel: En A, début de la saison des tempêtes, les vaguesenvahissent le bas de plage et atteignent la dune bordière et commencent à leur arracher du sable (1).En B, le matériel arraché (2) est l'accumulé dans le domaine de l'avant plage; une barre (3) se formeentraînant un affaiblissement de la profondeur des eaux et oblige les vagues à briser à des distancesde plus en plus éloignées de la ligne de rivage. Ainsi, bas et haut de plage échappent progressivementà l'attaque directe des vagues déferlantes. En C, au cours de la belle saison l'évolution inverse se pro-duit; les sédiments accumulés dans l'avant plage sont restitués au bas de plage par les vagues (4) puisau haut de plage par le vent (5)
Si bien qu’une plage peut, tant qu’elle évolue à l’état naturel et que sa dynamiquen’est pas perturbée, être entamée par les vagues et montrer des signes d’érosion à lasuite des tempêtes mais tout se corrige pendant la belle saison (Fig. 1.2.2).
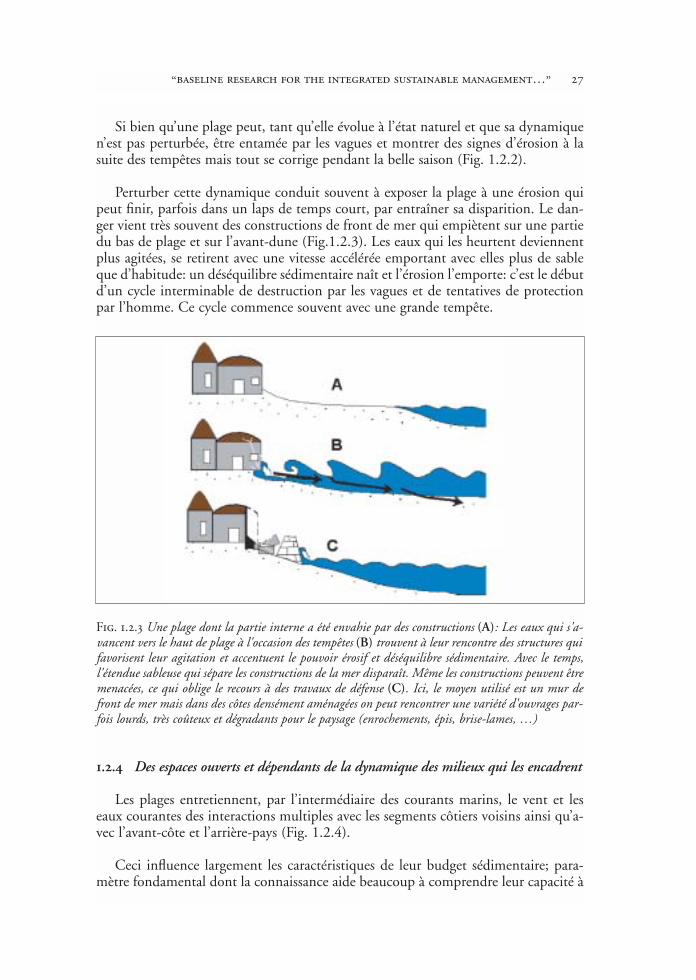
Perturber cette dynamique conduit souvent à exposer la plage à une érosion quipeut finir, parfois dans un laps de temps court, par entraîner sa disparition. Le dan-ger vient très souvent des constructions de front de mer qui empiètent sur une partiedu bas de plage et sur l’avant-dune (Fig.1.2.3). Les eaux qui les heurtent deviennentplus agitées, se retirent avec une vitesse accélérée emportant avec elles plus de sableque d’habitude: un déséquilibre sédimentaire naît et l’érosion l’emporte: c’est le débutd’un cycle interminable de destruction par les vagues et de tentatives de protectionpar l’homme. Ce cycle commence souvent avec une grande tempête.
1.2.4 Des espaces ouverts et dépendants de la dynamique des milieux qui les encadrent
Les plages entretiennent, par l’intermédiaire des courants marins, le vent et leseaux courantes des interactions multiples avec les segments côtiers voisins ainsi qu’a-vec l’avant-côte et l’arrière-pays (Fig. 1.2.4).
Ceci influence largement les caractéristiques de leur budget sédimentaire; para-mètre fondamental dont la connaissance aide beaucoup à comprendre leur capacité à
“baseline research for the integrated sustainable management…” 27
Fig. 1.2.3 Une plage dont la partie interne a été envahie par des constructions (A): Les eaux qui s'a-vancent vers le haut de plage à l'occasion des tempêtes (B) trouvent à leur rencontre des structures quifavorisent leur agitation et accentuent le pouvoir érosif et déséquilibre sédimentaire. Avec le temps,l'étendue sableuse qui sépare les constructions de la mer disparaît. Même les constructions peuvent êtremenacées, ce qui oblige le recours à des travaux de défense (C). Ici, le moyen utilisé est un mur defront de mer mais dans des côtes densément aménagées on peut rencontrer une variété d'ouvrages par-fois lourds, très coûteux et dégradants pour le paysage (enrochements, épis, brise-lames, …)
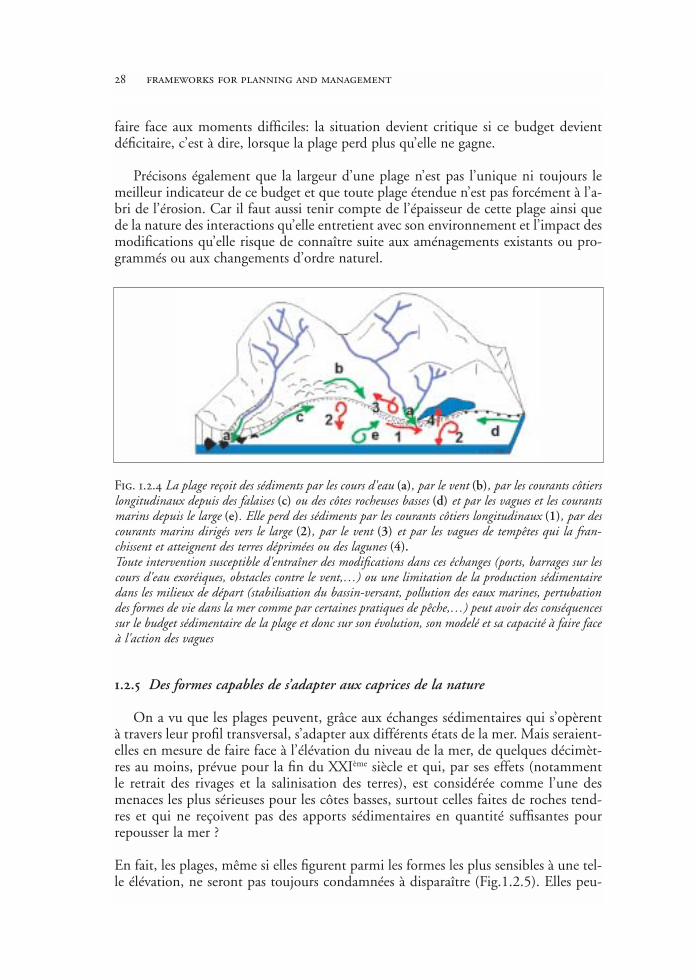
faire face aux moments difficiles: la situation devient critique si ce budget devientdéficitaire, c’est à dire, lorsque la plage perd plus qu’elle ne gagne.
Précisons également que la largeur d’une plage n’est pas l’unique ni toujours lemeilleur indicateur de ce budget et que toute plage étendue n’est pas forcément à l’a-bri de l’érosion. Car il faut aussi tenir compte de l’épaisseur de cette plage ainsi quede la nature des interactions qu’elle entretient avec son environnement et l’impact desmodifications qu’elle risque de connaître suite aux aménagements existants ou pro-grammés ou aux changements d’ordre naturel.
1.2.5 Des formes capables de s’adapter aux caprices de la nature
On a vu que les plages peuvent, grâce aux échanges sédimentaires qui s’opèrentà travers leur profil transversal, s’adapter aux différents états de la mer. Mais seraient-elles en mesure de faire face à l’élévation du niveau de la mer, de quelques décimèt-res au moins, prévue pour la fin du XXIème siècle et qui, par ses effets (notammentle retrait des rivages et la salinisation des terres), est considérée comme l’une desmenaces les plus sérieuses pour les côtes basses, surtout celles faites de roches tend-res et qui ne reçoivent pas des apports sédimentaires en quantité suffisantes pourrepousser la mer ?
En fait, les plages, même si elles figurent parmi les formes les plus sensibles à une tel-le élévation, ne seront pas toujours condamnées à disparaître (Fig.1.2.5). Elles peu-
28 frameworks for planning and management
Fig. 1.2.4 La plage reçoit des sédiments par les cours d'eau (a), par le vent (b), par les courants côtierslongitudinaux depuis des falaises (c) ou des côtes rocheuses basses (d) et par les vagues et les courantsmarins depuis le large (e). Elle perd des sédiments par les courants côtiers longitudinaux (1), par descourants marins dirigés vers le large (2), par le vent (3) et par les vagues de tempêtes qui la fran-chissent et atteignent des terres déprimées ou des lagunes (4).Toute intervention susceptible d'entraîner des modifications dans ces échanges (ports, barrages sur lescours d'eau exoréiques, obstacles contre le vent,…) ou une limitation de la production sédimentairedans les milieux de départ (stabilisation du bassin-versant, pollution des eaux marines, pertubationdes formes de vie dans la mer comme par certaines pratiques de pêche,…) peut avoir des conséquencessur le budget sédimentaire de la plage et donc sur son évolution, son modelé et sa capacité à faire faceà l'action des vagues
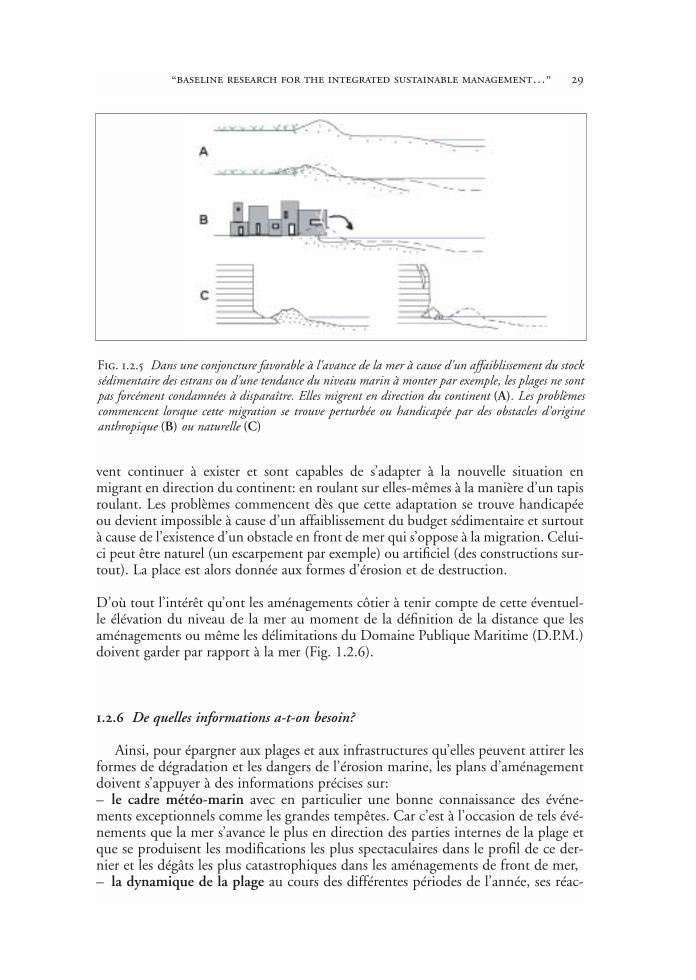
vent continuer à exister et sont capables de s’adapter à la nouvelle situation enmigrant en direction du continent: en roulant sur elles-mêmes à la manière d’un tapisroulant. Les problèmes commencent dès que cette adaptation se trouve handicapéeou devient impossible à cause d’un affaiblissement du budget sédimentaire et surtoutà cause de l’existence d’un obstacle en front de mer qui s’oppose à la migration. Celui-ci peut être naturel (un escarpement par exemple) ou artificiel (des constructions sur-tout). La place est alors donnée aux formes d’érosion et de destruction.
D’où tout l’intérêt qu’ont les aménagements côtier à tenir compte de cette éventuel-le élévation du niveau de la mer au moment de la définition de la distance que lesaménagements ou même les délimitations du Domaine Publique Maritime (D.P.M.)doivent garder par rapport à la mer (Fig. 1.2.6).
1.2.6 De quelles informations a-t-on besoin?
Ainsi, pour épargner aux plages et aux infrastructures qu’elles peuvent attirer lesformes de dégradation et les dangers de l’érosion marine, les plans d’aménagementdoivent s’appuyer à des informations précises sur:– le cadre météo-marin avec en particulier une bonne connaissance des événe-ments exceptionnels comme les grandes tempêtes. Car c’est à l’occasion de tels évé-nements que la mer s’avance le plus en direction des parties internes de la plage etque se produisent les modifications les plus spectaculaires dans le profil de ce der-nier et les dégâts les plus catastrophiques dans les aménagements de front de mer, – la dynamique de la plage au cours des différentes périodes de l’année, ses réac-
“baseline research for the integrated sustainable management…” 29
Fig. 1.2.5 Dans une conjoncture favorable à l'avance de la mer à cause d'un affaiblissement du stocksédimentaire des estrans ou d'une tendance du niveau marin à monter par exemple, les plages ne sontpas forcément condamnées à disparaître. Elles migrent en direction du continent (A). Les problèmescommencent lorsque cette migration se trouve perturbée ou handicapée par des obstacles d'origineanthropique (B) ou naturelle (C)

tions aux données météo-marines et surtout les modifications qui affectent aussibien son profil transversal que l’épaisseur de ses sédiments; données à travers les-quelles se dégagent formes d’adaptation et d’autodéfense face aux agents en action.Des mesures et des relevés répétés sur le profil de la plage, directement sur le terrainet sur des périodes significatives, constituent le meilleur moyen pour comprendrecette dynamique,– le budget sédimentaire de la plage en considérant les aménagements, entreprisou programmés (barrages, ports, destructions d’herbiers par la pêche ou la pollu-tion, travaux de protection dans les segments côtiers voisins,…) qui sont suscepti-bles de l’influencer et pourtant d’entraîner des modifications dans la dynamiquemarine et la position du rivage. La définition de la distance à garder par rapport àla mer par exemple, doit tenir compte, entre autres paramètres, de la réaction de cebudget sédimentaire à de tels aménagements,…
Exemples: Des constructions implantées sur une plage privée des apports sédimentairesdepuis le continent ou depuis des segments côtiers voisins par exemple (suite à la cons-truction d’un grand barrage sur le cours d’eau qui y débouche ou l’aménagement d’unport), ne tarderont pas à se trouver en difficulté. Au contraire des constructions implan-tées du côté de la face, exposée à la dérive littorale principale, d’un ouvrage s’avançanten mer (jetée d’un port, épi,…) verront leur plage s’élargir (Fig. 1.2.7).
Fig. 1.2.6 Réaction d’une plage à une élevation du niveau marin et conséquences sur les aménage-ments de front de mer
30 frameworks for planning and management

L’implantation d’une borne de D.P.M. du côté de la face qui tourne le dos à la dérivelittorale principale d’un obstacle qui s’avance en mer risque d’être sans intérêt si elle netient pas compte du déplacement du rivage que peut provoquer cet obstacle,…
– la fréquentation humaine (intensité et mode) dans l’objectif de définir la capa-cité de charge de la plage. Une telle capacité peut être définie en partant de la super-ficie de la plage mais elle doit tenir compte aussi de la sensibilité de la faune et dela flore associées à son matériel. Ceci exige, outre l’observation répétée et des mesu-res directes sur le terrain, des enquêtes auprès des utilisateurs de la plage (estivants,occupants des constructions de front de mer,…),– l’histoire récente de l’environnement côtier: une approche rétrospective peutaider sérieusement, en permettant de mieux comprendre les tendances de l’évolu-tion la plage, à mieux définir les aptitudes à l’aménagement. Cette tâche oblige lerecours à différents documents: archives variées (textes, photos,…) et surtout à desobservations minutieuses du terrain (modelés de détail, mesures répétées sous desconditions météo-marines différentes, recherches de traces significatives pour l’évo-lution et exploitation de tout repère pouvant éclairer sur la mobilité de la ligne derivage à commencer par les traces des anciennes variations du niveau marin et desvestiges archéologiques jusqu’aux aménagements modernes,– les prévisions relatives à l’évolution future du milieu naturel: l’approche pro-spective est désormais indispensable. Elle permet des réflexions fructueuses quant àla réaction de la plage aux modifications, d’ordre naturel (l’élévation du niveaumarin par exemple) ou anthropique, prévues dans l’avenir.
Des informations significatives concernant ces différents points peuvent autoriserdes modélisations et aider à mieux construire les scénarios d’aménagement.
“baseline research for the integrated sustainable management…” 31
Fig. 1.2.7 Schéma classique des effets d’un aménagement portuaire et d’une multiplication des con-structions à très peu de distance du rivage sur l’évolution de la plage dans une côte à dérive littoraleactive (indiquée par la flèche) portant vers une direction préférentielle: (1) port; (2) constructions; (3)plage élargie; (4) plage érodée (le trait discontinu indique l’ancienne position du rivage); (4) travauxde protection
1.3 biological framework
1.3.1 Introduction (Felicita Scapini)
Some activities, particularly those involving high number of people, such astourism, are likely to impact ecosystems, particularly when these are as fragile andlimited in space as are sandy-pocket beaches. Biologists are then asked to characteriseand estimate the biological value of a particular area with a view to management.Decision makers should take these estimates into account to preserve the natural her-itage for the benefit of the local population, the country and the whole region,including a concern for the future generations. Eco-audits are thus necessary to mon-itor changes in biological value and the sustainability of the management. This vol-ume presents some techniques for measuring diversity at different levels, from com-munities of different organisms and single species populations, to the level of theindividual genome (Chapter 3). Here the relevant concepts of diversity and biodi-versity are discussed, to clarify what should be measured and why.
Biodiversity is the most important concept in this context, and includes differentlevels of integration, from the ecosystem to the genes. It reflects the complexity of thedifferent life forms and their interactions with the environment, both physical andbiological. The more diverse the elements in an ecosystem, the more complex theexisting interactions and the less sensitive (i.e. more buffered) against changes it willbe. Sandy beaches are generally characterised by few abundant species, and the forc-ing factors are mainly physical (Brown and McLachlan, 1990; McLachlan, 2000).This is particularly true for the littoral zone where soft sediment is subject to rapiddehydration by direct sun light on the one hand, and is continuously influenced bywave and tidal action on the other. This zone is not colonised by plants, and thoseanimals living there depend on imported organic material of both marine and terres-trial origin. This explains the abundance of individuals and biomass of the few specieswhich are to be found here. Neighbouring zones, namely the sand dunes and the riv-er mouths, are characterised by their instability and sensitivity (Section 1.2). Howev-er, they often contain valuable and rare ecosystems, and discontinuities between somecoastal zones may give rise to islands of biodiversity, even if they are not physicallyseparated from the mainland.
Managers need to develop strategies which conserve the uniqueness of manysandy beach ecosystems, taking into account the high sensitivity of these natural envi-ronments.

1.3.2 Diversity and Biodiversity (João C. Marques)
Statisticians are generally unhappy with the diversity concept. The main reasonfor this might be the dynamics of diversity, which is permanently changing theinformation content, representing therefore a trouble in any set of definable prob-abilities. In fact, is basically impossible to stabilise variance in samples, since theentire model suffers from the typically irregular dynamic changes almost alwaysfound in nature. Such dynamics combines a general tendency to increase diversi-ty through different processes, with the occurrence of unexpected periods ofdecline, which are often spatially extensive. Therefore, although diversity can bemeasured, it can hardly be considered as a static property of samples proceedingfrom a given system.
Attempts have been made to discriminate between two components of diversity,i.e., the number of species in presence (species richness) and the uneven representa-tion of the different species (eveness). Nevertheless, these two components are corre-lated, since they emerge from an artificial division of the same distribution pattern,produced by our minds, and therefore it can be argued that there is no reason whywe should expect any clear advantage from such approach.
Another approach is represented by the “rarefaction methods” or extrapolationprocedures, which seek for estimating an “expected number of species”. Nevertheless,the statistical properties in the natural sets assumed by such methods, although inter-esting, are not proved, and therefore they cannot be recommended.
Even one of the simplest ways to express diversity, the rank frequency diagrams(Frontier, 1985) may be criticised, namely when certain features of the sequences, like“convexities” or “concavities” are interpreted as an effect of prevailing biological inter-actions. Although this might be possible, the most probable, and perhaps more realis-tic, explanation for such characteristics is that the initial conditions of the average pat-tern may simply reflect transient population oscillations affecting the species living con-currently in a given community. On the other hand, this constitutes an interesting start-ing point regarding the issue of seasonal variation and its irreversibility.
An additional problem in estimating diversity must be examined. It lies on thefact that modular organisms, for instance large marine macrophytes or macroalgae,cause difficulties in defining and counting individual organisms as such. Conse-quently, it becomes much more complicated to estimate diversity when we deal withsystems that combine big vegetal species or colonial animals with isolated individu-als, often belonging to a great number of different size strata. In such cases, to per-form estimations based on biomass provides only a partial solution. In fact, modularspecies are of great importance, namely because they behave as quite conservativegenetic pools. In other words, nature is too complex to be successfully described bysimple indices, and all the tries proposing new ways to estimate diversity couldn’t pro-vide any tangible conceptual progress.
This more than brief synopsis provides an approximate idea of the difficulties
“baseline research for the integrated sustainable management…” 33
involved in understanding the dynamics of diversity. Therefore, it is not pessimisticif we say that there is no conceivable “diversity index” capable of expressing thedynamics of mixed populations, exhibiting stabilised values through space and time.The difficulties may be summarised as follows:
a) The increase of diversity through time is inevitably gradual, more often than notassociated with the emergence and transformation of an organised system, but thedecrease of diversity is most frequently abrupt.
b) Looking to the spatial characteristics of ecosystems, we are forced to conclude thatit is impossible to have stabilised variance, which may lead us to favour any kindof spectral expression taking into account the way diversity may shift as a func-tion of the space considered. The problem in this case is that each spatial enlarge-ment provides a different spectrum as a function of the characteristics of new sitesadded to the sample.
c) Since the biosphere is a continuous, it is not adequate to set apart “local” diversi-ty (called α diversity) from diversity estimated by pooling discontinuous patches(β diversity) or measured at larger spatial scales (γ diversity), although, in a cer-tain extent, such description might become helpful to approach the biodiversityconcept.
We may say that, at present, biologists give less emphasis to the interpretation ofdiversity as an indicator regarding representative segments of the biosphere. Instead,the interest turned into “biodiversity”. This new term emerged suddenly by the endof the eighties in the past century, and its use expanded rapidly. Although it is stilldifficult to say where this new concept came from, biodiversity is, beyond any doubt,much more “saleable” and therefore much more appealing to decision-makers. Butlet’s appraise if the novelty restricts only to this “marketing” idea.
To some authors biodiversity may be seen as the full range of biological diversityfrom intraspecific genetic variation to the species richness, connectivity and spatialarrangement of entire ecosystems at a landscape level scale. This means that biodiver-sity concerns much less the existing numerical proportions among different taxonom-ic units and much more the absolute number of such taxonomic units or, in otherwords, genetic richness. In this sense, biodiversity represents a more holistic approachto ecosystem’s properties than the old diversity concept.
The biodiversity concept becomes especially interesting with regard to high diver-sity ecosystems, where the two properties, in their ultimate form, are not necessarilyrelated with higher biological or metabolic activities, rather the contrary. A goodexample of this is the profuse biological diversity in deep sea benthic environments,where the major driving force behind diversity development is the balance betweenthe energy flow, usually expressed in turnover, and the genetic differentiation relatedwith a hard survival in such environment.
Although more holistic, the biodiversity concept is indeed relatively simple, whichallowed to relieve the pressure concerning quantitative measures that prevailed formany years following the more conventional concept of diversity. On the other hand,such different perspective emphasised the goal of finding simple and comprehensive
34 frameworks for planning and management
regularities that may relate the total number of species found in samples with envi-ronmental changes at smaller (local) scales through speciation, migration, and extinc-tion processes. So to say, the previous diversity concept gave origin to biodiversity,which finally helped in making more precise his meaning. In fact, somehow, throughyears of use, the old concept of diversity had been side tracked to a kind of static sta-tistical problem, which in fact it is not since it finally expresses the dynamics ofecosystems as a whole. On the other hand, the emphasis on biodiversity allowed revi-talising taxonomic studies (this was most probably one of the ideas behind the shiftin concepts) and provides a better tool to assist the analysis of the structure anddynamics of the biosphere. The relations between the two concepts are therefore sig-nificant and may be described in an elegant way if we assume that Diversity developsfrom the stores of Biodiversity.
An example may illustrate even better the relations between the concepts of diver-sity and biodiversity as they generally used. It is well known that, independently fromthe local diversity regarding marine plankton communities, plankton blooms associ-ated with upwelling, which usually develop successively or in different places, con-cern only a few species. This is in many aspects similar to what we described withregard to cyclic changes in temperate terrestrial and aquatic ecosystems. Since in bio-diversity we include the reserve of genotypes, such marine plankton blooms may beinterpreted as “experiments in evolution” which borrow genotypes from the reserveof biodiversity, play with it and, genetically changed or unchanged, return it back tothe general store. The major interest of ecologists is typically focused on the mostactive segments of the yearly spectrum, associated with moderate or high biologicalactivity, here referred as “experiments in evolution”. From this perspective, it mightbe suggested that in temperate regions we should usually find a significant differencebetween actual diversity and total potential (bio)diversity, while for instance in equa-torial climates, where seasonal variations are meaningless, the difference betweendiversity and biodiversity should be not so large.
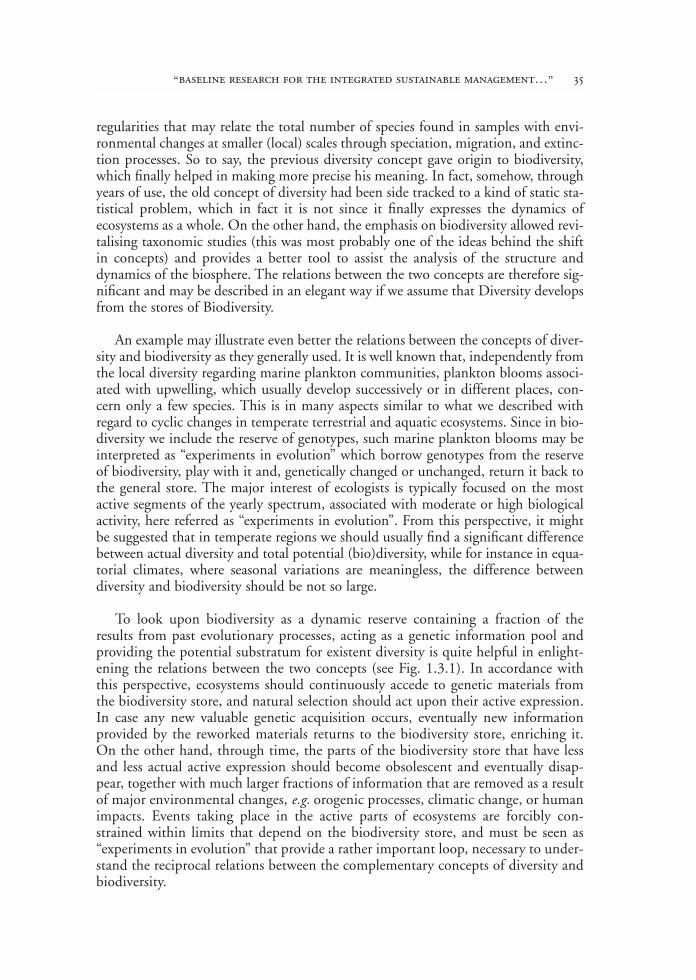
To look upon biodiversity as a dynamic reserve containing a fraction of theresults from past evolutionary processes, acting as a genetic information pool andproviding the potential substratum for existent diversity is quite helpful in enlight-ening the relations between the two concepts (see Fig. 1.3.1). In accordance withthis perspective, ecosystems should continuously accede to genetic materials fromthe biodiversity store, and natural selection should act upon their active expression.In case any new valuable genetic acquisition occurs, eventually new informationprovided by the reworked materials returns to the biodiversity store, enriching it.On the other hand, through time, the parts of the biodiversity store that have lessand less actual active expression should become obsolescent and eventually disap-pear, together with much larger fractions of information that are removed as a resultof major environmental changes, e.g. orogenic processes, climatic change, or humanimpacts. Events taking place in the active parts of ecosystems are forcibly con-strained within limits that depend on the biodiversity store, and must be seen as“experiments in evolution” that provide a rather important loop, necessary to under-stand the reciprocal relations between the complementary concepts of diversity andbiodiversity.
“baseline research for the integrated sustainable management…” 35
1.3.3 References
Brown A.C. and McLachlan A. (1990) Ecology of Sandy Shores, Elsevier, Amsterdam.Marques J.C., 2001. Diversity, Biodiversity, Conservation, and Sustainability. The Scientific
World, 1, 534-543.McLachlan A. (2001) Coastal beach Ecosystems. Encyclopedia of Biodiversity, Volume I, Acade-
mic Press, 741-751.
36 frameworks for planning and management
DIV
ER
SITY
ACTIVE EXPRESSION OFBIODIVERSITY
Continuous experiments in evolution in activesegments of the biosphere (e.g. seasonal
changes, population blooms)
Time(Evolution)
BIO
DIV
ER
SITY
General storeof G
eneticinform
ation
Less expressedin the activesegm
ents ofbiosphere
Obsolescent
Obsolete
Fractions ofbiodiversityremoved by
extinction events
Mat
erial
s
emer
ging
from
the s
tore
Reworked
materials
return to store
Fig. 1.3.1 Tentative scheme describing the relations between diversity and biodiversity
1.4 socio-economic frameworka framework for the analysis of socio-economic
impacts on beach environments
Alison Caffyn, Bob Prosser and Guy Jobbins
1.4.1 Human impacts
The coast is a dynamic environment subject to physical change caused by geo-morphological, oceanographic, meteorological and biological processes. However,over history human impacts on coastal areas have increased enormously. Around theglobe a high proportion of human activity and development has taken place at thecoast because of the concentration of resources in coastal areas and the need for trans-portation. Many major cities and ports are located on the coast along with manyindustrial and tourist developments. 50-70% of humans live within 60 km of thecoast and this proportion is increasing.
The following diagram (Fig. 1.4.1) introduces the wide range of impacts humanactivity may have on beach and coastal environments. It is not exhaustive, but use-fully summarises landward and seaward issues and the types of general impacts,which may be experienced by coastal areas.
Coastal management has to respond to a wide range of pressures and conflicts.There is increasing competition for coastal resources and increasing conflicts betweenresource users. This has often resulted in environmental degradation or pollution,particularly of sensitive ecosystems such as estuaries, mangroves, salt marshes andcoral reefs. This section focuses on the socio-economic impacts of human activity,particularly on beach environments.
Beaches have been the focus for much human activity throughout history. Theyhave been valued economically for resources such as fishing, shell fisheries, bait dig-ging, seaweed harvesting and sand extraction. But beaches also have great social andcultural significance as places of escape and relaxation (Lencek and Bosker, 1999).They are places where people can get away from the pressures of urban life and canrelax and ‘recreate’ with friends and family.
As people had access to more free time, beaches became increasingly desirablelocations for holidays. Gomez and Rebollo (1995) date the construction of the beachin Europe as a social product to the mid eighteenth century. Beaches were initiallyperceived as places for healing and many spa towns developed such as San Sebastien,Dieppe and Brighton. Later in the late nineteenth and early twentieth century theemphasis changed to leisure and fashion for social élites, in locations such as the

French Riviera. Since the 1950s beach tourism has grown at an enormous rate andhas become a mass phenomenon. Many cultures have become attracted by the pack-age of sun, sea and sand offered at beach resort locations. Over 200 million touristsvisit the Mediterranean every year, 80% to the European Union countries (Monta-nari, 1995). Many small Mediterranean fishing villages have been transformed intomajor resorts e.g. Torremolinos in Spain. It is estimated that in the western part of thenorth Mediterranean coast over 75% of the dune systems have been destroyed (Gehu,1985 cited in Udo de Haes and Wolters, 1992).
These developments have brought significant economic and social impacts as wellas physical transformations. Impacts can be both positive and negative and include:– business growth and investment;– economic diversification and modernisation;– decline of traditional economic sectors;– revenue and tax generation;– increased employment opportunities;– loss of, or commodification of, traditional cultures;– changing social mores;– changes in the status of women;– urbanisation and increased property prices;– modernisation of infrastructure and services;
38 frameworks for planning and management
Examples of landward issues
Port and harbour worksUrbanisationMarinas and moorings for leisure craftCoastal defencesMajor developments (e.g. resorts, refineries,container terminals)Recreational beach usageWater supplies (e.g. dams, desalination plants)Power generation (e.g. wind, water)Agricultural changeNature conservation
Examples of seaward issues
Waste disposalIncreased leisure sailingSea fishingWater sports and bathingMarine aggregate extractionOil and gas productionTidal and wave power generationMarine fish farmingGlobal warming and sea level changesMarine conservation
Physical character
• Decline in landscape value• Disruption of sediment
transport• Decline in amenity
resources• Impacts on character of
coastal settlements
Natural heritage
• Loss or decline of habitatand biodiversity
• Disturbance of coastalecosystems
• Decline in fish/shellfishresources
• Loss of treasured landscapes
Coastal use
• Conflicts with local sea and coastal users
• Incompatible uses needother locations
• Pressures for services andfacilities
• Impacts on existingbusinesses and employment
Examples of impacts on coastal systems
Fig. 1.4.1 Examples of human impacts on coastal environments (adapted from UK Local Govern-ment Management Board 1995)
– education and training opportunities;– importation of goods and employees;– indirect impacts on other economic sectors;– increasing external influence of large businesses;– elements of globalisation.
Much has been written about the impacts of tourism (Mathieson and Wall, 1982;Inskeep, 1991; Ritchie and Goeldner, 1994); it is sufficient here to summarise keyelements and to focus on an integrative framework for analysing and managing theseimpacts in beach environments. The impacts of tourism and recreation can be par-ticularly acute on coastal ecosystems, the resources of which are often exploited orimpacted upon well beyond their tolerance threshold.
A key concept is environmental quality. Many socio-economic uses of beaches aredependent on the good quality of the beach environment. In particular, once the envi-ronment begins to degrade and be damaged it will be less attractive for visitors andtourists. Thus if the water is polluted, or there is a large quantity of litter, or the beachsand is seriously eroded, people may seek alternative sites. This tendency for tourists tomove on to newer, pristine destinations is well known. Gomez and Rebollo (1995) iden-tify the need to restructure mass coastal tourism and develop a new model of the coastaltourism product both because of environmental degradation but also because touristmarkets are becoming tired of mass coastal products. They suggest either major improve-ments in the quality of existing mass tourism or the creation of new high quality areaswhich are better integrated into the environment and provide good infrastructure andservice. Montanari (1995) identifies a shift from beach tourism to cultural tourism,including visits to natural areas, archaeological sites and historic cities and agritourism.
Beach visitors are increasingly demanding good quality facilities such as toilets,parking, life guards, refreshments, beach umbrellas, showers, etc. Thus, a fundamen-tal task for managers is to provide the facilities which are necessary for the type andvolume of visitor but also to preserve the quality of the environment.
Quality itself is a difficult concept. It relates to customer satisfaction with theproduct or service provided not necessarily to certain measures. Thus it is importantto understand the consumers and what standards they expect in order to provide aquality product and experience. In the case of beach environments the quality offacilities and services such as lifeguards will be important as well as the physical envi-ronment. The challenge for managers at destinations is to encourage visitors to comeagain and to maintain sustainable visitor numbers. Recent management initiativeshave focused on quality management as the key concept in developing more sustain-able forms of tourism and recreation (European Commission, 1999). Managers needto maintain or improve the quality of the environments and of related facilities andservices to continue to attract visitors.
1.4.2 Physical impacts on beach environments
The physical impacts of human activity and hence their socio-economic implica-tions vary greatly depending on the type of environment and the type and level of
“baseline research for the integrated sustainable management…” 39
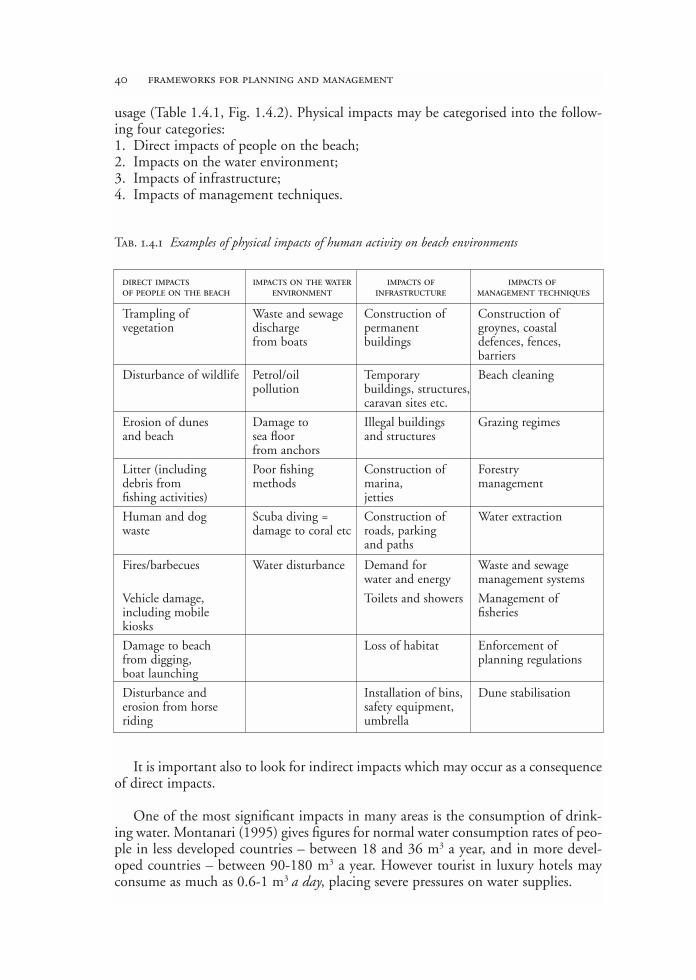
usage (Table 1.4.1, Fig. 1.4.2). Physical impacts may be categorised into the follow-ing four categories: 1. Direct impacts of people on the beach;2. Impacts on the water environment;3. Impacts of infrastructure;4. Impacts of management techniques.
It is important also to look for indirect impacts which may occur as a consequenceof direct impacts.
One of the most significant impacts in many areas is the consumption of drink-ing water. Montanari (1995) gives figures for normal water consumption rates of peo-ple in less developed countries – between 18 and 36 m3 a year, and in more devel-oped countries – between 90-180 m3 a year. However tourist in luxury hotels mayconsume as much as 0.6-1 m3 a day, placing severe pressures on water supplies.
40 frameworks for planning and management
Tab. 1.4.1 Examples of physical impacts of human activity on beach environments
DIRECT IMPACTS IMPACTS ON THE WATER IMPACTS OF IMPACTS OFOF PEOPLE ON THE BEACH ENVIRONMENT INFRASTRUCTURE MANAGEMENT TECHNIQUES
Trampling of Waste and sewage Construction of Construction of vegetation discharge permanent groynes, coastal
from boats buildings defences, fences,barriers
Disturbance of wildlife Petrol/oil Temporary Beach cleaningpollution buildings, structures,
caravan sites etc.
Erosion of dunes Damage to Illegal buildings Grazing regimesand beach sea floor and structures
from anchors
Litter (including Poor fishing Construction of Forestrydebris from methods marina, managementfishing activities) jetties
Human and dog Scuba diving = Construction of Water extractionwaste damage to coral etc roads, parking
and paths
Fires/barbecues Water disturbance Demand for Waste and sewagewater and energy management systems
Vehicle damage, Toilets and showers Management ofincluding mobile fisherieskiosks
Damage to beach Loss of habitat Enforcement offrom digging, planning regulationsboat launching
Disturbance and Installation of bins, Dune stabilisationerosion from horse safety equipment,riding umbrella
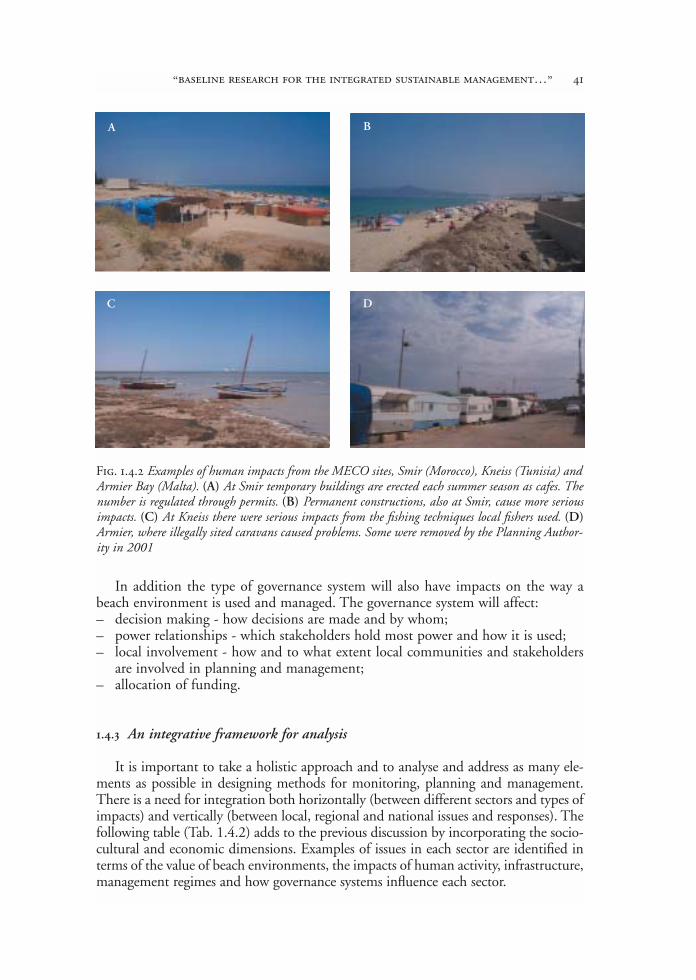
In addition the type of governance system will also have impacts on the way abeach environment is used and managed. The governance system will affect:– decision making - how decisions are made and by whom;– power relationships - which stakeholders hold most power and how it is used;– local involvement - how and to what extent local communities and stakeholders
are involved in planning and management;– allocation of funding.
1.4.3 An integrative framework for analysis
It is important to take a holistic approach and to analyse and address as many ele-ments as possible in designing methods for monitoring, planning and management.There is a need for integration both horizontally (between different sectors and types ofimpacts) and vertically (between local, regional and national issues and responses). Thefollowing table (Tab. 1.4.2) adds to the previous discussion by incorporating the socio-cultural and economic dimensions. Examples of issues in each sector are identified interms of the value of beach environments, the impacts of human activity, infrastructure,management regimes and how governance systems influence each sector.
“baseline research for the integrated sustainable management…” 41
A B
C D
Fig. 1.4.2 Examples of human impacts from the MECO sites, Smir (Morocco), Kneiss (Tunisia) andArmier Bay (Malta). (A) At Smir temporary buildings are erected each summer season as cafes. Thenumber is regulated through permits. (B) Permanent constructions, also at Smir, cause more seriousimpacts. (C) At Kneiss there were serious impacts from the fishing techniques local fishers used. (D)Armier, where illegally sited caravans caused problems. Some were removed by the Planning Author-ity in 2001

1.4.4 Key issues of socio-economic impacts
a. Issues of scaleIt is important to consider issues of scale when examining impacts. Some human
activities will have localised impacts (such as litter), others will affect a much widerarea (such as employment of people from the local area or the construction of a dam).Other aspects such as governance systems affect beach management at a national oreven international scale. The photos (Fig. 1.4.3) and table (1.4.3) in next page illus-trate this with examples of small scale and large scale human impacts.
b. StakeholdersFor a socio-economic analysis it is essential to identify all stakeholders or stake-
holder groups who have an interest in the beach environment being studied. A stake-holder is someone who has an interest or stake in the site. This could be someonewho owns, uses or simply values the site as important. Stakeholders include:– Owners;– Local and national government;– Management agencies;– Local businesses e.g. fishing, tourism, recreation, others;– Local residents;– Visitors;– Conservation groups;– Voluntary organisations;– Scientific community.
There may be very different views both between stakeholder groups and withinthem. Local residents will not necessarily all have the same opinions and government
42 frameworks for planning and management
Tab. 1.4.2 Integrative framework for issues to be considered
ENVIRONMENTAL SOCIO-CULTURAL ECONOMICISSUES ISSUES ISSUES
Value Valuable environment Attraction of beach Fishing, recreation(local-national scale) and ecosystems environments - and tourism
enjoymentImpacts of human Trampling, erosion, Recreation and Revenue,activity (local scale) pollution relaxation seasonalityImpacts of Construction, Quality and range Businesses andinfrastructure/facilities habitat loss, of facilities employment(local-regional scale) barriers and erosionImpacts of management Beach cleaning, Cleanliness, safety Economic viability,regime water supply aspects wider linkages to(local-regional scale) other sectorsInfluence of governance Environment, Health, education, Economicsystem (regional- resources and social development development andnational scale) development planning tourism
development
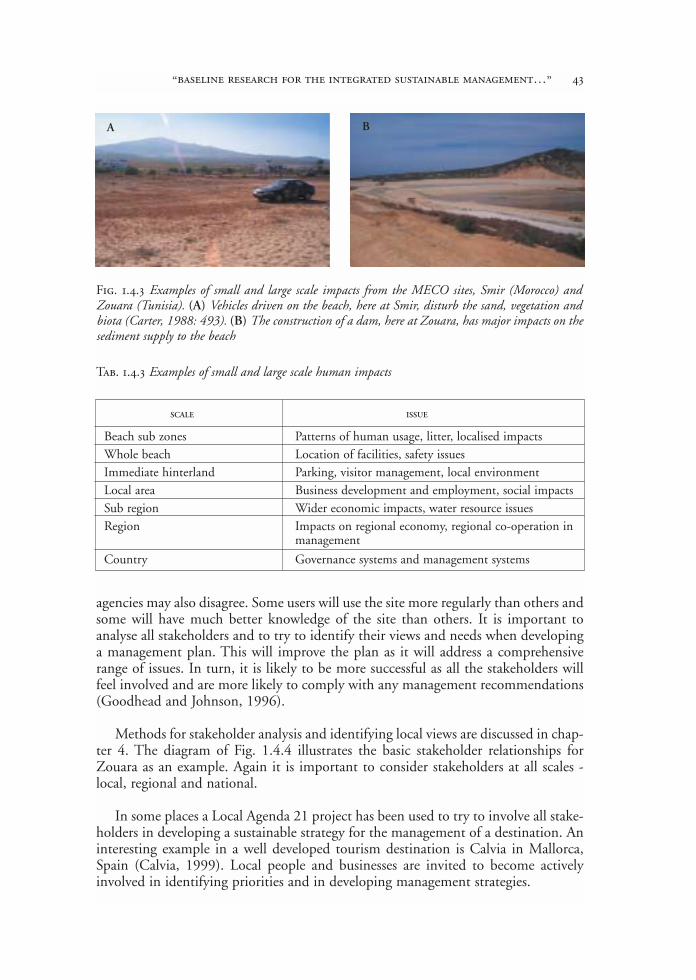
agencies may also disagree. Some users will use the site more regularly than others andsome will have much better knowledge of the site than others. It is important toanalyse all stakeholders and to try to identify their views and needs when developinga management plan. This will improve the plan as it will address a comprehensiverange of issues. In turn, it is likely to be more successful as all the stakeholders willfeel involved and are more likely to comply with any management recommendations(Goodhead and Johnson, 1996).
Methods for stakeholder analysis and identifying local views are discussed in chap-ter 4. The diagram of Fig. 1.4.4 illustrates the basic stakeholder relationships forZouara as an example. Again it is important to consider stakeholders at all scales -local, regional and national.
In some places a Local Agenda 21 project has been used to try to involve all stake-holders in developing a sustainable strategy for the management of a destination. Aninteresting example in a well developed tourism destination is Calvia in Mallorca,Spain (Calvia, 1999). Local people and businesses are invited to become activelyinvolved in identifying priorities and in developing management strategies.
“baseline research for the integrated sustainable management…” 43
Fig. 1.4.3 Examples of small and large scale impacts from the MECO sites, Smir (Morocco) andZouara (Tunisia). (A) Vehicles driven on the beach, here at Smir, disturb the sand, vegetation andbiota (Carter, 1988: 493). (B) The construction of a dam, here at Zouara, has major impacts on thesediment supply to the beach
A B
Tab. 1.4.3 Examples of small and large scale human impacts
SCALE ISSUE
Beach sub zones Patterns of human usage, litter, localised impactsWhole beach Location of facilities, safety issuesImmediate hinterland Parking, visitor management, local environmentLocal area Business development and employment, social impactsSub region Wider economic impacts, water resource issuesRegion Impacts on regional economy, regional co-operation in
management
Country Governance systems and management systems

c. Levels of developmentOf course some beaches are much more developed than others in terms of recre-
ation and tourism facilities. Calvia, mentioned above, is a mature destination includ-ing resorts such as Magalluf and Palma Nova, developed in the 1950s and 1960s. Thebeach and resort environments are very different from Zouara in Tunisia where therehas been very little development and most facilities provided are temporary structures(Fig. 1.4.5). It is important to assess the level of development of any site at an earlystage. In Malta, Morocco and Tunisia there are both well developed, mature beachesand lesser developed areas. The sites studied during the MECO project represent dif-ferent points on a continuum of development:
Undeveloped little developed some development well developed over developed
Kneiss Zouara Smir Malta
Beaches at different levels of development tend to attract different types of visitorsin search of different types of experience (De Ruyck et al., 1995), although accessi-bility and socio-economic factors are also important.
44 frameworks for planning and management
A. Zouara, Tunisia B. Mellieha, Malta
Fig. 1.4.5 Examples of temporary (A) and permanent (B) structures at the MECO sites
Regional tourism department
Businesses e.g. beachconcessions, transport
Visitors (local, national and international)
Regional administration
Delegation (localadministration)
Civil protection
Other linkages
The dam
Infrastructure
Forestry
Agriculture and herding
FishingLocal people
Government ministries
Fig. 1.4.4 Stakeholders at Zouara, Tunisia
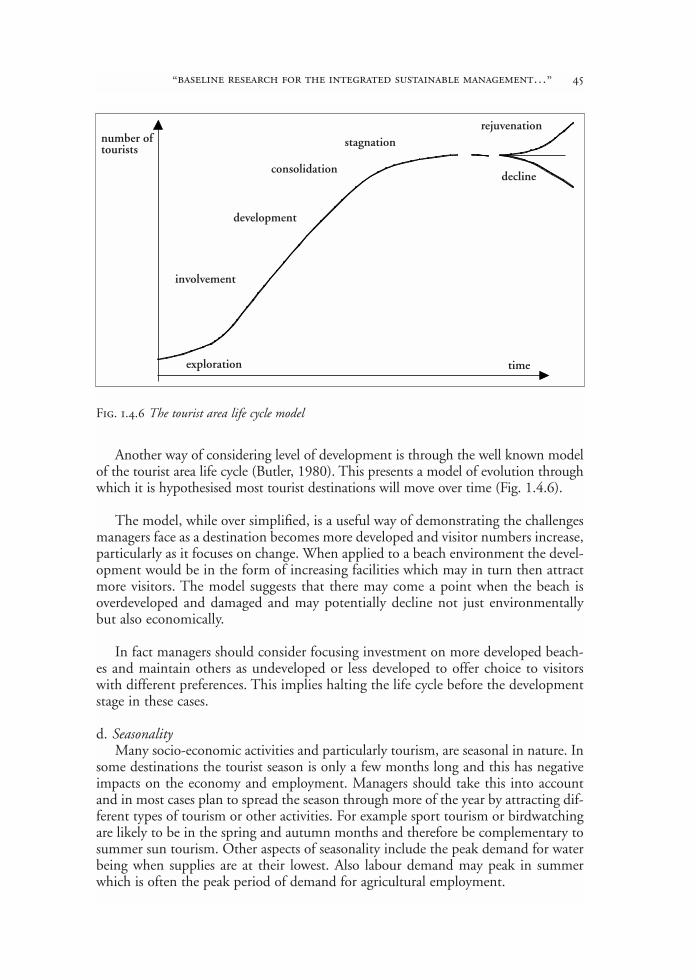
Another way of considering level of development is through the well known modelof the tourist area life cycle (Butler, 1980). This presents a model of evolution throughwhich it is hypothesised most tourist destinations will move over time (Fig. 1.4.6).
The model, while over simplified, is a useful way of demonstrating the challengesmanagers face as a destination becomes more developed and visitor numbers increase,particularly as it focuses on change. When applied to a beach environment the devel-opment would be in the form of increasing facilities which may in turn then attractmore visitors. The model suggests that there may come a point when the beach isoverdeveloped and damaged and may potentially decline not just environmentallybut also economically.
In fact managers should consider focusing investment on more developed beach-es and maintain others as undeveloped or less developed to offer choice to visitorswith different preferences. This implies halting the life cycle before the developmentstage in these cases.
d. SeasonalityMany socio-economic activities and particularly tourism, are seasonal in nature. In
some destinations the tourist season is only a few months long and this has negativeimpacts on the economy and employment. Managers should take this into accountand in most cases plan to spread the season through more of the year by attracting dif-ferent types of tourism or other activities. For example sport tourism or birdwatchingare likely to be in the spring and autumn months and therefore be complementary tosummer sun tourism. Other aspects of seasonality include the peak demand for waterbeing when supplies are at their lowest. Also labour demand may peak in summerwhich is often the peak period of demand for agricultural employment.
“baseline research for the integrated sustainable management…” 45
timeexploration
number oftourists
involvement
development
consolidation
stagnationrejuvenation
decline
Fig. 1.4.6 The tourist area life cycle model

1.4.5 Key concepts for planning and management
a. Carrying capacityThe concept of carrying capacity has been used to try to address concerns about
the levels of development and use of sites. This concept implies that there is a num-ber of people which a particular site can accommodate without significant damagebut that once this capacity is reached there will be both a reduction in the quality ofthe environment and also visitors’ experiences will suffer (Innskeep, 1991, Coccossisand Parpairis, 1996).
The idea of carrying capacity can also be applied to social aspects of tourism devel-opment. Doxey modelled community attitudes towards tourism as it develops overtime (Doxey, 1975 cited in Kay and Alder, 1999). In his Irridex model local peoplefirstly feel euphoria when tourism starts, as there are opportunities to make moneyand meet people from other areas/countries. Early tourists are often keen to meetlocal people and learn about local cultures as compared with the types of tourist whotake part in mass tourism. However as the industry expands tourists are taken forgranted, local people feel apathy and personal contact becomes more formal. Later asfacilities expand, big companies take over and tourism begins to encroach on the localpeople lives, they feel irritation. This can develop into antagonism as mass tourismgrows and tourists may become the target of frustration and anger of local peoplewho feel excluded and their local environment damaged. This implies that there isalso a social carrying capacity which is the level at which the local community feels itcan happily accommodate the number of visitors.
Social carrying capacity can also be estimated for beach users as the level at whichvisitors begin to feel overcrowded. However this level has been found to vary betweengregarious types and more individualistic types of visitor who desired less developedbeaches and lower densities of people (De Ruyck et al., 1997).
The concept of carrying capacity, whether environmental, social or an economiccapacity, has been difficult to apply in practice. Some destinations do apply a limit onthe number of visitors, for example, by using a permit system. Once the set number ofpeople have visited (per day/month/year) then no more are allowed in. Another methodwould be to limit the size of car parks. However identifying the correct level and estab-lishing and implementing such a management system is difficult (Williams,1994).There will be different capacities for different uses. Physical, social or economiccapacities are likely to be at different levels. It interferes with people’s freedom to visitlocations and usually implies they will be charged for their permit. De Ruyck et al.(1995) found that proposals to limit beach access were unpopular with the public.
b. Limits of acceptable changeA more flexible concept has become popular which focuses on the levels of change
in the physical and socio-economic environments which would be seen as acceptableby most stakeholders. This approach is called limits of acceptable change (LAC). Itaims to involve stakeholders in deciding what management and conservation meth-ods are necessary. The approach involves a series of key stages:
46 frameworks for planning and management

1. Broad review of issues in the area;2. Description/characterization of conditions in the area;3. Identification of change and indicators of change;4. Survey of indicators of change;5. Specification of quality standards;6. Prescription of desired conditions in each zone;7. Agreement of management action to maintain quality in each zone;8. Review of proposals for area as a whole;9. Implementation, monitoring and review.(Sidaway, 1995: 310)
The advantages of this approach are that instead of taking a negative approachsuch as trying to identify a carrying capacity, it focuses on a positive approach ofmanaging for quality. It incorporates a rational planning approach which focuses ondesirable future conditions (Sidaway, 1995). It also focuses on change. Identifying keyindicators of change is a crucial part of developing and monitoring a managementstrategy. Methodologies for identifying and integrating indicators are discussed inchapter 4. LAC is likely to work best when stakeholders are involved as this willimprove acceptance and support for management methods.
c. Recreation Opportunity SpectrumOne of the difficulties in planning and management for recreation and tourism
uses is that different people want to use the area in different ways. Some are happyjust to sit on the beach while others want to walk, play games, swim, take part inwater sports, fish etc. Some people like busy beaches, others like peace and quiet andwant to get away from the crowd. Here the concept of a recreation opportunity spec-trum (ROS) is useful. It can be used alongside the limits of acceptable change con-cept in planning and management for socio-economic uses of beaches both at thelocal and regional scale.
With ROS recreation is considered in terms of settings and experiences desired byvarious users, not just facilities or activities. A range of opportunities is identified tomeet most users’ demands. Settings and experiences take place in environments identi-fied as pristine; semi-pristine; semi-modern and modern, depending on their level ofdevelopment, road provision and access arrangements. Settings combine physical, bio-logical, social and managerial conditions. By varying these conditions managers canprovide a range of experiences, varying from getting away from the crowds in a natur-al setting with no support facilities to a modern resort development (Pigram and Jenk-ins, 1999). Thus managers can combine and balance conservation and recreation goals.
Recreation Opportunity Spectrum and management factors
Recreation settings and experiencesprimitive semiprimitive semi modern modern
Pristine Intensivelyenvironment managed
environment
“baseline research for the integrated sustainable management…” 47
Management factors include:– Access – how to get there, distance from nearest town, type of roads, parking loca-
tion and capacity;– Non recreational resources uses – such as mining, forestry, energy generation or
power lines;– Onsite management modification – facilities, designated walks, complexity and
visual impact of management;– Social interaction – level of contact with other people, groups;– Acceptability of visitor impacts – degree and spread of impacts;– Acceptable regimentation – visitor management, regulations, safety measures.
(Adapted from Pigram and Jenkins, 1999 and Kay and Alder, 1999)
d. Principles for an approach to sustainable tourismThe final concept which is outlined in this section relates specifically to tourism
development. There has been an enormous amount written in the last ten years abouthow to develop more sustainable forms of tourism which have reduced negativeimpacts on environments and cultures. There is no room to discuss the concept andits limitations here, but it is useful to identify a set of key principles which managersmay be able to incorporate in management strategies. One of the most useful sets ofprinciples developed to date is that by Bramwell et al. (1998) based on an analysis ofthe sustainable tourism literature.
48 frameworks for planning and management
Principles behind the approach to sustainable tourism:
1. The approach sees policy, planning and management as appropriate and, indeed,essential responses to the problems of natural and human resource misuse intourism.
2. The approach is generally not anti-growth, but it emphasises that there are limita-tions to growth and that tourism must be managed within these limits.
3. Long-term rather than short term thinking is necessary.4. The concerns of sustainable tourism management are not just environmental, but
are also economic, social, cultural, political and managerial.5. The approach emphasises the importance of satisfying human needs and aspirations,
which entails a prominent concern for equity and fairness.6. All stakeholders need to be consulted and empowered in decision making, and they
also need to be informed about sustainable development issues.7. While sustainable development should be a goal for all policies and actions, putting
the ideas of sustainable tourism into practice means recognising that in reality thereare often limits to what will be acheived in the short and medium term.
8. An understanding of how market economies operate, of the cultures and manage-ment procedures of private sector businesses and of public and voluntary sectororganisations, and of the values and attitudes of the public is necessary in order toturn good intentions into practical measures.
9. There are frequently conflicts of interest over the use of resources, which means thatin practice trade-offs and compromises may be necessary.
10. The balancing of costs and benefits in decisions on different courses of actionmust extend to considering how much different individuals and groups will gainor lose.
e. SummaryAll of these concepts may be difficult to apply in practice. However it should be
possible for managers in many locations to adopt and incorporate key elements asbasic planning and management principles. These key elements include:– Complete a comprehensive audit of current use and impact;– Identify impacts of people, of infrastructure, of management techniques and of
governance systems;– Integrate environmental, social and economic elements;– Consider issues of scale and level of development;– Involve stakeholders;– Incorporate quality management;– Identify indicators of change;– Consider recreation settings and experience.
Levels of tourism in the Mediterranean are predicted to continue increasing at arate of between 2 and 4% per year and it is likely that there will be increasing pres-sure on areas that are currently less developed (Grenon and Batisse, 1989). Other sec-tors such as fishing, water resources, port developments, industrial developments andmineral extraction are also exerting increasing impacts on coasts. Coastal managersface many challenges in developing responses.
1.4.6 References
Bramwell B., Henry I., Jackson G. and Van der Straaten J. (1998) A framework for under-standing sustainable tourism management in Bramwell et al. Sustainable tourism management,ATLAS, Tilburg University Press, Netherlands.
Butler R. (1980) The concept of a tourist area cycle of evolution: implications for managementof resources. Canadian Geographer, 24(1): 5-12.
Calvia (1999) Local Agenda 21 strategy, Mallorca.Carter R.W.G. (1988) Coastal environments: an introduction to the physical, ecological and cul-
tural systems of coastlines, Academic Press, London.Coccossis H. and Parpairis A. (1996) Tourism and carrying capacity in coastal areas: Mykonos,
Greece. In: Priestley G.K., Edwards, J.A. and Coccossis H. Sustainable tourism? Europeanexperiences, CAB International, Wallingford, UK.
De Ruyck A.M.C., Soares A.G. and McLachlan A. (1997) Social carrying capacity as a man-agement tool for sandy beaches, Journal of Coastal Research (13) 3: 822-830.
De Ruyck A.M.C., Soares A.G. and McLachlan A. (1995) Factors influencing human beachchoice on three South African beaches: a multivariate analysis, GeoJournal (36) 4: 345-352.
European Commission (1999) Pour un tourisme côtier de qualité: La gestion integrée de la qual-itée (GIQ) des destinations touristiques côtières, European Community, Luxembourg
Gomez M.J.M. and Rebollo F.V. (1995) Coastal areas: processes, typologies and prospects. InMontanari A. and Williams A.M. (eds) European tourism: regions, spaces and restructuring,Wiley, Chichester, UK.
Goodhead T. and Johnson D. (eds) (1996) Coastal recreation management: the sustainable devel-opment of maritime leisure, EandFN Spon, London.
Grenon M. and Batisse M. (eds) (1989) Futures for the Mediterranean Basin - the Blue Plan,Oxford University Press, UK.
“baseline research for the integrated sustainable management…” 49

50 frameworks for planning and management
Innskeep E. (1991) Tourism planning: an integrated and sustainable development approach, VanNostrand Reinhold, New York.
Kay R. and Alder J. (1999) Coastal planning and management, E&FN Spon, London.Lencek L. and Bosker G. (1999) The beach: the history of paradise on earth, Pimlico, London.Local Government Management Board (1995) Action on the coast, LGMB, Luton, UK.Mathieson A. and Wall G. (1982) Tourism: economic, physical and social impacts, Longman,
Essex, UK. Montanari A. (1995) The Mediterranean region: Europe’s summer leisure space. In Montanari, A.
and Williams A.M., European tourism: regions, spaces and restructuring, Wiley, Chichester, UK.Pearson N. (1996) Coastal zone management - towards best practice, Department of the Envi-
ronment, UK Government.Pigram J.J. and Jenkins J.M. (1999) Outdoor recreation management, Routledge, London.Ritchie J.R.B. and Goeldner C.R. (1994) Travel, tourism and hospitality research, second edition,
Wiley, Chichester, UK.Sidaway R. (1995) Managing the impacts of recreation by agreeing the limits of acceptable
change. In: Ashworth, G.J. and Dietvorst, A.G.J., Tourism and spatial transformations, CABInternational, Wallingford, UK.
Udo de Haes H.A. and Wolters A.R. (1992) The golden fringe of Europe: ideas for a Europeancoastal conservation strategy and action plan. In: Carter, R.W.G. et al., Coastal dunes, geo-morphology, ecology and management for conservation, AA Balkema, Rotterdam.
UK Local Government Management Board (1995) Action on the coast, LGMB, Luton, UK.Williams P.W. (1994) Frameworks for assessing tourism’s environmental impacts. In: Ritchie J.R.B.
and Goeldner, C.R. Travel, tourism and hospitality research, second edition, Wiley, Chichester,UK.

chapter 2
presentation and characterizationof the sites


2.1 le site de zouaratunisie
2.1.1 Présentation morphologique (Ameur Oueslati)
a. Une plage étendueL’une des plus étendues de la Tunisie, la plage de Zouara est aussi l’une des plus
exposées aux vents forts des secteurs septentrionaux et appartient à un segment côtierconnu pour la fréquence et la violence de ses tempêtes, surtout au cours de la saisonhivernale.
Sa morphologie associe un bas de plage large de quelques décamètres à plus de 100m (au droit de Oued Zouara) et un bourrelet de haut de plage ou avant-dune, hauten moyenne de 4 à 8 m et à tracé très rectiligne, en fait contrôlé par des travaux defixation du sable. Quant à l’avant-côte, il se caractérise par un modelé de sillons et derides sableuses souvent épaisses et bien marquées.
Cette abondance sédimentaire s’explique d’abord par les apports de Oued Zoua-ra qui prend source dans des terrains accidentés, évoluant par ravinement et mouve-ments de terrains et à ossature géologique dominée par le flysch numidien qui par sesépais bancs de grès favorise la libération et le départ du sable. Elle s’explique égale-ment par l’arrivée des matériaux poussés par les courants côtiers depuis les falaisesvives des segments côtiers voisins, largement taillées dans des roches gréseuses.
b. Un champ dunaire à morphologie variée et complexeDe forme triangulaire et s’avançant sur plusieurs kilomètres à l’intérieur des ter-
res, ce champs est l’un des plus étendus sur les côtes tunisiennes (Fig. 2.1.1).
L’activité éolienne y a été étroitement influencée ou guidée par la topographielocale. Sur les surfaces régulières ou peu accidentées, elle a donné lieu à des accumu-lations du type nebka de tailles variées isolées ou appartenant à des crêtes parfoiscontinues sur plusieurs hectomètres, voire sur quelques kilomètres. Dans ce derniercas, le sable couvre souvent des crêtes gréseuses plus anciennes. Les couloirs ont, encanalisant les masses d’air, servi surtout de voies de transit pour le sable. Par contre,sur les versants relativement escarpés les accumulations sont généralement épaisses etmontrent un aspect de surface massif à nombreuses rides transversales.
c. Des repères pour la reconstitution de l’histoire de l’homme et des paysages ainsi que pourla connaissance des tendances récentes de l’évolution de l’environnement
Vaste, le champs dunaire a, en plus de l’activité éolienne, connu l’intervention de
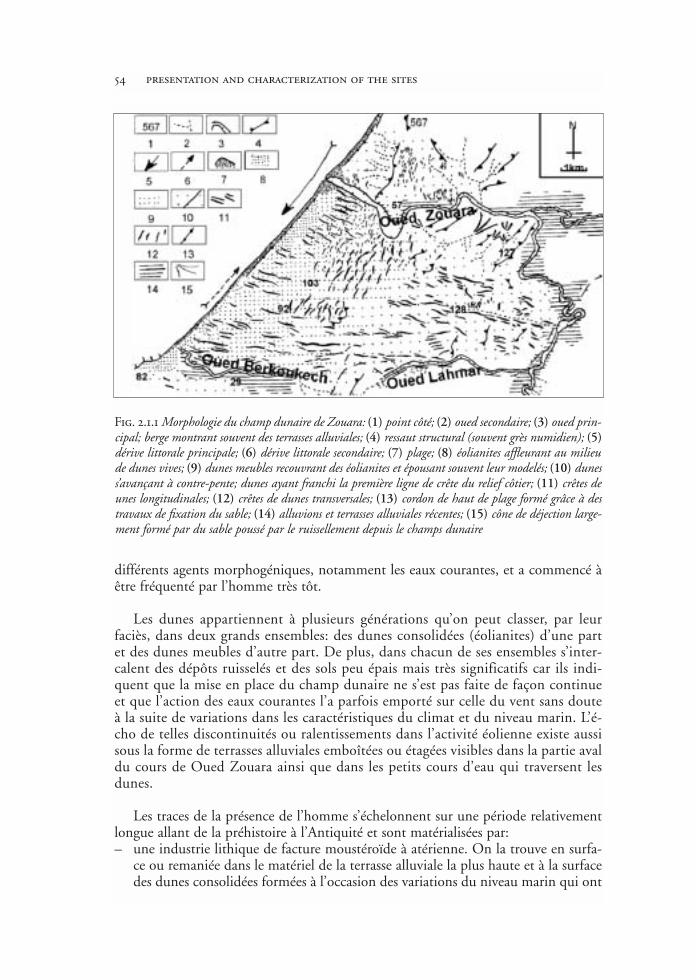
différents agents morphogéniques, notamment les eaux courantes, et a commencé àêtre fréquenté par l’homme très tôt.
Les dunes appartiennent à plusieurs générations qu’on peut classer, par leurfaciès, dans deux grands ensembles: des dunes consolidées (éolianites) d’une partet des dunes meubles d’autre part. De plus, dans chacun de ses ensembles s’inter-calent des dépôts ruisselés et des sols peu épais mais très significatifs car ils indi-quent que la mise en place du champ dunaire ne s’est pas faite de façon continueet que l’action des eaux courantes l’a parfois emporté sur celle du vent sans douteà la suite de variations dans les caractéristiques du climat et du niveau marin. L’é-cho de telles discontinuités ou ralentissements dans l’activité éolienne existe aussisous la forme de terrasses alluviales emboîtées ou étagées visibles dans la partie avaldu cours de Oued Zouara ainsi que dans les petits cours d’eau qui traversent lesdunes.
Les traces de la présence de l’homme s’échelonnent sur une période relativementlongue allant de la préhistoire à l’Antiquité et sont matérialisées par:– une industrie lithique de facture moustéroïde à atérienne. On la trouve en surfa-
ce ou remaniée dans le matériel de la terrasse alluviale la plus haute et à la surfacedes dunes consolidées formées à l’occasion des variations du niveau marin qui ont
54 presentation and characterization of the sites
Fig. 2.1.1 Morphologie du champ dunaire de Zouara: (1) point côté; (2) oued secondaire; (3) oued prin-cipal; berge montrant souvent des terrasses alluviales; (4) ressaut structural (souvent grès numidien); (5)dérive littorale principale; (6) dérive littorale secondaire; (7) plage; (8) éolianites affleurant au milieude dunes vives; (9) dunes meubles recouvrant des éolianites et épousant souvent leur modelés; (10) duness’avançant à contre-pente; dunes ayant franchi la première ligne de crête du relief côtier; (11) crêtes deunes longitudinales; (12) crêtes de dunes transversales; (13) cordon de haut de plage formé grâce à destravaux de fixation du sable; (14) alluvions et terrasses alluviales récentes; (15) cône de déjection large-ment formé par du sable poussé par le ruissellement depuis le champs dunaire
marqué le Quaternaire supérieur surtout le dernier interglaciaire (Tyrrhénien); lestraces de stationnement de la mer à des altitudes supérieures à celles du rivageactuel existent dans les falaises des segments côtiers voisins (du côté de Cap Negropar exemple),
– une industrie épipaléolithique héritée des civilisations ibéromaurusienne et néoli-thique parfois associée aux niveaux inférieurs des dunes meubles et des colluvionsqui les séparent ou qui s’y intercalent,
– des ruines antiques dont les plus étendues sont enterrées sous le sable des dunesmeubles.
d. Une plage en moins bon état qu’il y a quelques décennies et à risques dans l’avenirSi le champ dunaire n’a cessé de perdre sa vivacité sur le plan géomorphologique,
à cause surtout des travaux de reboisement qui ont fixé le sable, la plage est appelée àfaire face à une dynamique plus intense et surtout à une nouvelle conjoncture qui nelui sera pas toujours favorable.
Le rivage échappe encore aux formes de dégradation, notamment les problèmesdus à l’érosion marine, dont souffrent bien de rivages sableux en Tunisie et en Médi-terranée. Les figures d’érosion qu’on peut y rencontrer au cours de la saison hiverna-le, comme les microfalaises taillées dans le matériel du bas de plage, ne doivent pasêtre prises pour des signes d’une tendance au démaigrissement. Elles font partie d’u-ne dynamique classique dans les plages sableuses (Fig. 2.1.2). L’oeuvre des tempêteshivernales, elles disparaissent pendant la belle saison.
La plage serait cependant en moins bon état qu’il y a quelques décennies et risque,en tout cas, de se trouver face à des difficultés dans l’avenir: – Elle est en moins bon état à cause d’une réduction des apports terrigènes suite à
la multiplication des obstacles sur le chemin des eaux courantes (routes, travauxde C.E.S., …) mais aussi suite aux grands travaux de reboisement. La forêt a deseffets bénéfiques indiscutables pour l’environnement mais elle a, en fixant lesdunes, contribué à dérégler une dynamique naturelle qui permettait à la plage deretrouver, par le vent qui souffle depuis le continent et surtout par les eaux cou-rantes, une partie du sable qu’elle perd par le vent. Ce rapatriement s’inscrivaitdans un cycle du sable original: le sable soufflé par le vent s’avance en direction ducontinent jusqu’à ce qu’il rencontre un cours d’eau qui le ramène à la mer. En
“baseline research for the integrated sustainable management…” 55
Les traces de l’homme préhistoriques existent en de nombreux endroits, parfois sous laforme de jonchées étendues d’artefacts taillés dans différents matériaux (silex et grès sur-tout). Elles apparaissent et disparaissent au gré de la mobilité du sable. Les ruines antiques les plus importantes, par leur extension, existent dans le secteur deArgoub El Bania, sur la rive droite de Oued Zouara, immédiatement en aval du barra-ge. Elles sont presque entièrement enterrées sous les dunes. On peut se demander s’il nepeut pas s’agir des témoins d’un ancien comptoir établi à côté d’un port ou d’un abriimportant pour barques. Celui-ci se situerait au niveau de l’embouchure de Oued Zoua-ra immédiatement en aval de la digue du barrage. Il aurait été remblayé pour laisser laplace à l’épaisse plage qui caractérise le site de nos jours.

effet, la limite interne du champs dunaire est largement définie par le dessin duréseau hydrographique. Oued Lahmar par exemple, a toujours constitué une limi-te infranchissable pour les dunes. D’ailleurs, il doit son nom au sable qui tapissesa berge gauche et son lit: Lahmar signifie en arabe rouge en faisant allusion à lacouleur du sable.
– A risques puisqu’elle risque de se trouver face à des difficultés à cause de l’im-plantation du barrage de Sidi El Barrak. Car, en plus des termes de l’écosystèmeet du paysage qui vont connaître inéluctablement des modifications, cet ouvrageimportant aura comme conséquence une accentuation de la réduction de la four-niture sédimentaire dont profitait la plage.
Aussi, l’approche géomorphologique apporte-t-elle des indications qui, consi-dérées dans un plan d’aménagement, peuvent aider à mieux valoriser les potentia-lités naturelles et patrimoniales et surtout d’éviter les conséquences, parfois dra-matiques comme on en voit dans plusieurs rivages sableux, des interventionsimprévoyantes.
e. On insistera en particulier sur:– La qualité du paysage naturel: le site et ses environs offrent une richesse intéres-
sante en paysages favorisée par la juxtaposition de topographies contrastées et degéologies variées: rivage sableux et dunes étendues coincés entre la mer et les ver-sants escarpés de la chaîne montagneuse des Khmirs. Cette variété est enrichie par
56 presentation and characterization of the sites
Fig. 2.1.2 Représentation schématique du cycle du sable dans le secteur de Zouara: (1) sable poussépar le vent depuis le rivage; (2) sable poussé par les eaux courantes depuis le champ dunaire pour êtrerapatrié à la plage; (3) alimentation par les eaux courantes à partir des reliefs voisins; (4) dérive lit-torale principale; (5) apport sédimentaire depuis le large
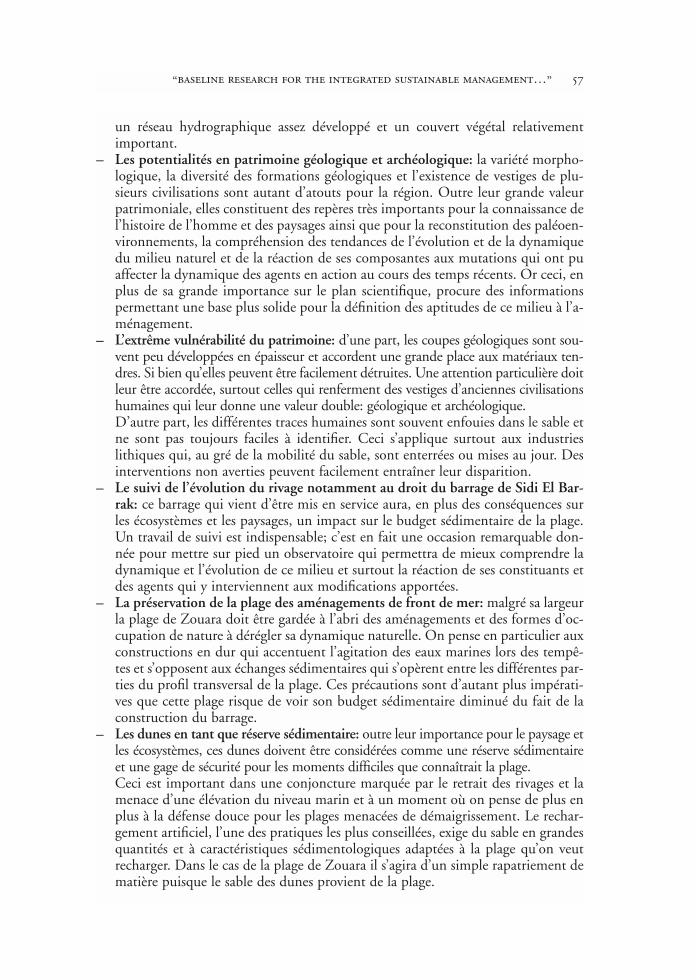
“baseline research for the integrated sustainable management…” 57
un réseau hydrographique assez développé et un couvert végétal relativementimportant.
– Les potentialités en patrimoine géologique et archéologique: la variété morpho-logique, la diversité des formations géologiques et l’existence de vestiges de plu-sieurs civilisations sont autant d’atouts pour la région. Outre leur grande valeurpatrimoniale, elles constituent des repères très importants pour la connaissance del’histoire de l’homme et des paysages ainsi que pour la reconstitution des paléoen-vironnements, la compréhension des tendances de l’évolution et de la dynamiquedu milieu naturel et de la réaction de ses composantes aux mutations qui ont puaffecter la dynamique des agents en action au cours des temps récents. Or ceci, enplus de sa grande importance sur le plan scientifique, procure des informationspermettant une base plus solide pour la définition des aptitudes de ce milieu à l’a-ménagement.
– L’extrême vulnérabilité du patrimoine: d’une part, les coupes géologiques sont sou-vent peu développées en épaisseur et accordent une grande place aux matériaux ten-dres. Si bien qu’elles peuvent être facilement détruites. Une attention particulière doitleur être accordée, surtout celles qui renferment des vestiges d’anciennes civilisationshumaines qui leur donne une valeur double: géologique et archéologique.D’autre part, les différentes traces humaines sont souvent enfouies dans le sable etne sont pas toujours faciles à identifier. Ceci s’applique surtout aux industrieslithiques qui, au gré de la mobilité du sable, sont enterrées ou mises au jour. Desinterventions non averties peuvent facilement entraîner leur disparition.
– Le suivi de l’évolution du rivage notamment au droit du barrage de Sidi El Bar-rak: ce barrage qui vient d’être mis en service aura, en plus des conséquences surles écosystèmes et les paysages, un impact sur le budget sédimentaire de la plage.Un travail de suivi est indispensable; c’est en fait une occasion remarquable don-née pour mettre sur pied un observatoire qui permettra de mieux comprendre ladynamique et l’évolution de ce milieu et surtout la réaction de ses constituants etdes agents qui y interviennent aux modifications apportées.
– La préservation de la plage des aménagements de front de mer: malgré sa largeurla plage de Zouara doit être gardée à l’abri des aménagements et des formes d’oc-cupation de nature à dérégler sa dynamique naturelle. On pense en particulier auxconstructions en dur qui accentuent l’agitation des eaux marines lors des tempê-tes et s’opposent aux échanges sédimentaires qui s’opèrent entre les différentes par-ties du profil transversal de la plage. Ces précautions sont d’autant plus impérati-ves que cette plage risque de voir son budget sédimentaire diminué du fait de laconstruction du barrage.
– Les dunes en tant que réserve sédimentaire: outre leur importance pour le paysage etles écosystèmes, ces dunes doivent être considérées comme une réserve sédimentaireet une gage de sécurité pour les moments difficiles que connaîtrait la plage. Ceci est important dans une conjoncture marquée par le retrait des rivages et lamenace d’une élévation du niveau marin et à un moment où on pense de plus enplus à la défense douce pour les plages menacées de démaigrissement. Le rechar-gement artificiel, l’une des pratiques les plus conseillées, exige du sable en grandesquantités et à caractéristiques sédimentologiques adaptées à la plage qu’on veutrecharger. Dans le cas de la plage de Zouara il s’agira d’un simple rapatriement dematière puisque le sable des dunes provient de la plage.
58 presentation and characterization of the sites
2.1.2 Présentation biologique (Faouzia Charfi)
La région de Zouara présente une remarquable diversité paysagère avec une pla-ge sableuse, bordée par un champ dunaire des plus vastes rencontrés sur les côtestunisiennes (Fig. 2.1.3). Dans l’immense forêt bordant le complexe des dunes desable, on peut reconnaître une forêt de reboisement constituée soit par des planta-tions homogènes de pin pignon (Pinus pinaster ), soit par des étendues essentielle-ment à base d’Acacia parsemées par des pieds épars de retam (Retama sphaerocarpa),de laurier rose (Nerium oleander ) dans les lits des cours d’eau et de rares pieds degenévrier de Phénicie (Juniperus phœnicea ) et une forêt naturelle dominée par le chê-ne kermès (Quercus coccifera ), le genévrier oxycèdre (Juniperus oxycedra ), le genévrierde Phénicie, le filaire (Phyllirea angustifolia ), le lentisque (Pistacia lentiscus ), etc.Cette forêt naturelle se trouve à l’ouest de la zone de Zouara, en direction de Tabar-ka. A l’est de la zone, se trouve l’Oued Zouara sur lequel a été édifié le barrage deSidi ElBarrak (Fig. 1.4.3 B).
Ces différents milieux forment des écosystèmes variés, plus ou moins diversifiés etdont les ressources biologiques sont très peu connues.
a. Plage et dunes bordières: Espace convoitéLa plage de Zouara est celle qui, parmi les rares plages de la Tunisie, a plus ou moins
conservé, jusqu’à présent, son cachet naturel et échappé à la construction des complexestouristiques à l’origine de la dégradation et de la régression des habitats naturels engen-
A B
C D
Fig. 2.1.3 Diversité paysagère à Zouara. (A) Plage étendue et de bonne qualité; (B) Forêt naturellediversifiée; (C) Ruines antiques presque enterrée sous les dunes; (D) Collecte de l’Ammophila

drant une raréfaction et une disparition de plusieurs espèces ainsi qu’une érosion géné-tique. L’accent est mis sur la diversité de l’arthropodofaune (voir dans ce manuel lessections 2.3.6–Diptera et 3.1-Coleoptera) qui constitue la composante principale decet écosystème englobant la plage et le complexe de dunes bordières, ainsi que ladiversité de la couverture végétale (section 2.3.5) de ce complexe.
Le haut de plage et les dunes meubles proches de la mer abritent un couvert végé-tal bien diversifié qui réunit une dizaine d’espèces psammo-halo-nitrophiles dontAmmophila arenaria (oyat) qui constitue la végétation pionnière de la fixation natu-relle des dunes vives (Fig. 2.1.4). Les espèces animales rencontrées dans ce milieu sontreprésentées par des arthropodes, insectes et crustacés. Les crustacés isopodes Tyloseuropaeus et amphipodes comme Talitrus saltator et Talorchestia brito se rencontrentsous les débris mais le plus souvent s’enfouissent dans des terriers pendant la journéeen dehors de leur période d’activité qui est plutôt nocturne. Ils se nourrissent dedébris organiques divers et sont considérés de ce fait comme des dépolluants. Lesinsectes sont représentés par plusieurs espèces tels que Phaleria acuminata (Tenebrio-nidae), Scarites laevigatus et Eurynebria complanata (Carabidae).
Nous insistons sur le fait que les invertébrés ne font pas l’objet d’évaluation. Pourtant,un bon nombre d’espèces sont des agents importants des processus écologiques.
Nous soutenons l’idée de la protection et de la fixation biologique des dunes parla plantation d’espèces locales telles que Ammophila arenaria faisant l’objet de collec-te abusive par la population qui l’utilise pour des fins artisanales (Fig. 2.1.3 D).
b. La forêt littorale naturelle unique en son genre La forêt de Zouara revêt une grande importance car c’est l’une des rares forêts
“baseline research for the integrated sustainable management…” 59
Fig. 2.1.4 Diversité floristique et arthropodes communes de la plage et des dunes bordières de Zoua-ra. Photos de gauche à droite: Talitrus saltator, Eurynebria complanata, Scarites laevigatus
Phaleria accuminataTalorchestiabrito
Tyloseuropaeus
Otanthus maritimus
Pancratium maritimum
Ammophila
Eryngium maritimum
Euphorbia paralias
Echinophon spikosa
Urginea maritima
Cakile maritima
côtières tunisiennes relativement peu perturbées et bien conservées. Cette forêt dechêne kermès (Quercus coccifera ) est l’une des plus étendues en Tunisie. Comparée àla forêt plantée, la couverture végétale naturelle est bien plus diversifiée. On recon-naît Juniperus oxycedra et J. phoenicea, Pistacia lentiscus, Phyllirea angustifolia, Retamamonosperma, Asparagus acutifolius, Smilax aspersa, Potamogeton pectinatus, Viburnustinus, Ruscus hypophyllum, Cynodon dactylon, Daphne gnidium. A cette diversité flo-ristique correspond une diversité faunistique qui a été analysée soit par un échan-tillonnage saisonnier de 3 milieux qui se distinguent par leur couverture végétale etpar la densité de la végétation, soit par une recherche sous les pierres et la litière, soitencore par un relevé de certains signes de présence ou d’activité des animaux.
Parmi les vertébrés, les mammifères sont représentés par Sus scrofa, Canis aureus,Vulpes vulpes, Genetta genetta, par des rongeurs reconnus par la présence de nombreuxterriers et les reptiles représentés par Chalcides ocellatus. Cette forêt abrite des espècespeu communes ou rares en Tunisie, tels le porc-épic.
Les invertébrés sont représentés essentiellement par des insectes, des myriapodeset des aranéides. Les crustacés récoltés sont des isopodes terrestres appartenant tous àla famille des Porcellionidae, Acaeroplastes melanurus, Agabiformius lentus, Porcellioni-des sexfasciatus, Porcellionides pruinosus et l’espèce endémique, Porcellio variabilis.
La forêt est exposée à divers agents dégradants tels que la déforestation et le feu.En effet, la disparition d’une partie de cette forêt côtière de chêne kermès aux envi-rons de Tabarka, à cause des aménagements touristiques (hôtels, aéroport…), appel-le à la nécessité de conserver ce patrimoine où des pieds de chêne kermès, remarqua-bles pouvant atteindre jusqu’à 14 m de haut et 0,75 m de diamètre, lui confèrent unstatut unique.
Par ailleurs, la disparition éventuelle de la couverture végétale induira un proces-sus irréversible de désertification, par l’instabilité des dunes. En effet, la région estexposée à des vents violents qui auront pour effet le déplacement du sable dunairevers le continent, à l’origine d’un ensablement et d’une déstabilisation du milieu; c’estle cas actuellement de certains secteurs de Zouara.
Suite à la disparition et la dégradation de la couverture végétale, on assiste à unediminution ou parfois même une perte de la diversité, particulièrement de la faune. Or,la diversité faunistique est encore très mal connue; il est donc très regrettable de voir cet-te diversité s’éroder avant qu’elle ne soit quantifiée pour pouvoir être gérée par la suite.
Nous soutenons l’idée de la création d’une réserve naturelle dans la forêt de Zoua-ra, afin de conserver les groupements végétaux naturels qu’elle abrite, notamment lesétendues de chêne kermès, ainsi que les stations qui comprennent des pieds de gran-de dimension de cette essence.
Cette réserve aura pour mission principale l’étude de la biodiversité en vue de sagestion, sa préservation et sa conservation. Cette station de recherches doit être étudiéed’une manière très approfondie par des scientifiques de différentes spécialités afin d’é-viter toutes les pratiques qui risquent de perturber le fonctionnement du site comme,par exemple, les introductions de nouvelles espèces.
Autour de cette réserve peuvent avoir lieu des aménagements qui permettent unevalorisation du site. Ces aménagements ne doivent pas avoir pour effet une altération
60 presentation and characterization of the sites
du milieu, surtout ses communautés biotiques. Ils peuvent consister en des pistes noncarrossables, mais accessibles à pied, à vélo ou à dos de cheval. Ces pistes visiterontnotamment les pieds de chêne kermès évoqués plus haut, ainsi que des endroits oùune exposition pédagogique montrera aux visiteurs intéressés certaines des particula-rités du milieu et sa diversité.
c. Le barrage et son entourage: zone humide pour les oiseaux d’eauLe barrage, récemment installé sur l’Oued Zouara, ainsi que son embouchure
constituent une zone humide qui attire une avifaune très diversifiée. Ceci est dû par-ticulièrement à la position géographique stratégique de ce secteur situé entre l’Euro-pe et l’Afrique, d’une part et à son ouverture sur la Méditerranée occidentale, d’aut-re part. Au niveau de la région Nord-Ouest de la Tunisie, ce site est presque uniqueen son genre. A une échelle encore plus réduite, cette zone est formée par 3 stationsstructurellement différentes qui sont la côte sableuse (S1), le complexe d’étangs com-pris entre le barrage et la mer et sous l’influence des 2 types d’eaux, marine et douce(S2) et enfin le barrage (S3). Ceci a pour effet d’engendrer une diversité au niveau desressources trophiques qui peuvent être soit d’origine marine, soit en provenance dubarrage ou des dunes bordières.
A cette diversité des biotopes et des ressources trophiques correspond une diversi-té de l’avifaune. En effet, les observations mensuelles directes réalisées de septembre2000 au mois d’avril 2001 ont permis d’identifier 19 espèces d’oiseaux répartis en 6ordres et 9 familles. Parmi les espèces hivernantes, le Goéland leucophée Laruscachinnans est le plus abondant (49,6%), le Goéland d’Audouin Larus audouinii(8,5%), la Sterne caugek Sterna sandvicensis (6,03%), la Mouette rieuse Larus ridi-bundus (4,4%), le Grèbe huppé Podiceps cristatus (4,08%), le Gravelot à collier inter-rompu Charadrius alexandrinus (1,21%), le Grand cormoran Phalacrocorax carbo(0,9%) et l’Aigrette garzette Egretta garzetta (0,8%). Par son ouverture sur la Médi-terranée, cette zone abrite des espèces de passage tels que le Fuligule milouin Aythyaferina (6,5%), la Foulque macroule Fulica atra (5,6%), le Grèbe à cou noir Podicepsnigricollis (4,08%), l’Huîtrier pie Haematopus ostralegus (0,9%), l’Héron cendré Ardeacinerea (0,5%) et le Canard chipeau Anas strepera (0,44%).
Dans le secteur (S1) formé par la mer, l’épandage alluvial situé à l’embouchu-re de l’oued et la plage sableuse à la base des dunes, 4 espèces sont présentes: leGoéland leucophée se nourrit et se repose dans le milieu marin; l’Huîtrier pie uti-lise l’épandage alluvial pour se reposer; le Bécasseau sanderling Calidris alba s’ali-mente au niveau de la ligne de rivage et le Gravelot à collier interrompu utilise labase des premières dunes pour se nourrir, pour se reposer et vraisemblablementpour nicher.
Certains oiseaux utilisent les petits étangs (secteur S2), situés entre la mer et le bar-rage, pour s’alimenter et pour assurer leur activité de confort. Il s’agit du Goéland leu-cophée, du Goéland d’audouin, du Grand cormoran, de la Mouette rieuse et del’Huîtrier pie.
Enfin, le barrage (secteur S3), dont la diversité aviaire de 0,069 bits est la plus fai-ble, abrite le Fuligule milouin et le Grèbe huppé qui utilisent ce milieu pour se nour-rir et pour assurer leur activité de confort.
“baseline research for the integrated sustainable management…” 61

Malgré les conséquences du barrage sur le transit sédimentaire qui priverait la plaged’un apport de matériel sableux associé à la houle qui éroderait une bonne partie del’avant côte de part et d’autre de l’embouchure, ce barrage et son voisinage consti-tuent un site d’attraction d’une avifaune diversifiée qui mérite un suivi régulier parl’installation d’un observatoire ornithologique.
62 presentation and characterization of the sites
2.2 le site des kneiss, tunisie: géomorphologieet aptitudes à l’aménagement
Moncef Gueddari et Ameur Oueslati
Monotonie et faiblesses (des altitudes, des pentes et de la profondeur des eaux lit-torales); telles sont les caractéristiques qui se dégagent d’un premier contact avec larégion. L’examen de près, du terrain, révèle cependant une variété indéniable de pay-sages et de modelés parfois d’une grande originalité ainsi qu’une richesse remarqua-ble tant sur le plan environnemental que sur le plan patrimonial.
2.2.1 Variété et originalité du paysage morphologique
Du côté du continent: De la mer vers l’intérieur se succèdent, assez régulièrement,un domaine de plaines, un domaine de bas plateaux et un domaine de collines. L’é-volution morphologique a légué une variété de formes et de modelés qui, malgré unecertaine discrétion dans le paysage, sont d’une grande valeur scientifique et patrimo-niale. D’une part, ils servent de repères pour l’histoire du terrain et la reconstitutiondes paléoenvironnements. D’autre part, ils recèlent les traces de différentes civilisa-tions humaines allant des temps préhistoriques aux temps récents.
Les plaines ont une genèse très récente puisque constituées d’alluvions d’âge holocè-ne à historique qui montrent le maximum de leur développement dans les sections desprincipaux cours d’eau et dans la marge littorale notamment autour de l’embouchure deOued Ouadrane. Ici, l’accumulation prend une forme en éventail et s’étend sur unedizaine de kilomètres le long de l’oued en s’élargissant en direction du rivage. Les altitu-des sont basses; au voisinage de la mer, elles descendent à 1 ou 2 m et parfois à quelquesdécimètres seulement et les pentes sont partout très faibles.
Les plateaux, situés entre 20 et 50 m d’altitude, sont généralement séparés des plainespar un talus de quelques mètres de commandement et caractérisés par des pentes égalementfaibles à très faibles (<0,5%). Leur surface est le plus souvent régulière et continue. Maiselle peut être localement accidentée par de petites ruptures de pentes ou découpée par leseaux courantes ce qui l’a parfois réduite à des buttes allongées à sommet convexe ou plat:des “tables” situées à des altitudes différentes ponctuent le paysage naturel.
Les collines portent les points culminants de la région, le plus souvent comprises ent-re 150 à 200 m. Elles sont pourtant bien marquées dans le paysage grâce notamment àla variété de leurs formes et à la platitude de leurs sommets.
Collines et plateaux sont formés dans des matériaux sédimentaires récents néogènes àquaternaires. Les premiers montrent la plupart du temps un faciès argileux à argilo-sableux-gypseux de couleur rougeâtre à rose. Leur sommet est généralement coiffé par des croûtescalcaires ou gypseuses parfois épaisses et résistantes ce qui leur a souvent assuré une bonne
protection contre l’érosion. C’est d’ailleurs grâce à ces croûtes que différents sommets ontpu conserver leur régularité.
Les formations quaternaires accompagnent surtout les principaux oueds où elles consti-tuent l’ossature de terrasses étagées ou emboîtées marquant les étapes de l’évolution au coursQuaternaire. Certaines d’entre elles, à l’image de celles qui accompagnent Oued Ouadrane,renferment des vestiges archéologiques, historiques et préhistoriques, et ont de ce fait unevaleur remarquable tant pour la recherche scientifique que pour le patrimoine.
Du côté de la mer: la topographie basse du continent passe insensiblement, dans lamer à un milieu original: les bancs des Kneiss qui correspondent à des hauts-fondscaractérisés par leur grande platitude, leur forme qui évoque une flèche littorale sub-mergée et leur bathymétrie extrêmement faible. Les fonds sont très souvent à moinsd’un mètre, voire à quelques décimètres avec des bancs étendus à fleur d’eau. Cette ori-ginalité est doublée par l’importance de la marée et l’existence d’un réseau hiérarchiséet complexe de chenaux sous-marins ou “oueds” (Oued Ed Dem, Oued El Baa, OuedRjef Ben Sehil, Oued Boukhlef, …). Par marée basse des superficies impressionnantessont exondées et la navigation devient impossible sauf dans les grands “oueds”.
Sur le rivage, la morphologie est assez variée mais les terres humides et les falaisesdominent tant par leur extension que par leur place dans le paysage. Les premiers,montrent généralement une zonation dans laquelle se succèdent de la mer vers l’in-térieur marais maritimes à slikke et schorre caractéristiques, sebkhas (terres fortementsalées et dépourvues de toute végétation) et chotts (auréoles de végétation halophileautour des sebkhas). Les falaises caractérisent la partie méridionale et sont tailléesdans les argiles gypseuses mio-pliocènes.
Les marais maritimes montrent généralement deux parties bien individualisées. L’u-ne régulièrement couverte et découverte, en fonction de la marée, c’est une slikke. L’au-tre correspond à un schorre caractéristique envahi par les eaux marines à chaque flot parl’intermédiaire d’un réseau, parfois très dense, de chenaux de marée.
Les schorres les plus étendues occupent: - le fond des baies et criques surtout celles quicorrespondent à une embouchure d’un cours d’eau, - les sites abrités par un petit cap com-me le cap de Skhira El Gdima, - les parties internes de grands chenaux de marée notammentles chenaux de Oued Maltine, Oued Grienech et Oued Rjef Ben Sehil. Leur surface est unpeu partout occupée par une formation serrée d’halophytes dominée par des Salicornes.
Les falaises deviennent l’élément le plus apparent de la morphologie littorale à partirdu port de Skhira El Gdima. Elles se détachent très bien dans le paysage grâce à leurcommandement souvent compris entre 10 et 20 m et surtout grâce à leur teinte rosâtrequi reflète en fait la couleur la plus caractéristique des argiles gypseuses mio-pliocènes.
Outre les terres humides et les falaises, la région renferme quelques plages sableu-ses et estrans rocheux. Les premières se réduisent généralement à des liserés plus oumoins continus localisés surtout dans les petites criques ou à des accumulations pro-visoires au pied des falaises. Les seconds, sont rares du côté du continent mais pré-dominent dans les îlots les plus petits de l’archipel des Kneiss.
L’archipel correspond à une guirlande d’îlots qui émergent à peine des hauts-
64 presentation and characterization of the sites

fonds: El Bessila, El Hjar, El Laboua (dit aussi îlot de Sidi Salah du nom du mara-bout qu’il renferme ou El Oustaniya c’est dire celui du milieu) et enfin El Gharbia.
El Bessila (l’îlot de la scille?), l’îlot le plus septentrional, le moins petit et le moinsbas, a une forme grossièrement circulaire avec un diamètre maximal de l’ordre de 2,5 km.Les altitudes y sont le plus souvent inférieures à deux mètres sauf dans la partie septen-trionale qui culmine à 7 m et où se situerait son premier noyau dont la constitution cor-respondrait, si on se réfère aux autres îlots, à un lambeau de grès marin eutyrrhénien. Laplus grande partie est occupée par des sols salés de sebkhas ou de chotts sur des terrainsmeubles sablo-limoneux à sablo-argileux parfois remaniés par le vent. Les parties méri-dionale et occidentale, les moins exposées à la houle, sont occupées par un vaste schorreà surface découpée par une multitude de chenaux de marée.
El Hjar (l’îlot rocher, l’îlot du rocher ou l’îlot rocheux), El Laboua (l’îlot de la vase?) etEl Gharbia (l’îlot de l’Ouest) sont beaucoup moins étendus. Le premier est le plus petit detous avec à peine 10 m de diamètre et une hauteur de l’ordre du mètre. Sur le plan géolo-gique, tous ces îlots ont une ossature de grès marin typique de la formation Rjiche main-tenant bien connue sur les côtes tunisiennes et attribuée à l’Eutyrrhénien (environ 120 000ans B.P.), épisode transgressif du dernier interglaciaire au cours duquel le niveau de la merétait supérieur à l’actuel d’une dizaine de mètres. Le rivage proprement dit est une micro-falaise devancée par un platier rocheux à surface affectée par de nombreuses formes de cor-rosion et jonchée de débris de grès provenant de sa destruction ou arrachés à la microfalai-se. On reconnaît aussi des fragments de roches allogènes et de céramiques issus des ruinesantiques qu’on trouve dans les différents îlots.
2.2.2 Une érosion marine menaçante et des rivages à haut risque avec une variation positive du niveau marin
L’érosion marine et les signes de retrait du rivage qui en résultent sont reconnais-sables dans le front de certains schorres, sebkhas et petites plages sableuses où ils sontgénéralement matérialisés par une microfalaise vive et/ou par des mottes de terres etdes plantes déchaussées par les vagues. Les plus spectaculaires ou significatifs pour l’é-volution récente caractérisent toutefois les falaises des environs de Skhira et les riva-ges des îlots de la partie méridionale de l’archipel des Kneiss.
Dans les falaises l’érosion marine agit par un mécanisme encoche-éboulement (Fig.2.2.1). La fréquence des cicatrices au dessus des encoches et les nombreux éboulis dontcertains atteignent quelques dizaines de m3 de volume témoignent de l’importance d’u-ne telle évolution menaçante pour différents aménagements et qui a sans doute été à l’o-rigine d’un retrait important du trait de côte. On ne dispose pas de repères récents pourquantifier ce recul mais on peut voir qu’immédiatement au Sud de Borj Ennadhour il adéjà amputé un site archéologique antique d’une partie importante de sa substance.
L’archipel n’a plus le même visage que celui que lui connaissaient les romains:c’est en effet dans les îlots rocheux de l’archipel que l’appréciation du recul du traitde côte et de ses conséquences est la plus aisée. Car, aux indices morphologiques s’a-joutent des repères archéologiques et des données recueillies dans des textes histo-riques de différentes époques.
“baseline research for the integrated sustainable management…” 65

Les eaux marines agissent à la fois par des processus mécaniques et biochimiquesdont l’efficacité est matérialisée par une microfalaise à pied encombré de débrisrocheux et par une multitude de formes de corrosion. L’importance du démantèle-ment est également attestée par des vestiges archéologiques antiques taillés par lafalaise et dont les traces sont visibles même sur l’avant côte. Tout indique que l’ar-chipel a connu une évolution importante et des modifications appréciables dans sonextension et sa configuration au cours des temps récents. De fait, arguments de ter-rain et textuels indiquent que la tendance générale a été pour le tronçonnage et laréduction de la superficie des différents îlots, surtout ceux du Sud. Les îlots d’ElHjar, d’El Laboua et d’El Gharbia ont très vraisemblablement continué à être unisjusqu’à l’époque historique, probablement jusqu’aux tous derniers siècles pour ElLaboua et El Gharbia.
Des investigations géoarchéologiques récentes (Trousset et al., 1992) ont permis deconfirmer l’idée selon laquelle les traces du monastère dans lequel s’était retiré Saint Ful-gence (abandonnant sa dignité d’abbé vraisemblablement en l’an 503, 504 ou 505, pourse consacrer à la prière et aux travaux manuels) existent dans l’îlot d’El Laboua. Or, cetîlot est aujourd’hui très minuscule; il n’a que 45 m sur 44 m respectivement pour la lon-gueur et la largeur et ne peut contenir une communauté de moines aussi importante quecelle ayant accompagné le Saint homme. C’est qu’en réalité il a été, depuis, amputé d’u-ne partie importante de sa substance.
D’un autre côté, en 1587, F. Lanfreducci et J.O. Bosio, dans leur Costa e discorsi diBarbaria, mentionnent les Friscioli qui sont les îles Kneiss, comme “deux petites îles avecdes bancs”. Il s’agit sans doute d’El Bessila d’une part et les trois autres îlots qui formaientune seule. La même idée se dégage chez d’Avezac (1948) qui avait remarqué que diversportulans catalans du Moyen Age et de la Renaissance ne cartographiaient sous le nomde Frixols que deux îles.
Une telle évolution, en particulier l’efficacité avec laquelle a opéré l’érosion mari-ne, peut paraître énigmatique compte tenu du cadre naturel qui ne favorise pas unegrande agitation des eaux marines. La hauteur des vagues est le plus souvent infé-rieure à 1 m et ne montre une certaine importance qu’à l’occasion de certaines tem-pêtes. Même dans ce dernier cas, elle n’excède presque jamais les 2 m. Les hauts-fondssont à l’origine d’une séparation naturelle importante entre le large d’une part et la
66 presentation and characterization of the sites
Fig. 2.2.1 Mode de recul des falaises sous l'action des vagues: l'évolution commence par une encocheau pied de la falaise qui prépare à des éboulements. Les éboulis assurent une protection provisoire dupied de la falaise ce qui peut favoriser l'apparition d'une végétation adaptée. Le scénario reprend dèsque ces éboulis sont démantelés par les vagues et leurs débris poussés par les courants
A B C D
côte d’autre part. D’ailleurs, l’appellation arabe traditionnelle “SurKneiss” (le rempartdes Kneiss) par laquelle sont désignés les bancs et les îlots qu’ils portent est fortexpressive; car ces bancs constituent une espèce de digue, une barrière de protectioncontre la houle venue de l’Est mais qui devait aussi assurer à la côte une protectioncontre les envahisseurs depuis le large.
L’explication est à chercher surtout dans la tendance qui a marqué le comporte-ment du niveau marin et la tectonique régionale au cours des temps récents. Si la mera réussi à gagner autant d’espace c’est à cause de l’élévation historique du niveaumarin maintenant attestée, sur les côtes tunisiennes, par de nombreux vestigesarchéologiques submergés et dont la valeur se situe entre 20 et 40 cm. Dans la régiondes Kneiss ses effets ont été amplifiés par un affaissement sensible du sol côtier suiteà une activité subsidente continue. Ceci est confirmé par exemple, par l’analyse desenregistrements marégraphiques du port de Sfax qui indiquent pour le vingtième siè-cle une variation positive du niveau marin de 5,7 mm/an (Pirazzoli, 1986), vitessequatre à cinq fois plus rapide que la moyenne avec laquelle se fait l’augmentation duniveau de la mer à l’échelle planétaire.
C’est donc un terrain très sensible aux variations du niveau marin. Il doit être consi-déré comme à haut risque en cas d’une Elévation Accélérée du Niveau Marin(E.A.N.M.) comme celle que prévoient les scénarios de l’I.P.C.C. Une telle élévationentraînera accélération de l’érosion marine et extension des sebkhas en direction ducontinent, suite à l’intrusion des eaux marines et la progression de la salinisation auxdépens des plaines alluviales qui les bordent. Des îlots comme El Hjar ou même Labouarisquent de disparaître ainsi que le patrimoine archéologique qu’ils renferment.
2.2.3 Une érosion hydrique dégradante dans le continent et à impacts multiplesdans le domaine marin
Souvent brutales, concentrées dans le temps et survenant après des périodes desécheresse plus ou moins longues, les pluies donnent fréquemment lieu à des écoule-ments agressifs. Si bien qu’en dépit de sa faiblesse, le réseau hydrographique mène,une érosion parfois sévère et très menaçante surtout pour un patrimoine pédologiquedéjà limité et peu protégé, les sols étant souvent très minces à squelettiques et le cou-vert végétal ne dépasse presque jamais le stade d’une steppe dégradée.
Les effets de cette érosion, qui contribue à l’accentuation de la désertification déjàassez perceptible dans différents secteurs, sont particulièrement nets dans les argilesmio-pliocènes et les formations quaternaires qui ne bénéficient pas d’une protectionpar des croûtes, notamment dans le domaine des collines et à la faveur des rupturesde pente qui accidentent ici et là le domaine des plateaux ou qui caractérisent les ber-ges des principaux cours d’eau. Le résultat est, en de nombreux endroits, un paysagetrès disséqué par un réseau très complexe de ravins; véritables “Chebkas” (terme trèsfréquent dans la toponymie locale et qui signifie terres très ravinées).
La contrepartie de cette érosion sont des alluvionnements parfois impressionnants
“baseline research for the integrated sustainable management…” 67
dans la partie aval des plaines littorales et dans le domaine marin où ils ont des consé-quences multiples. Pour le rivage ils sont plutôt bénéfiques puisqu’ils lui procurent unepartie de son corps sédimentaire. Mais au cours des événements pluviométriquesmajeurs les apports des oueds, surtout les plus grands comme Oued Ouadrane, sont àl’origine d’inondations catastrophiques et peuvent s’avancer loin vers le large notammentlorsque le paroxysme des crues coïncide avec une marée descendante ou lorsque leshauts-fonds sont exondés. Cette avancée, aidée par les oueds sous-marins du fait de lalocalisation de leurs principales branches dans le prolongement des oueds continentaux,peut alors, compte tenu de l’importance des hauts-fonds, influencer l’environnementmarin au moins sur le plan sédimentologique. C’est ce qui se serait produit à l’occasiondes inondations de janvier 1990 et surtout celles de septembre-octobre 1969. Tous lespêcheurs, d’un certain âge, s’accordent sur le fait que “la mer des Kneiss a subi des chan-gements importants suite aux crues de 1969”. Ils précisent que “certains secteurs sontdevenus moins profonds et que les secteurs proches du rivages sont devenus plus vaseux”.
Tout fait comme si ces hauts-fonds font partie à la fois de la mer et du continent;c’est l’autre face de l’originalité de la région des Kneiss.
2.2.4 De l’intérêt des géosystèmes en cours de formation au pied des falaises
Les falaises de Skhira sont, en différents endroits, soumises à une double attaque:l’érosion marine à la base et l’érosion hydrique dans leur partie supérieure. Celle-ci aréussi à créer un réseau de ravins parfois très dense et profondément encaissé. Le phé-nomène est initié par de petites cicatrices qui évoluent à la fois par érosion linéaire,latérale et surtout régressive. C’est une évolution relativement rapide ainsi que le lais-se croire par exemple, le déplacement répété des pistes qui passent à proximité destêtes de ravins.
La contrepartie de ce démantèlement est une progradation parfois remarquable del’estran. Si bien qu’en plusieurs endroits le rivage a été repoussé au point de mettreles falaises à l’abri des vagues parfois de façon permanente. En fait, plusieurs situa-tions existent allant de l’apparition de la petite plage, accompagnée ou non de dunes,à la plaine alluviale de largeur plurihectométrique; elles illustrent les différentes éta-pes d’une évolution dont la connaissance peut être très instructive sur le planmorphosédimentaire mais aussi pour la dynamique de l’environnement côtier dansson ensemble (Fig. 2.2.2). Car au fur et à mesure que ces espaces gagnés sur la merévoluent des formes de vie, végétale et animale, font leur apparition.
2.2.5 Les constructions éoliennes sur les berges des sebkhas: des géosystèmes en danger
Par sa localisation littorale et son climat semi aride, la région des Kneiss est trèsfavorable à l’activité éolienne. Celle-ci est déjà, par la déflation exercée à la surface desplateaux, à l’origine de différentes formes de désertification et de vastes regs (Hma-da). Les formes de construction se rencontrent au bord de la mer à la faveur des
68 presentation and characterization of the sites
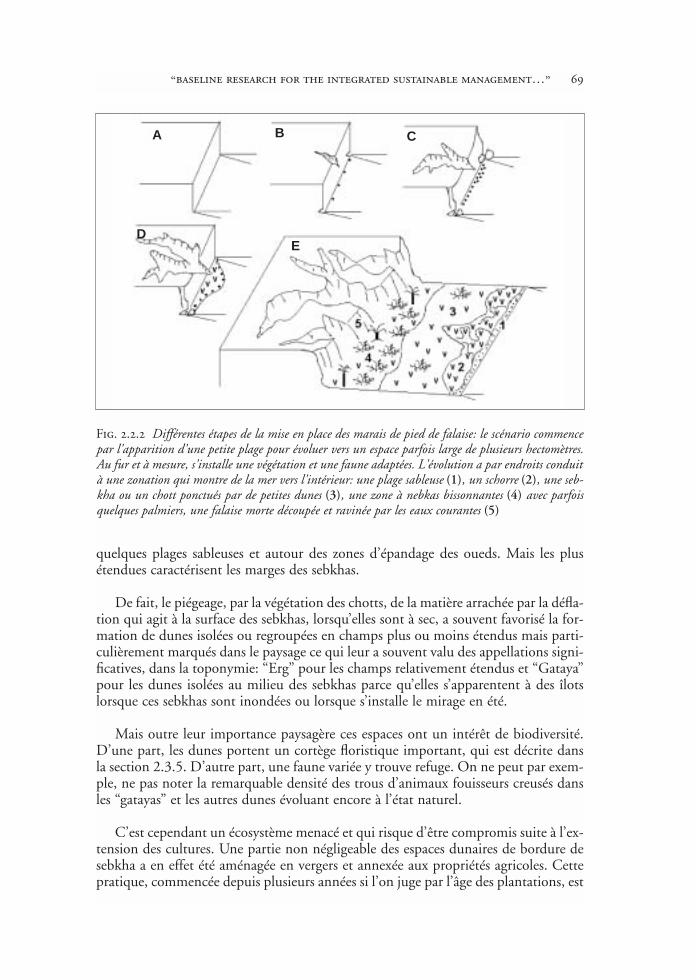
quelques plages sableuses et autour des zones d’épandage des oueds. Mais les plusétendues caractérisent les marges des sebkhas.
De fait, le piégeage, par la végétation des chotts, de la matière arrachée par la défla-tion qui agit à la surface des sebkhas, lorsqu’elles sont à sec, a souvent favorisé la for-mation de dunes isolées ou regroupées en champs plus ou moins étendus mais parti-culièrement marqués dans le paysage ce qui leur a souvent valu des appellations signi-ficatives, dans la toponymie: “Erg” pour les champs relativement étendus et “Gataya”pour les dunes isolées au milieu des sebkhas parce qu’elles s’apparentent à des îlotslorsque ces sebkhas sont inondées ou lorsque s’installe le mirage en été.
Mais outre leur importance paysagère ces espaces ont un intérêt de biodiversité.D’une part, les dunes portent un cortège floristique important, qui est décrite dansla section 2.3.5. D’autre part, une faune variée y trouve refuge. On ne peut par exem-ple, ne pas noter la remarquable densité des trous d’animaux fouisseurs creusés dansles “gatayas” et les autres dunes évoluant encore à l’état naturel.
C’est cependant un écosystème menacé et qui risque d’être compromis suite à l’ex-tension des cultures. Une partie non négligeable des espaces dunaires de bordure desebkha a en effet été aménagée en vergers et annexée aux propriétés agricoles. Cettepratique, commencée depuis plusieurs années si l’on juge par l’âge des plantations, est
“baseline research for the integrated sustainable management…” 69
Fig. 2.2.2 Différentes étapes de la mise en place des marais de pied de falaise: le scénario commencepar l'apparition d'une petite plage pour évoluer vers un espace parfois large de plusieurs hectomètres.Au fur et à mesure, s'installe une végétation et une faune adaptées. L'évolution a par endroits conduità une zonation qui montre de la mer vers l'intérieur: une plage sableuse (1), un schorre (2), une seb-kha ou un chott ponctués par de petites dunes (3), une zone à nebkas bissonnantes (4) avec parfoisquelques palmiers, une falaise morte découpée et ravinée par les eaux courantes (5)
B CA
DE
toujours en cours. Elle se fait parfois à un rythme rapide car ne nécessitant ni grosefforts ni gros moyens, les dunes étant faites d’un matériel meuble et leur végétationfacile à éradiquer.
2.2.6 Quelles recommandations pour l’aménagement?
Si le littoral des Kneiss est restée jusqu’à très récemment à l’abri des aménagementsc’est parce que son environnement naturel est jugé peu attractif notamment à causede la grande extension des terres humides et des estrans vaseux ainsi que des contrain-tes que pose la faible profondeur de ses eaux à la navigation. Ceci, s’il n’a pas favori-sé la région sur le plan économique, a constitué une chance pour le milieu naturel quia échappé à bien de problèmes dont souffrent d’autres milieux littoraux fortementanthropisés comme les plages.
L’implantation à Skhira d’une activité industrielle polluante, notamment l’usinede phosphates (S.I.A.P.E.), a certes des incidences au niveau du développement local;mais elle témoigne d’une continuité de la marginalisation du milieu naturel ou entout cas de l’existence d’insuffisances dans la définition de ses aptitudes réelles à l’a-ménagement.
Les investigations géologiques et géomorphologiques ont montré que la région, àla différence de l’impression que peut avoir un visiteur pressé, recèle des potentialitésmultiples parfois de très haute valeur environnementale et patrimoniale très insuffi-samment valorisées. De plus, sa nature en fait un milieu à originalités multiples etunique en son genre en Tunisie et même dans l’ensemble du bassin méditerranéen.Mais c’est en même temps un milieu très délicat et hypersensible aux interventionsde l’homme ainsi qu’aux variations d’ordre naturel; différents compartiments appel-lent déjà des interventions de protection. L’une des voies qui nous paraît, en somme,s’adapter le mieux à lui c’est d’en faire un parc naturel et un espace de découverte dela nature par la recherche scientifique et par un tourisme culturel.
Parmi les données que toute intervention, visant la valorisation de la région, sondéveloppement ou l’élaboration de plans d’aménagement doit considérer on insiste enparticulier sur:– la valeur paysagère et l’originalité du site;– le patrimoine géologique et archéologique important: préserver et valoriser les cou-
pes géologiques et les formations marines ou continentales significatives pour l’his-toire de la région ainsi que les vestiges archéologiques préhistoriques et historiques;
– la remarquable faiblesse de la bathymétrie qui rend le milieu marin particulière-ment sensible aux apports d’origine continentale aussi bien naturels qu’anthro-piques: apports des eaux courantes, apports de substances polluantes;
– la grande fragilité des constructions éoliennes, surtout en bordure des sebkhas, etleur intérêt de biodiversité à travers les formes de vie qui leur sont associées ouqu’elles abritent;
– l’instabilité des unités naturelles et les mutations qu’elles ont connu récemment ouqu’elles sont entrain de vivre: les uns disparus, menacées de disparition ou modifiées
70 presentation and characterization of the sites
(îlots méridionaux des Kneiss), les autres en cours de formation (au pied des falaisespar exemple) et offrent une occasion remarquable pour assister à la genèse de cer-tains écosystèmes permettant de mieux connaître leur nature et leur exigences;
– les tendances évolutives dans lesquelles s’inscrit la dynamique qui caractérise detelles unités naturelles: tenir compte en particulier de la variation positive duniveau marin, de la subsidence active du sol côtier, du retrait du trait de côte et del’incision du réseau hydrographique;
– les risques naturels divers, surtout ceux dont les effets peuvent être facilementaccentués par des interventions humaines imprévoyantes: érosion marine (parexemple, suite aux constructions très proches du rivage ou à proximité du sommetdes falaises), désertification (suite à un défonçage des croûtes ou à une destructionde ce qui reste du couvert végétal), inondations (suite à une multiplication desaménagements dans ou à proximité des lits des oueds et des zones d’épandage),une grande sensibilité aux variations du niveau marin (accélération de l’érosionmarine, progression de la salinisation en direction des terres basses littorales, …).
2.2.7 Références
Pirazzoli P.A. (1986) Secular trends of relative sea level change indicated by tide-gauge records,Journal Coastal Research, Special Issue, 1.
Oueslati A. (1995) Les Iles de la Tunisie, pubbl. C.E.R.E.S., des Arts et des Sciences Humaines,Sèrie Géographique 10, Tunis, 368 p.
Trousset P., Slim H., Paskoff R. et Oueslati A. (1992) Les Iles Kneiss et le Monastère de Ful-gence de Ruspe, Antiquités Afr., 28: 223-247.
“baseline research for the integrated sustainable management…” 71
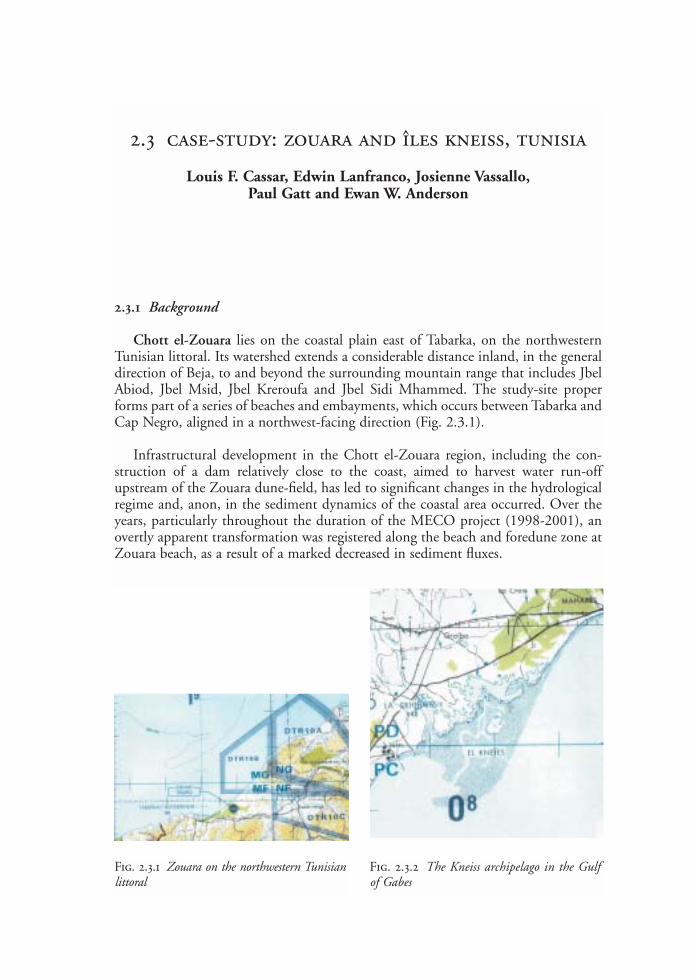
2.3 case-study: zouara and îles kneiss, tunisia
Louis F. Cassar, Edwin Lanfranco, Josienne Vassallo,Paul Gatt and Ewan W. Anderson
2.3.1 Background
Chott el-Zouara lies on the coastal plain east of Tabarka, on the northwesternTunisian littoral. Its watershed extends a considerable distance inland, in the generaldirection of Beja, to and beyond the surrounding mountain range that includes JbelAbiod, Jbel Msid, Jbel Kreroufa and Jbel Sidi Mhammed. The study-site properforms part of a series of beaches and embayments, which occurs between Tabarka andCap Negro, aligned in a northwest-facing direction (Fig. 2.3.1).
Infrastructural development in the Chott el-Zouara region, including the con-struction of a dam relatively close to the coast, aimed to harvest water run-offupstream of the Zouara dune-field, has led to significant changes in the hydrologicalregime and, anon, in the sediment dynamics of the coastal area occurred. Over theyears, particularly throughout the duration of the MECO project (1998-2001), anovertly apparent transformation was registered along the beach and foredune zone atZouara beach, as a result of a marked decreased in sediment fluxes.
Fig. 2.3.1 Zouara on the northwestern Tunisianlittoral
Fig. 2.3.2 The Kneiss archipelago in the Gulfof Gabes
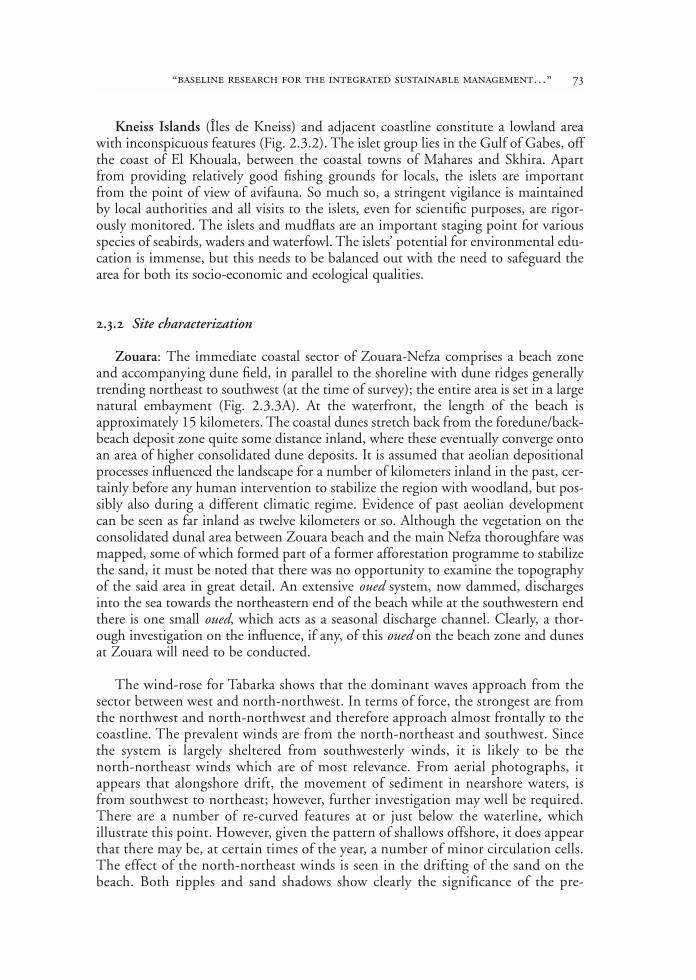
Kneiss Islands (Îles de Kneiss) and adjacent coastline constitute a lowland areawith inconspicuous features (Fig. 2.3.2). The islet group lies in the Gulf of Gabes, offthe coast of El Khouala, between the coastal towns of Mahares and Skhira. Apartfrom providing relatively good fishing grounds for locals, the islets are importantfrom the point of view of avifauna. So much so, a stringent vigilance is maintainedby local authorities and all visits to the islets, even for scientific purposes, are rigor-ously monitored. The islets and mudflats are an important staging point for variousspecies of seabirds, waders and waterfowl. The islets’ potential for environmental edu-cation is immense, but this needs to be balanced out with the need to safeguard thearea for both its socio-economic and ecological qualities.
2.3.2 Site characterization
Zouara: The immediate coastal sector of Zouara-Nefza comprises a beach zoneand accompanying dune field, in parallel to the shoreline with dune ridges generallytrending northeast to southwest (at the time of survey); the entire area is set in a largenatural embayment (Fig. 2.3.3A). At the waterfront, the length of the beach isapproximately 15 kilometers. The coastal dunes stretch back from the foredune/back-beach deposit zone quite some distance inland, where these eventually converge ontoan area of higher consolidated dune deposits. It is assumed that aeolian depositionalprocesses influenced the landscape for a number of kilometers inland in the past, cer-tainly before any human intervention to stabilize the region with woodland, but pos-sibly also during a different climatic regime. Evidence of past aeolian developmentcan be seen as far inland as twelve kilometers or so. Although the vegetation on theconsolidated dunal area between Zouara beach and the main Nefza thoroughfare wasmapped, some of which formed part of a former afforestation programme to stabilizethe sand, it must be noted that there was no opportunity to examine the topographyof the said area in great detail. An extensive oued system, now dammed, dischargesinto the sea towards the northeastern end of the beach while at the southwestern endthere is one small oued, which acts as a seasonal discharge channel. Clearly, a thor-ough investigation on the influence, if any, of this oued on the beach zone and dunesat Zouara will need to be conducted.
The wind-rose for Tabarka shows that the dominant waves approach from thesector between west and north-northwest. In terms of force, the strongest are fromthe northwest and north-northwest and therefore approach almost frontally to thecoastline. The prevalent winds are from the north-northeast and southwest. Sincethe system is largely sheltered from southwesterly winds, it is likely to be thenorth-northeast winds which are of most relevance. From aerial photographs, itappears that alongshore drift, the movement of sediment in nearshore waters, isfrom southwest to northeast; however, further investigation may well be required.There are a number of re-curved features at or just below the waterline, whichillustrate this point. However, given the pattern of shallows offshore, it does appearthat there may be, at certain times of the year, a number of minor circulation cells.The effect of the north-northeast winds is seen in the drifting of the sand on thebeach. Both ripples and sand shadows show clearly the significance of the pre-
“baseline research for the integrated sustainable management…” 73
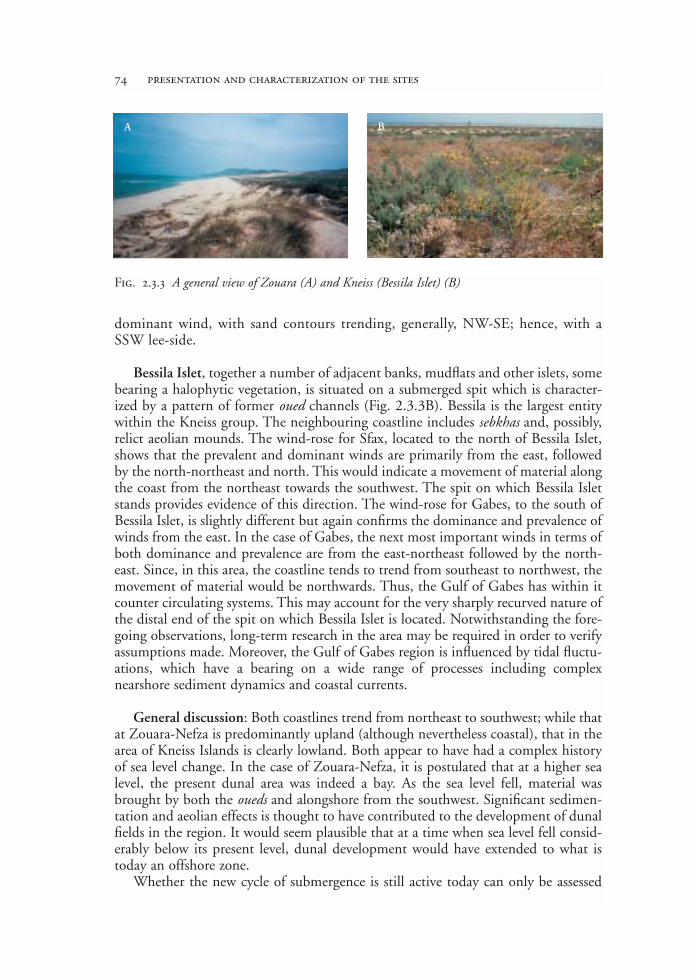
dominant wind, with sand contours trending, generally, NW-SE; hence, with aSSW lee-side.
Bessila Islet, together a number of adjacent banks, mudflats and other islets, somebearing a halophytic vegetation, is situated on a submerged spit which is character-ized by a pattern of former oued channels (Fig. 2.3.3B). Bessila is the largest entitywithin the Kneiss group. The neighbouring coastline includes sebkhas and, possibly,relict aeolian mounds. The wind-rose for Sfax, located to the north of Bessila Islet,shows that the prevalent and dominant winds are primarily from the east, followedby the north-northeast and north. This would indicate a movement of material alongthe coast from the northeast towards the southwest. The spit on which Bessila Isletstands provides evidence of this direction. The wind-rose for Gabes, to the south ofBessila Islet, is slightly different but again confirms the dominance and prevalence ofwinds from the east. In the case of Gabes, the next most important winds in terms ofboth dominance and prevalence are from the east-northeast followed by the north-east. Since, in this area, the coastline tends to trend from southeast to northwest, themovement of material would be northwards. Thus, the Gulf of Gabes has within itcounter circulating systems. This may account for the very sharply recurved nature ofthe distal end of the spit on which Bessila Islet is located. Notwithstanding the fore-going observations, long-term research in the area may be required in order to verifyassumptions made. Moreover, the Gulf of Gabes region is influenced by tidal fluctu-ations, which have a bearing on a wide range of processes including complexnearshore sediment dynamics and coastal currents.
General discussion: Both coastlines trend from northeast to southwest; while thatat Zouara-Nefza is predominantly upland (although nevertheless coastal), that in thearea of Kneiss Islands is clearly lowland. Both appear to have had a complex historyof sea level change. In the case of Zouara-Nefza, it is postulated that at a higher sealevel, the present dunal area was indeed a bay. As the sea level fell, material wasbrought by both the oueds and alongshore from the southwest. Significant sedimen-tation and aeolian effects is thought to have contributed to the development of dunalfields in the region. It would seem plausible that at a time when sea level fell consid-erably below its present level, dunal development would have extended to what istoday an offshore zone.
Whether the new cycle of submergence is still active today can only be assessed
74 presentation and characterization of the sites
Fig. 2.3.3 A general view of Zouara (A) and Kneiss (Bessila Islet) (B)
A B

from more detailed fieldwork and monitoring. It would appear that the foreshore isa particularly dynamic area.
In the area of Kneiss Islands, from an initial appraisal, it would appear thatmuch the same sequence of eustatic change could be discerned. As is the case withmost mudflats, the Kneiss system made up of islands, saltmarshes and sebkhas isfar from featureless. It exhibits a complexity of tidal channel networks (presentlyboth on land and in the water), ‘sediment mound’ topographies and ‘slope ter-races’. It is surmised that the detailed oued channel pattern could only have beenproduced sub-aerially. In contrast to the Zouara-Nefza beach sector, the terrestrialsector of this area appears geomorphologically more static. The apparent seawardcolonization by vegetation also indicates that there is some kind of stability, at leaston those areas, which do not experience too-frequent immersion. On the otherhand, the surrounding areas of the lower intertidal zone are, almost certainly, geo-morphologically dynamic, with sediments being transferred during tidal cycles(emersion/submersion cycle). At such time, a considerable recycling of sedimentsoccurs, depending on material erodibility, the processes of which are vital for themaintenance of mudflats. Apart from sediment transfer during tidal cycles, theregion is almost certainly influenced by sea currents. Evidence of this is the occur-rence of large beached pumice rocks (size: 250 mm) on Bessila; considering that thenearest volcano-generated rock materials occur a considerable distance from theKneiss islet group, it is clear that sea currents also play an important role in thetransport of sediments and other materials1.
2.3.3 Field survey methods
Assessment of landscape features: For both sites, if geomorphological systems andtopographic alteration are to be identified and change anticipated, it was consideredcritical to obtain measurements of current landforms and an assessment of the caus-es leading to degradation, particularly, of vegetation and, more specifically of theZouara dunes. In each case, therefore, detailed profiles were made and field measure-ments taken. When accurate larger scale maps are available, some of these profiles willallow identification of the main landscape features such as storm wave swash bars.Changes in landscape features can then be monitored by re-profiling.
In the case of geomorphological transects, for each profile, the orientation wasrecorded using a prismatic compass. A note of the position of the transect line wasmade, either in relation to other features or to previous transects. A detailed exami-nation of the transect line was made and the limits of each major facet were marked.A facet is normally taken to be a straight rather than a curved slope element. Incoastal environments, with the possible exception of dune slopes, facets are far morecommon than curved elements. Furthermore, angular measurements cannot be madeof curved elements and therefore curves were divided into straight facets. For each
“baseline research for the integrated sustainable management…” 75
1 The pumice may also have originated from roman ruins in the area.

facet, its angle from the horizontal was measured using an Abney Level. Length meas-urements were made either using the 15 m linen tape or by standard paces. Apartfrom these basic characteristics, potentially significant factors such as (i) vegetationtypes, (ii) sediment compaction, and (iii) the occurrence of debris along these tran-sects were noted. Field investigations on the status of the vegetation/habitat-types andthe dunal systems (in the latter case, Zouara) were conducted by way of standardsearches, belt transects and direct measurement using prismatic compass, clinometerand measuring tape. In particular, the foredune zone at Zouara beach was investigat-ed thoroughly in terms of its vegetation and dune morphology and coherence. Theentire foredune sector was measured (physical dimensions; angles of slope; dune hol-lows) and its physical relationship with other components of the beach/dune fieldassessed. At Kneiss and el Khaouala, where the topography is generally quite flat, thesurvey focused mainly, but not exclusively, on vegetation patterns of the mainland (elKhaouala) and Kneiss islet.
Profile plotting and field observations: Using transect data, a series of profiles wasplotted for each a scale of 1:500. This allowed an accuracy of 0.25 m for distancemeasurements. Angular records were plotted to the nearest 30’ of arc and, as is stan-dard practice for such profiles, the vertical measurement was trebled. Without suchexaggeration, it would be difficult to detect any features given the preponderance oflow angle facets. Since the measurements were made in facets, no attempt has beenmade to smooth the plotted curves. It is felt that when the procedure needs to bereplicated for monitoring purposes, the dimensions of each facet need to be clearlyidentifiable. Thus, the profiles appeared somewhat angular.
For the beach sector of Zouara, transects were measured to identify beach form inwhat appear to be the three major sectors of the beach. From the entry point of theroad, taken to be a fixed point, to the northwest is a sharply defined sand mound notunlike a dune crest, which, apart from the break for the oued entry, backs the beach.Evidence from aerial photographs together with the extraordinary rectilinear natureof this sand mound indicates that, if not entirely manmade, it is to a large extent arti-ficial. To the southwest of the road entry point, the dunes have a far more naturalappearance and are less rectilinear.
From the road entry point to the river, a swale immediately inland of the sandmound has obviously been cleared by earth moving equipment, presumably to rein-force the sand mound. Immediately beyond the breach made by the oued, the areahas led to a ponding of water, the volume and character of which appeared to changefairly significantly from year to year. Further to the northeast the pattern of dunesinland looks natural and relatively undisturbed. In this section there is a clear differ-ence in height of the dune, which backs the beach. Lower dunes are succeeded to thenortheast by higher dune crests, constituting a dunal succession; this may be due tothe larger dunes being located downwind of prevailing northwesterly winds.
The onset of the highest dunes coincides with:I. the widest extent of the beach; II. a shoreline promontory;
76 presentation and characterization of the sites

III. the northeastern termination of ponding as water erosion on the landward side ofthe dune; and
IV. the commencement of foredune and back-beach development.
The interpretation of this assemblage clearly requires more detailed fieldwork.Throughout the length of dune measured, the use of brushwood reinforcement wasin evidence (refer to threats and impacts below).
Transects were taken in three sections:I. northeast of the oued ;II. between the oued and road entry point; andIII. southwest of the road entry point.
Each transect was measured at a constant orientation of 325°, approximately nor-mal to the waterline. The distance between each transect was measured by standardpace. The resulting profiles have been plotted, in order, from the northeast to the south-west. Each begins at the waterline (left-hand end) and ends at the back of the beach,normally, at the top of the foredune (first dune ridge). For detailed analysis, it will benecessary to have an accurate large-scale map on which the lines of the transects couldbe plotted. Using the profiles alone, it was noted that the width of the beach varies veryconsiderably, in general narrowing from the northeast towards the southwest. Howev-er, it was clear from the length of the profiles that there are also embayments.
Immediately above the waterline, a wide variation in facet angle from a steep cliff-like feature to a very gentle slope was recorded. Towards the backshore (at the pointwhere back-beach deposits form), there was a greater consistency of profile. Foreduneand foredune relicts occurred in some areas. The angle of the dune face appears rela-tively constant although, this is to a degree a matter of judgment as the slope is gen-erally convex in shape. The main conclusions are that the beach varies considerablyin width, possibly as a result of sediment fluctuations, and that the foreshore appearsvolatile while the backshore seems relatively stable, although possibly experiencingincompatibility where beach-dune sediment budget is concerned. When the profilescan be plotted on a map, it will be possible to identify the length of beach berms andother features, which at present can only be intimated on the profiles.
In the coastal area adjacent to Kneiss Islets, two topographical transects weremade. As with the Zouara-Nefza transects, distance was measured using the 15 mlinen tape. For both transects, the distances involved were relatively great and, to aidthe identification of features, the limit of each facet is numbered in the plotted pro-files. Concurrently, belt transects were made on both the mainland at el Khaoualaand on Bessila.
Profiling at Bessila revealed a broad sebkha-like formation (salt-marsh area) whichfollows a narrow beach covered with organic material and flotsam that extends effec-tively across a considerable length of shoreline. There are then what can be inter-preted as narrow sand mounds not unlike raised beaches fronting dune-like assem-blages (? relict dunes), the crests of which extend inland from the low-lying shore.
“baseline research for the integrated sustainable management…” 77
The profile extends from sea level to inland mudflats, which are also taken to be atsea level and shows a fairly substantial overall rise and fall in the topography.
A detailed topographic transect was made across the higher locations of Bessilawhich otherwise comprises mudflats little above sea level. The only eminence not exam-ined, consisted of a narrow sand mound line in the southwest of the islet. The profilereveals the general flatness of the landscape onto which are superimposed minor undu-lations. Given the material of which they were made, it is reasonable to suppose thatthese are, in-part, relict aeolian mounds. From sea level, the profile rises to a low plateauthen descends to a flat relatively extensive plain. From the plain it rises to a relict sedi-ment mound, the crestline of which is shown by a major sediment mound, exhibitinga flattened crest. The length of each ridge was measured by standard pace. The lowplateau extended for 364 m and the major sediment mound for 996 m.
2.3.4 Observations on sand dunes and surrounding habitats at Zouara
The coastal area at Zouara consists of a wide embayment, not unlike a linear beachsetting. The study-area constitutes a beach zone, a dune field, a oued system developinginto a perennial watercourse (since the river is now dammed), and a hinterland, whichextends some twelve kilometres inland towards the Zouara-Nefza thoroughfare.
It is widely acknowledged that an active dune field is highly dependent on theinteraction between a number of key elements required for coastal dune develop-ment. Typically, an active dune field would consist of a sediment bank located in anoffshore or foreshore zone; the wet/dry transitional beach boundary, and an activeforedune area, known as the transit zone; and, a resting zone, which comprises thestable dune area. For these entities to occur, an ample supply of sediment is requiredtogether with the principal agents or geomorphological processes involving aeoliansand transport and deposition, and, a characteristic vegetation.
Sediment supply occurs as a result of alongshore drift from eroding headlands,cliffs and other coastal formations (including other beach zones and dune systems),as well as by fluvial sources such as rivers and valleys, and directly via the seabed. Inlocations experiencing a positive alongshore sediment budget, coastal foreduneassemblages would tend to develop in a sequence that is related to the gradient ofalongshore sediment supply.
In the case of Zouara, it is largely assumed that the prevailing situation vis-à-visthe foredunes, is due to the interruption of sediment, both in a spatial and temporalcontext, as a consequence of the new dam construction. Long-term erosion of theforedune assemblage in any dune system often leads to the initial enlargement of thedune proper. However, prolongment of this phenomenon due to alterations in sedi-ment fluxes (as a result of fluctuation in fluvial discharge at the coast) may subse-quently lead to deflation of the main dune ridge structure.
Before the dam was constructed, the Zouara coastal sand dune system may have
78 presentation and characterization of the sites

been described as a fluvial delta sediment system, whereby the source of sediment was,indeed, the system of oueds that eventually culminated in the river downstream,which flowed out into the sea at Zouara beach. In the Zouara case, the spatial asso-ciation began adjacent to the sediment source (river mouth) where a highly positivebeach budget and low dune budget occurred. Alongshore drift gradient would haveshown a decreasing beach budget accompanied by an increasing dune budget. Thismorphological sequence of events would lead to a very low foredune at the pointadjacent to the fluvial source and increasing in dimension in the alongshore directiondue to an enhanced dune budget. This was indeed the case at Zouara. However, withthe relatively recent damming of the fluvial source and consequent decrease in sedi-ment supply, the foredune zone experienced a sustained loss of its accumulated mass.
During the first year of research at Zouara it was predicted that should erosioncontinue at a steady pace, and, as a result of which, the beach budget deficit grows,it is likely that the foredune would continue to lose mass. Under a prolonged nega-tive budget, it was felt at the time that the foredune would eventually decrease in sizeand subsequently undergo morphological changes such as deflation of the ridge struc-ture. It was further envisaged that in the long-term the dune might experience asequence of attenuation stages that will lead to a ‘permanent’ loss of foredune struc-ture coherence. If this predicament for Zouara was correct, then the dunal system, atleast, that adjacent to the river mouth, was considered to be exceedingly vulnerable.Such interpretation was based on the fact that some of the foredunes appeared tohave become quite flat-ridged due to an evident loss in aeolian dynamism and, as aresult, a number of blow-out formations (excessive wind erosion and lack of sandmaterial input) and gullies had formed on and around the foredunes’ area.
In a relatively short time-span the Zouara foredunes became less stable and it soonbecame evident that dunal vegetation would find it harder to establish itself with suc-cess. Throughout the study period (1999-2001), degradation was observed to rapid-ly set in. This was largely due to a number of factors, namely the significant decreasein sediment supply coupled by a lack of adequate vegetation cover to effectively sta-bilise the dune face and to act as an interception medium for descending saltatingsand grains; higher rates of sand transport and low deposition levels often result fromthe latter. The presence of dune vegetation increases the amount of humus and oth-er detrital material resulting in better soil conditions and water retention capabilities.In the case of the Zouara dunes, the situation is likely to worsen since a considerablesection of the foredune has already began to lose much of its vegetation cover.
Having established a baseline on a number of components, which make up theZouara system, monitoring was identified as the only short-term option prior to pro-posing any intervention plans. In this respect, on-going observations were conduct-ed, over the three years of the project’s duration, on the dune system, the beach andthe river mouth zone. The beach was monitored in terms of depositional sand budg-ets on its surface; where the material was likely to be moving and subsequentlydeposited; and, whether the trends of beach-line erosion are continuing in the future,at the present rate. In the long-term, it would be important to establish whether thereis any evident retreat of the present shoreline and any significant build-out of sand
“baseline research for the integrated sustainable management…” 79

80 presentation and characterization of the sites
A B
C
D E
F
Fig. 2.3.4 (A-F) Degradation of dunes observed at Zouara throughout the study period (1999-2001).(A) Evidence of beach-face erosion (1999). (B) Detail (1999). (C) Significant sediment loss over aspan of ten months (2000). (D) Permanent structures as baseline for measuring erosion (2000). (E,F) Accelerated erosion as a result of the disruption of aeolian processes; note scraping of the beach sur-face (E) and collapse of permanent structures (F) (2001)
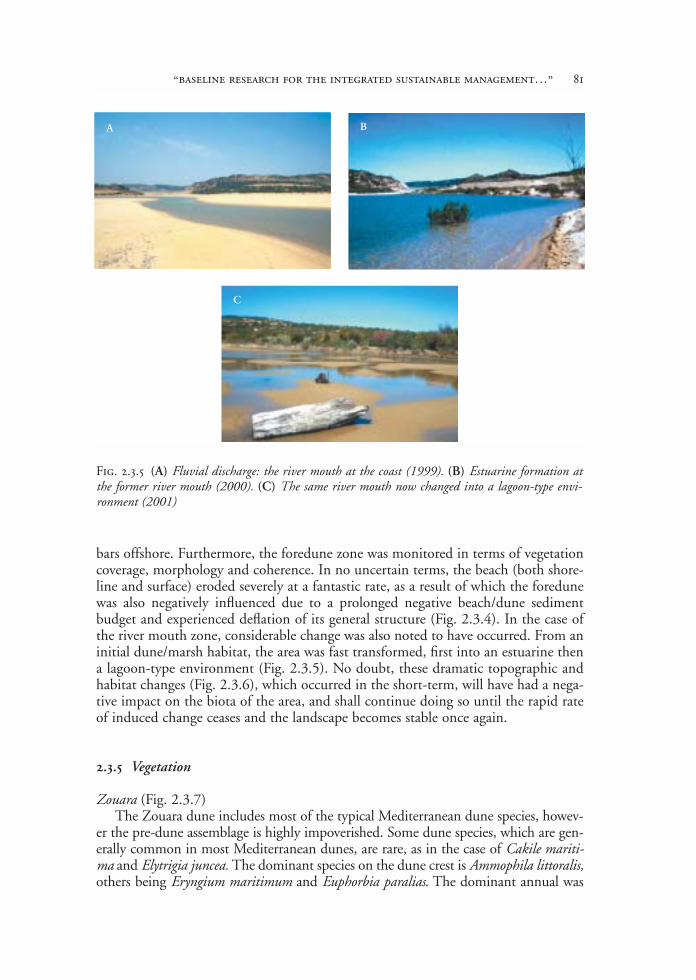
bars offshore. Furthermore, the foredune zone was monitored in terms of vegetationcoverage, morphology and coherence. In no uncertain terms, the beach (both shore-line and surface) eroded severely at a fantastic rate, as a result of which the foredunewas also negatively influenced due to a prolonged negative beach/dune sedimentbudget and experienced deflation of its general structure (Fig. 2.3.4). In the case ofthe river mouth zone, considerable change was also noted to have occurred. From aninitial dune/marsh habitat, the area was fast transformed, first into an estuarine thena lagoon-type environment (Fig. 2.3.5). No doubt, these dramatic topographic andhabitat changes (Fig. 2.3.6), which occurred in the short-term, will have had a nega-tive impact on the biota of the area, and shall continue doing so until the rapid rateof induced change ceases and the landscape becomes stable once again.
2.3.5 Vegetation
Zouara (Fig. 2.3.7)The Zouara dune includes most of the typical Mediterranean dune species, howev-
er the pre-dune assemblage is highly impoverished. Some dune species, which are gen-erally common in most Mediterranean dunes, are rare, as in the case of Cakile mariti-ma and Elytrigia juncea. The dominant species on the dune crest is Ammophila littoralis,others being Eryngium maritimum and Euphorbia paralias. The dominant annual was
“baseline research for the integrated sustainable management…” 81
A B
C
Fig. 2.3.5 (A) Fluvial discharge: the river mouth at the coast (1999). (B) Estuarine formation atthe former river mouth (2000). (C) The same river mouth now changed into a lagoon-type envi-ronment (2001)
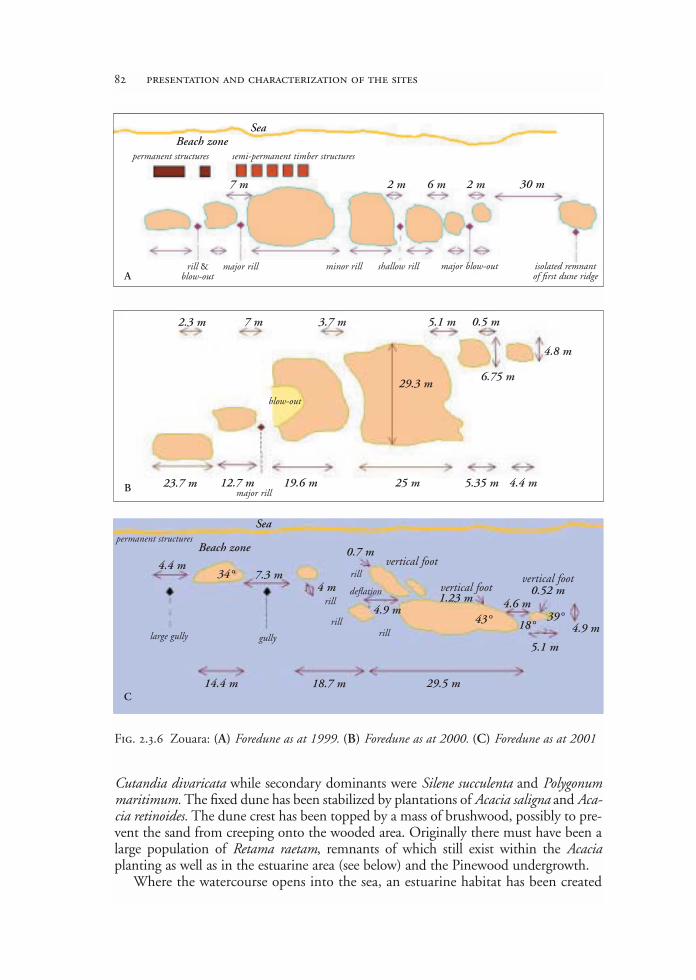
Cutandia divaricata while secondary dominants were Silene succulenta and Polygonummaritimum. The fixed dune has been stabilized by plantations of Acacia saligna and Aca-cia retinoides. The dune crest has been topped by a mass of brushwood, possibly to pre-vent the sand from creeping onto the wooded area. Originally there must have been alarge population of Retama raetam, remnants of which still exist within the Acaciaplanting as well as in the estuarine area (see below) and the Pinewood undergrowth.
Where the watercourse opens into the sea, an estuarine habitat has been created
82 presentation and characterization of the sites
Fig. 2.3.6 Zouara: (A) Foredune as at 1999. (B) Foredune as at 2000. (C) Foredune as at 2001
A
B
C
SeaBeach zone
7 m 2 m 6 m 2 m 30 m
29.3 m6.75 m
4.8 m
0.5 m5.1 m3.7 m7 m2.3 m
23.7 m 12.7 m 19.6 m 25 m 5.35 m 4.4 m
Beach zone
4.4 m
14.4 m
7.3 m4 m
0.7 m
18.7 m 29.5 m
vertical foot0.52 mvertical foot
vertical foot
permanent structures semi-permanent timber structures
rill &blow-out
major rill minor rill shallow rill major blow-out isolated remnantof first dune ridge
blow-out
major rill
Seapermanent structures
34°
large gully gully
rill
rill
rill
rill
deflation
4.9 m1.23 m 4.6 m
43° 39°
5.1 m
4.9 m18°
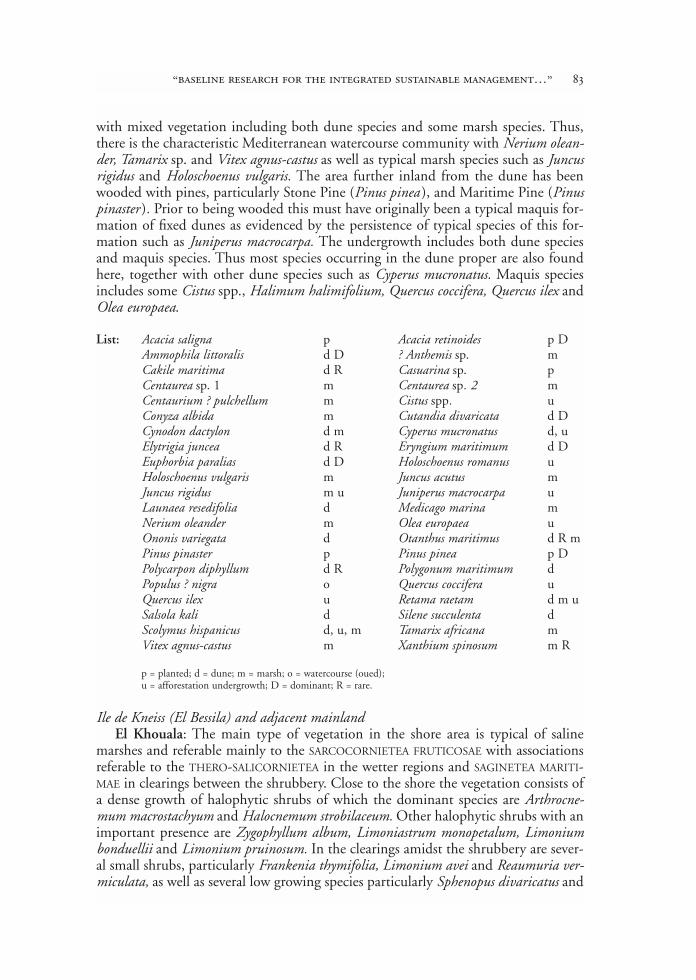
with mixed vegetation including both dune species and some marsh species. Thus,there is the characteristic Mediterranean watercourse community with Nerium olean-der, Tamarix sp. and Vitex agnus-castus as well as typical marsh species such as Juncusrigidus and Holoschoenus vulgaris. The area further inland from the dune has beenwooded with pines, particularly Stone Pine (Pinus pinea ), and Maritime Pine (Pinuspinaster ). Prior to being wooded this must have originally been a typical maquis for-mation of fixed dunes as evidenced by the persistence of typical species of this for-mation such as Juniperus macrocarpa. The undergrowth includes both dune speciesand maquis species. Thus most species occurring in the dune proper are also foundhere, together with other dune species such as Cyperus mucronatus. Maquis speciesincludes some Cistus spp., Halimum halimifolium, Quercus coccifera, Quercus ilex andOlea europaea.
List: Acacia saligna p Acacia retinoides p DAmmophila littoralis d D ? Anthemis sp. mCakile maritima d R Casuarina sp. pCentaurea sp. 1 m Centaurea sp. 2 mCentaurium ? pulchellum m Cistus spp. uConyza albida m Cutandia divaricata d DCynodon dactylon d m Cyperus mucronatus d, uElytrigia juncea d R Eryngium maritimum d DEuphorbia paralias d D Holoschoenus romanus uHoloschoenus vulgaris m Juncus acutus mJuncus rigidus m u Juniperus macrocarpa uLaunaea resedifolia d Medicago marina mNerium oleander m Olea europaea uOnonis variegata d Otanthus maritimus d R m Pinus pinaster p Pinus pinea p D Polycarpon diphyllum d R Polygonum maritimum d Populus ? nigra o Quercus coccifera u Quercus ilex u Retama raetam d m uSalsola kali d Silene succulenta d Scolymus hispanicus d, u, m Tamarix africana m Vitex agnus-castus m Xanthium spinosum m R
p = planted; d = dune; m = marsh; o = watercourse (oued);u = afforestation undergrowth; D = dominant; R = rare.
Ile de Kneiss (El Bessila) and adjacent mainlandEl Khouala: The main type of vegetation in the shore area is typical of saline
marshes and referable mainly to the SARCOCORNIETEA FRUTICOSAE with associationsreferable to the THERO-SALICORNIETEA in the wetter regions and SAGINETEA MARITI-MAE in clearings between the shrubbery. Close to the shore the vegetation consists ofa dense growth of halophytic shrubs of which the dominant species are Arthrocne-mum macrostachyum and Halocnemum strobilaceum. Other halophytic shrubs with animportant presence are Zygophyllum album, Limoniastrum monopetalum, Limoniumbonduellii and Limonium pruinosum. In the clearings amidst the shrubbery are sever-al small shrubs, particularly Frankenia thymifolia, Limonium avei and Reaumuria ver-miculata, as well as several low growing species particularly Sphenopus divaricatus and
“baseline research for the integrated sustainable management…” 83
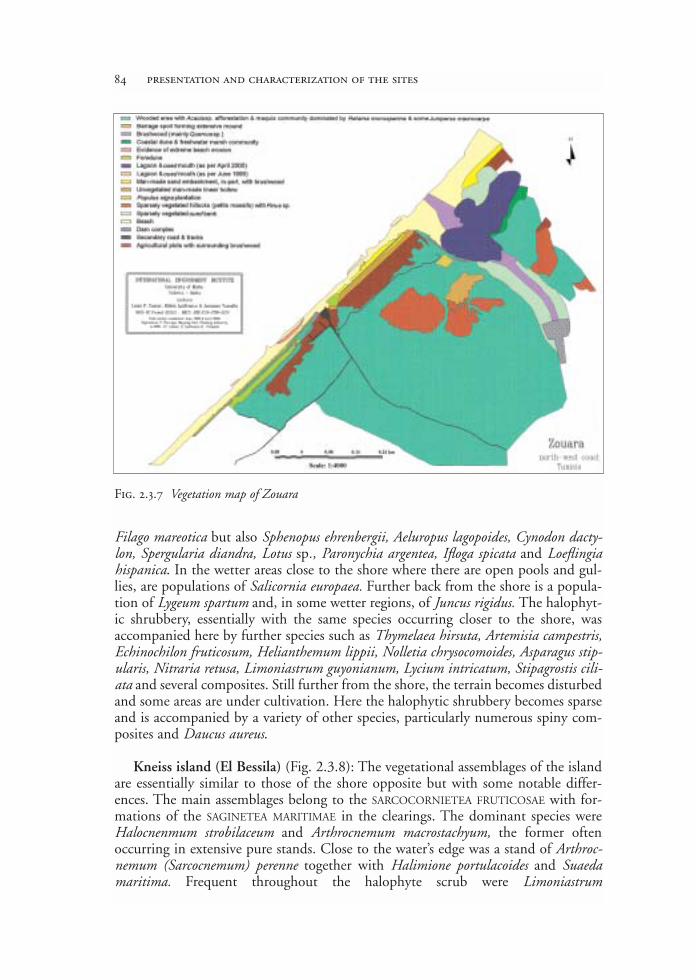
Filago mareotica but also Sphenopus ehrenbergii, Aeluropus lagopoides, Cynodon dacty-lon, Spergularia diandra, Lotus sp., Paronychia argentea, Ifloga spicata and Loeflingiahispanica. In the wetter areas close to the shore where there are open pools and gul-lies, are populations of Salicornia europaea. Further back from the shore is a popula-tion of Lygeum spartum and, in some wetter regions, of Juncus rigidus. The halophyt-ic shrubbery, essentially with the same species occurring closer to the shore, wasaccompanied here by further species such as Thymelaea hirsuta, Artemisia campestris,Echinochilon fruticosum, Helianthemum lippii, Nolletia chrysocomoides, Asparagus stip-ularis, Nitraria retusa, Limoniastrum guyonianum, Lycium intricatum, Stipagrostis cili-ata and several composites. Still further from the shore, the terrain becomes disturbedand some areas are under cultivation. Here the halophytic shrubbery becomes sparseand is accompanied by a variety of other species, particularly numerous spiny com-posites and Daucus aureus.
Kneiss island (El Bessila) (Fig. 2.3.8): The vegetational assemblages of the islandare essentially similar to those of the shore opposite but with some notable differ-ences. The main assemblages belong to the SARCOCORNIETEA FRUTICOSAE with for-mations of the SAGINETEA MARITIMAE in the clearings. The dominant species wereHalocnenmum strobilaceum and Arthrocnemum macrostachyum, the former oftenoccurring in extensive pure stands. Close to the water’s edge was a stand of Arthroc-nemum (Sarcocnemum) perenne together with Halimione portulacoides and Suaedamaritima. Frequent throughout the halophyte scrub were Limoniastrum
84 presentation and characterization of the sites
Fig. 2.3.7 Vegetation map of Zouara
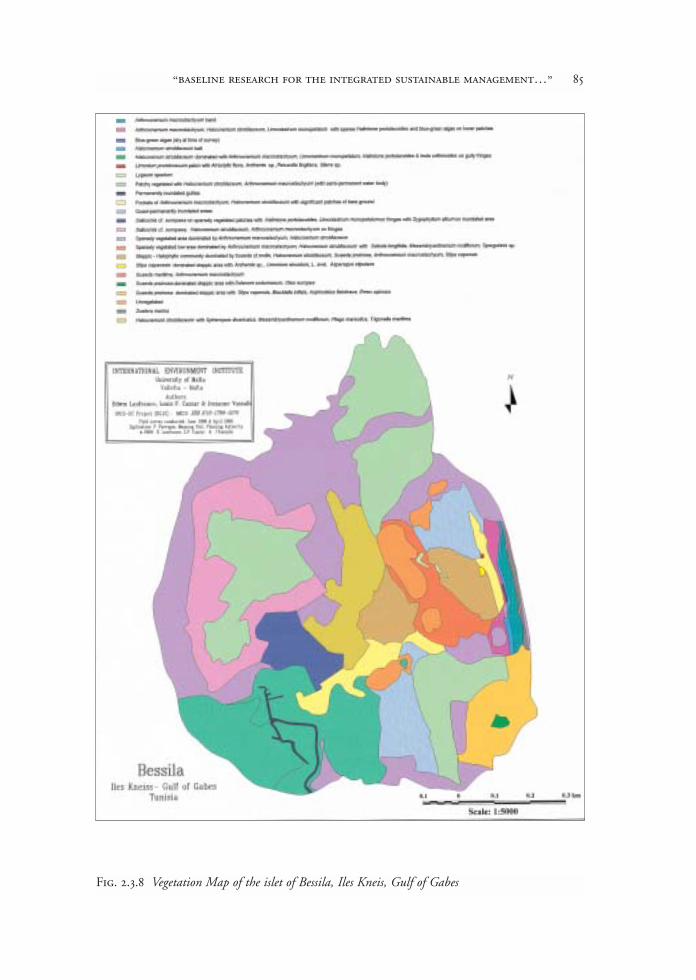
“baseline research for the integrated sustainable management…” 85
Fig. 2.3.8 Vegetation Map of the islet of Bessila, Iles Kneis, Gulf of Gabes
monopetalum, Zygophyllum album, Limonium sinuatum (here replacing the closelyrelated L. bonduellii of the mainland), Limonium pruinosum, Suaeda cf. mollis,Darniella cf. cruciata. The more steppic areas included stands of Suaeda pruinosa,Artemisia herba-alba, Stipagrostis ciliata, Stipa capensis, Allium commutatum, Aspho-delus ?fistulosus, Daucus aureus and undetermined composites, mainly thistles andAnthemidae. Along the water filled gullies were Halimione portulacoides, Limoniast-rum monopetalum and Arthrocnemum macrostachyum. In the clearings were assem-blages with Sphenopus divaricatus, Filago mareotica, Limonium avei, Frankenia thymi-folia, Cutandia memphitica, Lotus sp. and Spergularia diandra. Thick crusts ofcyanophytes covered areas that were evidently inundated during the wet season. Thehigher/drier parts include the occasional Nitraria retusa, Asparagus stipularis, Solanumsodomaeum, Blackiella inflata and a single olive tree, Olea europaea.
2.3.6 Diptera fauna
A total of 238 species in 50 families were collected during the whole of this fieldstudy (Table 2.3.1). 16 taxa are newly recorded for North Africa; 6 species are endem-ic to Tunisia, 1 is stenotopic (a site-specific species that occurs exclusively on dunes),at least 52 species were previously not recorded for Tunisia, and 8 species are new toscience. These findings serve to underscore the importance of the area under study.More extensive collecting will doubtless unearth more species.
The beach and dunes at Zouara (l/o Nefza) yielded the largest number of species(160). Most of the material recorded consists of widely distributed species that occurcommonly in similar habitats in Mediterranean shores and elsewhere. Some of theserecords are however notable. These include 1 species, which is exclusive to dunehabitats, 2 endemic species, 42 species, which are newly recorded for Tunisia, and 2species which are new to science. Nevertheless, considering its very extensive size,the area is not considered to have a particularly rich dipterous fauna. Some large orimportant families, such as the Agromyzidae, Bombyliidae, Culicidae, Chironomi-dae, Dolichopodidae, Hybotidae, Empididae, Simuliidae, and Syrphidae wereunder-represented. The erosion of the beach, increasing human interference, exten-
86 presentation and characterization of the sites
FAMILY SPECIES E NR NS
Zouaraa(Nefza)
43 160 2 42 2
Bessila(Kneiss)
25 53 4 7 3
Hachichina 21 41 2 3 6
E = Endemic, NR = New Record, NS = New Species
Tab. 2.3.1 Records of Diptera at the MECO sites in Tunisia

sive cultivation of the fore dunes with introduced plant (Acacia ) species and thedamming up of the Oued Zouara all seem to exert a negative impact on the dunefauna. The consolidated dunes behind the shore have a greater diversity, in part dueto the presence of a more varied flora and the abundance of goat dung with its asso-ciated fauna.
On the islet of Bessila (Kneiss) 53 species were collected. Of these 4 are endemicto Tunisia, 7 species are newly recorded for Tunisia, and 3 species are new to science.The island is clearly of scientific importance and deserves protection from humaninterference. The presence of a sizeable population of nesting seabirds with theirguano and its associated fly fauna adds interest to the site.
The saltmarsh and steppe at El Khaoula, limits of Hachinina, is also of interest,with 2 endemic, 3 previously unrecorded and 6 undescribed species. Unfortunately,clear signs of human interference were evident at the site. In particular, much of thesteppe is being taken over for agricultural purposes, and the marshland up to thecoastline is being used for dumping of household refuse and other waste.
2.3.7 Conclusion
Environmental issues and impacts: Both sites under study are, in manyrespects, of significant scientific interest. From the ecological and geomorphologi-cal viewpoints, Zouara and Kneiss are ideal locations for investigating their respec-tive dynamic systems. The site at Zouara is most suitable for studying dune mor-phology in relation to human intervention; it also lends itself suitably for environ-mental education purposes. Kneiss, on the other hand, is the ideal site for examin-ing and monitoring mudflat dynamics and sediment cycles; it also provides thepossibility of further primary research in both geomorphology and ecology, partic-ularly avifauna.
With regard to threats and impacts, both sites appear to be under a significantamount of risk as a result of human activity. In the case of Zouara, the area has beenimpacted upon following the construction of the dam. In this regard, sediment flux-es have been negatively impaired with serious consequence to the dunes. The beachand adjacent foredunes are also under severe pressure in view of the fact that the areais utilized for recreational/bathing purposes during the summer season. Human pres-ence, in this regard, has contributed to the degradation of various elements, whichconstitute the coastal belt at Zouara-Nefza.
Other notable elements, which contribute towards the further degradation of thedunes at Zouara and the area in general include: – the use of brushwood to ‘stabilize’ the sand. Apart from demonstrating poor man-
agement practice, brushwood, once dry, will increase the risk of fire. Moreover, itinduces changes in the hydrological system of the dune, by reducing evaporationand thereby altering the characteristics of the dune ridge and slopes. It would alsoimpede the active growth of dune vegetation so important to dune stabilization
“baseline research for the integrated sustainable management…” 87
and development.– the use of heavy plant machinery for shifting of sand on dunal zone, which dis-
rupts natural aeolian processes;– the use of alien species for afforestation or species that are planted out of context
to the habitat-type in question;– damage caused by agriculture-related activities such as reclamation of dunal areas
for cultivation and the possible use of pesticides and fertilizers, concentrations ofwhich would have a negative impact on the biota present;
– the presence of permanent (concrete) and temporary (timber) constructions onthe rear sector of the beach, which are quite harmful to foredune development;
– trampling, disturbance and encroachment in general by visitors to the area.
With regard to potential impacts, the site at Zouara would prove exceedingly vul-nerable to increased human presence, particularly if this were to lead to the develop-ment of the area for tourism and recreational activities. Any unplanned amenity andinfrastructural development, including camping, would probably prove detrimentalto the area in general.
In the case of Kneiss islets, impacts include:– disturbance by local fishermen and visitors alike;– dispersal of litter, mainly plastics (bags, bottles, etc.), glass and other waste includ-
ing certain flotsam such as fishing lines, floats with hooks; apart from marring thearea aesthetically, such refuse may also entrap, injure or even cause the death ofvarious species of marine fauna (including sea turtles) and small mammals, rep-tiles and invertebrates on land.
An increase in the islets’ popularity for bird watching, for example, coupled by thelack of management frameworks may lead to mismanagement practices and henceresult in increased levels of disturbance.
88 presentation and characterization of the sites

2.4 case-study: malta sites characterization
Josienne Vassallo, Michelle Borg and Louis F. Cassar
2.4.1 Background
The Maltese Islands support a number of pocket beaches of varying size, thelargest reaching a maximum length of some 1 km or so. There are a total of ninebeaches on the Maltese Islands supporting sand dunes or remnant thereof. Five sandybeaches, four of which occur in mainland Malta and one in the island of Gozo, usedas a control site, are investigated within the framework of the MECO Project (Fig.2.4.1). These are:– Ghadira;– Ir Ramla tat-Torri (also known as WhiteTower Bay);– Armier;– Ramla tal-Mixquqa (also known as Golden Bay); and– Ramla l-Hamra (also known as Ramla Bay) on Gozo.
2.4.2 Site characterization
a. GhadiraCharacterization: Ghadira, in the limits of Mellieha Bay, is situated on the
Fig. 2.4.1 Map of the Maltese Islands showing the location of the MECO study sites: (1) Ramla l-Hamra (Gozo), (2) Armier, (3) Ir Ramla tat-Torri (Torri l-Abjad), (4) Ghadira and (5) Ramla tal-Mixquqa (Malta)
1
2 3
4
5
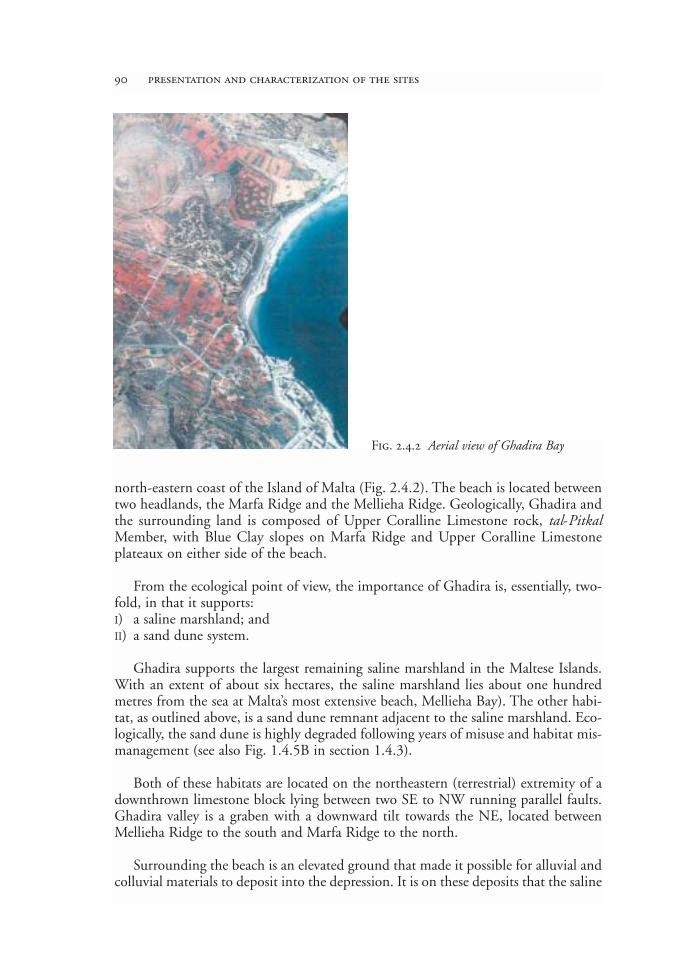
north-eastern coast of the Island of Malta (Fig. 2.4.2). The beach is located betweentwo headlands, the Marfa Ridge and the Mellieha Ridge. Geologically, Ghadira andthe surrounding land is composed of Upper Coralline Limestone rock, tal-PitkalMember, with Blue Clay slopes on Marfa Ridge and Upper Coralline Limestoneplateaux on either side of the beach.
From the ecological point of view, the importance of Ghadira is, essentially, two-fold, in that it supports:I) a saline marshland; andII) a sand dune system.
Ghadira supports the largest remaining saline marshland in the Maltese Islands.With an extent of about six hectares, the saline marshland lies about one hundredmetres from the sea at Malta’s most extensive beach, Mellieha Bay). The other habi-tat, as outlined above, is a sand dune remnant adjacent to the saline marshland. Eco-logically, the sand dune is highly degraded following years of misuse and habitat mis-management (see also Fig. 1.4.5B in section 1.4.3).
Both of these habitats are located on the northeastern (terrestrial) extremity of adownthrown limestone block lying between two SE to NW running parallel faults.Ghadira valley is a graben with a downward tilt towards the NE, located betweenMellieha Ridge to the south and Marfa Ridge to the north.
Surrounding the beach is an elevated ground that made it possible for alluvial andcolluvial materials to deposit into the depression. It is on these deposits that the saline
90 presentation and characterization of the sites
Fig. 2.4.2 Aerial view of Ghadira Bay

marshland developed. Consequently the marshland’s substratum is composed ofbeach sand towards the NE and alluvial deposit towards the SW.
Vegetation cover: The vegetation of the area is dominated by alien Acacia spp.,planted some decades ago, and a freshwater community dominated by Arundo don-ax. Dune species are also present, including Elymus farctus, Sporobolus arenarius, Pan-cratium maritimum, Euphorbia terracina, and Orobanche densiflora var. melitensis.Other species include opportunistic species like Chrysanthemum coronarium andOxalis pes-caprae and coastal species like Tamarix sp., Atriplex halimus and Juncus acu-tus. Besides these, planted species are also present in fairly large number; these includePinus halepensis, Acacia spp. and Eucalyptus gomphocephala.
b. Ramla tat-TorriCharacterization: Ir-Ramla tat-Torri (also known as White Tower Bay) on the
northern most tip on the Marfa Peninsula, is located between two headlands. Geo-logically, the site is composed of Upper Coralline Limestone rock (Mtarfa Member).Although human disturbance is highly evident, the beach supports a dune habitat.
Aeolian development is almost continuous along the bay’s littoral wherever fore-dune development is active. The dunes have an acute angle of slope ranging between12° and 18°. Although the interaction between the beach and the foredune area isevident in terms of sediment flux association, older dune ridges have disappeared fol-lowing degradation and encroachment mainly by the various land-uses located bothon the beach itself and further inland. In this respect, the sediment flux between thebeach zone and the foredune area appears to fluctuate from negative to negative budg-et and negative to positive budget. The latter scenario, however, seems short-term. Onthe other hand, the inland input appears to have been negatively affected byencroaching caravans and permanent structures i.e., boathouses and a road.
The valley system occurring on the posterior sector of the dune, and which in effectsupplies the beach/dune area with sediment, is extremely shallow and surrounded byagriculture. A principal threat posed at this point is that agricultural land surroundingthe wied is constantly undergoing reclamation, thus further reducing sediment flowfrom the valley towards the beach itself. Water catchment is quite extensive, howeverthe new retaining rubble walls enclosing agricultural land along the valley course, willimpede sediment transport mechanisms, which convey material seaward.
These boathouses, many of which are illegal and function more like summer res-idences, dominate the beach and the surrounding landscape. Being permanent, thesestructures are disturbing the dynamics of this coastal dune. Earlier during the year(2001), a number of boathouses in the Maltese Islands, some of which were locatedat ir-Ramla tat-Torri l-Abjad, were demolished.
Vegetation cover: The site is mainly dominated by Eryngium maritimum, Elytri-gia juncea together with Tamarix africana. Dune species also include Euphorbia ter-racina, Salsola kali, Sporobolus arenarius, Cakile maritima, Pancratium maritimum,Erodium laciniatum, Otanthus maritimus, Lotus cytisoides, Echinophora spinosa. The
“baseline research for the integrated sustainable management…” 91

pioneer species on the foredune is Elytrigia juncea. Other species include Arundo do-nax, Oxalis pes-caprae, Reichardia picroides and Soncus oleraceus.
A negative aspect with regards to vegetation is the fact that inland weed species,always in competition with dunal vegetation, are constantly spreading. On the otherhand, the young tamarisk trees, which had been irresponsibly chopped down duringan official beach clean-up, appear to be regenerating slowly and have presentlyformed a low thicket.
c. ArmierCharacterization: Another site located on the north of Marfa Peninsula which also
supports a dune habitat, albeit exceedingly small in area, is Armier. The beach, composedof Upper Coralline Limestone (Mtarfa Member), is located between two headlands, oneof which is the headland separating Armier from ir-Ramla tat-Torri. Wied Armier pro-vides the main source of freshwater and, consequently, sediment fluxes in the bay.
Vegetation cover: The dominant species on site are Elytrigia juncea and theweedy species Oxalis pes-caprae; the latter being an invasive alien. In addition to E.juncea, the Armier dune supports a dunal flora including: Sporobolus arenarius, Ca-kile maritima, Euphorbia terracina, Lotus cytisoides, Scolymus hispanicus and anexceedingly rare population of Calystegia soldanella. The latter species, thought tobe extinct from the Maltese Islands, was rediscovered in 1995 on the ‘foredune’zone. A fairly significant, but nonetheless vulnerable, population was confirmed tobe present on site in recent years. In view of the bay’s popularity, the species is seri-ously threatened. Another species in the area includes Arundo donax, which growsalong the valley’s watercourse.
d. Ramla tal-MixquqaCharacterization: Ir-Ramla tal-Mixquqa, also known as Golden Bay, is located on
the western side of Malta in the limits of Ghajn Tuffieha (Fig. 2.4.3). The site is sit-uated between two Upper Coralline Limestone (tal-Pitkal Member) headlandplateaus, Ghajn Tuffieha and in-Nahhalija. The coastal zone in the environs of Mix-quqa is dominated by a number of headlands and embayments supporting a numberof small pocket beaches, one of which is Mixquqa.
A highly degraded foredune with complete absence of vegetation cover dominatesthe beach. Although the beach itself is quite flat, the dune area exhibits a sharp angleof slope of some 32°. The absence of vegetation cover on the foredune area is to suchan extent that it nearly resembles a back-beach assemblage rather than an actual fore-dune. The only vegetation present on this mass of sand appears to be a regeneratingstand of Arundo donax.
For descriptive purposes, it was thought pertinent to sectionalize the area intothree entities: I) the watercourse;II) the dune proper; and III) the back-beach deposit.
92 presentation and characterization of the sites
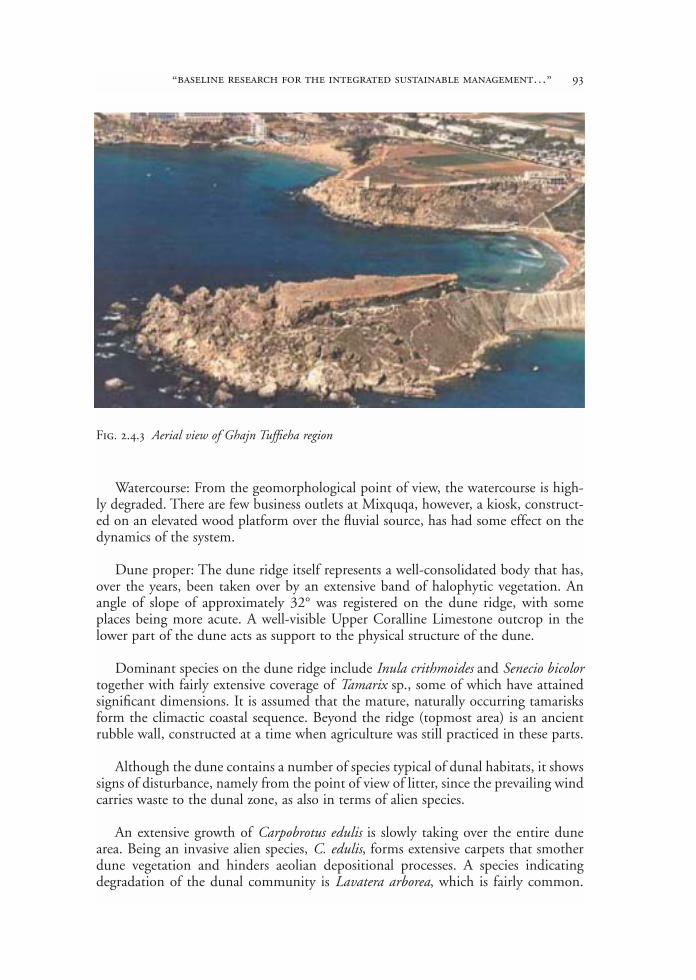
Watercourse: From the geomorphological point of view, the watercourse is high-ly degraded. There are few business outlets at Mixquqa, however, a kiosk, construct-ed on an elevated wood platform over the fluvial source, has had some effect on thedynamics of the system.
Dune proper: The dune ridge itself represents a well-consolidated body that has,over the years, been taken over by an extensive band of halophytic vegetation. Anangle of slope of approximately 32° was registered on the dune ridge, with someplaces being more acute. A well-visible Upper Coralline Limestone outcrop in thelower part of the dune acts as support to the physical structure of the dune.
Dominant species on the dune ridge include Inula crithmoides and Senecio bicolortogether with fairly extensive coverage of Tamarix sp., some of which have attainedsignificant dimensions. It is assumed that the mature, naturally occurring tamarisksform the climactic coastal sequence. Beyond the ridge (topmost area) is an ancientrubble wall, constructed at a time when agriculture was still practiced in these parts.
Although the dune contains a number of species typical of dunal habitats, it showssigns of disturbance, namely from the point of view of litter, since the prevailing windcarries waste to the dunal zone, as also in terms of alien species.
An extensive growth of Carpobrotus edulis is slowly taking over the entire dunearea. Being an invasive alien species, C. edulis, forms extensive carpets that smotherdune vegetation and hinders aeolian depositional processes. A species indicatingdegradation of the dunal community is Lavatera arborea, which is fairly common.
“baseline research for the integrated sustainable management…” 93
Fig. 2.4.3 Aerial view of Ghajn Tuffieha region
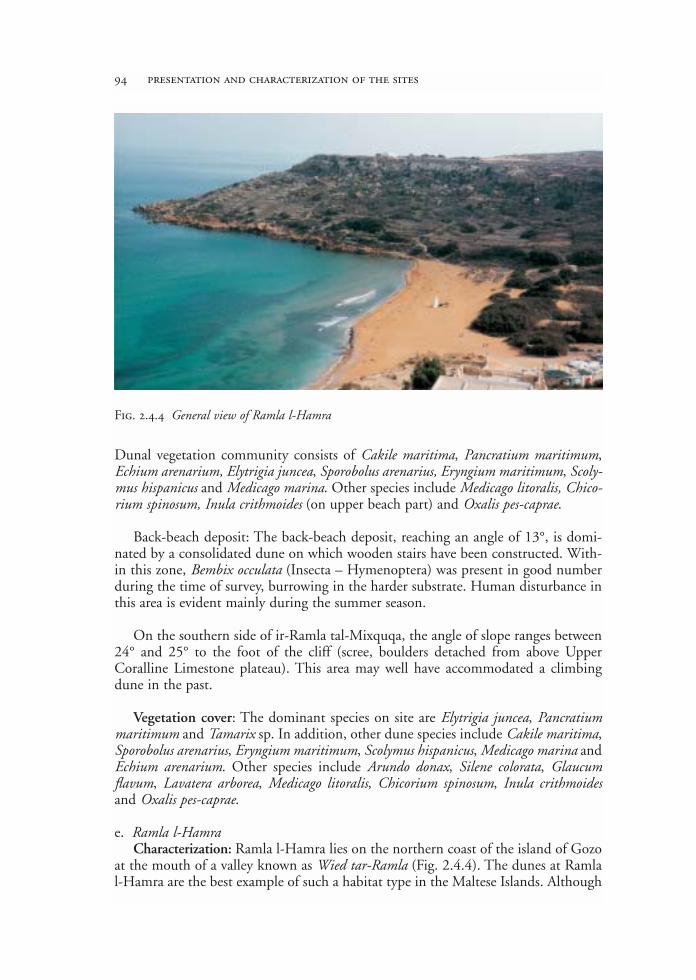
Dunal vegetation community consists of Cakile maritima, Pancratium maritimum,Echium arenarium, Elytrigia juncea, Sporobolus arenarius, Eryngium maritimum, Scoly-mus hispanicus and Medicago marina. Other species include Medicago litoralis, Chico-rium spinosum, Inula crithmoides (on upper beach part) and Oxalis pes-caprae.
Back-beach deposit: The back-beach deposit, reaching an angle of 13°, is domi-nated by a consolidated dune on which wooden stairs have been constructed. With-in this zone, Bembix occulata (Insecta – Hymenoptera) was present in good numberduring the time of survey, burrowing in the harder substrate. Human disturbance inthis area is evident mainly during the summer season.
On the southern side of ir-Ramla tal-Mixquqa, the angle of slope ranges between24° and 25° to the foot of the cliff (scree, boulders detached from above UpperCoralline Limestone plateau). This area may well have accommodated a climbingdune in the past.
Vegetation cover: The dominant species on site are Elytrigia juncea, Pancratiummaritimum and Tamarix sp. In addition, other dune species include Cakile maritima,Sporobolus arenarius, Eryngium maritimum, Scolymus hispanicus, Medicago marina andEchium arenarium. Other species include Arundo donax, Silene colorata, Glaucumflavum, Lavatera arborea, Medicago litoralis, Chicorium spinosum, Inula crithmoidesand Oxalis pes-caprae.
e. Ramla l-HamraCharacterization: Ramla l-Hamra lies on the northern coast of the island of Gozo
at the mouth of a valley known as Wied tar-Ramla (Fig. 2.4.4). The dunes at Ramlal-Hamra are the best example of such a habitat type in the Maltese Islands. Although
94 presentation and characterization of the sites
Fig. 2.4.4 General view of Ramla l-Hamra
like the rest of the dunal areas, these have been subjected to various anthropogenicimpacts, the Ramla dune system is quasi-intact and still supports most of the typicaldune flora and fauna. It is on the basis of species richness, ecosystem stability anactive morphological dynamics that the coastal dunes at Ramla l-Hamra are the mostimportant dune system on the islands.
The beach is located between two Upper Coralline Limestone headlands onwhich are the settlements of Xaghra and Nadur. Geologically, Ramla beach lies onUpper Globigerina Limestone rock, however sediment supply to the beach origi-nates from the erosion of the Upper Coralline Limestone plateaux escarpments andboulder screes, and Greensand, through climatic factors, wave action and terrestri-al run-off. Ramla is considered as very dynamic in terms of sediment budget andsupply. Terrestrial run-off, the main source of sediment supply, comes from a num-ber of valley systems, namely Wied tar-Ramla, Wied il-Harraq and Wied il-Pergla.In fact, during the wet season run-off from the Wied tar-Ramla watercourse reach-es the sea forming a shallow gully, carrying sediment into the bay for a number ofweeks.
Vegetation cover: Ramla l-Hamra still supports typical dune vegetation. Thedune system’s main sand binders are Elytrigia juncea and Sporobolus arenarius. Ram-la also supports vulnerable, rare or endangered dune flora that include: Echinopho-ra spinosa, Pancratium maritimum, Eryngium maritimum, Euphorbia paralias,Euphorbia terracina, Euphorbia peplis, Medicago marina, Cakile maritima, Cutandiamaritima, Pseudorlaya pumila, Ononis variegata, and a very rare sand-dwellingmushroom Montagnites arenaria.
Apart from the sand dune habitat, a number of other biotic communities occurwithin the Ramla region. These include:– Freshwater wetland community ~ supporting beds of Arundo donax, Phragmites
australis and Typha domingensis;– Crithmo-Limonietum association ~ dominated by halophytes, Inula crithmoides
and Limonium melitensis;– Ononis natrix garigue ~ dominated by Ononis natrix, Asparagus aphyllus, Dittrichia
viscosa, Pancratium maritimum and Cyperus capitatus; and– Disturbed ground, mainly found in areas mostly liable to anthropogenic distur-
bance such as trampling and vehicle access.
2.4.3 Management Options for Ghadira, Ramla tal-Mixquqa, Armier, Ir-Ramlatat-Torri and Ramla l-Hamra
IntroductionThe predominant use of these beaches within the Maltese Islands is related to
bathing. There are no management schemes currently in place that regulate the typeand level of activities that can occur within sandy beaches. Separate measuresattempting to regulate one form of activity or another have been adopted such asbeach cleaning operations and kiosk development.
“baseline research for the integrated sustainable management…” 95
The objective of this section is to identify those management options for landbased activities within the sandy beaches under study that allow for the continual useas recreational areas whilst aiming to safeguard the beaches themselves as natural sys-tems. It is not the scope of this manual to look into water-related activities or the sub-merged areas of these beaches.
Existing Uses and ActivitiesThe land uses and activities occurring within these beaches that will be considered
in this section include: – Sunbathing;– Barbeques;– Beach cleaning;– Kiosks and Restaurants;– Placement of beach paraphernalia, e.g. : paddleboats/sun beds;– Construction of concrete walls along water’s edge;– Road construction.
The main problems that affect these sandy beaches emanate from the fact thatthey are used extensively in the summer time for bathing purposes. The promotionof the Maltese Islands as a sun and sea tourist destination has led to the developmentof inappropriate structures within these areas. The aim of improving access to theseareas has led to road construction at the back of beaches (e.g. Ghadira and Armier),thus affecting sediment transport. Concrete boundary walls around the beaches aswell as the placement of concrete along the beach for the provision of additionalbeach space (e.g. Ghadira) may also affecting beach dynamics.
The provision of refreshments for beach users was translated into the constructionof large-scale restaurants on or adjacent to the sandy beaches taking up space for bathersas well as hindering beach processes. In addition to these structures, mobile kiosks arealso placed on the beaches to provide both refreshments as well as beach equipmentsuch as deckchairs, umbrellas and paddleboats for hiring. In recognising the importanceof the dune systems in Ramla Bay, Gozo, measures were taken in the mid-1990s toremove the kiosks from the beach and relocate them in an adjacent area.
Another activity associated with recreation is that of beach cleaning. The accu-mulation of Posidonia oceanica remains on sandy beaches is considered to be aesthet-ically unpleasing to beach users. Consequently beach cleaning operations are initiat-ed in mid-April/May before the tourist season. The removal of these Posidoniaremains prevents the banquette system from developing thus eliminating the prote-ctive function it gives the beach against erosion. With the exception of Ramla Bay inGozo, the removal of Posidonia remains is conducted by mechanical means. In addi-tion trucks and other vehicles are driven onto the beach itself during the cleaning oflitterbins.
Proposed SolutionsThe management options for these areas can be dealt with on two levels. The
short-term solution is to adopt a beach management system that controls issues relat-
96 presentation and characterization of the sites

ing to beach cleaning and beach activities. The long-term solution is to address exist-ing structures.
Beach Management: The adoption of a zoning scheme is ideal to direct the spa-tial allocation of activities on the beach with the aim of prohibiting access to the sanddune areas. The zoning scheme should also identify sunbathing and barbeque areas.Adequate numbers of appropriately designed litterbins should be provided. The zon-ing scheme should provide for the potential provision of other facilities such as show-ers/toilets in accordance with the EU Blue Flag system. As much as possible suchfacilities should be located at the edge of the beach, preferably not on the sand itself.
Beach cleaning: A set of guidelines need to be drawn up to direct how beachcleaning operations of both Posidonia remains as well as litterbins, are to be under-taken. With respect to Posidonia remains, manual removal of material with rakesshould replace the mechanical use in practice today. The removal of these leavesshould start later, around late May/June to allow the protective function of the ban-quette system to continue.
With respect to litterbins, the collection point for disposing material to dumptrucks should be located outside the beach itself.
Vehicular Access: No vehicles should be allowed onto the beach. Access points toemergency vehicles should however be indicated.
Existing StructuresKiosks/RestaurantsThe number and location of temporary kiosks should be revised to identify the
acceptable quantity to service beach users. Any of the existing structures located onthe beach itself, particularly those threatening the development of dune systemsshould be removed. Their resizing to smaller structures and relocation outside thebeach area should be the main objective.
Roads/boundary wallsThose structures that are detrimental to the dune system should ideally be
removed. These include concrete steps at Mixquqa, low boundary wall and road atArmier as well as the road cutting across the beach system at Ghadira. The majorobstacle that is not likely to be removed is the arterial road at Ghadira as this is theaccess point to the ferry terminal at Cirkewwa.
To conclude, all of the management solutions identified require an assessmentthat identifies the financial package needed for their implementation. Most of thesolutions concerning beach activities are achievable within the short-term, howeverthe costs for relocating existing structures will be the major hurdle for implementinga management system that secures the long-term protection of these beaches.
“baseline research for the integrated sustainable management…” 97
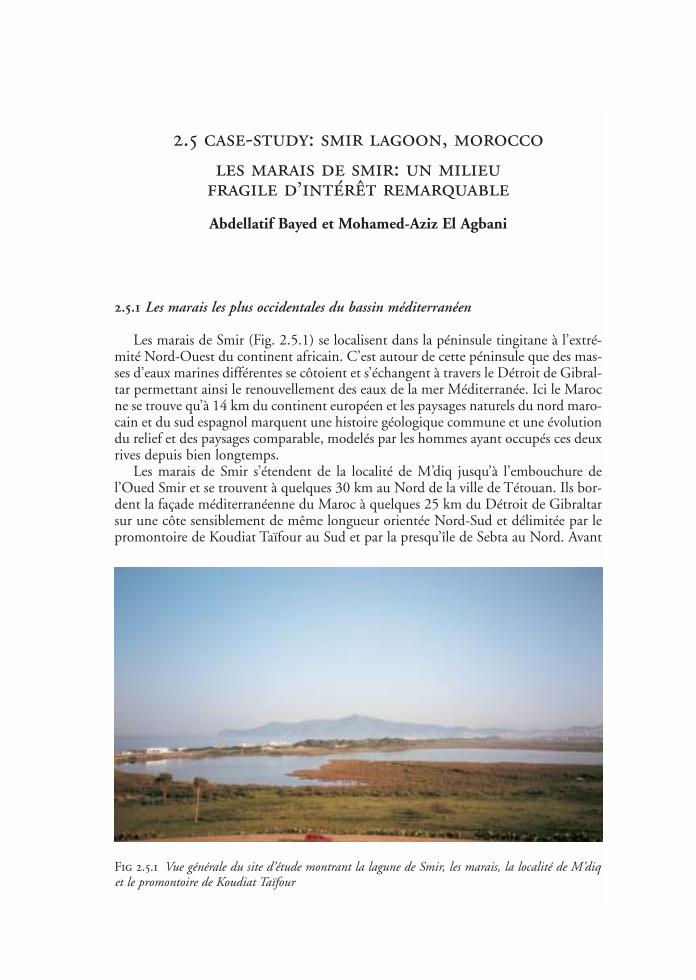
2.5 case-study: smir lagoon, moroccoles marais de smir: un milieu
fragile d’intérêt remarquable
Abdellatif Bayed et Mohamed-Aziz El Agbani
2.5.1 Les marais les plus occidentales du bassin méditerranéen
Les marais de Smir (Fig. 2.5.1) se localisent dans la péninsule tingitane à l’extré-mité Nord-Ouest du continent africain. C’est autour de cette péninsule que des mas-ses d’eaux marines différentes se côtoient et s’échangent à travers le Détroit de Gibral-tar permettant ainsi le renouvellement des eaux de la mer Méditerranée. Ici le Marocne se trouve qu’à 14 km du continent européen et les paysages naturels du nord maro-cain et du sud espagnol marquent une histoire géologique commune et une évolutiondu relief et des paysages comparable, modelés par les hommes ayant occupés ces deuxrives depuis bien longtemps.
Les marais de Smir s’étendent de la localité de M’diq jusqu’à l’embouchure del’Oued Smir et se trouvent à quelques 30 km au Nord de la ville de Tétouan. Ils bor-dent la façade méditerranéenne du Maroc à quelques 25 km du Détroit de Gibraltarsur une côte sensiblement de même longueur orientée Nord-Sud et délimitée par lepromontoire de Koudiat Taïfour au Sud et par la presqu’île de Sebta au Nord. Avant
Fig 2.5.1 Vue générale du site d’étude montrant la lagune de Smir, les marais, la localité de M’diqet le promontoire de Koudiat Taïfour

la mise en place d’aménagement, ces marais représentaient la zone d’inondation del’Oued Smir avant son débouché en mer.
Sur toute la façade méditerranéenne marocaine, on ne rencontre un tel type dezone humide et une telle diversité d’habitats qu’au niveau de deux localités: 1. l’em-bouchure et marais de l’Oued Smir à l’extrémité occidentale; 2. l’embouchure etmarais de l’Oued Moulouya à l’extrémité orientale.
2.5.2 Un bassin versant côtier
D’une superficie de 100 km2, le bassin versant de l’Oued Smir domine majes-tueusement le paysage qui se présente en une succession de reliefs parallèles à la côteavec des altitudes décroissantes d’Ouest en Est. Le massif calcaire appelé aussi dorsa-le calcaire culmine à plus de 800 mètres et se trouve dépourvu de végétation. Il estsuivi d’une dépression longitudinale d’altitude bien plus faible (200 mètres) qui cons-titue le piémont immédiat de cette dorsale. Le relief regagne ensuite de l’altitude auniveau des basses montagnes dont les sommets arrondis atteignent 300 mètres. Cerelief perd progressivement de son altitude en direction de la mer pour former un sec-teur relativement bas occupé par les marais et la lagune de Smir. Cet ensemble estbordé côté mer par une dune formant un cordon littoral séparé de la mer par une pla-ge sableuse. La confluence de plusieurs cours d’eau dans le piémont immédiat de ladorsale calcaire forme l’Oued Smir qui, a quelques kilomètres de son embouchure,développe son lit entre deux massifs collinaires du Jbel Zemzem au Nord et le massifde Rachchaka – Koudiat Taïfour au Sud.
Les caractéristiques du climat méditerranéen qui règne dans la région permettentde le classer dans l’étage bioclimatique humide. Les précipitations à Tétouan et M’diqsont généralement supérieures à 600 mm/an et représentent près du double de lamoyenne nationale. Depuis la saison 1998-1999 et jusqu’à la saison 2000-2001, lesprécipitations ont montré une diminution significative, comme pour l’ensemble duterritoire marocain, et étaient légèrement supérieures à 400 mm/an contre des annéeshumides avec une pluviométrie pouvant atteindre 800 mm/an. Les pluies sont trèsabondantes durant la période novembre-janvier alors que la période sèche, sans pré-cipitations ou avec précipitations réduites, s’étend de juin à septembre. La moyennedes températures à Fnideq varie entre 11°C en janvier et 28°C en août.
2.5.3 Lieu de rencontre entre eaux continentales et eaux marines
L’alimentation en eaux douces des marais et de la lagune de Smir ont subit de pro-fonds changements depuis la construction d’un barrage sur l’Oued Smir entré enfonction en 1991. Avant la mise en place de ce barrage, l’Oued Smir représentait laprincipale source en eau douce de ce complexe dont le débit dépassait 40 l/s enmoyenne par an (année normale) avec un maximum qui pouvait atteindre 75 l/s.Notons que ce débit pouvait atteindre 640 m3/s pendant les périodes de crues. Le bar-rage est construit sur la limite qui sépare la dépression longitudinale d’altitude des
“baseline research for the integrated sustainable management…” 99

basses montagnes, son mur a une hauteur de 45 mètres et développe une surface deretenue de 475 hectares permettant de garder 43 millions de mètres cubes. Les eauxde ruissellement et la nappe phréatique sont les autres sources en eau douce qui ali-mentent les marais et la lagune. Bien que certains puits soient creusés à proximité dela lagune où pénètrent les eaux marines aucun contact ne semble être établi entre nap-pe phréatique et eau marine. Il est probable que la nature envasée et compact du fondde ce plan d’eau limite les échanges entre ces eaux.
Les marais sont parcourus de chenaux permettant aux eaux de ruissellement d’at-teindre la lagune située dans la partie nord de ce complexe (Fig. 2.5.2). Actuellementl’alimentation en eaux d’origine continentale provient principalement des rejets d’eauxusées de la ville de M’diq située à 5 km de la lagune. Le surplus des eaux usées, ne pou-vant pas être traitées par une unité locale est rejeté à l’extrémité sud des marais avantd’aboutir dans la lagune à travers un réseau de chenaux qui sillonnent un couvert végé-tal assez dense permettant l’épuration naturelle de ces eaux qui enrichissent le milieuen matière organique et en polluants. Les chenaux convergent et forment un chenalprincipal permettant de faire déboucher les eaux d’origine domestique dans la lagune.Ceci a favorisé le développement d’une importante roselière qui joue un double rôle;elle permet l’épuration des eaux usées d’une part et constitue un refuge pour la repro-duction de plusieurs populations remarquables d’oiseaux d’eau, d’autre part. Il est ànoter que le complexe touristique attenant à l’embouchure déverse aussi ses eaux uséesdans la lagune et aucun traitement préalable n’a été mis en évidence. Ceci a pour effetl’enrichissement en matière organique du secteur nord de la lagune.
100 presentation and characterization of the sites
Fig 2.5.2 L’étendu de la plage et la lagune de Smir
Les bouleversements du régime hydrologique des marais, en général et de la lagu-ne en particulier, se trouvent encore accentués par la modification qui a touché ladébouchée de l’Oued Smir en mer. En effet, depuis la construction d’un port de plai-sance et du complexe touristique y attenant, la communication avec la mer à traversle port est devenue permanente. Ce contact régulier par le biais du flux et reflux dela mer s’est traduit par une modification progressive des conditions physico-chi-miques des eaux et par là un changement significatif des composantes de la biodiver-sité dans la lagune et les marais. Le déficit en apport d’eau douce a eu pour consé-quence une extension d’habitats supportant une forte salinité, notamment la salicor-naie au dépend de ceux qui ne se développent normalement qu’en eau saumâtre àdouce (jonchaie, phragmitaie et typhaie).
Avec une profondeur maximale de 2,5 mètres, la lagune dont la superficie actuel-le est de 0,5 km2 présente des dimensions assez réduites, par rapport à des situationsantérieures où elle occupait la quasi totalité de la surface actuelle des marais. La lagu-ne débouche dans un port et les échanges avec la mer sont permanents et dépendentuniquement de l’amplitude de la marée. Dans ce secteur de la Méditerranée, la maréeest de type semi-diurne dont l’amplitude est significative, de l’ordre de 1 mètre envi-ron. La salinité de l’eau marine y est de 37‰ et la température peut atteindre 24°Cen été contre 17°C en hiver. La digue construite dans le but de limiter la pénétrationde l’eau de mer dans la lagune ayant cassée, l’eau marine pénètre dans la lagune et enhomogénéise les valeurs des composantes physico-chimiques (température, salinité,oxygène dissous, pH, etc.). En été et pendant le flot, l’eau marine inonde la lagune etprogresse dans les marais à travers le chenal principal qui va ainsi permettre l’exten-sion des masses d’eaux salées qui vont conquérir progressivement les zones intérieu-res des marais. Pendant le jusant, un zonage des paramètres physico-chimiques appa-raît; ainsi les eaux sortantes du chenal principal et celles occupant les endroits les plusreculés de la lagune ont une température élevée pouvant atteindre 29°C. La salinitésuit le même scénario puisque les eaux entrantes ne dépassent pas 37‰ alors que leseaux sortantes atteignent 40 ‰.
2.5.4 Lieu de fortes diversités biologiques, d’habitats et de productivités
Mesurer le niveau de la biodiversité (diversité biologique) d’un milieu est un outild’estimation de son équilibre et de son évolution. Les marais et la lagune de Smirrecèlent un grand nombre d’espèces végétales et animales qui présentent un intérêtpour la biodiversité marocaine, nord-africaine ou méditerranéenne. Ce qui permet àce complexe écologique de revêtir une importance majeure. Certaines de ses origina-lités lui ont valu qu’il soit classé, dans le cadre de l’Etude Nationale sur les Aires Pro-tégés, comme Site d’Intérêt Biologique et Ecologique (SIBE) parmi les 29 sites litto-raux retenus (Eaux et Forêts, 1995).
Dans le cadre du projet MECO, l’originalité de ce site a été renforcée par la décou-verte d’une flore très riche à l’image de la diversité des conditions écologiques quirègnent sur l’ensemble de ce plan d’eau. Pas moins de 14 espèces d’algues et 3 espècesde phanérogames tapissent le fond de la lagune de nature sableuse et sablo-vaseuse.
“baseline research for the integrated sustainable management…” 101

Les prélèvements étaient réalisées par plongée libre et les algues et phanérogamesont été récoltés à la main en veillant à récupérer l’ensemble de la plante. L’ensemblea été conservé puis ramené au laboratoire pour identification. Dans chaque station letaux de recouvrement par la végétation a été estimé et évalué.
Les herbiers de phanérogames (plantes à fleurs se reproduisant par germinationdes graines comme les formes homologues terrestres) sont des habitats remarquableset privilégiés. En mer, ces herbiers sont particulièrement connus des pêcheurs en rai-son des captures potentielles de poissons, coquillages et crustacés qu’ils peuvent yréaliser. Parmi les phanérogames rencontrés figure Zostera marina qui, en Méditerra-née, a vu la réduction des surfaces qu’elle occupe et la dégradation de ses biotopes pré-férentiels en rapport avec le développement des aménagements côtiers. Son extensionen Méditerranée est limitée et est relativement rare en Afrique du nord. Cette espèceest actuellement protégée par de nombreuses conventions et accords internationaux.Sa présence dans la lagune de Smir confère à celle-ci une importance majeure.
Les assemblages écologiques des algues et des phanérogames sont en rapport avecles conditions écologiques différentes et il est possible de distinguer entre groupesd’espèces qui préfèrent s’installer dans les zones bénéficiant d’arrivées d’eaux douceset les phanérogames qui occupent une position médiane en tolérant des dessalures,mais qui abondent particulièrement dans les zones franchement marines en associa-tion avec des algues.
Le macrozoobenthos qui regroupe les animaux vivant sur le fond ou enfouis dansle sédiment et dont la taille est supérieure à 1 mm est un outil complémentaire per-mettant de mesurer l’état de santé du milieu. En effet, ce compartiment de la com-posante biotique de l’écosystème intègre relativement bien les fluctuations des condi-tions du milieu et peut révéler sa tendance à court terme et à moyen terme. Il con-stitue aussi un maillon fondamental dans la chaîne trophique puisqu’il est une sour-ce de nourriture essentielle pour de nombreux consommateurs de rangs supérieurs,en particulier les Poissons et les Oiseaux. Tout changement qui touche le milieu, vainfluencer de façon plus ou moins proportionnelle sur le fonctionnement du com-partiment benthique (phytobenthos et zoobenthos), ce qui induit des modificationsaux niveaux supérieurs. En somme, la macrofaune benthique constitue un outil dechoix et un bon indicateur de l’état de l’environnement des écosystèmes côtiers.
La récolte de ce compartiment a été approchée par un plan d’échantillonnagepermettant de prélever l’ensemble des taxons présents et se trouvant dans tous lestypes d’habitats de la lagune et de la plage adjacente. Le moyen de prélèvement estun carottier de 12,5 cm de côté et le volume total échantillonné par station est de 625cm2 (1/16 m2). Après tamisage sur une toile de 1 mm2 de vide de maille, les échan-tillons sont ramenés au laboratoire où sont réalisés tri, identification, comptage etobservations biologiques. Pour caractériser le substrat, des prélèvements de sédimentsont réalisés parallèlement à cet échantillonnage.
Dans la lagune de Smir, la macrofaune récoltée se répartit en 32 taxons. Trois grou-pes zoologiques constituent l’essentiel de ce macrobenthos animal et représentent plus
102 presentation and characterization of the sites
de 84%: mollusques (5 espèces), polychètes (10 espèces) et crustacés (12 espèces). Enraison de leur position médiane dans le réseau trophique, ils donnent une idée assez pré-cise sur les conditions du milieu (température, salinité, éclairement, nature du fond,oxygène dissous, etc.) et sur le type de nourriture consommée qu’il s’agit de macrophy-tes ou de microorganismes et sur l’état de l’équilibre du milieu. Ici, la macrofaune estdominée successivement par les crustacés, suivis des polychètes, puis des mollusques. Ladensité de ces animaux peut atteindre 16000 individus par mètre carré.
Les plantes supérieures des marais de Smir sont nombreuses et diversifiées. Pasmoins de 88 taxons sont reconnues et sont pour l’essentiel des formes dites hygro-phytes qui représentent environ 50% de l’ensemble des hygrophytes des zones humi-des méditerranéennes marocaines. Cette grande diversité est comparable aux plusimportantes zones humides marocaines de la façade atlantique: 80 espèces à Merja deSidi Boughaba et 120 espèces à Merja Zerga. Les principaux facteurs intervenant dansla répartition de la végétation de cette zone sont la submersion, la charge organiqueet la salinité.
La végétation des marais composée de formations basses denses ou clairsemées etd’autres de moyennes et grandes tailles (roselières) développe de nombreux habitatset permet ainsi à une large gamme d’espèces d’oiseaux de s’y reposer, s’y nourrir et s’yreproduire. Cette diversité biologique, de types d’habitats ainsi que l’importante pro-ductivité a conféré à cette zone un cachet de zone humide d’importance internatio-nale sur le plan ornithologique, plus particulièrement en ce qui concerne les espècesd’oiseaux d’eau.
En effet, les marais de Smir constituent la première zone humide sur le sol afri-cain que les oiseaux européens et eurasiatiques empruntant la voie de migration occi-dentale rencontrent juste après la traversée de la Méditerranée lors de la migrationpostnuptiale. De la même manière, ces marais constituent un point de passage privi-légié et une zone d’escale de choix pour ces mêmes oiseaux lors de leur chemin deretour vers leurs quartiers de reproduction et ceci au cours de la période de migrationprénuptiale. Une partie de ces populations peut même y passer toute la mauvaise sai-son durant la période hivernale. Il faut noter également l’importance des habitats dece complexe (dunes, végétation dunaire, roselière, sansouire,…) pour la reproductiond’un certain nombre d’espèces d’oiseaux. A titre d’exemple, cette zone représente l’u-nique localité marocaine où se reproduit régulièrement une colonie de Spatule blan-che (Platalea leucorodia ), espèce menacée et protégée à l’échelle mondiale (Fig. 2.5.3).
2.5.5 Aménagements et impacts des activités humaines
Plusieurs activités humaines menacent ce complexe depuis déjà quelques décen-nies: pâturage, coupe de végétation, occupation agricole, urbanisation, rejets d’eauxusées, perturbation du rythme des marées… Ces activités ont largement contribué àla dégradation de ce milieu.
La région de Restinga-Smir a connu de très nombreux aménagements côtiers qui ne
“baseline research for the integrated sustainable management…” 103
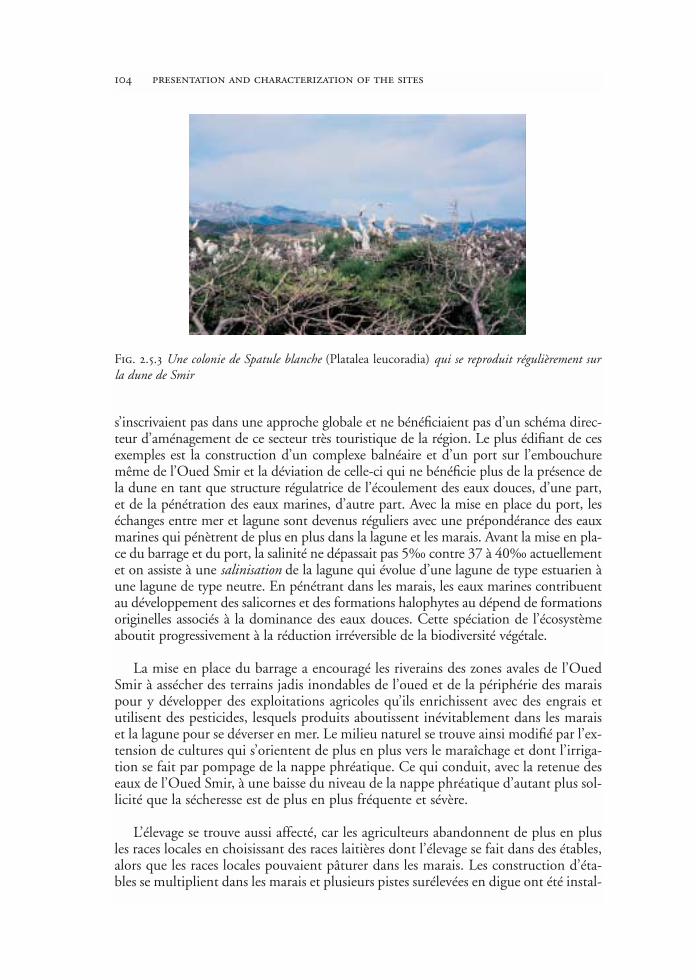
s’inscrivaient pas dans une approche globale et ne bénéficiaient pas d’un schéma direc-teur d’aménagement de ce secteur très touristique de la région. Le plus édifiant de cesexemples est la construction d’un complexe balnéaire et d’un port sur l’embouchuremême de l’Oued Smir et la déviation de celle-ci qui ne bénéficie plus de la présence dela dune en tant que structure régulatrice de l’écoulement des eaux douces, d’une part,et de la pénétration des eaux marines, d’autre part. Avec la mise en place du port, leséchanges entre mer et lagune sont devenus réguliers avec une prépondérance des eauxmarines qui pénètrent de plus en plus dans la lagune et les marais. Avant la mise en pla-ce du barrage et du port, la salinité ne dépassait pas 5‰ contre 37 à 40‰ actuellementet on assiste à une salinisation de la lagune qui évolue d’une lagune de type estuarien àune lagune de type neutre. En pénétrant dans les marais, les eaux marines contribuentau développement des salicornes et des formations halophytes au dépend de formationsoriginelles associés à la dominance des eaux douces. Cette spéciation de l’écosystèmeaboutit progressivement à la réduction irréversible de la biodiversité végétale.
La mise en place du barrage a encouragé les riverains des zones avales de l’OuedSmir à assécher des terrains jadis inondables de l’oued et de la périphérie des maraispour y développer des exploitations agricoles qu’ils enrichissent avec des engrais etutilisent des pesticides, lesquels produits aboutissent inévitablement dans les maraiset la lagune pour se déverser en mer. Le milieu naturel se trouve ainsi modifié par l’ex-tension de cultures qui s’orientent de plus en plus vers le maraîchage et dont l’irriga-tion se fait par pompage de la nappe phréatique. Ce qui conduit, avec la retenue deseaux de l’Oued Smir, à une baisse du niveau de la nappe phréatique d’autant plus sol-licité que la sécheresse est de plus en plus fréquente et sévère.
L’élevage se trouve aussi affecté, car les agriculteurs abandonnent de plus en plusles races locales en choisissant des races laitières dont l’élevage se fait dans des étables,alors que les races locales pouvaient pâturer dans les marais. Les construction d’éta-bles se multiplient dans les marais et plusieurs pistes surélevées en digue ont été instal-
104 presentation and characterization of the sites
Fig. 2.5.3 Une colonie de Spatule blanche (Platalea leucoradia) qui se reproduit régulièrement surla dune de Smir

lées dans le but d’accéder aux batteries d’élevage et aux maisons secondaires. Cesdigues empêchent une circulation adéquate de l’eau dans les marais.
La capacité de traitement de la station d’épuration de M’diq se trouve actuelle-ment dépassée par l’essor démographique et l’exode rural qui ont transformés cettelocalité en une véritable ville. Durant la saison estivale, la population de M’diq setrouve multipliée par un facteur 10 et les rejets liquides dans les marais sont trèsabondantes et dépassent même la capacité de charge du milieu. Les marais subissentainsi un envasement progressif suite à l’accumulation de la matière organique condui-sant à l’eutrophisation du milieu et à l’installation de conditions anoxiques. Un sys-tème nuisible à la santé des habitants (pullulation d’insectes nuisibles et des mous-tiques en particulier; odeurs désagréables, disparition du couvert végétal, etc.) risquede s’installer ce qui conduit à une mobilisation soutenue des autorités locales et toutparticulièrement ceux responsables de la santé public.
L’absence ou la non mise en œuvre d’un plan directeur d’aménagement de M’diq, setraduit sur le terrain par la multiplication anarchique de lotissements qui non seulementempiètent sur la zone humide, mais ne dispose pas de cadre adéquat pour l’installationde familles (absence de tout à l’égout, risque éminent d’inondations, salubrité douteu-se des zones avoisinantes par l’extension du volume des rejets domestiques).
2.5.6 Plan d’aménagement et de gestion, revitalisation et équilibre des systèmes
Le barrage de Smir est vital pour la région et permet d’alimenter en eau potableles villes de Tétouan, M’diq, Fnideq et la zone côtière de Restinga-Smir. Le dévelop-pement durable implique des mesures correctives à mettre en place de façon réguliè-re. Le plan d’aménagement et de gestion de cette zone entrepris dans le cadre du pro-jet MECO est une réponse qui se veut prospective se basant sur un diagnostic exhau-stif permettant la définition des actions à entreprendre après une large concertationavec les acteurs et de s’assurer de leur implication dans le processus identifiés.
Les actions proposées dans le cadre du plan d’aménagement et de gestion du com-plexe de Smir aboutiront sans doute à un rétablissement de l’équilibre de l’écosystème.La réussite de ce plan est tributaire d’un certain nombre de conditions, notamment:
1. Une bonne information et sensibilisation de l’ensemble des partenaires ayant desintérêts au niveau de ce complexe avant d’entreprendre toute action; 2. L’établissementd’un climat de confiance entre décideurs, partenaires socio-économiques et populationlocale; 3. Participation de la population locale aux prises de décision et aux program-mes de gestion concernant le complexe avec proposition de mesures compensatoiresadéquates.
2.5.7 Les oiseaux indicateurs de la qualité du milieu
Les oiseaux se trouvant à un niveau supérieur de la chaîne trophique constituentun bon indicateur de la qualité du milieu. En effet, leur installation ou disparition est
“baseline research for the integrated sustainable management…” 105

un outil de diagnostic souvent utilisé dans l’évaluation des zones humides. Dans lecas des marais de Smir et des environs immédiats, la diversité des grands types d’ha-bitats (lac de barrage, marais d’eau douce, roselière, marais d’eau saumâtre, sansoui-re, dune boisée, plage sableuse,…) explique la grande diversité ornithologique de cet-te zone. En plus, ce peuplement d’oiseaux comprend un certain nombre de popula-tions ayant une importance nationale et internationale.
1. Lac de Barrage: la création de cette pièce d’eau a constitué une importante zonede refuge pour plusieurs populations d’oiseaux d’eau, particulièrement du groupedes Ansériformes (Oies et Canards) durant la période d’hivernage. En effet, pen-dant les cinq dernières années (1996-2001) le peuplement hivernant d’Ansérifor-mes est de plus en plus diversifié et ses effectifs sont de plus en plus nombreux.Les valeurs enregistrées montrent une croissance régulière allant de 5000 indivi-dus à 14000 oiseaux recensés en janvier 2000. De ce fait, ce lac de barrage estconsidéré parmi les cinq meilleures zones humides marocaines en ce qui concernel’hivernage des Anatidés. Il est considéré comme site d’importance internationalepour l’hivernage du Canard Souchet (Anas clypeata ) puisqu’il y accueille plus de1% de la population régionale du Paléarctique occidental et répond ainsi au cri-tère de sélection de la convention de Ramsar.
2. Marais d’eau douce et Roselière: Zone parmi les rares localités du Maroc pour lareproduction d’un certain nombre d’espèces rares et ou menacées d’oiseaux d’eau tel-les que l’Héron pourpré, l’Héron Bihoreau, l’Héron crabier, le Busard des roseaux.
3. Dune boisée: Première colonie pour la reproduction de la Spatule blanche (Pla-talea leucorodia) au Maroc au niveau de la dune de la plage de Smir (Fig. 2.5.3).C’est une colonie mixte d’une quinzaine de couples de Spatule blanche, 500 cou-ples d’Héron garde-bœuf (Bubulcus ibis ), 50 couples d’Héron bihoreau (Nyctico-rax nycticorax ) et 20 couples d’Aigrette garzette (Egretta garzetta ). Ceci constituela première citation de la reproduction de l’espèce en colonie à l’échelle du pays.Cette importante donnée représente l’extension au Maroc de la limite méridiona-le de la répartition de l’espèce à l’échelle du Paléarctique. Il faut noter que la Spa-tule blanche est une espèce menacée et en large déclin en Europe [<10.000 cou-ples: France (5-7 couples), Italie (2-10 couples), Portugal (1-5 couples), Espagne(675 couples)].
4. Plage sableuse: Important biotope pour la reproduction du Gravelot à collierinterrompu (plusieurs dizaines de couples) et de l’Oedicnème criard.
5. Sansouire: Cet habitat à Salicornia et Sarcocornia constitue un lieu de choix pourplusieurs populations d’oiseaux d’eau notamment le Gravelot à collier interrom-pu, l’Echasse blanche, le Canard colvert .
106 presentation and characterization of the sites
chapter 3
techniques for the ecological characterizationof sites and eco-audits:
Estimating the state of coastal ecosystemshow to measure diversity


introduction
Felicita Scapini
Diversity occurs at various levels of biological complexity, ranging from genes,individuals, local populations, species, communities of species, to landscape. It is avalue per se, representing both the heritage from past evolution and the assurance forsustainability in the future. An ecosystem is characterised by the interactions of itselements, both physical and biological, and the more elements contribute to its con-struction the more complicated and stable it is. There are limits to the resistance ofan ecosystem to the loss of its elements, and to the possibility of recovery after degra-dation. Each species within an ecosystem has particular needs and interrelationshipsthat constitute its ecological niche, and can only survive if these are maintained.
Notwithstanding the conceptual and interpretative issues considered above(1.3.2), estimates of diversity remain important tools for the assessment of the healthand sustainability of beach ecosystems. Eco-audits involving such assessments may beused to monitor the effects of environmental changes on the ecosystem. Indicatorspecies, easy to recognise and sensitive to changes within an ecosystem may be usedto estimate ecosystem health, but eco-audits based on the presence or absence of suchsensitive elements (search of indicator species) are not useful in assessing the resist-ance of the ecosystem to change itself.
For the purpose of eco-audit we propose: a) a procedure, which has been used to measure diversity at chosen Mediterranean
coastal sites within the MECO project, based on the study of arthropod commu-nities (3.1);
b) bioassays based on measures of diversity at the individual (genetic, physiological andbehavioural) level for early warning and evaluation of adaptability to change (3.2.5);
c) a method based on population dynamics studies to identify inter-site variation (3.2.6).
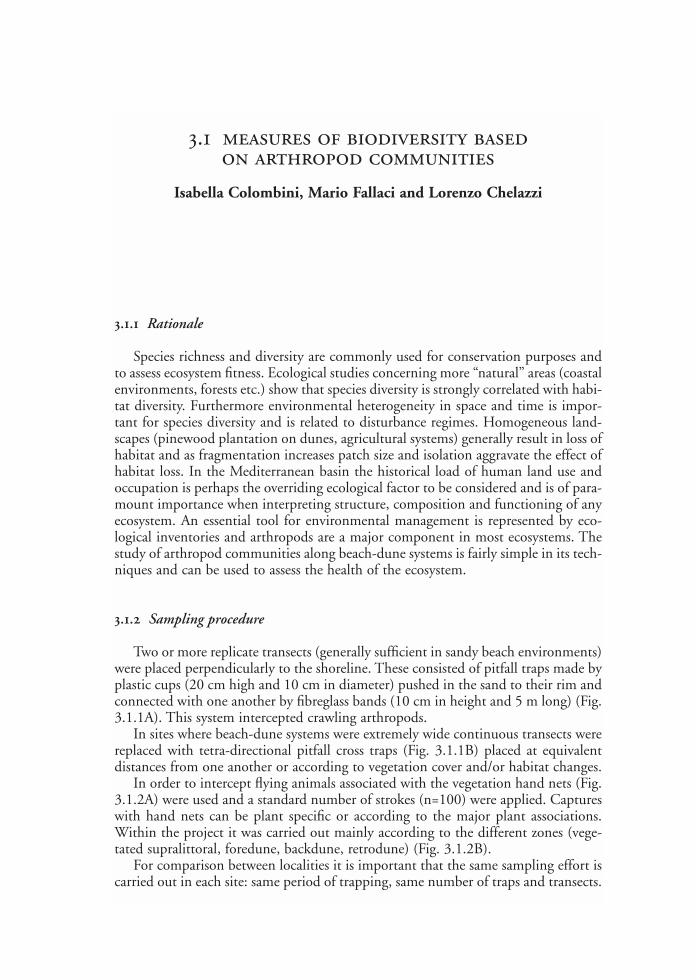
3.1 measures of biodiversity basedon arthropod communities
Isabella Colombini, Mario Fallaci and Lorenzo Chelazzi
3.1.1 Rationale
Species richness and diversity are commonly used for conservation purposes andto assess ecosystem fitness. Ecological studies concerning more “natural” areas (coastalenvironments, forests etc.) show that species diversity is strongly correlated with habi-tat diversity. Furthermore environmental heterogeneity in space and time is impor-tant for species diversity and is related to disturbance regimes. Homogeneous land-scapes (pinewood plantation on dunes, agricultural systems) generally result in loss ofhabitat and as fragmentation increases patch size and isolation aggravate the effect ofhabitat loss. In the Mediterranean basin the historical load of human land use andoccupation is perhaps the overriding ecological factor to be considered and is of para-mount importance when interpreting structure, composition and functioning of anyecosystem. An essential tool for environmental management is represented by eco-logical inventories and arthropods are a major component in most ecosystems. Thestudy of arthropod communities along beach-dune systems is fairly simple in its tech-niques and can be used to assess the health of the ecosystem.
3.1.2 Sampling procedure
Two or more replicate transects (generally sufficient in sandy beach environments)were placed perpendicularly to the shoreline. These consisted of pitfall traps made byplastic cups (20 cm high and 10 cm in diameter) pushed in the sand to their rim andconnected with one another by fibreglass bands (10 cm in height and 5 m long) (Fig.3.1.1A). This system intercepted crawling arthropods.
In sites where beach-dune systems were extremely wide continuous transects werereplaced with tetra-directional pitfall cross traps (Fig. 3.1.1B) placed at equivalentdistances from one another or according to vegetation cover and/or habitat changes.
In order to intercept flying animals associated with the vegetation hand nets (Fig.3.1.2A) were used and a standard number of strokes (n=100) were applied. Captureswith hand nets can be plant specific or according to the major plant associations.Within the project it was carried out mainly according to the different zones (vege-tated supralittoral, foredune, backdune, retrodune) (Fig. 3.1.2B).
For comparison between localities it is important that the same sampling effort iscarried out in each site: same period of trapping, same number of traps and transects.
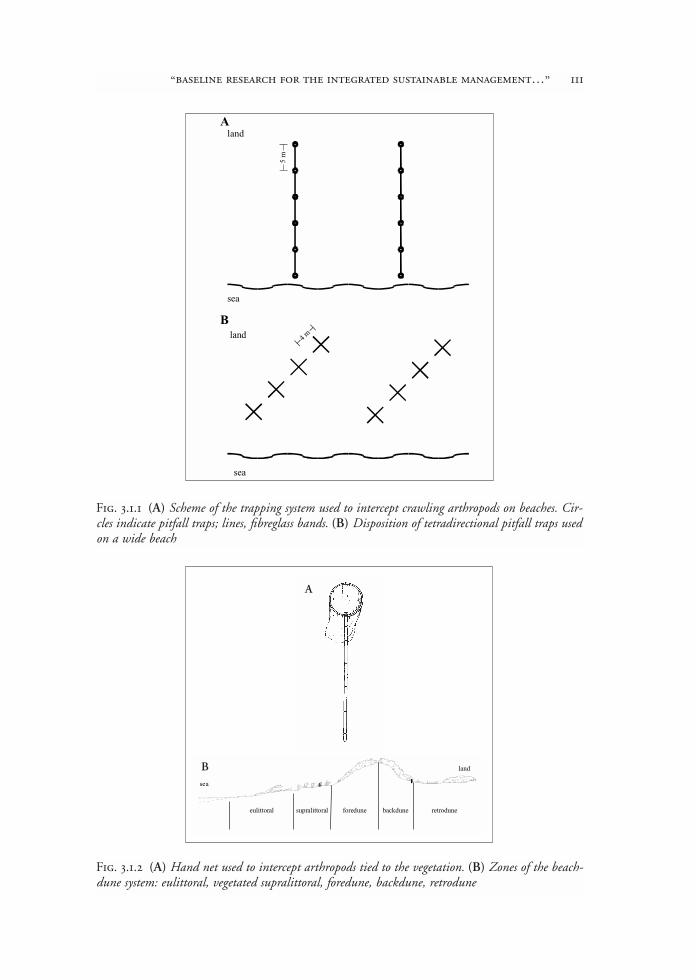
“baseline research for the integrated sustainable management…” 111
land
sea
5 m
land
sea
4 m
B
A
Fig. 3.1.1 (A) Scheme of the trapping system used to intercept crawling arthropods on beaches. Cir-cles indicate pitfall traps; lines, fibreglass bands. (B) Disposition of tetradirectional pitfall traps usedon a wide beach
A
sea
land
eulittoral supralittoral foredune backdune retrodune
B
Fig. 3.1.2 (A) Hand net used to intercept arthropods tied to the vegetation. (B) Zones of the beach-dune system: eulittoral, vegetated supralittoral, foredune, backdune, retrodune

Transects were kept active 72 consecutive hours, during which recognisable taxawere counted. These animals were released at the end of the sampling period. All oth-er samples were fixed in 75% alcohol and stored in the laboratory.
In the laboratory material was sorted under binocular microscopes and specieswere identified to order level.
The isopods and coleopterans alone (Harde, 1984) were chosen to be sorted fur-ther into morphologically recognisable taxonomic units (RTUs). Since determinationat species level is extremely time consuming because often samples must be sent tospecialists, this method permits to have an ideas of the number of species present ina sample, even if the name of the species is not given. This method consists in sub-dividing each order at family level and then in grouping the different species of eachfamily with conventional names (sp.1, sp.2, sp.3,… etc.).
3.1.3 Data analysis
Ecological coefficients such as relative abundance may be used to provide an objec-tive estimate of how the community is structured (Bigot and Bodot, 1973; Ponel,1983). These involve estimating the abundance of individual species, as a function of
112 techniques for ecological characterization of sites and eco-audits
To find α, find the intersection ofthe number of individuals (N)along the x axis, and the number ofspecies (S) up the y axis and readoff the value of α from nearest ofthe heravy divergent lines. Forexample:
with 1000 moths in130 species, α = 40
The curved broken lines indicatethe accuracy of the estimate of α,such that the 95% limits are ±2 xthe given percentage of α. Forexample:
with 1000 moths in43 species, α is 9 ±7.5%
i.e. the 95% limits for α are9 ± (2 x 7.5% of 9) =
9 ± 1.35, i.e. 7.65 and 10.35
Fig. 3.1.3 Williams’ nomograph. The relation between total number of units, or individuals(N), the number of groups, or species (S), and the index of diversity (α) in the logarithmic series:S = α ln (1 - N/α)

“baseline research for the integrated sustainable management…” 113
the total number of individuals gathered in a particular zone or season. Species werethen grouped as Abundant (A ≥ 5 %), Influent (2 ≤ A < 5 %) and Recedent (A< 2%).
Different indices provide different estimates of diversity, and have been usedwhere appropriate. In a relatively large assemblage of individuals the frequency dis-tribution of the number of species may be fitted to a logarithmic series (Fisher et al.,1943). In the logarithmic series distribution the relation between the number of indi-viduals and the number of species is given by:
S = α ln(1+ N/α)
where S is the number of species, N the number of individuals and α the diversi-ty index. The diversity index α must be chosen to satisfy this above equation or it canbe obtained from Williams’ (1947) nomograph (Fig. 3.1.3). Confidence limits of αare calculated using the standard error given in Williams’ nomograph.
The concept of evenness was introduced by Margalef (1958). The evenness ofa community is high or low according as its several species are more or less even-ly represented. To analyse the evenness Pielou’s (1978) evenness index (J’ ) wasused:
J’=H’/H’max
where H’ is the Shannon – Weaver (also called Shannon -Wiener) index (1949):
H’= -∑piln(pi)
expressed in nats, when the base of the logarithm is 2 the unit is a bit, when it is10, a decit and
H’max=ln(S)
where pi is the proportion of the community that belongs to the ith species and Sthe number of species. The Shannon – Weaver index is used when it is assumed thatthe community is indefinitely large:
H’= -∑piln(pi )
However for finite collections a more appropriate formula is that known as theBrillouin (1962) index (H ) and is used instead of Shannon – Weaver index:
H=ln[N!/(N1!N2!…Ns!)]/N
where N is the number of individuals, N1, N2,…Ns are the individuals of the first,of the second…. and of the sth species, and
N!=N(N-1)(N-2)….2·1
In this case Pielou’s (1978) evenness index ( J ) is:
J=H/Hmax
114 techniques for ecological characterization of sites and eco-audits
where Hmax is calculated dividing individuals among the species as evenly as pos-sible, but when N is not a multiple of S the species cannot all have the same numberof individuals. In this case, supposed N=S[N/S]+r where [N/S] is the integer part ofthe quotient N/S and r the remainder. Then Hmax is the diversity of a collection inwhich S-r species contain [N/S] individuals and the remaining r species contain[N/S]+1 individuals.
Another diversity index is the Simpson’s (1949) dominance index (L). Thisexpresses the abundance of the commonest species as a fraction of the total numberof individuals. This index decreases with increase in species number:
L= ∑ni(ni-1)/N(N-1)
where ni is the number of individuals that belong to the ith species and N is thenumber of individuals of all species.
For a quantitative and qualitative analysis of the different zones, seasons and local-ities Renkonen’s (1938) percentage similarity (PS ) was computed. This compares thetwo samples in terms of individuals of the various species. It places the emphasis onthe dominant species.
PS=2∑min(p1i, p2i)
where p1i, and p2i are the proportions of the ith species in the two compared sam-ples and the summation is based on the minimum (min ) of these two proportions.
The latter index allows computation of the changes in the community’s composi-tion along a sea-land gradient known as β-diversity (Whittaker 1972):
β = (lnPS0-lnPS’n)/nln2
where PS0 is the percentage similarity expected between two zones at zero distancefrom each other and PS’n is the percentage similarity of the total distance (n) betweenthe first and last considered zone. The latter is calculated from the regression lineobtained from each PS of the different zones.
3.1.4 A case study-Results and interpretation
In the MECO project diversity indexes were calculated for five different localitiesand were used to identify specie richness and habitat quality. The study was carriedout both in the different zones on the beach dune system and on a seasonal basis. Asan example the methods and results of the locality of Zouara (N 37° 0’ 41”, E 8° 53’26”, Tunisia, presented in sections 2.1 and 2.3) are here reported.
Standard samples using pitfall traps were taken along two transects from seatowards land. These traps captured arthropods spontaneously active at the sand sur-

face. Traps were placed every five meters up to 40 m and from this point every twometres until the shoreline using a continuous fiberglas strips proceeding from thebase of the dune towards sea (Fig. 3.1.1A). By contrast tetra-directional cross trapswere placed at 20 m, 50 m, 90 m, 140 m from the base of the dune towards land(Fig. 3.1.1B). The transect was then divided in zones starting from the sealine limits:zone 1 (62-30 m calculated from the dune’s base), zone 2 (25-0 m), zone 3 (20 mand 50 m from the base of the dune towards land), zone 4 (90 m and 140 m). Trapswere active for 72 consecutive hours and were controlled periodically.
Abundance. The results of the abundance analysis calculated for the coleopter-ans and isopods during the two seasons are reported in Tables 3.1.1 and 3.1.2. Forbriefness only the total abundance is shown but calculations were made for each ofthe four zones. At Zouara a total number of 6148 of Coleoptera belonging to 63species was collected. Of these 44 species were present in April and 34 in October.During April (Table 3.1.1) the most abundant coleopteran species was St5 (Phyto-sus nigriventris) with 64.338%. This species was followed by an anthicid of theAnthicus genus (An1, 10.163%), an histerid (Hi1 6.464%) and a tenebrionid (Pha-leria acuminata) (Te29, 5.343%). In October the latter species becomes the mostabundant (36.981%) followed by tenebrionids of the Xanthomus genus (Te15,14.465%), a scarabeid (Geotrupes stercorarius) (Sc5, 11.572%), a carabid (Euryne-bria complanata) (Ca28, 10.943%) and another tenebrionid (Pseudoseriaciusolivieri ) (Te40, 7.170%). In October St5 and An1 greatly decrease and becomeinfluent (3.774 and 2.642% respectively). Instead Hi1 was not collected in Octo-ber. For the isopods a total number of 12440 individuals were sampled at Zouara(Table 3.1.2). These belonged to three species: Armadillidium album, Porcelliolamellatus and Tylos europaeus. In April all three species were collected whereas inOctober only two. In both seasons only T. europaeus was abundant with 99.905 %and 99.976 % in spring and autumn respectively.
Species diversity. Analysing the coleopteran community of the beach-dune sys-tem of Zouara with Fisher’s diversity index, the α coefficient found for October washigher than that of April (7.22 and 6.56 respectively) (Table 3.1.3A). Consideringthe single zones individually the highest diversity values were obtained in zone 4 inApril and in zone 1 in October (although in this season a similar value was also foundin zone 4). Altogether the dune presented a higher diversity than that of the beach(10.38 and 5.90). In particular the highest values of α of the dune were obtained inApril (8.50) whereas the lowest were found for the beach during the same period(3.31). On the whole Zouara presented an α diversity of 9.77. Similar analysis of theisopod community showed a higher α coefficient in April (0.32) with respect toOctober (0.19) (Table 3.1.3B). Considering the zones individually it was zone 3 thatpresented the highest values in both seasons (0.53 in April; 0.56 in October). Thebeach presented a very low value (0.08) compared to the dune (0.92) and this washigher in April (1.59). On the whole the isopod community presented a quite low αvalue (0.28) for the entire beach-dune system.
Evenness of the community. The index of evenness, estimated for thecoleopterans over the entire beach-dune system by means of the Pielou-Brillouin
“baseline research for the integrated sustainable management…” 115
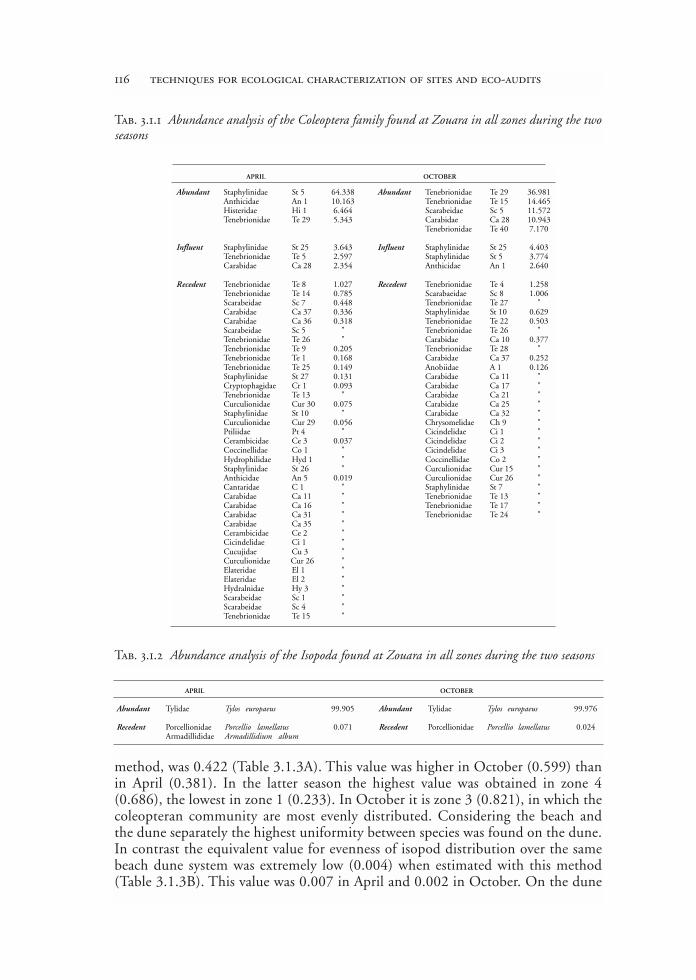
method, was 0.422 (Table 3.1.3A). This value was higher in October (0.599) thanin April (0.381). In the latter season the highest value was obtained in zone 4(0.686), the lowest in zone 1 (0.233). In October it is zone 3 (0.821), in which thecoleopteran community are most evenly distributed. Considering the beach andthe dune separately the highest uniformity between species was found on the dune.In contrast the equivalent value for evenness of isopod distribution over the samebeach dune system was extremely low (0.004) when estimated with this method(Table 3.1.3B). This value was 0.007 in April and 0.002 in October. On the dune
116 techniques for ecological characterization of sites and eco-audits
APRIL OCTOBER
Abundant Staphylinidae St 5 64.338 Abundant Tenebrionidae Te 29 36.981Anthicidae An 1 10.163 Tenebrionidae Te 15 14.465Histeridae Hi 1 6.464 Scarabeidae Sc 5 11.572Tenebrionidae Te 29 5.343 Carabidae Ca 28 10.943
Tenebrionidae Te 40 7.170
Influent Staphylinidae St 25 3.643 Influent Staphylinidae St 25 4.403Tenebrionidae Te 5 2.597 Staphylinidae St 5 3.774Carabidae Ca 28 2.354 Anthicidae An 1 2.640
Recedent Tenebrionidae Te 8 1.027 Recedent Tenebrionidae Te 4 1.258Tenebrionidae Te 14 0.785 Scarabaeidae Sc 8 1.006Scarabeidae Sc 7 0.448 Tenebrionidae Te 27 "Carabidae Ca 37 0.336 Staphylinidae St 10 0.629Carabidae Ca 36 0.318 Tenebrionidae Te 22 0.503Scarabeidae Sc 5 " Tenebrionidae Te 26 "Tenebrionidae Te 26 " Carabidae Ca 10 0.377Tenebrionidae Te 9 0.205 Tenebrionidae Te 28 "Tenebrionidae Te 1 0.168 Carabidae Ca 37 0.252Tenebrionidae Te 25 0.149 Anobiidae A 1 0.126Staphylinidae St 27 0.131 Carabidae Ca 11 "Cryptophagidae Cr 1 0.093 Carabidae Ca 17 "Tenebrionidae Te 13 " Carabidae Ca 21 "Curculionidae Cur 30 0.075 Carabidae Ca 25 "Staphylinidae St 10 " Carabidae Ca 32 "Curculionidae Cur 29 0.056 Chrysomelidae Ch 9 "Ptiliidae Pt 4 " Cicindelidae Ci 1 "Cerambicidae Ce 3 0.037 Cicindelidae Ci 2 "Coccinellidae Co 1 " Cicindelidae Ci 3 "Hydrophilidae Hyd 1 " Coccinellidae Co 2 "Staphylinidae St 26 " Curculionidae Cur 15 "Anthicidae An 5 0.019 Curculionidae Cur 26 "Cantaridae C 1 " Staphylinidae St 7 "Carabidae Ca 11 " Tenebrionidae Te 13 "Carabidae Ca 16 " Tenebrionidae Te 17 "Carabidae Ca 31 " Tenebrionidae Te 24 "Carabidae Ca 35 "Cerambicidae Ce 2 "Cicindelidae Ci 1 "Cucujidae Cu 3 "Curculionidae Cur 26 "Elateridae El 1 "Elateridae El 2 "Hydralnidae Hy 3 "Scarabeidae Sc 1 "Scarabeidae Sc 4 "Tenebrionidae Te 15 "
Tab. 3.1.1 Abundance analysis of the Coleoptera family found at Zouara in all zones during the twoseasons
APRIL OCTOBER
Abundant Tylidae Tylos europaeus 99.905 Abundant Tylidae Tylos europaeus 99.976
Recedent Porcellionidae Porcellio lamellatus 0.071 Recedent Porcellionidae Porcellio lamellatus 0.024Armadillididae Armadillidium album
Tab. 3.1.2 Abundance analysis of the Isopoda found at Zouara in all zones during the two seasons
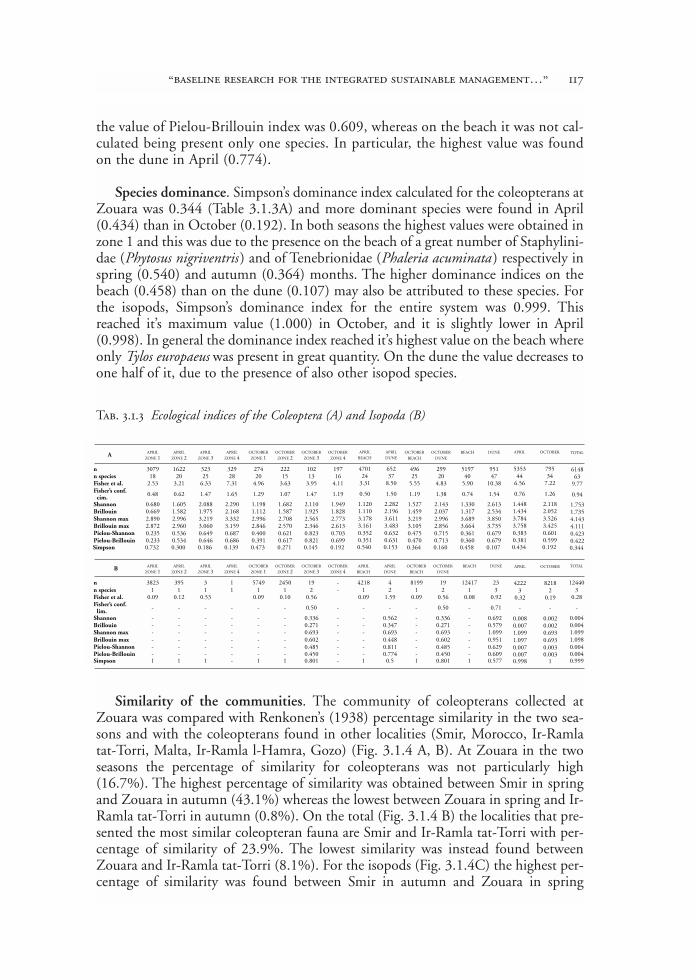
the value of Pielou-Brillouin index was 0.609, whereas on the beach it was not cal-culated being present only one species. In particular, the highest value was foundon the dune in April (0.774).
Species dominance. Simpson’s dominance index calculated for the coleopterans atZouara was 0.344 (Table 3.1.3A) and more dominant species were found in April(0.434) than in October (0.192). In both seasons the highest values were obtained inzone 1 and this was due to the presence on the beach of a great number of Staphylini-dae (Phytosus nigriventris ) and of Tenebrionidae (Phaleria acuminata ) respectively inspring (0.540) and autumn (0.364) months. The higher dominance indices on thebeach (0.458) than on the dune (0.107) may also be attributed to these species. Forthe isopods, Simpson’s dominance index for the entire system was 0.999. Thisreached it’s maximum value (1.000) in October, and it is slightly lower in April(0.998). In general the dominance index reached it’s highest value on the beach whereonly Tylos europaeus was present in great quantity. On the dune the value decreases toone half of it, due to the presence of also other isopod species.
Similarity of the communities. The community of coleopterans collected atZouara was compared with Renkonen’s (1938) percentage similarity in the two sea-sons and with the coleopterans found in other localities (Smir, Morocco, Ir-Ramlatat-Torri, Malta, Ir-Ramla l-Hamra, Gozo) (Fig. 3.1.4 A, B). At Zouara in the twoseasons the percentage of similarity for coleopterans was not particularly high(16.7%). The highest percentage of similarity was obtained between Smir in springand Zouara in autumn (43.1%) whereas the lowest between Zouara in spring and Ir-Ramla tat-Torri in autumn (0.8%). On the total (Fig. 3.1.4 B) the localities that pre-sented the most similar coleopteran fauna are Smir and Ir-Ramla tat-Torri with per-centage of similarity of 23.9%. The lowest similarity was instead found betweenZouara and Ir-Ramla tat-Torri (8.1%). For the isopods (Fig. 3.1.4C) the highest per-centage of similarity was found between Smir in autumn and Zouara in spring
“baseline research for the integrated sustainable management…” 117
A APRIL
ZONE 1APRIL
ZONE 2APRIL
ZONE 3APRIL
ZONE 4OCTOBER
ZONE 1OCTOBER
ZONE 2OCTOBER
ZONE 3OCTOBER
ZONE 4OCTOBER
BEACH
OCTOBER
DUNE
BEACH DUNE TOTAL
n 3079 1622 323 329 274 222 102 197 496 299 5197 951 6148n species 18 20 25 28 20 15 13 16 25 20 40 47 63Fisher et al. 2.53 3.21 6.33 7.31 4.96 3.63 3.95 4.11 5.55 4.83 5.90 10.38 9.77Fisher’s conf.cim. 0.48 0.62 1.47 1.65 1.29 1.07 1.47 1.19 1.19 1.38 0.74 1.54 0.94
Shannon 0.680 1.605 2.088 2.290 1.198 1.682 2.110 1.949 1.527 2.143 1.330 2.613 1.753Brillouin 0.669 1.582 1.975 2.168 1.112 1.587 1.925 1.828 1.459 2.037 1.317 2.534 1.735Shannon max 2.890 2.996 3.219 3.332 2.996 2.708 2.565 2.773 3.219 2.996 3.689 3.850 4.143Brillouin max 2.872 2.960 3.060 3.159 2.846 2.570 2.346 2.613 3.105 2.856 3.664 3.735 4.111Pielou-Shannon 0.235 0.536 0.649 0.687 0.400 0.621 0.823 0.703 0.475 0.715 0.361 0.679 0.423Pielou-Brillouin 0.233 0.534 0.646 0.686 0.391 0.617 0.821 0.699 0.470 0.713 0.360 0.679 0.422
B APRIL
ZONE 1APRIL
ZONE 2APRIL
ZONE 3APRIL
ZONE 4OCTOBER
ZONE 1OCTOBER
ZONE 2OCTOBER
ZONE 3OCTOBER
ZONE 4APRIL
BEACH
APRIL
DUNE
OCTOBER
BEACH
OCTOBER
DUNE
BEACH DUNE TOTAL
n 3823 395 3 1 5749 2450 19 - 4218 4 8199 19 12417 23 12440n species 1 1 1 1 1 1 2 - 1 2 1 2 1 3 3Fisher et al. 0.09 0.12 0.53 0.09 0.10 0.56 0.09 1.59 0.09 0.56 0.08 0.92 0.28Fisher’s conf.lim.
- - - - - - 0.50 - - - - 0.50 - 0.71 -
Shannon - - - - - - 0.336 - - 0.562 - 0.336 - 0.692 0.004Brillouin - - - - - - 0.271 - - 0.347 - 0.271 - 0.579 0.004Shannon max - - - - - - 0.693 - - 0.693 - 0.693 - 1.099 1.099Brillouin max - - - - - - 0.602 - - 0.448 - 0.602 - 0.951 1.098Pielou-Shannon - - - - - - 0.485 - - 0.811 - 0.485 - 0.629 0.004Pielou-Brillouin - - - - - - 0.450 - - 0.774 - 0.450 - 0.609 0.004Simpson 1 1 1 - 1 1 0.801 - 1 0.5 1 0.801 1 0.577 0.999
APRIL OCTOBER
5353 79544 34
6.56 7.22
0.76 1.26
1.448 2.1181.434 2.0523.784 3.5263.758 3.4250.383 0.6010.381 0.599
APRIL
BEACH
APRIL
DUNE
4701 65224 37
3.31 8.50
0.50 1.50
1.120 2.2821.110 2.1963.178 3.6113.161 3.4830.352 0.6320.351 0.631
APRIL OCTOBER
4222 82183 2
0.32 0.19
- -
0.008 0.0020.007 0.0021.099 0.6931.097 0.6930.007 0.0030.007 0.0030.998 1
Simpson 0.732 0.300 0.186 0.139 0.473 0.271 0.145 0.192 0.364 0.160 0.458 0.107 0.3440.434 0.1920.540 0.153
Tab. 3.1.3 Ecological indices of the Coleoptera (A) and Isopoda (B)

(96.3%). High similarities were also found when the isopod fauna of Ir-Ramla l-Hamra of spring was compared with that of Smir in both seasons and with Zouarain spring. Furthermore the isopod fauna of Ir-Ramlal-Hamra of autumn was similarto that of Zouara in autumn. On the total (Fig. 3.1.4 D) the localities that present-ed the most similar isopod fauna were Zouara and Ir-Ramla l-Hamra with a per-centage of similarity of 91.9%. High similarities were also found between Smir andZouara and between Smir and Ir-Ramla l-Hamra. Ir-Ramla tat-Torri differed themost in its isopod fauna when compared with the other study localities.
The results indicate that Zouara locality (Tunisia) presented a faunal communitywith a diversity similar to other localities (Smir, Morocco; Ir-Ramla tat-Torri, Malta;Ir-Ramla l-Hamra, Gozo) studied along the Mediterranean. The number of speciespresent in the beach-dune system was quite high and there was an increase of speciesfrom the beach towards the dune. The system presented few dominant species thatchanged both in quantity and in quality according to the season. For coleopterans,specie’s uniformity reached higher values in autumn months as the number of dom-inant species tended to decrease in this season. Isopods, mainly represented by onlyone species typical of the beach, were quite consistent showing a good quality of thebeach habitat.
118 techniques for ecological characterization of sites and eco-audits
A
Ss
Sa
Zs
B Za
S Ts
Z Ta
T Hs
H Ha
C
Ss
Sa
Zs
D Za
S Ts
Z Ta
T Hs
G Ha
0.0 0.1 0.2 0.3 0.4 0.5 0.6 0.7 0.8 0.9 1.0
Fig. 3.1.4 Renkonen’s percentage of similarity,between the different localities, for the coleopter-ans in the two seasons (A) and in the total (B)and for the isopods in the two seasons (C) andin the total (D). (Ss= Smir in spring; Sa= Smirin autumn; Zs= Zouara in spring; Za= Zouarain autumn; Ts= Ir-Ramla tat-Torri in spring;Ta= Ir-Ramla tat-Torri in autumn; Hs= Ir-Ramla l-Hamra in spring; Ha= Ir-Ramla l-Hamra in autumn; S= Smir; Z= Zouara; T=Ir-Ramla tat-Torri; H= Ir-Ramla l-Hamra)

3.1.5 References
Bigot L. and Bodot P. (1973). Contribution à l’étude biocoenotique de la garrigue à Quercus coc-cifera. II- Composition biotique du peuplement des invertébrés. Vie Milieu 23: 229-249.
Brillouin L. (1962). Science and Information Theory. 2nd, Academic Press, New York.Fallaci M., Colombini I., Chelazzi L. (1944) An analysis of the Coleoptera living along a
Tyrrhenian beach-dune system: abundances, zonation and ecological indices. Vie Milieu44(3/4): 243-256.
Fisher R.A., Corbet A.S. and Williams C.B. (1943). The relation between the number of speciesand the number of individuals in a random sample of an animal population. J. Anim. Col. 12:42-58.
Harde K.W. (1984) A field guide in colour to Beetles, Octopus Books, london.Lewis T. and Taylor L.R. (1967). Introduction to experimental ecology, Academic Press Inc., London.Pielou E.C. (1978). Population and community ecology: Principles and Methods, Gordan and
Breach Science Publishers, New York.Ponel P. (1983) Contribution à la connaissance de la communauté des Arthropodes psam-
mophiles de l’isthme de Giens. Trav. Sci. Parc nation. Port-Cros, Fr. 9: 149-182.Renkonen O. (1938). Statistisch-ökologische Untersuchungen über die terrestische Käferwelt
der finnischen Bruchmoore. An. Zool. Soc. Zool.-Bot. Fenn. Vanamo 6: 1-231.Shannon C.E. and W. Weaver (1949). The mathematical theory of communication, University of
Illinois Press, Urbana.Simpson E.H. (1949). Measurement of diversity. Nature 163: 688.Whittaker R.H. (1972). Evolution and measurement of species diversity. In: Origin and meas-
urement of diversity, Summer Institute in Systematics V, Smithsonian Institution, Washington.
“baseline research for the integrated sustainable management…” 119
3.2 bioassays for estimationof beach stability and ecosystem quality
Felicita Scapini and Elfed Morgan
The quality of beach ecosystems generally depends on the shoreline stability, andhealthy ecosystems in turn contribute to shoreline stability, as they allow for natural equi-librium. Human intervention, management, and other changes may upset the balanceof this equilibrium. Bioassays of key species allow rapid estimation of such changes andare proposed for regular monitoring of beaches with a view to sustainable management.
The basic requirements for a suitable bioassay are: 1) availability of the biologicalmaterial; 2) availability of the necessary equipment; 3) ease of execution by one/twopersons after short training; 4) clear interpretation that follows from previous testingand comparison with existing baseline data; 5) reliability with which the biologicalparameter can be repeatedly measured.
The bioassays proposed here have been developed and tested in real cases withinthe MECO project. Details are presented concerning points 1, 2 and 3, as well asexamples of how the bioassays were applied, and the relevant bibliography is given,to meet requirements 4 and 5.
Key species are elements of the ecosystem playing a relevant role for its equi-librium, and are thus important indicators of sustainability for management pur-poses. Any change of a key species would affect the ecosystem and converselychanging ecosystems would cause changes in the key species. In principle, anyspecies of a healthy ecosystem could be considered a key species, as it interacts withother elements of the ecosystem. However, not all species are of equal importance.This is particularly true for ecosystems like beaches where biological links are gen-erally less important than physical constraints. The choice of the key species is animportant step in the development of a bioassay. First of all, its role within theecosystem should be clearly recognised. Burrowing animals favour sediment turnover, and colonising plants contribute to dune fixation, for example. Some of thecommon arthropod species dwelling in sand beaches are good candidates for bioas-says (Fig. 3.2.1).
To meet requirement 1) above, a key species should be easy to find, recogniseand sample. We have chosen an animal, Talitrus saltator (Fig. 3.2.2), and a plant,Cakile maritima (Fig. 3.2.3), colonising the beach and fore dune respectively.These are the zone of a beach most used for leisure, and are also very importantfor sediment equilibrium (turn over, transport and fixation) and consequentlyshoreline stability.
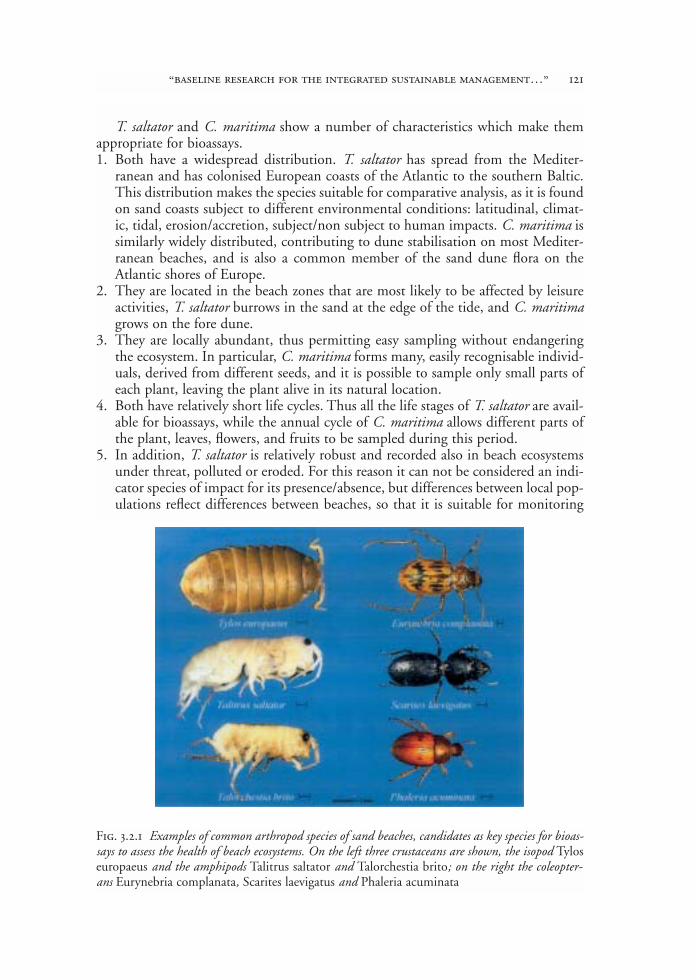
T. saltator and C. maritima show a number of characteristics which make themappropriate for bioassays.1. Both have a widespread distribution. T. saltator has spread from the Mediter-
ranean and has colonised European coasts of the Atlantic to the southern Baltic.This distribution makes the species suitable for comparative analysis, as it is foundon sand coasts subject to different environmental conditions: latitudinal, climat-ic, tidal, erosion/accretion, subject/non subject to human impacts. C. maritima issimilarly widely distributed, contributing to dune stabilisation on most Mediter-ranean beaches, and is also a common member of the sand dune flora on theAtlantic shores of Europe.
2. They are located in the beach zones that are most likely to be affected by leisureactivities, T. saltator burrows in the sand at the edge of the tide, and C. maritimagrows on the fore dune.
3. They are locally abundant, thus permitting easy sampling without endangeringthe ecosystem. In particular, C. maritima forms many, easily recognisable individ-uals, derived from different seeds, and it is possible to sample only small parts ofeach plant, leaving the plant alive in its natural location.
4. Both have relatively short life cycles. Thus all the life stages of T. saltator are avail-able for bioassays, while the annual cycle of C. maritima allows different parts ofthe plant, leaves, flowers, and fruits to be sampled during this period.
5. In addition, T. saltator is relatively robust and recorded also in beach ecosystemsunder threat, polluted or eroded. For this reason it can not be considered an indi-cator species of impact for its presence/absence, but differences between local pop-ulations reflect differences between beaches, so that it is suitable for monitoring
“baseline research for the integrated sustainable management…” 121
Fig. 3.2.1 Examples of common arthropod species of sand beaches, candidates as key species for bioas-says to assess the health of beach ecosystems. On the left three crustaceans are shown, the isopod Tyloseuropaeus and the amphipods Talitrus saltator and Talorchestia brito; on the right the coleopter-ans Eurynebria complanata, Scarites laevigatus and Phaleria acuminata

ecosystem adaptability or adaptation to changes. In this context, the ease withwhich it can be kept and reared in the laboratory is important, permitting in-depth physiological and genetic studies.
122 techniques for ecological characterization of sites and eco-audits
Fig 3.2.2 Photograph of a live adult male Talitrus saltator, of body length about 2 cm. Key for theidentification of the species recommended (Ruffo, The Amphipoda of the Mediterranean – Part III,Memoires de l’Institut Oceanografique, Monaco, 13, 1993)
Fig. 3.2.3 Photograph of a flowering Cakile maritima plant. The leaves only were used for the DNAanalyses
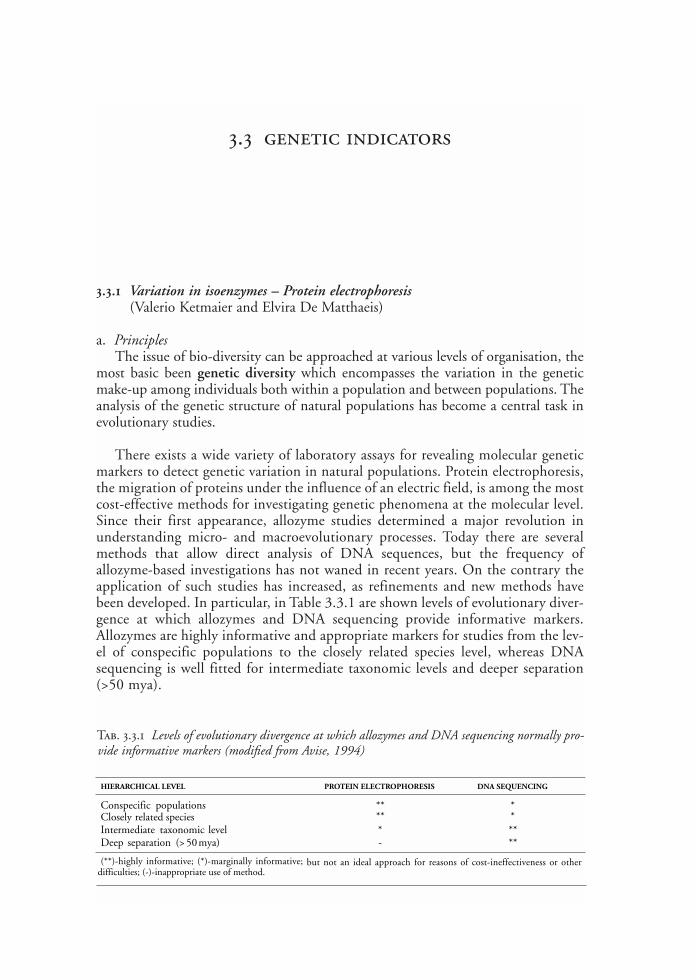
3.3 genetic indicators
3.3.1 Variation in isoenzymes – Protein electrophoresis(Valerio Ketmaier and Elvira De Matthaeis)
a. PrinciplesThe issue of bio-diversity can be approached at various levels of organisation, the
most basic been genetic diversity which encompasses the variation in the geneticmake-up among individuals both within a population and between populations. Theanalysis of the genetic structure of natural populations has become a central task inevolutionary studies.
There exists a wide variety of laboratory assays for revealing molecular geneticmarkers to detect genetic variation in natural populations. Protein electrophoresis,the migration of proteins under the influence of an electric field, is among the mostcost-effective methods for investigating genetic phenomena at the molecular level.Since their first appearance, allozyme studies determined a major revolution inunderstanding micro- and macroevolutionary processes. Today there are severalmethods that allow direct analysis of DNA sequences, but the frequency ofallozyme-based investigations has not waned in recent years. On the contrary theapplication of such studies has increased, as refinements and new methods havebeen developed. In particular, in Table 3.3.1 are shown levels of evolutionary diver-gence at which allozymes and DNA sequencing provide informative markers.Allozymes are highly informative and appropriate markers for studies from the lev-el of conspecific populations to the closely related species level, whereas DNAsequencing is well fitted for intermediate taxonomic levels and deeper separation(>50 mya).
Tab. 3.3.1 Levels of evolutionary divergence at which allozymes and DNA sequencing normally pro-vide informative markers (modified from Avise, 1994)
HIERARCHICAL LEVEL PROTEIN ELECTROPHORESIS DNA SEQUENCING
Conspecific populations ** *Closely related species ** *Intermediate taxonomic level * **Deep separation (> 50 mya) - **
(**)-highly informative; (*)-marginally informative; but not an ideal approach for reasons of cost-ineffectiveness or otherdifficulties; (-)-inappropriate use of method.
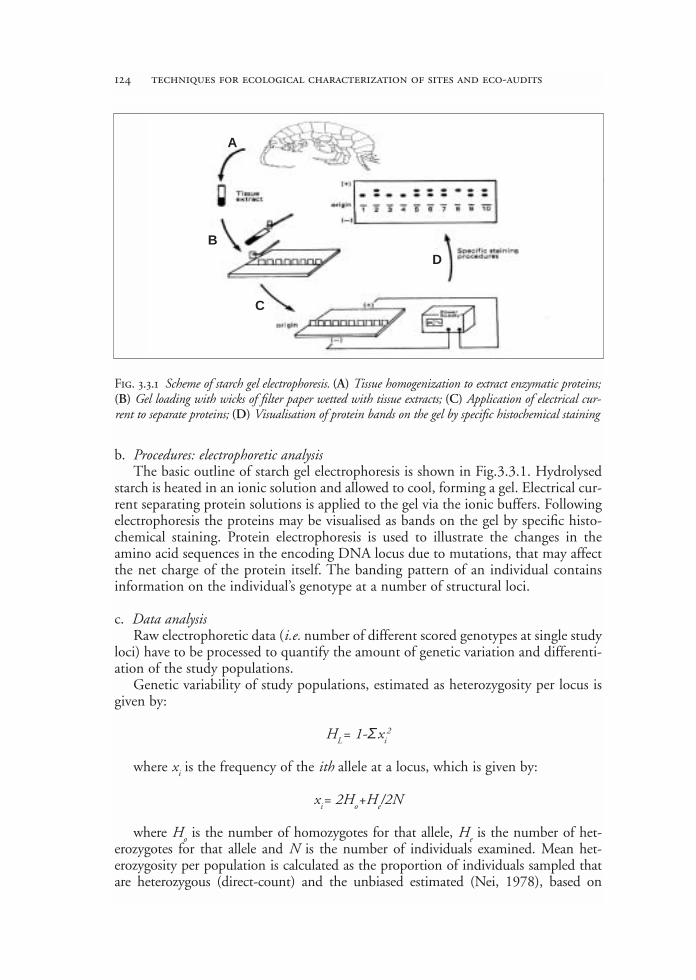
b. Procedures: electrophoretic analysisThe basic outline of starch gel electrophoresis is shown in Fig.3.3.1. Hydrolysed
starch is heated in an ionic solution and allowed to cool, forming a gel. Electrical cur-rent separating protein solutions is applied to the gel via the ionic buffers. Followingelectrophoresis the proteins may be visualised as bands on the gel by specific histo-chemical staining. Protein electrophoresis is used to illustrate the changes in theamino acid sequences in the encoding DNA locus due to mutations, that may affectthe net charge of the protein itself. The banding pattern of an individual containsinformation on the individual’s genotype at a number of structural loci.
c. Data analysisRaw electrophoretic data (i.e. number of different scored genotypes at single study
loci) have to be processed to quantify the amount of genetic variation and differenti-ation of the study populations.
Genetic variability of study populations, estimated as heterozygosity per locus isgiven by:
HL= 1-Σxi2
where xi is the frequency of the ith allele at a locus, which is given by:
xi= 2Ho+He/2N
where Ho is the number of homozygotes for that allele, He is the number of het-erozygotes for that allele and N is the number of individuals examined. Mean het-erozygosity per population is calculated as the proportion of individuals sampled thatare heterozygous (direct-count) and the unbiased estimated (Nei, 1978), based on
124 techniques for ecological characterization of sites and eco-audits
Fig. 3.3.1 Scheme of starch gel electrophoresis. (A) Tissue homogenization to extract enzymatic proteins;(B) Gel loading with wicks of filter paper wetted with tissue extracts; (C) Application of electrical cur-rent to separate proteins; (D) Visualisation of protein bands on the gel by specific histochemical staining
A
B
C
D
Hardy-Weinberg expectations. Other measures of genetic variability are the mean num-ber of alleles per locus and the percentage of loci polymorphic. A locus has been con-sidered polymorphic if the frequency of the most common allele does not exceed 0.99.
Several measures are available to quantify the genetic differentiation between pop-ulations. The most widely used statistics are those of Nei (1978). Nei’s coefficient ofgenetic identity (I ) between two taxa is given by:
I=Σxiyi/√(Σxi2Σyi
2)
where xi and yi are the frequencies of the ith allele in populations X and Y respec-tively. I =1 when X and Y are monomorphic for the same allele and I =0 when X andY are monomorphic for different alleles. The mean genetic identity (Imean) is the meanover all loci studied and is given by:
Imean=IXY /√(IXIY )
where IXY , IX and IY are the arithmetic means, over all loci of Σxiyi, Σxi2 and Σyi
2
respectively.The genetic distance (D ) is estimated by:
D=-lnI
When genetic identity and/or distance have been calculated for all possible pairs ofpopulations, results can be presented as dendrograms. Various methods are availablefor dendrogram construction. In this work we have applied to the genetic distance val-ues (D ; Nei, 1978) the unweighted pair-group arithmetic average (UPGMA) cluster-ing method, which performs hierarchical cluster analysis starting from the two popu-lations with the lowest genetic distance between them.
d. A case study In this section we intend to show, through a case study on amphipods, the basic
principles and interpretation of data yielded by protein electrophoresis. Detailed lab-oratory protocols can be found in Murphy et al. (1996).
Pattern of genetic divergence and variability in Mediterranean talitrids(Crustacea, Amphipoda) based on allozyme data
IntroductionTwo of the major applications of protein electrophoretic deal with the recognition
of species and their evolutionary relationships (molecular systematics) and estimatingand understanding genetic variability in natural populations.
For several years we have had ongoing projects on the study of the genetic varia-tion among populations of Talitrus saltator (Amphipoda, Talitridae). Up to date wehave a quite deep knowledge of the pattern of genetic structuring of this species at thescale of the whole Mediterranean (De Matthaeis et al., 1994; 1995; 1998; 2000a). Themain results of these studies have been the identification of geographic groups, high-
“baseline research for the integrated sustainable management…” 125
ly genetically divergent from each other. In particular a mean degree of genetic dis-tance (D ; Nei, 1978) of 0.4 was found among Tyrrhenian, Adriatic and Aegean pop-ulations of this species (Fig.3.3.2). D values of the same order of magnitude are fre-quently reported for interspecific comparisons (Thorpe, 1983; Stewart, 1993). Theoutcome of these evidences may so be used as a frame to place the analysis of the genet-ic structure of the T. saltator populations from North African coasts. Here we reportdata on the genetic structure on three North African populations of T. saltator, onefrom Morocco and two from Tunisia. We have compared these populations with sev-eral other populations, which could be considered representative of the above-men-tioned geographic groups, in order to understand the pattern of genetic relationshipsof these newly studied populations with the other geographic groups of T. saltator. T.saltator may be frequently found associated with species belonging to the genusTalorchestia such as T. deshayesii and T. brito. In particular, at Tabarka beach (Tunisia)we found both Talitrus saltator and Talorchestia brito, whereas at Zouara (Tunisia) T.brito was the most abundant species. Within Talorchestia deshayesii, available geneticdata (De Matthaeis et al., 1994) indicate a less pronounced degree of genetic differ-entiation among Italian populations than in Talitrus saltator. However, more recently,De Matthaeis et al. (2000b) pointed out the considerable amount of genetic differen-tiation of a population of Talorchestia deshayesii from Ramla Bay (Ramla l-Hamra,Gozo, described in section 2.4) with respect to several other conspecific populations(Dmean= 0.260) (Fig. 3.3.3). Ramla Bay is a sandy beach of extreme ecological value buthighly impacted during the tourist season.
Moreover, because Talitrus saltator is a typical element of the supralittoral fauna itcan be considered a good candidate as source of biological information in order to yieldimportant results on the quality of the study coastal sites. The rationale for this approachcomes from several experimental studies that have shown a non-random associationbetween levels of genetic variability and temporal and spatial patterns of environmentalvariations (Ayala et al., 1975; Scapini et al., 1995). Environmental stress, natural oranthropogenic, may cause variations in the genetic structure of natural populations(Hummel and Patarnello, 1994). Korol et al. (1996) have demonstrated mathematical-ly that cyclical changes of the environmental optimum cannot help in polymorphismmaintenance. Under these assumptions, several efforts have been made to use geneticmarkers as possible tools in analysing the impact of human-induced alterations on thequality of certain environments (Nevo et al., 1984; Foré et al., 1995a). We intend tohighlight the predictive potential of both supralittoral amphipods and this class ofmolecular markers in evaluating the state of health of different coastal ecosystems.
Material and methods
SamplingThe study populations, identified by a three-letter code, are listed in Table 3.3.2
and the geographic locations of sampling sites are shown in Fig. 3.3.4.
ElectrophoresisIn the present work we have used 12 enzymatic proteins to assess the degree of
genetic polymorphism of the study populations. In Table 3.3.3 are listed the
126 techniques for ecological characterization of sites and eco-audits

“baseline research for the integrated sustainable management…” 127
Fig. 3.3.2 UPGMA dendrogram showing the mean genetic distances among Talitrus saltator popu-lations from Atlantic, Tyrrhenian, Adriatic and Aegean coasts
Fig. 3.3.3 UPGMA dendrogram showing the genetic differentiation between Talitrus saltator andTalorchestia deshayesii from Mediterranean coasts
Atlantic
Tyrrhenian
Corsica
Aegean
Adriatic
Corsica
Tyrrhenian
Aegean
Adriatic
Corsica
Favignana
Gozo, Malta
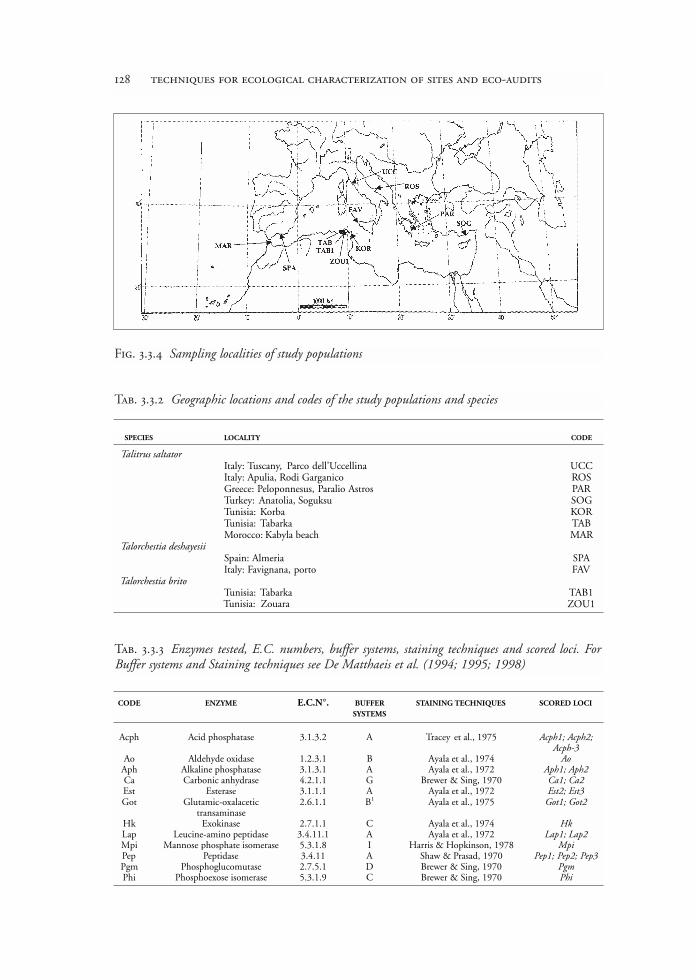
128 techniques for ecological characterization of sites and eco-audits
Fig. 3.3.4 Sampling localities of study populations
Tab. 3.3.2 Geographic locations and codes of the study populations and species
SPECIES LOCALITY CODE
Talitrus saltatorItaly: Tuscany, Parco dell’Uccellina UCCItaly: Apulia, Rodi Garganico ROSGreece: Peloponnesus, Paralio Astros PARTurkey: Anatolia, Soguksu SOGTunisia: Korba KORTunisia: Tabarka TABMorocco: Kabyla beach MAR
Talorchestia deshayesiiSpain: Almeria SPAItaly: Favignana, porto FAV
Talorchestia britoTunisia: Tabarka TAB1Tunisia: Zouara ZOU1
Tab. 3.3.3 Enzymes tested, E.C. numbers, buffer systems, staining techniques and scored loci. ForBuffer systems and Staining techniques see De Matthaeis et al. (1994; 1995; 1998)
CODE ENZYME E.C.N°. BUFFERSYSTEMS
STAINING TECHNIQUES SCORED LOCI
Acph Acid phosphatase 3.1.3.2 A Tracey et al., 1975 Acph1; Acph2;Acph-3
Ao Aldehyde oxidase 1.2.3.1 B Ayala et al., 1974 AoAph Alkaline phosphatase 3.1.3.1 A Ayala et al., 1972 Aph1; Aph2Ca Carbonic anhydrase 4.2.1.1 G Brewer & Sing, 1970 Ca1; Ca2Est Esterase 3.1.1.1 A Ayala et al., 1972 Est2; Est3Got Glutamic-oxalacetic
transaminase2.6.1.1 B1 Ayala et al., 1975 Got1; Got2
Hk Exokinase 2.7.1.1 C Ayala et al., 1974 HkLap Leucine-amino peptidase 3.4.11.1 A Ayala et al., 1972 Lap1; Lap2Mpi Mannose phosphate isomerase 5.3.1.8 I Harris & Hopkinson, 1978 MpiPep Peptidase 3.4.11 A Shaw & Prasad, 1970 Pep1; Pep2; Pep3Pgm Phosphoglucomutase 2.7.5.1 D Brewer & Sing, 1970 PgmPhi Phosphoexose isomerase 5.3.1.9 C Brewer & Sing, 1970 Phi
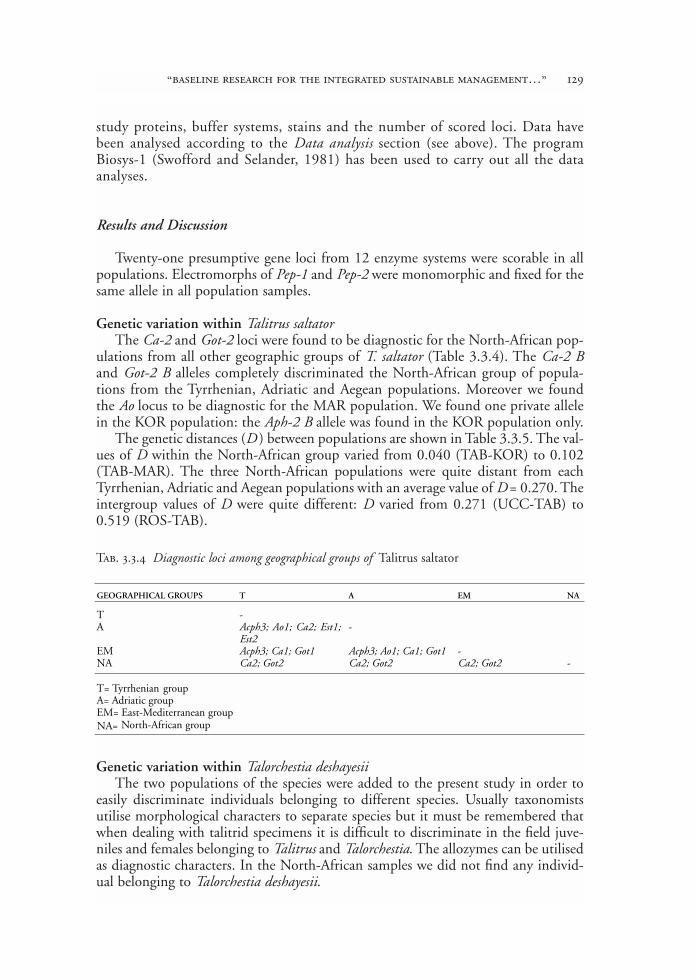
study proteins, buffer systems, stains and the number of scored loci. Data havebeen analysed according to the Data analysis section (see above). The programBiosys-1 (Swofford and Selander, 1981) has been used to carry out all the dataanalyses.
Results and Discussion
Twenty-one presumptive gene loci from 12 enzyme systems were scorable in allpopulations. Electromorphs of Pep-1 and Pep-2 were monomorphic and fixed for thesame allele in all population samples.
Genetic variation within Talitrus saltatorThe Ca-2 and Got-2 loci were found to be diagnostic for the North-African pop-
ulations from all other geographic groups of T. saltator (Table 3.3.4). The Ca-2 Band Got-2 B alleles completely discriminated the North-African group of popula-tions from the Tyrrhenian, Adriatic and Aegean populations. Moreover we foundthe Ao locus to be diagnostic for the MAR population. We found one private allelein the KOR population: the Aph-2 B allele was found in the KOR population only.
The genetic distances (D ) between populations are shown in Table 3.3.5. The val-ues of D within the North-African group varied from 0.040 (TAB-KOR) to 0.102(TAB-MAR). The three North-African populations were quite distant from eachTyrrhenian, Adriatic and Aegean populations with an average value of D = 0.270. Theintergroup values of D were quite different: D varied from 0.271 (UCC-TAB) to0.519 (ROS-TAB).
Genetic variation within Talorchestia deshayesiiThe two populations of the species were added to the present study in order to
easily discriminate individuals belonging to different species. Usually taxonomistsutilise morphological characters to separate species but it must be remembered thatwhen dealing with talitrid specimens it is difficult to discriminate in the field juve-niles and females belonging to Talitrus and Talorchestia. The allozymes can be utilisedas diagnostic characters. In the North-African samples we did not find any individ-ual belonging to Talorchestia deshayesii.
“baseline research for the integrated sustainable management…” 129
GEOGRAPHICAL GROUPS T A EM NA
T -A Acph3; Ao1; Ca2; Est1;
Est2-
EM Acph3; Ca1; Got1 Acph3; Ao1; Ca1; Got1 -NA Ca2; Got2 Ca2; Got2 Ca2; Got2 -
T= Tyrrhenian groupA= Adriatic groupEM= East-Mediterranean group
North-African groupNA=
Tab. 3.3.4 Diagnostic loci among geographical groups of Talitrus saltator
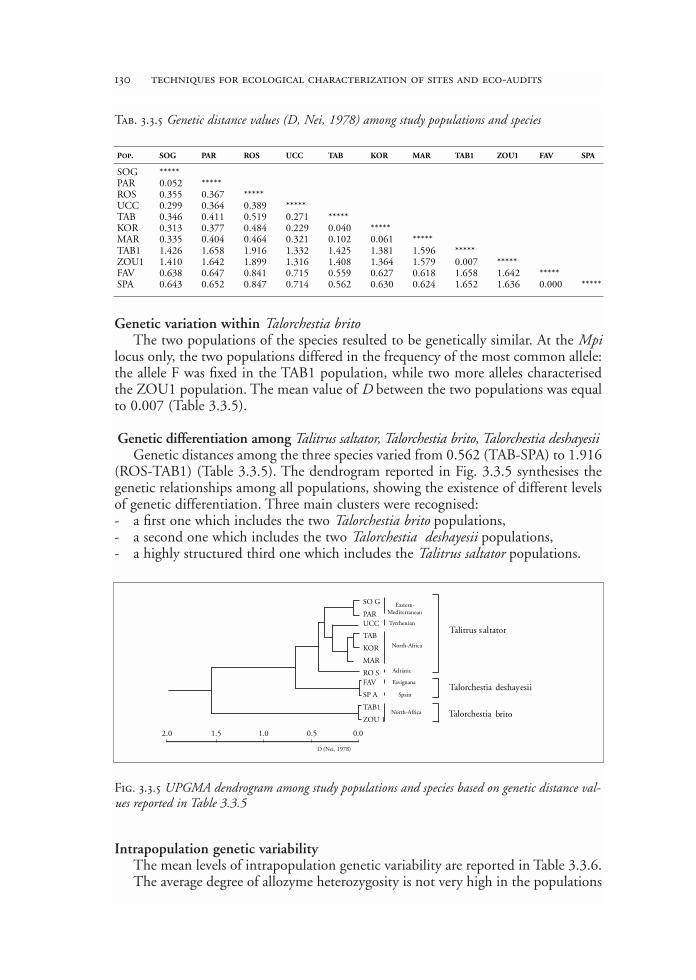
Genetic variation within Talorchestia britoThe two populations of the species resulted to be genetically similar. At the Mpi
locus only, the two populations differed in the frequency of the most common allele:the allele F was fixed in the TAB1 population, while two more alleles characterisedthe ZOU1 population. The mean value of D between the two populations was equalto 0.007 (Table 3.3.5).
Genetic differentiation among Talitrus saltator, Talorchestia brito, Talorchestia deshayesiiGenetic distances among the three species varied from 0.562 (TAB-SPA) to 1.916
(ROS-TAB1) (Table 3.3.5). The dendrogram reported in Fig. 3.3.5 synthesises thegenetic relationships among all populations, showing the existence of different levelsof genetic differentiation. Three main clusters were recognised:- a first one which includes the two Talorchestia brito populations,- a second one which includes the two Talorchestia deshayesii populations,- a highly structured third one which includes the Talitrus saltator populations.
Intrapopulation genetic variabilityThe mean levels of intrapopulation genetic variability are reported in Table 3.3.6. The average degree of allozyme heterozygosity is not very high in the populations
130 techniques for ecological characterization of sites and eco-audits
Tab. 3.3.5 Genetic distance values (D, Nei, 1978) among study populations and species
POP. SOG PAR ROS UCC TAB KOR MAR TAB1 ZOU1 FAV SPA
SOG *****PAR 0.052 *****ROS 0.355 0.367 *****UCC 0.299 0.364 0.389 *****TAB 0.346 0.411 0.519 0.271 *****KOR 0.313 0.377 0.484 0.229 0.040 *****MAR 0.335 0.404 0.464 0.321 0.102 0.061 *****TAB1 1.426 1.658 1.916 1.332 1.425 1.381 1.596 *****ZOU1 1.410 1.642 1.899 1.316 1.408 1.364 1.579 0.007 *****FAV 0.638 0.647 0.841 0.715 0.559 0.627 0.618 1.658 1.642 *****SPA 0.643 0.652 0.847 0.714 0.562 0.630 0.624 1.652 1.636 0.000 *****
2.0 1.5 1.0 0.5 0.0
D (Nei, 1978)
SO G
PARUCC
TAB
KOR
MAR
RO SFAV
SP A
TAB1
ZOU 1
Eastern-Mediterranean
Tyrrhenian
North-Africa
Adriatic
Talitrus s altator
Talorchestia deshayesii
brito
Favignana
Spain
North-Africa Talorchestia
Fig. 3.3.5 UPGMA dendrogram among study populations and species based on genetic distance val-ues reported in Table 3.3.5
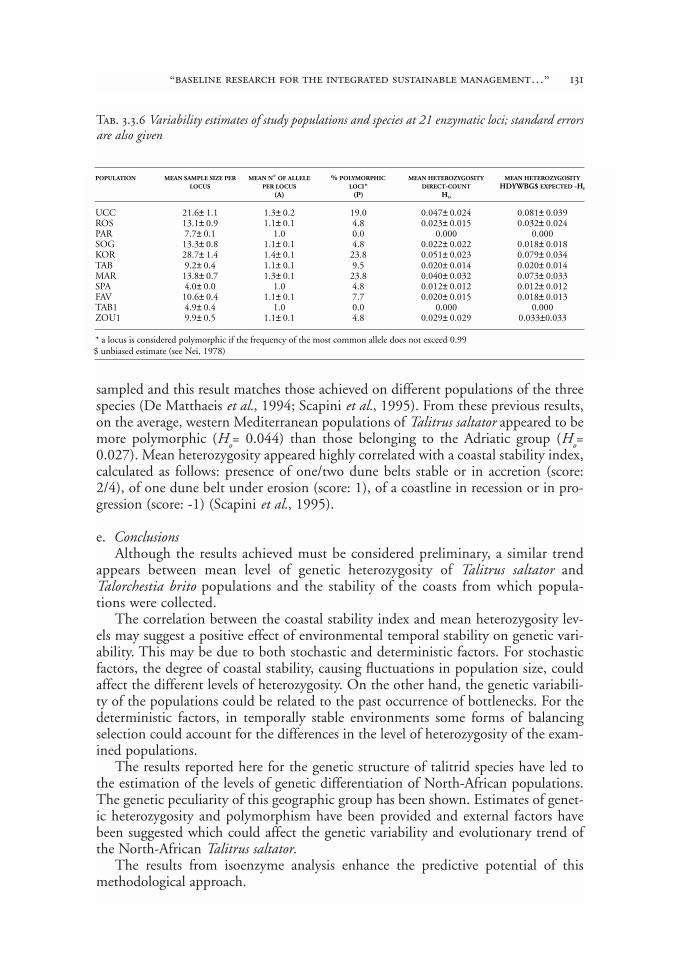
sampled and this result matches those achieved on different populations of the threespecies (De Matthaeis et al., 1994; Scapini et al., 1995). From these previous results,on the average, western Mediterranean populations of Talitrus saltator appeared to bemore polymorphic (Ho= 0.044) than those belonging to the Adriatic group (Ho=0.027). Mean heterozygosity appeared highly correlated with a coastal stability index,calculated as follows: presence of one/two dune belts stable or in accretion (score:2/4), of one dune belt under erosion (score: 1), of a coastline in recession or in pro-gression (score: -1) (Scapini et al., 1995).
e. ConclusionsAlthough the results achieved must be considered preliminary, a similar trend
appears between mean level of genetic heterozygosity of Talitrus saltator andTalorchestia brito populations and the stability of the coasts from which popula-tions were collected.
The correlation between the coastal stability index and mean heterozygosity lev-els may suggest a positive effect of environmental temporal stability on genetic vari-ability. This may be due to both stochastic and deterministic factors. For stochasticfactors, the degree of coastal stability, causing fluctuations in population size, couldaffect the different levels of heterozygosity. On the other hand, the genetic variabili-ty of the populations could be related to the past occurrence of bottlenecks. For thedeterministic factors, in temporally stable environments some forms of balancingselection could account for the differences in the level of heterozygosity of the exam-ined populations.
The results reported here for the genetic structure of talitrid species have led tothe estimation of the levels of genetic differentiation of North-African populations.The genetic peculiarity of this geographic group has been shown. Estimates of genet-ic heterozygosity and polymorphism have been provided and external factors havebeen suggested which could affect the genetic variability and evolutionary trend ofthe North-African Talitrus saltator.
The results from isoenzyme analysis enhance the predictive potential of thismethodological approach.
“baseline research for the integrated sustainable management…” 131
POPULATION MEAN SAMPLE SIZE PERLOCUS
MEAN N° OF ALLELEPER LOCUS
(A)
% POLYMORPHICLOCI*
(P)
MEAN HETEROZYGOSITYDIRECT-COUNT
HO
MEAN HETEROZYGOSITYHDYWBG$ EXPECTED -HE
UCC 21.6± 1.1 1.3± 0.2 19.0 0.047± 0.024 0.081± 0.039ROS 13.1± 0.9 1.1± 0.1 4.8 0.023± 0.015 0.032± 0.024PAR 7.7± 0.1 1.0 0.0 0.000 0.000SOG 13.3± 0.8 1.1± 0.1 4.8 0.022± 0.022 0.018± 0.018KOR 28.7± 1.4 1.4± 0.1 23.8 0.051± 0.023 0.079± 0.034TAB 9.2± 0.4 1.1± 0.1 9.5 0.020± 0.014 0.020± 0.014MAR 13.8± 0.7 1.3± 0.1 23.8 0.040± 0.032 0.073± 0.033SPA 4.0± 0.0 1.0 4.8 0.012± 0.012 0.012± 0.012FAV 10.6± 0.4 1.1± 0.1 7.7 0.020± 0.015 0.018± 0.013TAB1 4.9± 0.4 1.0 0.0 0.000 0.000ZOU1 9.9± 0.5 1.1± 0.1 4.8 0.029± 0.029 0.033±0.033
* a locus is considered polymorphic if the frequency of the most common allele does not exceed 0.99$ unbiased estimate (see Nei, 1978)
Tab. 3.3.6 Variability estimates of study populations and species at 21 enzymatic loci; standard errorsare also given

132 techniques for ecological characterization of sites and eco-audits
f. SupportEquipment: in order to carry out starch gel electrophoresis a specific laboratory is
needed, a number of pieces of equipment are essential and others are highly desirable.A complete listing of basic equipment are given in Murphy et al. (1996). In the sametext it is possible to retrieve the basic chemicals required.
Software: an high number of dedicated packages are available to perform a varietyof statistical analysis of genetic data; one of the most popular is Biosys-1 (Swoffordand Selander, 1981). A lot of these programs are available freely through Internet (seefor instance http://evolution.genetics.washington.edu/phylip/software.html).
Expertise: 1) laboratory capacity - easy after training; 2) processing of raw data -easy with the assistance of an expert researcher; 3) calculation of relevant statistics –easy with the packages available; 4) interpretation of results – comparison with exist-ing data base is needed.
Database from the allozyme results achieved during the MECO project will bemade at disposal of interested persons in Rome (Prof. Elvira De Matthaeis, Universi-ty of Rome “La Sapienza”- Department of Animal and Human Biology, e-mail: [email protected]).
g. ReferencesAvise J.C. (1994). Molecular markers, natural history and evolution, Chapman and Hall. New York.Ayala F., Valentine J.W., Hedgecock D., Barr L. (1975) Deep sea asteroids: high genetic vari-
ability in a stable environment. Evolution, 29: 203-212.De Matthaeis E., Cobolli M., Mattoccia M., Saccoccio P., Scapini F. (1994) Genetic divergence
between natural populations of Mediterranean sandhoppers. In: Beaumont A. R. (ed.), Genet-ics and Evolution of aquatic organisms, Chapman and Hall. London.
De Matthaeis E., Cobolli M., Mattoccia M., Scapini F. (1995) Geographical variation in Tali-trus saltator (Crustacea, Amphipoda): biochemical evidence, Boll. Zool., 62: 77- 84.
De Matthaeis E., Davolos D. and Cobolli M. (1998) Genetic divergence between populationsand species of talitrids from Aegean islands. J. Hered., 89: 37-43.
De Matthaeis E., Davolos D., Cobolli M., Ketmaier V. (2000a) Isolation by distance in equi-librium and non-equilibrium populations of four talitrids species in the Mediterranean sea.Evolution, 54: 1606-1613.
De Matthaeis E., Ketmaier V., Cobolli M., Davolos D., Schembri P.J. (2000b) Patterns ofgenetic diversity in Mediterranean supralittoral amphipods (Crustacea, Amphipoda). Pol.Arch. Hydrobiol., 47: 351-361.
Foré S.A., Guttman S.I., Bailer A.J., Altfater D.J., Counts B.V. (1995) Exploratory analysis ofpopulation genetic assessment as a water quality indicator. Ecot. Environ. Safety, 30: 24-35.
Hummel H. and Patarnello T. (1994) Genetics effects of pollutants on marine and estuarineinvertebrates. In: Beaumont A. R. (ed.), Genetics and Evolution of aquatic organisms, Chap-man and Hall. London.
Korol A.B., Kirzhner V.M., Ronin Y.I., Nevo E. (1996) Cyclical environmental changes as a fac-tor maintaining genetic polymorphism. 2. Diploid selection for an additive trait. Evolution,50: 1432-1441.
Murphy R.W., Sites J.W., Buth D.G. and Haufler C.H. (1999) Proteins: isozyme electrophore-sis. In: Hillis D. M., Moritz C. and Mable B.K. (eds.). Molecular systematics -second edition,Sinauer, Sunderland.
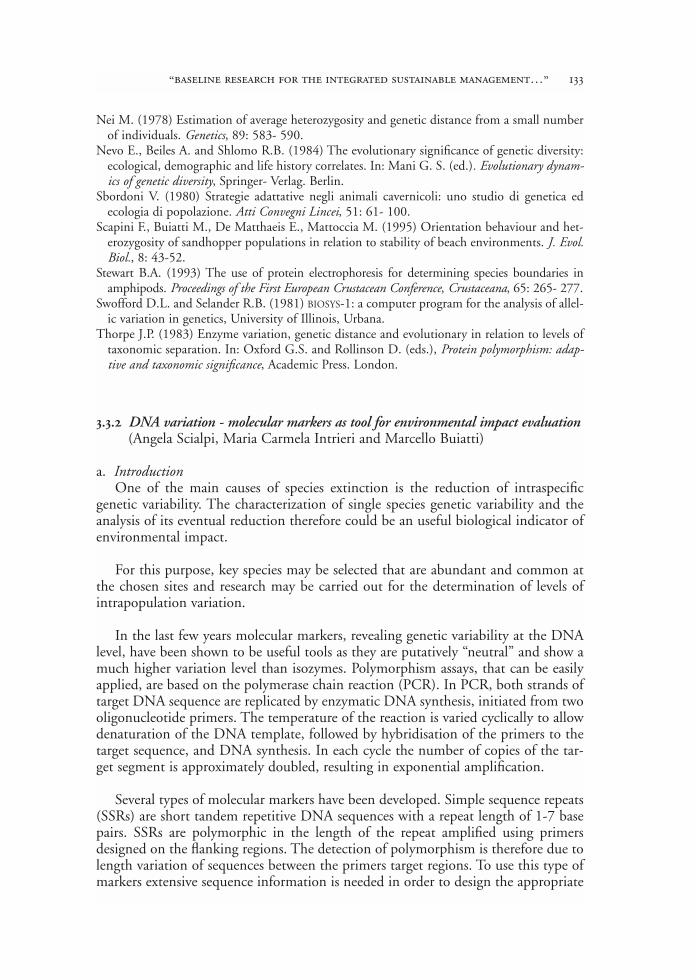
Nei M. (1978) Estimation of average heterozygosity and genetic distance from a small numberof individuals. Genetics, 89: 583- 590.
Nevo E., Beiles A. and Shlomo R.B. (1984) The evolutionary significance of genetic diversity:ecological, demographic and life history correlates. In: Mani G. S. (ed.). Evolutionary dynam-ics of genetic diversity, Springer- Verlag. Berlin.
Sbordoni V. (1980) Strategie adattative negli animali cavernicoli: uno studio di genetica edecologia di popolazione. Atti Convegni Lincei, 51: 61- 100.
Scapini F., Buiatti M., De Matthaeis E., Mattoccia M. (1995) Orientation behaviour and het-erozygosity of sandhopper populations in relation to stability of beach environments. J. Evol.Biol., 8: 43-52.
Stewart B.A. (1993) The use of protein electrophoresis for determining species boundaries inamphipods. Proceedings of the First European Crustacean Conference, Crustaceana, 65: 265- 277.
Swofford D.L. and Selander R.B. (1981) BIOSYS-1: a computer program for the analysis of allel-ic variation in genetics, University of Illinois, Urbana.
Thorpe J.P. (1983) Enzyme variation, genetic distance and evolutionary in relation to levels oftaxonomic separation. In: Oxford G.S. and Rollinson D. (eds.), Protein polymorphism: adap-tive and taxonomic significance, Academic Press. London.
3.3.2 DNA variation - molecular markers as tool for environmental impact evaluation(Angela Scialpi, Maria Carmela Intrieri and Marcello Buiatti)
a. IntroductionOne of the main causes of species extinction is the reduction of intraspecific
genetic variability. The characterization of single species genetic variability and theanalysis of its eventual reduction therefore could be an useful biological indicator ofenvironmental impact.
For this purpose, key species may be selected that are abundant and common atthe chosen sites and research may be carried out for the determination of levels ofintrapopulation variation.
In the last few years molecular markers, revealing genetic variability at the DNAlevel, have been shown to be useful tools as they are putatively “neutral” and show amuch higher variation level than isozymes. Polymorphism assays, that can be easilyapplied, are based on the polymerase chain reaction (PCR). In PCR, both strands oftarget DNA sequence are replicated by enzymatic DNA synthesis, initiated from twooligonucleotide primers. The temperature of the reaction is varied cyclically to allowdenaturation of the DNA template, followed by hybridisation of the primers to thetarget sequence, and DNA synthesis. In each cycle the number of copies of the tar-get segment is approximately doubled, resulting in exponential amplification.
Several types of molecular markers have been developed. Simple sequence repeats(SSRs) are short tandem repetitive DNA sequences with a repeat length of 1-7 basepairs. SSRs are polymorphic in the length of the repeat amplified using primersdesigned on the flanking regions. The detection of polymorphism is therefore due tolength variation of sequences between the primers target regions. To use this type ofmarkers extensive sequence information is needed in order to design the appropriate
“baseline research for the integrated sustainable management…” 133
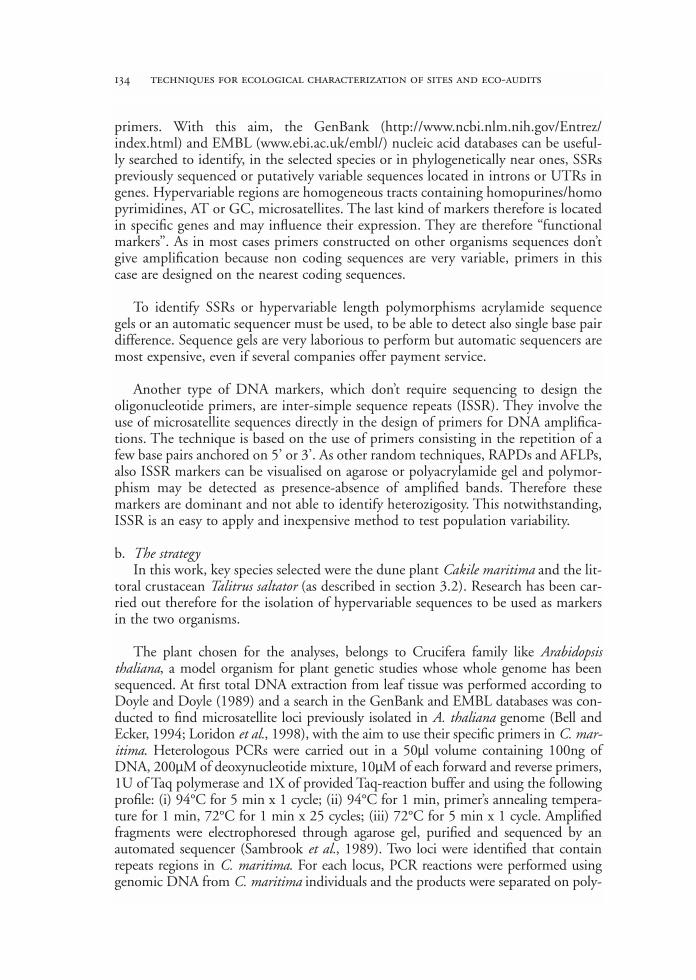
primers. With this aim, the GenBank (http://www.ncbi.nlm.nih.gov/Entrez/index.html) and EMBL (www.ebi.ac.uk/embl/) nucleic acid databases can be useful-ly searched to identify, in the selected species or in phylogenetically near ones, SSRspreviously sequenced or putatively variable sequences located in introns or UTRs ingenes. Hypervariable regions are homogeneous tracts containing homopurines/homopyrimidines, AT or GC, microsatellites. The last kind of markers therefore is locatedin specific genes and may influence their expression. They are therefore “functionalmarkers”. As in most cases primers constructed on other organisms sequences don’tgive amplification because non coding sequences are very variable, primers in thiscase are designed on the nearest coding sequences.
To identify SSRs or hypervariable length polymorphisms acrylamide sequencegels or an automatic sequencer must be used, to be able to detect also single base pairdifference. Sequence gels are very laborious to perform but automatic sequencers aremost expensive, even if several companies offer payment service.
Another type of DNA markers, which don’t require sequencing to design theoligonucleotide primers, are inter-simple sequence repeats (ISSR). They involve theuse of microsatellite sequences directly in the design of primers for DNA amplifica-tions. The technique is based on the use of primers consisting in the repetition of afew base pairs anchored on 5’ or 3’. As other random techniques, RAPDs and AFLPs,also ISSR markers can be visualised on agarose or polyacrylamide gel and polymor-phism may be detected as presence-absence of amplified bands. Therefore thesemarkers are dominant and not able to identify heterozigosity. This notwithstanding,ISSR is an easy to apply and inexpensive method to test population variability.
b. The strategyIn this work, key species selected were the dune plant Cakile maritima and the lit-
toral crustacean Talitrus saltator (as described in section 3.2). Research has been car-ried out therefore for the isolation of hypervariable sequences to be used as markersin the two organisms.
The plant chosen for the analyses, belongs to Crucifera family like Arabidopsisthaliana, a model organism for plant genetic studies whose whole genome has beensequenced. At first total DNA extraction from leaf tissue was performed according toDoyle and Doyle (1989) and a search in the GenBank and EMBL databases was con-ducted to find microsatellite loci previously isolated in A. thaliana genome (Bell andEcker, 1994; Loridon et al., 1998), with the aim to use their specific primers in C. mar-itima. Heterologous PCRs were carried out in a 50µl volume containing 100ng ofDNA, 200µM of deoxynucleotide mixture, 10µM of each forward and reverse primers,1U of Taq polymerase and 1X of provided Taq-reaction buffer and using the followingprofile: (i) 94°C for 5 min x 1 cycle; (ii) 94°C for 1 min, primer’s annealing tempera-ture for 1 min, 72°C for 1 min x 25 cycles; (iii) 72°C for 5 min x 1 cycle. Amplifiedfragments were electrophoresed through agarose gel, purified and sequenced by anautomated sequencer (Sambrook et al., 1989). Two loci were identified that containrepeats regions in C. maritima. For each locus, PCR reactions were performed usinggenomic DNA from C. maritima individuals and the products were separated on poly-
134 techniques for ecological characterization of sites and eco-audits
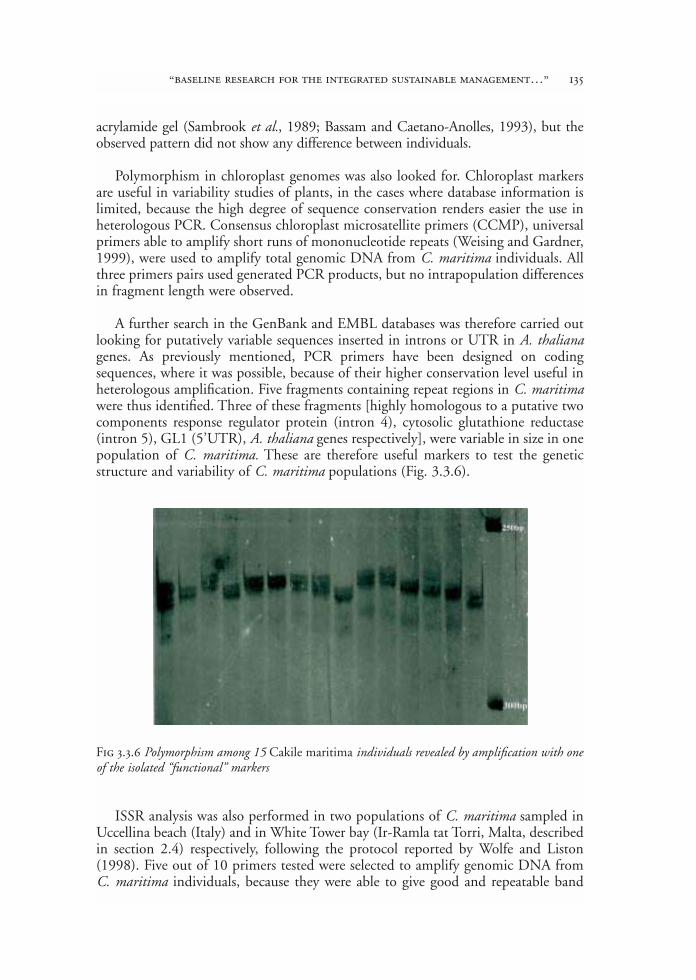
acrylamide gel (Sambrook et al., 1989; Bassam and Caetano-Anolles, 1993), but theobserved pattern did not show any difference between individuals.
Polymorphism in chloroplast genomes was also looked for. Chloroplast markersare useful in variability studies of plants, in the cases where database information islimited, because the high degree of sequence conservation renders easier the use inheterologous PCR. Consensus chloroplast microsatellite primers (CCMP), universalprimers able to amplify short runs of mononucleotide repeats (Weising and Gardner,1999), were used to amplify total genomic DNA from C. maritima individuals. Allthree primers pairs used generated PCR products, but no intrapopulation differencesin fragment length were observed.
A further search in the GenBank and EMBL databases was therefore carried outlooking for putatively variable sequences inserted in introns or UTR in A. thalianagenes. As previously mentioned, PCR primers have been designed on codingsequences, where it was possible, because of their higher conservation level useful inheterologous amplification. Five fragments containing repeat regions in C. maritimawere thus identified. Three of these fragments [highly homologous to a putative twocomponents response regulator protein (intron 4), cytosolic glutathione reductase(intron 5), GL1 (5’UTR), A. thaliana genes respectively], were variable in size in onepopulation of C. maritima. These are therefore useful markers to test the geneticstructure and variability of C. maritima populations (Fig. 3.3.6).
ISSR analysis was also performed in two populations of C. maritima sampled inUccellina beach (Italy) and in White Tower bay (Ir-Ramla tat Torri, Malta, describedin section 2.4) respectively, following the protocol reported by Wolfe and Liston(1998). Five out of 10 primers tested were selected to amplify genomic DNA fromC. maritima individuals, because they were able to give good and repeatable band
“baseline research for the integrated sustainable management…” 135
Fig 3.3.6 Polymorphism among 15 Cakile maritima individuals revealed by amplification with oneof the isolated “functional” markers
profiles. Amplification profiles, obtained after electrophoresis in agarose gel, showeda number of bands in all samples and polymorphic ones in single individuals. There-fore ISSR were used to test the level of resolution of molecular markers for the quan-titative evaluation of variability in natural populations. For each ISSR amplificationpattern, all the bands ranging in size from 2000 to 150bp were scored in 36 individ-uals tested for the presence (1) or absence (0) of homologous bands and compiledinto a matrix. Pairwise comparisons between samples were performed using the sim-ple matching coefficient (m/n) with the NTSYS-pc program (Rohlf, 1993). Thematrices of similarity show that the variability is higher in the Uccellina populationthan in White Tower one. Values of similarity index in the Uccellina population areranging between 0.51 and 1, while in White Tower population the range is between0.65 and 1. The similarity matrices were analysed using the unweighted pair groupmethod algorithm (UPGMA) and assembled into a dendrogram. The two popula-tions analysed are clearly separated in the dendrogram, individuals from the WhiteTower population giving one main cluster, while in the Uccellina population the clus-ter ramifications separate with higher values of the euclidean coefficient (Fig. 3.3.7).
This result suggests that the genetic variability may be higher in the Uccellinapopulation than in the White Tower one, as expected from the known differences inthe human impact, much higher in the second than in the first location.
The same strategy used in the plant, was also used to study the animal species,Talitrus saltator, a crustacean belonging to the Amphipoda order.
136 techniques for ecological characterization of sites and eco-audits
M1 M7 M15 M17 M2 M8 M4 M5 M10 M11 M16 M13 M12 M3 M9 M6 M14 U1 U3 U14 U19 U4 U6 U2 U12 U5 U13 U16 U15 U9 U18 U7 U17 U8 U10 U11
0.00 2.64 5.27 7.91 10.55
Coefficient
Fig 3.3.7 Dendrogram illustrating ISSR polymorphisms among 36 individuals of two populations ofCakile maritima, generated by the UPGMA cluster analysis (NTSYS)
White Tower
Uccellina

At first total DNA extraction from single individuals was performed using theDNeasy Tissue kit (QIAGEN Inc., Valencia, California) according to the manufac-turer’s instructions. A search in the GenBank and EMBL databases was conducted,but database informations on Amphipoda are limited. In fact microsatellites lociidentified in databases were isolated in the Decapoda order (Tam and Kornfield,1996; Tassanaikajon et al., 1998; Ostellari et al., 2000), therefore the amplificationusing heterologous primer was difficult. Moreover when heterologous PCRs wereperformed and amplified fragments were electrophoresed through agarose gel, puri-fied and sequenced, the expected variable sequences were not found in the amplifiedfragments.
Through another search in the GenBank and EMBL databases, putatively variablesequences were identified in introns of Peneaus (Decapoda) genes (Bierne et al.,2000). Also in this case, PCR primers were designed on flanking coding sequences.Amplified fragments did not contain the expected variable sequences.
Mitochondrial DNA analysis was also performed. In the vast majority of caseswhere mitochondrial genome length polymorphisms are observed, it is a direct con-sequence of size variation in the “control region”, named the D-loop in vertebrates orAT-rich region in invertebrates. In fact this region often contains short tandemlyrepeated sequences (Rand, 1993). Using universal primers, the region was amplifiedin single individuals of T. saltator and amplified products showed only SNPs (singlenucleotide polymorphisms), but no easy to detect length polymorphisms. Thereforethis kind of marker is not useful as such in an easy and inexpensive intrapopulationstudy although it may be a basis for restriction polymorphisms.
ISSR analysis was then performed also in two populations of T. saltator sampledin Uccellina beach and in San Rossore beach (see Fig. 3.4.3A), respectively (bothfrom the western coast of Italy). Five out of 10 primers tested were selected, becausethey gave many and repeteable bands. The data were treated as those of C. maritima.
The matrices of similarity support that the variability in the Uccellina populationis higher than in the San Rossore population, also in this case in agreement with envi-romental data showing a high chemical impact in the last location. Values of the sim-ilarity index in the Uccellina population are ranging between 0.50 and 1, while inSan Rossore population they are ranging between 0.66 and 1. The similarity matri-ces were clustered using the UPGMA algorithm and assembled into a dendrogram.The San Rossore population showed only one main cluster while in the Uccelinapopulation the cluster ramifications separate with higher value of the euclidean coef-ficient (Fig. 3.3.8).
Average variabilities calculated for each population show therefore that the vari-ability is higher in Uccellina population than in San Rossore.
We can conclude that we have identified techniques for the early identification ofreduction in biodiversity, likely as a consequence of increased environmental impactin both key species.
“baseline research for the integrated sustainable management…” 137
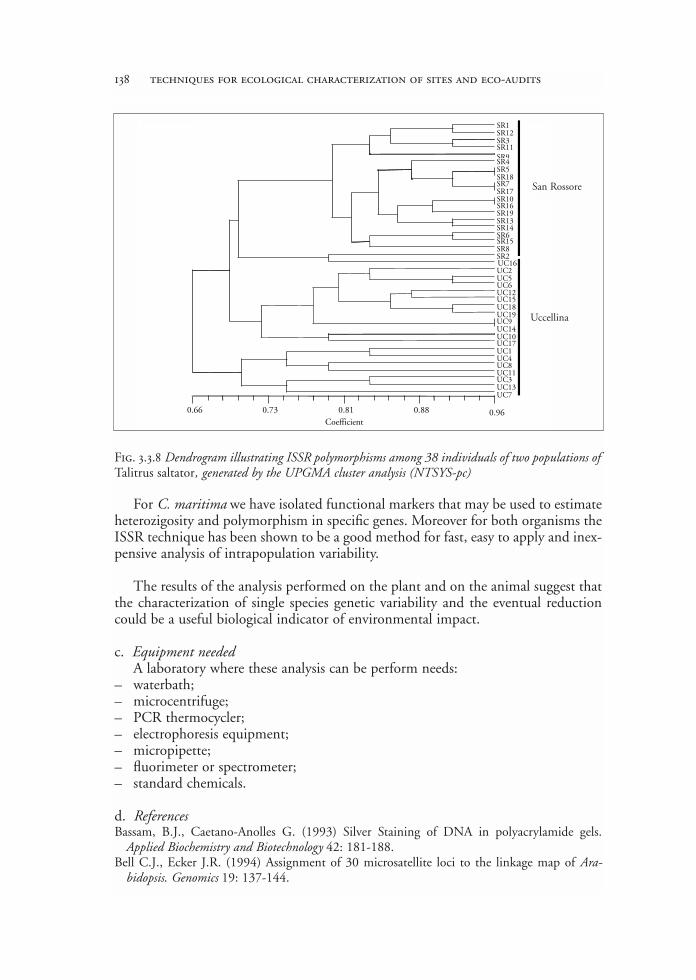
For C. maritima we have isolated functional markers that may be used to estimateheterozigosity and polymorphism in specific genes. Moreover for both organisms theISSR technique has been shown to be a good method for fast, easy to apply and inex-pensive analysis of intrapopulation variability.
The results of the analysis performed on the plant and on the animal suggest thatthe characterization of single species genetic variability and the eventual reductioncould be a useful biological indicator of environmental impact.
c. Equipment neededA laboratory where these analysis can be perform needs:
– waterbath;– microcentrifuge;– PCR thermocycler;– electrophoresis equipment;– micropipette;– fluorimeter or spectrometer;– standard chemicals.
d. ReferencesBassam, B.J., Caetano-Anolles G. (1993) Silver Staining of DNA in polyacrylamide gels.
Applied Biochemistry and Biotechnology 42: 181-188.Bell C.J., Ecker J.R. (1994) Assignment of 30 microsatellite loci to the linkage map of Ara-
bidopsis. Genomics 19: 137-144.
138 techniques for ecological characterization of sites and eco-audits
0.96
SR1 SR12 SR3 SR11SR9 SR4 SR5 SR18 SR7 SR17 SR10 SR16 SR19 SR13 SR14 SR6 SR15 SR8 SR2 UC16 UC2 UC5 UC6 UC12 UC15 UC18 UC19 UC9 UC14 UC10 UC17 UC1 UC4 UC8 UC11 UC3 UC13 UC7
Coefficient0.66 0.73 0.81 0.88
Fig. 3.3.8 Dendrogram illustrating ISSR polymorphisms among 38 individuals of two populations ofTalitrus saltator, generated by the UPGMA cluster analysis (NTSYS-pc)
San Rossore
Uccellina

Bierne N., Lehnert S.A., Bedier E., Bonhomme F., Moore S.S. (2000) Screening for intron-length polymorphisms in penaeid shrimps using exon-primed intron-crossing (EPIC)-PCR.Molecular Ecology 9: 233-235.
Doyle J, Doyle J. (1989) Isolation of plant DNA from fresh tissue. Focus 1: 13-15.Loridon K., Cournoyer B., Goubely C., Depeiges, A., Picard G. (1998) Length polymorphism
and allele structure of trinucleotide microsatellites in natural accessions of Arabidopsisthaliana. Theoretical and applied genetics 97: 591-604.
Ostellari L., Zane L., Maccatrozzo L., Bargelloni L., Patarnello T. (2000) Novel microsatelliteloci isolated from the northern krill, Meganyctiphanes norvegica (Crustacea, Euphausiacea).Molecular Ecology 9: 365-378.
Rand D.M. (1993) Endotherms, ectotherms, and mitochondrial genome-size variation. Journalof Molecular Evolution 37: 281-295.
Rohlf F.J. (1993) NTSYS-pc. Numerical, taxonomy and multivariate analysis system. AppliedBiostatistics Inc., Eixerter Software, Setauket New York.
Sambrook J., Fritsch E.F. and Maniatis T. (1989) Molecular cloning: a laboratory manual, ColdSpring Harbor, New York.
Wolfe A.D., Liston A. (1998) Contributions of PCR-based methods to plant systematics andevolutionary biology. In: Plant Molecular Systematics II, eds: D. E. Soltis, P. S. Soltis and J. J.Doyle, pp. 43-86, Kluwer.
Weising K., Gardner C. (1999) A set of conserved PCR primers for the analysis of simplesequence repeat polymorphisms in chloroplast genomes of dicotyledonous angiosperms.Genome 42: 9-19.
Tam Y.T., Kornfield I. (1996) Characterization of microsatellites markers in Homarus (Crus-tacea, Decapoda). Molecular Marine Biology and Biotechnology 5 (3): 230-238.
Tassanaikajon A., Tiptawonnukul A., Supungul P., Rimphanitchayakit, V. (1998) Isolation andcharacterization of microsatellite markers in the black tiger prawn Penaeus monodon. Molecu-lar Marine Biology and Biotechnology 6 (4): 249-254.
“baseline research for the integrated sustainable management…” 139
3.4 behavioural changes as indicatorsof beach stability
Introduction (Elfed Morgan and Felicita Scapini)
Changes in animal behaviour are usually the earliest biological indicators of envi-ronmental change, and a comparison of the behaviour patterns of key species fromselected beaches with those already on record provides a basis for bioassays of beachstability. These assume that population samples from stable beaches are likely to showless diverse behaviour patterns than those from beaches under threat. The rationalefor such assumption is that adaptation to particular environmental features requirestime (lifetime for individual adaptation, several generations for genetic adaptation).Only individuals coming from coasts relatively stable in time can adapt to the spe-cific features of the sites of origin. Estimates of specific adaptation can thus serve asa tool for coastal stability assessment. The tests are based on the behaviour of a keyspecies, the sand-beach amphipod, Talitrus saltator (see section 3.2). Other commonsandhoppers, such as Talorchestia brito and the beach isopod Tylos europaeus (Fig.3.2.1), which share the same environment, are also suitable for bio-assays, providedthe data are compared with the appropriate database. The tests require reasonablenumbers of live animals and are relatively easy to perform. Moreover, the animals areunharmed, and can be returned to their environment. The results are simple toanalyse using software packages developed within the MECO programme. Record-ing equipment is available in some laboratories in the Mediterranean region, andcould be made available on request (see below Fig. 3.4.1 and 3.4.4).
In the field, talitrids undergo regular nocturnal migrations up and down theshore, and it is this behaviour that has provided the basis of the bioassays. Two aspectsof this behaviour: the orientation of the animals to recover the shoreline whenremoved from sand during the day, and the rhythmic nature of the locomotor activ-ity, have been studied.
3.4.1 Variation in orientation of sandhoppers removed from their burrows duringthe day (Felicita Scapini, Mohamed El Gtari and Giovanni M. Marchetti)
a. RationaleAlthough Talitrus saltator is normally nocturnal, clear preferred orientation patterns
are evident in animals removed from the substratum during the day. Sandhoppers showa tendency to orient towards the shoreline, where, under natural conditions, they wouldfind moist sand in which to burrow at the water’s edge. Variation in the angle of orien-tation is easily estimated using portable choice chambers in the field (Fig. 3.4.1).

The variation in orientation is made as an estimate of adaptation to changingenvironments. On stable coasts, a consistent orientation of all individuals seawardswould be favourable for population maintenance, but on changing coastlines manyindividuals would be maladapted and search for the moist sand strip in wrong direc-tions. Individual variation would also be adaptive on bays or islands, where an arrayof directions would be suitable.
b. ProcedureTalitrus saltator (Fig. 3.2.2) were collected on site and transferred to an holding
box with some moist sand and kept in the shade prior to testing. They were thenreleased in the centre of a circular orientation chamber made of transparent Plexiglas(Fig. 3.4.1A-C). The chamber was 40 cm in diameter and it had 72 pitfall traps onits circumference. The arena was screened from wind with a transparent cover.
On site, the chamber was placed on a tripod, care being taken to ensure that thefloor was horizontal. In the experiments described in section d, prominent landmarkswere screened by covering the horizon of the arena with white rectangular cardboard,and the observers were hidden from view (Fig. 3.4.1C).
“baseline research for the integrated sustainable management…” 141
Fig. 3.4.1 Orientation chamber used for the bioassays; (A) the arena positioned on the sand surface. Thesandhoppers were introduced from the top through the tube and captured at the periphery; (B) the are-na was position on a tripod to hide the experimenters from the view of the sandhoppers tested. Two are-nas were used, one with landscape view screened off and the second one permitting the full view of thehorizon. Here on Bessila, Kneiss Islands; (C) schematic representation of the apparatus
a b
c

In a further set of experiments (described in section e-f ) tests were carried outunder changing climatic factors (temperature, air humidity, atmospheric pressure)and different geophysical conditions, one of which allowed the animals to view thehorizon through a transparent screen, the other one did not (Fig. 3.4.1B).
The animals were introduced in groups of 10 through a tube in the centre of thelid. After a period of 2-5 minutes, the tube was raised, and the animals released. Thenumber in the pitfall traps at each compass point was then recorded. Three groups often individuals were released in the morning, another three groups at noon andanother three groups in the afternoon, resulting in 90 independent records for oneday. The angles with respect to the north and the shoreline direction were recordedto permit subsequent analysis.
c. Data analysisThe data were analysed using circular statistics and the mean vectors determined
for each set of experiments. The distribution of the orientation directions for one daytrials was calculated relative to an assumed ‘normal’ or mean preferred angle of ori-entation, using software developed within the MECO programme.
The first step in the analysis was the graphical representation of the angular dis-tribution with respect to the north and the seaward direction (Fig. 3.4.2). Each pointof distribution represented the choice of one individual. All the individuals testedfrom one population were cumulated in the same distribution chart.
For unimodal distributions a mean vector was calculated by summing all individ-ual vectors (xi ) and dividing the resultant vector length with the number of vectors,using the formula:
r = √ (Σsenxi2 + Σcosxi
2)/n
r is the mean vector length, and would vary from 0 (individuals scattered in alldirections) and 1 (all individuals oriented in the same direction). Then the parame-ter r is a measure of the concentration of the distribution, i.e. of the consistency ofthe orientation. The mean direction µ is the direction of this resultant vector (calcu-lated from the arc tang ). In orientation studies, the reference directions are the geo-graphic directions North, East, South and West, oriented clockwise as in the geo-graphic maps. Then the first quadrant of the circle is North-East, the second South-East, the third South-West and the fourth North-West.
Statistical tests used to estimate the significance of the orientation were based onthe length of the mean vector (r ). The Rayleigh-test tests the significance of an uni-modal distribution against a scattered distribution; the V-test is based on the projec-tion of the mean vector on the expected direction seawards:
V = r x cos (µ - µ0)
where r is the mean vector length, µ its direction and µ0 the expected direction
142 techniques for ecological characterization of sites and eco-audits
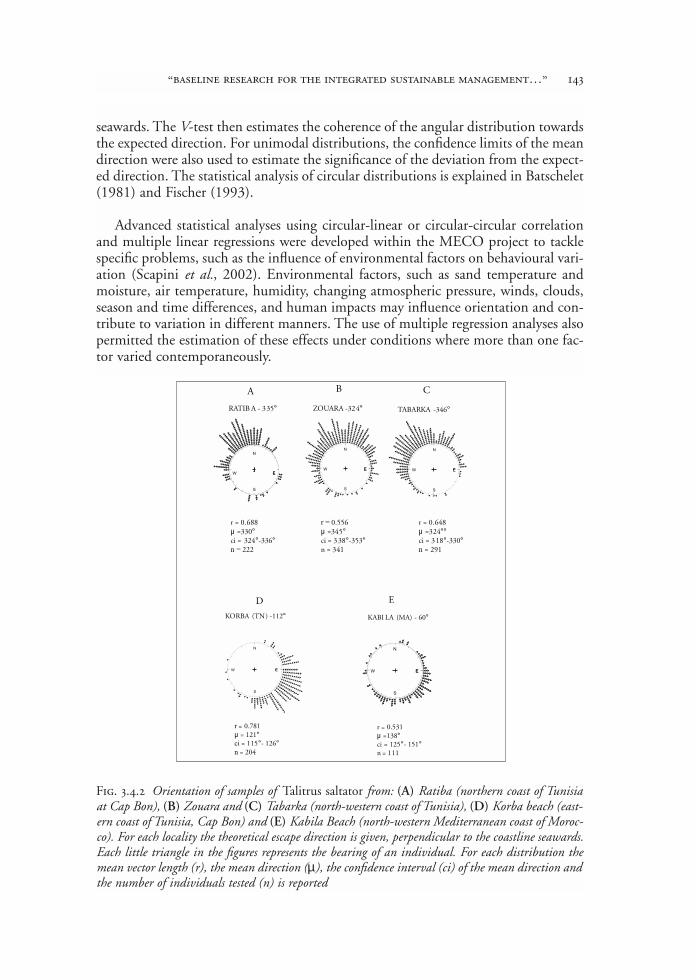
seawards. The V-test then estimates the coherence of the angular distribution towardsthe expected direction. For unimodal distributions, the confidence limits of the meandirection were also used to estimate the significance of the deviation from the expect-ed direction. The statistical analysis of circular distributions is explained in Batschelet(1981) and Fischer (1993).
Advanced statistical analyses using circular-linear or circular-circular correlationand multiple linear regressions were developed within the MECO project to tacklespecific problems, such as the influence of environmental factors on behavioural vari-ation (Scapini et al., 2002). Environmental factors, such as sand temperature andmoisture, air temperature, humidity, changing atmospheric pressure, winds, clouds,season and time differences, and human impacts may influence orientation and con-tribute to variation in different manners. The use of multiple regression analyses alsopermitted the estimation of these effects under conditions where more than one fac-tor varied contemporaneously.
“baseline research for the integrated sustainable management…” 143
E
N
W
S
EE
N
W
S
EE
N
W
S
E
RATIB A - 335° ZOUARA -324° TABARKA -346°
r = 0.688µ =330°ci = 324°-336°n = 222
r = 0.648µ =324°°ci = 318°-330°n = 291
r = 0.556µ =345°ci = 338°-353°n = 341
A B C
E
N
W
S
E E
N
W
S
E
KORBA (TN) - 112° KABI LA (MA) - 60°
r = 0.781µ = 121°ci = 115°- 126°n = 204
r = 0.531µ =138°ci = 125°- 151°n = 111
D E
Fig. 3.4.2 Orientation of samples of Talitrus saltator from: (A) Ratiba (northern coast of Tunisiaat Cap Bon), (B) Zouara and (C) Tabarka (north-western coast of Tunisia), (D) Korba beach (east-ern coast of Tunisia, Cap Bon) and (E) Kabila Beach (north-western Mediterranean coast of Moroc-co). For each locality the theoretical escape direction is given, perpendicular to the coastline seawards.Each little triangle in the figures represents the bearing of an individual. For each distribution themean vector length (r), the mean direction (µ), the confidence interval (ci) of the mean direction andthe number of individuals tested (n) is reported

d. Results of orientation experiments and discussionWithin the MECO programme, the bioassay based on variation in orientation has
been used to compare populations of Talitrus saltator in Tunisia, at Tabarka, Zouara,Ratiba and Korba, and in Morocco at the Kabila beach in front of the Smir lagoon(Fig. 3.4.2). Further populations of related talitrid species (Talorchestia deshayesii,Orchestia montagui, O. stephenseni) have also been studied at the Maltese Islands andKneiss Islands (not reported here).
The distributions of North-African talitrids show a general orientation towardsthe sea in all the populations tested. This is shown by the high frequencies of indi-vidual angular choices in directions near the expected direction perpendicular to theshoreline seawards.
The highest concentration was shown by the population from the coast of Korba(Fig. 3.4.2D), with r = 0.781, i.e. close to 1 and statistically highly significant(Rayleigh-test). The worst orientation was shown by the Kabila (Fig. 3.4.2E) popu-lation with r = 0.531. Even so, this was still statistically significant.
The comparison of the mean directions of the angular distributions with theexpected direction was carried out using the confidence interval (ci ) of the meandirection. All the populations showed deviations from the exact seaward direction.The most evident was the deviation shown by the Kabila population, the smallest wasshown by Ratiba population. This test may fail to show a significant deviation whenthe distribution is scattered.
The results of the North African populations obtained above may be interpreted interms of beach stability versus changing coastline, confirming similar results obtainedby Scapini et al. (1995) in Italian sandhoppers. According to the bioassay, Ratiba andKorba, both from Cap Bon beaches, however differently oriented, have the most stablecoastline. In fact their orientation is more consistent towards the direction of the sea.At Tabarka and Zouara the coastline is changing. Tabarka beach has been recentlyaffected by development for tourism development, and Zouara is subject to erosion bythe sea (see sections 2.1 and 2.3). The sandhoppers from Tabarka showed a high devi-ation from the sea direction, and were apparently maladapted. Zouara sandhopperswere more scattered than those of Tabarka, and were adapted to re-gain the moist sandin different directions. This behavioural flexibility was frequently observed on changingbeaches (Scapini and Fasinella, 1990). Similarly, Kabila beach at Smir has been severe-ly impacted by the construction of a marina. The effect of the recent change of shore-line direction is shown by the deviation of the mean direction chosen by Talitrus salta-tor from the expected direction seawards.
e. Analysis of factors influencing orientation using multiple regressionThe examples shown in Fig. 3.4.2 were results of experiments conducted under con-
trolled conditions using an arena on the beach, with landscape view screened off, in latespring-summer and in warm sunny days. Under such conditions, when freshly collect-ed adult individuals are tested, a consistent orientation seawards is expected, whichwould allow the animals to recover the moist sand near the waterline. But, when the
144 techniques for ecological characterization of sites and eco-audits
experiments are conducted under changing meteorological conditions, in different sea-sons or using individuals of various sizes and belonging to different species, a carefulanalysis of the combined effect of different factors should be carried out. This methodwould permit quantification of the effect of environmental (changing) factors, particu-larly coastline stability that is of interest for monitoring purposes.
In the framework of the MECO programme, multiple regression analyses wereadapted for orientation data and applied to large data sets from experiments con-ducted on Zouara beach in two seasons (April and October), at different times of theday, under varying meteorological conditions, on two talitrid species, Talitrus saltatorand Talorchestia brito (Scapini et al., 2002).
Regression methods are appropriate to study the dependence of the direction ona set of possible influencing variables, and are important to study the associationswith the variables, allowing for the presence of other concomitant variables. The useof models permits better interpretation of behavioural variation in the field, and theestimation of the effect of single factors affecting orientation, which under naturalconditions cannot be separated from other environmental and intrinsic factors. Sta-tistical analysis of the effects of factors on the circular response was carried out,assuming a Projected Normal Distribution of the directions, instead of the usual vonMises pattern (used for example in the Rayleigh and V tests mentioned above). TheSpherically Projected Multivariate Linear Model (SPML) of Presnell et al. (1998) wasused. This is a parametric model, which assumes that the directions in every combi-nation of the factors are distributed as Projected Normals, i.e. like the projectionsonto the unit circle of a bivariate standard normal distribution. The Projected Nor-mal Distribution can be parameterised with the mean vector of the bivariate normaldistribution. This is intended as a latent point of the plane whose polar co-ordinatesindicate (a) the mean direction (the angle made by the vector) and (b) the concen-tration around this direction (the length of the vector), the further the point from theorigin the more concentrated the response.
The model then assumes that the position of the mean of the bivariate normal isa function of the explanatory variables. Both the mean direction and the mean result-ant length depend on the explanatory variables (predictors). When all the explanato-ry variables are qualitative (i.e. factors) the model is analogous to a multiway analy-sis of variance model with or without interactions. A model with the full set of inter-actions specifies a different Projected Normal Distribution for each combination ofthe levels of the factors. This model obviously can have a huge number of parameters(two for each cell) and thus simpler models can be advantageous if they do not devi-ate significantly from it. The models are fitted by maximum likelihood using the EMalgorithm (see Presnell et al., 1998 for the details).
One of the advantages of the method proposed is the possibility of exploringmany models including a large number of main effects and interactions. This involvesa model selection stage in the analysis, in which several models are compared. Themain strategy is to start from a reasonably large model and to simplify it by backwardselection. All tests are based on the likelihood ratio statistic, with the relevant nullasymptotic chi square distribution. However, the choice of a final parsimonious mod-el is based on the Akaike information criterion (AIC ) defined by AIC = -2 l + 2 p
“baseline research for the integrated sustainable management…” 145
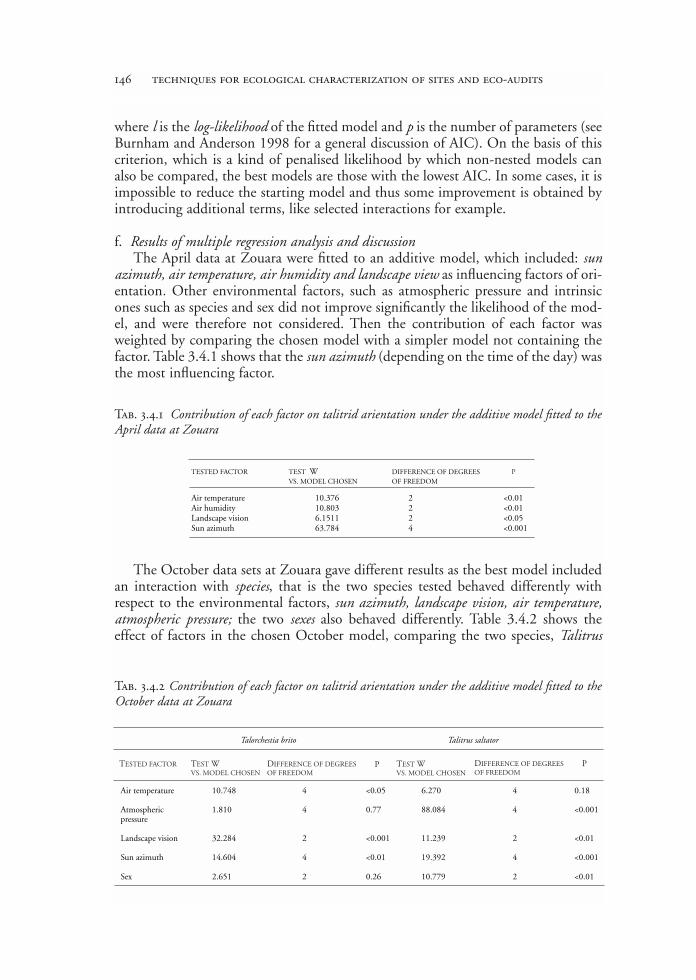
where l is the log-likelihood of the fitted model and p is the number of parameters (seeBurnham and Anderson 1998 for a general discussion of AIC). On the basis of thiscriterion, which is a kind of penalised likelihood by which non-nested models canalso be compared, the best models are those with the lowest AIC. In some cases, it isimpossible to reduce the starting model and thus some improvement is obtained byintroducing additional terms, like selected interactions for example.
f. Results of multiple regression analysis and discussionThe April data at Zouara were fitted to an additive model, which included: sun
azimuth, air temperature, air humidity and landscape view as influencing factors of ori-entation. Other environmental factors, such as atmospheric pressure and intrinsicones such as species and sex did not improve significantly the likelihood of the mod-el, and were therefore not considered. Then the contribution of each factor wasweighted by comparing the chosen model with a simpler model not containing thefactor. Table 3.4.1 shows that the sun azimuth (depending on the time of the day) wasthe most influencing factor.
The October data sets at Zouara gave different results as the best model includedan interaction with species, that is the two species tested behaved differently withrespect to the environmental factors, sun azimuth, landscape vision, air temperature,atmospheric pressure; the two sexes also behaved differently. Table 3.4.2 shows theeffect of factors in the chosen October model, comparing the two species, Talitrus
146 techniques for ecological characterization of sites and eco-audits
TESTED FACTOR TEST WVS. MODEL CHOSEN
DIFFERENCE OF DEGREES OF FREEDOM
Air temperature 10.376 2 <0.01Air humidity 10.803 2 <0.01Landscape vision 6.1511 2 <0.05Sun azimuth 63.784 4 <0.001
P
Tab. 3.4.1 Contribution of each factor on talitrid arientation under the additive model fitted to theApril data at Zouara
Tab. 3.4.2 Contribution of each factor on talitrid arientation under the additive model fitted to theOctober data at Zouara
Talorchestia brito Talitrus saltator
Air temperature 10.748 4 <0.05 6.270 4 0.18
Atmosphericpressure
1.810 4 0.77 88.084 4 <0.001
Landscape vision 32.284 2 <0.001 11.239 2 <0.01
Sun azimuth 14.604 4 <0.01 19.392 4 <0.001
Sex 2.651 2 0.26 10.779 2 <0.01
TESTED FACTOR TEST WVS. MODEL CHOSEN
DIFFERENCE OF DEGREESOF FREEDOM
P TEST WVS. MODEL CHOSEN
DIFFERENCE OF DEGREESOF FREEDOM
P
saltator and Talorchestia brito . The comparison is reported with a simpler model notcontaining the factor.
For Talorchestia brito, air pressure and sex were influencing factors and landscapevision resulted the most important factors, while Talitrus saltator was not influenced bytemperature changes, but reacted to the atmospheric pressure changes, to landscape visionand sun azimuth.
This method permits the quantification of the effect of single environmental fac-tors of orientation when these are presented together, as is usually the case in fieldexperiments. The method can therefore be proposed in the analysis of bioassays of thequality of a beach, when one of the factors is an impact.
The results presented above also show how carefully the evaluation of the bioas-say must be conducted, as several changing factors could influence orientation. Theideal situation would be to carry out the bioassays based on behaviour under the sameenvironmental conditions, i.e. in the same season, at the same time of the day, withthe same weather, using only one species and possibly one sex or age class. Then theimpact factor under test only should vary.
g. SupportEquipment: 1) a custom-built orientation chamber, to be made from the model
of Figure 3.4.1 and available from Prof. F. Scapini (University of Florence; [email protected]); 2) plastic containers for keeping the animals prior to testing; 3)tubes with alcohol to store a few samples to check species identification later; 4) mag-netic compass to orient the chamber; 5) thermometer and hygrometer.
Software: self-made packages for the calculation of circular statistics and the S-Plusfunctions to fit the multiple regression models are available at request (Prof. G.M. Mar-chetti, University of Florence; [email protected])
Expertise: 1) species identification – easy after training; 2) conduction of the orien-tation tests – easy after training; 3) calculation of relevant statistics – easy with the pack-ages available; 3) interpretation of results – comparison with existing database is needed.
Database from the MECO will be made at disposal of interested persons, in: Flo-rence (Prof. F. Scapini) and Tunis (Prof. F. Charfi and M. El Gtari); see also referencesbelow.
h. ReferencesBatschelet E. (1981) Circular statistics in biology, Academic Press, London.Borgioli C., Marchetti G.M., Scapini F. (1999) Variation of zonal recovery in four Talitrus salta-
tor populations from different coastlines: a comparison of the orientation in the field and inan experimental arena. Behavioural Ecology and Sociobiology 45: 79-85.
Burnham K.P. and Anderson D.R. (1998) Model selection and inference, Springer Verlag, New York.Fisher N.I. (1993) Statistical analysis of circular data, Cambridge University Press, Cambridge Presnell B., Morrison S.P., Littel R.C. (1998) Projected multivariate linear models for direc-
tional data. J. Amer. Stat. Ass. 93, 443:1068-1077.
“baseline research for the integrated sustainable management…” 147
Scapini F. (1999) Tendances initiales et ajustement des systèmes d’orientation chez les talitres.In: Gervet J. e Pratte M. (eds) Eléments d’éthologie cognitive, Hermes, Paris, 1999: 143-161.
Scapini F., Aloia A., Bouslama M.F., Chelazzi L., Colombini I., ElGtari M., Fallaci M., Mar-chetti G.M. (2002) Multiple regression analysis of the sources of variation in orientation oftwo sympatric sandhoppers, Talitrus saltator and Talorchestia brito, from an exposed Mediter-ranean beach. Behavioural Ecology and Sociobiology.
Scapini F., Audoglio M., Chelazzi L., Colombini I., Fallaci M. (1997) Astronomical, landscapeand climatic factors influencing oriented movements of Talitrus saltator in nature. MarineBiology 128: 63-72.
Scapini F., Buiatti M., De Matthaeis E., Mattoccia M. (1995) Orientation behaviour and het-erozygosity of sandhopper populations in relation to stability of beach environments. Journalof Evolutionary Biology 8: 43-52.
Scapini F. and Fasinella D. (1990) Genetic determination and plasticity in the sun orientationof natural populations of Talitrus saltator. Marine Biology 107: 141-145.
3.4.2 Variation in the period of the biological clock(Mariella Nardi and Elfed Morgan)
a. RationaleTalitrus saltator is a semi-terrestrial animal, which respires branchially and is easily
subjected to dehydration. Foraging is performed mainly at night, when the animals leavethe sand where they remain burrowed during the day, and migrate along the shore insearch for food. These nightly migratory excursions are endogenous, in that they persistfor some weeks under constant conditions in the laboratory, when they coincide with theexpected night. The mean period of this activity rhythm approximates closely to the 24hours of the solar day, although variation occurs between individuals and populations.
Variation may be derived from non optimal adaptation, as in the case of changingenvironmental conditions, or from individual adaptation to specific local features. Thisvariation may be used to estimate the stability of the sand beach ecosystem.
b. A case study - ProcedureThe animals to be used for the activity rhythm recording experiments were col-
lected on the beaches of San Rossore – Pisa (43° 50’ N – 10° 20’ E) and Castiglionedella Pescaia (42° 46’ N – 10° 53’ E) along the Tuscan coast of Italy. These two sandybeaches differ in coastline dynamics (eroded versus dynamically stable) and use(inside a natural park versus freely used and cleaned for leisure) (see Fig. 3.4.3A andB). They thus provide two different environments, which can highlight intra-popu-lation and inter-population variation.
Animals collected from the shore by hand were transported to the laboratory in athermally insulated container containing sand from the site of collection.
Sand from the collection site, finger sifted to remove unwanted animals, wasplaced to a depth of about 2 cm in each of the 16 recording chambers (see Fig.3.4.4).
The chambers were of annular design, 16 cm high with internal and external
148 techniques for ecological characterization of sites and eco-audits

diameters of 9 and 12 cm respectively. An infrared beam spanned the radius of theannulus across a small bridge on the surface of the sand. When broken by the testanimals, this caused an event to be registered on a data logging device which down-loaded to a computer the number of interruptions of each beam as a separate chan-nel, every 20 minutes throughout the experiment. A single animal was added to eachchamber, which was then covered with a sheet of polythene, secured by a rubberband. This maintained the air humidity inside the chambers at suitable levels for theanimals. The animals inside the chambers were also provided with dry fish food.
Activity was monitored using the equipment described and shown in Fig. 3.4.4.The animals were kept in a light-dark cycle approximating to that of the natural day-night cycle at the time of collection for the first 7 days of recording so that they could
“baseline research for the integrated sustainable management…” 149
Fig. 3.4.3 The two beaches in which sandhoppers were collected for this study: (A) San Rossore –Pisa. (B) Castiglione della Pescaia – Grosseto (Italy)
a b
Fig. 3.4.4 Recording chambers used for the analysis of activity rhythm of Talitrus saltator. A singleanimal was added to each chamber, which was then covered with a sheet of polythene, secured by arubber band. 01. Amplifier – logger; 02. Recording chambers; 03. Connection to the interface; 04.Interface; 05. Connection to the PC outside the controlled environment cabinet
settle into the experimental conditions. They were then transferred to constant dark-ness for at least another week of recording. The experiments were carried out in acontrolled environment room where the temperature was maintained constant at15°± 1°C throughout.
The data of the locomotor activity of the animals recorded by the computer wereanalysed using a software package developed within the MECO programme. The peri-od of the rhythm was then detected by time series analysis, using the periodogram tech-niques. This method of analysis is based on the Whittaker periodogram, and involvesconverting the data into a Buys – Ballot table from which table column mean and thestandard deviation of the columns means are calculated giving the form estimates for theperiod scanned. The means divided by the standard deviation of the whole series give acorrelation ratio that, when plotted against the period, gives the basic periodogram. Theconfidence levels are calculated using the following formula:
Fs (f1, f2 )qs
2 = [p (m - 1) / p - 1] + Fs (f1, f2 )
where: qs = level of significancep = periodm = number of columnsFs = FRACTILE of F distribution
The variance of the mean period was calculated for each population. Differencesbetween populations were calculated using the non-parametric Wilcoxon rank-sum test.
c. Results and interpretationThe behaviour of the animals in the recording chambers may vary considerably.
Some remain inactive throughout the recording session, others may show a clear andpersistent rhythm of locomotor activity, and diverse patterns may be found betweenthese two extremes. In the light-dark cycle, activity is primarily nocturnal, but maydrift out of phase with the time of expected dark when in constant darkness, as theperiod of the internal clock deviates from that of the 24 hours day.
Data are conventionally plotted as an actogram (Fig. 3.4.5). This shows the activ-ity of each individual, recorded over successive 20 minutes intervals during each day.In the present study the level of activity in each 20 minute period has been expressedas a percentage of the highest value recorded during the 24 h of the solar day. Dailyrecords are plotted twice, to the right and again below, to facilitate interpretation. Anexamination of the actograms by eye is the first analysis of the level of variation in thepatterns of activity showed by the sandhoppers. Examples of actograms obtainedwith animals from the populations of San Rossore and Castiglione della Pescaia areshown in Fig. 3.4.5 and 3.4.6 respectively. The differences between individuals areevident for each population. Some animals showed activity well synchronised withthe light-dark regimen and free-ran in constant darkness with a clear period longerthan 24 hours (Fig. 3.4.5A and 3.4.6A-B). Other animals showed an irregularactivity pattern which was much disturbed by noise (Fig. 3.4.5B and 3.4.6C-D).
150 techniques for ecological characterization of sites and eco-audits
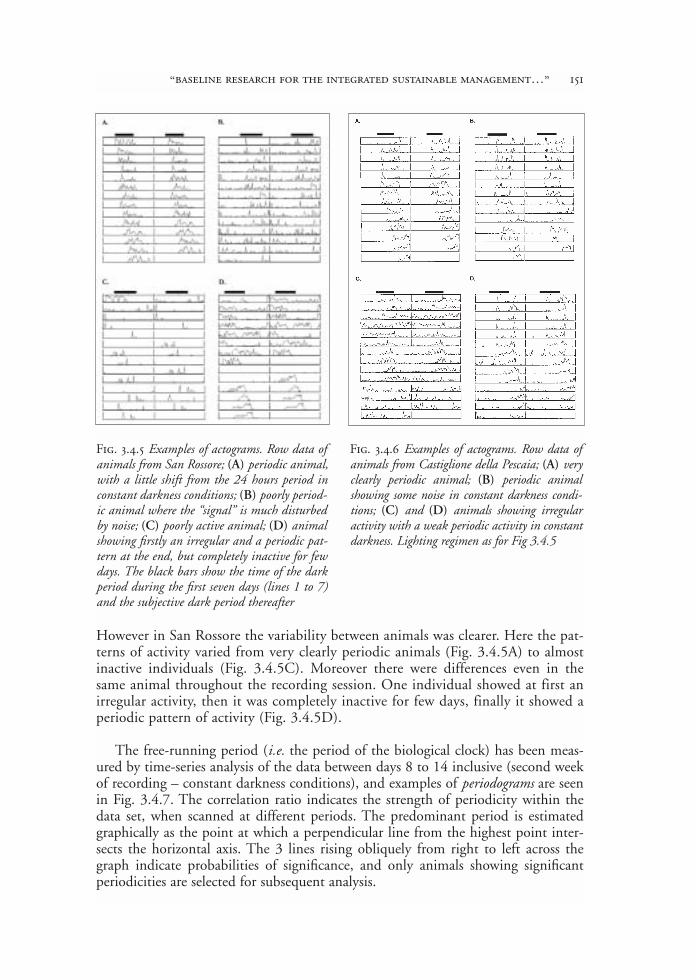
However in San Rossore the variability between animals was clearer. Here the pat-terns of activity varied from very clearly periodic animals (Fig. 3.4.5A) to almostinactive individuals (Fig. 3.4.5C). Moreover there were differences even in thesame animal throughout the recording session. One individual showed at first anirregular activity, then it was completely inactive for few days, finally it showed aperiodic pattern of activity (Fig. 3.4.5D).
The free-running period (i.e. the period of the biological clock) has been meas-ured by time-series analysis of the data between days 8 to 14 inclusive (second weekof recording – constant darkness conditions), and examples of periodograms are seenin Fig. 3.4.7. The correlation ratio indicates the strength of periodicity within thedata set, when scanned at different periods. The predominant period is estimatedgraphically as the point at which a perpendicular line from the highest point inter-sects the horizontal axis. The 3 lines rising obliquely from right to left across thegraph indicate probabilities of significance, and only animals showing significantperiodicities are selected for subsequent analysis.
“baseline research for the integrated sustainable management…” 151
Fig. 3.4.5 Examples of actograms. Row data ofanimals from San Rossore; (A) periodic animal,with a little shift from the 24 hours period inconstant darkness conditions; (B) poorly period-ic animal where the “signal” is much disturbedby noise; (C) poorly active animal; (D) animalshowing firstly an irregular and a periodic pat-tern at the end, but completely inactive for fewdays. The black bars show the time of the darkperiod during the first seven days (lines 1 to 7)and the subjective dark period thereafter
Fig. 3.4.6 Examples of actograms. Row data ofanimals from Castiglione della Pescaia; (A) veryclearly periodic animal; (B) periodic animalshowing some noise in constant darkness condi-tions; (C) and (D) animals showing irregularactivity with a weak periodic activity in constantdarkness. Lighting regimen as for Fig 3.4.5
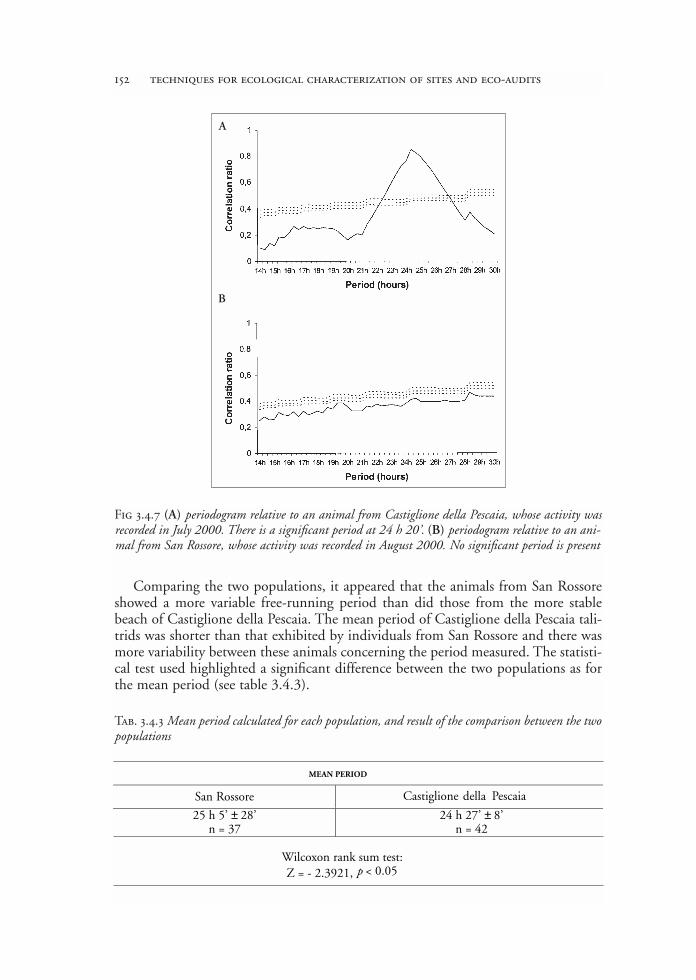
Comparing the two populations, it appeared that the animals from San Rossoreshowed a more variable free-running period than did those from the more stablebeach of Castiglione della Pescaia. The mean period of Castiglione della Pescaia tali-trids was shorter than that exhibited by individuals from San Rossore and there wasmore variability between these animals concerning the period measured. The statisti-cal test used highlighted a significant difference between the two populations as forthe mean period (see table 3.4.3).
152 techniques for ecological characterization of sites and eco-audits
Fig 3.4.7 (A) periodogram relative to an animal from Castiglione della Pescaia, whose activity wasrecorded in July 2000. There is a significant period at 24 h 20’. (B) periodogram relative to an ani-mal from San Rossore, whose activity was recorded in August 2000. No significant period is present
A
B
Tab. 3.4.3 Mean period calculated for each population, and result of the comparison between the twopopulations
MEAN PERIOD
San Rossore Castiglione della Pescaia
25 h 5’ ± 28’n = 37
24 h 27’ ± 8’n = 42
Wilcoxon rank sum test:Z = - 2.3921, p < 0.05
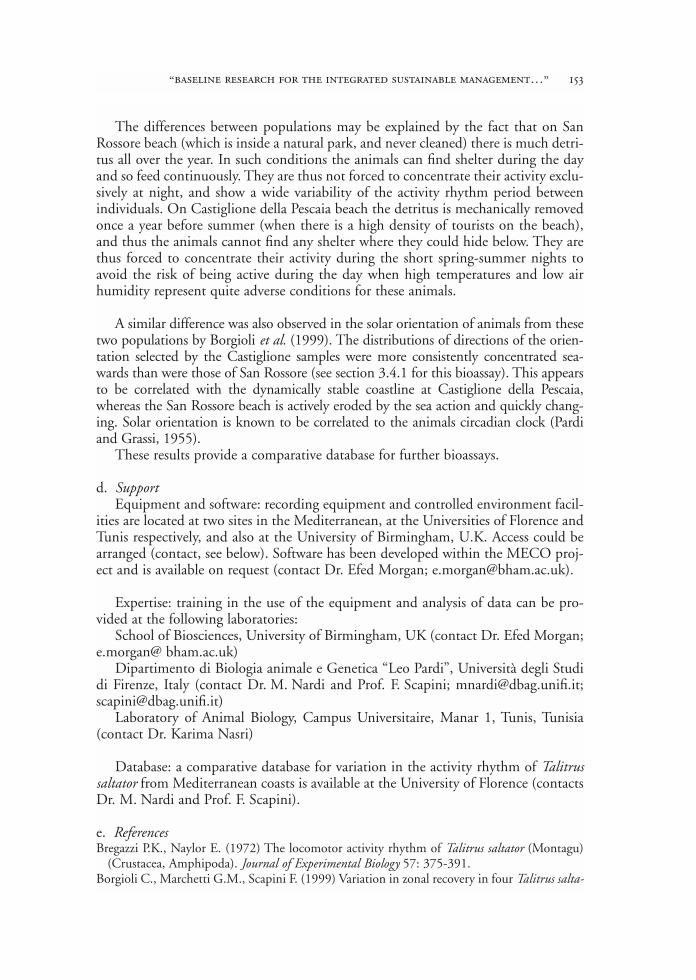
The differences between populations may be explained by the fact that on SanRossore beach (which is inside a natural park, and never cleaned) there is much detri-tus all over the year. In such conditions the animals can find shelter during the dayand so feed continuously. They are thus not forced to concentrate their activity exclu-sively at night, and show a wide variability of the activity rhythm period betweenindividuals. On Castiglione della Pescaia beach the detritus is mechanically removedonce a year before summer (when there is a high density of tourists on the beach),and thus the animals cannot find any shelter where they could hide below. They arethus forced to concentrate their activity during the short spring-summer nights toavoid the risk of being active during the day when high temperatures and low airhumidity represent quite adverse conditions for these animals.
A similar difference was also observed in the solar orientation of animals from thesetwo populations by Borgioli et al. (1999). The distributions of directions of the orien-tation selected by the Castiglione samples were more consistently concentrated sea-wards than were those of San Rossore (see section 3.4.1 for this bioassay). This appearsto be correlated with the dynamically stable coastline at Castiglione della Pescaia,whereas the San Rossore beach is actively eroded by the sea action and quickly chang-ing. Solar orientation is known to be correlated to the animals circadian clock (Pardiand Grassi, 1955).
These results provide a comparative database for further bioassays.
d. SupportEquipment and software: recording equipment and controlled environment facil-
ities are located at two sites in the Mediterranean, at the Universities of Florence andTunis respectively, and also at the University of Birmingham, U.K. Access could bearranged (contact, see below). Software has been developed within the MECO proj-ect and is available on request (contact Dr. Efed Morgan; [email protected]).
Expertise: training in the use of the equipment and analysis of data can be pro-vided at the following laboratories:
School of Biosciences, University of Birmingham, UK (contact Dr. Efed Morgan;e.morgan@ bham.ac.uk)
Dipartimento di Biologia animale e Genetica “Leo Pardi”, Università degli Studidi Firenze, Italy (contact Dr. M. Nardi and Prof. F. Scapini; [email protected];[email protected])
Laboratory of Animal Biology, Campus Universitaire, Manar 1, Tunis, Tunisia(contact Dr. Karima Nasri)
Database: a comparative database for variation in the activity rhythm of Talitrussaltator from Mediterranean coasts is available at the University of Florence (contactsDr. M. Nardi and Prof. F. Scapini).
e. ReferencesBregazzi P.K., Naylor E. (1972) The locomotor activity rhythm of Talitrus saltator (Montagu)
(Crustacea, Amphipoda). Journal of Experimental Biology 57: 375-391.Borgioli C., Marchetti G.M., Scapini F. (1999) Variation in zonal recovery in four Talitrus salta-
“baseline research for the integrated sustainable management…” 153
tor populations from different coastlines: a comparison of orientation in the field and in anexperimental arena. Behavioural Ecology and Sociobiology 45: 79-85.
Kennedy F., Naylor E., Jaramillo E. (2000) Ontogenetic differences in the circadian locomotoractivity rhythm of the talitrid amphipod crustacean Orchestoidea tubercolata. Marine Biology137: 511-517.
Morgan E., Minors D.S. (1995) The analysis of Biological Time-Series Data: some PreliminaryConsiderations. Biological Rhythm Research 26: 124-148.
Pardi L., Grassi M. (1955) Experimental modifications of direction-finding in Talitrus saltator(Montagu) (Crustacea; Amphipoda). Naturwissenschaften 39: 262-263.
Scapini F., Chelazzi L., Colombini I., Fallaci M. (1992) Surface activity, zonation and migra-tion of Talitrus saltator on a Mediterranean beach. Marine Biology 112: 573-581.
Williams J.A. (1980a) Environmental influence on the locomotor activity rhythm of Talitrussaltator (Crustacea: Amphipoda). Marine Biology 57: 7-16.
Williams J.A. (1980b) The effect of dusk and dawn on the locomotor activity rhythm of Talitrussaltator (Montagu) (Crustacea; Amphipoda). Journal of Experimental Marine Biology and Ecolo-gy 42: 285-297.
Williams J.A. (1980c) The light-response rhythm and seasonal entrainment of the endogenouscircadian locomotor rhythm of Talitrus saltator (Crustacea: Amphipoda). Journal of theMarine Biological Association of the UK 60: 773-785.
Williams J.A. (1983a) Environmental regulations of the burrow depth distribution of the sandbeach amphipod Talitrus saltator. Estuarine Coastal and Shelf Science 16: 291-298.
Williams J.A. (1983b) The endogenous locomotor activity rhythm of four supralittoral per-acarid crustaceans. Journal of the Marine Biological Association of the UK 63: 481-492.
Williams J.A. (1995) Burrow-zone distribution of supralittoral amphipod Talitrus saltator onDerbyhaven Beach, Isle of Man: a possible mechanism for regulating desiccation stress? Jour-nal of Crustacean Biology 15: 466-475.
154 techniques for ecological characterization of sites and eco-audits

3.5 integration and interpretationof ecological data at population level
João C. Marques and Pedro Anastácio
Introduction
Populations of key species are usually considered as good biological targets toassess the potential impact of induced environmental changes, namely with regard tolong term responses. In such case, it is particularly suitable to account for their pop-ulation dynamics and reproductive biology.
Arthropods are the predominant group of sand beach fauna. Within this group,talitrid amphipods have usually wide geographic distributions, keeping neverthelessquite sensitive to anthropogenic pressures on coastal environments. Due to its abun-dance and distributional range, Talitrus saltator is usually particularly suitable to eval-uate ecological adaptation and differentiation as a response to different levels of envi-ronmental stress, including human disturbance (section 3.2).
3.5.1 Identifying qualitative inter-site variations through population dynamics studies
From the ecological point of view, the identification of inter-site variationsbetween populations of the same species can be achieved through comparative pop-ulation dynamics studies, including the estimation of energy budgets and its relationto available food sources. From this database, models should be developed to under-stand adaptation to environmental gradients and changing habitats.
a. Scope and objectives of population dynamics studiesStudy sites should be selected from beaches representing different environmental
conditions along the coastline. Climatic factors, geophysical variables, degree of pol-lution, and recreational use must be taken into consideration for comparison. Peri-odic samples should be analysed for population abundance, reproductive period,sex-ratio, fecundity, and survival during development. In the case of Talitrus saltator,recruitment is assumed to be discontinuous. Therefore, tracking recognisable agecohorts may be used to assess field growth rates and life span.
Food abundance from the edge of the sea to the dunes should be estimated wheninvestigating the population dynamics, and different populations should be com-pared throughout the year to account for seasonal variation. An “energy budget ofeach beach” can then be constructed, to investigate the role of local arthropods, in thecase Talitrus saltator, in the degradation of the organic material.
b. Field sampling protocol for Talitrus saltator or other sandhoppers population dynamicsSince the goal is to carry out quantitative sampling on the studied populations,
the samples must be expressed as a function of the sampled area. Additionally, as afunction of the requirements of further analytical techniques, is necessary to collect aminimum of 150 specimens of Talitrus saltator at each sampling date. In fact, this isthe suitable number for modal analysis studies addressing growth and biological fea-tures of the population.
From the shoreline to land, we may distinguish in the beach the intertidal and thesupratidal areas, followed by the primary dunes. Talitrus saltator will be usually moreabundant in the supratidal area. Nevertheless, the zonation of the age and sex classes ofT. saltator varies with climatic conditions (storms) and with the season. For instance, inMediterranean beaches, juveniles tend to appear closer to the shoreline than adults,while the opposite occurs on the French Atlantic coast where there are high tidal excur-sions. On the other hand, during the winter when the climatic gradients are more uni-form, adults can be found scattered on the entire beach up to the top of the dunes.
Moreover, other abundant talitrid populations might be found in the beaches,most probably belonging to the genus Talorchestia and/or Orchestia. Specimens fromthese genera have about the same size as Talitrus and may be superficially confusedby non-trained observers. It will be necessary to pay very much attention to this.
Therefore, for Talitrus saltator, in order to obtain a representative pattern, sam-pling should carried out in the following way:I. Take the samples at regular intervals along transept guidelines, from the shore-
line to the base of the dune, as indicated in Fig. 3.5.1. At least one replicate ofthe transept must be done. Additionally, at the level where the populations werefound more abundant, take more samples randomly, to the left and to the rightof the transepts (see Fig. 3.5.1). This sampling strategy will simultaneously allowto account for differential vertical distribution and to collect the minimum ofindividuals necessary for statistical analysis. Preferentially, sampling periodicityshould be 15 days. On the other hand, rainy days must be avoided, which maycause animals dispersion.
II. Use a metal or wood-square of 0.25 m2 to bound the sampling area. Next, using asmall scoop, remove the first 20 cm of the sand surface layer, where the organismswill most probably be present. Sieve the sand through a 2 mm mesh size, throw-ing it into a rectangular plastic container with high walls and about 5 cm of sea-water add to it. The largest animals will be retained in the sieve. Make sure to avoidanimals from escaping, collecting them immediately into a plastic bottle (withsome water in). The water in the plastic will prevent animals that passed throughthe sieve (juveniles) from escaping. At this point animals will most probably startswimming and may be caught using small hand nets or scoops. The container mayalso be slightly inclined to make the animals crawl out of the water and these couldbe captured with aspirators or with the hand net. Collect all the animals, respect-ing of course the minimum of 150 for Talitrus saltator. If the sediment in the beachconsists predominantly of fine sand, you may alternatively sieve the sand througha 1 mm mesh size net bag, washing the sample within a plastic container filled with
156 techniques for ecological characterization of sites and eco-audits
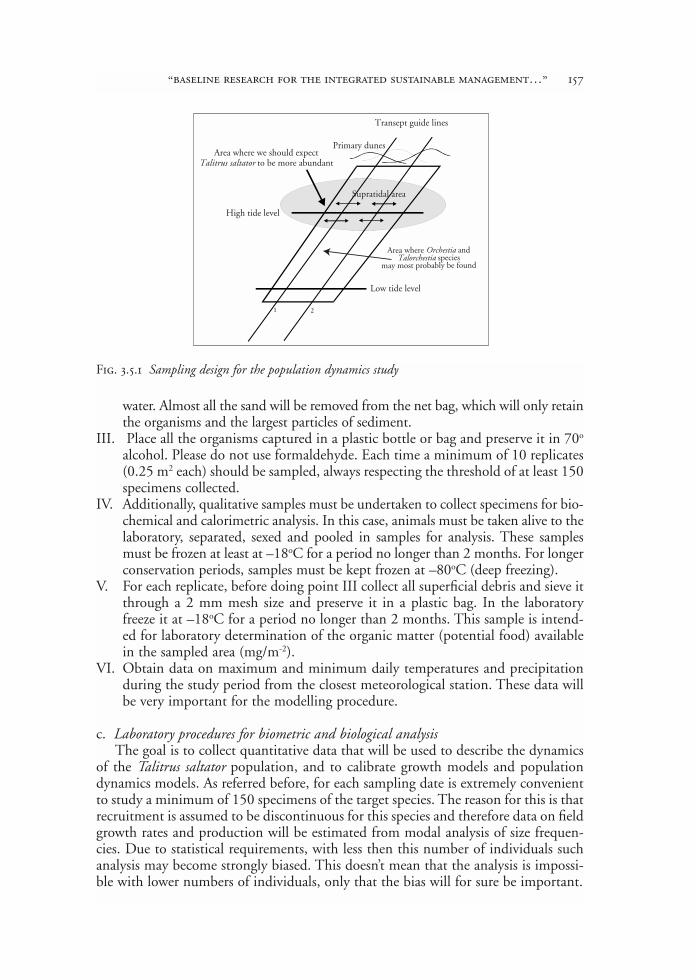
water. Almost all the sand will be removed from the net bag, which will only retainthe organisms and the largest particles of sediment.
III. Place all the organisms captured in a plastic bottle or bag and preserve it in 70o
alcohol. Please do not use formaldehyde. Each time a minimum of 10 replicates(0.25 m2 each) should be sampled, always respecting the threshold of at least 150specimens collected.
IV. Additionally, qualitative samples must be undertaken to collect specimens for bio-chemical and calorimetric analysis. In this case, animals must be taken alive to thelaboratory, separated, sexed and pooled in samples for analysis. These samplesmust be frozen at least at –18oC for a period no longer than 2 months. For longerconservation periods, samples must be kept frozen at –80oC (deep freezing).
V. For each replicate, before doing point III collect all superficial debris and sieve itthrough a 2 mm mesh size and preserve it in a plastic bag. In the laboratoryfreeze it at –18oC for a period no longer than 2 months. This sample is intend-ed for laboratory determination of the organic matter (potential food) availablein the sampled area (mg/m-2).
VI. Obtain data on maximum and minimum daily temperatures and precipitationduring the study period from the closest meteorological station. These data willbe very important for the modelling procedure.
c. Laboratory procedures for biometric and biological analysisThe goal is to collect quantitative data that will be used to describe the dynamics
of the Talitrus saltator population, and to calibrate growth models and populationdynamics models. As referred before, for each sampling date is extremely convenientto study a minimum of 150 specimens of the target species. The reason for this is thatrecruitment is assumed to be discontinuous for this species and therefore data on fieldgrowth rates and production will be estimated from modal analysis of size frequen-cies. Due to statistical requirements, with less then this number of individuals suchanalysis may become strongly biased. This doesn’t mean that the analysis is impossi-ble with lower numbers of individuals, only that the bias will for sure be important.
“baseline research for the integrated sustainable management…” 157
1 2
Transept guide lines
Primary dunesArea where we should expect
Talitrus saltator to be more abundant
High tide level
Supratidal area
Low tide level
Area where Orchestia andTalorchestia species
may most probably be found
Fig. 3.5.1 Sampling design for the population dynamics study

The laboratory procedure should be as follows:Biometric data: Each individual must be measured for the cephalic length (see
Fig. 3.5.2) using a binocular microscope equipped with a micrometrical ocular lenscalibrated with an objective micrometer. Please be sure to use a correct amplifica-tion to avoid parallax errors (suitable: 25 to 37.5 X for adultes and 50 to 75 X forjuveniles). It is only necessary to measure the cephalic lenght since existing equa-tions to estimate total length from cephalic length (type TL = a CL + b ) might beused.
Each individual, after being measured, must be sexed based on:a) Presence of copulating appendixes - males;b) Presence of oostegites, with or without setae – females;c) If oostegites present setae we may consider the female as mature, meaning that she
will be carrying eggs soon or that she has just come from releasing them;d) Absence of secondary sexual dimorphic features – juveniles.
The individuals may therefore be classified as:a) male;b) resting female;c) mature female;d) juvenile.
If females are carrying eggs in the brood pouch these must be taken, counted andclassified. The classification for the eggs will be as follows:a) Stage A – newly laid eggs grouped and resembling a gelatinous mass;b) Stage B – eggs well separated, internally homogenous;c) Stage C – embryo comma-shape and initiation of pereopods already visible;d) Stage D – constriction of the comma clearly visible, appendages segmented, eyes
visible;e) Stage E – hatched and free juveniles.
3.5.2 Data analysis
a. Length – weight relationshipsTo determine the relationships between length and weight of the individuals,
which will be described with an appropriated equation, at least 150 to 200, random-
158 techniques for ecological characterization of sites and eco-audits
Cephalic lenght(from the extremity of the rostrum
to the base of the head)
Fig. 3.5.2 How to measure the cephalic lenght intalitrids
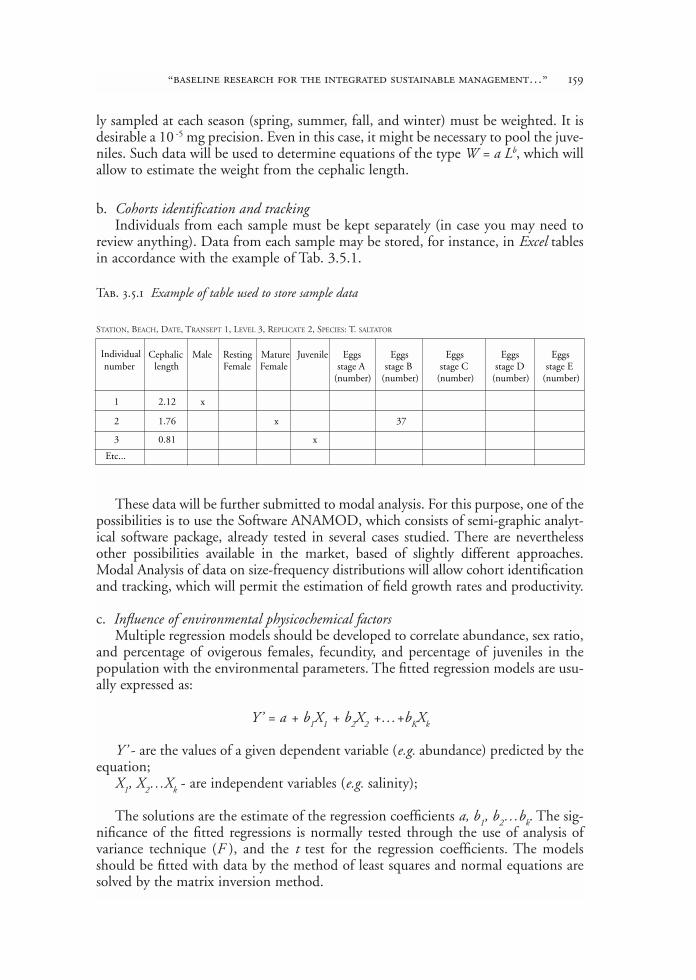
ly sampled at each season (spring, summer, fall, and winter) must be weighted. It isdesirable a 10 -5 mg precision. Even in this case, it might be necessary to pool the juve-niles. Such data will be used to determine equations of the type W = a Lb, which willallow to estimate the weight from the cephalic length.
b. Cohorts identification and trackingIndividuals from each sample must be kept separately (in case you may need to
review anything). Data from each sample may be stored, for instance, in Excel tablesin accordance with the example of Tab. 3.5.1.
These data will be further submitted to modal analysis. For this purpose, one of thepossibilities is to use the Software ANAMOD, which consists of semi-graphic analyt-ical software package, already tested in several cases studied. There are neverthelessother possibilities available in the market, based of slightly different approaches.Modal Analysis of data on size-frequency distributions will allow cohort identificationand tracking, which will permit the estimation of field growth rates and productivity.
c. Influence of environmental physicochemical factorsMultiple regression models should be developed to correlate abundance, sex ratio,
and percentage of ovigerous females, fecundity, and percentage of juveniles in thepopulation with the environmental parameters. The fitted regression models are usu-ally expressed as:
Y’ = a + b1X1 + b2X2 +…+bKXk
Y’ - are the values of a given dependent variable (e.g. abundance) predicted by theequation;
X1, X2…Xk - are independent variables (e.g. salinity);
The solutions are the estimate of the regression coefficients a, b1, b2…bk. The sig-nificance of the fitted regressions is normally tested through the use of analysis ofvariance technique (F ), and the t test for the regression coefficients. The modelsshould be fitted with data by the method of least squares and normal equations aresolved by the matrix inversion method.
“baseline research for the integrated sustainable management…” 159
Tab. 3.5.1 Example of table used to store sample data
Individualnumber
Cephaliclength
Male RestingFemale
MatureFemale
Juvenile Eggsstage A
(number)
Eggsstage B
(number)
Eggsstage C
(number)
Eggsstage D
(number)
Eggsstage E
(number)
1 2.12 x
2 1.76 x 37
3 0.81 x
Etc...
STATION, BEACH, DATE, TRANSEPT 1, LEVEL 3, REPLICATE 2, SPECIES: T. SALTATOR
d. Production estimatesProduction estimates was based upon cohort recognition. Growth increments or
production increments (P ) and elimination production (E ) were calculated. Approxi-mate values of P and E for each cohort during a given time interval were expressed as:
P = [(Nt+Nt+1)/2] x (Wt+1-Wt) for Wt+1>Wt
E = [(Wt+Wt+1 )/2] x (Nt-Nt+1) for Nt>Nt+1
N - density of the cohort in each sample date;W - mean individual biomass in each sample date;t and t+1 - consecutive sample dates;
Total values of P and E for each cohort are expressed as:
t=n P = Σ [(Nt+Nt+1 )/2] ∆ W
t=0
t=nE = Σ [(Wt+Wt+1)/2] ∆ N
t=0
Total values of P and E for the population is expressed as:
N N
P = Σ Pcn and Σ = S Ecnn=1 n=1
Pcn and Ecn are the growth and elimination production of the cohort n.
P/B and E/B ratios were determined. B (mean population biomass) is expressed as:
N
B = (1/T) Σ (Bn t)n=1
T - period of study;N - number of successive cohorts in the period T ;Bn - mean biomass of the cohort n ;t - duration of the cohort n.
3.5.3 Modelling sandhoppers population dynamics
A model of Talitrus saltator population dynamics can be used for scenario simula-tions i.e. as a tool to try to predict what would happen if the present conditions
160 techniques for ecological characterization of sites and eco-audits
would change. The coastal line is constantly submitted to both natural and humansources of change and T. saltator will tend to be affected by these changes. Since it isusually present on European beaches, namely along the Mediterranean, they mayserve as an indicator of the prevailing ecological conditions.
In order to build a model two main practical approaches may be used: 1. You canuse programming languages such as (e.g. ) Fortran, Pascal or Visual basic; 2. You canuse one of the many software packages for modelling purposes (e.g. Stella or Matlab).These modelling tools allow build models of the type that will serve the present pur-poses. Dynamic models should be considered in order to simulate populationdynamics. This implies the use of a set of variables defined as a function of time. Ifwe would like to include the effects of the spatial heterogeneity these variables canalso be dependent on space. However a strong heterogeneity should not be expectedon a sandy beach. For modelling purposes a few compartments e.g. representing thelower beach, the upper beach and the dune may suffice or even be unnecessary.
A good rule is to follow the step-by-step modelling procedure. The following stepsshould be highlighted: 1- the construction of a conceptual diagram as shown in Fig.3.5.3. The diagram will give information about the variables and processes includedin the model; 2- equations can then be used to describe the model in a mathemati-cal form; 3- verification will test the internal logic of the model; 4- sensitivity analy-sis will measure the impact that changes on the model will have on the model out-puts. Typically one can test the effects of changes on parameters (e.g. birth rate); 5- acalibration of the parameter values must be performed so that the model producesvalues in accordance with the data used to build it; 6- whenever possible, a validationof the model should be performed. This means checking the model performanceunder other circumstances, e.g. by using data from a nearby area or from a differentyear.
If the reader is familiarized with Leslie matrices or with life tables this may wellhelp to understand the way that most population dynamics models are structured.They are based on the division of the population into several age classes (Fig. 3.5.4),each of them having a certain number of individuals with only a certain numberbeing females. Some specific characteristics are attributable to each age class, usuallymortality rates and fecundity. These characteristics allow the model to calculate howthe population will vary from one time step to the next one. If our time step is oneday the model will calculate the number of individuals of each age class at each dayby using the values on the day before.
The main problem with the previous approach when we are dealing with cru-staceans is the difficulty in identifying the age classes in field samples. There is notyet a safe method for determining the age of the crustaceans. Therefore indirectmethods must be applied. Size and weight are heavily dependent on the age butthey are influenced by the environmental conditions for growth. Size or weight canonly be used to estimate age when a previous sampling program allowed the iden-tification of the cohorts (groups of individuals born approximately at the sametime).
“baseline research for the integrated sustainable management…” 161

162 techniques for ecological characterization of sites and eco-audits
Fig. 3.5.3 Conceptual model: external variables
The dynamics of each age class
M(i) = f (Pred,afdw, food ,T,...) * M(measured)
Age classes
Weight
Fig. 3.5.4 Conceptual model: simulation of the number of animals in each age class and basic struc-ture of the model showing the interactions between different age classes considered as different statevariables
In crustaceans most of the age specific characteristics such as the fecundity or mor-tality can be related to weight or size instead of age. The consequence of this is thatthe modeller is forced to calculate the weight that a certain age class is supposed tohave attained under the growth conditions that it was subjected to.
Overall, the most problematic points about modelling amphipod populationdynamics are a) the need to calculate the average weight of each weight class, b) thedifficulty in identifying the main factors driving reproduction at each location, andc) the quantification of the effects of the external variables such as the weather uponthe dynamics of the species.
3.5.4 Implications for integrated planning and management
Biological and ecological information is of primer importance in terms of envi-ronmental management and planning. As explained above, reproductive biology andpopulation dynamics studies of key stone species is a useful tool to integrate envi-ronmental changes at different time scales. In fact, within certain limits, species tendto cope with environmental changes, and when they are under environmental stress,natural or induced by human activities, their life cycles, production, and energybudgets will reflect it.
Starting from a calibrated population dynamics model, hopefully validated aswell, different scenarios, corresponding to different environmental conditions, maybe accounted for by changing the forcing functions and by changing the modelparameters in accordance. Therefore, taking the studied species, e.g. Talitrus saltator,as representative of the living community (indicator), the state of the system if a giv-en type of change occur may be anticipated. For example, the following questionsmight be approached:
How will the community respond to a significant increase in the number of peo-ple frequenting the beach?
How will the community react to removing the detritus from the beach vs. notdoing it?
Several questions may be raised for a scenario where the sandy beach commu-nity, dominated by detritivores like the sandhoppers, declines or disappears. Forexample:
Will the sanitary quality of sand be affected since the detritus will not beprocessed by detritivores but simply decomposed by microorganisms?
Will the birds’ community be affected by the probable reduction of available foodsources?
Such questions, of obvious importance in terms of managing and planning may,in a certain extent, be approached through model simulations, which appear there-fore as a powerful tool.
“baseline research for the integrated sustainable management…” 163

3.5.5 Necessary support - Expertise
To develop the actions described in this chapter, the following expertise and facil-ities will be necessary:
– Linear Statistics and Modal Analysis techniques;– Development of population dynamics models;– Training regarding acquisition of the necessary know-how may be obtained in a
number of Institutions. In the scope of the MECO project team the laboratorythat can provide this knowledge is IMAR – Institute of Marine Research, Coim-bra Interdisciplinary Centre, Portugal.
3.5.6 References
Anastácio P.M., Nielsen S.N. and Marques J.C. (1999) CRISP (Crayfish and Rice IntegratedSystem of Production): 1. Modelling crayfish (Procambarus clarkii) population dynamics. Eco-logical modelling 123(1): 5-16.
Jorgensen S.E. (1994) Fundamentals of ecological modelling, Amsterdam, Elsevier, 628 pages.Renshaw E. (1991) Modelling biological populations in space and time, Cambridge University
Press, 403 pages.
164 techniques for ecological characterization of sites and eco-audits

3.6 general evaluation of bioassays
Felicita Scapini
Several different methods have been described in this chapter, which have provedtheir validity to assess the state of sandy beach ecosystems. However, their applicationmay appear difficult for non scientists. There also appears some redundancy of meth-ods proposed. Why should a monitoring programme include more than one bio-assay? Why should it include bioassays at all?
Let’s start from the last question. If a management plan is to be planned that takesthe ecosystem into account and its sustainability, the possible impacts of the meas-ures on ecosystem degradation/equilibrium have to be monitored regularly. Bio-assays can be included in the monitoring programme, as they are repeatable and givequantitative results for comparison. Then the change in the ecosystem quality causedby the measures taken in the management plan can be estimated. Bioassays can alsobe used to compare environments subject to different degrees of impacts.
In particular, the bioassays based on genetic variation (section 3.3) permit us toestimate molecular variation directly linked to biodiversity (this concept is discussedin section 1.3). Bioassays based on genetic diversity are frequently used for differentpurposes, in agronomy and conservation of wild animal populations. We proposehere their application for the evaluation of degrade of beach ecosystems. Two exam-ples of application on animal and plant species are given, which are common in sandybeach ecosystems and can be applied to similar cases. The levels of variation in thespecies analysed could be used as reference for further analyses and comparisons. Forthe application of these bioassays a laboratory equipped for bio-molecular analyses isneeded, which can be found in most universities in the Mediterranean region.
Measures of diversity at the species level (section 3.1) have been widely used toprovide a baseline for conservation purposes and management of natural parks. Fora correct application of this kind of bioassay in a comparative context, the samplingstrategy and the expertise in the species identification are critical points, which couldhamper the use of this tool in a monitoring programme. Repeatable methods of easyapplication are proposed here. These methods are not expensive, but time consum-ing. Specific expertise will be needed in the analysis phase.
Similar considerations as above can be made for the bioassay based on the analy-sis of the population dynamics of a key species and modelling (section 3.5). The sam-pling necessary, although not expensive, is time consuming, and specific expertise will
be needed for the analysis. Modelling will also permit us to make predictions on thetrends.
The bioassays based on behavioural variation (section 3.4) are here proposed forthe first time. In principle, they estimate within species variation for beach manage-ment purpose, similarly to the genetic and population dynamics analyses. But theapplication of behavioural bioassays has the advantages of simplicity and speed.Experiments of orientation (section 3.4.1) of a key species can be made on site, andthe animals tested can then be released. On the other hand, experiments of activityrhythms (section 3.4.2) have the advantage of automatic recording and logging. Theprototype chambers, recording and logging system developed within the MECOproject can be easily reproduced by an equipped electronics workshop. The methodsof analysis of data proposed here are of easy application. The disadvantage of themethod is the lack of background that could be used as reference or baseline for com-parison.
It follows that not one optimal bioassay exists to be directly included in the mon-itoring programme of a management plan of sensitive coastal environments. Thestrategy of using more than one, at least two, independent bioassays, would thus beuseful, increasing the power of both. Such a strategy was applied within the MECOproject and worked efficiently. An important recommendation is that the two differ-ent bioassays should be applied independently, ideally by two different teams. Thestrategy would then be to start more than one independent monitoring program atthe same site to estimate the impacts of the management measures. The applicationof different methods would both permit a reciprocal control, and highlight changesat different levels of integration and of different “grain size”, spatial and time scales.
166 techniques for ecological characterization of sites and eco-audits
chapter 4
socio-economic analysis of sites

4.1 indicators of change
Alison Caffyn, Bob Prosser and Guy Jobbins
In order to develop management strategies and techniques to respond to the wide-ranging human impacts discussed in section 1.4, an adequate information base isrequired. Managers need relevant information so that they can monitor the site andmake decisions about management actions they may deem necessary. This chapteraims to give an overview of the types of information that may be relevant for man-agement of coastal and beach locations. It discusses how identifying indicators ofchange for important aspects and impacts should provide relevant information. Thechapter then gives some examples of the types of method which may be useful formonitoring specific socio-economic indicators (section 4.2). Finally the need for inte-grated and wide-ranging assessments of the environmental, social and economic sec-tors is proposed (Chapter 6).
Monitoring has been defined as “the process of repetitive observations of one ormore elements of the environment, for defined purposes, according to prearrangedschedules in space and time and using comparable methodologies for environmentalsensing and data collection” (Van der Meulen and Janssen, 1992:517). In this con-text ‘environment’ should be interpreted as not only the natural environment but alsothe built environment, economic environment and socio-cultural environment.
The elements of the environment to be monitored can be used as indicators ofchange. An indicator is a measure of the character, attributes or dynamics at a site.Using the concept of Limits of Acceptable Change, outlined in section 1.4.5, indica-tors of change will enable managers to identify desired quality standards for each ele-ment and management actions to try to maintain or improve quality. Any change inthe indicator may indicate unacceptable levels of negative impact or stress or con-versely, a positive impact or reduction in stress.
An example is the monitoring of the quality of sea water for pollution. Desiredquality levels may have been commonly agreed (e.g. by the European Community inrelation to their Blue Flag scheme). If the water quality falls below the desired level,managers should identify why, agree actions to address the problems and implementthese in association with key stakeholders. Many beaches now regularly monitorwater quality and display information for beach users.
A similar approach is useful for many other aspects of beach environments butoften it is not so easy to collect and monitor relevant data. Indicators are not an end
in themselves but a way of better understanding changes in the environment.Changes are likely to require management responses. Each indicator chosen shouldideally be supported by a regular monitoring programme. The use of similar indica-tors should allow comparison between different sites.
The EU report on quality management of coastal tourism (1999) identifies howthe use of indicators of change should lead to the sustainable development of coastaldestinations. Certainly the focus on change is vital when considering issues of sus-tainability.
The World Tourism Organisation (WTO) have published guidelines on thedevelopment and use of indicators of sustainable tourism (1995). They identify a setof core indicators which should apply to any site and then a set of destination spe-cific indicators which relate to different types of ecosystem or that are developed tomeet the characteristics of particular sites (Tables 4.1, 4.2).
170 socio-economic analysis of sites
Tab. 4.1 The core indicators proposed
INDICATOR MEASURES
1. Site protection Level of protection or conservation designation2. Stress Tourist numbers visiting the site3. Use intensity Intensity of use in peak periods4. Social impact Impact of tourism on the social/cultural lives of local communities5. Development control Existence and implementation of environmental review procedure or formal controls
over the development and use of the site6. Waste management The procedures for and percentage treatment of sewage at the site7. Planning process The extent to which there is a comprehensive planning system8. Critical ecosystems The number and condition of rare species and ecosystems9. Consumer satisfaction The measurement of visitor satisfaction over time10. Local satisfaction The levels of satisfaction of local people affected by tourism over time.
Adapted from WTO (1995)
Tab. 4.2 A supplementary list of indicators for coastal areas
ISSUE INDICATORS SUGGESTED MEASURES
Ecological destruction Amount degraded % in degraded condition
Beach degradation Levels of erosion % of beach eroded
Fish stocks depletion Reduction in catch Effort to catch fishFish species counts for key species
Overcrowding Use intensity Persons per metre of accessible beach
Disruption of fauna Species count Number of species presentChange in species mixNumber of key species sightings
Diminished water quality Pollution levels Faecal coliform and heavy metalcounts
WTO (1995)
There are different types of indicator which can be used for different purposes:– Warning indicators are measures which alert managers to potential problems devel-
oping;– Stress or pressure indicators measure key external factors such as population levels
which will increase pressure on a resource;– Resource measures address changes in the actual resource being managed;– Measures of impacts aim to identify the impacts of physical, biological, social or
economic changes;– The current management inputs and impacts should also be measured to identify
what is being done and what impacts management methods are having.
Indicators are often quantitative measures: figures, percentages, quantities, etc.However, they may also be in the form of qualitative information, that is descriptiveinformation or data about people’s opinions or views. An example of qualitative datamight be value judgements about change in the aesthetic appearance of an area andhow it had improved or deteriorated.
Choice of indicators is extremely important. The aim is to understand what needsto be measured and to choose a relevant and useful set of indicators. However, thepotential range of information needs to be reduced to a manageable scale. The choiceof indicators depends on the site’s attributes and the management objectives. Thegeneral lists above provide a starting point but more specific indicators will berequired at each site. If a site is to be managed to preserve rare species of fauna or flo-ra, key indicators will focus on the health of the ecosystem and the scale of perceivedthreats. If the site is to be managed to reduce the impact of recreation then it will beimportant to measure levels, types and patterns of recreational use.
Key issues will be the availability of data and the costs (in time and money) of col-lecting new data. If managers need develop monitoring systems issues of reliabilityover time and the expertise required are extremely important.
The WTO identifies five key criteria by which to evaluate potential indicators:1. Whether the data is obtainable;2. Whether the indicator is both credible and easy to understand;3. Whether the indicator enables the detection of trends over time and comparison
across areas;4. Whether the indicator is predictive of sustainability;5. Whether threshold or reference values are available (benchmark levels).
If an indicator fulfils these criteria it is likely to be very useful. Often there maynot be one indicator that will on its own measure change in a particular element ofthe environment but a combination of two or three indicators may provide moreconfirmation of change (Tab. 4.3).
Indicators focus on key areas of concern and should help ensure that managementaims and objectives are achieved. A target level may be set for each indicator which willenable progress towards objectives to be measured (Pearson, 1996).
“baseline research for the integrated sustainable management…” 171
BIO
TIC
CH
AN
GE
SA
BIO
TIC
/PH
YSI
CA
L C
HA
NG
ES
EN
VIR
ON
ME
NT
AL
CH
AN
GE
SFR
OM
HU
MA
N A
CT
IVIT
YSO
CIO
-CU
LTU
RA
L C
HA
NG
ES
EC
ON
OM
IC C
HA
NG
ES
FR
OM A
CT
ION
S
• Sp
ecie
s di
vers
ity
(flo
raan
d fa
una)
• B
iom
ass
(flo
ra a
ndfa
una)
• D
iver
sity
in b
ehav
iour
(fau
na)
• G
enet
ic v
aria
tion
• H
abit
at d
iver
sity
and
loss
• C
onta
min
atio
n le
vels
in b
irds
egg
s/sh
ellfi
shIn
dica
tors
cou
ld m
onit
or:
• C
oral
s•
Fish
• In
sect
s•
Am
phip
ods
• B
irds
• Tu
rtle
s,
rept
iles
• M
amm
als
e.g.
rod
ents
,se
als,
dol
phin
s•
Alg
al b
loom
s•
Veg
etat
ion
Bot
h pr
otec
ted
and
com
mon
spe
cies
• M
eteo
rolo
gica
lco
ndit
ions
• W
ater
qua
lity
e.g.
salin
ity
• C
oast
aler
osio
n/ac
cret
ion
• O
cean
ogra
phic
chan
ges
• W
ind
eros
ion/
accr
etio
n e.
g.bl
ow o
uts
• R
iver
sed
imen
t•
Dun
e st
abili
ty•
Leve
l of w
ater
tabl
e•
Clim
ate
chan
ge
• La
nd ta
ke fo
r to
uris
m,
hous
ing,
indu
stry
• Le
vels
of t
ram
plin
g•
Air
pol
luti
on•
Vol
ume/
patt
ern
of u
sage
/nu
mbe
rs o
f vis
itor
s•
Dem
and
for
wat
er•
Wat
er p
ollu
tion
• Li
tter
/was
te -
vol
ume
and
com
posi
tion
• C
onge
stio
n -
traf
ficco
unts
, noi
se p
ollu
tion
• A
esth
etic
cha
nge
tola
ndsc
ape
• A
esth
etic
cha
nge
in th
ebu
ilt e
nvir
onm
ent
• Il
lega
l con
stru
ctio
n -
type
s, v
olum
es a
ndlo
cati
ons
• Fi
re –
num
ber
and
exte
ntof
fire
s
• C
omm
unit
y vi
ews
• D
emog
raph
ic c
hang
e•
Vis
itor
cha
ract
eris
tics
• R
ange
of
acti
viti
esav
aila
ble
• V
isit
or s
atis
fact
ion
leve
ls•
Safe
ty is
sues
e.g
. num
ber
of a
ccid
ents
• C
rim
e st
atis
tics
• H
ealth
sta
tist
ics
• C
omm
unic
atio
n w
ith
and
part
icip
atio
n of
loca
lpe
ople
• Q
ualit
y of
life
• C
ultu
ral d
iver
sity
/mix
• V
olum
e of
bus
ines
ses
• N
umbe
r of
empl
oyee
s•
Leve
ls o
f ene
rgy
use
• R
even
ues
e.g.
from
car
park
s, m
arin
abe
rths
or
entr
y fe
es•
Vis
itor
num
bers
and
leng
th o
f sta
y•
Vis
itor
spe
nd p
erhe
ad•
Fish
cat
ches
• T
imbe
r pr
oduc
tion
,G
razi
ng le
vels
• U
nem
ploy
men
t ra
tes
• A
vera
ge e
arni
ngs
• E
cono
mic
div
ersi
ty
Bea
ch c
lean
ing
-vo
lum
es/t
ype
ofw
aste
• D
une
stab
ilisa
tion
-ar
ea•
Fish
ery
man
agem
ent
- le
vels
of l
iais
on o
ren
forc
emen
t•
Plan
ning
reg
ulat
ions
enfo
rcem
ent
acti
on•
Fore
stry
man
agem
ent
e.g.
num
ber
of tr
ees
plan
ted
• C
oast
al d
efen
ces
-nu
mbe
r of
floo
ds•
Com
mun
ity
liais
on -
num
ber
of m
eeti
ngs,
outc
omes
• Fi
re p
reve
ntio
nte
chni
ques
CH
AN
GE
SM
AN
AG
EM
EN
T
•
othe
r
Tab.
4.3
Pot
entia
l ind
icat
ors o
f cha
nge
for
beac
h en
viro
nmen
ts

“baseline research for the integrated sustainable management…” 173
The MECO project has studied a wide range of biological, geomorphological andsocio-economic issues and it is possible to propose a range of potential indicators forbeach environments. Although it is logical to apply a common set of indicators to allsites, their relative significance and usefulness will vary from site to site. Data forsome indicators will be easily available, while for others regular monitoring by trainedpersonnel will be required. Chapter 3 has already presented a range of ecologicalmonitoring methodologies in detail. This section identifies a range of other potentialindicators and will then discuss methodologies for undertaking monitoring for someof the socio-economic indicators (section 4.2).
The potential indicators listed in table 4.3 are not exhaustive. They are not listedin any particular order. The aim is to show how biological, physical and socio-eco-nomic indicators should be considered side by side, i.e. biological and physicalchanges are likely to have social and economic implications. The list is a usefulprompt for managers to consider a wide range of potential indicators. In each casethe type of data required must be judged as discussed above. If possible managersshould try to choose a range of indicators which will monitor both short term andlonger term changes.
Some indicators will apply at a relatively small scale e.g. just to part of a site. Oth-er indicators will be available only for larger scale areas e.g. population statistics. Thisdoes not mean they are not useful but allowance must be made for the scale at whicheach indicator is measured. It is also useful to compare the results of local indicatorswith similar statistics for the wider area or region. This enables anomalies to be iden-tified. Comparison of the same indicators from different sites can be used as bench-marks (as long as the same methodologies are used). This is helpful to managers intrying to understand how the dynamics of one site may vary from another and thuswhat responses will be most appropriate where.
The recommendation is that managers use at least two indicators from each col-umn. More might be used from one column where this issue is of prime concern forexample where human impact is very heavy or certain species are under threat.Remember, indicator information may not identify causes of impacts. Establishingcausation may involve a further stage of investigation.

4.2 monitoring methods
Alison Caffyn, Bob Prosser and Guy Jobbins
Introduction
A great range of methods exist for collecting monitoring data for indicators. Themethods chosen will depend on the site, resources available (in terms of staff, timeand finances) and the expertise of managers and other staff.
Methods need to be:– Relatively simple;– Use simple equipment;– Easily repeatable;– Reliable;– Comparable;– Regularly evaluated.
It is important to select sample points for monitoring carefully. The sample sitesneed to be adequate in number and distribution depending on the size, characteris-tics and variability of the site.
Remote sensing methodologies and GIS systems are becoming more frequently usedfor some types of monitoring. These offer advantages for certain types of monitoring butshould also be judged against the same criteria as other methods. If available it would beprudent to mix the use of satellite imagery or GIS with other methods. This would pro-vide a form of triangulation of data from various sources and will help verify results.
There are a number of difficulties associated with monitoring change (Williams,1994). If possible managers should try to overcome these by using a range of meth-ods and data sources and by integrating results as much as possible. However someissues are difficult to resolve.
Problems with monitoring change include:– How to identify base levels. Is it possible to have a reference point to measure
change against? This is difficult if change has been happening for some time.– How to isolate the cause of specific impacts. Often human pressure may just
accelerate changes that were already underway.– Change may not happen in the same place as the impact e.g. a change in river
flow may cause impacts far downstream. Similarly it may take time the changecaused by an impact to be detected. If changes are not detected for several yearsthis causes problems for management.

– Indicators are an attempt to simplify very complex processes. The complexity ofrelationships may make it very difficult to monitor change and identify causes.
– There may be indirect impacts from changes which may not be monitored. Thisis another reason to monitor a wide range of indicators as indirect impacts maybe picked up through other methods.
A brief discussion of each the following methods which were used during theMECO project follows:1. Use of secondary information and statistics;2. SWOT analysis;3. Beach usage - counts and observations;4. Stakeholder analyses;5. Visitor surveys;6. Wider assessments.
4.2.1 Use of secondary information and statistics
The first methodology to consider is existing sources of data. It is usually possibleto access published statistics for example on population statistics, employment ratesand tourism trends. It obviously saves time and resources if a significant amount ofinformation can be sourced from other organisations on a regular basis. Official sta-tistics usually have the advantage of being reliable and collected on a regular basisover a number of years. However they are often for larger scale areas than specific sitesand areas and thus need careful interpretation for application at the site level.
Examples used in the MECO project include tourism seasonality and accommo-dation supply in Tetouan province, Morocco, which were useful in our analysis ofSmir, which is one of the main resort areas in Tetouan province (Fig. 4.1, 4.2).
The tourism trends data were also interesting, but because they were only avail-able for the whole Tangiers region it was more difficult to draw conclusions from this(Fig. 4.3). The data could only be used to infer similar trends had taken place at Smir.
It is also important to check for any specialist studies which may have been carriedout by government organisations, voluntary organisations and academics. These stud-ies may provide useful in depth information on a particular topic or site, but may notbe repeated regularly. Examples of this type of data identified in the MECO studyincluded the results of a special survey of the density of people on the main Maltesebeaches, using counts undertaken from a helicopter (Table 4.4). This demonstrated avery similar level of density on three of the beaches and the much less developed beachWhite Tower (Ir-Ramla tat-Torri) had far fewer people per m2 of beach.
4.2.2 SWOT analysis
The analysis of the Strengths, Weaknesses, Opportunities and Threats is a commontechnique in socio-economic contexts. It can be used as a preliminary tool to identify
“baseline research for the integrated sustainable management…” 175
and assemble a range of positive and negative issues, including opinions from a rangeof different people. It is able to encompass issues from the past that have had an impact,current issues and focuses attention on the future by trying to identify opportunitiesand threats. The technique is very simple, but provides a useful starting point for thesocio-economic research. It enables an initial assessment of the constraints and poten-
176 socio-economic analysis of sites
0
10000
20000
30000
40000
50000
60000
70000
80000
90000
Jan
Mar
May
Jul
Sep
Nov
Feb
Apr
Jun
Aug
Oct
Dec
Fig 4.1 Seasonality – tourist night, all hotels, Tetouan province, Morocco, 1999
0 10000 20000 30000 40000 50000
5 star hotels
4 star hotels
3 star hotels
2 star hotels
1 star hotels
non classified hotels
tourist villages
tourist residences
Total arrivals
Fig 4.2 Type of tourist accommodation, Tetouan province, Morocco, 1999
0
200000
400000
600000
800000
1000000
1200000
1987 1988 1989 1990 1991 1992 1993 1994 1995 1996 1997
International tourists Domestic tourists
Fig 4.3 Tourist nights, Tangiers, Morocco, 1987-1997

tialities of each site. The initial SWOT analyses can be used at later stages to promptresponses and clarify differences of opinions between stakeholders.
A sample SWOT analysis is shown in Table 4.5, undertaken during the earlystages of the MECO project (1999). It presents a range of issues under environ-mental, economic and socio-cultural headings. It should be stressed that an issuewhich appears as a strength can also be interpreted as a weakness from an alterna-tive point of view. The analysis begins to reveal the complexity of the socio-eco-nomic issues affecting a site.
“baseline research for the integrated sustainable management…” 177
STRENGTHS
Environmental• Attractive sandy beaches• Wide range of birdlife• Lagoon fauna and floraEconomic• Agriculture in local villages• Tourism industry• Nearby markets in Tetouan• Local fishing industry• Services in M’diq• Water provision by new damSocio-cultural• Good local communications
WEAKNESSES
Environmental• Dam disrupted hydrological cycle• Invasion of lagoon by sea water• Restriction of dune constructionEconomic• Need for irrigation• Limited tourist season• Pressure on water resourcesSocio-cultural• Localised poverty• Restricted access along beach
OPPORTUNITIES
Environmental• Legal protection• New forms of water treatment• New water managementEconomic• Wider range of tourism services• New forms of tourism e.g. birdwatching
THREATS
Environmental• Salinisation of ground water• Increased sewage and drainage needs• Increased demand for water• New road developments• Spreading urbanisationEconomic• Depletion of agriculture• Reliance on tourismSocio-cultural• Elements of drug culture• Drift from rural to urban areas• Loss of public access to beach
Tab. 4.4 Density of people on beaches - a Sunday in August 1999, Maltese beaches
Armier Bay 10938 8708 2235 693 348 1428 6.09
White Tower 8248 8248 - - - 134 61.55
Ghadira 35609 30563 5046 3088 1088 4826 6.3
Golden Bay 10880 10670 210 1044 483 1527 6.5
BEACH TOTAL AREA M 2
SANDY AREA ROCKY AREA PEOPLE SWIM-MING
PEOPLE ONSHORE
TOTAL PEOPLE
DENSITY M PERPERSON
2
Tab. 4.5 SWOT analysis for Smir, Morocco

4.2.3 Beach usage - counts and observations
Various types of data were collected through observational surveys conducted ateach beach site. (The approach taken at Kneiss, Tunisia, was different as it is not abeach site, and different techniques were required.) Firstly it was important to recordthe numbers of beach users over time and to distinguish between recreational usersand any local people using the beach as part of their business or normal daily lives.Thus regular counts were taken of people on the beach during each day of survey. Inaddition to exact numbers, other data were collected such as the types of activitiestaking place, the types of visitors present and any conflicts or problems observed.Data were recorded on specially designed record sheets and photographic recordswere also taken each hour (Fig. 4.4). A graph showing the results of these counts atZouara, Tunisia, is presented in Fig. 4.5.
It was identified early on in the research process that the spatial spread of beachusage was vitally important. Thus the survey methods were designed to estimatehow many people were in each zone of a beach at a particular time. Zones were iden-
178 socio-economic analysis of sites
0
50
100
150
200
250
10.00 AM 11.00 AM 12.00 PM 1.00 PM 2.00 PM 3.00 PM 4.00 PM 5.00 PM
time
num
bers
of v
isit
ors
fore beach middle beach back beach
Fig 4.5 Zouara, Tunisia – volume of visitors over time for three beach zones (July 1999)
Fig. 4.4 (A, B) Two photos showing contrasting volumes of usage at the same location - Zouara, TunisiaJuly 1999
a b
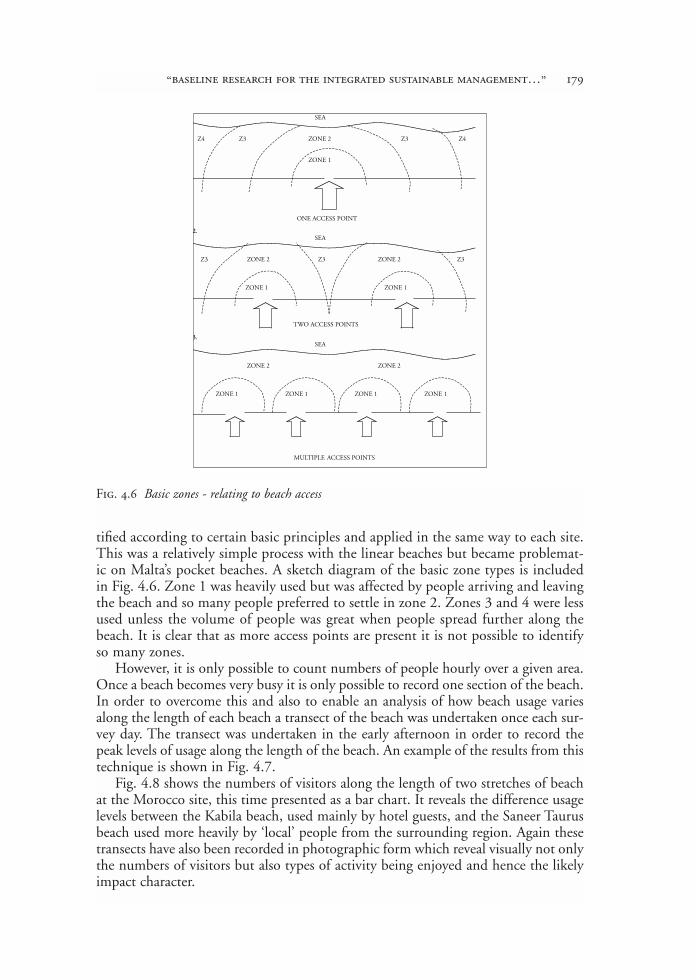
“baseline research for the integrated sustainable management…” 179
tified according to certain basic principles and applied in the same way to each site.This was a relatively simple process with the linear beaches but became problemat-ic on Malta’s pocket beaches. A sketch diagram of the basic zone types is includedin Fig. 4.6. Zone 1 was heavily used but was affected by people arriving and leavingthe beach and so many people preferred to settle in zone 2. Zones 3 and 4 were lessused unless the volume of people was great when people spread further along thebeach. It is clear that as more access points are present it is not possible to identifyso many zones.
However, it is only possible to count numbers of people hourly over a given area.Once a beach becomes very busy it is only possible to record one section of the beach.In order to overcome this and also to enable an analysis of how beach usage variesalong the length of each beach a transect of the beach was undertaken once each sur-vey day. The transect was undertaken in the early afternoon in order to record thepeak levels of usage along the length of the beach. An example of the results from thistechnique is shown in Fig. 4.7.
Fig. 4.8 shows the numbers of visitors along the length of two stretches of beachat the Morocco site, this time presented as a bar chart. It reveals the difference usagelevels between the Kabila beach, used mainly by hotel guests, and the Saneer Taurusbeach used more heavily by ‘local’ people from the surrounding region. Again thesetransects have also been recorded in photographic form which reveal visually not onlythe numbers of visitors but also types of activity being enjoyed and hence the likelyimpact character.
SEA
Z4 Z3 ZONE 2 Z3 Z4
ZONE 1
ONE ACCESS POINT
2. SEA
Z3 ZONE 2 Z3 ZONE 2 Z3
ZONE 1 ZONE 1
TWO ACCESS POINTS
3. SEA
ZONE 2 ZONE 2
ZONE 1 ZONE 1 ZONE 1 ZONE 1
MULTIPLE ACCESS POINTS
Fig. 4.6 Basic zones - relating to beach access
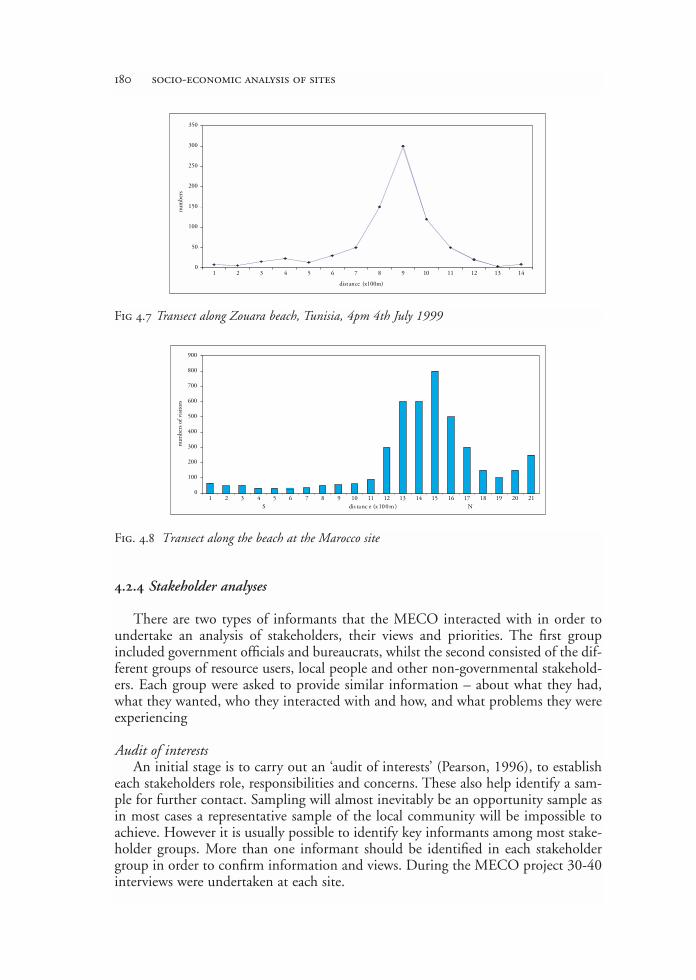
4.2.4 Stakeholder analyses
There are two types of informants that the MECO interacted with in order toundertake an analysis of stakeholders, their views and priorities. The first groupincluded government officials and bureaucrats, whilst the second consisted of the dif-ferent groups of resource users, local people and other non-governmental stakehold-ers. Each group were asked to provide similar information – about what they had,what they wanted, who they interacted with and how, and what problems they wereexperiencing
Audit of interestsAn initial stage is to carry out an ‘audit of interests’ (Pearson, 1996), to establish
each stakeholders role, responsibilities and concerns. These also help identify a sam-ple for further contact. Sampling will almost inevitably be an opportunity sample asin most cases a representative sample of the local community will be impossible toachieve. However it is usually possible to identify key informants among most stake-holder groups. More than one informant should be identified in each stakeholdergroup in order to confirm information and views. During the MECO project 30-40interviews were undertaken at each site.
180 socio-economic analysis of sites
0
50
100
150
200
250
300
350
1 2 3 4 5 6 7 8 9 10 11 12 13 14
distance (x100m)
num
bers
Fig 4.7 Transect along Zouara beach, Tunisia, 4pm 4th July 1999
0
100
200
300
400
500
600
700
800
900
1 2 3 4 5 6 7 8 9 10 11 12 13 14 15 16 17 18 19 20 21S dis tanc e (x 100m ) N
num
bers
of v
isit
ors
Fig. 4.8 Transect along the beach at the Marocco site
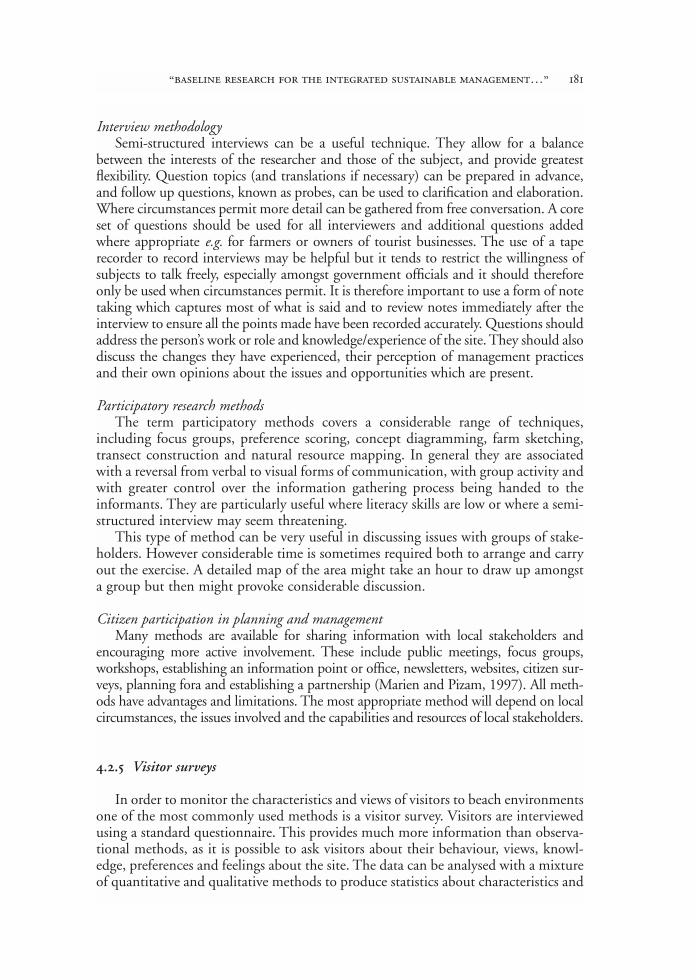
Interview methodologySemi-structured interviews can be a useful technique. They allow for a balance
between the interests of the researcher and those of the subject, and provide greatestflexibility. Question topics (and translations if necessary) can be prepared in advance,and follow up questions, known as probes, can be used to clarification and elaboration.Where circumstances permit more detail can be gathered from free conversation. A coreset of questions should be used for all interviewers and additional questions addedwhere appropriate e.g. for farmers or owners of tourist businesses. The use of a taperecorder to record interviews may be helpful but it tends to restrict the willingness ofsubjects to talk freely, especially amongst government officials and it should thereforeonly be used when circumstances permit. It is therefore important to use a form of notetaking which captures most of what is said and to review notes immediately after theinterview to ensure all the points made have been recorded accurately. Questions shouldaddress the person’s work or role and knowledge/experience of the site. They should alsodiscuss the changes they have experienced, their perception of management practicesand their own opinions about the issues and opportunities which are present.
Participatory research methodsThe term participatory methods covers a considerable range of techniques,
including focus groups, preference scoring, concept diagramming, farm sketching,transect construction and natural resource mapping. In general they are associatedwith a reversal from verbal to visual forms of communication, with group activity andwith greater control over the information gathering process being handed to theinformants. They are particularly useful where literacy skills are low or where a semi-structured interview may seem threatening.
This type of method can be very useful in discussing issues with groups of stake-holders. However considerable time is sometimes required both to arrange and carryout the exercise. A detailed map of the area might take an hour to draw up amongsta group but then might provoke considerable discussion.
Citizen participation in planning and managementMany methods are available for sharing information with local stakeholders and
encouraging more active involvement. These include public meetings, focus groups,workshops, establishing an information point or office, newsletters, websites, citizen sur-veys, planning fora and establishing a partnership (Marien and Pizam, 1997). All meth-ods have advantages and limitations. The most appropriate method will depend on localcircumstances, the issues involved and the capabilities and resources of local stakeholders.
4.2.5 Visitor surveys
In order to monitor the characteristics and views of visitors to beach environmentsone of the most commonly used methods is a visitor survey. Visitors are interviewedusing a standard questionnaire. This provides much more information than observa-tional methods, as it is possible to ask visitors about their behaviour, views, knowl-edge, preferences and feelings about the site. The data can be analysed with a mixtureof quantitative and qualitative methods to produce statistics about characteristics and
“baseline research for the integrated sustainable management…” 181
opinions but also people’s responses about the meaning the site has for them or theirviews on its management. Sample sizes need to be reasonable to ensure statistics pro-duced are reliable and to monitor trends from one year to the next.
It is important to sample at both weekends and during the week as types andnumbers of beach users will vary from day to day. Similarly sampling should takeplace throughout the season the beach is used, which could be over a six month peri-od or more. The best sampling points should be considered where a large site is beingsurveyed - as again different users may prefer different areas of the beach. Sample sizesfor visitor surveys are often over 1000 people, more where a large number of samplepoints are used or when the survey lasts over many months.
If there are a high proportion international tourists using the beach there are like-ly to be problems with languages as many visitors will not be able to respond to ques-tions. Interviewers need to be carefully trained to sample users randomly and toimplement the questionnaires in a standard fashion. It may not be necessary to carryout a visitor survey every year. Some recreation sites monitor only every three or fiveyears to see if changes can be identified in users and in their opinions. If significantmanagement changes have been introduced it would be useful to survey subsequent-ly to monitor users responses. Visitor surveys can be large scale and time consumingexercises. They are only useful if carried out in a consistent fashion and thus great caremust be taken over their implementation and interpretation. The standard question-naire used in the MECO research is presented in the box of Fig. 4.9.
4.2.6 Basic economic estimates
During the MECO project we had difficulty sourcing economic information aboutthe sites. We therefore undertook some basic estimates of the levels of employment andrevenue generation in the close vicinity to each site. Asking people about how muchmoney they earn or how much their business makes is obviously a very sensitive sub-ject and such direct questions are rarely answered, at least not accurately. There may bea suspicion that the information may be passed to officials and much economic activi-ty and employment around beaches may be of a semi-legal nature. However by secur-ing responses from a small sample of key informants by asking less sensitive questionsit is possible to draw up rough estimates of localised economic impacts. For example atSmir, Marocco, we spoke to at least two people in each of the following categories:– hotel manager;– restaurant/cafe owner;– beach umbrella/watersport concession operator;– refreshment kiosk operator;– craft shop owner;– casual ‘hawker’ of goods.Simple questions were asked about:– the number of people who were employed full time and part time;– the numbers of visitors per day/occupancy rates;– the length of the season;– whether business was better this year from last and trends over the last few years;– financial burdens such as licences, tourist taxes etc.
Often one or two people will be happy to provide more information such as aver-
182 socio-economic analysis of sites

Dat
e___
___L
ocat
ion_
____
__In
terv
iew
er__
____
ID
____
____
__
Intr
oduc
tion
- H
ello
. We’r
e do
ing
a su
rvey
of p
eopl
e vi
siti
ng th
is b
each
toda
y. W
ould
you
be p
repa
red
to a
nsw
er s
ome
ques
tion
s (a
bout
why
you
com
e he
re a
nd w
hat y
ou t
hink
abou
t the
bea
ch)?
Thi
s w
ill ta
ke 2
0-30
min
utes
.
1. W
here
do
you
live?
Tow
n___
____
____
____
____
____
____
___
(if l
ocal
)R
egio
n___
____
____
____
____
____
____
__ (
if do
mes
tic
visi
tor)
Cou
ntry
____
____
____
____
____
____
____
(if o
vers
eas)
2. A
re y
ou h
ere
on h
olid
ay?
____
___(
tick
)or
vis
itin
g fr
iend
or
rela
tive
s?__
____
or o
n a
day
trip
from
hom
e?__
____
_3.
If y
ou a
re o
n ho
liday
a) H
ow m
any
nigh
ts a
re y
ou s
pend
ing
in th
e ar
ea?
____
____
____
___
b) W
hat t
ype
of a
ccom
mod
atio
n ar
e yo
u st
ayin
g in
? __
____
____
____
____
____
__c)
Whe
re is
this
acc
omm
odat
ion?
___
____
____
____
____
____
____
____
____
__4.
Hav
e yo
u vi
site
d th
is b
each
bef
ore?
(ri
ng)
Yes
/no
If s
o ho
w o
ften
? __
____
____
____
____
____
____
____
_O
ver
how
man
y ye
ars?
___
____
____
_If
mor
e th
an 2
yea
rs a
sk -
Has
the
bea
ch c
hang
ed m
uch
sinc
e yo
u fir
st v
isit
ed it
and
inw
hat w
ays?
___
____
____
____
____
____
____
____
____
____
____
____
____
____
____
5. H
ave
you
or a
re y
ou p
lann
ing
to v
isit
any
oth
er b
each
es in
this
are
a? Y
es/n
oW
hich
one
s?__
____
____
____
____
____
____
____
____
____
____
____
____
____
____
6. H
ow d
id y
ou g
et to
the
beac
h to
day?
(i.e
. w
hat w
as y
our
mai
n m
eans
of t
rans
port
?)__
____
____
____
____
____
____
____
____
____
____
____
____
____
____
____
____
_7.
How
man
y pe
ople
(in
clud
ing
your
self
) are
the
re in
you
r gr
oup
visi
ting
the
beac
h to
day?
Adu
lts__
____
____
___
Chi
ldre
n (u
nder
15)
____
____
____
8. W
hat w
ould
you
say
is th
e m
ain
reas
on fo
r yo
ur v
isit
her
e to
day?
____
____
____
____
____
____
____
____
____
____
____
____
____
____
____
____
_9.
How
did
you
kno
w o
r fin
d ou
t abo
ut th
e be
ach?
___
____
____
____
____
____
____
_10
. How
muc
h w
ill y
ou s
pend
dur
ing
your
vis
it to
day
(for
who
le g
roup
) on
the
follo
win
gth
ings
?Tr
avel
____
____
____
____
____
____
_
Foo
d an
d dr
ink_
____
____
____
____
__A
ctiv
itie
s___
____
____
____
____
____
C
hair
s/lo
unge
rs e
tc__
____
____
____
__E
nter
tain
men
t___
____
____
____
____
___
Any
thin
g el
se (
spec
ify)_
____
____
____
____
Tota
l (s
o ov
eral
l tha
t wou
ld b
e ab
out…
..?)_
____
____
____
____
____
____
____
____
_11
. Hav
e yo
u ta
ken
part
(or
do
you
inte
nd to
) in
any
of t
hese
act
ivit
ies
toda
y? (
tick
thos
ew
hich
app
ly)
Swim
min
g __
____
____
__Pl
ayin
g ga
mes
____
____
__W
alki
ng/j
oggi
ng__
____
____
__W
ater
spor
ts__
____
____
__B
oati
ng__
____
____
____
_Any
thin
g el
se (
spec
ify)_
____
12. H
ow w
ould
you
rat
e th
e fo
llow
ing
aspe
cts
of th
is b
each
?E
xcel
lent
g
ood
aver
age
po
or
ver
y po
or(i
f poo
r or
v p
oor
ask
- w
hy?)
Sand
1
2
3
4
5 _
____
____
Wat
er
12
3
45
___
____
___
Caf
és
2
3
4
5 _
____
____
_To
ilets
1
2
3
4
5 _
____
____
_A
ctiv
itie
s
12
3
45
___
____
___
Park
ing
1
2
3
4
5 _
____
____
_C
lean
lines
s 1
2
3
4
5 _
____
____
_Sa
fety
1
2
3
4
5 _
____
____
_13
. (If
thi
s hi
s fir
st v
isit
) How
wou
ld y
ou r
ate
this
bea
ch a
gain
st y
our
expe
ctat
ions
befo
re y
ou a
rriv
ed?
(tic
k)B
ette
r th
an e
xpec
ted_
____
____
____
__A
bit
bet
ter
than
exp
ecte
d___
____
____
Abo
ut t
he s
ame
as e
xpec
ted_
____
____
_A
bit
dis
appo
inti
ng__
____
____
____
__V
ery
disa
ppoi
ntin
g___
____
____
____
_D
idn’
t kn
ow w
hat t
o ex
pect
____
____
_14
. Wha
t hav
e yo
u en
joye
d m
ost a
bout
you
r vi
sit?
____
____
____
____
____
____
____
____
____
____
____
____
____
____
____
___
15. W
hat h
ave
you
enjo
yed
leas
t abo
ut y
our
visi
t?__
____
____
____
____
____
____
____
____
____
____
____
____
____
____
____
_16
. Are
the
re a
ny s
peci
fic w
ays
in w
hich
the
beac
h co
uld
be im
prov
ed t
o m
ake
a vi
sit
mor
e en
joya
ble?
(an
ythi
ng e
lse?
)__
____
____
____
____
____
____
____
____
____
____
____
____
____
____
____
_17
. Who
do
you
thin
k sh
ould
be
resp
onsi
ble
for
thes
e im
prov
emen
ts?
____
____
____
____
____
____
____
____
____
____
____
____
____
____
____
___
18. D
o yo
u ha
ve a
ny o
ther
com
men
ts a
bout
the
beac
h?__
____
____
____
____
____
____
____
____
____
____
____
____
____
____
____
_19
. How
like
ly a
re y
ou t
o co
me
back
to th
is b
each
in fu
ture
? (r
ing)
Ver
y lik
ely
Poss
ibly
Not
ver
y lik
ely
Won
’t co
me
back
20. W
e w
ould
app
reci
ate
it if
you
cou
ld p
rovi
de s
ome
sim
ple
info
rmat
ion
abou
tyo
urse
lf a)
Mal
e/fe
mal
e (r
ing)
b) A
ge g
roup
(ri
ng)
15-
24 2
5-34
35-
44 4
5-54
55-
64 6
5+c)
Are
you
: (ri
ng)
In p
aid
empl
oym
ent
A s
tude
nt U
nem
ploy
ed R
etir
edH
ouse
wife
/hus
band
Oth
erIf
em
ploy
ed
-
in w
hat t
ype
of jo
b?__
____
____
____
____
____
____
____
____
____
1
Fig.
4.9
Sta
ndar
d qu
estio
nnai
re u
sed
in th
e M
ECO
res
earc
h
age wages or their turnover or profit. When this information is matched with thenumber and size of such businesses and present information about the prices ofrooms, sun loungers, goods and meals, some rough estimates of localised direct eco-nomic impacts can be made.
4.2.7 Wider assessments
If resources are available it would be extremely useful to undertake fuller impactassessments of all aspects - environmental, economic and socio-cultural. These wouldinclude:– Environmental Impact Assessment;– Economic cost -benefit analysis (Kay and Alder, 1999);– Market assessments (of the tourist and other sectors);– Risk assessments of various hazards such as cyclones, landslips or political unrest
(Kay and Alder, 1999).
4.2.8 Sharing information
It is good practice to share information with scientists, managers and stakehold-ers. This will ensure consistency, avoid duplication, help keep everyone informed andassist in good management.
Pearson (1996) outlines key issues for sharing information:– Establish your information needs at an early stage;– Determine what information is held elsewhere;– Agree on the best means of obtaining information;– Decide who is best placed to collect it;– Use clear and uncluttered maps;– Decide on the best way to manage the information;– Think long-term;– Consider how best to convey information to all users, including the public.
4.2.9 References
European Commission (1999) Pour un tourisme côtier de qualité: La gestion integrée de la quali-té (GIQ) des destinations touristiques côtières, European Community, Luxembourg.
Kay R. and Alder J. (1999) Coastal planning and management, E&FN Spon London.Marien C. and Pizam A. (1997) Implementing sustainable tourism development through citi-
zen participation in the planning process. In: Wahab S. and Pigram J.J., Tourism developmentand growth: the challenge of sustainability, Routledge, London.
Pearson N. (1996) Coastal zone management: towards best practice, Department of the Environ-ment, UK Government.
Van der Meulen F. and Janssen M. (1992) Towards a monitoring programme for Europeancoastal environments. In: Carter RWG et al., Coastal dunes, geomorphology, ecology and man-agement for conservation, AA Balkema, Rotterdam.
Williams P.W. (1994) Frameworks for assessing tourism’s environmental impacts. In: RitchieJ.R.B. and Goeldner C.R., Travel, tourism and hospitality research (second edition), Wiley,Chichester, UK.
World Tourism Organisation (1995) What tourism managers need to know: a practical guide tothe development and use of indicators of sustainable tourism, WTO, Madrid.
184 socio-economic analysis of sites

chapter 5
developing a management planplans d’aménagement

5.1 plan de gestion des zones sensibles:lignes directrices
A.P.A.L.
Cadre générale du programme en Tunisie
Le Ministère de l’Environnement et de l’Aménagement du Territoire a entreprisl’élaboration de Schémas Directeur d’Aménagement des Zones Sensibles (SDAZS)littorales. Ces schémas donnent une délimitation assez précise des espaces particuliè-rement sensibles nécessitant une protection, une revalorisation et une gestion adap-tées à leurs particularités naturelles.
Le projet MECO s’inscrit dans le cadre de la mise en œuvre de ce programme, etpermet d’identifier le programme global de gestion pour chacune des deux zones sen-sibles choisies.
Objectifs du programme
– Conserver l’équilibre naturel du site,– Valoriser le site en développant, si possible, une activité économique et culturelle
compatible avec sa spécificité écologique,– Mettre en place une procédure de gestion, de contrôle et du suivi du site.
Consistance du programme
Ce programme comporte deux actions principales:
1. L’élaboration des plans de gestion afin de:– identifier et caractériser les contraintes et les potentialités socio-économiques en
vue de la valorisation et de l’aménagement intégré des écosystèmes côtiers,– définir la meilleure stratégie possible pour le développement durable de ces éco-
systèmes.
2. Mise en œuvre du plan de gestion– Mettre en œuvre un système de suivi (commission de gestion, conseil scientifique,
observatoire, …etc.),– Instituer un cadre réglementaire (loi, cahier de charges, commission de ges-
tion, …),
– Réaliser les actions de protection et de valorisation (O.N.G., A.P.A.L., Ministèrede l’agriculture, privés, …).
Constitution du plan de gestion
Le premier document comprend l’étude de caractérisation des espaces naturelsà protéger à savoir:– L’inventaire détaillé des particularités, biologique, écologique, paysagère, culturel-
le et socio-économique du site,– L’analyse critique des aménagements existants et programmés dans l’entité homo-
gène composée du site considéré et ses proches environs et pouvant induire uneincidence notable sur l’équilibre de la zone.
Le deuxième document comprend le schéma de gestion à savoir:– Le plan de protection et/ou de conservation fixant:
les moyens nécessaires à la réhabilitation éventuelle du site,les mesures compensatrices liées aux effets des aménagements existants et projetés,
– Un plan d’aménagement intégré et de mise en valeur des ressources naturelles,– Un plan opérationnel de gestion.
Le troisième document défini le cadre réglementaire du protocole de suivi etde gestion:– Suivi de l’évolution des écosystèmes à travers des indicateurs pertinents,– Évaluation périodique de la pression anthropique.
Procédure d’élaboration du plan de gestion
L’élaboration du plan de gestion comprend trois phases:
Phase 1: Caractérisation de la zone1. Collecte d’informations:
– le cadre physique,– l’occupation du sol,– les spécifités du site à savoir: le paysage, la biodiversité (faune et flore en précisant
les espèces d’intérêt international et régional et les espèces endémiques), l’archéo-logie, la sensibilité et la fragilité, etc…,
– les menaces et sources de nuisance: l’érosion, la pollution tellurique/pélagique, lapression anthropique, etc…
2. DiagnosticIl s’agit de procéder à l’analyse des différentes informations recueillies, d’élaborer
des cartes thématiques de synthèse et d’orientation. Ce diagnostic concerne l’analysede la situation, écologique et environnementale du site et permet d’identifier son apti-tude à l’aménagement conformément aux recommandation du SDAZS:– L’évaluation de l’état d’équilibre du site,
188 developing a management plan
– L’identification des risques qu’il peut encourir,– La détermination des évolutions tendancielles et les mesures à entreprendre pour
protéger et/ou conserver le site,– L’évaluation des potentialités du site et son aptitude à l’aménagement et à la réha-
bilitation, dans un contexte de développement durable.
Phase 2: Elaboration des scénarios de gestionPrésentation de scénariosSur la base du bilan diagnostic, différents scénarios d’aménagement sont présen-
tés conformément aux objectifs du programme de gestion des zones sensibles à savoirla conservation de l’équilibre naturel du site et sa valorisation.
Les scénarios proposés sont accompagnés d’une étude succincte d’impact envi-ronnemental, d’une estimation financière des coûts, d’une évaluation des avantagesdes aménagements projetés et d’une analyse multi-critère.
Choix du scénarioSur la base de l’analyse multi-critère proposée et en concertation avec tous les ser-
vices et organismes concernés, un choix est effectué pour identifier le scénario opti-mal d’aménagement de la zone dans un cadre de cohérence global.
Phase 3: Schéma de gestion Cette phase comprend trois parties principales pour l’élaboration du schéma de
gestion détaillé du scénario retenu:1. Schéma détaillé de gestion du siteCe schéma traduit les orientations de gestion et leur répartition spatiale sur un
document cartographique qui précise:– le programme de protection et de gestion pour la mise en valeur du site et son
développement durable,– les mesures techniques, correctrices ou compensatoires dans certains cas, indispen-
sables pour assurer la meilleure intégration possible des aménagements,– les besoins logistiques nécessaires pour assurer la veille et le suivi en terme de ges-
tion du site,– l’estimation des coûts (réalisation, maintenance et suivi),– l’étude d’impact détaillée sur l’environnement y compris l’impact socio-économique, – le planning de réalisation du programme de protection et de valorisation pour met-
tre en cohérence les mesures sectorielles d’aménagement et de protection du site.
2. Mesures d’accompagnementIl s’agit d’identifier:
– les mesures réglementaires applicables à la protection de la zone et destinées à limi-ter toutes sortes de nuisances, pollutions ou risques,
– les relations institutionnelles et le partenariat envisageables avec les acteurs poten-tiels, y compris les O.N.G., pour la bonne gestion du site,
– les indicateurs de l’évolution des sites en précisant la fréquence et le mode deleur suivi,
– les ressources financières après la réalisation des aménagements.
“baseline research for the integrated sustainable management…” 189

190 developing a management plan
3. Cahier de charges pour la réalisation des travauxIl s’agit d’un cahier de charges pour la réalisation des travaux d’aménagement rela-
tifs au schéma de gestion adopté.Il doit arrêter en particulier:
– les travaux de protection et leur mode de réalisation,– les précautions à prendre lors de la réalisation des travaux,– l’emplacement et la superficie exactes des équipements projetés,– la nature des matériaux utilisés.
5.2 diagnostique des sites tunisiens -les fiches des experts
Dans cette section des exemples sont montrés de fiches synthétiques concer-nantes les sites de Zouara et de Kneiss et remplies par les expert MECO sur requê-te de l’A.P.A.L. en charge de proposer les plans d’aménagement (section 5.3).
5.2.1 Zouara
Nom de l’expert: A. Bayed et M.A. El AgbaniSpécialité: Ecologie marine et OrnithologieEquipe MECO: Institut Scientifique – Rabat, MaroccoNom du Site: Zouara
I – Potentialités (dans le domaine d’expertise) des sites tunisiens:– Grande diversité de types d’habitats: plage, dunes bien conservées, embouchured’oued, plan d’eau du barrage.– Impact humain est relativement réduit, sauf en période estivale.– Peuplement ornithologique riche en rapport avec la création du plan d’eau du barra-ge; Celui-ci a permis l’installation d’un peuplement ornithologique riche en espècesplongeuses particulièrement du groupe des Anatidés qui n’existait pas auparavant dansla région, ce qui constitue l’un des points positifs de ce type d’infrastructure dans despays sud-méditerranéens où le régime pluviométrique est très irrégulier. En effet dansdes pays comme la Tunisie, les lacs de barrages, constituent des milieux refuges pour lesoiseaux d’eau du Paléarctique lors des périodes de migration et d’hivernage particulière-ment durant les périodes de sécheresse.
II – Problèmes, contraintes et nuisances constatés: – Forte réduction des apports sédimentaires et d’eau douce suite à l’installation du bar-rage de Sidi El Barrak. Ceci a engendré une réduction de l’étendue de la zone de trans-ition reliant le tronçon aval de l’oued Zouara à la mer.– Impact négatif de la part des estivants.
III – Recommandations de l’expert en terme de gestion Actions recommandées :– Maintenir un débit sanitaire en eau douce au tronçon aval de l’oued Zouara dans lebut de conserver une bonne diversité en types d’habitats, en faune et en flore.– Mettre en place dans le complexe plage-lac de barrage-embouchure de l’oued Zouara
�
192 developing a management plan
Nom de l’expert: Lorenzo ChelazziSpécialité: Ecologie en particulière des écosystèmes côtièreEquipe MECO: CNR, CONISMA, ItalieNom du Site: Zouara
d’un centre d’éducation environnementale pour les villes voisines (écoles, lycées, grandpublic, estivants) combinés avec des circuits écotouristiques, ce qui va donner au site uneimportance particulière dans cette partie du territoire tunisien. Le programme éco-tou-ristique peut drainer des bénéfices financiers à toute la région.– Le plan de gestion devrait être axé sur la sensibilisation et l’éducation environnementale.Actions formellement proscrites :Utilisation abusive de la plage.
I – Potentialités (dans le domaine d’expertise) des sites tunisiens:Zouara est un site très intéressant parce qu’il est le seul en Tunisie à avoir des dunesmobiles ainsi hautes. Ici l’écosystème de la plage et de la dune est très bien préservé etc’est un des meilleures dans toute la Méditerranée avec ces caractéristiques. Le peuple-ment des animaux est riche en espèces et la couverture végétale est typique et semblableà celle qu’on peut trouver sur les grandes dunes des côtes Atlantiques. C’est un lieuimportant aussi pour les témoignages préhistoriques (ancien port et village, forêt fossile)qui se trouve le long de la côte.
II – Problèmes, contraintes et nuisances constatés:Un des problèmes les plus importants, que nous avons constaté, est le barrage qui empê-che le débit des sédiments vers la côte. Ce conduira à une diminution de la plage et àune disparition presque complète d’une dune naturelle. En outre l’ensablement de l’em-bouchure de l’Oued au niveau de la plage a déjà crée une stagnation des eaux et parconséquent le changement de l’écosystème de fleuve et des ses berges.La présence de défenses sur les dunes avec de la végétation morte s’oppose aux mouve-ments du sable et une raréfaction des espèces animales adaptées aux dunes mobiles.En outre la coupe de l’Ammophila arenaria, opérée par la population locale pour la pro-duction des paniers, en empêche la reproduction aussi bien par stolons que par graineset par conséquent la consolidation naturelle de la dune.
III – Recommandations de l’expert en terme de gestionActions recommandées :Dans le plan d’aménagement du barrage il faudra considérer le relâchement périodiquede l’eau pour faire en sorte qu’encore des sédiments s’écoule vers la mer. On cette façonl’embouchure de l’oued au niveau de la plage restera toujours ouvert empêchant la sta-gnation des eaux et il y aura un ralentissement des processus de destruction de la plageet de la dune.Si on veut forcément fixer la dune un système beaucoup plus efficace est l’installation desplantes de Ammophila arenaria qu’on peut facilement reproduire en pépinières. Cetteplante est capable de contenir les mouvements du sable et de consolider la dune avec sonapparat radical.On devra sensibiliser la population locale du dommage causé par la coupure de l’Am-
�
Nom de l’expert: Alison Caffyn and Guy JobbinsSpécialité: Socio-economyEquipe MECO: CURS, UKNom du Site: Zouara
“baseline research for the integrated sustainable management…” 193
mophila arenaria et interdire cette pratique. On devra conseiller l’emploi d’autres maté-riaux pour la construction des paniers et coffins pour maintenir cette forme d’artisanatlocal.Les bestiaux ne devront pas être laissés libres sur la dune. Le pâturage est une pratiqueque doit être absolument abolit.On devra interdire le passage sur la dune à pied et avec autres moyens de locomotion etpermettre l’entrée à la plage seulement en certains endroits. Le passage vers la mer pour-ra être facilité par le mise en place des planches en bois qui retiendront les baigneurs demarcher sur la dune et ses plantes. On conseille de mettre des panneaux pour signalerles comportements permis.Les poubelles devront être nombreuses et les ordures ramassées tous les jours pour empê-cher qu’ils deviennent des pièges à attraction pour les animaux (invertébrés et vertébrés).S’il y a un projet de construire une installation touristique, on devra avoir la précautiond’emporter tous les débris de chantier.On suggère de préserver et promouvoir les sites préhistoriques et les témoignages d’uneforêt fossile au sud de l’oued Zouara, aussi bien que les ruines d’un antique port sur lebord droit de l’oued. Un petit musée pourvoira à contenir les pièces archéologiques etl’histoire de cette zone.Actions formellement proscrites :Il faudra interdire l’entrée à la plage dehors d’endroits permis. La plage et la dune nedevront pas être nettoyées avec moyens mécanisés, mais seulement manuellement enlaissant tout le matériel organique. Les quais et les barrages dans la mer ne devront pasêtre construits, parce que, en déviant les courants marins, ils provoquent seulement desérosions et des cumuls des détritus sur la côte, même à grande distance, sans empêcherl’érosion de la dune de Zouara.
I – Potentialités (dans le domaine d’expertise) des sites tunisiens:Opportunities include :To develop a new model of tourism development for Tunisia – a viable and sustainabletourism development, integrated within the local area – an opportunity to get it right.To draw on good practice and examples from elsewhere in order to maximise local bene-fits and minimise harmful impacts.To use the new dam and reservoir as both a land-based and water based recreationalresource for local people and tourists for fishing and boating.
II – Problèmes, contraintes et nuisances constatés:Problems and constraints include :How to develop an economically viable tourism development without compromisingthe peace, wildness and open spaces so valued by visitors.The short tourism season.
�

194 developing a management plan
Use of water resources.Infrastructure including waste disposal, particularly sewage treatment.Danger of fire to the forestry areas.Accessibility of Zouara – very car dependent.Lack of appropriate labour force locally – need for training and management expertise.Safety – e.g. strong currents in the sea and near-shore boating activities.Tourist activities – what activities are appropriate, where and with what environmentalimpacts?How to ensure benefits for local people and businesses, rather than leakages out of the localeconomy.Underdeveloped agricultural communities in the forest.
III – Recommandations de l’expert en terme de gestion:Recommended actions :– Develop a business plan for the tourism development with full costings and marketassessment to ensure there is a market for the type of development proposed, at the sca-le of development proposed and given the seasonality of the destination.– Undertake market testing – what is the target market? What will they want to do?What will they pay? What is the size of the market and what is the competition? Howwill seasonality impact on the development?– Conduct a full environmental impact assessment to assess impacts on dunes, forest,sea and in particular to assess demands for water, waste disposal and fire risks.– Develop an integrated management plan for the wider area which includes the tou-rism development within the management of the forest, dam, coastline and widercatchment area.– Develop management practices that are adaptive and flexible, decreasing the relianceon fixed plans and better utilising resources distributed to local and regional levels.– Consider forms of more decentralised integrated decision-making and planning– Consult with local stakeholders to find out more about local needs and opportunitiesand to give local people a stake in the new development.– Conduct an economic impact analysis of the proposed tourism development to iden-tify the number of jobs which will be created and the effects on the local and regionaleconomy. The level of ‘embeddedness’ in the local economy is crucial so that benefitswill be felt locally. Do not rely on the ‘trickle down’ of benefits to local people.– Monitor the impacts of the dam and reservoir.– Make investment companies prove how they will ensure local benefits and attachconditions to ensure this happens.– Create a commission to examine the impacts of the dam’s construction on local com-munities, review compensation policies and calculate total economic values of waterresources using modern resource economic assessment techniques.– Develop community institutions, fund agricultural extension and community deve-lopment workers, involving NGOs such as APEL to embark on a programme of inte-grated rural development.

5.2.2 Kneiss
Nom de l’expert: Moncef Gueddari et Ameur OueslatiSpécialité: Géologie et géomorphologieEquipe MECO: Tunisie, FSTNom du Site: Kneiss
“baseline research for the integrated sustainable management…” 195
I – Potentialités (dans le domaine d’expertise)des sites tunisiens:Les potentialités, sur le plan géologique et géomorphologique, tiennent surtout à la qua-lité des paysages naturels, à l’existence de formes de terrains et d’écosystèmes spécifiques,ainsi qu’à une dynamique du milieu particulière en rapport avec un environnement phy-sique original. Le site et ses environs offrent, en plus des potentialités pour le développement éco-nomique (tourisme, pêche, etc.), de grandes opportunités pour la recherche scienti-fiques. – Des potentialités paysagères: Malgré la faiblesse de la topographie, la région montredes paysages naturels d’une beauté exceptionnelle et d’une grande originalité. Les falai-ses des environs de Skhira, les hauts-fonds largement exondés ou envahis par la mer augré de la marée, les îlots perdus au milieu de ces hauts-fonds et les chenaux de marée sontles principales composantes de cette originalité. – Une originalité sur le plan morphologique et sédimentologique: la morphologie sous-marine et la topographie du rivage, d’une part, et l’importance de la marée, d’autre part,ont favorisé la mise en place de formes et de modelés côtiers uniques en leur genre oupeu connus ailleurs dont, en particulier, des marais maritimes à slikkes et schorres carac-téristiques. Ces formes, qui montrent dans le site de Kneiss un grand développement,sont très peu représentées en Méditerranée. De telles conditions naturelles ainsi que le grand développement des hauts-fonds et lescaractéristiques de la topographie sous-marine sont également à l’origine d’une dynamiquesédimentaire originale.– Un patrimoine géologique et archéologiques indéniable (coupes géologiques etdépôts marins et continentaux significatifs, vestiges archéologiques préhistoriques ethistoriques). Les rares coupes géologiques, lorsqu’elles existent, sont souvent trèssignificatives. Elles permettent la connaissance des caractéristiques de la dynamiquedes milieux côtiers et la compréhension des tendances de l’évolution récente des lit-toraux. Les formes et dépôts ainsi que les vestiges archéologiques constituent des repères pré-cieux pour la reconstitution des étapes de cette évolution et des paléoenvironnements; cequi double leur valeur patrimoniale. Une telle démarche est toujours d’un grand intérêtpour la définition des aptitudes à l’aménagement. – Un environnement encore peu anthropisé: il faut y voir une chance, les espaces côtiersnon ou faiblement aménagés étant devenus rares. Ceci permet, mieux qu’ailleurs, la valo-risation des atouts de la nature. Cet intérêt est en fait doublé par la valeur écologique etpar la biodiversité de l’ensemble des hauts-fonds, des îles et du rivage.- Un grand intérêt scientifique: par les caractéristiques-potentialités qui viennent d’êtreénumérées, ce terrain offre de grandes opportunités pour développer de nouveaux axesde recherche en Géologie et en Géomorphologie, relatifs aux milieux côtiers.
�

196 developing a management plan
Nom de l’expert: A. Bayed et M.A. El AgbaniSpécialités: Ecologie marine et OrnithologieEquipe MECO: Institut Scientifique – Rabat, MaroccoNom du Site: Complexe des zones humides des Îles Kneiss
II – Problèmes, contraintes et nuisances constatés:– Des problèmes d’érosion marine: les principaux problèmes constatés sont relatifs à l’é-rosion marine. Certains secteurs (notamment au droit des principaux cours d’eau et aupied de quelques falaises), connaissent une progradation de leur rivage, mais la tendan-ce générale est pour le recul du trait de côte. Les îles, notamment les plus petites d’ent-re elles, sont les plus menacées. L’avancée de la mer est facilitée par la faiblesse de la topographie, le caractère tendre desformations géologiques battues par les vagues et la tendance à la subsidence des terrainscôtiers.– Des problèmes d’érosion hydrique: l’érosion hydrique assure une alimentation sédi-mentaire parfois importante aux estrans et peut, de ce point de vue, être considérée com-me bénéfique au rivage. Mais dans certains cas elle est en train de menacer un patrimoinepédologique déjà faible, des structures archéologiques et des propriétés agricoles. Le pro-blème est parfois devenu épineux, notamment dans l’aire des falaises et dans les margesexternes des plateaux dans lesquels elles sont taillées.
I – Potentialités (dans le domaine d’expertise)des sites tunisiens:– Originalité physionimique du site à l’échelle de la Méditerranée, marquée par l’exis-tence de grandes vasières et de chenaux découvrants à basse mer; grande amplitude demarée permettant l’installation de conditions écologiques très variées.– Larges superficies de vasières, lieu de nourrissage d’oiseaux d’eaux, et tout particuliè-rement des limicoles.– Grande diversité de biotopes et d’habitats pour la flore et la faune, ce qui laisse sup-poser une biodivesité élevée conférant à ce site une importance toute particulière.– Existence de nombreuses zones occupées par les phanérogames marines dont l’intérêtmondial est croissant et qui développe et qui permettent le développement d’une faunespécifique et particuilèrement abondante et diversifiée.– Existence d’îlots favorables au développement d’une végétation spécifique adaptée etpermettant la nidification de larges effectifs d’oiseaux, notamment les laro-limicoles.– Forte diversité et abondance de l’ornithofaune se nourrissant de vasières témoignantd’une grande abondance de microfaune et macrofaune benthique qui trouvent ici lesconditions favorables à leur développement compte tenu de l’arrivée d’eaux douce et parle fort marnage que connaît ce complexe.– Intérêt socio-économique pour la population riveraine par le développement des acti-vités de pêche de poissons et de ramassage de mollusques.– Potientielités éco-touristiques indéniables pour ce milieu tellement particulier etdiversifié.– Vu les importants effectifs d’oiseaux d’eau que peut accueillir le site en hivernage etdurant les périodes de migration, le site répond amplement au critères de sélection de laconvention de Ramsar et peut être considéré comme site d’importance internationale.
�
Nom de l’expert: Alison Caffyn, Guy JobbinsSpécialité: Socio-economyEquipe MECO: CURS, UKNom du Site: Kneiss
“baseline research for the integrated sustainable management…” 197
Pour un certain nombre d’espèces d’oiseaux d’eau, le complexe des zones humides desÎles Kneiss, représente un site clé à l’échelle de toute la Méditerranée occidentale.
II – Problèmes, contraintes et nuisances constatés:– Forte pollution par les déchets en plastique.– Surexploitation des ressources halieutiques (pêche et ramassage de mollusques).– Absence de réglementation de la pêche dans le complexe.– Dérangement des nicheurs et ramassage des œufs pendant la saison de reproductionau niveau des îles.
III – Recommandations de l’expert en terme de gestion:Actions recommandées :– Organisation et réglementation des activités de pêche et de ramassage des mollusques.– Réglementation des accès aux îlots.– Suivi de la qualité des apports des affluents continentaux vers complexe.– Etablissement de programme de suivi des populations d’oiseaux d’eau pendant lespériodes de migration, hivernage et reproduction.Actions formellement proscrites :– Accès aux îlots pendant la période de reproduction des oiseaux.– Utilisation des engins de pêche qui perturbent l’écosystème et provoquent la mortali-té d’espèces non ciblées par la pêche.– Adapter le nombre de barques (bateaux) et des pêcheurs en fonction des potentialitéshalieutiques du complexe des Kneiss.– Perturbation excessive des vasières par le piétinement provoqué par les ramasseurs desmollusques.
I – Potentialités (dans le domaine d’expertise) des sites tunisiens:Opportunities include :To develop a more economically and environmentally sustainable fishery.To identify and develop alternative sources of income for local communities and diver-sify the local economy.To improve access to health and education for the local population.To conserve valuable marine and land environments and habitats.To explore potential for small scale ecotourism, perhaps based on ornithology.
II – Problèmes, contraintes et nuisances constatés:Problems and constraints include :The closure of the shell fishery.Pollution in the Gulf of Gabes.Unsustainable and illegal fishing techniques.
�

198 developing a management plan
Poverty of local population.Declining fish stocks.Power and role of ‘middlemen’ who sell fish at market.Lack of options available to fishermen and local communities.Ineffective management mechanisms – incentives, penalties and appropriate forms ofcredit.Limited water resources.
III – Recommandations de l’expert en terme de gestion:Recommended actions :Introduce new management mechanisms which involve and educate the fishermen andseek their co-operation.Support the development of better and more flexible co-operative arrangements for fis-hermen to buy equipment, sell their fish and work together. Current co-operatives arenot accessible to fishermen due to entry requirements and conditions.Examine means of strengthening enforcement, including the recruiting of local fisher-men and shore patrols.Identify more funding for outreach or extension workers to work with local communi-ties to identify areas of need and opportunity and develop closer relations between localpeople and the administration.Disseminate information about fishery and environmental management more effective-ly to all government departments, local managers and the local community and developbetter communication mechanisms.Work with local officials to develop a ‘listening mentality’ towards local people.Discuss ways of limiting or regulating the power and control of ‘middlemen’, or of invol-ving them in the governance process.Develop alternative forms of economic activity in the area, for example are there oppor-tunities for women to diversify family incomes?Develop social capacity amongst the local population through education and the deve-lopment of more social structures including community institutions as a precursor to co-operatives.Conduct further research into marine pollution and its impacts on marine and terres-trial ecosystems, particularly the threats to humans, fish stocks and birdlife.Consider establishing territories for artisanal fishers, thereby establishing communityresource rights.Actions forbidden :Forbid the use and possession of bottom trawling gear e.g. the ‘kess’, in all fisheries. Other suggestions :Rely less on expensive infrastructural development e.g. the harbour at Zaboussa, andinvest more in community projects, agricultural extension workers etc.
5.3 étude de cas:plan de gestion du site de zouara-nefza et du
site des îles kneiss (tunisie)
Habib Ben Moussa, Fadhel Baccar, Lassad Douffani, Anissa Ksia,Mohamed Hedi Sfar et Sihem Slim
Sur la base du diagnostic établi pour les deux sites de Zouara et de Kneiss et del’analyse de leurs situations particulières, une synthèse a été établie par chaque expertintervenant dans l’équipe d’études afin de définir, de son point de vue, les facteurs desensibilités du site et ses aptitudes à l’aménagement (section 5.2).
Ceci a permis de dégager les orientations de protection, de valorisation et de ges-tion et de définir les actions capables de protéger le site et de lui garantir les condi-tions favorisant le maintien de son équilibre environnemental et paysager.
5.3.1 Premier cas: Le site de Zouara
a. Rappel des facteurs de sensibilité du site Si le site fait preuve d’une certaine richesse écologique et naturelle, cela ne l’empê-
che pas d’être également l’objet de diverses contraintes et menaces à l’affût du maintiende son équilibre environnemental. Celles ci se résument dans les faits suivants:
Les impacts directs et indirects du barrage de Sidi El Barrak : Cet ouvrage constitue,à priori, la menace la plus importante qui risque de générer de graves nuisances au sitede Zouara. On assiste de à présent à plusieurs phénomènes dont principalement:– Une stagnation des eaux du côté de la plage ralentissant le débit de déversement
dans la mer ce qui provoque par conséquent, une stagnation constante des sédi-ments au niveau de la plage et un blocage de l’embouchure de l’oued au niveau dela plage,
– Une pollution des eaux du côté plage causée par le ralentissement du débit d’eau, – Une disparition par submersion par les eaux, des terres cultivées aux niveaux des
berges de l’oued,– Une perturbation de l’équilibre sur les plans écologique, urbain et socio-économique.En terme de prévisions, on s’attend aux conséquences suivantes:– Un ralentissement négatif prochain de la production halieutique et de la recharge
en sable de la plage du à la mise en service du barrage,– Une diminution notable de la surface de la plage,– Une disparition potentielle de la dune naturelle.
La raréfaction des espèces animales adaptées aux dunes mobiles par la mise endéfens pratiquée sur les dunes et la présence de végétation morte qui entravent lemouvement du sable.
200 developing a management plan
Le développement incontrôlé de l’habitat rural et de nombreux petits commercesdans certaines parties du site, menace les surfaces boisées par le grignotage progressifdes terres au profit d’un habitat anarchique.
La menace due aux risques d’incendie est également un facteur à prendre en compt.En effet la forêt de Zouara a subi au courant de l’été 1999 un incendie qui a ravagé plusde 50 hectares dont la cause semble être la rupture de certaines lignes électriques.
La présence de plusieurs vestiges archéologiques dont les plus importants sont unancien port et une quantité non négligeable de vestiges préhistoriques. Ces élémentsconstituent un patrimoine culturel important qui appuie le caractère spécifique de lazone et son besoin en matière de protection.
La dégradation de la faune présente au sein des dunes et ce essentiellement par:– Des dommages affectant la structure génétique des populations de talitrides,– Une paupérisation des arthropodes fouisseurs causée par l’implantation des cons-
tructions permanentes ainsi que par la pression occasionnée par les véhicules auniveau de la plage.La mauvaise exploitation de la plage par les estivants : En effet on remarque que
lors des grandes affluences d’été, les baigneurs affichent le plus grand irrespect parrapport au caractère environnemental du site dans la mesure et outre une sur - fré-quentation parfois abusive des lieux, cette population se caractérise par des pratiquesgénérant pollution, rejet de déchets et d’objets en matière plastique, dégradation dela végétation…
La présence d’un peuplement ornithologique sur les lieux est également un fait àsignaler: En effet la création du plan d’eau du barrage a permis l’installation de cer-taines espèces ornithologiques plongeuses (du groupe des Anatidés). Ce type de pland’eau constitue un milieu de refuge pour les oiseaux d’eau lors des périodes de migra-tion: c’est ici l’un des rares points positifs de l’aménagement du barrage.
La fixation des dunes par des structures horizontales peuvent rompre l’équilibre destabilité de ces dunes mobiles et de remettre ainsi en cause l’équilibre de tout un éco-système.
Le prélèvement de la végétation dans le cadre de l’exploitation de la forêt peutconstituer une menace pour les dunes stabilisées, s’il n’est pas bien géré.
La capture anarchique de certaines espèces animales qui risque de rompre l’équi-libre des ressources naturelles présent dans la zone d’étude. Notons également que lesmoyens de capture de ces animaux, essentiellement le piégeage, sont des procédésirrespectueux pour l’environnement du site et peuvent, si aucune mesure n’est prise,en arriver à la destruction de toutes ou parties des populations faunistiques présentesdans la forêt.
L’utilisation des dunes comme terrains de parcours par des ruminants risque de lesfragiliser d’avantage.
La convoitise du site pittoresque de Zouara pour l’installation d’activités touris-tiques dont certaines sont déjà envisagées qui risque de détruire les richesses aujour-d’hui reconnues sur le site.
b. Les aptitudes du site de Zouara a l’amenagementAinsi les sites particulièrement fragiles qui nécessitent une haute protection ont
été exclus de toutes forme d’aménagement qui risque de générer une fréquentation etune pression sur le sol.

“baseline research for the integrated sustainable management…” 201
Il s’agit notamment:– Des sites renfermant les dunes dont essentiellement celles non consolidées,– Des sites faisant l’objet de mise en défens,– Des sites renfermant des vestiges préhistoriques ou archéologiques et même ceux
où la présence de vestiges est soupçonnée,– Des zones exploitées par l’activité agricole dans la mesure où ce ne sont pas néces-
sairement des sites particulièrement vulnérables mais où il est recommandé depréserver ce type d’occupation,
– Des zones boisées renfermant une végétation précairement établie ou présentantdes signes de dégradation ou de mortalité de certaines espèces,
– Des sites littoraux où il est recommandé de préserver la qualité de plage et de l’en-vironnement marin face au boisement,
– Du parcours de l’oued et de ses abords et surtout le site des travaux du barrage,– De la zone où il y a formation d’une large étendue d’eau provoquée par ces mêmes
travaux,– Du site des travaux de désensablement du débouché de l’oued.
Hormis ces sites, jugés particulièrement vulnérables ou sujets à fortes menaces,les autres parties du territoire de Zouara sont en mesure, sous réserve, de recevoircertains équipements et de supporter certaines activités y compris celles générantune fréquentation humaine pouvant être parfois soutenues.
c. Les orientations de protection et de valorisationCes mesures sont dressées dans l’objectif de protéger les potentialités écologiques
contenues par le site et de garantir le maintien de l’équilibre de cet écosystème vul-nérable et de ses différentes ressources.
Ces mesures sont principalement 4 volets:1. La mise en œuvre de structures de suivi de l’évolution du site; il s’agit de:
– L’établissement de bilans pour évaluer l’évolution des aspects topologiques ettopographiques de la forêt; Ces bilans sont susceptibles de suivre d’une maniè-re exacte les mouvements de la dune et d’observer toute modification poten-tielle,
– L’établissement d’un inventaire, le plus précis possible, ciblant la flore au sein duboisement,
– L’établissement d’un constat relatif aux peuplements faunistiques de la zone boisée,– L’association de certains experts dans les actions de suivi du biotope du site boisé
et de conservation des ressources naturelles reconnues dans le périmètre d’étude,– Le constat de toute forme de dégradation pouvant affecter l’aspect naturel et envi-
ronnemental,– L’établissement d’inventaires concernant l’aspect floristique et la qualité de l’eau
du milieu marin; Cette action permettra essentiellement de mesurer l’évolutiondes herbiers en terme de surface occupée et d’inventorier les espèces végétales,
– Le répertoriage systématique des différents peuplements végétaux au sein de laforêt ainsi que la valorisation des pieds vétérans des espèces existantes,
– La reconnaissance de la valeur scientifique de la forêt de Zouara,– L’établissement de bilans concernant la faune marine; Cet exercice sera en mesu-
re de répertorier les différentes espèces présentes en mer et cela aussi bien quanti-tativement que qualitativement,
– La mise en place d’un système de contrôle des dunes qui constituent le supportterrestre de la forêt,
– Le lancement d’une étude ponctuelle dont l’objet serait l’examen du systèmedunaire de la forêt de Zouara; Cette étude aura pour objectifs l’analyse des condi-tions actuelles, l’évaluation des impacts subis par ce système et enfin rechercher lessolutions les plus adéquates pour remédier aux éventuelles dégradations dont ontpu faire l’objet les dunes,
– Le lancement d’une étude ponctuelle ciblant l’élément du barrage pour identifier:- l’état du site avant les travaux,- l’envergure et les conditions dans lesquelles se sont fait ces travaux,- les impacts exacts subis par le site suite à l’exécution des travaux,- la projection des impacts encore prévisibles risquant d’affecter l’écosystème,
- les solutions auxquelles on peut encore avoir recours pour stopper ou réduirecertains impacts négatifs et pour palier à certaines mutations de l’écosystème,
– L’élaboration d’une étude d’impact sur l’environnement, la plus exhaustive et la pluscomplète possible, de la réalisation du projet touristique préconisé par le SDAZS.
2. La mise en œuvre d’actions de protection:– La mise en place d’un contrôle plus rigoureux de la forêt et le renforcement du
gardiennage,– La défense absolue de tout rejet de détritus et de déchets non biodégradables ris-
quant de polluer l’environnement terrestre et/ou marin de la forêt de Zouara,– La mise en place d’un contrôle rigoureux de la pratique de la plage par les esti-
vants et ce particulièrement au courant de la saison d’été,– La mise en place de procédures d’éclaircissement de la forêt pour empêcher l’eutro-
phisation des espèces végétales et pour parer à l’expansion d’un éventuel incendie,– L’aménagement d’une ceinture coupe feu le long du passage des principales lignes
électriques et voies de circulation dans l’aire de la forêt,– Le nettoyage et l’entretien réguliers et assidus des surfaces boisées,– L’organisation de campagnes de nettoyage de la plage,– L’entretien de la totalité du site (forêt, plage et dunes) à l’aide de moyens manuels
en veillant à préserver le matériel organique et sans avoir recours à des procédésmécanisés,
– L’aménagement sur le site de la plage de collecteurs de déchets en nombre suffisant,– L’interdiction la plus stricte de certaines pratiques employées par les estivants tel
que nettoyage de vaisselle en mer, arrachage de branches…,– L’interdiction de livrer à eux-mêmes les ruminants au sein du périmètre de la forêt,– L’interdiction de l’occupation permanente ou d’une forte pression au niveau des
dunes, essentiellement les premières d’entre elles et les non encore stabilisées,– La réduction de l’exploitation des voies et des chemins menant à la plage et tra-
versant la forêt,– L’aménagement d’un minimum d’accès à la plage en balisant des cheminements
choisis,– La réduction au maximum de la pression générée par le passage et le stationne-
ment des véhicules au sein de la forêt et aux abords de la plage,
202 developing a management plan
– L’interdiction de l’accès à la forêt d’engins lourds,– L’accord d’un intérêt tout à fait particulier au contexte des dunes en défendant
toute action susceptible de générer une perturbation de leur maintien et de leuréquilibre précaire,
– La réglementation de la production urbaine anarchique relevée dans le périmètred’étude et dans son environnement immédiat; Il est recommandé à ce niveau defaire établir un document réglementant les territoires et les conditions de cons-tructibilité de la zone,
– La prise des mesures nécessaires pour empêcher l’occupation et la pratique de latotalité de la forêt quelques soient les orientations décidées par le plan de gestionde la zone,
– L’interdiction sur le sol de la forêt d’intervention lourdes capables de transformer lesconditions topographiques et topologiques du sol ou d’affecter le maintien des dunes,
– L’interdiction d’implanter des structures construites importantes (en terme demasses et d’étendues) sur le sol de la forêt, sur les dunes ou sur la plage,
– L’interdiction de réaliser tout type d’ouvrage en mer risquant de perturber l’éco-système marin; Il est entendu par cela l’aménagement de quais en dur, de barra-ges, de digues…,
– Interdire tout type de projet générant grande affluence et occupation importantedu site, essentiellement les projets hôteliers autres que ceux prévus par le SDAZSde la zone sensible de Tabarka – Zouara.
3. La mise en œuvre d’actions de sensibilisation:– La sensibilisation, à l’aide de recommandations et d’affiches, de la population
locale et des occupants saisonniers au caractère vulnérable du site,– La sensibilisation de la population locale à éviter le prélèvement de certaines espè-
ces végétales.
4. La mise en œuvre d’actions de valorisation et d’aménagement:– La valorisation du site de la source comme un point d’intérêt de la zone sensible
et intégrer ce point dans une dynamique éventuelle à concevoir pour la zone,– La valorisation des sites et des vestiges préhistoriques et archéologiques relevés sur
place ou dans les environs du périmètre d’étude,– La préservation des sites historiques et anciens en aménagement des aires de pro-
tection tout en y interdisant toute fréquentation et toute installation ponctuelleou permanente,
– Le recours à un tourisme de type “écologique” au sein de la forêt; Cet éco-touris-me sera en mesure de minimiser les impacts négatifs pouvant être encourus par lazone suite à une installation hôtelière sur son territoire; D’autre part la pratiqued’un tourisme écologique est susceptible de valoriser d’avantage la zone de Zoua-ra et de contribuer à sa protection,
– L’option de recourir, dans la réalisation de constructions en dur:- à des structures légères n’occasionnant que le minimum de nuisances au site de
la forêt et à celui des dunes,- à des choix structurels ne nécessitant pas de fondations profondes ni des travaux
trop lourds,- à des solutions d’échelle et de traitement (entre autres séquences de façades)
“baseline research for the integrated sustainable management…” 203

s’intégrant dans la dimension de la forêt et ne rompant pas avec la qualité dupaysage de la zone,
– La sélection de matériaux adaptés aux particularités paysagères du site et l’emploide l’élément végétal dans la réalisation d’unités construites au sein du périmètrede la zone d’étude.
d. Le projet d’amenagement1. Options d’aménagementIl s’agira de programmer au sein du périmètre d’étude un certain nombre d’acti-
vités contenues dans des aménagements particuliers de manière à:– Induire une “clientèle” ayant une conscience de la sensibilité environnementale de
la forêt,– Réglementer les conditions selon lesquelles se pratiquent toutes ou parties de la zone,– Dynamiser un contexte culturel déjà présent ou projeté,– Eviter à l’aspect paysager de la forêt toute tentative ultérieure de dégradation,– Garantir au site les meilleures conditions de maintien de son équilibre écologique.
2. Programme d’aménagement (Fig. 5.1)Dans le cadre des options d’aménagement cité ci-dessus, on propose sur le terri-
toire de la forêt les activités suivantes:La projection d’une unique zone de tourisme écologique telle que programmée par
le schéma d’aménagement de la zone sensible de Tabarka – Zouara. L’amorce de cet-te zone est distante d’environ 1,2 kilomètres de la plage et de près de 3 kilomètres del’Oued Zouara et se situe à proximité immédiate de la voie d’accès de la plage deZouara. La surface réservée à la réalisation de la zone touristique est d’une centained’hectares devant accueillir, selon les données du SDAZS, de 1500 à 2000 lits enfonction des densités retenues.
Une structure d’accueil au niveau de l’accès principal à la forêt. Cet aménagementest destiné à la réception des visiteurs ou des estivants allant vers la forêt ou vers laplage et qui seront à cet endroit sensibilisés aux valeurs environnementales et aux rai-sons de la vulnérabilité du site.
Une aire d’animation à proximité de la structure d’accueil projetée. Il s’agira d’unpetit ensemble servant comme première halte aux visiteurs motorisés ayant fait pro-bablement et au préalable d’une longue route. Cette aire d’animation renfermera unecafétéria, un espace de jeux éducatifs pour enfants, ainsi qu’une exposition traitantdes ressources écologiques de la zone et certains éléments de l’archéologie présente surles lieux.
Une zone de relais à proximité de l’accès secondaire à la plage. Cet espace conçu pourla détente du visiteur devra renfermer un petit café où il pourra être consommé boissonset nourriture légère ainsi qu’une aire aménagée destinée à accueillir les pique-niqueurs.L’aire de pique-nique sera équipée du mobilier urbain nécessaire à cette pratique.
Un petit nombre de points buvettes, réparties sur la longueur de la plage. Ces amé-nagements ponctuels n’auront qu’une petite emprise au sol et seront érigés avec desmatériaux légers. La réalisation de ces buvettes ne devra pas être accompagnée de ter-rasses en dur mais tout au plus de quelques mobiliers permettant aux consommateursde s’asseoir pour un court moment.
Une série d’abris pour les pêcheurs. Ces petits abris sont à aménager au niveau
204 developing a management plan

même de la plage, à mi-chemin entre les deux accès à cette dernière Ces aménage-ments de petite envergure, sont destinés un minimum de confort et de fonctionnali-té pour les pêcheurs du coin. Cette initiative est par ailleurs en mesure de matériali-ser un point d’intérêt de la part des visiteurs qui sera susceptible de favoriser d’unepart l’implication du pêcheur dans la nouvelle conception du site après aménagementet d’autre part l’implication du visiteur dans la dynamique active de la zone côtièrede Zouara (techniques de pêche, variétés des espèces pêchées, … ).
Des aires de sport au niveau de la plage. Ce type d’aménagement est imaginé pourproposer des sports nautiques ou de plage nécessitant peu d’équipements et surtout unmatériel non polluant, comme par exemple la plongée sous-marine, le pédalo et la plan-che à voile. De légères structures servant au rangement des équipements seront suffi-santes à l’exercice de ces activités. La pratique de ces sports sera mise à la dispositionaussi bien des estivants de jour que des résidents des unités hôtelières programmées.
Un petit centre ornithologique doublé d’un mirador au niveau du débouché del’oued; en effet et compte tenu des conditions particulières offertes par le plan d’eaudu barrage, on assiste depuis quelques temps au développement de l’avifaune en celieu. Aussi devrait-on profiter de cette opportunité pour offrir aux amateurs de lanature et de l’ornithologie une petite structure leur permettant l’observation de cepeuplement d’oiseaux.
Un léger aménagement ponctuant la source de “Ain Ras el Oued” au sein du ter-ritoire de la forêt. Par aménagement léger il n’est nullement sous entendu un monu-ment commémoratif mais une simple signalisation indiquant la présence de la sour-ce et ses principales caractéristiques.
Une petite aire d’accueil au niveau de la source précitée. Cette aire d’accueil offri-ra au visiteur, et particulièrement au randonneur (sur le parcours de santé), une hal-te de repos où il lui sera possible de consommer entre autre l’eau de la source et de sedétendre à l’ombre des arbres. Sur cette aire d’accueil, un mobilier léger sera mis à ladisposition du visiteur.
Des ateliers artisanaux qui seront prévus toujours à proximité de la source et del’aire d’accueil. Ces ateliers au nombre de six ou sept seront réalisés sous forme de ten-tes et renfermeront des activités artisanales locales comme la confection d’objet enbois ou en peau de brebis, la production, avec des procédés traditionnels, des dérivésdu lait, le tissage d’étoffes, la mise en bouteille de l’eau de la source, l’élevage des fai-sans ou des brebis, la fabrication de couffins …
Des points sanitaires dont la nécessité est due à des conditions de fonctionnalitéincontournables. Il est projeté d’aménager deux unités au niveau de chaque accès à laplage.
A côté de ces installations, il est proposé certains aménagements comme:Une aire de stationnement située au niveau de l’accès principal de la plage. Cette
initiative est destinée à éviter l’empiétement des dunes par les véhicules lesquels circu-lent d’ailleurs d’une manière quelque peu anarchique sur les voies de desserte. Le choixd’éloigner l’aire du parking de la plage est volontaire dans la mesure où les dunes nonstabilisées ainsi que la végétation courent ainsi moins de risques de dégradation.
Une zone tampon de maîtrise foncière autour du village d’Oulija dont l’extensionurbaine “en tache d’huile” est à l’origine du grignotage progressif de la forêt. En effetet en attendant l’élaboration d’une étude susceptible de délimiter définitivement les
“baseline research for the integrated sustainable management…” 205

conditions du développement urbain du village d’Oulija, il est présentement recom-mander de créer une frange contrôlée ceinturant le périmètre bâti.
Un circuit de santé à l’intérieur de la forêt prévu pour la promenade et la randon-née. Cette proposition ne devra pas nécessiter des aménagements importants mais seu-lement quelques travaux légers de déblaiement et une simple signalisation des itinérai-res projetés. Ce parcours est conçu pour arpenter l’espace de la forêt sur quelques kilo-mètres, et rejoindre d’une part la plage et d’autre part la zone touristique programmée.
Des ceintures coupe-feu le long des lignes électriques et des voies principales pourprotéger la forêt contre d’éventuels incendies.
Le renforcement de la voie transversale perpendiculaire au trait de côte et dont l’étatactuel est jugé “en bon état” tout en conservant sa présente largeur, soit quatre mètres.
L’amélioration de la piste longitudinale qui longe la forêt et mène à l’aéroport deTabarka. Celle ci est actuellement difficile d’accès et devient totalement impraticablepar temps de fortes pluies.
3. Utilisateurs potentiels et conditions de fonctionnementLa zone de Zouara, après aménagement, peut accueillir trois types de “clientèles”,
à savoir:– Une “clientèle” composée par les estivants. Ces derniers sont pour la plus grande
part motorisés et cherchent essentiellement la plage et éventuellement quelquesstructures d’accueil et d’animation. Ce type de visiteurs affluent exclusivemententre les mois de mai et d’octobre.
– Une autre “clientèle” formée par les promeneurs et les amateurs de découverte dessites naturels. Cette population est susceptible de fréquenter le site entre les moisde septembre à juin en évitant les mois de juillet et août pendant lesquels la cha-leur n’encourage pas la pratique de la forêt.
– Une dernière “clientèle” relative aux locataires de la zone touristique, qui cherche-ront à découvrir le site en toute saison.Concernant les deux premiers type de visiteurs, ces derniers accéderont au site part
la route de Tabarka, et emprunteront pour la plupart la voie principale d’accès à laplage. C’est pour cette raison qu’il a donc été volontairement choisi de placer à cetendroit l’aire de stationnement où il sera impératif de laisser tout véhicule. En ce lieu,sera aménagée la structure d’accueil où des “orienteurs” ont pour mission de sensibi-liser les estivants au caractère fragile du site et d’instruire les randonneurs sur les acti-vités et les circuits proposés.
A partir de ce point chaque type de clientèle est censé emprunter un circuit différent.
Le circuit d’étéCe circuit intéressera essentiellement les estivants qui chemineront à partir de l’ai-
re de stationnement, la desserte principale jusqu’à arriver à la plage. Sur leur cheminse trouvera l’aire d’animation où il sera possible de profiter du petit café pour se repo-ser et consommer une boisson, où leurs enfants pourront participer aux jeux propo-sés en ce lieu et où ils auront l’occasion de découvrir l’aire d’exposition pour unemeilleure reconnaissance du site.
Une fois sur la plage, ces baigneurs pourront s’installer librement pour quelquesheures où il leur sera possible de s’approvisionner depuis les points buvettes aména-gés à cet effet.
206 developing a management plan
Les amateurs de sport trouveront sur place trois petites stations proposant chacu-ne la pratique d’une activité différente: ainsi il sera possible de louer un pédalo pourune promenade en mer, d’emprunter un équipement de planche à voile ou de rejoin-dre le club de plongée pour se faire initier à ce sport.
Les plus aventureux parmi ces baigneurs pourront longer la côte et découvrir lesabris des pêcheurs où il leur sera possible de découvrir la variété halieutique caracté-risant la zone.
Rien n’empêchera ce type de visiteurs d’emprunter le parcours de promenade ausein de la forêt, ni d’accéder au centre ornithologique.
Les unités accompagnant l’exploitation de la plage seront disponibles de mai àoctobre (compris). Les mois restant, elles seront fermées au public ce qui permettra àla structure de gestion du site de procéder à l’entretien de ces unités (points buvettes,des aires de sport et des points sanitaires).
Le circuit d’hiverLe circuit d’hiver concerne une population peu intéressée par la plage.La clientèle relative au circuit d’hiver sera inviter dans un premier temps dans la
structure d’accueil pour y recevoir une brève présentation du site. Partant de là cettedernière pourra soit se diriger vers la côte pour profiter de l’aire d’animation et pourvisiter le centre ornithologique et accéder au mirador à partir duquel il sera possibled’observer l’avifaune, soit se diriger vers le circuit de santé.
Les randonneurs en question pourront être également accueillis:– Dans le village artisanal où ils visiteront les ateliers et prendront connaissance des
diverses activités proposées et des divers produits disponibles,– Dans le site de la source et dans l’aire d’accueil qui l’accompagne pour faire une halte,– Dans la zone de relais où ils pourront se restaurer dans le café snack ou sur l’aire
de pique-nique.Il sera par ailleurs tout à fait permis à ce type de visiteurs d’accéder à toutes les au-
tres activités proposées par le site y compris celles intégrées à la zone touristique.Les aménagements relatifs aux activités “d’hiver” seront exploités de mars à
novembre (inclus). Les mois de janvier et février seront consacrés à la restauration desunités d’accueil. Sont visés ici la structure d’accueil, l’aire d’animation, la zone derelais, le centre ornithologique, l’aire d’accueil et l’aire de stationnement.
Concernant la clientèle de la zone touristiqueCelle ci pourra accéder dans les meilleures conditions à la totalité des unités et des
aménagements proposés par le présent schéma de gestion et cela selon la saison encours et l’intérêt personnel du touriste.
Pour ce qui est du fonctionnement de la zone touristique et d’après les disposi-tions découlant du schéma directeur d’aménagement de la zone de Tabarka-Zouara,en retiendra: “Afin qu’il n’y ait pas d’appropriation de l’espace forestier par des privés,il est recommandé que seul 30% à 40% des terrains de l’ensemble de la zone soitcédés aux privés pour l’aménagement de leurs unités”. Les chalets de grand luxe: Ils’agit d’unités de grand luxe implantées dans des terrains de 1 hectare et bénéficiantd’un bon niveau de services (femmes de chambre, repas de grande qualité, grandconfort). Leurs capacités ne devraient pas dépasser les 30 lits et leur gestion devra êtreassurée par un système familial dans un cadre chaleureux et très confortable.
“baseline research for the integrated sustainable management…” 207

L’hôtellerie de grand luxe est previe pour une clientèle spécifique qui exige unconfort, loin des foules et sans contraintes (vestimentaires, de programmation, de res-tauration etc …). Il s’agit d’unités hôtelières d’une capacité de 100 à 150 lits facile-ment gérable pour une clientèle exigeante en service et en confort. Seules quatre oucinq unités de ce type peuvent être programmées dans la zone avec des chambres spa-cieuses ou des bungalows.
Les aménagements susceptibles d’intéresser le plus la clientèle touristique à savoir,le village artisanal et le parcours de santé, resteront ouverts en permanence. Devantla nécessité d’entreprendre l’entretien annuel de ces aménagements, il sera prévu ladurée d’une semaine de fermeture (à définir en fonction de l’affluence des visiteurspotentiels).
Les abris de pêcheurs seront opérationnels les douze mois de l’année.Par ailleurs il est nécessaire de programmé un gardiennage permanent et vigilant
sur toute la zone. Ce gardiennage aura pour entre autre mission à veiller à l’applica-tion des interdictions suivantes:– Le prélèvement de faune ou de flore sur le site,– La consommation de produits alimentaires ailleurs que sur les espaces prévus à cet
effet,– Le rejet de restes ou de déchets sur le territoire de la forêt ou en mer,– L’allumage de feux ou l’utilisation de produits inflammables,– La circulation sur le cordon dunaire.
5.3.2 Deuxième cas: Le site des Îles Kneiss
a. Rappel des facteurs de sensibilité des Îles KneissDans un premier temps nous citerons les principales spécificités écologiques et cul-
turelles des îles et qui confèrent précisément au lieu son caractère riche et exception-nel. Ainsi on peut noter:
Une concentration de population ornithologique aussi bien importante que variée,(quelques 300000 oiseaux au moins migrent chaque année à travers le complexe desîles). C’est probablement ici l’aspect le plus riche et le plus exceptionnel qui caracté-rise les Kneiss (il paraît que l’estran est vraisemblablement le plus important de laMéditerranée).
Une flore marine suffisamment riche consistant essentiellement en la présenced’importantes prairies de cymodocées (sur plusieurs milliers d’hectares) situées le longdu littoral et au large des îles.
D’importantes ressources halieutiques en matière de faune qui est à la fois spécifiqueet particulièrement abondante et diversifiée.
De grandes vasières et de chenaux permettant l’installation de conditions écolo-giques très variées.
Une grande biodiversité au niveau de la faune terrestre caractérisée essentielle-ment par une variété d’invertébrés.
Une biodiversité au niveau de la flore terrestre qui n’est pas non plus à négliger (enmatière de différentes espèces de plants et une floraison exceptionnelle au printemps).
Une présence de vestiges archéologiques qui mériteraient certainement une meilleureprotection et des fouilles plus exhaustives car ils représentent une confirmation de l’in-
208 developing a management plan

térêt de la zone (sur l’îlot d’el Hjar et sur celui d’el Gharbia, on peut observer des citer-nes ainsi qu’une quantité d’amphores, sur l’îlot d’el Laboua, on peut voir les restes d’unmonastère et d’une petite église, et un peu partout sur les falaises, mises à nu par l’éro-sion, il y a des vestiges antiques dont un monument funéraire au niveau de l’angle Nord).
Les facteurs de sensibilité des îles sont tout aussi bien représentés par les multiplesformes de nuisances faisant pression sur aussi bien l’environnement terrestre quemarin, dont voilà ci-dessous les aspects les plus préoccupants:
Une pollution non négligeable par hyperthrophisation, qui est essentiellement due:– Aux conséquences de l’industrie de transformation des phosphates,– Au déversement des hydrocarbures.Un phénomène de destruction des prairies de cymodocées qui sont pourtant l’u-
ne des principales richesses du milieu marin et l’un des indices de bonne santé dece milieu.
Des impacts du raclage des fonds marins par des engins de pêche. Notons que lapêche n’est pas réglementée et que ce genre de pratique, quoique défendue est en mesu-re, à long terme, de massacrer définitivement la flore marine présente sur les lieux.
Une grande pollution sur les côtes des îles due à la présence de quantités trèsimportantes de matière plastique et cela sous la forme de bouteilles, de sacs, d’em-ballages…, sans pour autant oublier les boîtes de conserve. Signalons que ce type depollution est tout à fait non biodégradable.
Une surexploitation des ressources en palourdes mais aussi en crevettes. En effet leshabitants des villages côtiers se rendent souvent sur les îles pour y prélever les mol-lusques qu’ils revendent par la suite pour survivre. Cette situation est en mesure degénérer d’importantes conséquences à l’équilibre de ce type de faune sur les lieux, aus-si vaut-il mieux, faute d’interdire définitivement cette pratique, au moins de l’éviterpendant quelques mois de l’année.
Une pratique qui est aujourd’hui sévèrement contrôlée et définitivement interditeet qui consiste d’une part à laisser paître les moutons sur l’île et d’autre part à couperla végétation locale pour en extraire de la matière combustible au profit des habitantsdes villages côtiers.
Un phénomène de massacre des tortues de mer qui sont d’ailleurs le plus générale-ment dépecées sur place. Cette pratique, outre le fait qu’elle soit illicite, est grande-ment néfaste pour la présence de ce type de faune près des îles et pour les chances deleur pérennité.
Des agressions déplorées subites par les espèces ornithologiques dont on prélève lesœufs. Cette pratique minimise la profusion des espèces et menace même leur présen-ce sur le site, cela à côté du dérangement subi par la totalité des races de nicheurs dela part de l’homme.
Une action érosive dont les principaux indices sont la mise à nu des vestigesarchéologiques (essentiellement des citernes) situés aux abords des falaises et quisubissent actuellement un effritement continu.
En considération à toutes ces raisons, qu’elles soient en rapport avec les res-sources identifiées sur les îles ou en rapport avec les différentes menaces dont nousavons ci dessus établi l’inventaire, il est reconnu aux Îles Kneiss un degré de sensi-bilité important et mérité.
“baseline research for the integrated sustainable management…” 209

En réponse à ce constat, il est nécessaire de définir le plus urgeament possible:d’une part, certaines mesures conséquentes à cette situation et capables de proté-
ger le site et de lui garantir les conditions favorisant le maintien de son équilibre envi-ronnemental et culturel,
et d’autre part, un plan de gestion spatial en mesure de garantir une exploitationraisonnable des potentialités relevées et de définir “un mode de fonctionnement” évi-tant au mieux toute dégradation potentielle tout en mettant en valeur les différentesrichesses retenues par les diagnostics établis.
N’oublions pas enfin que le complexe des zones humides des Îles Kneiss repré-sente non seulement un site clé à l’échelle de toute la Méditerranée occidentale maiségalement une richesse écologique dont l’importance est jugée internationale.
b. Les aptitudes du site des Kneiss a l’amenagementIl a été reconnu lors des expertises thématiques dont a fait l’objet le site et surtout
lors des recommandations qui s’en sont découlées que le territoire des îles était toutà fait inapte à recevoir une quelconque implantation ni d’ailleurs une pressionhumaine fréquente et soutenue.
Il demeure cependant que les îles ne sont pas un territoire détaché de tout envi-ronnement physique mais qu’il doit être considéré par rapport à son contexte géo-graphique, c’est à dire par rapport à la portion de la côte continentale qui lui face.Cette dernière, caractérisée par bien moins de facteurs de vulnérabilité que les îles, estappelée dans ce cas de figure à matérialiser la continuité aussi bien géographique quedynamique des Kneiss. Aussi s’agit-il ici de se reposer sur cette partie du littoral pourconcrétiser le contexte actif dans l’aménagement de la zone.
c. Les orientations de protection et de valorisationSur la base de l’étude diagnostique et l’analyse de l’aptitude du site, il ressort les
orientations suivantes:– Exclure sur le territoire des îles toute éventualité d’aménagements lourds ou d’é-
chelle importante,– Exclure sur ce même site toute fréquentation démesurée ou continue,– Envisager certains aménagements, avec réserve, sur l’arrière pays continental,– Insister sur le respect et les interdictions découlant de l’application du D.P.M.
(Domaine Public Maritime) sur cette face continentale,– Envisager un aménagement qui prenne en compte aussi bien la vulnérabilité de
l’archipel des Kneiss que le contexte environnemental de la côte continentale.
d. Les mesures de protectionCes mesures de protection concernent aussi bien le site que les zones ayant une
influence directe ou indirecte sur son equilibre. Leurs objectifs est de préserver lespotentialités naturelles, culturelles et paysagères révélées par le site et de garantir ain-si la pérennité de cet écosystème îlien fragile et le maintien des différentes ressourcesqui y sont observées.
Il s’agit essentiellement:– De protéger la flore terrestre et d’éviter la pratique, aujourd’hui pratiquement
abandonnée, de l’arrachage des végétaux; Un inventaire de cette biodiversité natu-relle est vivement conseillé,
210 developing a management plan
– D’établir un constat de reconnaissance du contexte faunistique diagnostiqué sur lesite d’étude et d’œuvrer pour sa protection; Il est en effet reconnu à travers les exper-tises établies que l’île est le territoire d’une grande variété d’invertébré,
– D’accorder une attention particulière à la présence de la faune ornithologiquerelevée sur le site d’étude; En effet cette dernière paraît être la plus importante desrichesses naturelles et culturelles diagnostiquées sur le milieu îlien,
– De procéder au suivi des espèces ornithologiques qui peuplent l’île ou qui n’y sontque de passage lors des migrations; Ce suivi se fera essentiellement à travers desconstats périodiques et des inventaires destinés à mieux cerner les aspects quanti-tatifs, qualitatif et comportemental des oiseaux,
– De strictement interdire le ramassage et la destruction des œufs; En effet les îlessont réputées pour être le lieu de reproduction de plusieurs espèces ornitholo-giques et cela est d’ailleurs l’une des plus grandes spécificité du milieu,
– D’interdire tout type de gêne occasionnée à la population ornithologique en ter-me de perturbations diverses, de destruction des nids…,
– De protéger les vasières qui non seulement permettent l’installation de conditionsparticulières écologiquement aussi variées qu’intéressantes mais qui offrent desopportunités d’alimentation pour l’ornithofaune présente sur les Îles Kneiss,
– De prendre les mesures nécessaires pour la protection du contexte floristique marindu milieu dans la mesure où d’une part ce milieu est un indicateur de “bonne san-té” de l’écosystème marin et d’autre part, il est sujet à différentes dégradations,
– D’accorder un maximum d’attention à la pollution de l’environnement marin obser-vée sur le site; Cette pollution est d’origine industrielle; A cet effet il est important de:- envisager des actions en mesure d’endiguer l’impact négatif de la dispersion du
phosphogypse en mer à partir des terrils,- veiller à “l’opérationnalité” des moyens de lutte contre un possible déverse-
ment accidentel d’hydrocarbures,– De prendre les mesures qui s’imposent pour empêcher tout acte susceptible de
dégrader les prairies de cymodocées qui peuplent le milieu marin de la zone,– D’interdire les actions en mesure de dégrader les fonds marins particulièrement
par le raclage de ces derniers,– De prohiber certaines techniques de pêche à l’origine de la dégradation des fonds
marins; A cet effet il est conseillé de réglementer la pêche et d’encourager l’emploides techniques de pêche traditionnelles,
– De mettre en œuvre les procédures nécessaires pour le suivi de la qualité del’eau,
– De protéger la faune aquatique (poissons, crustacés et mollusques); L’établisse-ment d’inventaires quantitatifs et qualitatifs serait un moyen efficace pour pouvoircerner le potentiel en aquafaune,
– D’accorder une attention particulière au phénomène de la surexploitation des res-sources en palourdes et en crevettes dans la mesure où ces dernières sont systéma-tiquement récupérées par les pêcheurs artisanaux en provenance de la côte conti-nentale,
– D’interdire le plus strictement possible le massacre des tortues capturées et le plussouvent dépecées sur place,
– D’accorder une attention au phénomène d’érosion observé sur le site; A ce titre il estrecommandé de lancer une étude spécifique dont les objectifs seraient de:
“baseline research for the integrated sustainable management…” 211

- evaluer les effets actuels de l’érosion,- evaluer ce même phénomène sur une période ultérieure établie en fixant des
repères précis,- rechercher et mettre en œuvre des solutions susceptibles de stopper, voire de
diminuer les effets de l’érosion sur le site d’étude,– De procéder à un suivi rigoureux de la qualité des apports des affluents continentaux,– De préserver le site et ses environs des effets de la pollution d’origine humaine; En
effet l’observation la plus flagrante pouvant être faite sur le site est malheureuse-ment celle relative aux amas de déchets non dégradables,
– De procéder au ramassage fréquent et périodique de ce type de déchets aussi biendepuis le continent que sur les îles,
– De renforcer les mesures de gardiennage et de surveillance qui sont déjà présentessur les lieux,
– De protéger le patrimoine archéologique relevé sur le site des Kneiss; Pour cela ilest nécessaire:- d’encourager les actions de fouilles ainsi que les travaux des chercheurs et des
archéologues,- de procéder à des missions de reconnaissance destinées à établir des inventai-
res précis relevant le contenu de ce patrimoine historique,- d’établir des aires de protection des sites reconnus,- d’interdire toute pratique de ces sites à d’autres visiteurs que les archéologues
et les chercheurs en matière d’archéologie,– De veiller, à court terme, au respect de ces sites (piétinement, prélèvement de
matériaux…) par les pêcheurs et autres visiteurs non avertis,– D’interdire catégoriquement tout accès aux petits îlots; Cette interdiction peut
toutefois être occasionnellement levée dans le cas de campagnes d’inventaire ou devisites de chercheurs et/ou de spécialistes,
– De contrôler le plus efficacement possible la fréquentation de l’île principale et deveiller à éviter toute sur-occupation même occasionnelle de ce territoire,
– D’interdire au mieux la fréquentation des lieux pendant la période de reproduc-tion des oiseaux,
– D’interdire, sur le territoire des îles, toute construction ou édifice:- clos et réalisé en dur,- dont les matériaux, l’emprise et la hauteur seraient en contradiction avec les
caractéristiques paysagères du lieu,- en mesure de bouleverser un tant soit peu les caractéristiques et la nature du
sol iléen.
e. Le projet d’amenagementDans la mesure où il a pu être dégagé lors de l’établissement des mesures de pro-
tection les actions à envisager pour la protection du site et la préservation de ses res-sources, la partie suivante sera consacrée à la mise au point du plan de gestion en ter-me d’aménagement.
1. La proposition d’aménagementIl va de soi que les aménagements qui concerneront le territoire des îles seront peu
importants dans la mesure où le caractère fragile de l’écosystème ne permet que très
212 developing a management plan

peu, voire pas du tout d’interventions sur le site et que dans ce cadre précis c’est bienentendu en conséquence de cet équilibre précaire qu’il est nécessaire d’agir.
En contre partie, c’est sur le sol continental, face à l’archipel, que les possibilitésd’aménagement sont permises et que c’est précisément ce territoire qui sera destiné àmatérialiser les conditions écologiques particulières des îles, à présenter les potentielset les richesses en ressources contenues par l’environnement des Kneiss et enfin àconcrétiser la fonction culturelle et ludique qu’il s’agit d’insuffler à la zone.
1. Les propositions d’aménagement sur le territoire des îles (Fig. 5.2)Outre la très haute protection dont devra faire l’objet le territoire de l’archipel et
ce en terme de préservation des ressources naturelles et écologiques relevées et enactions destinées à éviter toute dégradation de ces ressources (voir les mesures de pro-tection), il est proposé sur le site des Kneiss les actions suivantes:
Interdire l’accès aux petits îlots (el Gharbia, el Laboua et el Hajar) par toute sai-son et par tout type de fréquentation, exception faite aux opérations d’inventairesrelevant du suivi de la zone et éventuellement aux chercheurs avec réserve de l’effec-tif présent sur terrain, des travaux à accomplir et de la durée de leur intervention.
Prévoir sur l’île principale, certains aménagements légers en mesure de s’inscriredans une logique d’accueil d’une petite fréquentation “avertie” et de faciliter l’em-barquement et le débarquement depuis ce site. Ces équipements seront situés surDzirat el Bassila et sont essentiellement:
Un petit embarcadère devant nécessairement être en structure légère, cette instal-lation est en mesure de réglementer et de faciliter l’abordage de l’île,
Un abri couvert mais ouvert destiné à recevoir certaines fonctions de premièrenécessité; L’aménagement en question ne devra en aucun cas perturber la nature dela topographie du site ni aller à l’encontre des caractéristiques paysagères des îles,
Un aménagement d’un circuit de promenade et de découverte de l’île ; Ce circuitne devra pas nécessiter d’aménagement lourd mais devra se suffire d’une simple signa-lisation indiquant les cheminements prévus à cet effet.
2. Les propositions d’aménagement sur le territoire continental (Fig. 5.3)Au vu de la grande sensibilité et le peu de disposition à toute pression dont fait
preuve l’archipel des Kneiss, c’est la face continentale qui se chargera de jouer le rôlede continuité au territoire îlien dans les actions de programmation d’un site d’accueil.Aussi s’agira-t-il de prévoir le plus gros de l’aménagement sur cette côte continenta-le, plus précisément sur le site dénommé Zaboussa, qui malgré la présence de plu-sieurs surfaces humides (Sebkhas), est toutefois en mesure d’accepter l’installation dequelques unités fonctionnelles destinées à accueillir les visiteurs du site et les randon-neurs éventuels de l’Ile d’el Bessila.
Ces installations doivent s’inscrire dans un cadre:– de valorisation des ressources paysagères de la zone,– de moyens de reconnaissance du site fragile de l’archipel,– de production d’aires de détente pour le visiteur,– d’intégration du site par rapport à l’arrière pays continental,– de production d’un cadre culturel mettant en relief la richesse de la zone.
Pour répondre à ce type d’impératifs, il s’agit d’imaginer certaines fonctions quisont en mesure de drainer une foule modérée, quelque peu consciente du cadre par-
“baseline research for the integrated sustainable management…” 213
ticulier de la zone, de produire des activités répondant aux attentes de cette clientèle,de dynamiser par là le contexte culturel du site et surtout de respecter la vulnérabili-té environnementale des lieux.
On propose sur le site de Zaboussa l’aménagement d’un petit parc d’environ unecinquantaine d’hectares où il pourra être développé les activités suivantes:
Une structure d’accueil pour recevoir, sensibiliser et orienter le visiteur désireuxd’explorer la zone et/ou se rendre sur l’île d’el Bessila.
Une aire détente en mesure d’offrir au visiteur une halte de repos dans un cadreapproprié en relation avec les caractéristiques du site. Cette aire comprendra une peti-te unité de consommation alimentaire, un espace de jeux pour enfants, un mobilierpour les amateurs du pique-nique…
Un mirador, en matériaux légers, suffisamment élevé, aménagé pour répondre auxvisiteurs voulant dans un premier temps observer depuis le site de Zaboussa, l’en-semble des Îles Kneiss en terme de paysage et de population ornithofaune.
Un petit musée racontant l’historique des îles et renfermant certains vestigesarchéologiques locaux. Cet aménagement est proposé pour d’une part compenserl’impossibilité de la visite de l’îlot d’el Laboua où se trouvent les ruines du Monastè-re de Saint Fulgence datant de la période du Vème - début du VIème siècle, et d’au-tre part pour mettre en valeur le patrimoine archéologique se trouvant aussi bien surle territoire des quatre îles que sur les territoires continentaux d’en face.
Un musée consacré à la flore et surtout à l’ornithologie. En effet, il a été unani-mement reconnu que l’une des valeurs écologiques les plus importantes sur le site desKneiss était l’effectif tout autant que la variété des espèces d’oiseaux peuplant l’archi-pel ou en faisant une halte lors des migrations. Pour cette raison il est proposé dansce cadre l’aménagement d’un local informant le visiteur sur les caractéristiques de cet-te population, les variétés présentes ainsi que les particularités du milieu insulaire enterme de végétation et de paysage.
Un petit centre ouvert essentiellement à la population locale dans le but de la sensi-biliser au cadre environnemental des lieux mais aussi d’offrir l’écoute et l’aide nécessai-re aux pêcheurs et aux ramasseurs de mollusques (activités désormais à réglementer).
A côté de ces activités, il est proposé certains aménagements comme:Une aire de stationnement destinée à accueillir les véhicules motorisés des visiteurs
du site ainsi que les groupes,Un quai permettant l’abordage des embarcations et leur stationnement entre
chaque navette,Un circuit de promenade pédestre distribuant essentiellement les sites littoraux et
permettant l’observation de l’archipel et sa population ornithologique depuis la terreferme,
Une liaison viaire, sans matériaux rigides, reliant le village de Hachichina au sitecôtier de Zaboussa. La voie à aménager suivra dans un premier temps la trace de lapiste existante sur la frange Ouest de Zaboussa puis aura à rejoindre le site proposé àl’aménagement et ce jusqu’au abords du littoral au Nord-Est d’el Guettaia.
Une dernière proposition viendra compléter le programme, il s’agit de l’organisa-tion d’un circuit de découverte du site par voie de mer. Cette activité aura comme
214 developing a management plan
support des embarcations destinées à cet effet qui quitteront l’embarcadère situé àZaboussa pour longer les petits îlots et rejoindre Dziret el Bessila en y accostant ouen la contournant, pour revenir par la suite au point de départ.
Enfin, rappelons que dans le cadre de la proposition d’aménagement et de gestiondu site des Kneiss, les mesures de protection développées plus haut restent non seu-lement d’actualité mais résument dans leur contenu les actions essentielles à entre-prendre pour mettre au point un plan de gestion cohérent et un aménagement com-patible avec le caractère de la zone; Aussi il s’agit de garder en mémoire les impératifsde préservation du milieu et de mise en valeur des ressources qui restent les actes lesplus essentiels et les plus urgents à mettre en œuvre dans la politique de gestion desÎles Kneiss.
3. Utilisateurs potentiels et conditions de fonctionnementLe parc est destiné à recevoir aussi bien un public averti (amateur d’ornithologie
ou d’archéologie…) qu’une population profane venant sur le site pour y trouver lerepos et la détente et profiter des activités culturelles proposées pour éventuellements’instruire sur certains sujets. Le flux des visiteurs rejoindra le site de Zaboussa depuisle village de Hachichina donc depuis la Route Nationale 1 et sur une distance depresque huit kilomètres à vol d’oiseau. La distance réelle à parcourir par voie carros-sable est de l’ordre de 10,5 kilomètres.
A l’entrée de la zone aménagée se situe l’aire de stationnement et l’unité d’accueil desvisiteurs: c’est à partir de ce point d’accueil qu’il s’agira de renseigner le visiteur sur lanature des activités offertes aussi bien sur la zone continentale que sur le territoire desKneiss ainsi que sur les procédés d’exploitation établis par le présent plan de gestion.
Plusieurs circuits sont proposés au visiteur:Le premier parcours se développe sur la partie continentale de la zone. Il s’agira
d’emprunter le circuit de promenade en profitant des points d’animation aménagés. Lepremier de ces points est l’aire de détente qui comprendra une cafétéria offrant à ceuxqui le désirent l’opportunité de consommer une boisson ou un aliment. Il est bienentendu hors de question que cette activité ne se substitue à celle d’un restaurant néces-sitant un approvisionnement important et certaines dépendances telles que cuisines etc.
Une terrasse accompagnera la cafétéria et permettra aux visiteurs de s’installer en pleinair pour profiter du cadre offert par l’aménagement projeté. Un mobilier urbain viendraagrémenter cette terrasse: il est proposé dans ce contexte de prévoir des chaises et destables en bois et étoffe en essayant d’éviter le mobilier en matière plastique.
L’aire de détente comprendra un espace de loisirs pour enfants où il sera aménagédes jeux de plein air ainsi que des activités éducatives ayant pour principal thème laprotection de l’environnement et la sensibilisation au caractère vulnérable de l’archi-pel et aux ressources ornithologiques.
Plus loin se trouvera le musée de l’archéologie dont les espaces seront employés àl’exposition des vestiges archéologiques récupérés sur le milieu continental où sur lesterritoires des Îles Kneiss.
A côté de l’exposition, l’espace du musée s’appuiera sur des ouvrages écrits et desaffiches pour relater l’historique des îles, leur occupation par les moines… Le muséeen question pourra renfermer des maquettes reprenant par exemple le Monastère deSaint Fulgence.
“baseline research for the integrated sustainable management…” 215
Un petit espace de documentation pourra accompagner l’activité d’exposition. Ilpourra être mis à la disposition des visiteurs des ouvrages sur l’histoire de la zone oude sites voisins ou encore des travaux de chercheurs ayant opéré sur le périmètre.
Après avoir visité, pour ceux que cela intéressera, le petit centre destiné à la popu-lation locale, le parcours débouchera sur le musée de l’ornithologie, de la faune et dela flore locale. Ce musée racontera par voie d’affiches, de photos, d’illustrations et devisites guidées la richesse exceptionnelle des Kneiss en matière d’ornithologie et ren-seignera le visiteur sur la végétation et les invertébrés caractérisant la zone. Desmaquettes résumant les circuits de migration des oiseaux pourront enrichir la visite.
Parmi les activités proposées par le musée de l’ornithologie, il y aura celle qui pré-parera le promeneur à la visite du mirador.
Ce mirador est la dernière étape du circuit; Il offrira aux intéressés la découverte,à l’œil nu ou à travers des moyens installés sur place comme des jumelles ou des lon-gues vues, d’explorer le site des Kneiss et d’en contempler la population ornitholo-gique qui fait sa célébrité. Une personne qualifiée devra occuper les lieux du miradoret aura pour fonction de renseigner le visiteur sur les points d’intérêts offerts par lepaysage et sur les espèces et les caractéristiques des oiseaux qui pourront être observésdepuis les paliers du mirador.
Le parcours finira par conduire à l’embarcadère.Le site aménagé de Zaboussa pourra fonctionner neuf mois sur douze dans la
mesure où les conditions climatiques seront vraisemblablement inadéquates aux acti-vités proposées au courant des mois de décembre, de janvier et de février.
Durant les mois d’accueil, le parc pourra fonctionner de 9 heures du matin jus-qu’à la tombée de la nuit.
Il sera défendu à chaque visiteur de pratiquer des actes allant à l’encontre desimpératifs de protection de la zone établis précédemment.
Le deuxième circuit prend justement son départ depuis cet embarcadère.L’activité qui y est proposé est une randonnée par voie de mer permettant de visi-
ter à distance le complexe des Îles Kneiss et d’en observer le paysage.Cette activité se fera grâce à des embarcations prévues à cet effet.Les visiteurs intéressés par ce type de loisirs seront accompagnés dans cette activi-
té par un guide qui les renseignera sur les points d’intérêt qu’ils rencontreront et surles sites qu’ils observeront.
Le circuit proposé partira depuis l’embarcadère prévu à Zaboussa puis s’orientera versle Sud jusqu’à l’îlot d’el Gharbia qu’il contournera pour longer les côtes orientales de Dzi-ret el Laboua et de Dziret el Hajar. Par la suite l’embarcation approchera Dziret el Bes-sila par l’Est et la contournera au Nord, puis s’orientera à vers le Sud pour longer à nou-veau les îlots sur l’autre versant et retourner finalement à l’embarcadère de Zaboussa.
Ce circuit devra durer en moyenne quatre heures et pourra être réalisé 2 à 4 foispar jour selon affluence et succès de la randonnée.
Un effectif de trente personnes est à prévoir lors de chaque voyage.L’activité en question pourra se dérouler à partir du mois d’avril et jusqu’au mois
d’octobre compris (sept mois sur l’année).
Le troisième circuit est identiquement le même que le précédent sauf qu’il offriraà certains, qui le désirent, de débarquer momentanément sur Dziret el Bessila.
216 developing a management plan

La seule activité permise sur el Bessila est la randonnée sur l’itinéraire apprêté à ceteffet. Le circuit en question se développe sur environ 5 kilomètres et permet l’explo-ration de la partie centrale de l’île et de la zone humide qui l’occupe.
En milieu de circuit, le randonneur peut faire une halte sous un abri. Cet aménage-ment n’est ni destiné à la détente ni à la consommation alimentaire, il a pour seul butd’offrir un peu d’ombre, un siège et de l’eau, ou en cas de nécessité un soin urgent.
Les visiteurs intéressés par ce circuit pourront être déposés sur l’île d’el Bessila parl’embarcation qui assure le circuit de la randonnée par voie de mer être récupérés parle voyage suivant.
On retiendra que la durée de la randonnée sur l’île sera de l’ordre de quatre heures.La visite de l’île ne pourra se faire que du mois d’avril à celui d’octobre et sera stric-
tement interdite pendant la période de reproduction des oiseaux.Seuls dix personnes au maximum pourront se trouver sur l’île simultanément.La visite d’el Bessila doit nécessairement se faire en présence d’un guide spécialisé.Il sera interdit aux visiteurs d’el Bessila:
– Le prélèvement de faune ou de flore sur le site de l’île,– La consommation de produits alimentaires et/ou le rejet de restes ou de déchets
in situ,– La dégradation du patrimoine naturel se trouvant sur l’île,– La circulation sur le territoire ailleurs que le circuit prévu à cet effet,– La perturbation des oiseaux (ramassage d’œufs, destruction de nids, pourchasse…).
5.3.3 Conclusion
Les approches adoptées pour la proposition d’aménagement des deux sites sensiblesde la forêt de Zouara et celui des îles Kneiss restent similaires bien qu’il s’agisse de pro-blématiques différentes. Forêt littorale de fixation de dunes et espaces insulaires. Eneffet, la collaboration de plusieurs experts avec chacun son analyse et son approche par-ticulière a permis de confronter les idées et de fixer les priorités pour la protection et lavalorisation de ces sites dans une perspective de développement durable.
Ainsi, les aménagements projetés répondent nécessairement aux objectifs tracés:– Valoriser les spécificités paysagères des lieux,– Produire les moyens permettant la reconnaissance du caractère fragile de la zone,– Produire des aires de détente pour le visiteur,– Réaliser un cadre culturel susceptible de valoriser le site de la forêt et des espaces
insulaires sensibles.
“baseline research for the integrated sustainable management…” 217
Fig.
5.1
Sché
ma
d’am
énag
emen
t de
la z
one
de Z
ouar
a
Fig.
5.2
Sché
ma
d’am
énag
emen
t de
Kne
iss e
t Zab
oussa
Fig.
5.3
Sché
ma
d’am
énag
emen
t de
site
de Z
abou
ssa
chapter 6integration in monitoring and management
Alison Caffyn and Guy Jobbins
This manual has demonstrated the great diversity in Mediterranean sandy and lowcoasts. It has identified the wide range of threats which these sensitive environmentsface and the many challenges which face managers. The case study sites studied dur-ing the MECO project have demonstrated this diversity in practice.
The project has also demonstrated the diversity of scientific disciplines andresearch methodologies which can be used to study coastal environments. Managerswill have to choose which methods are most appropriate for their sites but the impor-tance of taking a broad approach incorporating a range of indicators has been shown.
From the perspective of management the two most salient facts about ecosystemsare their unpredictability, and their ‘openness’. Small changes in nutrient input, sed-iment flow or salinity can have disproportionate effects on productivity, species rich-ness and composition, for example, and changes in ecosystems can be very rapid anddifficult to reverse. Often the source of such changes can be outside the area of imme-diate management, as in downstream effects of dam construction or the loss of breed-ing habitat for migratory fish stocks. In this sense ecosystems tend to be ‘open’ withrespect to human spatial boundaries, e.g. national borders.
When the interactions between human and natural systems are considered, themanagement problems arising from these two facts are multiplied. Not only are ecosys-tems ‘open’ with respect to divisions of the human economy, such as between tourismand agriculture, but market forces on a potentially global scale begin to effect the deci-sions of resource users. This was shown to be the case at Kneiss, where fishers’ increasedaccess to an international market in Sfax has contributed to the decline of local fishstocks. Unpredictability is also increased, as it is not always clear how resource users orthe ecosystem itself will respond to management intervention. New laws, regulationsand management interventions sometimes result in unforeseen consequences that maybe problematic. This is usually what happens when decisions are made on the basis ofincomplete analysis, and interventions focus on tackling symptoms rather than causes.
Successful management approaches recognise the complexity of the task facingthem. The site needs to be considered in its wider spatial, bio-physical, and socio-eco-nomic context in multidisciplinary studies that include analyses of previous manage-ment strategies. Management policies, plans and actions need to be co-ordinatedboth horizontally and vertically, but managers must recognise that resource users are
the day-to-day managers of resources; the effectiveness of regulations and policiesdepends upon whether resource users decide to comply with them. The state shouldattempt to engage with stakeholders at a level that goes beyond simply informingtowards building consensus. We are proposing a more consensual, inclusiveapproach. We feel it is essential that both research and management address thiswider context if they are to be successful.
Finally, plans and decision-making processes need to reflect the unpredictabilityof the system they attempt to govern. Plans should be flexible, and related to the con-stant monitoring of indicators.
The key to effective monitoring is to identify the important issues and threats ateach site and to then choose a range of appropriate indicators of all sectors. Managersshould try to integrate the aims and objectives, the monitoring systems, the decisionmaking process and the management strategies which result. Successful integrationhelps avoid misunderstandings, conflicts or duplication of effort. It also helpsincrease efficiency and effectiveness of planning and management actions.
The following check list is presented as a summary of key points made within themanual. It will inevitably not be possible to achieve all points in most locations butwe hope it will be helpful for managers to assist in the development, implementationand evaluation of their strategies.
Integration of aims and objectives– adoption of clear aims and objectives, understood by all stakeholders, – develop a shared vision which identifies genuine issues and real needs,– promote consensus through early involvement of all stakeholders,– seek sustainable use and development of the area.
Integration of monitoring systems– analyses and assessments which cut across scientific disciplines,– identify baseline information as far as possible,– monitoring which includes applied research components,– provide reliable and necessary information available to all stakeholders.
Integration in decision making, planning and management of beach and coastal areas – the horizontal integration of separate economic sectors and the associated units of
government which significantly influence the planning and management ofcoastal resources and environments,
– the vertical integration of all levels of government and non-governmental organi-sations (local, regional, national and international),
– a planning and management perspective which combines land use and sea useprocesses,
– a programme which includes education for all stakeholders - local people, visitorsand managers,
– the active involvement of all stakeholders,– regular monitoring and evaluation of the overall process.
222 integration in monitoring and management

We hope this manual has contributed to develop better understanding and co-operation between scientists and managers. Scientists should focus on managementobjectives and constraints when developing scientific techniques which can then beimplemented by practitioners on an ongoing basis. Managers should develop more indepth and wider ranging knowledge about their sites and be prepared to evaluate andadapt management practices and systems if necessary.
It is important to sustain diversity in ecosystems and in the socio-economic envi-ronment. Integrated research methodologies are required for integrated managementand sustainable development. Complete integration may not be possible but the aimis to develop more integrated approaches and to improve integration in all aspects ofmonitoring and management. To this aim we would welcome comments from read-ers, both scientists and managers, on their own experiences and recommendations.
“baseline research for the integrated sustainable management…” 223

Printed in ItalyTipografia ABC
Sesto Fiorentino - FlorenceApril 2002