Embed Size (px)
Citation preview

Basel II Pillar III Quantitative Disclosures
As at 30 June 2014

Ithmaar Bank B.S.C
Basel II Pillar III Quantitative Disclosures at 30 June 2014
INDEX
S. No. Description Page No.
1 Background 3
2 Basel II Framework 3
3 Methodology 3
4 Approaches adopted for determining regulatory capital requirements 4
5 Group structure 4
6 Consolidated Capital Structure for capital adequacy purpose 5
7 Disclosure of the regulatory capital requirements for credit risk under
standardized approach
6
8 Gross credit exposures 7
9 Geographical distribution of credit exposures 8
10 Industrial distribution of credit exposures 9
11 Maturity breakdown of credit exposures 10
12 Related-party balances under credit exposure 11
13 Past due and impaired financings and related provisions for impairment 12
14 Past due and impaired financings by geographical areas 13
15 Details of credit facilities outstanding that have been restructured during the
six month period ended 30 June 2014
13
16 Credit exposures which are covered by eligible financial collateral 13
17 Disclosure of regulatory capital requirements for market risk under the
standardized approach
14
18 Disclosure of regulatory capital requirements for operational risk under the
basic indicator approach
14
19 Tier one capital ratios and Total capital ratios 14
20 Equity positions in Banking book 15
21 Gross income from Mudaraba and profit paid to Unrestricted Investment
Accountholders (URIA)
15
22 Movement in Profit Equalization Reserve and Provisions – URIA 16
23 Gross return from Restricted Investment Accounts (RIA) 17
24 Average declared rate of return on General Mudaraba deposits 17
25 Profit rate risk 17
26 Currency risk 18
27 Performance ratios 18
28 Liquidity rations 18
29 Legal contingencies and compliance 18

Ithmaar Bank B.S.C
Basel II Pillar III Quantitative Disclosures at 30 June 2014
1. Background
2. Basel II Framework
-
-
-
3. Methodology
-
-
As per the requirements of CBB’s Basel II capital adequacy framework, the method for calculating the
consolidated capital adequacy ratio for the Group is summarized as follows:
Line by line consolidation is performed for the risk exposures and eligible capital of all the subsidiaries
within the Group with the exception of Ithmaar’s banking subsidiaries incorporated outside Kingdom of
Bahrain which are operating under Basel II compliant jurisdictions, where full aggregation is performed of
the risk weighted exposures and eligible capital as required under Prudential Consolidation and
Deduction module (PCD).
The Public Disclosure (PD) module of the Central Bank of Bahrain (CBB) rulebook was introduced with effect
from January 2008. The disclosures in this report are in addition to the disclosures set out in the Group’s interim
condensed consolidated financial statements for the six month period ended 30 June 2014, presented in
accordance with Financial Accounting Standards (FAS) issued by the Accounting and Auditing Organisation for
Islamic Financial Institutions (AAOIFI). These disclosures are mainly related to compliance with the Basel II
Pillar III Quantitative disclosure requirements and should be read in conjunction with the Group’s interim
condensed consolidated financial information for the six month period ended 30 June 2014.
Pro-rata aggregation of risk weighted exposures and eligible capital of Ithmaar’s significant investments
(20% – 50%) in banking and other financial entities as required under PCD module.
CBB has issued Basel II guidelines for the implementation of Basel II capital adequacy framework for Banks
incorporated in the Kingdom of Bahrain.
The Basel II framework provides a risk based approach for calculation of regulatory capital. The Basel II
framework is expected to strengthen the risk management practices across the financial institutions.
The Basel II framework is based on three pillars as follows:-
Pillar I: Minimum capital requirements including calculation of the capital adequacy ratio
Pillar III: Market discipline which includes the disclosure of risk management and capital adequacy
information.
Pillar II: Supervisory review process which includes the Internal Capital Adequacy Assessment Process
3

Ithmaar Bank B.S.C
Basel II Pillar III Quantitative Disclosures at 30 June 2014
4. Approaches adopted for determining regulatory capital requirements
5. Group Structure
Ownership Approach
66.6 per cent Full Aggregation
The approach adopted for determining regulatory capital requirements under CBB’s Basel II guidelines is
summarised as follows:
The Group’s interim condensed consolidated financial information are prepared and published on a full
consolidation basis, with all subsidiaries being consolidated in accordance with AAOIFI. However, the CBB’s
consolidated capital adequacy methodology accommodates both line-by-line and aggregation forms of
consolidation.
Standardised approach
Standardised approach
Basic Indicator approach
Credit Risk
Market Risk
Operational Risk
Line by line consolidation is performed for the risk exposures and eligible capital of all the subsidiaries within the
Group except for the following:
Subsidiary
Country of
Incorporation
Faysal Bank Limited Pakistan
4
Ithmaar Bank B.S.C
Basel II Pillar III Quantitative Disclosures at 30 June 2014
(Expressed in thousands of United States Dollars unless otherwise stated)
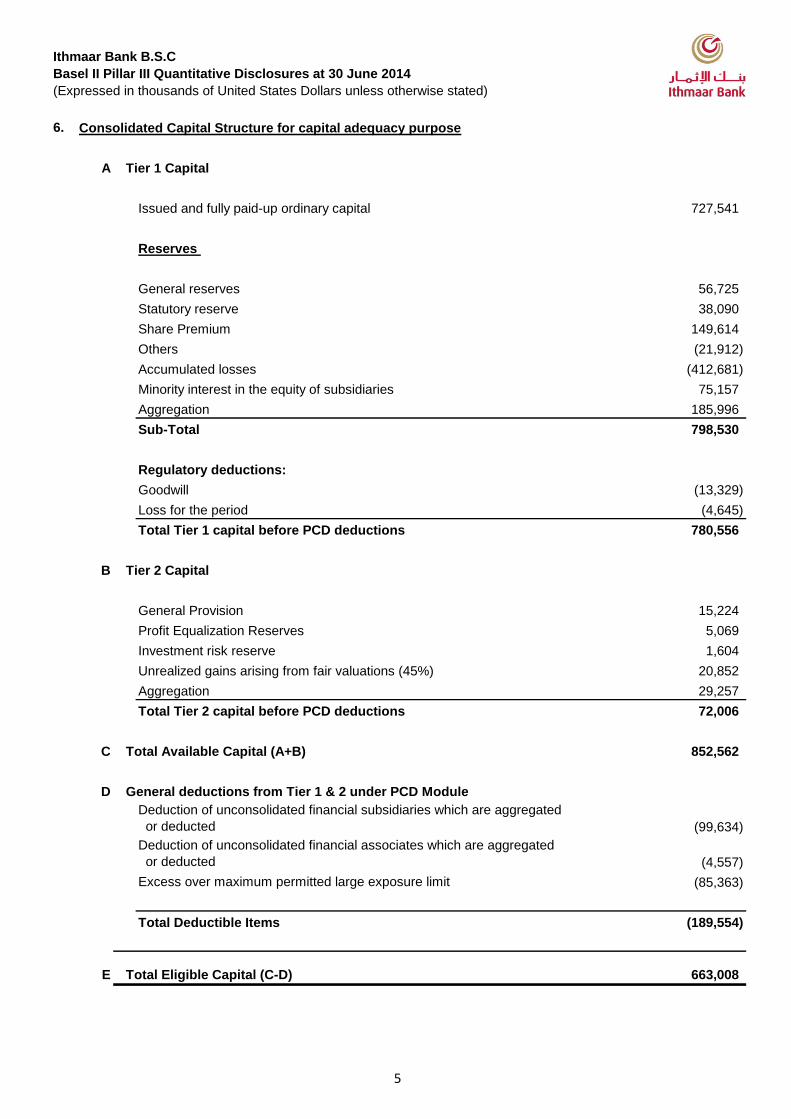
6. Consolidated Capital Structure for capital adequacy purpose
A
Issued and fully paid-up ordinary capital 727,541
Reserves
General reserves 56,725
Statutory reserve 38,090
Share Premium 149,614
Others (21,912)
Accumulated losses (412,681)
Minority interest in the equity of subsidiaries 75,157
Aggregation 185,996
Sub-Total 798,530
Regulatory deductions:
Goodwill (13,329)
Loss for the period (4,645)
Total Tier 1 capital before PCD deductions 780,556
B
General Provision 15,224
Profit Equalization Reserves 5,069
Investment risk reserve 1,604
Unrealized gains arising from fair valuations (45%) 20,852
Aggregation 29,257
Total Tier 2 capital before PCD deductions 72,006
C 852,562
D
Deduction of unconsolidated financial subsidiaries which are aggregated
or deducted (99,634)
Deduction of unconsolidated financial associates which are aggregated
or deducted (4,557)
Excess over maximum permitted large exposure limit (85,363)
Total Deductible Items (189,554)
E 663,008
Tier 1 Capital
Tier 2 Capital
Total Available Capital (A+B)
General deductions from Tier 1 & 2 under PCD Module
Total Eligible Capital (C-D)
5

Ithmaar Bank B.S.C
Basel II Pillar III Quantitative Disclosures at 30 June 2014
(Expressed in thousands of United States Dollars unless otherwise stated)
7. Disclosure of the regulatory capital requirements for credit risk under standardized approach
Exposure funded by Self Finance
Risk weighted assets Capital requirement
Claims on sovereign 84,491 10,139
Banks 122,566 14,708
Corporate portfolio 426,549 51,186
Investments in securities 1,039,979 124,797
Holding of real estate 856,111 102,733
Regulatory retail 1,680 202
Past due financings 135,910 16,309
Other assets 197,475 23,697
Aggregation 1,453,844 174,461
Total 4,318,605 518,232
Exposure funded by Unrestricted Investment Accounts (URIA)
Risk weighted assets Capital requirement
Corporate portfolio 83,866 10,064
Equity portfolio 19,097 2,292
Holding of real estate 20,331 2,440
Regulatory retail 175,347 21,042
Past due financings 77,168 9,260
Total 375,809 45,098
6

Ithmaar Bank B.S.C
Basel II Pillar III Quantitative Disclosures at 30 June 2014
(Expressed in thousands of United States Dollars unless otherwise stated)
8. Gross credit exposures:
Gross credit exposure
Average gross credit
exposure
Credit risk exposure relating to on balance
sheet assets are as follows:
Cash and balances with banks and central banks 668,199 631,935
Commodity and other placements with banks,
financial and other institutions 383,352 440,837
Murabaha and other financings 3,306,155 3,229,900
Musharaka financing 75,238 68,670
Investments 2,563,377 2,525,438
Other assets 295,802 281,497
Fixed assets 118,699 116,932
Intangible assets 223,829 223,687
Total on balance sheet credit exposure 7,634,651 7,518,896
Credit risk exposure relating to off balance
sheet items are as follows:
Financial guarantees and irrevocable letters of
credit 858,470 905,223
Financing commitments, Undrawn facilities and
other credit related liabilities 2,378,249 2,515,945
Total off balance sheet credit exposure 3,236,719 3,421,168
Total credit exposure 10,871,370 10,940,064
Total credit exposure financed by URIA 2,013,236 2,021,123
Total credit exposure financed by URIA (%) 18.52% 18.47%
Average gross credit exposures have been calculated based on the average of balances outstanding during the
six month period ended 30 June 2014.
7

Ithmaar Bank B.S.C
Basel II Pillar III Quantitative Disclosures at 30 June 2014
(Expressed in thousands of United States Dollars unless otherwise stated)
9. Geographical distribution of credit exposures:
Asia/ Pacific Middle East Europe
North
America Others Total
On-balance sheet items
Cash and balances with banks and central banks 288,737 205,924 132,229 41,309 - 668,199
Commodity and other placements with banks, financial and
other institutions - 347,045 28,754 - 7,553 383,352
Murabaha and other financings 1,793,626 1,169,361 226,342 128 116,698 3,306,155
Musharaka financing 75,238 - - - - 75,238
Investments 1,259,283 1,127,677 147,747 28,670 - 2,563,377
Other assets 156,840 84,894 37,220 16,843 5 295,802
Fixed assets 58,564 60,067 68 - - 118,699
Intangible assets 24,186 195,584 4,059 - - 223,829
Total on balance sheet items 3,656,474 3,190,552 576,419 86,950 124,256 7,634,651
Off balance sheet items 2,539,403 661,860 27,926 - 7,530 3,236,719
Total credit exposure 6,195,877 3,852,412 604,345 86,950 131,786 10,871,370
The Group uses the geographical location of the credit exposures as the basis to allocate to the respective geographical region as shown above.
8

Ithmaar Bank B.S.C
Basel II Pillar III Quantitative Disclosures at 30 June 2014
(Expressed in thousands of United States Dollars unless otherwise stated)
10. Industrial distribution of credit exposures:
Banks and
financial
institutions
Trading and
manufacturing
Property and
construction Services
Private
Individuals Textile Others Total
On-balance sheet items
Cash and balances with banks
and central banks 668,199 - - - - - - 668,199
Commodity and other placements
with banks, financial and other
institutions 383,352 - - - - - - 383,352
Murabaha and other financings 424,071 1,251,789 197,589 193,046 838,382 113,730 287,548 3,306,155
Musharaka financing - 30,066 - 29,558 12,524 920 2,170 75,238
Investments 1,678,694 170,289 574,910 108,714 28,721 - 2,049 2,563,377
Other assets 201,357 15,988 32,132 7,421 35,634 36 3,234 295,802
Fixed assets 60,341 - 58,358 - - - - 118,699
Intangible assets 223,829 - - - - - - 223,829
Total on balance sheet items 3,639,843 1,468,132 862,989 338,739 915,261 114,686 295,001 7,634,651
Off balance sheet items 780,612 1,267,327 424,718 130,196 193,132 37,351 403,383 3,236,719
Total credit exposure 4,420,455 2,735,459 1,287,707 468,935 1,108,393 152,037 698,384 10,871,370
9
Ithmaar Bank B.S.C
Basel II Pillar III Quantitative Disclosures at 30 June 2014
(Expressed in thousands of United States Dollars unless otherwise stated)
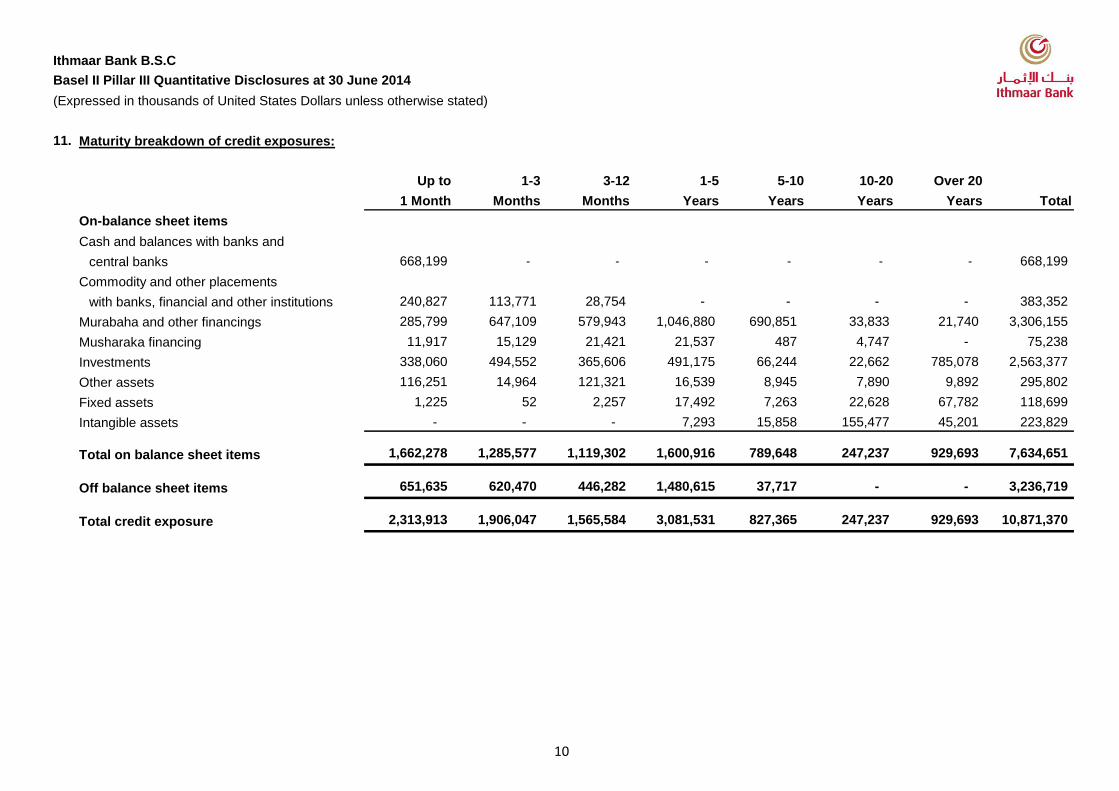
11. Maturity breakdown of credit exposures:
Up to 1-3 3-12 1-5 5-10 10-20 Over 20
1 Month Months Months Years Years Years Years Total
On-balance sheet items
Cash and balances with banks and
central banks 668,199 - - - - - - 668,199
Commodity and other placements
with banks, financial and other institutions 240,827 113,771 28,754 - - - - 383,352
Murabaha and other financings 285,799 647,109 579,943 1,046,880 690,851 33,833 21,740 3,306,155
Musharaka financing 11,917 15,129 21,421 21,537 487 4,747 - 75,238
Investments 338,060 494,552 365,606 491,175 66,244 22,662 785,078 2,563,377
Other assets 116,251 14,964 121,321 16,539 8,945 7,890 9,892 295,802
Fixed assets 1,225 52 2,257 17,492 7,263 22,628 67,782 118,699
Intangible assets - - - 7,293 15,858 155,477 45,201 223,829
Total on balance sheet items 1,662,278 1,285,577 1,119,302 1,600,916 789,648 247,237 929,693 7,634,651
Off balance sheet items 651,635 620,470 446,282 1,480,615 37,717 - - 3,236,719
Total credit exposure 2,313,913 1,906,047 1,565,584 3,081,531 827,365 247,237 929,693 10,871,370
10
Ithmaar Bank B.S.C
Basel II Pillar III Quantitative Disclosures at 30 June 2014
(Expressed in thousands of United States Dollars unless otherwise stated)
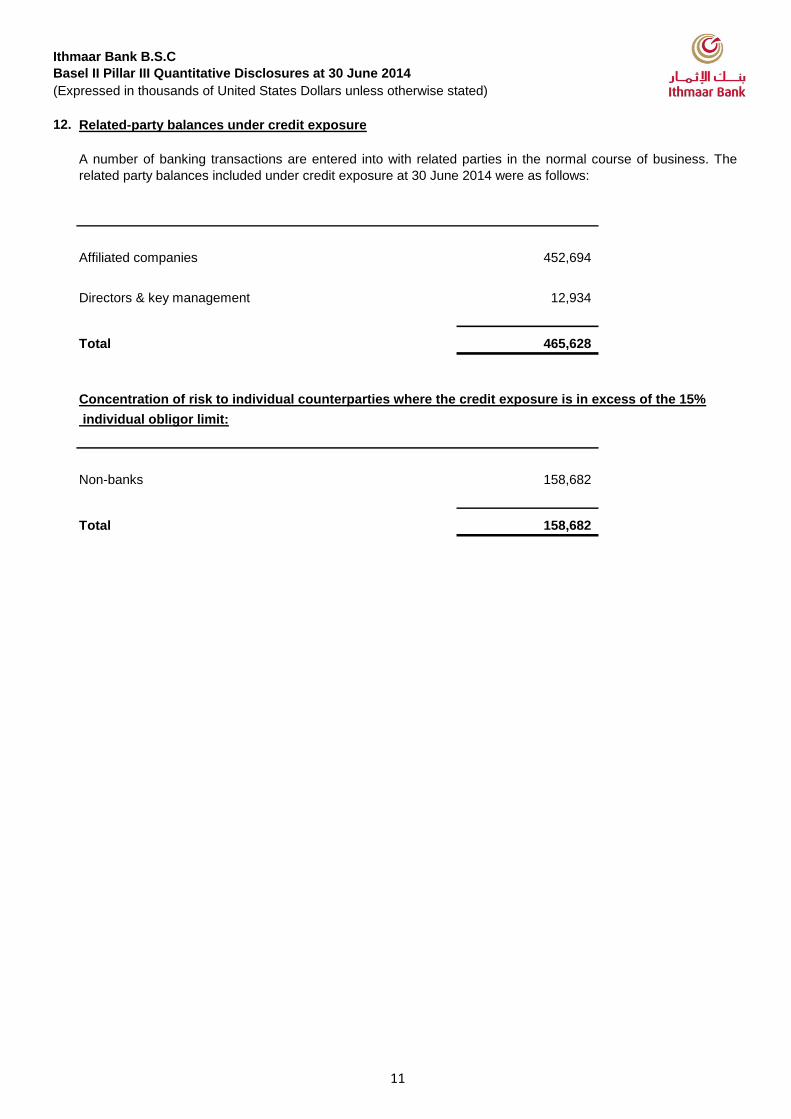
12. Related-party balances under credit exposure
Affiliated companies 452,694
Directors & key management 12,934
Total 465,628
Concentration of risk to individual counterparties where the credit exposure is in excess of the 15%
individual obligor limit:
Non-banks 158,682
Total 158,682
A number of banking transactions are entered into with related parties in the normal course of business. The
related party balances included under credit exposure at 30 June 2014 were as follows:
11

Ithmaar Bank B.S.C
Basel II Pillar III Quantitative Disclosures at 30 June 2014
(Expressed in thousands of United States Dollars unless otherwise stated)
13. Past due and impaired financings and related provisions for impairment:
Gross Impairment Net
exposure provisions exposure
Analysis by industry
Manufacturing 254,302 191,475 62,827
Agriculture 16,536 6,233 10,303
Construction 90,623 21,788 68,835
Finance 2,143 1,581 562
Trade 206,371 57,361 149,010
Personal 81,642 16,560 65,082
Real estate 33,064 20,774 12,290
Technology and
telecommunications 504 34 470
Transportation 2,276 1,255 1,021
Other sectors 63,377 45,395 17,982
Total 750,838 362,456 388,382
Ageing analysis
Over 3 months up to 1 year 186,562 8,793 177,769
Over 1 year up to 3 years 106,838 14,634 92,204
Over 3 years 457,438 339,029 118,409
Total 750,838 362,456 388,382
Relating to
unrestricted
Movement in impairment Relating to investment
provisions owners accounts Total
At 1 January 2014 264,114 67,186 331,300
Charge for the period 15,672 5,216 20,888
Write back during the period (6,350) - (6,350)
Utilized during the period - (374) (374)
Exchange differences 16,992 - 16,992
At 30 June 2014 290,428 72,028 362,456
12
Ithmaar Bank B.S.C
Basel II Pillar III Quantitative Disclosures at 30 June 2014
(Expressed in thousands of United States Dollars unless otherwise stated)
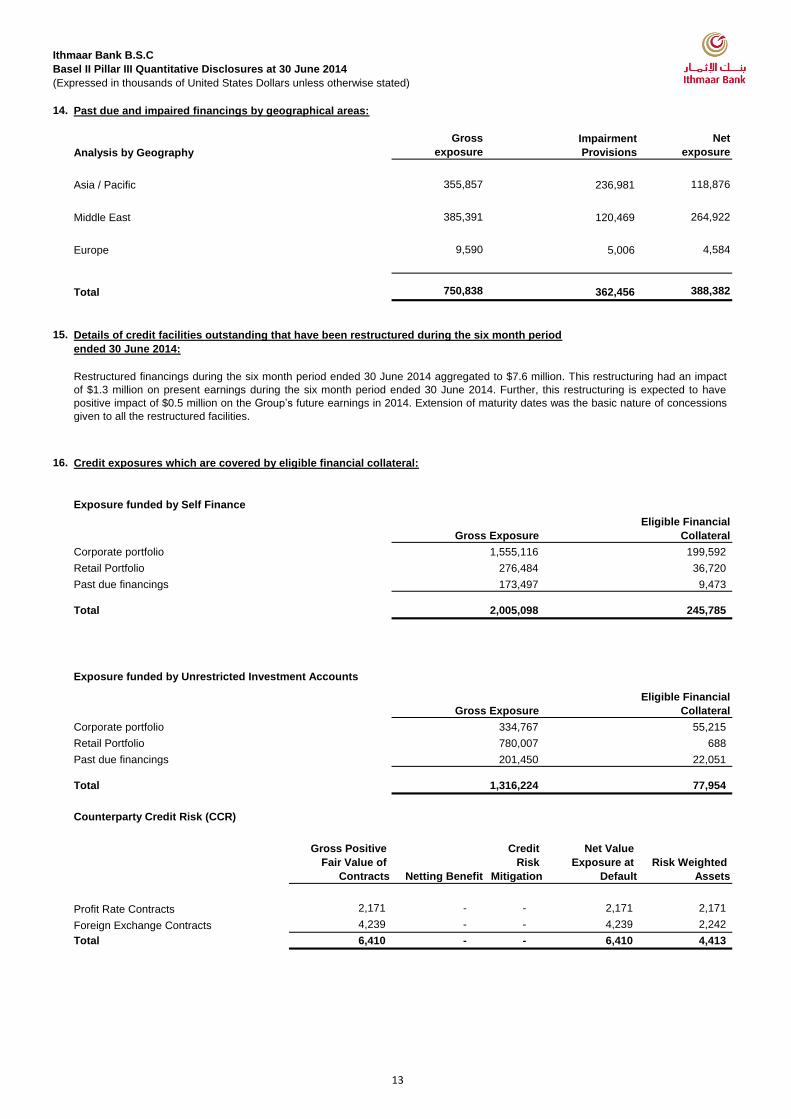
14. Past due and impaired financings by geographical areas:
Gross Net
Analysis by Geography exposure exposure
Asia / Pacific 355,857 118,876
Middle East 385,391 264,922
Europe 9,590 4,584
Total 750,838 388,382
15. Details of credit facilities outstanding that have been restructured during the six month period
ended 30 June 2014:
16. Credit exposures which are covered by eligible financial collateral:
Exposure funded by Self Finance
Corporate portfolio
Retail Portfolio
Past due financings
Total
Exposure funded by Unrestricted Investment Accounts
Corporate portfolio
Retail Portfolio
Past due financings
Total
Counterparty Credit Risk (CCR)
Gross Positive
Fair Value of
Contracts Netting Benefit
Credit
Risk
Mitigation
Net Value
Exposure at
Default
Risk Weighted
Assets
Profit Rate Contracts 2,171 - - 2,171 2,171
Foreign Exchange Contracts 4,239 - - 4,239 2,242
Total 6,410 - - 6,410 4,413
199,592 1,555,116
276,484 36,720
Restructured financings during the six month period ended 30 June 2014 aggregated to $7.6 million. This restructuring had an impact
of $1.3 million on present earnings during the six month period ended 30 June 2014. Further, this restructuring is expected to have
positive impact of $0.5 million on the Group’s future earnings in 2014. Extension of maturity dates was the basic nature of concessions
given to all the restructured facilities.
Impairment
Provisions
Eligible Financial
CollateralGross Exposure
236,981
120,469
5,006
362,456
173,497
2,005,098 245,785
9,473
1,316,224 77,954
201,450 22,051
Gross Exposure
Eligible Financial
Collateral
334,767 55,215
780,007 688
13

Ithmaar Bank B.S.C
Basel II Pillar III Quantitative Disclosures at 30 June 2014
(Expressed in thousands of United States Dollars unless otherwise stated)
17. Disclosure of regulatory capital requirements for market risk under the standardized approach:
30 June
2014
Maximum
Value
Minimum
Value
30 June
2014
Maximum
Value
Minimum
Value
Foreign exchange risk 145,789 145,789 145,592 17,495 17,495 17,471
Aggregation
Foreign exchange risk 4,746 4,746 13,951 570 570 1,674
Profit Rate Risk
(Trading Book) 27,792 27,792 9,785 3,335 3,335 1,174
Equity Position Risk 40,698 40,698 36,934 4,884 4,884 4,432
Commodity Risk - - - - - -
Total 219,025 219,025 206,263 26,283 26,283 24,752
18. Disclosure of regulatory capital requirements for operational risk under the basic indicator approach:
19. Tier one capital ratios and Total capital ratios:
Tier One Total
Capital
Ratio
Capital
Ratio
Ithmaar consolidated 11.03% 12.38%
Significant Bank subsidiaries whose regulatory capital
amounts to over 5% of group consolidated regulatory capital
whether on a stand-alone or sub-consolidated basis are as follows:
Faysal Bank Limited 10.30% 11.92%
Risk weighted assets Capital requirement
For regulatory reporting, the capital requirement for operational risk is calculated based on basic indicator
approach. According to this approach, the Bank's average gross income over the preceding three financial years is
multiplied by a fixed alpha coefficient.
The alpha coefficient has been set at 15% under CBB Basel II guidelines. The capital requirement for operational
risk at 30 June 2014 aggregated to $53.1 million.
14
Ithmaar Bank B.S.C
Basel II Pillar III Quantitative Disclosures at 30 June 2014
(Expressed in thousands of United States Dollars unless otherwise stated)
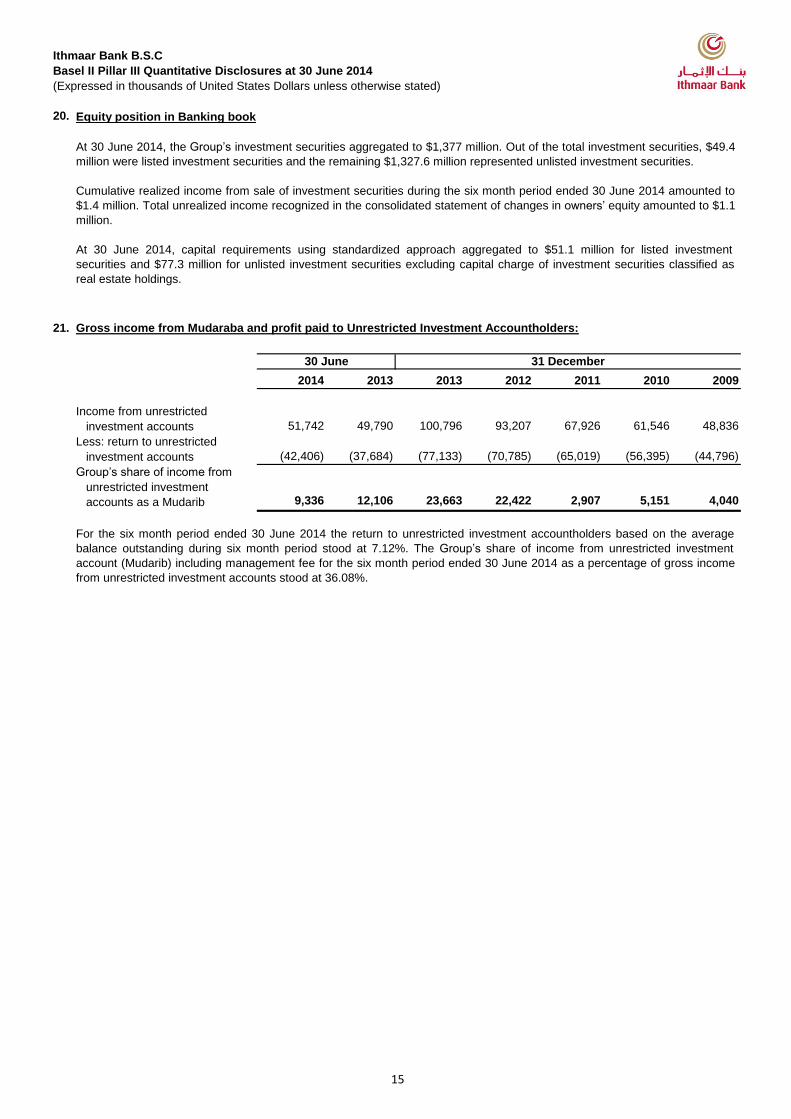
20. Equity position in Banking book
21. Gross income from Mudaraba and profit paid to Unrestricted Investment Accountholders:
2014 2013 2013 2012 2011 2010 2009
Income from unrestricted
investment accounts 51,742 49,790 100,796 93,207 67,926 61,546 48,836
Less: return to unrestricted
investment accounts (42,406) (37,684) (77,133) (70,785) (65,019) (56,395) (44,796)
Group’s share of income from
unrestricted investment
accounts as a Mudarib 9,336 12,106 23,663 22,422 2,907 5,151 4,040
31 December
At 30 June 2014, the Group’s investment securities aggregated to $1,377 million. Out of the total investment securities, $49.4
million were listed investment securities and the remaining $1,327.6 million represented unlisted investment securities.
Cumulative realized income from sale of investment securities during the six month period ended 30 June 2014 amounted to
$1.4 million. Total unrealized income recognized in the consolidated statement of changes in owners’ equity amounted to $1.1
million.
At 30 June 2014, capital requirements using standardized approach aggregated to $51.1 million for listed investment
securities and $77.3 million for unlisted investment securities excluding capital charge of investment securities classified as
real estate holdings.
For the six month period ended 30 June 2014 the return to unrestricted investment accountholders based on the average
balance outstanding during six month period stood at 7.12%. The Group’s share of income from unrestricted investment
account (Mudarib) including management fee for the six month period ended 30 June 2014 as a percentage of gross income
from unrestricted investment accounts stood at 36.08%.
30 June
15
Ithmaar Bank B.S.C
Basel II Pillar III Quantitative Disclosures at 30 June 2014
(Expressed in thousands of United States Dollars unless otherwise stated)
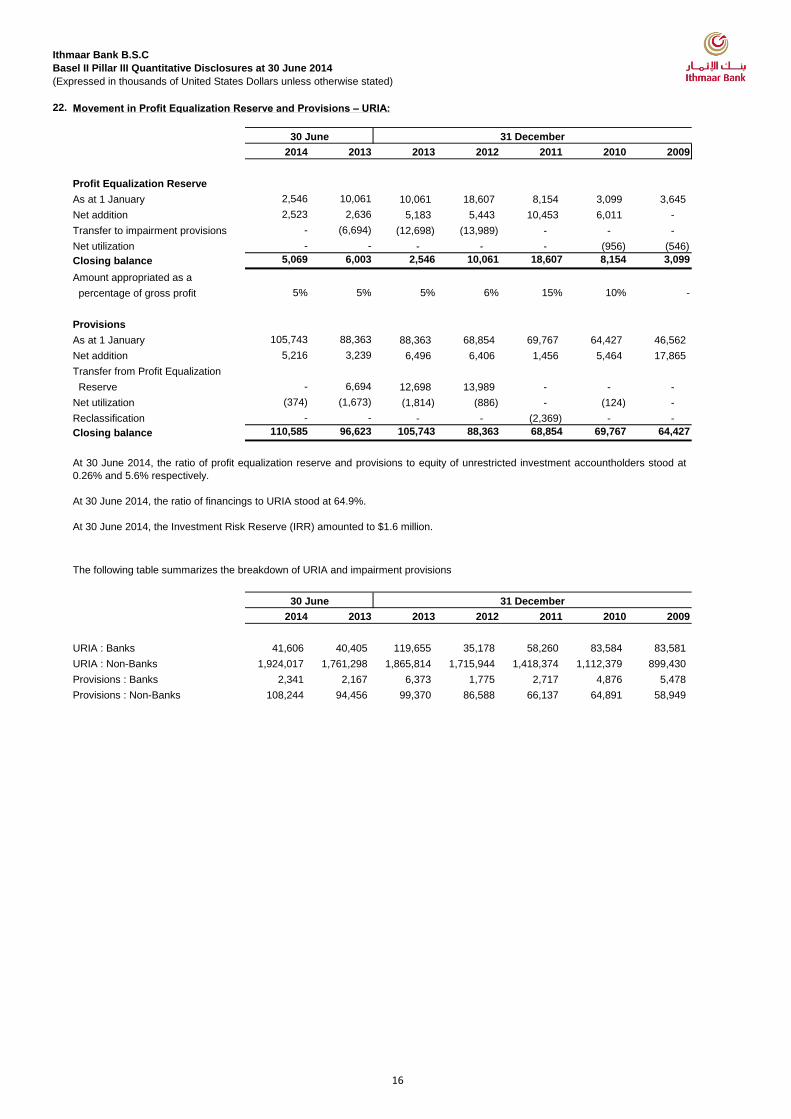
22. Movement in Profit Equalization Reserve and Provisions – URIA:
2014 2013 2013 2012 2011 2010 2009
Profit Equalization Reserve
As at 1 January 2,546 10,061 10,061 18,607 8,154 3,099 3,645
Net addition 2,523 2,636 5,183 5,443 10,453 6,011 -
Transfer to impairment provisions - (6,694) (12,698) (13,989) - - -
Net utilization - - - - - (956) (546)
Closing balance 5,069 6,003 2,546 10,061 18,607 8,154 3,099
Amount appropriated as a
percentage of gross profit 5% 5% 5% 6% 15% 10% -
Provisions
As at 1 January 105,743 88,363 88,363 68,854 69,767 64,427 46,562
Net addition 5,216 3,239 6,496 6,406 1,456 5,464 17,865
Transfer from Profit Equalization
Reserve - 6,694 12,698 13,989 - - -
Net utilization (374) (1,673) (1,814) (886) - (124) -
Reclassification - - - - (2,369) - -
Closing balance 110,585 96,623 105,743 88,363 68,854 69,767 64,427
The following table summarizes the breakdown of URIA and impairment provisions
2014 2013 2013 2012 2011 2010 2009
URIA : Banks 41,606 40,405 119,655 35,178 58,260 83,584 83,581
URIA : Non-Banks 1,924,017 1,761,298 1,865,814 1,715,944 1,418,374 1,112,379 899,430
Provisions : Banks 2,341 2,167 6,373 1,775 2,717 4,876 5,478
Provisions : Non-Banks 108,244 94,456 99,370 86,588 66,137 64,891 58,949
31 December
31 December
At 30 June 2014, the ratio of profit equalization reserve and provisions to equity of unrestricted investment accountholders stood at
0.26% and 5.6% respectively.
At 30 June 2014, the ratio of financings to URIA stood at 64.9%.
At 30 June 2014, the Investment Risk Reserve (IRR) amounted to $1.6 million.
30 June
30 June
16
Ithmaar Bank B.S.C
Basel II Pillar III Quantitative Disclosures at 30 June 2014
(Expressed in thousands of United States Dollars unless otherwise stated)
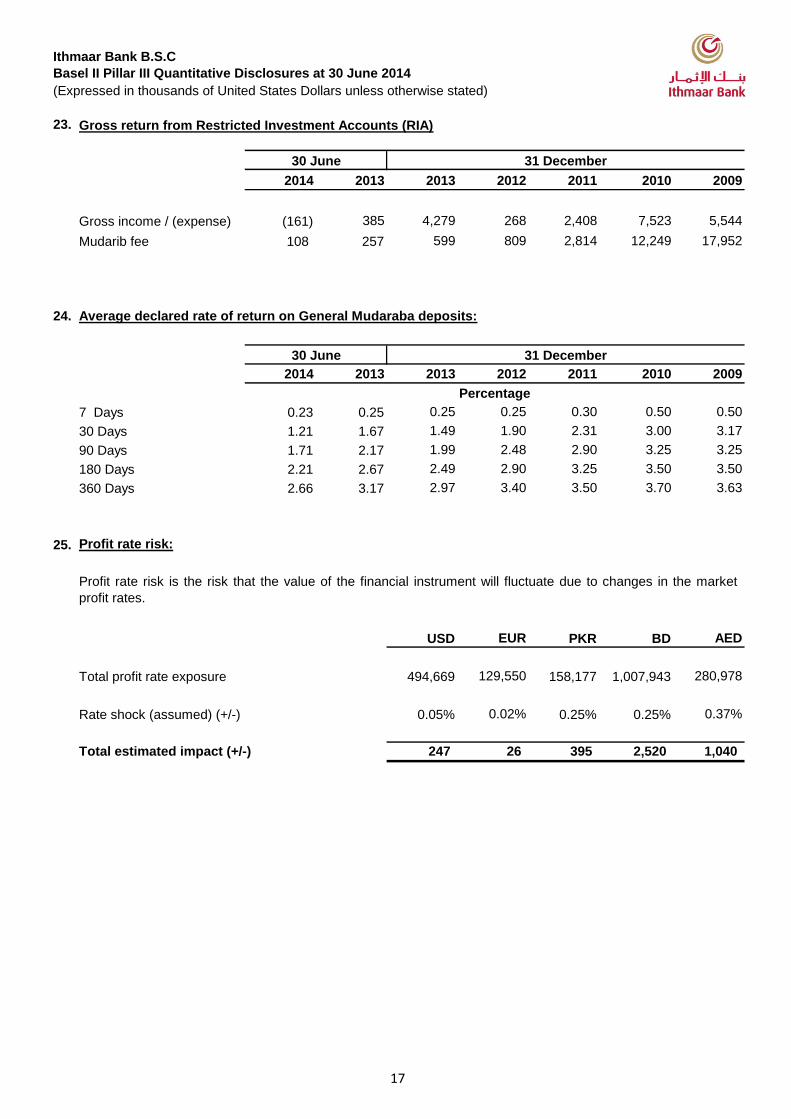
23. Gross return from Restricted Investment Accounts (RIA)
2014 2013 2013 2012 2011 2010 2009
Gross income / (expense) (161) 385 4,279 268 2,408 7,523 5,544
Mudarib fee 108 257 599 809 2,814 12,249 17,952
24. Average declared rate of return on General Mudaraba deposits:
2014 2013 2013 2012 2011 2010 2009
7 Days 0.23 0.25 0.25 0.25 0.30 0.50 0.50
30 Days 1.21 1.67 1.49 1.90 2.31 3.00 3.17
90 Days 1.71 2.17 1.99 2.48 2.90 3.25 3.25
180 Days 2.21 2.67 2.49 2.90 3.25 3.50 3.50
360 Days 2.66 3.17 2.97 3.40 3.50 3.70 3.63
25. Profit rate risk:
USD EUR PKR BD AED
Total profit rate exposure 494,669 129,550 158,177 1,007,943 280,978
Rate shock (assumed) (+/-) 0.05% 0.02% 0.25% 0.25% 0.37%
Total estimated impact (+/-) 247 26 395 2,520 1,040
Profit rate risk is the risk that the value of the financial instrument will fluctuate due to changes in the market
profit rates.
31 December
31 December30 June
30 June
Percentage
17

Ithmaar Bank B.S.C
Basel II Pillar III Quantitative Disclosures at 30 June 2014
(Expressed in thousands of United States Dollars unless otherwise stated)
26. Currency risk:
The significant net foreign currency positions at 30 June 2014 were as follows:
Pakistani Rupee
Euro
United States Dollars
Polish Zloty
UAE Dirham
Hong Kong Dollar
27. Performance ratios:
2014 2013 2013 2012 2011 2010 2009
Return on average assets 0.05% -0.21% -1.08% -0.38% -0.91% -2.18% -4.13%
Return on average
Shareholders’ equity -0.04% -2.50% -14.34% -5.23% -10.20% -21.99% -30.26%
Cost to operating income Ratio 87.54% 97.72% 97.60% 85.38% 121.71% 72.06% 139.31%
28. Liquidity ratios
2014 2013 2013 2012 2011 2010 2009
Liquid assets to total assets 13.77% 13.03% 14.78% 13.74% 12.80% 13.48% 17.02%
Short term assets to short term
liabilities 61.15% 49.67% 66.97% 56.98% 63.80% 63.44% 83.39%
29. Legal contingencies and compliance:
31 December
At 30 June 2014, the Group had contingent liabilities towards customer and other claims aggregating to $391.2
million. The management is of the view that these claims are not likely to result into potential liabilities. During
the six month period ended 30 June 2014, the Bank paid penalty of $16.3 thousand imposed by the CBB due to
delay in compliance of regulatory submission requirement.
Currency risk is the risk that the value of a financial instrument will fluctuate due to changes in foreign exchange
rates. Substantial portion of the Group’s assets and liabilities are denominated in US Dollars, Bahraini Dinars
and Pakistani Rupee. Bahraini Dinars and Saudi Riyal are pegged to US Dollars and as such currency risk is
minimal
Long/(Short)
30 June
30 June 31 December
98,693
(118,917)
104,932
64,686
(283,289)
68,833
18