Embed Size (px)
Citation preview
136 Section Three Ellvirollmellta/ Alla/ysis
4. Suppose the costs of an environmental pollution-control program are expected to be equal to $80 per year, and that benefits will be $50 per year for50 years, then $150 per year thereafter. At a discount rate of 4 percent, whatare the net benefits of this program? What would the net benefits be at a discount rate of 2 percent? Comment on the difference.
5. When setting public policy on environmental risks, should we base it on thelevels of risk to which people think they are exposed or on the risk leveis asscientists have determined them to be in fact?
For additional readings and Web sites pertaining to the material in this chaptersee www.mhhe.com/fieldSe.
Chapter
___' J
Benefit-Cost Analysis:Benefits
Remembering the provisos about the distribution of incame and the availability of information, we already have made the connection between benefitsand willingness to payo We see that the benefits of something are equalto what people are willing to pay for it. rhe question is: how is willingness topay to be estimated in specific cases? For goods and services sold on marketsit may be relatively easy to estímate willingness to payo ro estimate people'swillingness to pay for potatoes, for example, we can observe them buyingpotatoes-so many potatoes at certain prices-and develop a good idea of thevalue people place on this item. This will not work, however, when valuingchanges in environmental quality. There are no markets where people buyand sell units of environmental quality. Instead, we have to fall back on indirect means. As one environmental economist put it: "Benefit estimation ofteninvolves a kind of detective work for piecing together the clues about thevalues individuals place on [environmental services] as they respond to othereconomic signals."l
The measurement of benefits is an activity pursued on many levels. For ananalyst working in an environmental agency, it can turn into a plug-in-thenumbers exercise. So many acres of c1am bed destrayed (information provided by a marine biologist) times the going price of clams (provided by aquick trip to the local fish market) equals damages of water pollution in the"X" estuary. At the other extreme, for an environmental economist whose interest is in extending the technique, it can be an excursion into sophisticatedmeans of squeezing subtle information fram new sets of data. Our path in thischapter lies between these extremes. We review the main techniques enviranmental economists have developed to measure the benefits of improvementsin environmental quality. The objective is to understand the economic logic
1 A. Myrick Freeman 111, "Benelits 01 Pollution Control," in U.S. Environmental ProtectionAgency, Critical Revlew of Estimating Benefits of Air and Water Pollution Contral, Washington, DC,EPA 600/5-78-014,1978, pp. 11-16.
137
138 Section Three Environmental Analysis
behind these techniques, without getting bogged down in the theoretical andstatistical details.z
The Damage Function: Physical Aspects
When environmental degradation occurs, it produces damages; the emissionscontrol rnodel of Chapter 5 is based in part on the relationship between emissions and marginal damages. Thus, the benefits of environmental quality improvements stem from the reduced damages this would produce. Io measure anemissions damage function, it's necessary to go through the fo11owing steps:
1. Measure emissions.2. Determine the resulting levels of ambient quality through the use of diffusion
models.3. Estirnate the resulting human exposure that these ambient levels would
produce.4. Estimate the physical impacts of these exposure levels.5. Determine the values associated with these physical irnpacts.
The prirnary work of environmental economists is in step 5, and we will devotemost of the chapter to this activity. Let us begin, however, with sorne brief comments on the first four steps.
Some of the most important damages caused by environrnental poUution arethose related to human health. Air po11ution, especially, has long been thoughtto increase mortality and morbidity3 among people exposed to it, certainly inthe episodic releases of toxic pollutants, but also from long-run exposure tosuch pollutants as SOz and particulate matter. Diseases such as bronchitis, emphysema, lung cancer, and asthma are thought to be traceable in part to polluted airo Water pollution also produces health damages, primarily throughcontaminated drinking water supplies. So the measurernent of the humanhealth damages of environmental pollution is a critical task for environmentaleconomists.
Many factors affect human health-lifestyles, diet, genetic factors, age, andso on-besides ambient pollution levels. To separate the effects of pollution, onehas to account for a11 the other factors or else run the risk of attributing effectsto pollution that are actuaUy caused by something else (e.g., smoking). Thiscalls for large amounts of accurate data on health factors, as we11 as the numerous suspected causal factors. The major work here is that of epidemiologists,who derive statistical results from large data sets to derive relationships between arnbient pollution exposure and adverse health effects. One of the firstsuch studies of air poUution and human health in the United States was done by
2 There are a number of books reviewing the current state 01 environmental benefits measurement.These are Iisted in the bibliography at the end of the chapter.J Morbidity refers to the incidence of ill health and can be expressed in many ways: for example,days rnissed from work, days spent in the hospital, and the duration of particular symptoms.
...... ,.., - ._ ~""' •.. ,..
Chapter 1 11"/11'/11 1',,,,, .o\""/V'/' ¡k,ll'lH. 'IU
Lave and Seskin in the 1970s.4The data were for 1969 dnd rl'll'r tn f'"hllf'hrd 111formation on standard metropolitan statistical areas (SMSAs). TIII'Y I'lllll'illdl'dthat, in general, a 1 percent reduction in air pollution produces.1 O.121"'I'l'I'IIII'·
duction in death rates. In the last few decades, literally thousands nI ,lddillllll,i1studies have been done to investigate the linkage between pollutiun and 1111111,111
health, in terms of both premature mortality and morbidity. A study sponslIl't'llby the California Air Resources Board (CARB) showed clear relationships in el liIdren between exposure to air po11utants and reduced lung function.5 A study hyRitz and coUeagues showed a relationship between birth defects and the exposure of pregnant women to air polll1tants.6 BeU and colleagues studied nationa Idata~d showed a pronounced relationship between ozone levels and increasedrisk of death? Studies of this type are gradually increasing our knowledge abouthow environmental po11utants affect the health and welfare of human beings asweU as the health of the many nonhuman parts of the natural world. The nextstep, where environmental economics comes into play in a major way, is tovalue these outcomes so that the information can be used in classic benefit-costtype studies.
Measurin~DamageCosts Directly
There are a nurnber of situations where it would appear possible to measuredirectly the monetary costs of health and other types of outcomes.
Health CostsThe greatest concern about dirninished air and water quality is the impacts thesehave on human health. One approach to assessing damages in this case is to estimate the increased medical and other costs associated with particular poUutionrelated illnesses. This is called the cost of illness (COI) approach. For example,Table 7.1 shows data from a recent study of this type on asthma, a disease thathas increased rapidly in recent years and that researchers believe may be relatedto air po11ution. The estimates are divided into direct and indirect costs. Directcosts are the costs of medical visits to hospitals or doctors' offices, together withthe costs of medicatians used to fight asthma. Indirect costs are related to the opportunity casts of lost work time for people who become ill, lost school days, andlost econornic productivity of people who die premahuely from asthma.
With the COI perspective, the benefits of pollution control are the reducedhealth-related costs they produce. This could be regarded as a minimum, or
4 Lester B. Lave and Eugene P. Seskin, Air Po/lution and Human Health, ¡ohm Hopkins Press,Baltimore, MD, 19/1.
5 California Air Resources Board, "The Children's Health Study," CARB, Sacramento, 2002.
6 Beate Ritz et al., "Ambient Air Pollution and Risk of Birth Defects in Southern California:'American }ournal of Epidemialogy, Vol. 155, No. 1, January 2002, pp. 17-25.
7 Michelle L. Bell et al., "Ozone and Short-Term Mortality in 95 U.S. Urban Communities,1987-2000," }oumal of the American Medical Association, Vol. 292, No. 19, November 2004,pp. 2372-2378.
m"l"""""'''',..'''·····
140 Section Three EllvirollJllenta/ AllalysisChapter 7 Benefil-Cost Analysis: Benefits 141
TABlE 7.1 Estimated Cost oi Adult Asthma in the United States
Cost for Average Adult $/Year
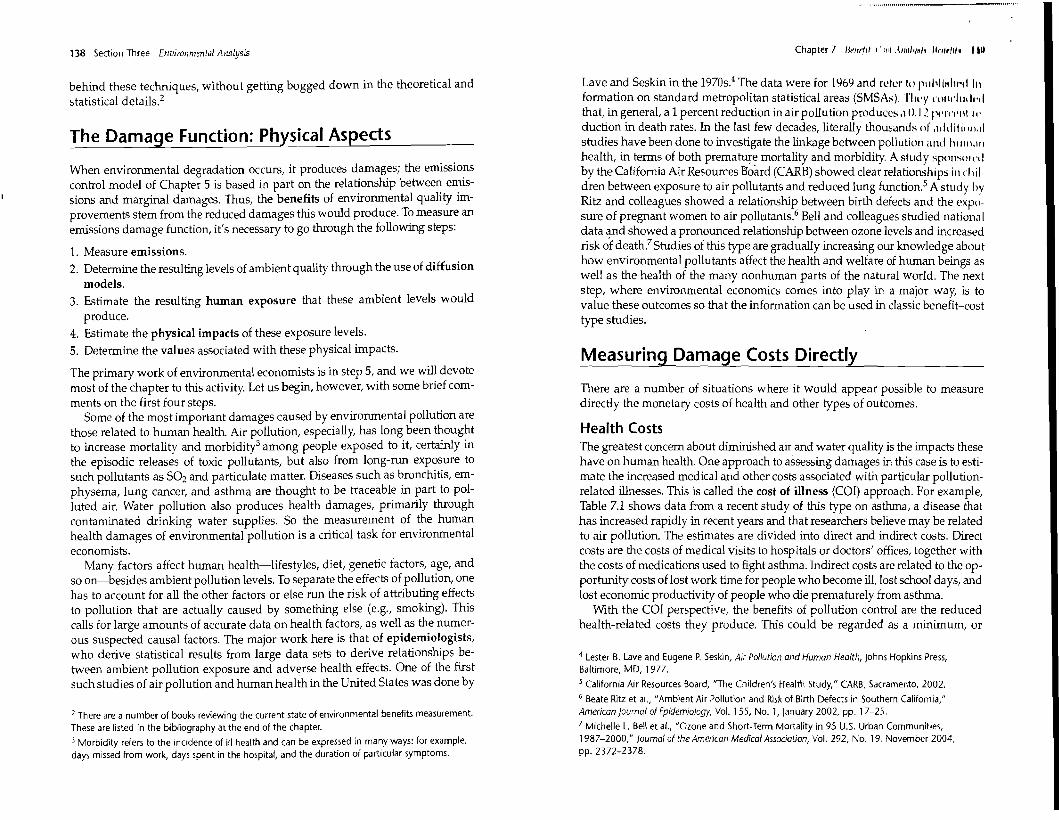
FIGURE 7.1 Benefits from Reduced Production Costs
Source: M. G. Cisternas et a1., "A Comprehensive Study of the Direct and Indirect (asts aE AdultAsthma," JOl/rnal 01 Alhg¡j a",¡ (fil/ieal Im/1/l/nolog¡j. 111(6), June 2003, pp. 1212-1218.
lower-bound, assessment of these benefits, becaUSe the impraved health alsoproduces a better quality of life for those who are impacted. Many researchersin the health area have sought to create health indices that capture the improvements in physical health parameters that less environmental pollutionwOllld produce. This involves assigning numeric values to various healthstates, both martality and marbidity, to develop aggregate measures of healthoutcomes. These indices are sornetimes "monetized" to develop estimates ofvalues of health outcomes that can be compared with the monetary cosls of polllltion control. They do not rely, however, on the basic concept of willingness tosacrifice as a measure of value. We will take this up below.
The Effects of Pollution on Production CostsAir pollution can reduce yields of exposed crops; it also can reduce the growthrates of commercially valuable timber. Water pollution can adversely aEfect firmsand municipalities that use the water for production purposes or for domesticuse. Diminished water quality also can have a negative impact on commercialfishing industries. Soil contamination can have serious impacts on agriculturalproduction. Pollution in the workplace can reduce the effectiveness of workersand often can increase the rate at which machinery and buildings deteriorate. Inthese cases the effects of pollution are felt on the production of goods and Services. The damage caused by the pollution comes about because it interferes insorne way with these production processes, in effect making it more costly toproduce these outputs than it would be in a less polluted world.
How we actually measure production-related benefits of reducing pollutiondepends on circumstances. Suppose we are looking at a small group oE agricultural producers living in a certain region who will be affected by reduced airborne emissions coming from an upwind factary. Pollutants fram the Eactoryhave depressed yields, so reducing emissions will cause yields to increase. Thecrap being produced is sold in a national market, and its price will be unaffected
82
q2
Quantity el output
ql
Pll--l---------.
by the output changes in this one region. This situation is depicted in Figure 7.1.In this diagram, SI is the supply curve for this group of farrns befare the improved air quality; S2 is the supply curve after the improvement. Price of theoutput is Pr· Befare the change, these farmers produce at an output level of qr,whereas after the impravement their output increases to q2.
One way of approximating the benefits of this environmental improvementis to measure the value of increased output produced by this graup of farms.This is the increased output, q2 - qr, multiplied by the price of the crop. Thisgives an estima te corresponding to the area (d + e) in Figure 7.1.
Anumber of studies have been done along these lines.8 Murphy et al.g studied the effects on agriculture of eliminating ozone precursor emissiens frommotor vehicles in the United States. They estimated that the benefits to the agricultural sector of this would amount to between $3.5 and $6.1 bil1ion annually.Another study was done by Page et al.lOto measure crop-related air pollution
$
8These are reviewed in Gardner M. Brown Jr. and Mark L. Plummer, "Market Measures 01 UserBenefits," in Acid Deposition: State of Science and Technology, Report 27, Methods lar ValuingAcidic Deposition and Air Pollution Effects, National Acid Precipitation Assessment Program,Washington, DC, U.S. Superintendent of Documents, 1990, pp. 27-35 to 27-73.
9 james Murphy, Mark Delucchi, Donald McCubbin, and H. J. Kim, "The Cost 01 Crop DamageCaused by Ozone Air Pollution from Motor Vehicles" (April 1, 1999). Institute of TransportationStudies. Paper UCD-ITS-REP-99-03. http://repositories.cdlib.org/itsdavis/UCD-ITS-REP_99_03.
10 W. P. Page, G. Abogast, R. Fabian, and J. Ciecka, "Estimation 01 Economic Losses to theAgricultural Sector from Airborne Residuals in the Ohio River Basin," ¡oumal ofAir Pol/ution ControlAssociation, 32(2), February 1982, pp. 151-154.
1,732
4,912
3,180
1,605805770
1,062486184
Direct costs:DrugsHospital visitsOther (primarily physician5)
Subtotal
Indirect C05t5:Complete work ce5sationLost daY5 but 5tHI employedOther
Subtotal
Grand total

142 Section Three EllvironmentaJ Al1alysis
losses in a six-state area. They estimated annual losses in the productíon of soybeans, wheat, and corn and then aggregated these to see what the present valueof total losses would be during the period 1976-2000. They carne up with an estímate of about $7 biIlion.
A more refined approach to this problem is possible. The problem with taking just the value of the increased output is that production costs also may havechanged. When air polIution diminishes, farmers actually may increase theiruse of certain inputs and farm this land more intensively. How do we accountfor this possibility? We can analyze the ful! change by using net incomes of thefarmers (total value of output minus total production costs).
The situation befare the change:
Total value of OUtpllt: a + b + eTotal costs: b + e
Net income: 11
The situation after the change:
Total value of output: a + b + e + d + eTotal costs: e + e
Netincome:a + b + d
Thus, the improvement in net incomes is (11 + b + d) - a, al' an amount equal toarea b + d in Figure 7.1.
How we measure this amount depends on how much information we areable to get. If we have studied these farms and know their supply curves before and after the change, we can measure the increased net income directly.If the supply curves are not known, we might look at the increased values ofagricultural land in the area. In many cases, added net incames of this type wiUget capitalized into land values, and we can use the increased land values toestimate the benefits of the environmental improvements.
Materials DamageAir polIutants cause damage to exposed surfaces, metal surfaces of machinery,stone surfaces of buildings and statuary, and painted surfaces of aIl types ofitems. TI1e most heavily implicated poIlutants are the sulfur compounds, particulate matter, oxidants, and nitrogen oxides. For the most part, the damage isfrom increased deterioration that must be offset by increased maintenance andearlier replacement. In the case of outdoor sculpture, the damage is to theaesthetic qualities of the objects.
In this case the dose-response relationship shows the extent of deteriorationassociated with exposure to varying amounts of air polIutants. The basic physical relationships may be investígated in the laboratory, but in applicatíon toany particular area one must have data on the various amounts of exposed materials that actuaIly exist in the study region. Then it is possible to estímate thetotal amount of materials deterioratian that would occur in an average year ofexposure to the air of the region with its "normal" loading of various pol!utants.
ehapter 7 !I"Jldil i ,<"1:1,,.,1'1"" /1"11"111. I~~
One must then put a value on this deteríoration. Takin¡.; .l~lrlll d'llllil)!."
function approach, we could estímate the increased cost Di m,tinl"lldl"'" (1,'''"1.paint, etc.) made necessary by this deterioration,ll but this would 1", .11' 111,,1.·,estimate of the true damages from a wilIingness-to-pay perspectiv.,. 1'01/\ "111,,'damages would be aesthetic-the reduced visual values oi 11'sS sightly 111111.1ings and painted surfaces. We might arrive at these values through l'olltill¡',I'1l1
valuation methods, discussed latero In addition, the maintenance cost <1 I'P 1'( >01111
would not be complete if pollution causes builders to switch to other llliltl'ri,i1s
to reduce damages.
Prob.lems with Direct Damage ApproachesThe basic problem with direct damage estimates is that they are almost alwaysseriously incomplete. Consider the case of measuring health damages by lostproduetivity and medical expenditures. We note, first, that these tend to be market measures. They measure the value of marketed goods and services a personmight, on average, produce. So the many nonmarket contributions peoplemake, both inside and outside the home, sometimes don't get counted. Thismethod also would assign a zera value to a person with disabilities unable towork 01' to a retiree. There are also numerous monetary, as welI as psychic,benefits received by others-friends and relatives, far example-that the praductivity measure does not account fol'. Nar does it account for the pain andsuffering of il!ness. Similar concIusions may be drawn about using medicalexpenditures to estimate damages from reduced environmental quality. Suppose we estímate the damages to you of getting a head cold. We come up withan estimate of $1.27, the cost of the aspirin you consume to reduce the discomfort. This probably would be a serious understatement of the true damages ofthe cold. If you were asked how much you would be wilIing to pay to avoid thecald, the answer is likely to be substantiaIly more than the cost of th~ aspirin.This is perhaps an unfair example because majar medical expenditures far aperson suffering from air polIution-induced lung cancel' are much more significant than a bottle of aspirin. But the principie is valido
Another majar problem with attempts to measure damage functions directlyis that people and markets normalIy wilI change and adjust to enviromnentalpoIlutíon, and a fuIl accountíng of the damages of polIution must take theseadjustments into accaunt. Farmers raising crops affected by polIutíon may shiftto other crops, while the prices of the damaged crops may change, affecting consumers. People often wilI change their behavior when faced with poIluted air orwater, engaging in what is calIed averting behavior, or making major changesin lifestyle. These effects are difficuIt to measure when using a direct approachto damage measurement. For this reason, we must tum back to our fundamental concept for determining value: wiIlingness to pay.
11 This approach is taken from R. L. Horst, E. H. Manueljr., R. M, Black 111, J. K. Tapiero, K. M.Brennan, and M. C. Duff, "A Damage Function Assessment of Building Materials: The Impact ofAcid Deposition," Washington, De, U.S. Environmental Protection Agency, 1986.

144 Section Three EJJviralll1lenl'll AJJalysis
Willingness to Pay
There are essentially three ways of trying to find out how much people are will·ing to pay for improvements in environmental quality. We can illustrate themby considering a case of noise pollution. One feature of the modem world ishigh-speed roadways (expressways, freeways, and tumpikes), and a majorcharacteristic of these roads is that the traffic on them creates noise. Thus, thepeople who live nearby suffer damages from trus traffic noise. Suppose our jobis to estimate the willingness to pay of people living near expressways to reducetraffic noise. How might we do this?
1. The homeowners themselves may have made expenditures to reduce thenoise levels inside their homes. For example, they may have installed additional insulation in the walls of their homes or put double-thick glass in thewindows. When people make expenditures such as these, they reveal something about their willingness to pay for a quieter environmenl. In general,then, if we can find cases where market goods are purchased in order toaffect a consurner's exposure to the ambient environment, we may be ableto analyze these purchases for what they say about the value people place onchanges in that ambient environment. The technical term for this is the studyof averting costs.
2. The noise in the vicinity of the road may have affeeted the prices that nearbyresidents may have paid for their houses. If two houses have exactly the sarnecharacteristics in all respects except the level of exterior noise, we wouldexpect the one in the noisier environment to be less valuable to prospectivebuyers than the one in the quieter environment. If the housing market iscompetitive, the price of the noisier house would be lower than the other one.Thus, by looking at the difference in house prices we can estimate the valuepeople place on reduced noise pollution. In general, therefore, any time theprice of sorne good or service varies in accordance with its environmentalcharacteristics, we may be able to analyze these price variations to determinepeople's willingness to pay for these charaeteristics.
3. The third way is deceptively simple. It is to conduct a survey among homeowners and ask them how much they would be willing to pay for reductionsin noise levels around and inside their homes. This direct-survey approachhas received a lot of attention from environmental economists in recentyears, primarily because of its flexibility. The primary method in trus surveytype approach is cal1ed contingent valuation. Virhlally any feature of thenatural environment that can be described accurately to people can be studied by this method.
The first two of these rnethods involve the study of individuals' choices so asto uncover the implied values that have led them to make these declsions. Forthis reason they are often cal1ed revealed preference methods, since individuals are essentially revealing their tmder1ying values. The third method involvesasking people directly what their willingnesses to pay are, and are therefore
Chapter 7 Benefil-Cast Analysis: Benefils 145
called stated preference approaches. In the remainder of the chapter we will examine sorne of the ways these methods have been applied to estímate the benefits of improvernents in environmental quality.
Willingness to Pay: RevealedPreference Methods ~,
The thought behind these indirect approaches is that when people make marketchoices among certain items that have different characteristics related to theenvironment, they reveal the value they place on these environmental factors.Perhaps the most important is what they reveal about the values of health andhuman life.
Usingwillingness to pay to measure health benefits has the virtue ofbeingconsistent with other types of economic-demand studies, and it recognizes that evenwith something as important as health care, it is people's evaluations of its worththat should count. But the concept must be used with careo In any real-world situation, willingness to pay implies ability lo pay; one cannot express a willingnessto pay for something if one lacks the necessary income or wealth. So we must besensitive to the income levels of people whose demand we are trying to measure.lf the analysis includes a substantial number of people with low incomes, themeasured willingness to pay may be lower than what might be justified. We maynot want to lower the estimated health benefits of an environmental programsimply because the target population has lower-than-average incomes.
Another feature about health care as a normal economic good is that peoplemay be willing to pay for the health of others. 1do not care if my daughter eatsmeat; her own willingness to pay is a good expression of her demand for meal.1do care about her health, however, and, to her own willingness to pay for goodhea1th,I would be wi11ing to add a substantial sum of my own. Thtis, strictlyindividualistic measures of willingness to pay for health improvements mayunderestimate the true benefits of programs that increase health.
The Value af Human Health as Expressed in Averting (astsAir and water pollutíon can produce a variety of adverse health conditions,ranging from slight chest discomfort or headaches a1l the way to acute episodesrequiring hospital careo People often make expenditures to try to avoid, oravert, these conditions, and these averting costs are an expression of their wi1lingness to pay to avoid them. A number of studites have been done in whichthese averting expenditures have been analyzed for what they teH about wil!ingness to pay.12 One study was done of a sample of people in the Los Angelesarea in 1986100king at expendihlres they made to avoid a variety of respiratorysymptoms. Expenditures included such things as cooking with electricity ratherthan gas, operating ahorne air conditioner, ami driving an air-conditioned caro
12 These are reviewed in Maureen L. Cropper and A. Myrick Freem"n 111. "Environmental HealthEffects," in John B. Braden and Charles o. Kolstad (eds.), Measunng the Demand for EnvironmentalQua/lty, North-Holland, Amsterdam, 1991. pp. 200-202.

146 Section Three Environmental Analysis Chapter 7 Bmejll··Cosl AI/allf''''_; H"lIt/il., '47
TABlE 7.2 Implied Value of a Statistical Life as Estimated in RecentLabor Market 5tudies
Sources: M. C. Berger and P. E. Gabriel, "Risk Aversion and the Earnings oí U.5. lmnügrants andNatives." Applied EC01"mics, Vol. 23, 1991. pp. 311-318; T. J. Kniesner and J. D. Leeth, "CompensatingWage Dilferentials lar Fatal Injury Risk m AuslraHa, Japan, and the United States," Journa/ oi Risk andUncerttlil1ty, 4(1), 1991, pp. 75--9O;J. P. Leigh, "No Evidem:e of Compensating Wages for OccupationalFalaHnes," Industrial Relafions, 30(3),1991. pp. 382-395; J. P. Leigh, "Compensating Wages, Value of a5tatistical Lile, and Inter-Ind\.lstry Differentials," fOUl'nlJ/ oj EJ1vironmrnfilI Economics alld Mal1llgemmt,28(11.1995, pp. 83-97; J. R. Lotl ond R. L. Manning, "Ha" Changing Uability Rules CompensatedWorkers Twice foc Oceupahonal Hazards? Earnings Premiums and Cancer Risks," !ourna[ ofLegal5fudies, 29, 2000, pp. 9<¡....130; M.r Moare and W. K. Viscusi, "Models for Estimating Discount Rates forLong-Term Hea1th Risks Using Labor Market Data," ¡aumal ofRisk and Unm-tail1ly, Vol. 3, 1990, pp.38]-401; P. Dorman and P. Hagstrom, "Wage Compensahon far Dangerous Work Revlsited," Industrialana LAbor Re/afions Review. 52(1).1998, pp. 116-135; and D. Gegax, S. Gerking, and W. 5chulze, "PerceivedRisk and the Marginal Value 01 Safety," Revlew of Econolllics nnd Statistics, 73(4), 1991, pp. 589-5%.
total willingness to pay is $20(100,000) = $2,000,000, which is lhe valw lit 1\
statisticallife based on willingness to pay.The most futiy developed revealed preference approach to measuri n~ t11l' w i11
ingness to pay for reducing risk to life is through industrial wage rate studil''i.Suppose there are two jobs similar in all respects except that in one, beGlllSL' IIIthe type of machinery used, the. psk of death is somewhat higher than in tllt'other. Suppose that initially the wage rates in the two industries were the s.mU'.In this case it wOllld obviously be preferable to work in the safer industrysame wage, lower risk. Workers would then seek to move from the dangerousindustry to the safer industry. This would tend to drive down the wage in thesafer industry and increase the wage in the other, as firms sought to keep workers fram leaving that industry. Thus, a wage differential would evolve betweenthe two industries; the amount of that differential would show how workersvalued the differences between them in terms of risk of death. The wage differential, in other words, represents an implicit valuation of a statisticallife. Byanalyzing wage differences sueh as this, we can get a measure of the benefitspeople would get from reducing pollution-related premature deaths.
Table 7.2 surnmarizes sorne of the recent results of wage-rate studies aimed atestimating the value of a statisticallife in the United States. Note that the estimates range from $700,000 to over $10 million. What accounts for these differences? Different data and statistical techniques probably account for most ofthem. These studies are difficult because there are many other factors that haveto be taken into account and because it is hard to get exactly the right data. For
Their estimates of the willingness to pay to avoid various respiratory symptomsranged from $0.97 for shortness of breath to $23.87 for chest tightness.
One place where averting-cost analysis has been done is to value water quality, because of the usually ready availability of altematives to water of dubiousquality, such as water filtration devices and bottled water. At the other extreme,averting behavior has been studied to deduce the value of a statisticallife, aconcept discussed more fully in the next sectionY
The Value of Human life as Expressed in Wage RatesDiminished air quality and contaminated water can lead to deteriorated healthand death. How are these impacts to be valued? It is tempting to say that"human life is beyond measure," but that is not the way people behave in thereal world. We can see by casual observation that individuals do not, in fact,behave as if prolonged life, or the warding off of disease, is in sorne sense anultimate end to which all their resources must be devoted. We see people engaging in risky activity, in sorne sense trading off risk for the benefits received. AImost everybody drives a car, sorne people smoke, sorne rock climb, many striveto get tans, and so on. We also see people allocating portions of their income toreducing risk: buying locks, installing smoke alarms, staying away from darkplaces at night. In addition, we observe people making differential judgments oftheir own worth: parents with children buying more life insurance than singlepeople, and so on. AII of this suggests that people treat the risk of death in areasonably rational manner, and that we could use wi1lingness to payas a wayof evaluating the benefits of reducing the risk of death or illness.
But we must be clear on exaetly what is involved. There is a joke about thestingy millionaire, walking down a street, who gets held up. The robber pointsa gun at her and says, "Your money or your life," and the victim replies: "Ah, letme think about that." Estimating the willingness-to-pay value of a human lifedoes not involve this kind of situation. People are not asked for their willingness to pay to save their own lives. Under sorne circumstances a person presumably will be willing to give everything he owns, but these are not the kindsof situations people normally face. When 1express a willingness to pay for reducing air pollution, the relevant concept is the value of a statisticallife (VSL),not the life of sorne particular individual. This does not imply that people areassumed to care only about the average, or random, person and not about specific people. People obviously feel closer to their relatives, friends, and neighborsthan to strangers. What is involved is the value people place on rearranging theliving conditions of a large group of people by, for example, reducing theirexposure to environmental pollutants in order to lower the probability thatsorne randornly deterrnined individual from the group will suffer illness orpremature death. Suppose, for example, that the average person in a group of100,000 people would be willing to pay $20 to lower the probability of a randomdeath among members oí that group fram 7 in 100,000 to 6 in 100,000. Then the
13 Glenn C. Blomquist, "Self Protection and Averting Behavior, Values of Statistical Uves, andBenefit Cost Analysis of Environmental Policy," Review 01 Economics of the Household, 2(1), 2004,pp. 89-110.
Study
Moore and Viscusi (1990)Kniesner and Leeth (1991)Gegax, Gerking, and Schulze (1991)Leigh (1991)Berger and Gabriel (1991)Leigh (1995)Dorman and Hagstrom (1998)Lott and Manning (2000)
Value of a StatisticalLife in 2000 ($ million)
20.80.72.1
7.1-15.38.6,10.98.1-16.88.7-20.31.5,3.0

148 Section Three EllVirOllmental Allalysis
example, most worker accident and wage data apply to industry groupings, andwithin these groups there may be substantial variation among individual firms,not only because of teclmological differences among them but also because sornefirms may have done a lot more than others to make the workplace safer. lt isalso the case that wage-rate studies such as these are predicated on the reasonably efficient working of the labor market, and this may not be the case in sorneindustries. Union agreements, colIusion among fum managers, and lack of information can upset the competitive wage-making process in sorne industries.These problems do not mean that these studies are not useful, only that we havenot yet reached a point where they are giving us a consistent story.
Valuing Children's HealthMost willingness-to-pay studies in the health area are focused on the valuationsof adults. But a large percentage of the people impacted by environmental pollution are children, and it is not clear that the WTP estimates of adults are applicable also to children. Children may be more heavily impacted than adultsby given concentrations of polIutants in the air and water. And children themselves are in no position to offer WTP information on their health. Thus, whatwe need are WTP estimates of adults for reducing health risks to children, andthese may be quite different than their WTP to reduce health risks to themselves. For example, Liu and co-workers found that a mother's WTP for herchild's health was greater than the WTP for her own health. 14 Blomquist and coworkers gathered data on the use of seat belts and found that they implied aVSL of $3.7 milIion for the average child under five years of age, and $2.8 million for adults. 15
The Value of Environmental Qualityas Expressed in House PricesThe wage-rate studies we just looked at estirnate the willingness to pay to be exposed to a lower risk of death, which is a specific consequence of being exposedto lower levels of environmental polIution. But there are wider benefits to acleaner environment than simply heaJth benefits. A more inclusive approach isto examine people's willingness to pay to live in a less polluted environment.This would indude the health effects but also other dimensions such as aestheticimpacts.
Suppose you had two houses that were exactly the same in terms of alI theirphysical characteristics-number of rooms, floor area, age, and so on-as wellas in locational factors-distance to neighbors, distance to shopping facilities,and so forth. Assume, however, that one house is located in an area of substantial
14 j.-T. Liu, J. K. Hammitt, ).-0. Wang, and J.-L. Liu, "Mother's Willingness to Pay lor Her Own andHer Child's Health: A Contingent Valuation Study in Taiwan," Health Economics, Vol. 9, 2000,pp. 319-326.
1s Glenn C. Blomquist, Ted R. Miller, and David T. Levy, "Values 01 Risk Reduction Implied byMotorist Use 01 Protection Equipment: New Evidence Irom Oifferent Populations," ¡oumal 01Transport Economics and Poliey, Vol. 30, 1996, pp. 55-66.
Chapter 7 Benefit-Cost Anaiysis: Benefits 149
FIGURE 7.2 Relationship of Ambient SOz Concentration andHouse Prices
$Houseprice ..
oParticulate content 01 ambient air
air pollution, whereas the other is located in an area with relatively clean airo Wewould expect the market prices of these two houses to differ because of the airquality difference. This conclusion generalizes to a large housing market involving many properties. The surrounding air quality is essentially a feature ofthe location of a house so, as houses are bought and sold in the house market,these air quality differences would tend to get "capitalized" into the marketprices of the houses.16 Of course, homes differ in many respects, not just interms of air quality. So it is necessary to collect large amounts of data on manyproperties and then use statistical techniques to identify the role played by airpollution, as welI as other factors. 17
Assuming we had collected enough data and conducted the appropriatestatistical analyses, we might end up with a relationship such as that shown inFigure 7.2. This shows that as the particulate content of the surrounding airincreases, house prices decrease, everything else held equal. Information of thistype can then be used to estimate homeowners' marginal willingness to pay(benefits) for small decreases in particulate exposure. Smith and Huang recently reviewed a number of studies of this type. They fOlmd that, in general,the marginal wilIingness to pay for a one-w1it decrease in exposure to totalsuspended particulate matter (TSP) was in the range of $100 to $300 for most
16 Capitalized means that house prices adjust to reflect the present value 01 the stream 01 futuredamages to which homeowners would be exposed il they Iived in the various houses.
17 The technical name for this l'¡pe 01 approach is "hedonic" analysis. When the price 01something is related to the many characteristics it possesses, we can study patterns 01 pricedifferences to deduce the value people place on one 01 those characteristics.
150 Section Three EI1viroll1l1el1ta/ Al1lllysis
stuclies.18 Another recent study of house prices by Chattopadhyay estimatedthat people are willing to pay on average about $310 for a one-unit decrease inexposure to PMI0.19
The same kind of approach might be used with sorne cases of water pollution.In Chapter 4 we used lake pollution to introduce the concept of a public good.Suppose a ]ake is surrounded by a number of residences. The market price ofthese homes wi11 be affected by many things: their age, size, condition, and so on.They a]so will be affected by the water quality of the ]ake. If this water qualitydegrades over time, we wou]d expect the market va]ues of the surroundingproperties to go down. The deteriorating water qua]ity means that homeownerswilJ obtain ]ess utiJity from living in that vicinity, other things remaining equa],and this wil1 get capita]ized into the va]ues oí the houses. One approach to measuring the benefits of cleaning up the ]ake is to estimate the overall increase inproperty values among the homes in the vicinity of the lake. We have to remember, however, that this is Jike]y to be on]y a partial estimate of total benefits. Ifnonresidents have access to the ]ake or park, they a]so would be gaining benefits,but these would not show up in property value changes. Property va]ue changesto measure benefits from pollution reduction also can be used in other situations:for example, in valuing the damage from noise around airports and major highways and in measuring the benefits flowing from urban parks.
HousC' price studies can a]so be used to estimate VSLs. Houses near superfundsites, for example, expose residents to higher degrees of risk, and the extent towhich these house prices are ]ower than others can give an imp]ied VSL. In onestudy, for example, the researchers found that this gave a VSL of $4.7 million.20
The Value of Environmental Qualityand Intercity Wage DifferentialsWe talked about using wage rate differences among jobs to measure the valueof reducing health risks from pollution. Wage rate studies a]so have been usedto estímate the va]ue of living in a cleaner environment. Sllppose there weretwo cities, alike in every respect, but one has higher air pollution than the other.Suppose that initially wage rates in the two cities were equal. Since everythingelse is exactly the same, it would be more desirable to work in the less pollutedcity-same wages but less air pollution. Workers would therefore migrate to thecleaner city. Io keep a labor force in the dirty city, one of two things musthappen: the air must be cleaned up or a higher wage must be offered to offset
18 TSP is expressed in terms of micrograms per cubic meter. See V. Kerry Smith and ju-ChinHuang, "Can Markets Value Air Quality? A Meta Analysis of Hedonic Property Value Models,"joumal of Polítical Economy, 103(1 l, 1995, pp. 209-227.
19 PMIO refers to the concentration of particulate matter composed of particles less than10 microns in diameter. See S. Chattopadhyay, "Estimating the Demand for Air Quality: NewEvidence Based on the Chicago Housing Market," Land Economic5, 75(1 l, February 1999,pp. 22-38
lO Ted Cayer, James T. Hamilton, and W. Kip Viscusi, "Private Values of Risk Trade-offs at SuperfundSites: Housing Market E.vidence on Learning about Risk," Review of Economic5 and Statistic5,Vol. 82, 2000, pp. 439-451.
Chapter 7 ¡¡"/lI'jil 1'0'" :l"""/"''' /1,'''''''/' I ~ I
the damages of living in more polluted airo So we could study W,l).\l' 1'.1\1' dill.,/'entia]s among cities with different degrees of air pollutilln tll ml~a"L1n'llll' Vldlll'
that people place on cleaner air. Ihis would give us a way of cstim.llill~ till' hl'l\
efits of cleaning up the air in the more pol1uted cities.
The Value of Environmenta.l Amenitiesas Expressed in Travel CostsOne of the first approaches that environmental economists ever used to estimate the demand for environmental amenities is a method that takes travelcosts as a proxy for price. Although we don't observe people buying units of environrnental quality directly, we do observe them traveling to enjoy, for exampIe, recreational experiences in national and state parks, swimming and fishingexperiences in ]akes and streams, and so on. Travel is costly; it takes time as wellas out-of-pocket travel expenses. By treating these trave] costs as a price thatpeople must pay to experience the environmental amenity, we can estimate,under sorne circumstances, a demand function for those amenities.
By getting travel cost data for a large number of people, we can build upestimates of the aggregate willingness to pay for particular environmentalameruties. Of course, information must be obtained on more than just theirtravel costs. Farnilies will differ in terms of many factors, not just in terms oftheir travel costs to this park. They wil1 have different income ]evels, they willdiffer in terms of the presence of altemative parks and other recreational experiences available to them, and so on. So surveys have to collect ]arge amounts ofdata on many visitors to be able to statistical1y sort out all these various influences on park visitation rates.
This approach may be used to estimate the benefits of improving the qualityof the environrnent at the visitation site, for example, by improving the waterqllality at a recreation lake so that fishing is better. Io do this we mllst mllect information not only on the travel costs of recreators to a single recreation site buton the travel costs to many different sites with differing natural characteristics.Then we can parse out the effects on visitation of various qualitative aspects ofdifferent sites. From this we can then determine their willingness to pay for improvements in these qualitative changes.
Willingness to Pay: Stated Preference Methods
We come now to what might seem as a more direct way of assessing wil1ingnessto pay. This is a stated preference approach, because it invo]ves asking peopledirectly to indicate their willingness to pay for some environmental feature, orsorne outcome that is closely connected to the state of the environrnent.
The best known stated preference method is a technique called contingentvaluatíon. In this method individua]s are asked to make willingness-to-payresponses when placed in contingent situations. If we were interested in measuring people's willingness to pay for something ]ike potatoes, we collld stationourse]ves at stores and see them choosing in real situations. But when there are
152 Section Three Envirol1111entaI Analysis
no real markets for something, such as an environmental quality characteristic,we can only ask them to tell us how they would choose if they were faced witha market for these characteristics.
Contingent valuation methods have been utilized in two different types ofsituations: (1) to estimate valuations for specific features of the environment, forexample, the value of view-reIated amenities, the recreationaI quality ofbeaches, preservation of wildlife species, congestion in wildemess areas, hunting and fishing experiences, toxic waste disposal, preservation of wild rivers,and others;21 and (2) to estimate the valuations people place on outcornes thatare related to environmental quality. A major justification for more stringent environmental regulations has always been the improvements in human healththat these would produce. What is important here are the valuations that peopie place on such things as reduced risk of premature mortality, decreased riskof chronic lung disease, decreased risk of asthma, and so on.
In fact, the use of contingent valuation methods has also spread into nonenvironmental areas, such as estimating the vaIue of programs for reducing therisks of heart attacks, the value of supermarket price information, and the valueof a seniors companion programo Over time the method has been developedand refined to give what many regard as reasonably reliable measures of thebenefits of a variety of public goods, especially environmental quality.
The basic steps in a CV anaIysis are the following:
1. Identification and description of the environmental quality characteristic orhealth outcome to be evaluated.
2. Identification of respondents to be approached, indudirlg sampling procedures used to select respondents.
3. Design and application of a survey questionnaire through personal, phone,or mail interviews (in recent years, focus groups sornetimes have been used).
4. Analysis of results and aggregation of individual responses to estimatevalues for the group affected by the environmental change.
The nature of CV analysis can best be understood by looking more dosely atthe questionnaire design phase.
Valuing an Environmental AmenityIn this case the questionnaire is designed to elicit trom respondents theirwillingness to pay for sorne feature of the environment. The questionnairewould normally have three components.
1. A clear statement of exactly what the environmental feature or amenity isthat people are being asked to evaluate.
21 For a review 01 many 01 these studies and 01 the general problems 01 CV analysis, see RobertCameron Mitchell and Richard T. Carson, Using Surveys to Va!ue Pub/lc Goods: The ConringentValuation Method, Washington, DC, Resources lor the Future, 1989; and Ronald G. Cummings,David S. Brookshire, and William D. Schulze, Va/uing Environmenta/ Goods: An Assessment 01 theContingent Va/uation Method, Rowland and Allanheld Publishers, Totowa, Nj, 1986.
Chapter 7 Bmefit-<::ost Analysis: Brnefits 153
2. A set of questions that will describe the respondent in economically relevantways, such as income, residentiallocation, age, and use of related goods.
3. A question, or set of questions, designed to elicit willingness-to-pay responsestrom the respondent.
The central purpose of the qJ.leStionnaire is to elicit from respondents theirestimate of what the environmental feature is worth to them. In economicterms this means getting them to reveal the maximum amount they would bewilling to pay rather than go without the amenity in question. A number oftechniques have been used to get at this response. The most obvious is to askpeople outright to provide the number with no prompting or probing on thepart of the interviewer. Other approaches indude using a bidding game,where the interviewer starts with a bid at a low level and progressively increases the value until the user indicates that the limit has been reached. Alternatively, the interviewer could start with a high figure and lower it to findwhere the respondent's threshold value is located. Another method is to givethe respondents printed response cards with a range of values, and then askthe respondents to check off their maximum willingness to paYo Exhibit 7.1presents sorne examples of questions used in several contingent valuationstudies.
One great advantage of contingent valuation is that it is flexible and applicable to a wide range of environmental amenities, not just those that cansomehow be measured in conjunction with sorne marketable good. Virtuallyanything that can be made comprehensible to respondents can be studiedwith this technique.
CV was first used in 1963 by Bob Davis to estimate the benefits of outdoorrecreation opportunities in the Maine backwoods. He found that the modalwillingness to pay per family for the use of a wildemess recreation area wasbetween $1.00 and $2.00 per day.22
A contingent valuation study of bird hunting in Delaware found that theaverage willingness to pay for a bagged duck was $82.17; this value was influenced by, among other things, the arnount of congestion in the huntingarea.23
J. Loomis and co-workers found that the average respondent in their CVsurvey would be willing to pay $21 per month for improved water quality inthe Platte River. 24
22 Robert K. Davis, "The Value of Big Game Hunting in a Priva te Forest," in Tramactiom 01 theTwenty-ninth North American Wildlife Conlerence, Wildlile Management Institute, Washington,OC, 1964.
23 )ohn MacKenzie, "A Comparison of Contingent Prelerence Models," American ¡oumal 01Agricultural Economics, Vol. 75, August 1993, pp. 593-603.
24}ohn loomis, Paula Kent, liz Strange, Kurt Fausch, and AJan Covich, "Measuringthe Total Economic Value of Restoring Ecosystem Services in an Impaired River Basin:Results from a Contingent Value Survey," Ecological Economics, 33(1), 2000,pp. 103-117.
154 Section Three Etlvirotl11lentai Anaiysis Chapter 7 B~1I11il··c:".'1 :\1111/1/,"',' //"11"111' I~.~
Sample of QuestionsUsed in Several ContingentValuation Studies
Banzhaf and co-workers found that residents in the Adirondack region ofNew York would be willing to pay between $48 and $107 for ecologicalimprovements in air and water that might flow from currently proposedenvironmental regulations.25
25 Spencer Banzhaf, Dalias Burtraw, David Evans, and Alan Krupnick, "Valuation of NaturalResource Improvements in the Adirondacks," paper presented at National Center forEnvironmental Economics, EPA workshop, October 26-27, 2004.
STUDY TO ESTlMATE BENEFITSOF NATIONAL FRESHWATERQUAlITY IMPROVEMENTS1. How many people in this household
are under 18 years of age?
2. During the last 12 months, did you orany member of your household boat,fish, swim, wade, or water·ski in afreshwater river, lake, pond, or stream?
Here are the national water pollution goals:
Goal C-99 percent of freshwater is atleast boatable,
Goal B-99 percent of freshwater is atleast fishable,
Goal A-99 percent of freshwater is atleast swimmable.
3. What is the highest amount you wouldbe willing to pay each year:a. To achieve Goal C?b. To achieve Goal B?c. To achieve Goal A?
4. Considering the income cfasses listedin the accompanying card, what category best describes the total incomethat you and all the members of thehousehold earned in 20_?
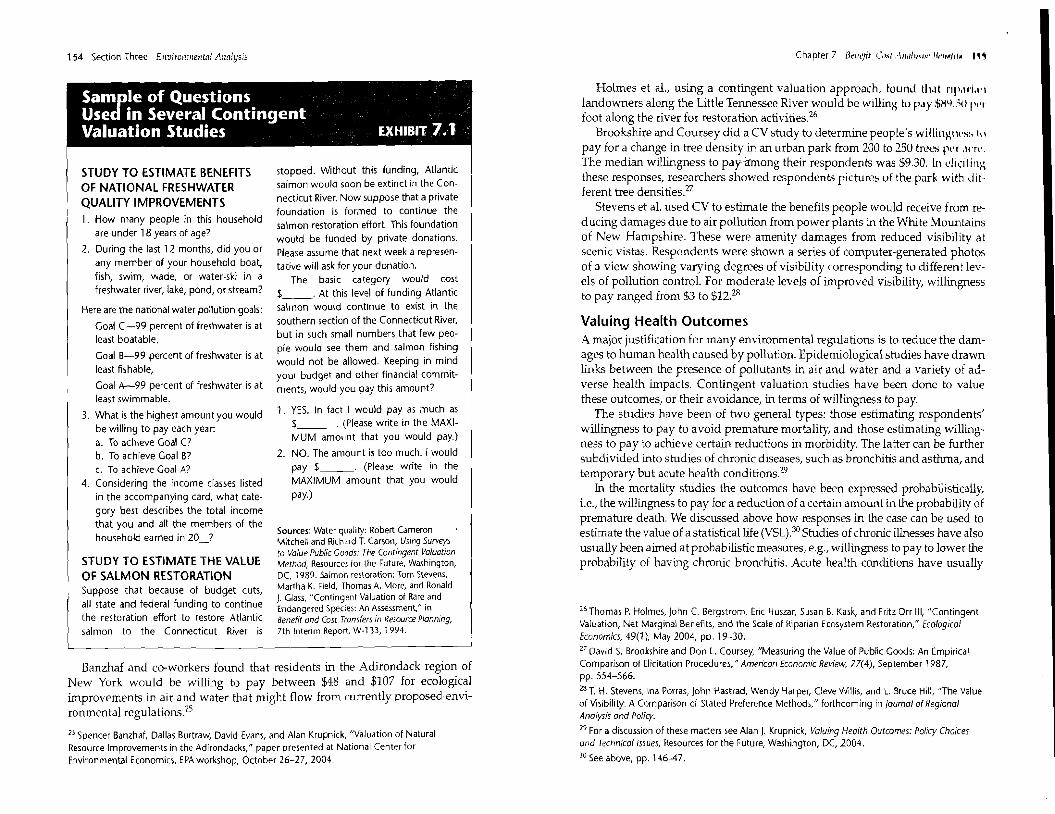
STUDY TO ESTIMATE THE VALUEOF SALMON RESTORATIONSuppose that because of budget cuts,all state and federal funding to continuethe restoration effort to restore Atlanticsalmon to the Connecticut River is
stopped. Without this funding, Atlanticsalmon would soon be extinct in the Connecticut River. Now suppose that a privatefoundation is formed to continue thesalmon restoration effort. This foundationwould be funded by private donations.Please assu me that next week a representative will ask for your donation.
The basic category would cost$__. At this level of funding Atlanticsalmon would continue lo exist in thesouthern section of the Connecticut River,but in such small numbers that few peopie would see them and salmon fishingwould not be allowed. Keeping in mindyour budgel and other financial commitments, would you pay this amount?
1. YESo In fact I would payas much as$~~~. (Please write in the MAXIMUM amount that you would pay.)
2. NO. The amount is too mucho I wouldpay $__. (Please write in theMAXIMUM amount that you wouldpay.)
Sources: Water quality: Robert CameronMitcheli and Richard T. Carson, Using Surveysro Vo/ue Public Goads: The Contingent Vo/uationMethod, Resources for the Future, Washington,DC, 1989. Salmon resloration: Tom Stevens,Martha K. Field, Thornas A. More, and RonaldJ. Glass, "Contingent Valuation of Rare andEndangered Species: An Assessment," inBenelit ond Cost Translers in Resource Planning,7th Interim Report. W-133, 1994.
Holmes et al., using a contingent valuation approach, fallnd th ..II ril',II'I.1I1landowners along the Little Tennessee River would be wilJing to P,lY :j;¡.¡q.!itl 1"'1foot along the river for restoration activities.26
Brookshire and Coursey did a CV study to determine people's willingl\t'sh 11\
pay for a change in tree density in an urban park from 200 to 250 trl'es I'l'r ,ll'l"'.
The median willingness to pay-a-mong their respondents was $9.30. In l'lidtillf;these responses, researchers showed respondents pictures of the park with dif·ferent tree densities.27
Stevens et al. used CV to estímate the benefits people would receive from reducing damages due to airpollution from powerplants in the White Mountainsof New Hampshire. These were amenity damages from reduced visibility alscenic vistas. Respandents were shown a series of computer-generated photosof a view showing varying degrees of visibility corresponding to different levels of pollution control. For moderate levels of improved visibility, willingnessto pay ranged from $3 to $12.28
Valuing Health OutcomesA majar justification for many environmental regulations is to reduce the damages to human health caused by pollution. Epidemiological studies have drawnlinks between the presence of pollutants in air and water and a variety of adverse health impacts. Contingent valuation studies have been done to valuethese outcomes, or their avoidance, in terms of willingness to pay.
The studies have been oE two general types: those estimating respondents'willingness to pay to avoid premature mortality, and those estimating willingness to pay to achieve certain reductions in morbidity. The latter can be furthersubdivided mto studies of chronic diseases, such as bronchitis and asthma, andtemporary but acute health conditions.29
In the martality studies the outcomes have becn expressed probabilistically,Le., the willingness to pay for a reduction of a certain amount in the probability oEpremature death. We discussed aboye how responses in the case can be used toestimate the value of a statisticallife (VSL).30 Studies of chronic illnesses have alsousually been aimed at probabmstic measures, e.g., willingness lo pay to lower !heprobability of having chronic bronchitis. Acute health conditions have usually
26Thomas P. Holmes, lohn C. Bergstrom, Eric Huszar, Susan B. Kask, and Fritz Orr 111, "ContingentValuation, Net Marginal Benefits, and the Scale of Riparian Ecosystem Restoration," EcologicalEconomics, 49(1), May 2004, pp. 19-30.27 David S. Brookshire and Don L. Cour5ey, "Measuring the Value of Pub/ic Goods: An EmpiricalComparison of Elicitation Procedures," American Economic Review, 77(4), September 1987,pp. 554-566.28 T. H. Stevens, Ina Porras, John Ha5trad, Wendy Harper, Cleve Willis, and L. Bruce Hill, "The Valueof Visibility: AComparison of Stated Preference Methods," forthcoming in ¡oumal 01 RegionalAna/Y5i5 and Poliey.
29 For a discussion of these matters see Alan l. Krupnick, Valuing Heolth Outcome5: Poliey Choice5ond Technical155ue5, Resources for the Future, Washington, OC, 2004.30 See aboye, pp. 146-47.

156 Section Three Ellvirolll1lelltal Allalysis Chapter 7 BeHefit-Cost Allalysis: Benefits 157
Outcome U.S. EPA' Canada2 Europe3
TABLE 7.3 Selected Willingness to Pay Estimates for Health Outcomes
Valuation (1990 U.S. Dollars)
Sources:
1 U.S. EPA: The SeneJi!s nnd Cosls oj Ihe Clenn Air A(I Amendlllents oj1990, 1990 lo 2010, Washington, OC, 1999,Appendix H, pp. H-1 lo H-47.'2Canada: Air Quality Valuation Documentation, Stratus Consulting, User Guide, Boulder, COI 1999.""3 Europe: ExtemE, Externalities 01 Ener81j, Va/time 7, Methodology, Brussels, European Commission, 1998...."'As referenced in Alan J. Krupnick, Valuillg Henlfh Outcomes: Poilel} C/JOices and TecJlI1ical Issues, Resources fOI the Fuhrre,March 2004. p. 50.
been valued as though they were certain to be avoided, e.g., willingness to pay toavoid a comrnon cold, or a visit to the emergency room of a hospital.
Table 7.3 presents a small selection oí health related willingness-to-pay measures as reported in three different studies, one of the United States, one oíCanada, and one oí European respondents.
~J!il
reflect not just the value oí a particular ítem, but something about what kind ofan economic system they want to live in, which is a much broader question.
The other question is whether respondents could normally be expected tohave incentives to misstate their true willingness to payo Environmental qualitycharacteristics are public goods, as we saw in Chapter 4. People can be expectedto understate their preíerences Wp these kinds oí goods when they expect thattheir answers will be used to establish payment schedules for the goods. Yet, inCV studies, there is no threat that responses could be used, íor example, to settaxes to pay for the item being evaluated. So, perhaps, this source oí bias is unlikely. The opposite bias may be more likely. People may be led to give an inflated 'estimate oí their willingness to pay hoping, perhaps, that others will dothe same thing, realizing that their share oí the cost of making the item availablewill, in any case, be very small.
There have been hundreds of contingent valuation studies carried out toestimate people's willingness to pay for environmental quality. Despíte the cliííiculties, CV analysis offers great flexibility and a chance oí estimating manyvalues that no other technique can match. The technique is still evolving, however, and we can expect it over time to produce increasingly reliable estimatesoí the value people place on environmental assets oí all types.
Problems in Benefit Estimation
Many problems remain in estimating the beneíits oí improved environmentalquality. Good data are always hard to come by. Better techniques are alwaysuseful to separa te out the effects oí other íactors and isolate the true environmental impacts. More thought has to be given to the conceptual problems thatremain. We will indicate very briefly sorne oí the lalter.
DiscountingOne of the most important is the matter oí discounting. Should we discount future benefits, as we talked about in the last chapter, and, if so, what discoLmtrate is appropriate? When we discount the íuture value of something, we reduce its present value, and the longer in the future these beneíits will be realized, the lower their present value. So discounting tends to decrease the relativevalue oí programs that produce beneíits far in the future and increase those thatproduce beneíits in the next few years. This might make sense with certaintypes oí benefits. People today presumably would put more value on reducingenvironmentally related premature deaths next year than they would on premature deaths 50 years írom now. But there are sorne significant environmentalissues, such as global warming, where substantial impacts are expected to occurin the distant íuture, and in this case discounting tends to reduce substantiallythe importance of programs addressing this problem.
There is no easy answer to this problem. We cannot simply reject discountingaltogether; even future generations would be unlikely to agree with that ifthey could make their wishes known. In ordinary aífairs, however, the present
$3.0 mil$103 thous
$218$73
$2.9 mil$186 thous
$399$51
$4.8 mil$260 thous$25 thous$194$38
Reduced mortality, implied V5LWTP to avoid a case of chronic bronchitisWTP to avoid a case of chronic asthmaWTP to avoid an ER visitWTP to avoid a "restricted activity day"
Problems of CV AnalysisThe most problematic aspect oí contingent valuation is its hypothetical character. When people buy potatoes, to go back to our example, they have to "puttheir money where their mouth is," as the saying goes. It is a real situation and ifthe wrong choices are made, people suffer real consequences. In a CV questionnaire, however, the same real-world implications are not present. People face ahypothetical situation to which they may give hypothetical responses not governed by the discipline oí a real marketplace. In thinking about this, two types oíquestions come up: First, will people know enough about their real preíerencesto be able to give valid responses, and, second, even ií they know their preferences, will they have incentives to misrepresent them to the investigator?
Everyone develops experience buying sorne things, but not others, on themarket. In 17th-century New England, people were used to buying and sellingpews in the church. In sorne countries official papers írom public officials require standard monetary bribes. In contemporary society there are going pricesfor cantaloupes and blood. When people face market prices íor a good or service over a period oí time, they have time to learn about their values, adjusttheir purchases, and settle on a wiUingness to pay that accurately representstheir preferences. But when asked to place a monetary value on something thatdoes not normally carry a price, it may be much more diíficult to state one's truewillingness to payo What would you bewilling to pay for 10 more beautiíul sunsets per year? People also develop ideas over time about the appropriate extentoí the market in allocating certain goods and services; when asked to put avalue on something that is currently beyond the market, their answers may
158 Section Three Ellv;ronmenlal Arwlysis
generation is undoubtedly too oriented to the short run; too much reliance isplaced on recent history and not enough on future possibilities. For society as awhole, a longer-run perspective is appropriate. As mentioned in the last chapter, perhaps the best approach is to combine discounting with the idea of sustainability. Discounting is appropriate as long as it does not lead to a rednctionin the long-run environmental capital of the society.
Willingness to Pay vs. Willingness to AcceptAn alternative way of approaching the problem of valuing environmental improvements is to ask people how much they would be willing to accept to giveup sorne envirorunental amenity. Io value better air quality we could ask eitherhow much people would be willing to pay for a small improvement or howmuch they would have to receive to compensate them for a small reduction inair quality. Suppose public authorities are contemplating locating a hazardouswaste incinerator in a particular community. As a measure of the damagessuffered by the community, we could take the amount of money required to getthe community willingly to accept the incinerator (rather than, in other words,the amount they would be willing to pay to keep it out).
Clearly, willingness to accept is not constrained by one's income, as is willingness to pay. So it may be no surprise that when people are asked willingnessto-accept questions, their answers are usually higher than their willingness-topay responses for the same item. To sorne extent it may depend on what theyare asked. For a small change we would expect the two measures to be close.Suppose what is involved is a single cantaloupe. If 1am willing to pay $1.99 forone more cantaloupe, that is also probably close to what it would take to compensate for my 1055 of a single cantaloupe, but for large changes (what are caHednorunarginal changes) this may not be the case. If we are talking, for example,of large changes in air pollution in my neighborhood that will substantiallychange my welfare, the two measures may be quite different.
Economists have taken several approaches to resolving this problem. One isto look closely at the questionnaire and the way questions are asked of respondents. Experience has shown that responses will differ· according to howquestions are phrased; therefore, one possibility is that the differences betweenwillingness to pay and willingness to aceept are traceable primarily to the wayquestions are being framed. Ihe other approach is to replace the standardeeonomic principIes, which imply that there should be no difference betweenthese two measures, with new concepts that can explain the difference.
Nonuse ValuesWhen people buy potatoes, we assume that they do so because they expect toeat them; the value of potatoes to people lies in their use value. This reasoningextends also to envirorunental assets, but in this case there may be more. Whenpeople voluntarily donate money for the preservation of unique envirorunentalassets that they may never even see, except perhaps in photographs, somethingother than use value mllst be involved. People's willingness to pay for theseenvironmental charaeteristics also must involve certain nonuse values. One
Chapter 7 81'1/I'Iil ('",</ /1111/111'01:1 /1,"lr'/II. I \U
possibility is that although perhaps not currently in d po~itiun tu ("1'('1'11'111"
directly a particular environmental asset, people often want tu pn'~\'IVI' lli,'option to do so in the future. Option value is the amount i1 p('rson wUlIld ",'willing to pay to preserve the option of being able to experiencl' a pil 1'1 il 111.1 renvironmental arnenity in the future. People may even be willing to pay 1(1 pn L
serve something they in aH likelihood will never see-African wild lifl', fuI'example. In this case, what is involved is existence value, a willingnl'Sh lo P,IYsimply to help preserve the existence of sorne environmental amenity. Suchaltruistic values may be focused to sorne extent on future generations. in whichcase they might be called bequest values. Lastly, we might add a stewardshipvalUé, which is a value not related necessarily to human use of the environment, but rather to maintaining the health of the environment for the continueduse of all living organisms. One of the reasons contingent valuation studieshave become more common is that questions can be phrased so as to get at thesenonuse values.
SummaryBenefit measurement is a major focus of study within environmental economics. New techniques are being developed to uncover values that previouslywere hidden from view. From legislatures and courts a brisk demand has arisenfor benefits information on whieh to base laws and legal settlements. Public environmental agencies have devoted considerable time and effort to generatingbenefits estimates in order to justify their poliey rulings. After reviewing brieflywhat we mean by benefits, we discussed sorne of the main teclu1iques environmental economists use to measure these benefits. Health impacts, previouslyassessed by direct damage estimation, are now more frequently pursuedthrough willingness-to-pay procedures, especial1y wage-rate studies- showinghow people value risks to health. We also covered house-price studies, production cost studies, and travel cos! studies. hnal1y, we reviewed the technique ofcontingent valuation. This technique allows benefits to be rneasured over amuch wider range of environmental phenomena than other techn'iques permit.Indeed, contingent valuation techniques allow analysts to push beyond traditional use values and explore sorne of the less tangible, but no less real, sourcesof envirorunental benefits, such as option value, existence value, and steward·ship value,
Questions for Further Discussion1. Suppose you were hired by the homeowners loeated around a lake lo deter
mine the benefits of improving the water quality in the lake. How might yougo about doing it?
2. One of the main studies used in evaluating the EPA's decision to ban leadedgasoline estimated that the avoided medical costs and avoided remedial
160 Section Three EnVlronmelltal Analysis
education costs of such aban would be about $225 million. What are theadvantages and disadvantages of using this number as a measure of thehealth-related benefits of the ban? (For more on this, see Albert L. Nichols,aLead in Gasoline," in Richard D. Morgenstem (ed.), Economic Analysis alEPA, Assessing Regulalory Impact, Resources for the Future, Washington, DC,1997, pp. 49-86.)
3. Suppose you want to determine the aggregate willingness to pay among students at your school for reducing litter on the school grounds. How mightyou do this?
4. What is the usual meaning that economists give to the expression "the valueof a human IHe"? What are the different ways of estimating this value?
5. Design sorne contingent valuation-type questions for evaluating the value topeople of improving the air quality in the Grand Canyon.
6. Survey 10 other students, asking them how much they would be willing topay for one visit to their favorite beach. What qualifying questions did yourrespondents ask you before they could assign a dollar value? What are sornefactors influencing people's willingness-to-pay value?
For ,1dditioTIal readings and Web sites pertaining to the material in this chaptersel' www.mhhe.com/fieldSe.
Chapter
Benefit-Cost Analysis:Costs
In this chapter we look at the cost side of benefit-eost analysis. The importanceof accurate cost measurement often has been underestimated. The results of abenefit-cost ana1ysis can be affected as easily by overestimating costs as byunderestimating benefits. In developing countries, where people place a highpriority on economic growth, it is critically important to know how environmental programs will affect that growth rate and how costs are distributedamong different social groups. In industrialized countries, opposition to environmental policies frequently centers on their estimated costs, which meansthat those doing benefit-eost analyses of these programs are well advised toget the cost estimates right. In this chapter we will first take up sorne generalconsiderations about ('osts, then look at sorne specific issues and examples ofcost estimation.
The Cost Perspective: General Issues
Cost analysis can be done on many levels. At its simplest, it focuses On the coststo a single community or firm of an environmental regulation or of a single environmental project, such as a wastewater treatment plant, incinerator, or beachrestoration project. The reason for calling these the simplest is that they usuallyproceed by C'Osting out a definite engineering specification that has dear boundaries and for which the "rest of the world" can rightly assume to be constant.
At the next level we have costs to an industry; or perhaps to a region, of meeting environmental regulations or of adopting certain technologies. Here it is nolonger possible to rely on simple engineering assumptions; we must do thingssuch as predict with reasonable accuracy how groups of polluting firms wil1respond to changes in laws on emissions or how they will respond to changesin recycJing regulations. Problems will arise because not all firms will be alike-sorne small, sorne large, sorne oId, sorne new, and so on-and each of them willusually have multiple possibilities for reacting to regulations.
161
162 Section Three EnvÍronmental Analysis
At a still higher leve!, our concem may be with the costs to an entire economyof achieving stated environmental goals. Estimating costs at the nationallevel caUsfor an entirely different approach. Here everything is cormected to everything else;when pollution-control regulations are imposed, adjustrnents wjU reverberatethroughout the economy. Tracing them out requires macroeconomic data and usualIy fairly sophisticated aggregate models. After taking a look at severa! generalissues in cost estimation, we will deal with the subject at these different levels.
The WithjWithout PrincipieThere is an important principie that has to be kept in mind in this work. Indoing a benefit-cost analysis of how firms will respond to new laws, we wantto use the with1without principIe and not the before/after principIe. We want toestimate the differences in costs that poUuters would have with the new law,compared to what their costs would have been in the absence 01 the law. This is not thesame as the difference between their new costs and what their costs used to bebefare the law. Consider the following illustrative numbers that apply to a manufacturing firm for which a pollution-control regulation has been proposed:
Estimated production costs:
Before the regulation: $100In the future without the regulation: $120In the future with the regulation: $150
It would be a mistake to condude that the added costs of the poUution-controlregulation will be $50 (future costs with the regulation minus costs before thelaw). This is an application of the befare!after principIe and does not accuratelyreflect the true costs of the law. This is so because in the absence of any new law,production costs are expected to increase (e.g., because of increased fuel costsunrelated to environmental regulations). Thus, the true cost of the regulation isfound by applying the with!without principIe. Here, these costs are $30 (costs inthe future with the regulation minus future costs without the regulation). Ofcourse this makes the whole job of cost estimation harder because we want toknow not historical costs of a firm or an industry but what its future costs wouldbe if it were to continue operating without the new environmentallaws.
The with!without scenario calls for baseIine analysis, the estimation ofwhat future cost levels could be expected to be in the absence of the regulation.What makes baseline analysis so difficult is that future technical change (betterprocedures, better equipment, etc.) will lower costs, and it is normally veryhard to predict with accuracy how fast this technical change will take place.
No-Cost Improvements in Environmental Quality50metimes environmental improvements can be obtained at zero social cost,except the political cost of making the required changes in public laws or regulations. In virtuaUy any type of political system, usuaUy some laws and administrative practices are instituted primarily to benefit certain groups within society forpolitical reasons rather than to move toward economically efficient resource useor achieve de5erving income redistributions. These regulations, besides transferring inLOffi(' tlllhe favored groups, often have negative environmental effects.
Chapter 8 B~'ItFI-l'''sl :I/lIIIV,"" \""'" 11\ I
Consider, for example, coastal zone flood insurance in the Ul1itl~d St.II,'"Commercial insurance for property constructed in the coastal ¿OHe wlluld /lO!'
mally have such high premiums, because of the expected losses fmm 11110.1-.,that few coastal homeowners could afford it. The US. government, amI SOlll"
times state governments, will often subsidize coastal zone insurance Sil lJi,11
people building in these areas C<11< get insurance at substantially less than COIll
mercial rates. The effects of this have been to reduce the private Olonet.lry costsof building and maintaining houses in the coastal zone; thus, substantial Jevl'l·opment has occurred there, with attendant environmental impacts. A red uctiol1in these public subsidies to coastal homeowners not only would work to reducethese' environmental impacts but also would lead to an increase in nationalincome. Of course, coastal homeowners would suffer losses.
There are many other examples such as tms. AgriculturaI subsidies in manydeveloped cáuntries have provided the incentive to develop intensive, chemicalbased production methods, which have resulted both in increased agriculturaloutput and in the nonpoint-source water and air pollution to which these methods lead. Reducing these agricultural subsidies would inerease national incomeand reduce the environmental impacts, though of course sorne farmers wouldbe worse off.
The Distribution of CostsThe overall social costs of environmental regulations are important in assessingtheir cost-effectiveness. Beyond this, however, a majar factor behind many policy controversies is how these total costs are distributed among different groupsin society. Environmental regulations initial1y may lead to increased productioncosts in the industry to which the regulation applies, as firms undertake thepollution-control steps required by the regulations. But changes will not be confined to this one industry. As firms alter production technology, input mixes, andother aspects of their operations, their prices are likely to change, for both outputs and inputs. So sorne, or perhaps al1, of the consequences of the regulationwill be shifted to consumers and input-supplying firms. Employees of the regulated firms will be impacted when production rates increase or decrease in theaffected industries. Very often there will be important regional differences inthese impacts, because often industries are more concentrated in certain regionsthan in others. It is impartant, then, to be concemed not only with total costs, butalso with how these costs are distributed.
ConceRts of Cost
Opportunity CostsIn economics the most fundamental concept of costs is opportunity costs. Theopportunity cost of using resources1 in a certain way is the highest value theseresources would have produced had they not been used in the manner under
1 Remember that resources is a word that can have two meanings: It can be a short way 01 sayingnatural resources 01' a general relerence analogous to the word inputs. Here we are using it in thesecond sense.

164 Section Three Environmenlal Analysis
consideration. U resources are used to produce cars, they can't be used to produce something else. If resources are used to enforce air pollution regulations,they can't be used to implement land-use regulations. It is the forgone values ofthese altemative uses that constitute the opportunity costs of pursuing a particular course of action.
Costs are incurred by all types of firms, industries, agencies, and othergroups. Prom the perspective of a private firm, the opportunity cost of producing a good or service is what they could have produced if they had chosen a different output. We must differentiate private costs from social opportunitycosts. The latter represent the costs to society of using resources in aparticular way, meaning aH costs, no matter to whom they accrue. We discussedearlier how social costs inelude private costs, but also include external costs, inthe form of pollution damage casts incurred by third parties, whenever theyexist.2
Sometimes items that a private group might consider a cost (e.g., a tax) is nota cast from the standpoint of society. Sometimes items that particular decisionmakers do not consider as costs really do have social costs. Suppose a community is cantemplating building a bicyele path to relieve congestion and air pollution downtown. Its primary concem is what the town will have to pay tobuild the path. Suppose it will take $1 million to build it, but 50 percent of thiswill come from the state or federal government. Prom the town's perspectivetht' cost of the bike path will be a half million dollars, but from the standpoint ofsocicty lhe ful! opportunity costs of the path are $1 miJlion.
When most people lhink of cost they usually think of money expenditure.afIen the monetary cost of something is a good measure of its opportunitycasts, but frequenlly it is noto Suppose the bike path is going to be put on an oldrailro,KI right-of-way that has absolutely no alternative use, and suppose thetown must pay the railroad $100,000 for this right-of-way. This money isdefinitely an expenditure the town must make, but it is not truly a part of theopportunity costs of building the path because society gives up nothing indevoting the old right-of-way to the new use.
Environmental CostsIt may seem paradoxical to think that environmental protection control programs might have environmental costs, but trus is in fad the case. Most specificemissions-reduction programs are media based; that is, they are aimed at reducing emissions into one particular environmental medium such as air orwater. So when emissions into one medium are reduced, they may increase intoanother. Reducing untreated domestic waste outflow into rivers or coastaloceans leaves quantities of solid waste that must then be disposed of, perhapsthrough land spreading or incineration. Reducing airbome 502 emissions frompower plants by slack-gas scrubbing also leaves a highly concentraled sludgethat must be disposed of in sorne way. lncinerating domestic salid waste createsairbome emissions.
2See Chapter 4, p. 71.
Chapter 8 Benefit-Cost Ana/ys's: Costs 165
Media switches are not the only source of environmental impacts stemmingfrom environmental improvement programs. There can be direct effects-forexample, sediment runoff from construction sites for new treatrnent plants orsewer lines. There also can be unforeseen impacts when firms or consumersadjust to new programs. Gasoline producers reduced the amounls of lead intheir product, but beca use COl}5umers still insisted on high-powered performance they added other compounds, which ended up having environmenlalimpacts in their own right. With the beginning of community programs tocharge consumers for solid waste disposa!, sorne have been faced with substantial increases in "midnight dumping," thal is, illegal dumping along the sides ofroads or in remote areas.
Sorne of the potential environmental impacls from these public projects orprograms can be mitigated; that is, steps can be taken to reduce or avoid them.More enforcement resources can help control midnight dumping, extra stepscan be laken to reduce construction-site impacts, special lechniques may beavailable to reduce incinerator residuals, and so on. These mitigation costs muslbe included as part of the total costs of any project or programo Beyond this, anyremaining environmental costs must be set against the overall reduction inenvironmental darnages lo which the program is primarily aimed.
Enforcement CostsEnvironmental regulations are not self-enforcing. Resources must be devoted tomonitoring the behavior of firms, agencies, and individuals subject to the regulations and to sanctioning violators. Public environmental facilities, such aswastewater treatrnenl plants and incinerators, musl be monitored lo be surethey are being operated correctly.
There is an importanl application of the opportunity idea in the enforcementphenomenon. Many environmental laws are enforced by agencies whose enforcement budgets are not strictly tailored to the enforcement responsibilitiesthey are given. Thus, budgets can be stable, or even deelining, al the same timelhat new environrnentallaws are passed. Enforcing the new laws may requireshifting agency resources away from the enforcement of other laws. In thiscase the opportunily costs of new enforcement must include lhe lower levels ofcompliance in areas that now are subject lo less enforcernent.
Costs of Single Facilities
Perhaps the easiest type of cost analysis to visualize is that for a singlt" engineered project of sorne type. There are many types of environmental qualityprograrns that involve publicly supported construetion of physical facilities(although the analysis would be the same whatever lhe ownersrup), such aspublic wastewater treatment plants, of wruch hundreds of millions of dollars'worth have been built over lhe last few decades. Other examples include floodcontrol projects, solid-waste handling facilities, hazardous-wasle incineralors,beach-restoration projects, public parks, wildlífe refuges, and so on.
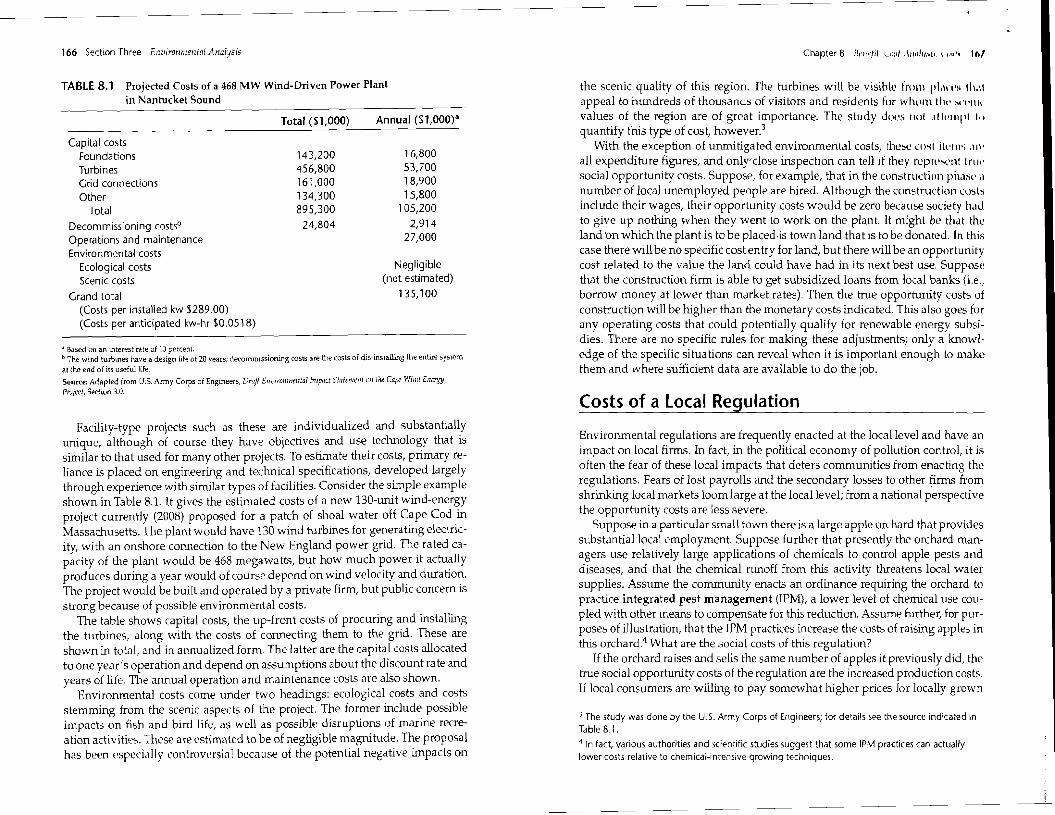
166 Seetion Three EJlvironnlentai Al1alysis Chapter 8 B"II':lil \.. ,>:".\""11/",,, 1,.. l. lt,'
TABLE 8.1 Projeeted Costs of a 468 MW Wind-Driven Power Plant
in Nantucket Sound
• Ba:sed O" an interest cate of 10 percent.bThe wind turbines halJe a desígn life 01 20 years; decommissioning costs are the costs of dis~installing the entire systemat the end of its Llsefullife.
Source: Adapted from U.5. Army Corps of Engineers, Draft EJIvirolllJtetltal Impact Statemenf 011 the Cape Wind EnergyProject, Section 3,0.
Capital costsFoundationsTurbinesGrid connectionsOther
TotalDecommissioning costsb
Operations and maintenanceEnvironmental costs
Ecological costsScenic costs
Grand total(Costs per installed kw $289.00)(Costs per anticipated kw-hr $0.0518)
Total ($1,000)
143,200456,800161,000134,300895,300
24,804
Annuaf ($1,000)"
16,80053,70018,90015,800
105,2002,914
27,000
Negligible(not estimated)
135,100
the scenic quality of this region. The turbines will be visible (mm pl.\ll'~' lil,\\appeal to hundreds of thousands of visitors and resident5 fuI' whplll lill' ~I'I'I\II'
values of the regíon are of great importance. The study JOl'S I1P[ ,1111'1111'1 1..
quantify this type of cost, however.3
With the exceptíon of unmitigated environmental cost5, thesl' rost ill'III'¡ .11'1'
aU expenditure figures, and onltdose inspection can teH if they I'l'prl'sl'nllnll'social opportunity costs. Suppose, for example, that in the constrllctilll1 pha~l' .1
number of local unemployed people are hired. Although the construdion (():,h
indude their wages, their opportunity costs would be zero becallse society h.ldto give up nothing when they went to work on the plant. lt might be that theland 'On which the plant is to be placed.is town land that is to be donated. In thiscase there will be no specific cost entry for land, but there will be an opportunitycast related to the value the land could have had in its next best use. Supposethat the construction firm is able to get subsidized loans from local banks (i.e.,borrow money at lower than market rates). Then the true opportunity costs ofconstruction will be higher than the monetary costs indicated. This also goes forany operating costs that could potentiaUy qualify for renewable energy subsidies. There are no specific rules for making these adjustments; only a knowledge of the specific situations can reveal when it is important enough to makethem and where sufficient data are available to do the jobo
Costs of a local RegulationFacility-type projects such as these are individualized and substantially
unique, although of course they have objectives and use technology that issimilar to that used for many other projects. To estimate their costs, primary reliance is placed on engineering and technical specifications, developed largelythrough experience with similar types of facilities. Consider the simple exampleshown in Table 8.1. It gives the estimated costs of a new 130-unít wind-energyproject currently (2008) proposed for a patch of shoal water off Cape Cod inMassachusetts. Tbe plant would have 130 wind turbines for generating electricity, with an onshore connection to the New England power grid. The rated capacity of the plant would be 468 megawatts, but how much power it actuallyproduces during ayear would of course depend on wind velocity and duration.The project would be built and operated by a private firm, but public concern isstrong because of possible environmental costs.
The table shows capital costs, the up-front costs of procuring and instaUingthe turbines, along with the costs of connecting them to the grid. These areshown in total, and in annualized form. The latter are Ihe capital costs allocatedto one year's operation and depend on assumptions about the discount rate andyears of life. The annual operation and maintenance costs are also shown.
Environmental costs come under two headings: ecological costs and costsstemming from the scenic aspects of the project. The former include possibleimpacts on fish and bird life, as well as possible disruptions of marine recreation activities. These are l'stimatcd to be of negligible magnitude. The proposalh;¡s been especially controvcrsi;¡[ because of the potential negative impacts on
Environmental regulations are frequently enacted at the locallevel and have animpact on local firms. In fact, in the political economy of pollution control, it isoíten the fear of these local impacts that deters communities from enacting theregulations. Fears of lost payrolls and the secondary losses to other firms fromshrinking local markets 100m large at the locallevel; from a national perspectivethe opportunity costs are less severe.
Suppose in a particular srnal! town there is a large apple orchard that providessubstantiallocal employment. Suppose further that presently the orchard managers use relatively large applications oí chemicals to control apple pests anddiseases, and that the chemical nmoff from this activity threatens local watersupplies. Assume the comrnunity enacts an ordinance requiring the orchard topractice integrated pest management (IPM), a lower level of chemical use coupled with other means to compensate for this reduction. Assume further, for pllrposes of illustration, that the IPM practices increase the costs of raising apples intrus orchard4 What are the social costs of this regulation?
If the orchard raises and sells the same number of apples it previously did, thetrue social opportunity costs oí the regulation are the increased production costs.If local consumers are willing to pay somewhat higher prices íor locally grown
J The study was done by the U.S. Army Corps 01 Engineers; lor details see the sauree indieated inTable 8.l.
4 In faet, various authorities and seientific studies suggest that sorne IPM praetiees ean aetuallylower eosts relative to ehemical-intensive growing teehniques.
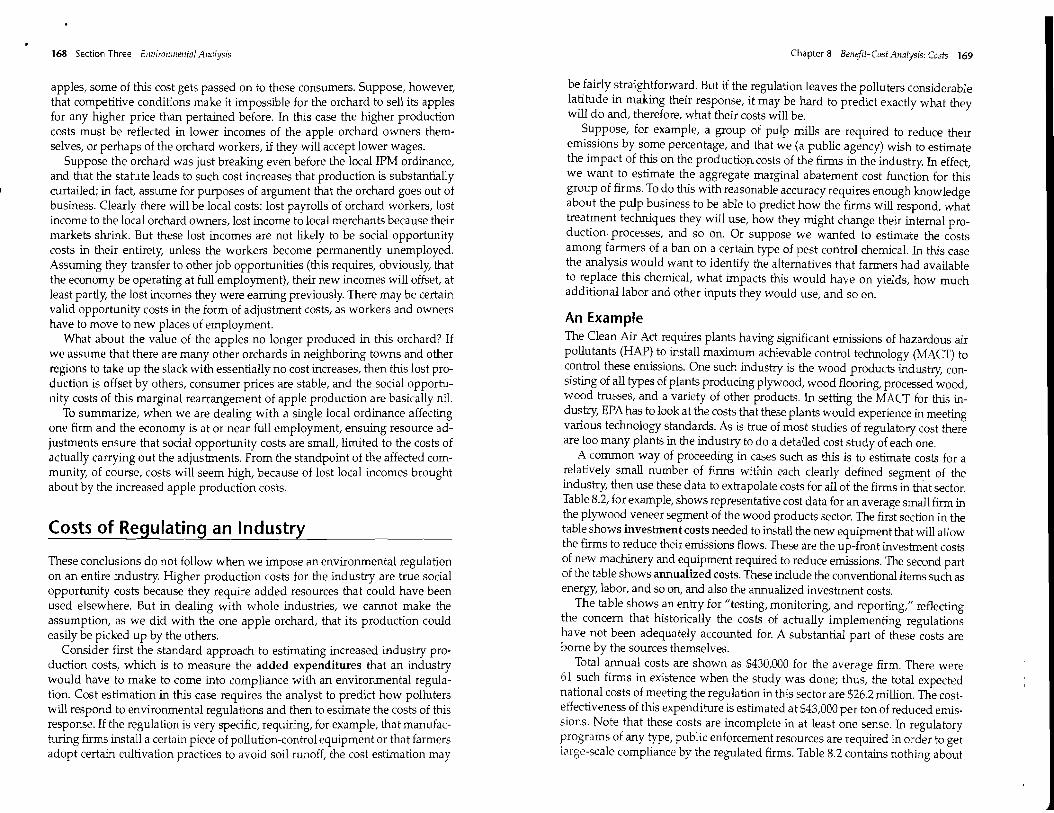
168 Section Three fl1vironmenta/ Ana/ysis
apples, sorne of this cost gets passed on to these consumers. Suppose, however,that competitive conditions make it impossible for the orchard to sell its applesfor any higher price than pertained before. In this case the higher productioncosts must be reflected in lower incomes of the apple orchard owners themselves, or perhaps of the orchard workers, if they will accept lower wages.
Suppose the orchard was just breaking even before the local IPM ordinance,and that the statute leads to such cost increases that production is substantiallycurtailed; in fact, assume for purposes of argument that the orchard goes out ofbusiness. Clearly there will be local costs: lost payrol!s of orchard workers, lostincome to the local orchard owners, lost income to local merchants because theirmarkets shrink. But these lost incomes are not likely to be social opportunitycosts in their entirety, unless the workers become permanently unemployed.Assuming they transfer to other job opportunities (this requires, obviously, thatthe economy be operating at full employrnent), their new incomes wil! offset, atleast partly, the lost incomes they were eaming previously. There may be certainvalid opportunity costs in the form of adjustment costs, as workers and ownershave to move to new places of employment.
What about the value of the apples no longer produced in this orchard? Ifwe assume that there are many other orchards in neighboring towns and otherrcgions to take up the slack with essentially no cost increases, then this lost production is offset by others, consumer prices are stable, and the social opportunity costs of this marginal rearrangement of apple production are basically ni!.
To summarize, when we are dealing with a single local ordinance affectingone firm and the economy is at 01' near fuI! employment, ensuing resource adjustments ensure that social opportunity costs are small, limited to the costs ofactually carrying out the adjustments. From the standpoint of the affected community, of course, costs will seem high, because of lost local incomes broughtabout by the increased apple production costs.
Costs of Regl.!lating an Industry
These conclusions do not fol!ow when we impose an environmental regulationon an entire industry. Higher production costs for the indl.lstry are true socialopportunity costs because they require added resources that could have beenused elsewhere. But in dealing with whole industries, we cannot make theassumption, as we did with the one apple orchard, that its production couldeasily be picked up by the others.
Consider first the standard approach to estimating increased industry production costs, which is to measure the added expenditures that an industrywould have to make to come into compliance with an environmental regulation. Cost estimation in this case requires the analyst to predict how polluterswill respond to environmental regulations and then to estimate the costs of thisresponse. If the regulation is very specific, requiring, for example, that manlliacturing firms instal! a certain piece of pollution-control equipment or that farmersadopt certain cultivation practices to avoid soil runoff, the cost estimation may
Chapter 8 Benefit-Cost Ana/ysis: Costs 169
be fairly straightforward. But if the regulation leaves the pol!uters considerablelatitude in making their response, it may be hard to predict exactly what theywill do and, therefore, what their costs will be.
Suppose, for example, a group of pulp milis are required to reduce theiremissions by sorne percentage, and that we (a public agency) wish to estimatethe impact of this on the prodUCtiOfLcOStS of the firms in the industry. In effect,we want to estimate the aggregate marginal abatement cost function for thisgroup of fums. To do this with reasonable accuracy requires enough knowledgeabout the pulp business to be able to predict how the firms will respond, whattreatment techniques they will use, how they might change their internaI production. processes, and so on. 01' suppose we wanted to estimate the costsamong farmers of aban on a certain type of pest control chemica!. In this casethe analysis would want to identify the alternatives that farmers had availableto replace this chemica!, what impacts this would have on yields, how muchadditionallabor and other inputs they would use, and so on.
An ExampleThe Clean Air Act requires plants having significant emissions of hazardous airpollutants (BAP) to install maxirnum achievable control technology (MACT) tocontrol these emissions. One such industry is the wood products industry, consisting of al! types of plants producing plywood, wood flooring, processed wood,wood trusses, and a variety of other products. In setting the MACT for this industry, EPA has to look at the costs that these plants would experience in meetingvarious technology standards. As is true of most studies of regulatory cost thereare too many plants in the industry to do a detailed cost study of each one.
A cornmon way of proceeding in cases such as this is to estimate costs for arelatively small number of firms within each clearly defined segment of theindustry, then use these data to extrapolate costs for a11 of the firms in thiü sector.Table 8.2, for example, shows representative cost data for an average sma11 firm inthe plywood veneer segment of the wood products sector. The first section in thetable shows investment costs needed to install the new equipment that will al!owthe firms to reduce their emissions t1ows. These are the up-front investment costsof new machinery and equipment required to reduce emissions. The second partof the table shows annualized costs. These include the conventional iterns such asenergy, labor, and so on, and also the annualized investment costs.
The table shows an entry for "testing, monitoring, and reporting," reflectingthe concern that historical!y the costs of actually implementing regulationshave not been adequately accounted foro A substantial part of these costs areborne by the sources themselves.
Total annual costs are shown as $430,000 for the average firmo There were61 such firms in existence when the study was done; thus, the total expectednational costs of meeting the regulation in this sector are $26.2 million. The costeffectiveness of this expenditure is estimated at $43,000 per ton of reduced ernissions. Note that these costs are incomplete in at least one sense. In regulatoryprograms of any type, public enforcement resources are required in order to getti,rge-scale compliance by the regulated firms. Table 8.2 contains nothing abol.lt

170 Section Three Environmentai AJJalysis Chapter 8 Bellefit-CIJ,~I IIt/llIV"'.: ,"",/,. 111
these costs, but in a full social benefit-eost analysis, they obviously would haveto be included.
..AMualized al 7 percent with a 15-year assumed equipment lHe.
Source: Adapted from U.S. EPA, Eeollomie Impaet Ana/y,i, of tlle l'Iytoood alld Composite Woodl'rodlle/s, NFSHAP Final Report, Office oi Air Quality, November 2002.
TABlE 8.2 Costs per Year of a Typical Plywood Veneer Plantto Instan Maximum Available Control Technology(MACT) for Hazardous Air PolIutants (HAPs)
by a composite cost estimate. In this case accurately means clost' enoll~h IhMindividual firms will not be inclined to take the agency to court on ~rtllInd:i
that their own unique cost situations are misrepresented by the figun's I(lr t/w"representative" firmo Many court battles have been fought over this issul'.
Misrepresentation of CostsBecause the regulated firms therri¿elves are the source of much cost data lIsedto develop the regulations, there is clearly a question whether these firms willsupply accurate data. By overstating the costs of reaching certain reductions inemissions, firms may hope to convince agencies to promulgate weaker regulations ttLan they would if the agencies had an accurate idea of costs. It is a verycommon sight in public hearings on establishing emission control regulationsto see firms making vigorous claims that the regulations will be unduly costlyfor them to meet. There is evidence !hat many of these clairns have been exaggerated in the past. This issue will come up numerous times when we examinethe incentives surrounding different types of environmental policies. In effect,regulated firms have prívate information about their costs that regulating agencies often don't have.
Actual vs. Minimum Pollution Control CostsThe costs shown in Table 8.2 show the estimated costs of the plywood veneersector meeting the environrnental standards imposed by law. There is an important question of whether these costs are the least costs necessary to achievethe emission reductions sought in the law. This is an important point because,as we saw in Chapter S, the efficient level of emissions or ambient quality is defined by the trade-off of emission abatement costs and environmental damages.If abatement costs used to define the efficient level are higher than they need tobe, the point so defined will be only a pseudo-efficient outcome.
When there is a single facility involved, we must rely on engineering judgment to ensure that the technical proposal represents !he least costly way ofachieving the objectives. When what is involved is an entire industry, both technical and econornic factors come into play. As discussed earlier, in order for theoverall costs of a given emission reduction to be achieved at rninimum cost, theequimarginal principle has to be fulfilled. Frequently, environmental regulations work against this by dictating that different sources adopt essentially thesame levels of ernission reductions or install the same general types of pollutioncontrol technology. As will be seen in later chapters, many environmentallaws are based on administratively specified operating decisions that firmsare required to make. These decisions may not lead, or allow, firms to achieveemission abatement at least cost. Thus, industry costs such as those depicted inTable 8.2 may not represent mínimum abatement costs.
There is no easy way out of this dilernrna. If one is called on to do a beneHtcost analysis of a particular environmental regulation, one presumably is committed to evaluating the regulation as given. In cases such as this it would nodoubt be good policy for the analyst to point out that there are less costly waysof achieving !he benefits.
154,00068,00028,00017,00043,000
430,000
120,000
Costs per Year (S)
1,100,000320,000
Cost Item
Investment costs:PurchaseInstallation
Annual costs:*Capital costsLabor:
OperatingMaintenance
SuppliesPowerTesting, monitoring, and reporting
Total annual costs
Sources of Cost DataWhere does one get the cost data necessary to constntct these representativefirms? Many of the basic data are generated through cost surveys of existingfirms. In effect, questionnaires are sent out to these firms asking them to supplyinformation on number of employees, processes used, costs of energy and materials, and so on. With a sufficiently detailed questionnaire and a reasonablyhigh response rate by firms, researchers hope to get a good idea of basic costconditions in the industry and how they might be affected by environrnentalregulations.
One problem with cost surveys is that they are usually better at getting information on past cost data than on future costs under new regulations. Firms canprobably report past cost data wi!h more reliability than they can estímate futurecosts of meeting environrnental constraints. Historical data may not be a goodguide to the future, especially because environrnental regulations almost by definition confront firms with novel situations. In these cases it is coromon to supplement survey data with technical engineering data that can be better adaptedto costing out !he new techniques and procedures that Hrms may adopt.
The "representative Hrm" approach, although dictated by the large number offirms in an industry, has its own problems, especially when those Hrms are substantially heterogeneous among themselves. ln following this procedure, forexample, the EPA runs into the problem of whether costs of the real plants in theindustry, each of which is to sorne degree unique, can be accurately represented
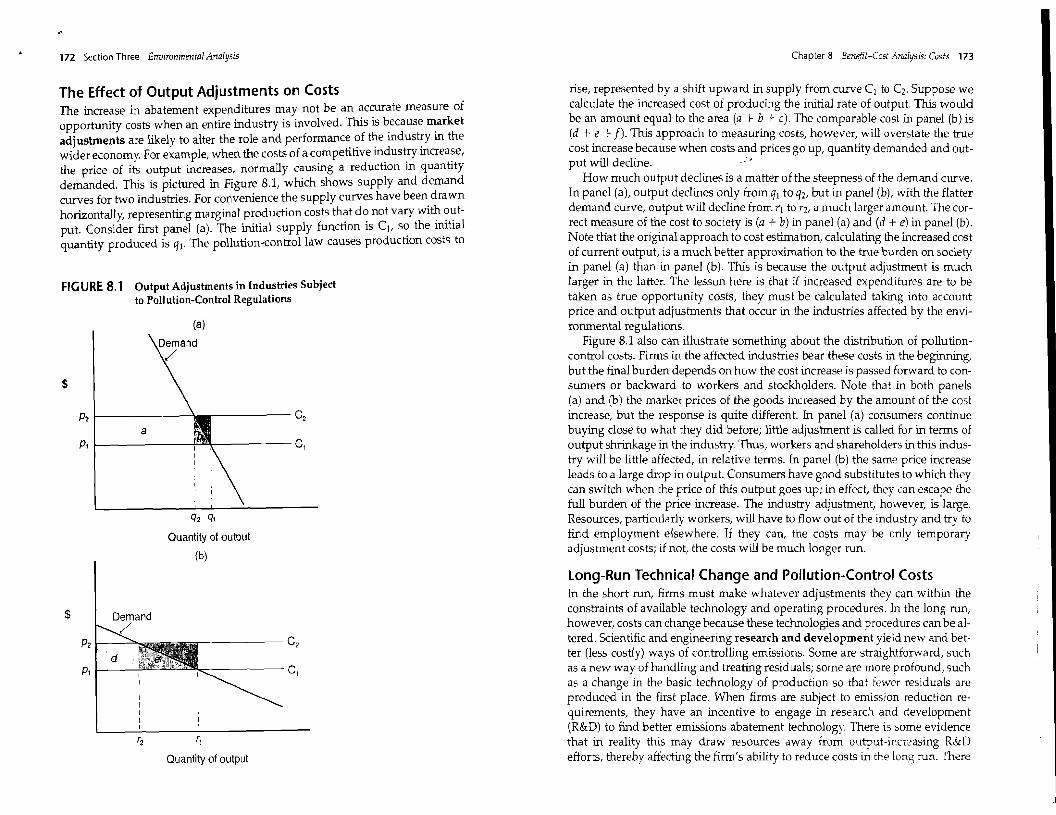
172 Section Three EnviTOnmental Analysis Chapter 8 Benefit-Cost Analysis: Costs 173
(a)
FIGURE 8.1 Oulpul Adjustmenls in Industries Subjectto Pol1ulion-Conlroi Regulations
The Effect of Output Adjustments on CostsThe increase in abatement expenditures may not be an accurate rneasure ofopportunity costs when an entire industry is involved. This is because markeladjustments are likely to alter the role and performance of the industry in thewider econorny. For example, when the costs of a competitive industry increase,the price of its output increases, normally causing a reduction in quantitydernanded. This is pictured in Figure 8.1, which shows supply and dernandcurves for two industries. For convenience the supply curves have been dra wnhorizontally, representing marginal production costs that do not vary with output. Consider first panel (a). The initial supply function is Cl, so the initialquantity produced is ql' The pollution-controllaw causes production costs to
rise, represented by a shift upward in supply from curve Cl to C2. Suppose wecalculate the increased cost of producing the initial rate of output. This wouldbe an amount equal to the area (a + b + e). The comparable cost in panel (b) is(d + e + f). This approach to rneasllring costs, however, will overstate the truecost increase because when costs and prices go up, quantity dernanded and out-put will decline. "
How much output declines is a rnatter of the steepness of the dernand curve.In panel (a), output declines only from ql to q2, but in panel (b), with the flatterdemand curve, output will decline froro TI to T2, a much larger amount. The correct measure of the cost to society is (a + b) in panel (a) and (d + e) in panel (b).Note tliat the original approach to cost estimation, calculating the increased costof current output, is a rnuch better approximation to lhe tIlle burden on societyin panel (a) than in panel (b). This is because the output adjustment is muchlarger in the latter. The lesson here is that if increased expenditures are to betaken as tme opportunity costs, they must be calculated taking mto accountprice and output adjustments that occur in the industries affected by the environmental regulations.
Figure 8.1 also can illllstrate something about the distribution of pollutioncontrol costs. Firms in the affected industries bear these costs m the beginning,but the final burden depends on how the cost increase is passed forward to consumers or backward to workers and stockholders. Note that m both panels(a) and (b) the market prices of the goods increased by lhe amount of the costincrease, but the response is quite differenl. In panel (a) consumers contmuebuying close to what they did before; little adjustment is called for in terms ofoutput shrinkage in the industry. Thus, workers and shareholders in this industry will be little affected, in relative terms. [n panel (b) the same price increaseleads to a large drop in ou tpul. Consumers have good substitutes to which theycan switch when the price of this output goes up; in effect, they can escape thefull burden of the price increase. The industry adjustment, however, is large.Resources, particularly workers, will have to flow out of the industry and try lofind employrnent elsewhere. If they can, the costs may be only temporaryadjustment costs; if not, the costs will be much longer runo
C2
q2 q,
Quantity ef output
(b)
P, I !1!!l!!I, C,
,P? I 4
a
$
Quantity 01 output'2 "
Long-Run Technical Change and Pollution-Control CostsIn the short run, firms must make whatever adjustrnents lhey can within theconstraints of available technology and operating procedures. In the long run,however, costs can change because these technologies and procedures can be altered. Scientific and engineering research and development yield new and better (less cost1y) ways of controlling emissions. Sorne are straightforward, sllchas a new way of handling and treating residuals; sorne are more profound, suchas a change in the basic technology of production so lhat fewer residuals areproduced in the first place. When firms are subject to emission reduction requirements, they have an incentive to engage in research and cteveloprnent(R&D) to find better emissions abaternent technology. There is sorne evidencethat in reality this may draw resources away frorn output-inneasing R&Defforts, thereby affecting the firm's ability to reduce costs in the long runo There
C2
I~ C,
Demand/
P, 1-'-/----'
P2 1 .........
$

Environmentallndustry-Revenues and Employment,by Industry Segment: 1980 to 2002
[59.0 represents $59,000,000,000. Covers approximately 59,000 prívate and publiccompanies engaged in environmental activities.]
174 Section Three Ellviro11l11el1tal Al1alysis
The U.S. environmental industry had totalrevenues of over $190 billion in 1998 andemployed more than 1.3 million people.These are very substantially higher thanthe comparable numbers of 1980, as thedata below indicate. More than half of theindustry actually comprises services, while
the rest are technology and equipmentbased. The early growth of the industrywas based on c1eaning up the sins of thepast, or controlling emissions from outdated facilities. Growth in the future willdepend more on developments in pollution prevention.
Chapter 8 Bel1eJit-Cost ¡\"tI/y.-i'· (",/" lIS
is also evidence, however, that environmental regulations have led to uHantil'ipated, marketable products or processes stemming from their research. Slllnl'
studies have even shown that after investing in pollution-control R&D, SI )Ilh'
finns have reduced their long-run production costs. In cases such as this, t11l'short-run cost increases arising from pollution-control regulations are not accurate estirnates of the long-run opp,o¡tunity costs of these regulations.
Critical to the success of any effort to innovate in pollution-control technology is the economic health of the envirotech índustry. This is the industryconsisting of firms producing goods and services that are used by other firms toreduce their emissions and envíronmental impacts. It also contains firms thatengage. in environmental dean-up, such as the dean-up of past hazardouswaste dump sites. A healthy envirotech industry is one lhat produces a brisksupply of new pollution-control technology and practices. The growth of thisindustry over time will have a lot to do with how fast marginal abatement costscome down in the future (see Exhibit 8.1).
Revenue (bil. dol.) Employment (1,000)
Industry Segment 1980 1990 2002 1980 1990 2002
Industry total 59.0 152.3 221.3 462.5 1,223.8 1,510.0
Analytical services1 0.4 1.5 1.3 6.0 18.0 15.0
Wastewater treatment works 2 10.9 19.8 30.2 53.9 88.8 123.7
Solid waste management3 11.2 26.1 42.7 83.2 205.5 284.4
Hazardous waste management4 0.6 6.3 4.7 6.8 53.9 38.6
Remediation/industrial services 2.4 11.1 11.1 69 133.3 105.9
Consulting and engineering 1.7 12.5 18.7 20.5 147.1 193.7
Water equipment and chemicals 6.9 13.5 20.8 62.4 92.7 135.3
Instrument manufacturing 0.2 2.0 3.9 2.5 18.0 30.9
Air pollution control equipment5 3.3 13.1 18.6 28.3 96.4 126.0
Waste management equipment6 3.5 8.7 9.9 41.9 69.6 74.1
Process and prevention technology 0.1 0.4 1.4 2.1 9.3 30.9
Water utilities 7 11.9 19.8 32.3 76.9 98.5 139.1
Resource recovery8 4.4 13.1 14.1 48.7 142.9 110.1
Clean energy systems and power9 1.5 4.3 11.5 22.4 49.9 102.3
1 Coyers enYironmentallaboratory testing and 6 Includes yehicles, containers, liners,services. processing, and remediation equipment.
2 Mostly reyenues collected by munkipal 7 Revenues generated Irom the sale 01 water.entities. aReyenues generated Irom the sale 013 Coyers such activities as collection, recoyered metals, paper, plastic, and so an.transportation, transler stations, disposal, 9 Includes solar, wind, geothermal, andlandlill awnership, and management conservation devices.lor solid waste.4 Transportation and disposal 01 hazardous,
50urce: Environmental Business International,Ine., San Diego, CA, Environmental Business
medical, and nuclear waste. ¡aurnaJ, monthly (copyright) (as published ins Includes stationary and mobile Slalistical Abstract 01 the United States: 7999,sources. p. 251, and 2003, p. 239).
Costs at the National Level
We finally come to the most aggregative level for which cost studies are normally pursued, the level of the national econorny. The usual question of interestis the extent of the macroeconomic cost burden of the environmental regulationsa country imposes, or might be planning to impose, in a given period of time.Sometimes interest centers on the totality of the regulations put in place. Sometimes the focus is on specific regulations that will nevertheless have a broadimpact on a national economy, such as a prdgram of COz emissions reduction.
There are basically two ways of approaching this question: bottom up andtop down. The bottom-up approach looks at expenditures made throughout theeconomy for pollution-control purposes. Firms in the economy are subject to anumber of pollution-control regulations. In response they install and operate awide variety of technological means to reduce emissions. These expendituresdetract from other outputs (assuming full employment) because of the inputdiversion. Economy-wide surveys can be done to estimate the size of thesepollution-control expenditures. Sorne results are shown in Table 8.3, whichpresents pollution abatement costs (PAe) as a proportion of CDP for a numberof developed economies at the end of the 19905. These ranged from a low of0.3 percent in Mexico to a high of 1.3 percent in Austria.
In the lóñg run, numbers such as these may not give an entirely accurate picture of how pollution controls are affecting the national economy. Expendituresfor plant, equipment, labor, and other inputs for reducing emissions can affectother economic sectors not directly covered by environmental regulations, andmacroeconomic interactions of this type need to be accounted for to get thecomplete picture. An industry subject to environmental controls, and trying tolower its emissions, puts increasing demand on the pollution-control industry,which expands output and puts increasing demands on other sectors, forexample, the construction sector, which respond by increasing output.
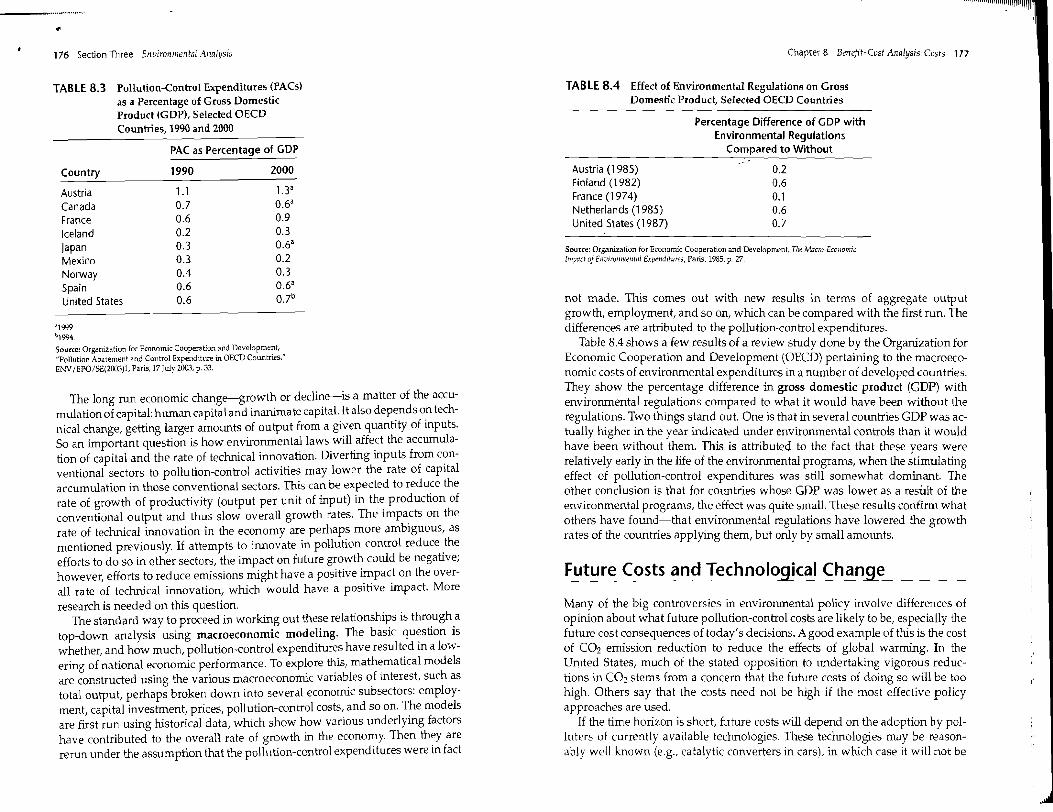
..· .. ,.."""'" ""''''''1'''1I~1I1l1111ll1l1'
176 Section Three EnvirOlll1lental Allalysis Chapter 8 Benejit-Cost Analysis: Cast, 1n
TABlE 8.3 Pollution-Control Expenditures (rACs)as a Percentage of Gross DomesticProduct (GDP), Selected üECDCountries, 1990 and 2000
rAC as Percentage of GDP
TABlE 8.4 Effect of Environmental Regulations on GrossDomestic Product, Selected üECD Countries
Percentage Difference of GDP withEnvironmental Regulations
Compared to Without
Source: Organization foc Ecol1omic Cooperation and Developrnent Tlle Macro·Ec071omic[l1Ipcrd 0fEIl1.JirolTmelllt11 Expt'11ditures, Paris, 1985, p_ 27.
Future Costs and Technological Change
Many of the big controversies in environmental policy involve differences ofopinion about what future pollution-control costs are likely to be, especially thefuture cost consequences of today's decisions. Agood example of this is lhe costof CO2 emission reduction to reduce the effects of global warming. In theUnited States, much of the stated opposition to undertaking vigorous reductions in CO2 stems froro a concern that the future costs of doing so will be toohigh. Others say that the costs need not be high if the most effective policyapproaches are used.
lf the time horizon is short, future costs will depend on the adoption by polluters of currently available technologies. These technologies may be reasonably wdl known (e.g., catalytic converters in cars), in which case it will not be
not made. This comes out with new results in terros of aggregate outputgrowth, employment, and so on, which can be compared with the first runo Thedifferences are attributed to the pollution-control expenditures.
Table 8,4 shows a few results of a review study done by the Organization forEconomic Cooperation and Development (OECO) pertaining to the macroeconomic costs of environmental expenditures in a number of developed countries.They show the percentage difference in. gross domestic produd (GDP) withenvironmental regulations compared to what it would have been without theregulations. Two things stand out. One is that in several countries GDP was actually higher in the year indicated under environmental controls than it wouldhave been without them. This is attributed to the fact that these years wererelatively early in the life of the environmental programs, when the stimulatingeffect of pollution-control expenditures was still somewhat dominant. Theother conclusion is that for countries whose GDP was lower as a reswt of theenvironmental programs, the effect was quite small. These results confirm whatothers have found-that environmental regulations have lowered the growthrates of the countries applying them, but only by small amounts.
0.20.60.10.60.7
Austria (1 985)Finland (1982)France (1974)Netherlands (1985)United States (1987)
Country 1990 2000
Austria 1.1 1.3'
Canada 0.7 0.6'
France 0.6 0.9
Iceland 0.2 0.3
japan 0.3 0.6'
Mexico 0.3 0.2
Norway 004 0.3
Spain 0.6 0.6'
United Slates 0.6 0.7b
The long run economic change-growth or decline-is a matter of the accumulation of capital: human capital and inanimate capitaL lt a150 depends on technical change, getting larger amounts of output from a given quantity of inputs.So an important question is how environmentallaws will affect the accumulation of capital and the rate of technical innovation. Diverting inputs from conventional sectors to pollution-control activities may lower the rate of capitalaccumulation in those conventional sectors. This can be expected to reduce therate of growth of productivity (output per unit of input) in the production ofconventional output and thus slow overall growth rates. The impacts on therate of technical innovation in the economy are perhaps more ambiguous, asmentioned previously. If attempts to innovate in pollution control reduce theefforts to do so in other sectors, the impact on future growth could be negative;however, efforts to reduce emissions might have a positive impact on the overall rate of technical innovation, which would have a positive impac!. Moreresearch is needed on this question.
The standard way to proceed in working out these relationships is through atop-down analysis using macroeconomic modeling. The basic question iswhether, and how much, pollution-control expenditures have resulted in a lowering of national economic performance. To explore this, mathematical modelsare constructed using the various macroeconomic variables of interest, such astotal output, perhaps broken down into several economic subsectors: employment, capital investrnent, prices, pollution-control costs, and so on. The modelsare first run using historical data, which show how various underlying factorshave contributed to the overall rate of growth in the economy. Then they arererun under the assumption that the pollution-control expenditures were in fact
'1999bl994.
Source: Organization for Economic Cooperation and Development,"Pollution Abatement and Control Expenditure in OEeD CotIDtries,"ENV /EPO/SE(2003)1. P,ris. 17 JuIy 2003. p. 33,

178 'i~( 11011 11"". /'/II I /1'lI/ll/lmtlll Á/mlys/s
11111 "MI! Itl('lilim.lte what these new pollution-control costs will be. Much of thefldl'lh'" dll'lwssioll in this chapter is based on this perspective.
11111 whcn the relevant time horizon is longer, say 10 years or more (as it~II rl'ly is wi th global warrning), it is no longer easy to know what technologícall:hanges will occur, when they will be available for widespread adoption, andwhat impact they will have on pollution-control costs. Much discussion andresearch have been directed at the idea of a large-scale changeover to a hydrogenfuel system in cars and trucks, for example. But it is not easy to see when thatmight arrive and what its impacts may be, or whether other technologies maybe more appropriate and feasible. In the long run, in other words, estirnatingfuture costs is likely to be very difficult.
One of the important aspeets of this is how research, development, andadoption of new pollution-control technologies respond to environmental policies and regulations. This is a topie we will encounter a number of times in thenext section dealing with the different types of pollution-control policies.
SummaryIn this chapter we reviewed sorne of the ways that costs are estimated inbenefit-cost studies. We began with a discussion of the fundamental concept ofopportunity costs, differentiating this from the notion of cost as expenditure.We then looked at cost estimation as it applied to different levels of economicactivity. The first was a cost analysis of a single facility, as represented by theestimated costs of a wastewater treatrnent facility. We then considered the costs ofan environrnental regulation undertaken by a single community, distinguishingbetween costs to the cornrnunity and opportunity costs to the whole society.
We then shifted focus to cost estimation for an entire industry, giving specialattention to the difference between short-run and long-run costs and the problem of achieving mínimum costs. We finally expanded our perspective to thenational economy as a whole, where cost means the loss in value of marketedoutput resulting from environrnental regulations.
Questions for Further Discussion1. Over the last two years, ernission abatement costs in industry X have been
about $1 million per year. A new regulation willlead to abatement costs of$1.8 million per year. Does this mean that the regulation will cause increasedabatement costs of $800,000 per year? Explain.
2. In order to protect the quality of its nearby water resources, a communityplaces a restriction on any housing development closer than 100 feet to a wetland. How might you estímate the social costs of this regulation?
3. "The costs of achieving emission reductions in the future will depend ímportantly on the types of policies used to reduce emissions today." Explain.
'0
Chapter 8 Bt!nt!jil-Cu'</ Al/l/Iv."" ("'N" 179
4. A tax on gasoline is proposed in order to raise money for pollution ,'( Intml ,ll'.
tivity of several public agencies. The tax will be 101t per gallon, <1l1d In~t y"""10.3 million gallons of gasoline were used by motorists (this is stridly .111
illustrative number). Does this mean that we can anticipate $1,030,lJO() inrevenues from this tax? Explain.
5. Most industries are composee of firms which, though perhaps producingroughly the same thing, are very different; sorne are large and sorne smal1;sorne are profitable and others not; sorne are located in one part of the country and sorne in others; sorne perhaps have undertaken a certain amount ofvoluntary emissions reductions and sorne have not; and so on. How does tmscomplicate the job of estimating the total social costs of pollution controlregulations?
For additional readings and Web sites pertaining to the material in this chaptersee www.mhhe.com/fieldSe.