Embed Size (px)
Citation preview

FEBRUARY 17, 2020
(over please)
The Publisher’s sale Of This rePrinT DOes nOT COnsTiTuTe Or imPly any enDOrsemenT Or sPOnsOrshiP Of any PrODuCT, serviCe, COmPany Or OrganizaTiOn.Custom Reprints 800.843.0008 www.djreprints.com DO NOT EDIT OR ALTER REPRINT/REPRODUCTIONS NOT PERMITTED 57115
TOP FUNDFAMILIES Responding to the rise of passive investing,
stellar money managers are finding waysto stand out from the crowd

By SARAH MAX
Good years are great. Investors have reveled in more than a decade’s worth of markets marching higher in lockstep. Last year, the S&P 500 index returned 31%, international markets climbed more than 20%, corporate bonds soared 14%, and even Treasuries gained nearly 8%. That was certainly good news for index inves-tors, who went along for the ride. But it’s a high bar for active managers, most of whom still struggle to beat their bench-marks.
It’s hard to add value in a year when vir-tually every asset class offers outsize gains. But the top performers on this year’s Fund Families Ranking—No. 1 MFS Investment Management, followed by Virtus Invest-ment Partners, DWS Group, Columbia Threadneedle Investments, and Principal Global Investors—managed to do that for most of their investors. Their leaders also point to decisions made in late 2018 that set them up to outperform in 2019, after the S&P 500 had plunged 20%.
What does it mean to be an active man-ager in this environment? “Active man-agement is relevant and will stay relevant, but you’ve got to invest in that engine to stay really good at it,” says Mike Roberge, CEO of MFS Investment Management, which has 300 investment professionals in nine locations around the world and is hiring in “pretty much every region.” The firm—whose funds saw net inflows last year when the industry had outflows—also has integrated environmental, social, and corporate governance, or ESG, research into all of its strategies, and hired in-house data scientists to help analysts seek and share research.
In fact, all of the firms that ranked high this year do what indexers can’t—empha-size and optimize the human element of investing.
Like MFS, No. 3 DWS, and No. 4 Columbia Threadneedle are building global research platforms in which experts
across sectors, regions, and asset classes share viewpoints gleaned from around the world. At the other end of the spectrum, No. 2 Virtus and No. 5 Principal Global Investors are all about specificity—multi-manager boutiques in which autonomous teams cultivate their own cultures and investment strategies.
“With the competitive environment being created from the passive world, the active managers that are going to be successful on a long-term basis are those that are truly different and can truly stand out in a crowd,” says Virtus CEO George Aylward, adding that the multi-boutique approach offers investors the best of both worlds: specialization under the banner of a single firm that can do many things well.
The investment landscape has changed dramatically since Barron’s began ranking fund families more than two decades ago. Back then, “passive” referred to a person-ality trait, and “platform” was not a staple of the investment lexicon. Active managers have since shifted their approaches to stay relevant in an industry that risks being swallowed up by index funds—and the top firms in this year’s ranking speak to the many faces of active management.
The primary ranking focuses on one-year relative performance, admittedly, just
a snapshot in time. Still, it offers a window on how diversified firms perform across a wide range of actively managed funds. Passive index funds are excluded from our listing.
To qualify for this ranking, firms must offer at least three active mutual funds or actively run exchange-traded funds in Lipper’s general U.S. stock category; one in world equity; and one mixed-asset—such as a balanced or allocation fund. They also need to offer at least two taxable bond funds and one national tax-exempt bond fund. All funds must have a track record of at least one year. The ranking excludes index funds, but does include actively managed ETFs, and “smart-beta” ETFs, which are run passively but are built on ac-tive investment strategies. The list reflects each firm’s active management ability.
All told, just 55 asset managers out of the 843 in Lipper’s database met our criteria for 2019. While many notable firms generally don’t qualify for the ranking, the list varies from year to year, as firms merge, get acquired, or add or drop funds. Absent from this year’s ranking is Charles Schwab Investment Management, which liquidated one of its actively run taxable bond funds. Allianz Global Investors and PNC Funds are out because they no longer
The following has been excerpted
Barron’s Top Fund Families Our annual ranking of how the industry’s actively managed funds have performed.
Cover Story
© 2020 Dow Jones & Co. Inc. Licensed Use: Web post, email and social mediaLicensed To: Virtus Investment PartnersExpiration Date: 02/20/21
Current Rank
2018 Rank
Family Total Assets (mil)*
Weighted Score
U.S. Equity
World Equity
Mixed Equity
Taxable Bond
Tax-Exempt Bond
1 12 MFS Investment Management $309,040 77.73 2 17 2 6 13
2 22 Virtus Investment Partners 42,305 68.77 5 39 1 30 30
3 48 DWS Group 31,108 68.71 21 18 4 2 28
4 44 Columbia Threadneedle Investments 151,006 66.48 12 3 11 17 20
5 39 Principal Global Investors 153,819 65.27 3 10 16 42 4
6 46 Nuveen 219,890 65.20 20 4 10 19 6
7 31 State Street Bank & Trust 22,407 64.63 7 11 6 28 45
8 41 Putnam Investment Management 79,380 63.81 4 23 32 23 12
9 27 Fidelity Management & Research 1,553,830 62.38 25 12 8 14 26
10 8 Vanguard Group 1,619,821 60.93 23 33 14 4 25
The Best Fund Families for 2019This is the third year we’ve ranked the fund families purely on the performance of their actively managed funds.
FUND RANKING
*Total assets reflect the funds included in the survey NR=Not ranked Source: Refinitiv Lipper
offer national municipal bond funds. For-esters Investment Management funds are now listed under Delaware Management, and OppenheimerFunds is now part of Invesco. Other notable, though consistent, absences are Janus Henderson and Dodge & Cox. Two additional firms moved onto the list for 2019—Morgan Stanley Invest-ment Management and AssetMark, a 2013 spinoff of Genworth.
Because the Best Fund Families results are asset-weighted, firms’ largest funds have the biggest impact on their rankings.
Indeed, No. 1–rated MFS owes much to its $53 billion MFS Value (ticker: MEIAX) fund. Its 30% return for retail shares last year bested 86% of its Lipper category peers and added three percentage points of excess return relative to its benchmark, the Russell 1000 Value Index. The 80-stock portfolio was flush with double-digit gainers, including a 43% rise by its largest holding, JPMorgan Chase (JPM). Last year wasn’t a fluke: The fund has averaged more than 10% annual advances since its 1996 inception.
“Companies that have more durable, less volatile earnings and cash flow are the types of companies we tend to be attracted to—and those were the companies that the market rewarded in 2019,” says Ted Maloney, chief investment officer at the Boston-based company.
The performance of the $28 billion MFS Growth (MFEGX) also helped. The fund, which has returned an average 10% annu-ally since its 1993 inception, was up 37.6% last year, thanks in part to longstanding stakes in Microsoft (MSFT), which was up 55%, Visa (V), and Mastercard (MA).
It was a similar story in fixed income. The 21-year-old, $7 billion MFS Total Return Bond (MRBFX) was also a key player in its parent’s overall showing. MFS has been building out its global fixed-income team; its roster of 100 analysts, manag-ers, and traders has grown 40% since 2013.
MFS is a textbook long-term investor; it regularly ranks in the top five firms for five- and 10-year returns.
The hiring philosophy at MFS is not unlike its investment philosophy: The firm takes its time finding new talent, works hard to keep top performers, and bases incentive compensation on three-, five-, and even 10-year-plus performance. “The most important thing you can do before you bring someone into the organization is to ensure that they sync up with the cul-
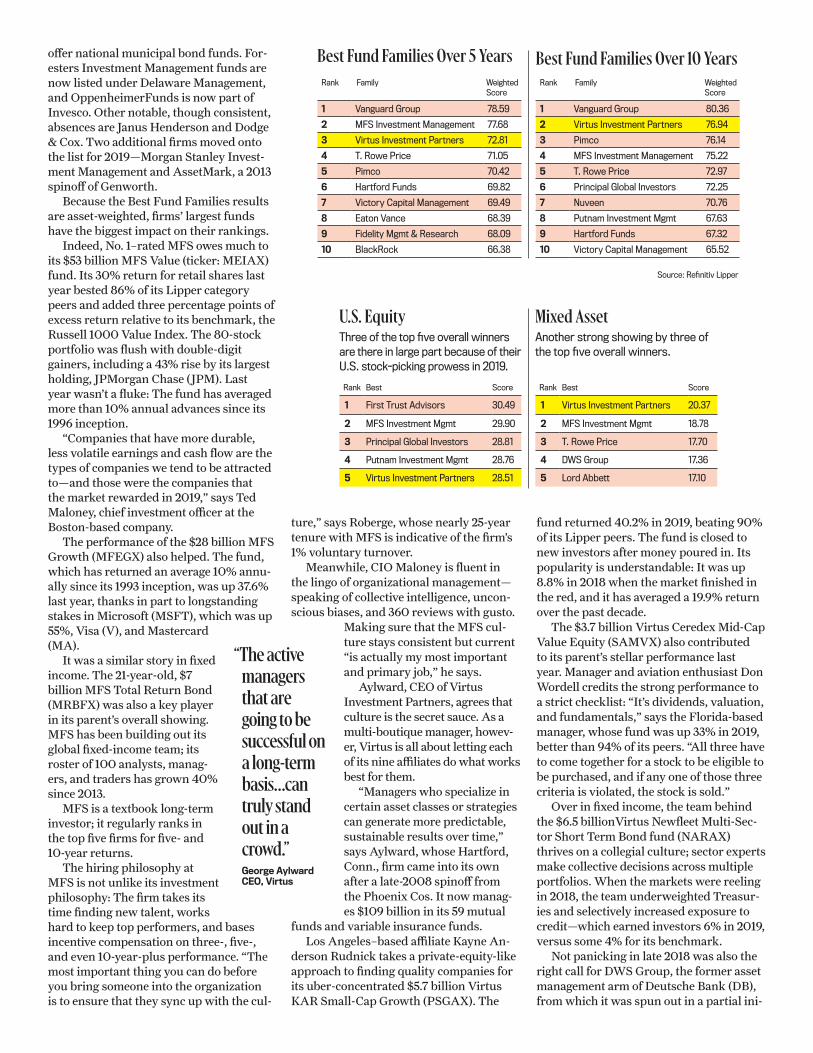
Rank Family Weighted Score
1 Vanguard Group 78.59
2 MFS Investment Management 77.68
3 Virtus Investment Partners 72.81
4 T. Rowe Price 71.05
5 Pimco 70.42
6 Hartford Funds 69.82
7 Victory Capital Management 69.49
8 Eaton Vance 68.39
9 Fidelity Mgmt & Research 68.09
10 BlackRock 66.38
Rank Family Weighted Score
1 Vanguard Group 80.36
2 Virtus Investment Partners 76.94
3 Pimco 76.14
4 MFS Investment Management 75.22
5 T. Rowe Price 72.97
6 Principal Global Investors 72.25
7 Nuveen 70.76
8 Putnam Investment Mgmt 67.63
9 Hartford Funds 67.32
10 Victory Capital Management 65.52
Best Fund Families Over 5 Years Best Fund Families Over 10 Years
Source: Refinitiv Lipper
U.S. EquityThree of the top five overall winners are there in large part because of their U.S. stock-picking prowess in 2019.
Mixed AssetAnother strong showing by three of the top five overall winners.
Rank Best Score
1 First Trust Advisors 30.49
2 MFS Investment Mgmt 29.90
3 Principal Global Investors 28.81
4 Putnam Investment Mgmt 28.76
5 Virtus Investment Partners 28.51
Rank Best Score
1 Virtus Investment Partners 20.37
2 MFS Investment Mgmt 18.78
3 T. Rowe Price 17.70
4 DWS Group 17.36
5 Lord Abbett 17.10
“The active managers that are going to be successful ona long-term basis…can truly stand out in a crowd.” George Aylward CEO, Virtus
ture,” says Roberge, whose nearly 25-year tenure with MFS is indicative of the firm’s 1% voluntary turnover.
Meanwhile, CIO Maloney is fluent in the lingo of organizational management—speaking of collective intelligence, uncon-scious biases, and 360 reviews with gusto.
Making sure that the MFS cul-ture stays consistent but current “is actually my most important and primary job,” he says.
Aylward, CEO of Virtus Investment Partners, agrees that culture is the secret sauce. As a multi-boutique manager, howev-er, Virtus is all about letting each of its nine affiliates do what works best for them.
“Managers who specialize in certain asset classes or strategies can generate more predictable, sustainable results over time,” says Aylward, whose Hartford, Conn., firm came into its own after a late-2008 spinoff from the Phoenix Cos. It now manag-es $109 billion in its 59 mutual
funds and variable insurance funds.Los Angeles–based affiliate Kayne An-
derson Rudnick takes a private-equity-like approach to finding quality companies for its uber-concentrated $5.7 billion Virtus KAR Small-Cap Growth (PSGAX). The
fund returned 40.2% in 2019, beating 90% of its Lipper peers. The fund is closed to new investors after money poured in. Its popularity is understandable: It was up 8.8% in 2018 when the market finished in the red, and it has averaged a 19.9% return over the past decade.
The $3.7 billion Virtus Ceredex Mid-Cap Value Equity (SAMVX) also contributed to its parent’s stellar performance last year. Manager and aviation enthusiast Don Wordell credits the strong performance to a strict checklist: “It’s dividends, valuation, and fundamentals,” says the Florida-based manager, whose fund was up 33% in 2019, better than 94% of its peers. “All three have to come together for a stock to be eligible to be purchased, and if any one of those three criteria is violated, the stock is sold.”
Over in fixed income, the team behind the $6.5 billionVirtus Newfleet Multi-Sec-tor Short Term Bond fund (NARAX) thrives on a collegial culture; sector experts make collective decisions across multiple portfolios. When the markets were reeling in 2018, the team underweighted Treasur-ies and selectively increased exposure to credit—which earned investors 6% in 2019, versus some 4% for its benchmark.
Not panicking in late 2018 was also the right call for DWS Group, the former asset management arm of Deutsche Bank (DB), from which it was spun out in a partial ini-

How We Rank the Fund Families
All mutual and exchange-traded funds are required to report their returns (to regulators as well as in advertising and marketing material) after fees are deducted, to better reflect what investors would actually experience. But our aim is to measure manager skill, independent of expenses beyond annual management fees. That’s why we calculate returns before any 12b-1 fees are deducted. Similarly, fund loads, or sales charges, aren’t included in our calculation of returns.
Each fund’s performance is measured against all of the other funds in its Lipper category, with a percentile ranking of 100 being the highest and one the lowest. This result is then weighted by asset size, relative to the fund family’s other assets in its general classification. If a family’s biggest funds do well, that boosts its overall rank-ing; poor performance in its biggest funds hurts a firm’s ranking.
To be included in the ranking, a firm must have at least three funds in the general equity category, one world equity, one mixed equity (such as a balanced or target-date fund), two taxable bond funds, and one national tax-exempt bond fund.
We have historically excluded single-sector and country equity funds, but those are now factored into the rankings as general equity. We exclude all passive index funds, including pure index, enhanced index, and index-based, but include actively managed ETFs and so-called smart-beta ETFs, which are passively managed but created from active strategies.
Finally, the score is multiplied by the weighting of its general classification, as determined by the entire Lipper universe of funds. The category weightings for the one-year results in 2019 were general equity, 35.4%; mixed asset, 21.1%; world equity, 17%; taxable bond, 21.8%; and tax-exempt bond, 4.6%.
The category weightings for the five-year results were general equity, 36.9%; mixed asset, 19.7%; world equity, 17.2%; taxable bond, 21.7%; and tax-exempt bond, 4.6%. For the 10-year list, they were general equity, 37.6%; mixed asset, 20.1%; world equity, 17.5; taxable bond, 20%; and tax-exempt bond, 4.7%.
The scoring: Say a fund in the general U.S. equity category has $500 million in as-sets, accounting for half of the firm’s assets in that category, and its performance lands it in the 75th percentile for the category. The first calculation would be 75 times 0.5, which comes to 37.5. That score is then multiplied by 35.4%, general equity’s overall weighting in Lipper’s universe. So it would be 37.5 times 0.354, which equals 13.28. Similar calculations are done for each fund in our study. Then the numbers are added for each category and overall. The shop with the highest total score wins. The same process is repeated to determine the five- and 10-year rankings.
tial public offering in 2018. When markets broke through the cloud of pessimism, “even superboring assets like German Bunds came back,” says CIO Stefan Kreuz-kamp from his office in Frankfurt, one of six global hubs for the firm’s 900 invest-ment professionals.
This massive research engine is just one distinguishing factor. “We’re one of the few firms in the world with traditional active, passive, and alternative product suites,” says Kreuzkamp, whose company manages $834 billion globally, with $217 billion in U.S. assets.
One of the largest members of its U.S. lineup of 42 funds, $4 billion DWS Core Equity (SUWAX), straddles those worlds with a quantitative model that sorts the Russell 1000 universe into 35 custom industry groups and ranks them based on a handful of factors. Two other funds that helped put the firm on the leaderboard take a more conventional approach; DWS Global Income Builder (KTRAX) and DWS High Income (KHYAX) returned 19.9% and 14.7%, respectively.
Still, DWS isn’t assuming that what works today will work in the future. “I don’t know of anyone who has developed an algorithm to replace active manage-ment’s decisions,” Kreuzkamp says of the firm’s recent decision to take a 25% stake in Arabesque, a company that uses artificial intelligence and other technologies for stock-picking among sustainable com-panies. “But the portfolio manager of the future should understand technology.”
After Ameriprise Financial (AMP) merged its Columbia Management and Threadneedle divisions in 2015, global CIO Colin Moore wanted to improve how experts on regions, sectors, and asset class-es share ideas.
“It doesn’t make sense to have seven different people making forecasts on energy prices,” he says of the inspiration behind regular thematic and fundamen-tal research meetings covering topics as varied as monetary policy and how to value Amazon.com. “If you can get people collaborating and debating information in a healthy way, there’s an information coef-ficient where one plus one equals 2.1.”
He credits Columbia Threadneedle’s ro-bust performance in 2019 to this collective wisdom. “We had a very strong view that the Federal Reserve had made a mistake by increasing interest rates [in the fourth quarter of 2018] and that it would have to be unwound,” says Moore. The firm has 450 investment professionals in 17 coun-tries, tending to $494 billion in assets.
That view helped $20 billion Colum-bia Dividend Income (LBSAX) log a 28% return in 2019, better than 80% of its
Lipper peers. It also gave Guy Pope and his co-managers of $10 billion Columbia Contrarian Core (LCCAX) even more conviction in buying stocks sitting under a temporary cloud of pessimism. They ended 2019 up more than 32%.
It’s easy to assume that the as-set-management arm of a 140-year-old financial-services conglomerate based in Des Moines, Iowa, would be pretty plain vanilla. In reality, Principal Global Investors was a relatively early adopter of the multi-boutique approach, which it began using 20 years ago. Its $459 billion in assets are run by 14 specialized teams, working on different asset classes and in various global cities.
“We’ve created a culture that allows talented managers to really focus on their craftsmanship, but also leverage a bigger organization to get those capabilities into the marketplace,” says Pat Halter, CEO and president of Principal Global Investors, a wholly owned subsidiary of Principal Financial Group (PFG).
One such boutique is Edge Asset Man-agement in Seattle. The firm was founded in 1939 and acquired by Principal in 2006. In 2019, the tight-knit team ushered the $8.6 billion Principal Equity Income (PQI-AX) to benchmark-beating 28.7% returns.
Aligned Investors, another firm, was also instrumental to Principal’s overall success last year. Aligned focuses on own-er-operated companies whose interests are indeed aligned with those of shareholders. Last year, its $19.2 billion Principal Mid-Cap (PEMGX) fund returned 42.8%, better than 99% of its Lipper peers. The fund is closed to new investors, but its large-cap sibling, the $5.5 billion Principal Blue Chip (PBLAX), hasn’t reached full capacity. In 2019, it returned nearly 39%.
“The alpha engine was truly alive and well for us in 2019,” says Halter, who, on a cold Friday in January, was getting ready for a weekend that suggests similar verve—riding a fat-tire mountain bike through the snow-packed trails of Iowa. n
To learn more about Virtus Investment Partners and our comprehensive product suite,
please contact us at 800-243-4361 or visit Virtus.com.
This reprint must be accompanied by a current fact sheet for the Virtus KAR Small-Cap GrowthFund, the Virtus Ceredex Mid-Cap Value Equity Fund, and the Virtus Newfleet Multi-Sector Short Term Bond Fund.
Performance data quoted represents past results. Past performance is no guarantee of future results and current performance may be higher or lower than the performance shown. Investment return and principal value will fluctuate, so your shares, when redeemed, may be worth more or less than their original cost.
Investing involves risk, including loss of your investment. Applicable sales charges, if included, would reduce performance shown.
Please consider a Fund’s investment objectives, risks, charges, and expenses carefully before investing. For this and other information about any Virtus Fund, contact your financial representative, call 800-243-4361, or visit virtus.com for a prospectus or summary prospectus. Read it carefully before investing.
Barron's Best Mutual Fund Families Annual Rankings: In the overall fund family rankings for 2019 (published February 17, 2020), Virtus Investment Partners ranked 2 out of 55 on a 1-year basis, 3 out of 52 on a 5-year basis, and 2 out of 45 on a 10-year basis. Virtus ranked 5th within the U.S. equity category and 1st in the Mixed Asset category. Source: Refinitiv Lipper.
Barron’s is a registered trademark of Dow Jones & Company; all rights reserved.
Virtus Mutual Funds distributed by VP Distributors, LLC, member FINRA and subsidiary of Virtus Investment Partners, Inc.

5752 2-20