Embed Size (px)
Citation preview

SciENTiA M a rin a 71(2) June 2007, 223-238, Barcelona (Spain)
ISSN: 0214-8358
B aroclin ie and w ind-induced c ircu la tion in T arragona h arb our (n orth eastern Spain)
MARC MESTRES \ JOAN PAU SIERRA2 and AGUSTÍN SÁNCHEZ-ARCILLA21 HAMA, Technical University of Valencia, Camino de Vera s/n, 46022 Valencia. Spain.
E-mail: [email protected] 2LIM-UPC, Technical University of Catalonia, Jordi Girona 1-3, Modul D l, 08034 Barcelona. Spain.
SUMMARY : The sustainability of harbour management from an environmental standpoint is a current concern for port authorities. It includes dealing with problems that may affect the quality of in-harbour waters. In semi-enclosed basins, the characteristics of the circulation pattern are one of the main factors influencing the water quality, since they determine the residence time of pollutants inside the basin and govern the interaction between inside waters and the cleaner outside waters. Although harbour hydrodynamics are affected by tire constant traffic of vessels and the physical constraints imposed by harbour structures, the water dynamics in ports are generally governed by three mechanisms: tidal forcing, wind surface stress, and baroclinie effects. This study presents the characterisation of winter circulation features in Tarragona harbour (northeast Spain), based on both field data and numerical simulations. Due to the microtidal nature of the Mediterranean Sea, three- dimensional water density distribution and local wind are expected to be the most relevant driving mechanisms. The results obtained suggest that, although wind effects may be important in determining tire water flow in and out of the harbour for small time-scales, in the long term the most important water exchange mechanism is related to the waterbody's baroclinie structure, with wind forcing playing only a second-order role.
Keywords', harbours, baroclinie circulation, wind stress, residence time, modelling, Mediterranean Sea, Spain.
RESUMEN: C ir c u l a c ió n b a r o c l ín ic a e in d u c id a p o r v ie n t o e n e l p u e r t o d e T a r r a g o n a (E s p a ñ a ) . - La gestión soste- nible de Ios puertos desde un punto de vista ambiental es un tema de interés actual y un objetivo para las autoridades portuarias . Este tipo de administración incluye el tratamiento de problemas que pueden afectar a la calidad de las aguas interiores del puerto. En cuerpos de agua semicerrados, uno de Ios factores que más influye en la calidad del agua son las características del patrón de circulación, puesto que gobiernan la interacción entre aguas interiores y aguas exteriores más limpias, y determinan el tiempo de residencia de contaminantes dentro del recinto. Si bien las corrientes dentro de Ios puertos se ven afectadas continuamente por el tráfico de buques y por las restricciones físicas impuestas por las propias estructuras portuarias, la hidrodinámica general está dominada por tres mecanismos distintos: mareas, tensión de viento, y efectos baroclíni- cos. Este estudio presenta la caracterización de la circulación invernal en el Puerto de Tarragona (España), basada en datos de campo y en simulaciones numéricas. Debido al carácter micromareal del Mediterráneo, se espera que Ios forzamientos más relevantes sean el viento local y la distribución tridimensional de la densidad del agua. Los resultados obtenidos sugieren que, si bien Ios efectos del viento pueden ser importantes para determinar el flujo de agua hacia el interior del puerto para escalas de tiempo reducidas, a largo plazo el mecanismo más importante de intercambio de agua con el exterior está asociado a la estructura baroclínica del cuerpo de agua, siendo el forzamiento por viento un agente secundario.
Palabras clave: puerto, circulación baroclínica, tensión de viento, tiempo de residencia, modelado numérico, mar Mediterráneo, España.
INTRODUCTION
A harbour can be defined as a sheltered part of a body of water that is deep enough to provide anchorage and operative conditions for
loading/unloading of ships. It is also a place in which upland activities interface with waterborne activities. D ifferent harbour classification schemes can be devised based on scale, complexity or activity.
224 • M. MESTRES et al.
In contrast with this simple definition, a port is also a very complex system in which almost all the elements that can be associated with anthropogenic pollution can be found (Darbra et al., 2004). Noise, dredging, waste production, waste water, emissions of particles into the atmosphere or the water, accidental releases of hazardous substances, etc., are likely to be present in one way or another. Moreover, pollution sources may include activities or facilities that do not belong strictly to the port, but are closely linked to it, such as neighbouring industrial installations or fisheries (Darbra et al., 2004).
The impact of port activities upon the environment is likely to increase in the future, partly because of the construction of new harbours and the further development of those already in operation, and partly due to the expected growth of maritime trading (Chua, 1999). Simultaneously, environmental issues are becoming essential for ports, which are impelled to conform to advancing environmental regulations and to maintain a good public image, the latter due mainly to the close relationship existing between harbours and urban areas. As an example, the comparison between the 1996 ESPO Environmental Questionnaire and the 2004 ESPO Environmental Survey data (Table 1) shows the shifting environmental concerns in 129 European ports, reflecting an increase in environmental awareness—often induced by the implementation of new regulations.
Environmentally sustainable port management is thus a current concern for port managers. There are several methodologies for assessing the environ- mental-friendliness of seaport management, including ISO 14001 (ISO, 1996) and EMAS (EU, 1993; 2001), and new contributions are being offered continuously. Darbra eta!. (2004) for instance, designed a first-level Self Diagnosis Method to assess envi-
T a b l e E - Ten most common issues in port environmental management (ESPO, 2004)
1996 2004
1 Port development (water) 1 Garbage / Port waste2 Water quality 2 Dredging3 Dredging disposal 3 Dredging disposal4 Dredging 4 Dust5 Dust 5 Noise6 Port development (land) 6 Air quality7 Contaminated land 7 Hazardous cargo8 Habitat loss / degradation 8 Bunkering9 Traffic volume 9 Port development (land)10 Industrial effluent 10 Ship discharge (bilge)
ronmental port management, which was tested satisfactorily on 60 European ports, and Peris-Mora et al. (2005) developed a system of 17 pressure/state indicators, some of them multi-dimensional, that account for 63 forms of potential environmental impact from port activities.
Within an environmentally-sound management of seaports, dealing with actual and potential water quality issues is a key element. These are frequent in harbour waters due to the constant baffle of ships in a small, confined area, and to typical port activities such as bulk loading/unloading, ship maintenance and refuelling operations, and the accidental spillage of cargo.
The quality of water in a harbour is influenced primarily by the local circulation pattern within the port—typically induced by wind and baroclinie forcing—and between the port and the surrounding waterbody, the magnitude and timing of tidal and freshwater flows, and the various pollution sources associated with human action. The former two constitute an important aspect of harbour design, and conhibute to the flushing action that leads to the reduction of pollutant concenhation in the harbour. A further dilution mechanism to be considered is the water mixing due to waves associated with seiches and resonance events, and to those generated by the passage of vessels.
In the particular Spanish case, water quality issues are a current concern for the National Harbour Authority, as illustrated by the recent publication by the Spanish National Port Authority (Puertos del Estado) of a set of recommendations (ROM5.1) related to water quality in harbours (Puertos del Estado, 2005). For this reason, two Spanish harbours (Tarragona and Barcelona) were characterised from a hydrodynamic and water quality point of view using existing available information, complemented by a winter and a summer field campaign. This characterisation was used to set up and validate a hydrodynamic model which will, in the near future, lead to the development of an operative prediction system for water dynamics and quality in port areas. This paper focuses on the numerical modelling of winter hydrodynamics in Tarragona Harbour, as the first step in the numerical procedure—including pollutant transport simulation—that will lead to an estimation of water quality in harbours. The methodology followed in this study is applicable not only to ports, but also to coastal lagoons and any other shallow, semi-enclosed waterbody .
SCI. MAR., 71(2), June 2007,223-238. ISSN: 0214-8358
CIRCULATION IN TARRAGONA HARBOUR • 225
4553000River Francoli
O Meteorological station (MS)A Water quality measurements (WQ)• Velocity Doppler profile (DOP)♦ Sea Level gauge (SL)
4552000
AWQ-4
4551000 FRANCE
AWQ-5
SPAIN4550000 AWQ-6
D O P- 3 •/VAWQ-7
348000 349000 350000 351000UTM (m)
352000 353000 354000
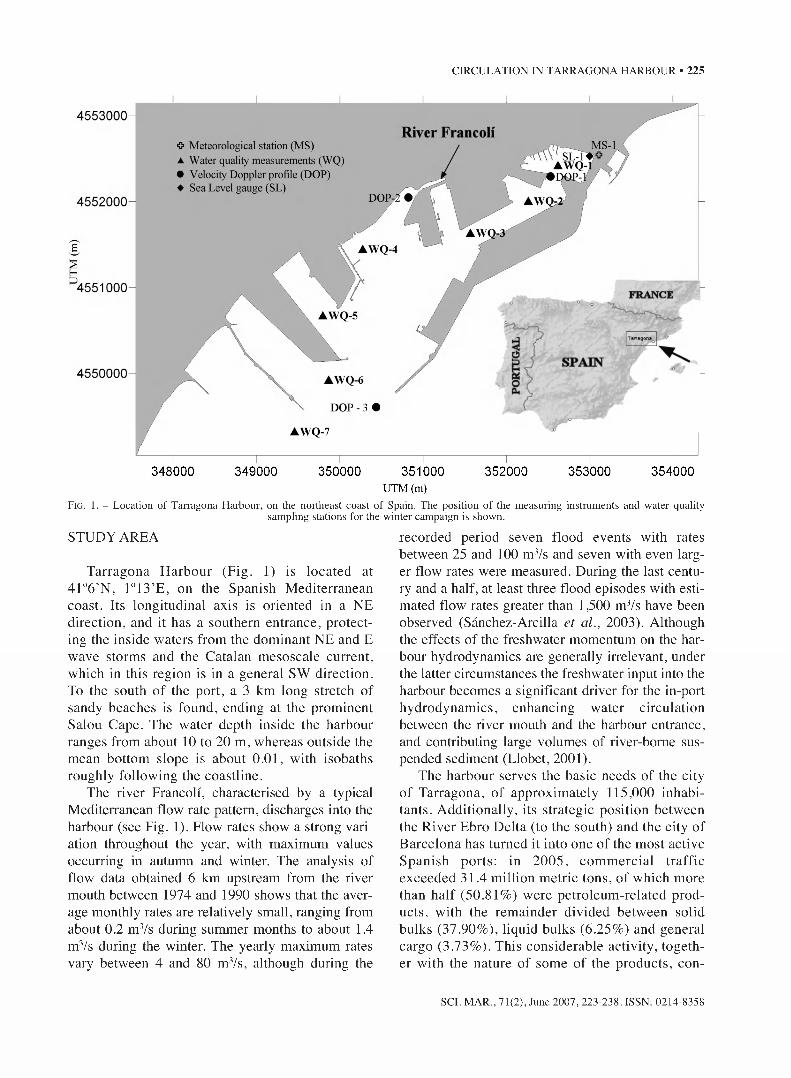
F i g . 1. - Location of Tarragona Harbour, on the northeast coast of Spain. The position of the measuring instruments and water qualitysampling stations for the winter campaign is shown.
STUDY AREA
Tarragona Harbour (Fig. 1) is located at 41°6’N, 1°13’E, on the Spanish Mediterranean coast. Its longitudinal axis is oriented in a NE direction, and it has a southern entrance, protecting the inside waters from the dominant NE and E wave storms and the Catalan mesoscale current, which in this region is in a general SW direction. To the south of the port, a 3 km long stretch of sandy beaches is found, ending at the prominent Salou Cape. The water depth inside the harbour ranges from about 10 to 20 m, whereas outside the mean bottom slope is about 0.01, with isobaths roughly following the coastline.
The river Francoli, characterised by a typical Mediterranean flow rate pattern, discharges into the harbour (see Fig. 1). Flow rates show a strong variation throughout the year, with maximum values occurring in autumn and winter. The analysis of flow data obtained 6 km upstream from the river mouth between 1974 and 1990 shows that the average monthly rates are relatively small, ranging from about 0.2 m3/s during summer months to about 1.4 m3/s during the winter. The yearly maximum rates vary between 4 and 80 m3/s, although during the
recorded period seven flood events with rates between 25 and 100 m3/s and seven with even larger flow rates were measured. During the last century and a half, at least three flood episodes with estimated flow rates greater than 1,500 m3/s have been observed (Sánchez-Arcilla et al., 2003). Although the effects of the freshwater momentum on the harbour hydrodynamics are generally irrelevant, under the latter circumstances the freshwater input into the harbour becomes a significant driver for the in-port hydrodynamics, enhancing water circulation between the river mouth and the harbour entrance, and contributing large volumes of river-borne suspended sediment (Llobet, 2001).
The harbour serves the basic needs of the city of Tarragona, of approximately 115,000 inhabitants. Additionally, its strategic position between the River Ebro Delta (to the south) and the city of Barcelona has turned it into one of the most active Spanish ports: in 2005, com m ercial traffic exceeded 31.4 million metric tons, of which more than half (50.81%) were petroleum-related products, with the remainder divided between solid bulks (37.90%), liquid bulks (6.25%) and general cargo (3.73%). This considerable activity, together with the nature of some of the products, con
SCI. MAR., 71(2), June 2007, 223-238. ISSN: 0214-8358
226 • M. MESTRES et al.
tributes to occasional water pollution issues, which are added to those caused by permanent pollution sources (collectors, etc.) located throughout the harbour.
FIELD CAMPAIGNS
Two field campaigns were undertaken in Tarragona Harbour in 2004 in order to achieve a physico-chemical characterisation of the waterbody. The first campaign extended from January 31 to February 24, supplying information corresponding to winter conditions, whereas the second started on September 14 and ended on October 14, measuring summer-autumn conditions. Field measurements for both campaigns included hydrodynamic, meteorological and water quality data. Water currents were obtained using one Nortek AWAC ADP (1 MHz) placed at the harbour entrance acquiring a 0.5 m-resolution profile every 600 s, one (500 kHz) near the river mouth acquiring a 1.0 m-resolution profile every 1800 s, and a third (RDI) between the two innermost basins. The information from the third ADP was useless due to the proximity of a concrete structure. Wave and sea-level data were measured by the ADP placed at the harbour entrance, and also supplied externally from a Datawell Waverider scalar buoy belonging to the REMRO network (deployed by Puertos del Estado, recording data every hour) and an in-har- bour tidal gauge (CEDEX). Hourly mean and peak values of wind speed and direction were provided by the Tarragona Port Authority from their meteorological station located within the harbour premises (see Figure 1). Vertical profiles of water quality parameters (salinity, temperature, fluorometry, turbidity, pH and DO) were also measured twice during each campaign using a SeaBird 19 plus CTD sensor registering data every 0.25 m. Freshwater discharge rates from the Francoli river at the EA- 79 gauging station in Tarragona were supplied by the Catalan Water Agency. Figure 1 shows the position of the measuring instruments, together with the water quality sampling stations for the winter campaign.
A detailed description of the campaigns and the post-campaign data analyses and results can be found in Sánchez-Arcilla et al. (2005). Herein, only the winter campaign data which arc relevant to feed and calibrate the numerical model arc described briefly.
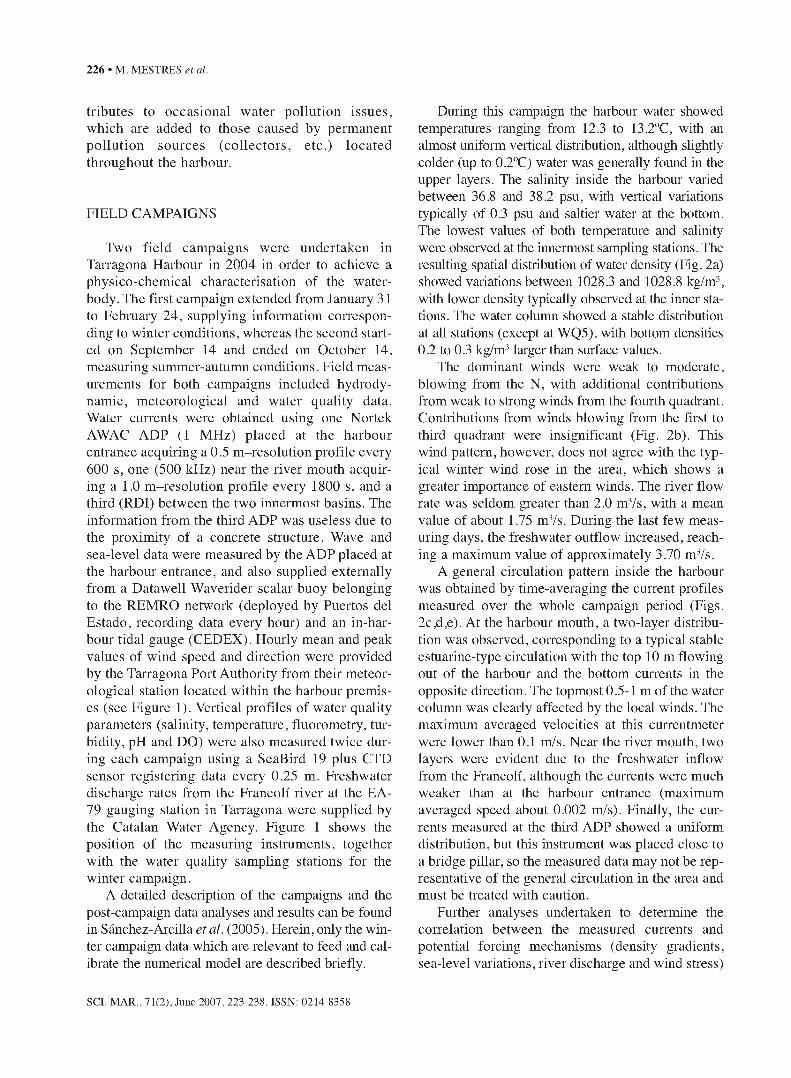
During this campaign the harbour water showed temperatures ranging from 12.3 to 13.2°C, with an almost uniform vertical distribution, although slightly colder (up to 0.2°C) water was generally found in the upper layers. The salinity inside the harbour varied between 36.8 and 38.2 psu, with vertical variations typically of 0.3 psu and saltier water at the bottom. The lowest values of both temperature and salinity were observed at the innermost sampling stations. The resulting spatial distribution of water density (Fig. 2a) showed variations between 1028.3 and 1028.8 kg/m3, with lower density typically observed at the inner stations. The water column showed a stable distribution at all stations (except at WQ5), with bottom densities 0.2 to 0.3 kg/m3 larger than surface values.
The dominant winds were weak to moderate, blowing from the N, with additional contributions from weak to strong winds from the fourth quadrant. Contributions from winds blowing from the first to third quadrant were insignificant (Fig. 2b). This wind pattern, however, does not agree with the typical winter wind rose in the arca, which shows a greater importance of eastern winds. The river flow rate was seldom greater than 2.0 m3/s, with a mean value of about 1.75 m3/s. During the last few measuring days, the freshwater outflow increased, reaching a maximum value of approximately 3.70 m3/s.
A general circulation pattern inside the harbour was obtained by time-averaging the current profiles measured over the whole campaign period (Figs. 2c,d,e). At the harbour mouth, a two-layer distribution was observed, corresponding to a typical stable estuarine-type circulation with the top 10 m flowing out of the harbour and the bottom currents in the opposite direction. The topmost 0.5-1 m of the water column was clearly affected by the local winds. The maximum averaged velocities at this currcntmctcr were lower than 0.1 m/s. Near- the river mouth, two layers were evident due to the freshwater inflow from the Francoli, although the currents were much weaker than at the harbour entrance (maximum averaged speed about 0.002 m/s). Finally, the currents measured at the third ADP showed a uniform distribution, but this instrument was placed close to a bridge pillar-, so the measured data may not be representative of the general circulation in the area and must be treated with caution.
Further analyses undertaken to determine the correlation between the measured currents and potential forcing mechanisms (density gradients, sea-level variations, river discharge and wind stress)
SCI. MAR., 71(2), June 2007,223-238. ISSN: 0214-8358
CIRCULATION IN TARRAGONA HARBOUR • 227
a
wo
wo
WQ
1028.0 1028.5
NORTH
WO
Q.a>a
W Q - j I WÛ
1028.0 1028.5D ensity (kg/m3)
[w ö
1028.0 1028.5
SOUTH
Wind speed (m/s) > 13.90
8 .00 -13 .90
5 .5 0 -8 .0 0
3 .5 0 -5 .5 0
1.50-3 .50
0 .50-1 .50
D ensity (kg/m3)
Current normal to the port entrance
Density (kg/m3)
Current normal to river mouth
E -10
Current normal to port channelo
-2■3■4
■5■6■7■8■9
-0.06 -0.04 -0.02 0.00C u rren t s p e e d (m /s)
0.02 - 0.001 0C u r r e n t s p e e d (m /s )
0.001 -0 .06 -0.04 -0.02C u rre n t s p e e d (m /s)
0.00
Fig . 2. - W ater density distribution within Tarragona harbour (a); wind rose corresponding to the winter field campaign (b); campaign-averaged current profiles at the harbour entrance (c), rivermouth (d), and between the innermost basins (e). Negative velocities correspond to
water flowing towards the south (out-of-harbour direction)
suggested that the main driving agent for currents in the harbour was associated with the baroclinie characteristics of the waterbody, whilst the effects of sea-level gradients within the harbour appeared to be quasi-negligible (Sánchez-Arcilla et al., 2005). The hydrodynamic effects of the river discharge can also be ignored, due to the low outflow rates registered during the field campaign. However, the correlation between wind parameters and the measured currents insinuates that wind stress is an important forcing mechanism that must be considered.
NUMERICAL MODELLING
Numerical model
The hydrodynamic patterns induced in the harbour region by baroclinie forcing, wind stress and
river outflow were modelled using the COHERENS code (Luyten, 1999). This is a 3D hydrodynamic model developed for coastal and estuarine waters, coupled to different modules that account for biological, resuspension and pollution processes.
COHERENS solves the momentum and continuity equations, assuming vertical hydrostatic equilibrium, and includes equations for temperature and salinity. The resolution scheme is formulated in a (x,y,o) reference system, so both the surface and bottom are transformed into co-ordinate systems (Phillips, 1957), thus greatly simplifying the numerical solution of the equations and allowing for an accurate representation of surface and bottom boundary processes.
The mathematical model is discretised using conservative finite differences. An Arakawa “C” grid is chosen for the horizontal plane, staggering vector and scalar nodes. A mode-splitting tech-
SCI. MAR., 71(2), June 2007, 223-238. ISSN: 0214-8358
228 • M. MESTRES et al.
nique is used to solve the momentum equations, whereby the depth-integrated continuity and momentum equations are solved for the b aro tropic mode using a small timestep, and the 3D momentum equations are solved for the baroclinie mode using a larger timestep. The equivalence between the depth-integrated currents obtained from the 2D and the 3D mode equations is checked using a pre- dictor-corrector step. Different numerical schemes and closure models arc available to solve the advection of momentum and horizontal diffusion, and to reproduce vertical diffusion.
Model setup
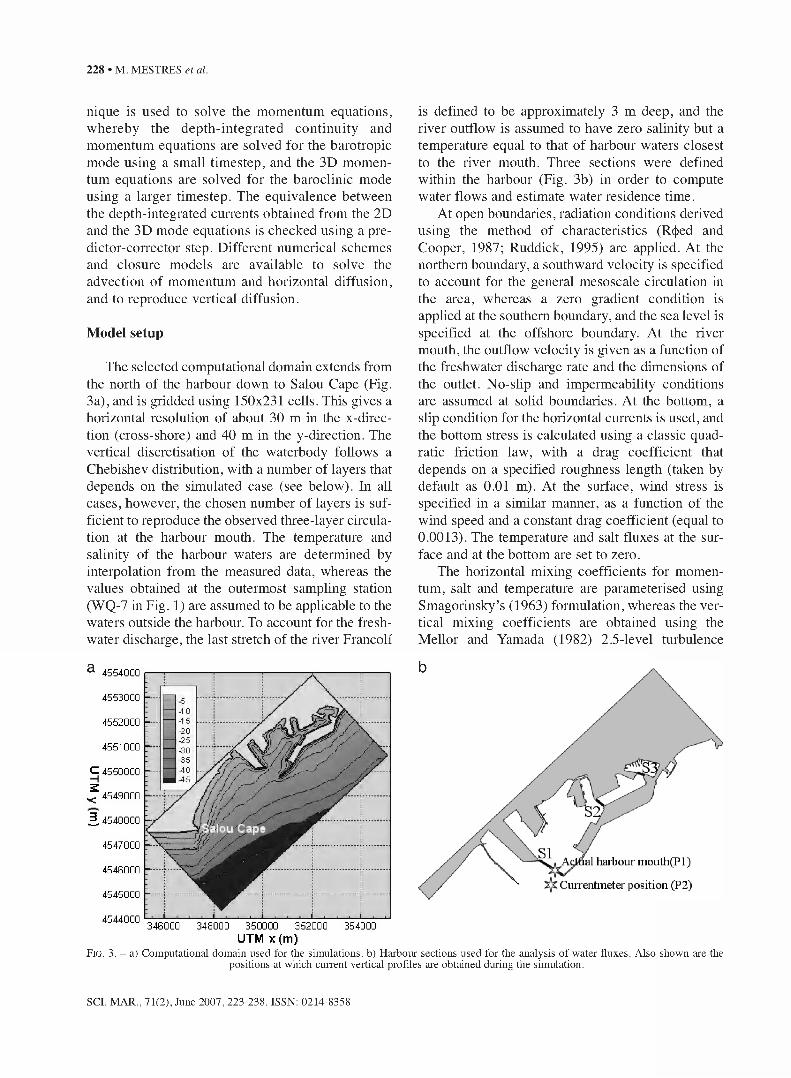
The selected computational domain extends from the north of the harbour down to Salou Cape (Fig. 3a), and is gridded using 150x231 cells. This gives a horizontal resolution of about 30 m in the x-direc- tion (cross-shore) and 40 m in the y-direction. The vertical discretisation of the waterbody follows a Chebishev distribution, with a number of layers that depends on the simulated case (see below). In all cases, however, the chosen number of layers is sufficient to reproduce the observed three-layer circulation at the harbour mouth. The temperature and salinity of the harbour waters arc determined by interpolation from the measured data, whereas the values obtained at the outermost sampling station (WQ-7 in Fig. 1) are assumed to be applicable to the waters outside the harbour. To account for the freshwater discharge, the last stretch of the river Francoli
a 4554000
4553000 I-
4552000 E-
4551000
C 4550000
^ 4549000
¿ 4548000
4547000
4546000
4545000
is defined to be approximately 3 m deep, and the river outflow is assumed to have zero salinity but a temperature equal to that of harbour waters closest to the river mouth. Three sections were defined within the harbour (Fig. 3b) in order to compute water flows and estimate water residence time.
At open boundaries, radiation conditions derived using the method of characteristics (Rcjred and Cooper, 1987; Ruddick, 1995) arc applied. At the northern boundary, a southward velocity is specified to account for the general mesoscale circulation in the arca, whereas a zero gradient condition is applied at the southern boundary, and the sea level is specified at the offshore boundary. At the river mouth, the outflow velocity is given as a function of the freshwater discharge rate and the dimensions of the outlet. No-slip and impermeability conditions are assumed at solid boundaries. At the bottom, a slip condition for the horizontal currents is used, and the bottom stress is calculated using a classic quadratic friction law, with a drag coefficient that depends on a specified roughness length (taken by default as 0.01 m). At the surface, wind stress is specified in a similar manner, as a function of the wind speed and a constant drag coefficient (equal to 0.0013). The temperature and salt fluxes at the surface and at the bottom arc set to zero.
The horizontal mixing coefficients for momentum, salt and temperature are paramctcriscd using Smagorinsky’s (1963) formulation, whereas the vertical mixing coefficients are obtained using the Melior and Yamada (1982) 2.5-level turbulence
Aglfial harbour mouth(Pl)
Currentmeter position (P2)
4544000 346000 348000 350000 352000 354000UTM X (m)
Fig. 3. - a) Computational domain used for the simulations, b) Harbour sections used for the analysis of water fluxes. Also shown are the positions at which current vertical profiles are obtained during the simulation.
SCI. MAR., 71(2), June 2007,223-238. ISSN: 0214-8358
CIRCULATION IN TARRAGONA HARBOUR • 229
scheme. This closure model includes a background mixing coefficient, which for the present study is taken to be equal to IO-3 m2/s.
A first order upwind scheme was selected for the horizontal and vertical advection of momentum.
Modelled cases
Three different simulation cases were defined. The first two (Cases 1 and 2) are characterised by a constant wind forcing, whereas the hydrodynamics in the last case (Case 3) are forced by real time-varying wind parameters. In addition, as mentioned above, baroclinie and river discharge forcing are also considered. Since the analysis of field data revealed no significant correlation between the currents and the sea-level gradients, tidal forcing was not included in the simulations. The waterbody was divided into 3 layers for Cases 1 and 2, and into 7 for Case 3, to perform a better comparison of modelled results with observational data.
In order to characterise the constant-wind cases, the two most frequent wind directions observed in the study area (Garcia et a l., 1993) were selected, together with a mean wind speed. Therefore, for both Case 1 and Case 2, the wind speed was taken as 5.0 m/s, blowing from the east in the former case and from the northwest in the latter. In both simulations, a 24-hour warm-up period was defined, during which the wind speed increased linearly until the specified value was reached, while maintaining a constant direction. The freshwater discharge rate was also assumed to be constant for these simulations, and derived from the measured riverflow data; a value of 2.0 m3/s, slightly larger than the observed mean, was considered. At the northern boundary, a southward slope current of about 0.15 m/s (a typical value for this coastal area - Font et al., 1990) was defined, corresponding to the typical mesoscale current; the sea level at the offshore boundary was set to zero, to avoid sea level and current overshooting in the harbour, as observed during preliminary runs. Under these conditions, the hydrodynamic model was run until an approximately stationary state was reached (about 3 days).
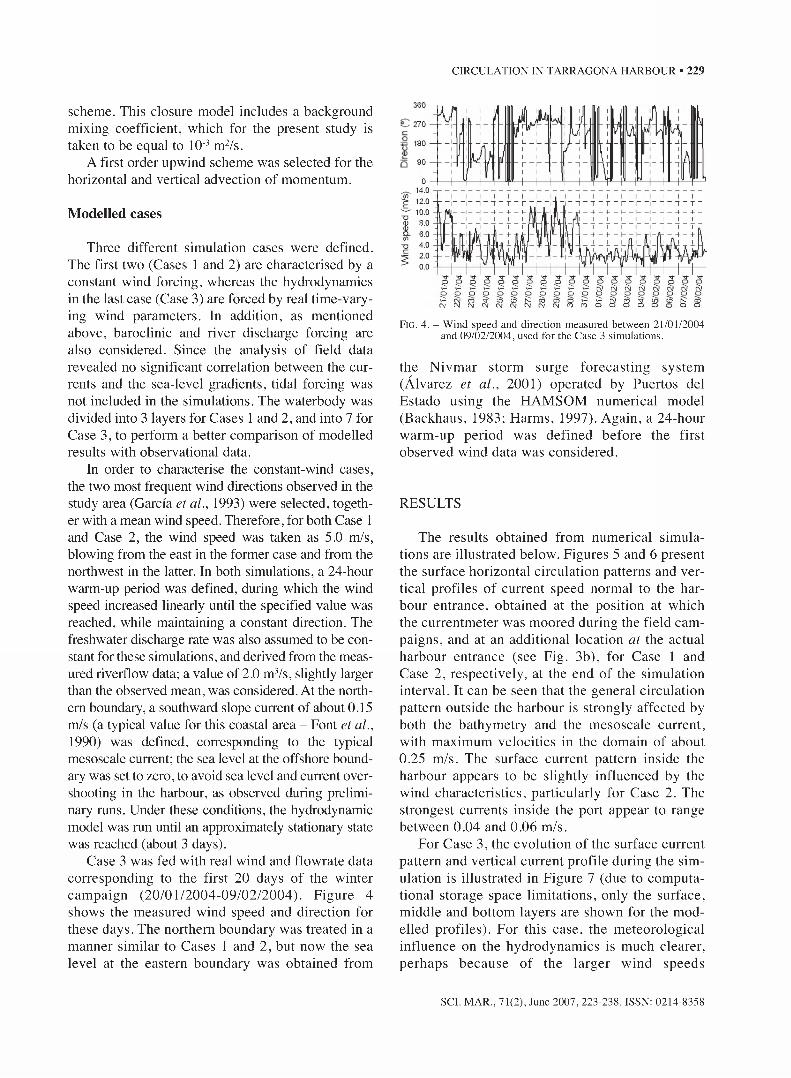
Case 3 was fed with real wind and flowrate data corresponding to the first 20 days of the winter campaign (20/01/2004-09/02/2004). Figure 4 shows the measured wind speed and direction for these days. The northern boundary was treated in a manner similar to Cases 1 and 2, but now the sea level at the eastern boundary was obtained from
^ 14.0 ̂ 12.0 w 10.0
4 . 0 — K
2.0 - -
0.0 - -
Fig . 4. - Wind speed and direction measured between 21/01/2004 and 09/02/2004, used for the Case 3 simulations.
the Nivm ar storm surge forecasting system (Álvarez et a l ., 2001) operated by Puertos del Estado using the HAMSOM numerical model (Backhaus, 1983; Harms, 1997). Again, a 24-hour warm-up period was defined before the first observed wind data was considered.
RESULTS
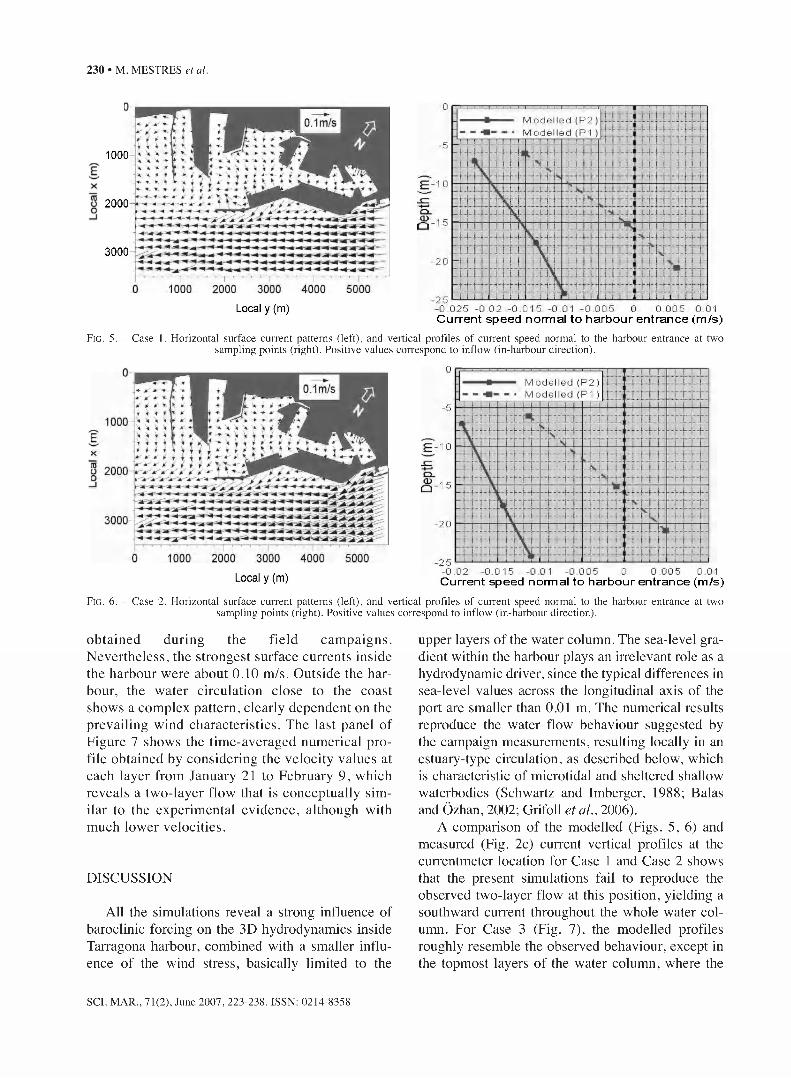
The results obtained from numerical simulations are illustrated below. Figures 5 and 6 present the surface horizontal circulation patterns and vertical profiles of current speed normal to the harbour entrance, obtained at the position at which the currentmeter was moored during the field campaigns, and at an additional location at the actual harbour entrance (see Fig. 3b), for Case 1 and Case 2, respectively, at the end of the simulation interval. It can be seen that the general circulation pattern outside the harbour is strongly affected by both the bathymetry and the mesoscale current, with maximum velocities in the domain of about 0.25 m/s. The surface current pattern inside the harbour appears to be slightly influenced by the wind characteristics, particularly for Case 2. The strongest currents inside the port appear to range between 0.04 and 0.06 m/s.
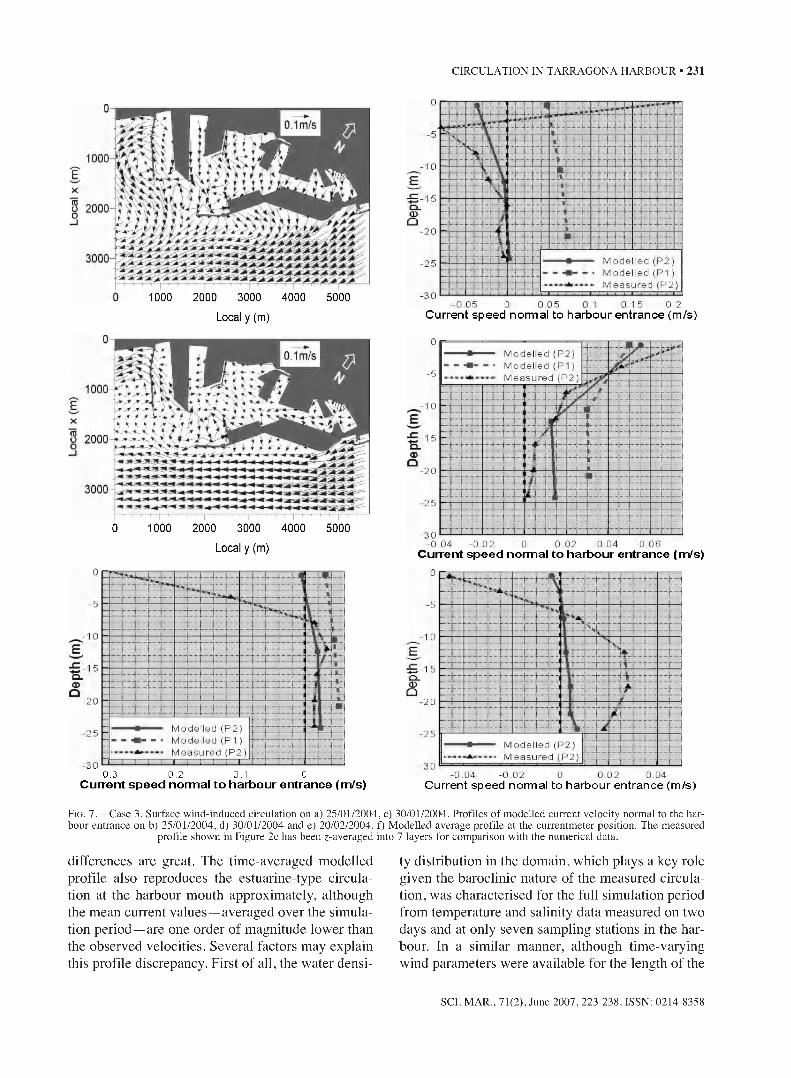
For Case 3, the evolution of the surface current pattern and vertical current profile during the simulation is illustrated in Figure 7 (due to computational storage space limitations, only the surface, middle and bottom layers are shown for the modelled profiles). For this case, the meteorological influence on the hydrodynamics is much clearer, perhaps because of the larger wind speeds
SCI. MAR., 71(2), June 2007, 223-238. ISSN: 0214-8358
230 • M. MESTRES et al.
1000
2000
3000
M o d e l l e d ( P2 ) M o d e l l e d (P1 )
I S '
<DÛ
-2 0
.................- 0 . 0 2 5 - 0 . 0 2 -0 . 01 5 - 0 . 01 - 0 . 0 0 5 0 0 . 0 0 5 0.01
Fig. 5. - Case
2000 3000 4000Local y (m)
C urren t sp eed norm al to harb o u r e n tran ce (m /s)1. Horizontal surface current patterns (left), and vertical profiles of current speed normal to the harbour entrance at two
sampling points (right). Positive values correspond to inflow (in-harbour direction).
ö 2000
2000 3000 4000Local y (m)
M o d e l l e d ( P 2 ) M o d e l l e d (P1 )
- 2 0
- 2 5 ......................- 0 . 0 2 - 0.01 01 - 0 . 0 0 5 0 0 . 0 0 5 0.01C urrent sp eed norm al to harbour en tran ce (m /s)
F i g . 6. - Case 2. Horizontal surface current patterns (left), and vertical profiles of current speed normal to the harbour entrance at two sampling points (right). Positive values correspond to inflow (in-harbour direction).
obtained during the field cam paigns. Nevertheless, the strongest surface currents inside the harbour were about 0.10 m/s. Outside the harbour, the water circulation close to the coast shows a complex pattern, clearly dependent on the prevailing wind characteristics. The last panel of Figure 7 shows the time-averaged numerical profile obtained by considering the velocity values at each layer from January 21 to February 9, which reveals a two-layer flow that is conceptually similar to the experimental evidence, although with much lower velocities.
DISCUSSION
All the simulations reveal a strong influence of baroclinie forcing on the 3D hydrodynamics inside Tarragona harbour, combined with a smaller influence of the wind stress, basically limited to the
upper layers of the water column. The sea-level gradient within the harbour plays an irrelevant role as a hydrodynamic driver, since the typical differences in sea-level values across the longitudinal axis of the port are smaller than 0.01 m. The numerical results reproduce the water flow behaviour suggested by the campaign measurements, resulting locally in an estuary-type circulation, as described below, which is characteristic of microtidal and sheltered shallow waterbodies (Schwartz and Imberger, 1988; Balas and Özhan, 2002; Grifoll et al., 2006).
A comparison of the modelled (Figs. 5, 6) and measured (Fig. 2c) current vertical profiles at the currentmeter location for Case 1 and Case 2 shows that the present simulations fail to reproduce the observed two-layer flow at this position, yielding a southward current throughout the whole water column. For Case 3 (Fig. 7), the modelled profiles roughly resemble the observed behaviour, except in the topmost layers of the water column, where the
SCI. MAR., 71(2), June 2007, 223-238. ISSN: 0214-8358
CIRCULATION IN TARRAGONA HARBOUR • 231
o 2000
1000 2000 3000 4000 5000Local y (m)
ö 2000
0 1000 2000 3000 4000 5000Local y (m)
o
■5
1 0
1 5
20
Mode l led (P2)-25
M e a s u r e d (P2-30
-0.3 -0.2 -0.1 0Current sp e e d normal to harbour entrance (m/s)
-2 0
— Mode l l e d ( P2 )- ■ Mode l l e d ( P I ) M e a s u r e d ( P2 )
-2 5
-3 0-0 .05 0 0.05 0.1 0.15 0.2
Current speed normal to harbour en trance (m/s)
— Mode l led (P2)- ■ Mode l led (P1 ) M e a s u r e d (P2)
-2 0
-2 5
-3 0 .......................-0 . 04 -0 .02 0 0 .02 0.04 0 .06
Current sp e e d normal to harbour entrance (m/s)
"4...
-20
-25M ode l l ed (P2 ) M e a s u r e d ( P2)
■30- 0.04 - 0 . 0 2 0 0 .02 0.04
Current speed normal to harbour entrance (m/s)
Fig . 7. - Case 3. Surface wind-induced circulation on a) 25/01/2004, c) 30/01/2004. Profiles of modelled current velocity normal to the harbour entrance on b) 25/01/2004, d) 30/01/2004 and e) 20/02/2004. f) Modelled average profile at the currentmeter position. The measured
profile shown in Figure 2c has been z-averaged into 7 layers for comparison with the numerical data.
differences are great. The time-averaged modelled profile also reproduces the estuarine-type circulation at the harbour mouth approximately, although the mean current values —averaged over the simulation period—are one order of magnitude lower than the observed velocities. Several factors may explain this profile discrepancy. First of all, the water densi
ty distribution in the domain, which plays a key role given the baroclinie nature of the measured circulation, was characterised for the full simulation period from temperature and salinity data measured on two days and at only seven sampling stations in the harbour. In a similar manner, although time-varying wind parameters were available for the length of the
SCI. MAR., 71(2), June 2007, 223-238. ISSN: 0214-8358
232 • M. MESTRES et al.
modelling period, the wind measurements were obtained at one single meteorological station located at the opposite end of the harbour, close to the innermost basin. Taking into account the port configuration and the distance between the measuring station and the harbour entrance, it is likely that wind characteristics at the currentmeter position may be different from those measured.
The position of the currentmeter also provides a possible explanation for the differences. In order to avoid interferences with daily port operation, the currentm eter was not placed at the harbour entrance, but at a certain distance to the southwest (Fig. 1). At this location, however, the instrument was not protected by the jetty, so current speed measurements included the effects of the general southward mesoscale circulation. Although the mesoscale current has been included in the numerical simulations via the boundary conditions, no simultaneous measurements were done to determine its velocity. Because of this, typical values found in the literature (Font et al., 1990), which may not coincide with the real values existing during the campaigns, have been used, introducing a further uncertainty in the simulations. The effect of the mesoscale current on numerical results is evident from the figures. The modelled profiles at the currentmeter position are systematically shifted to more negative values with respect to the profiles at the harbour entrance, revealing a greater southward component of the velocity away from the relative protection provided by the jetty.
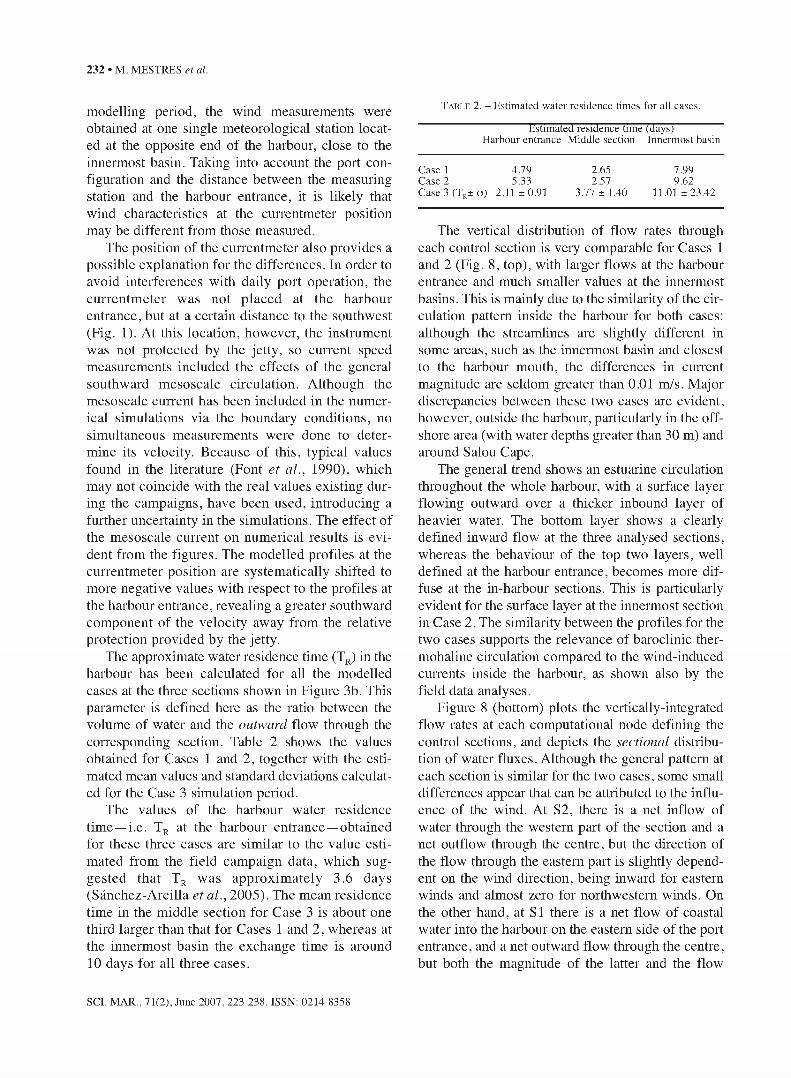
The approximate water residence time (TR) in the harbour has been calculated for all the modelled cases at the three sections shown in Figure 3b. This parameter is defined here as the ratio between the volume of water and the outward flow through the corresponding section. Table 2 shows the values obtained for Cases 1 and 2, together with the estimated mean values and standard deviations calculated for the Case 3 simulation period.
The values of the harbour water residence tim e—i.e. TR at the harbour entrance—obtained for these three cases are similar to the value estimated from the field campaign data, which suggested that Tr was approxim ately 3.6 days (Sánchez-Arcilla et al., 2005). The mean residence time in the middle section for Case 3 is about one third larger than that for Cases 1 and 2, whereas at the innermost basin the exchange time is around 10 days for all three cases.
T a b l e 2 . - Estimated water residence times for all cases.
Estimated residence time (days)Harbour entrance Middle section Innermost basin
Case 1 4.79 2.65 7.99Case 2 5.33 2.57 9.62Case 3 (TR± a) 2.11 ±0.91 3.77 ±1.40 11.01 ±23.42
The vertical distribution of flow rates through each control section is very comparable for Cases 1 and 2 (Fig. 8, top), with larger flows at the harbour enhance and much smaller values at the innermost basins. This is mainly due to the similarity of the circulation pattern inside the harbour for both cases: although the streamlines are slightly different in some areas, such as the innermost basin and closest to the harbour mouth, the differences in current magnitude are seldom greater than 0.01 m/s. Major discrepancies between these two cases are evident, however, outside the harbour, particularly in the offshore area (with water depths greater than 30 m) and around Salou Cape.
The general bend shows an estuarine circulation throughout the whole harbour, with a surface layer flowing outward over a thicker inbound layer of heavier water. The bottom layer shows a clearly defined inward flow at the three analysed sections, whereas the behaviour of the top two layers, well defined at the harbour entrance, becomes more diffuse at the in-harbour sections. This is particularly evident for the surface layer at the innermost section in Case 2. The similarity between the profiles for the two cases supports the relevance of baroclinie thermohaline circulation compared to the wind-induced currents inside the harbour, as shown also by the field data analyses.
Figure 8 (bottom) plots the vertically-integrated flow rates at each computational node defining the control sections, and depicts the sectional distribution of water fluxes. Although the general pattern at each section is similar for the two cases, some small differences appear- that can be attributed to the influence of the wind. At S2, there is a net inflow of water through the western part of the section and a net outflow through the centre, but the direction of the flow through the eastern part is slightly dependent on the wind direction, being inward for eastern winds and almost zero for northwestern winds. On the other hand, at SI there is a net flow of coastal water into the harbour on the eastern side of the port enhance, and a net outward flow through the centre, but both the magnitude of the latter and the flow
SCI. MAR., 71(2), June 2007,223-238. ISSN: 0214-8358

CIRCULATION IN TARRAGONA HARBOUR • 233
5.0 m/s
S3Q (m3/s)
[S2
5.0 m/s
S3Q (m î/s)
S2
- 1 0 0 0 0 0 10 0 0 Q (m3/s)
-40.0 Ï10.O 40.Q (m3/s)
100 . 0 0.0 100 . 0 Q (m3/s)
-40.0 0.0 40.Q (m3/s)
; / T j
[S3l
1__-S2E ° iTTf
Fig. 8. - Vertical distribution of flow rates through each of the control sections, for Case 1 (a) and Case 2 (b). Vertically-averaged flow rate distribution through each control section, for Case 1 (c) and Case 2 (d). Positive values correspond to inflow (in-harbour direction).The solid
line represents the net flow rate. Also indicated are the wind speed and direction.
through the western side of the section are also a function of the wind direction.
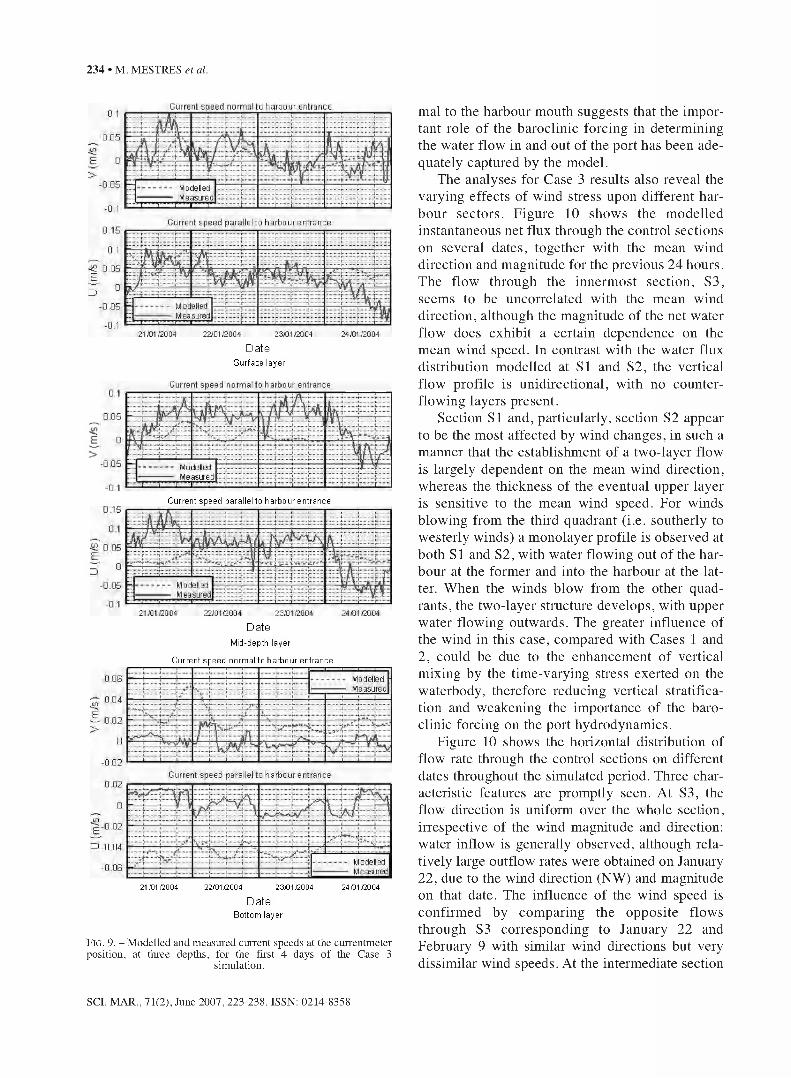
For Case 3, the currents modelled at the currentmeter position were compared with the observational data, suitably r-ave raged to account for the thickness of the computational layers. Figure 9 shows the comparison for the first 4 days of the simulation period. It appears that, for the upper layer, the general current trend and magnitude are similar to those obtained from the measurements, although this similarity decreases with increasing depth. In the middle layer, both components of the computed water velocity are smaller than the observed values, and their time evolution is much smoother. In the bottom layer, the current component normal to the harbour entrance is systemati
cally overestimated, though the modelled time evolution is also similar to that of the observed data (e.g. peaks around midnight on 21/01 and at the end of 22/01). On the other hand, the comparison between the parallel component of the bottom currents shows large discrepancies between modelled and measured time series, both in magnitude and tendency, possibly due to the influence of the bottom stress term in the hydrodynamic equations. An adequate representation of this term, which is affected by the mesoscale current, becomes relevant given the weakness of the currents measured near the bottom during the winter field campaign. Nevertheless, the fact that the similarity between measured and modelled currents is consistently larger for the component nor-
SCI. MAR., 71(2), June 2007, 223-238. ISSN: 0214-8358
234 • M. MESTRES et al.
C u rren t s p e e d n o rm a l lo h a rb o u r e n tra n c e
0 05
E
>-0 05
C u rren t s p e e d p a ra lle l to h a rb o u r e n tr a n c e0 15
0.05
-0 05
21/01/2004 22/01/2004 23/01/2004 24/01 /2004
DateS u r fa c e lay e r
C u rren t s p e e d n o rm a l to h a rb o u r e n tra n c e0.1
0 05
0
-0 05 M odeledM easured
■0.1
C u rren t s p e e d p a ra lle l to h a rb o u r e n tr a n c e0 15
0 05
-0 05 M odeledM easured
21 AM /2004
Date M id-depth lay e r
C u rren t s p e e d n o rm al to h a rb o u r e n tra n c e
0.06 ModelledM easured
E 0.02>
- 0.02C u rren t s p e e d p ara lle l to h a rb o u r e n tra n c e
0.02
0- 0.02
ModelledM easured-0.06
21 /01/2004 22/ 01/2004 23 /01/2004 24 /01/2004
DateB o tto m lay e r
Fig. 9. - Modelled and measured current speeds at the currentmeter position, at three depths, for the first 4 days of the Case 3
simulation.
mai to the harbour mouth suggests that the important role of the baroclinie forcing in determining the water flow in and out of the port has been adequately captured by the model.
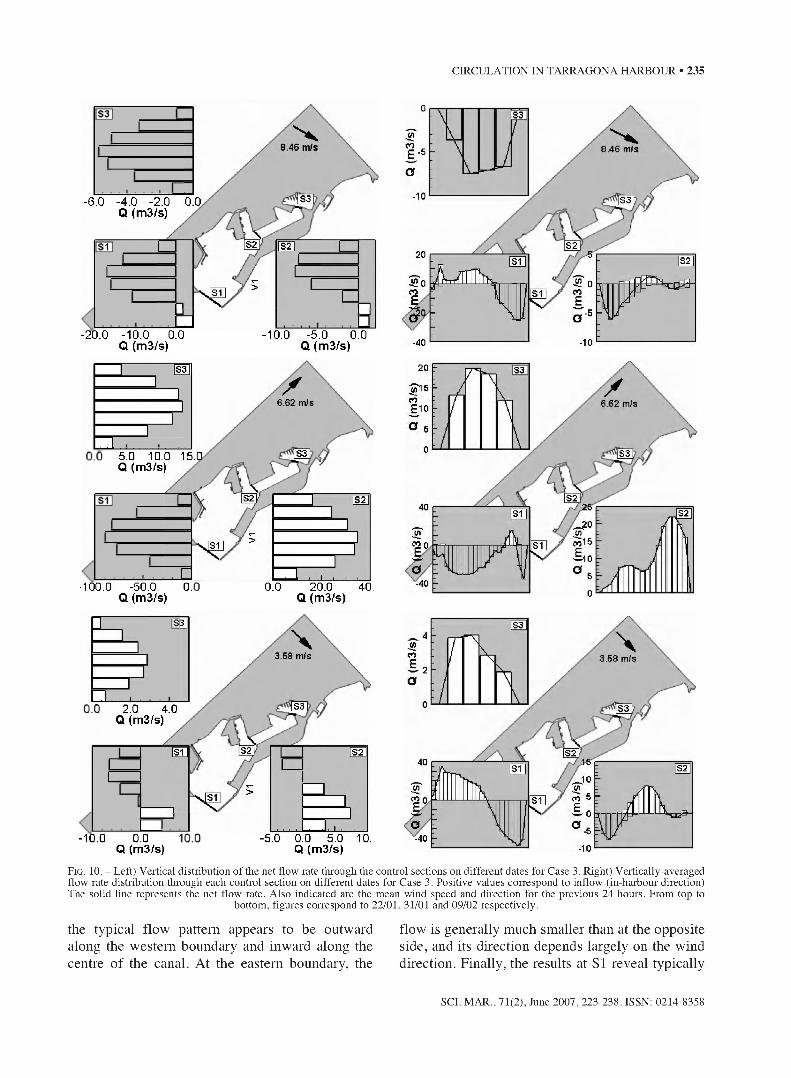
The analyses for Case 3 results also reveal the varying effects of wind stress upon different harbour sectors. Figure 10 shows the modelled instantaneous net flux through the control sections on several dates, together with the mean wind direction and magnitude for the previous 24 hours. The flow through the innermost section, S3, seems to be uncorrelated with the mean wind direction, although the magnitude of the net water flow does exhibit a certain dependence on the mean wind speed. In contrast with the water flux distribution modelled at SI and S2, the vertical flow profile is unidirectional, with no counterflowing layers present.
Section SI and, particularly, section S2 appear to be the most affected by wind changes, in such a manner that the establishment of a two-layer flow is largely dependent on the mean wind direction, whereas the thickness of the eventual upper layer is sensitive to the mean wind speed. For winds blowing from the third quadrant (i.e. southerly to westerly winds) a monolayer profile is observed at both SI and S2, with water flowing out of the harbour at the former and into the harbour at the latter. When the winds blow from the other quadrants, the two-layer structure develops, with upper water flowing outwards. The greater influence of the wind in this case, compared with Cases 1 and 2, could be due to the enhancement of vertical mixing by the time-varying stress exerted on the waterbody, therefore reducing vertical stratification and weakening the importance of the baroclinie forcing on the port hydrodynamics.
Figure 10 shows the horizontal distribution of flow rate through the control sections on different dates throughout the simulated period. Three characteristic features are promptly seen. At S3, the flow direction is uniform over the whole section, irrespective of the wind magnitude and direction: water inflow is generally observed, although relatively large outflow rates were obtained on January 22, due to the wind direction (NW) and magnitude on that date. The influence of the wind speed is confirmed by comparing the opposite flows through S3 corresponding to January 22 and February 9 with similar wind directions but very dissimilar wind speeds. At the intermediate section
SCI. MAR., 71(2), June 2007,223-238. ISSN: 0214-8358
CIRCULATION IN TARRAGONA HARBOUR • 235
-6.0 -4.0 -2.0 Q (m3/s)
- 20.0 - 10.0 0.0 Q (m3/s)
M
-10.0 -5.0 0.0Q (m3/s)
0.0 20.0 40.Q (m3/s)
5.0 10.0 15. Q (m3/s)
■100.0 -50.0 0.Q (m3/s)
S3
CO 8.46 m/s
-10 S3
S2
J2oCO sTI CO
-40 -10
20
6.62 m/s
S3
|S2
sTI
-40
co 3.68 m/s
S3
[S2
-40-10
Fig. 10. - Left) Vertical distribution of the net flow rate through the control sections on different dates for Case 3. Right) Vertically-averaged flow rate distribution through each control section on different dates for Case 3. Positive values correspond to inflow (in-harbour direction) The solid line represents the net flow rate. Also indicated are the mean wind speed and direction for the previous 24 hours. From top to
bottom, figures correspond to 22/01, 31/01 and 09/02 respectively.
the typical flow pattern appears to be outward flow is generally much smaller than at the oppositealong the western boundary and inward along the side, and its direction depends largely on the windcentre of the canal. At the eastern boundary, the direction. Finally, the results at SI reveal typically
- 10.0 0.0Q (m3/s) Q (m3/s)
2.0 4.0Q (m3/s)
SCI. MAR., 71(2), June 2007, 223-238. ISSN: 0214-8358

236 • M. MESTRES et al.
inflowing waters through the western part of the harbour entrance, balanced by the outflow observed on the opposite side. Although small variations are imposed on these patterns following varying wind directions, the mean flow distribution at all sections is consistent with that described above, irrespective of the wind parameters. The exception to the nile is obtained when the prevailing mean wind blows into the harbour and along its axis, as occurred on January 31. Under these wind conditions, the flows through sections SI and S2 are completely different, particularly at the harbour mouth section. Here, the effects of the southwestern wind result in flow inversion, by which harbour waters flow outward through the western side and the centre of the mouth, and outside waters move in-harbour only at the eastern edge of the section. Unexpectedly, for this simulation the magnitude of the outflow was significantly greater than the water flow into the harbour, due mainly to the subsurface circulation, which appeared to be somewhat unaffected by the direct wind effects. On the other hand, the flow through the intermediate section (S2) under these wind conditions is entirely directed into the harbour’s inner basins, with a larger modelled inflow at the eastern side of the control section.
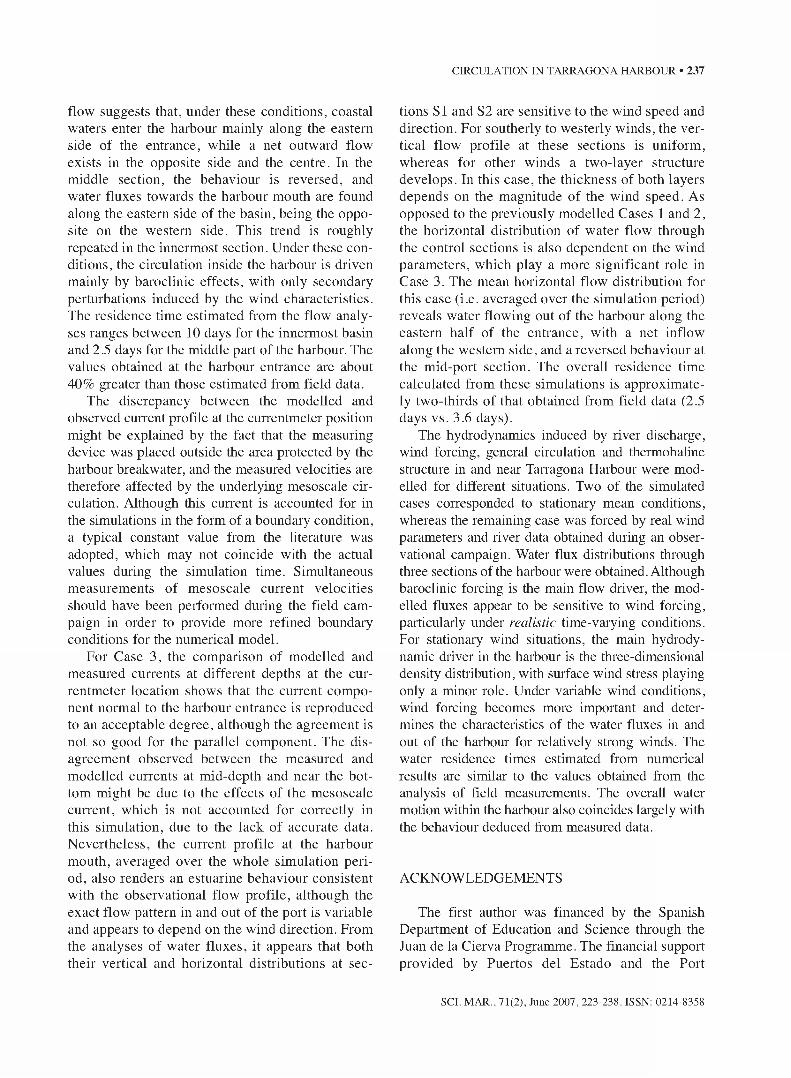
The mean flow values, obtained by averaging the flow rates for the aforementioned dates, arc represented in Figure 11. The mean residence time for the harbour waters during this simulation period, calculated using the mean flow at the harbour enhance, is estimated at approximately 2.1 days, which is about 33% shorter than that obtained from the field cam
paign data (3.6 days). It should be stressed that the observational TR was calculated using a single current profile measured with a 0.5 m vertical resolution (i.e. 46 layers) and at 10-minute intervals for 32 days, whereas the computational TR given here was obtained from only 6 time data and 7 vertical layers. Therefore, the agreement between the two values can be considered satisfactory.
CONCLUSIONS
The main goal of this work was to reproduce the estuarine-type circulation at the harbour entrance observed during the field campaign. Such a circulation pattern is a significant mechanism for water renovation in shallow semi-enclosed waterbodies, and therefore plays a relevant role in determining the quality of harbour waters. For stationary cases (Cases 1 and 2), a pattern with bottom inflow and upper outflow was obtained at the harbour mouth, but not at the position where the currentmeter was located during the campaign. This discrepancy is justified below. Furthermore, the analyses of water fluxes at three sections within the harbour show that the surface flow is generally directed towards the harbour mouth, whereas the bottom and middepth flows are in the opposite direction, except in the innermost arcas where the intermediate flow almost vanishes. Once stationary conditions arc reached, the magnitude of these water fluxes appears to be independent of the wind direction. The horizontal distribution of vertically-averaged
S3
[S2
IsT
-40-10
Fig. 11. - Mean vertical distribution of the net flow rate (left) and mean vertically-averaged flow rate distribution through each control section, for Case 3. Positive values correspond to inflow (in-harbour direction).The solid line represents the net flow rate.
0.0 2.0 4.0Q (m3/s)
- 20.0 0.0 Q (m3/s)
10.0 Q (m3/s)
SCI. MAR., 71(2), June 2007,223-238. ISSN: 0214-8358
CIRCULATION IN TARRAGONA HARBOUR • 237
flow suggests that, under these conditions, coastal waters enter the harbour mainly along the eastern side of the entrance, while a net outward flow exists in the opposite side and the centre. In the middle section, the behaviour is reversed, and water fluxes towards the harbour mouth are found along the eastern side of the basin, being the opposite on the western side. This trend is roughly repeated in the innermost section. Under these conditions, the circulation inside the harbour is driven mainly by baroclinie effects, with only secondary perturbations induced by the wind characteristics. The residence time estimated from the flow analyses ranges between 10 days for the innermost basin and 2.5 days for the middle part of the harbour. The values obtained at the harbour entrance are about 40% greater than those estimated from field data.
The discrepancy between the modelled and observed current profile at the currentmeter position might be explained by the fact that the measuring device was placed outside the area protected by the harbour breakwater, and the measured velocities arc therefore affected by the underlying mesoscale circulation. Although this current is accounted for in the simulations in the form of a boundary condition, a typical constant value from the literature was adopted, which may not coincide with the actual values during the simulation time. Simultaneous measurements of mesoscale current velocities should have been performed during the field campaign in order to provide more refined boundary conditions for the numerical model.
For Case 3, the comparison of modelled and measured currents at different depths at the currentmeter location shows that the current component normal to the harbour entrance is reproduced to an acceptable degree, although the agreement is not so good for the parallel component. The disagreement observed between the measured and modelled currents at mid-depth and near the bottom might be due to the effects of the mesoscale current, which is not accounted for correctly in this simulation, due to the lack of accurate data. Nevertheless, the current profile at the harbour mouth, averaged over the whole simulation period, also renders an estuarine behaviour consistent with the observational flow profile, although the exact flow pattern in and out of the port is variable and appears to depend on the wind direction. From the analyses of water fluxes, it appears that both their vertical and horizontal distributions at sec
tions SI and S2 are sensitive to the wind speed and direction. For southerly to westerly winds, the vertical flow profile at these sections is uniform, whereas for other winds a two-layer structure develops. In this case, the thickness of both layers depends on the magnitude of the wind speed. As opposed to the previously modelled Cases 1 and 2, the horizontal distribution of water flow through the control sections is also dependent on the wind parameters, which play a more significant role in Case 3. The mean horizontal flow distribution for this case (i.e. averaged over the simulation period) reveals water flowing out of the harbour along the eastern half of the entrance, with a net inflow along the western side, and a reversed behaviour at the mid-port section. The overall residence time calculated from these simulations is approximately two-thirds of that obtained from field data (2.5 days vs. 3.6 days).
The hydrodynamics induced by river discharge, wind forcing, general circulation and thermohaline structure in and near- Tarragona Harbour were modelled for different situations. Two of the simulated cases corresponded to stationary mean conditions, whereas the remaining case was forced by real wind parameters and river data obtained during an observational campaign. Water flux distributions through three sections of the harbour were obtained. Although baroclinie forcing is the main flow driver, the modelled fluxes appear- to be sensitive to wind forcing, particularly under realistic time-varying conditions. For stationary wind situations, the main hydrodynamic driver in the harbour is the three-dimensional density distribution, with surface wind stress playing only a minor role. Under variable wind conditions, wind forcing becomes more important and determines the characteristics of the water fluxes in and out of the harbour for relatively strong winds. The water residence times estimated from numerical results are similar- to the values obtained from the analysis of field measurements. The overall water motion within the harbour also coincides largely with the behaviour deduced from measured data.
ACKNOWLEDGEMENTS
The first author was financed by the Spanish Department of Education and Science through the Juan de la Cierva Programme. The financial support provided by Puertos del Estado and the Port
SCI. MAR., 71(2), June 2007, 223-238. ISSN: 0214-8358
238 • M. MESTRES et al.
Authorities of Barcelona and Tarragona, via a collaboration agreement with LIM-UPC, must also be acknowledged. The authors would like to thank all the people who took part in the field campaign, and those responsible for the post-processing of field measurements, in particular- Anna Rubio, Jordi Cateura, Manel Grifoll and Joan Puigdefàbregas, from LIM-UPC. Thanks are also due to Ms. Begoira Pérez and Mr. Jaime López, from Puertos del Estado, for supplying the sea level data from the operational Nivmar system.
REFERENCES
Alvarez, E., B. Pérez and I. Rodriguez. - 200E Nivmar: a storm surge forecasting system for Spanish waters. Sei. Mar., 65 (Suppl. 1): 145-E54.
Backhaus, J.O. - 1983. A semi-implicit scheme for shallow water equations for applications to shelf sea modelling. Cont. Shelf Res., 2: 243-254.
Balas, L. and E. Ozhan. - 2002. Three-Dimensional Modelling of Stratified Coastal Waters. Est. Coast. Shelf Sei., 54: 75-87.
Chua, T E . - 1999. Marine pollution prevention and management in the East Asian seas. Mar. Poll. Bull., 39: 80-88.
Dabra, R.M., A. Ronza, J. Casal, T.A. Stojanovic and C. Wooldridge. - 2004. Tire Self Diagnosis Method: a new methodology to assess environmental management in sea ports. Mar. Poll.''Bull., 48: 420-428.
ESPO. - 2004. ESPO Environmental Survey 2004 - Review o f European Performance in Port Environmental Management. ESPO, Brussels.
EU. - 1993. Council Regulation no. 1836/93 o f 29 June 1993 allowing voluntary participation by companies in the industrial sector in a community eco-management and audit scheme. Official Journal of the European Communities L 168: 1-18.
EU. - 2001. Regulation (EC) no. 761/2001 o f the European Parliament and o f the Council o f 19 March 2001 allowing voluntary participation by organisations in a community eco-man- agement and audit scheme (EMAS). Official Journal of tire European Communities L 114: 1-29.
Font, J., J. Salat and A. Julià. - 1990. Marine circulation along the Ebro continental margin. Mar. Geol., 95: 165-177.
García, M., A. Sánchez-Arcilla, J.P. Sierra, J. Sospedra and J. Gómez. - 1993. Wind waves off the Ebro Delta, NW Mediterranean. J. Mar. Sys., 4: 235-262.
Grifoll, M., M. Espino, J.P. Sierra, A. Sánchez-Arcilla, A. Rubio, J. Puigdefàbregas and J. Cateura. - 2006. SeasonalHydrodynamic Variations in a Two-Mouth Harbour in the Mediterranean Sea: The Barcelona Case Study. J. Mar. Sys. (submitted).
Harms, I.H. - 1997. Watermass transformation in the Barents Sea.- Application of The HAMburg Shelf Ocean Model (HAM- SOM). J. Mar. Sei., 54: 351-365.
ISO. - 1996. EN ISO 14001. Environmental Management Systems- Specification with Guidance for Use. CEN, Brussels.
Llobet, M. - 2001. Estudio del transporte de sedimentos del rioFrancoli en el interior del Puerto de Tarragona mediante la aplicación de un modelo hidrodinámico y de un modelo de transporte de sedimentos. M aster Thesis, Technical University of Catalonia.
Luyten, P.J. (ed). - 1999. COHERENS - Dissemination and exploitation o f a coupled hydrodynamical-ecological model for regional and shelf seas. MAS3-CT97-0088. Final report, MUMM Internal Report, Management Unit of the Mathematical Models, 76 pp.
Melior, G.L. and T. Yamada. - 1982. Development of a turbulent closure model for geophysical fluid problems. Rev. Geophys. Space Pitys., 20: 851-875.
Peris-Mora, E., J.M. Diez Orejas, A. Subirais, S. Ibáñez and P. Alvarez. - 2005. Development of a system of indicators for sustainable port management. Mar. Poll. Bull., 50: 1649-1660.
Phillips, N.A. - 1957. A coordinate system having some special advantages for numerical forecasting. J. Met., 14: 184-185.
Puertos del Estado - 2005. ROM 5.1 - Calidad de las aguas litorales en areas portuarias. Ed. Puertos del Estado, Madrid, Spain.
Rt[)ed, L.P. and C.K Cooper. - 1987. A study of various open boundary conditions for wind-forced barotropic numerical ocean models. In: J.C. Nihoul and B.M. Jamart (eds.), Three- dimensional models o f marine and estuariae dynamics, pp. 305-335. Elsevier, Amsterdam.
Ruddick, K.G. - 1995. Modelling o f coastal processes influenced by the freshwater discharge o f the Rhine. PhD thesis, Univ. Liège.
Sánchez-Arcilla, A., M. Mestres, J.P. Sierra and R. Juanola. - 2003. Simulación del transporte de sedimentos en el Puerto de Tarragona. Proc. VII Jornadas Españolas de Ingeniería de Costas y Puertos, Almería, Spain.
Sánchez-Arcilla, A., M. Espino, J.P. Sierra, J. Cateura, J. Gómez, M. Grifoll, J. Puigdefàbregas and A. Rubio. - 2005. Informe de las campañas del Puerto de Tarragona. Research Report LIM/AOC-05-2, UPC, Barcelona, 76 p.
Schwartz, R.A. and J. Imberger, - 1988. Flushing behaviour of a coastal marina. Proc. 28"' ICCE, ASCE, USA, pp. 2626-2640.
Smagorinsky, J. - 1963. General circulation experiments with the primitive equations - I. The basic experiment. Mon Weather Rev., 91: 99-165.
Scient, ed.: J. Font.Received September 12, 2006. Accepted January 2, 2007. Published online May 17, 2007.
SCI. MAR., 71(2), June 2007,223-238. ISSN: 0214-8358