Embed Size (px)
Citation preview
From the SelectedWorks of Nicholas LGeorgakopoulos
August 2013
Bar Passage: GPA and LSAT, not Bar Reviews
ContactAuthor
Start Your OwnSelectedWorks
Notify Meof New Work
Available at: http://works.bepress.com/nicholas_georgakopoulos/8
Draft of Saturday, August 10, 2013; 9,825 words.
NICHOLAS L. GEORGAKOPOULOS*
Bar Passage: GPA and LSAT, not Bar Reviews
I. INTRODUCTION ..................................................................................................... 2 II. LITERATURE REVIEW .......................................................................................... 2 III. THE DATASET .................................................................................................... 5 IV. DESCRIPTIVE STATISTICS ................................................................................... 7 V. PROBIT REGRESSIONS OF BAR PASSAGE ON GPA, LSAT AND UGPA ................ 3
A. Irrelevance of Undergraduate GPA ..................................................... 6 B. The Extraordinary Power of Law School GPA .................................... 6 C. The Attenuated Power of LSAT ............................................................ 9 D. The Relevance of Upperclass GPA .................................................... 11
VI. LINEAR REGRESSIONS OF GPA ON LSAT AND UGPA ..................................... 12 A. The Noisy Prediction of Law GPA ..................................................... 13
VII. ANALYSIS OF BAR PREPARATION COURSES.................................................... 18 VIII. CONCLUSION: NURTURE AND LEGAL ANALYSIS RATHER
THAN NATURE AND MEMORIZATION ..................................................................... 20
Abstract: Probit regressions of bar passage on law GPA, undergraduate GPA (uGPA) and LSAT show GPA to have a very strong relation, LSAT a weaker one, and uGPA not to have any relation. 1L and upperclass GPA both have strong predictive power, favoring an interpretation of significant learning in small and elective courses compared to the mandated large ones of the first year. Linear regressions of GPA on uGPA and LSAT show a noisy relation to exist only for first-time bar exam takers, none for 2nd time takers. Analysis of bar review courses does not show the choice among them to have consequence. Possible interpretations favor legal education over innate skill and the training in legal analysis over memorization. This argues for elective courses, even at the expense perhaps of the fixed 1L curriculum.
*. Harold R. Woodard Professor of Law, Indiana University Robert H. McKinney School of Law. I wish to thank especially Peg Brinig, Jennifer Drobac, Lea B. Shaver, Mike Pitts, Antony Page, Joshua Silverstein, for their helpful comments. I urge you to send your comments to me at [email protected].
2 Nicholas L. Georgakopoulos DRAFT
I. INTRODUCTION
The cynical approach to legal education is that natural inclination dominates training, that the higher grading of upperclass courses is grade inflation and allows students to game the system at the expense of their education, and that the slow and discursive (socratic) style of law school instruction is a luxury easily substituted by a bar preparation course and its attendant memoriza-tion. I must admit that the cynic in me could not refute and was even attracted to these positions. These data, however, refute them rather loudly. Training dominates natural inclination (at least to the extent that LSAT captures natural inclination) because law school GPA has a much stronger relation to bar passage than LSAT. High upperclass grades are not grade inflation but relate to higher bar passage probability suggesting true learning. Finally, the choice among bar preparation courses does not have consequence for bar passage, leaving GPA and its underlying learning as the likely explanation of success at the bar examination.
II. LITERATURE REVIEW
Legal education is thoroughly examined and discussed in law journals and even has dedicated journals, such as the Journal of Legal Education. Important discussions about educational principles,1 diversity mostly by gender2 and race,3 skills training,4 1. See, e.g., WILLIAM M. SULLIVAN ET AL, THE CARNEGIE FOUNDATION FOR THE
ADVANCEMENT OF TEACHING, EDUCATING LAWYERS: PREPARATION FOR THE PROFESSION OF
LAW (2007); Gerald F. Hess, Heads and Hearts: The Teaching and Learning Environment in Law School, 52 J. Legal Educ. 75 (2002); Roger C. Cramton, The Current State of the Law Curriculum, 32 J. Legal Educ. 321 (1982). 2. See, e.g., Lauren A. Graber, Are We There yet? Progress Toward Gender-Neutral Legal Education, 33 B.C. J.L. & Soc. Just. 45 (2013); Minna J. Kotkin, Of Authorship and Audacity: An Empirical Study of Gender Disparity and Privilege in the “Top Ten” Law Reviews, 31 Women's Rts. L. Rep. 385 (2010); Nancy Leong, A Noteworthy Absence, 59 J. Legal Educ. 279 (2009); LANI GUINIER ET AL., BECOMING GENTLEMEN: WOMEN, LAW
SCHOOL, AND INSTITUTIONAL CHANGE (1997); Allison L. Bowers, Women at the University of Texas School of Law: A Call for Action, 9 Tex. J. Women & L. 117 (2000); Adam Neufeld, Costs of an Outdated Pedagogy? Study on Gender at Harvard Law School, 13 Am. U.J. Gender Soc. Pol'y & L. 511 (2005); Sari Bashi & Maryana Iskander, Why Legal Education Is Failing Women, 18 Yale J.L. & Feminism 389 (2006); Claire G. Schwab, Note, A Shifting Gender Divide: The Impact of Gender on Education at Columbia Law School in the New Millennium, 36 Colum. J.L. & Soc. Probs. 299, 303 & n.24 (2003); Mark R. Brown, Gender Discrimination in the Supreme Court's Clerkship Selection Process, 75 Or. L. Rev. 359 (1996).
2013 BAR PASSAGE: GPA AND LSAT, NOT BAR REVIEWS 3
grading systems,5 and disparity between graders,6 take front stage. The attention is not new.7 Quantitative statistics also connect law school grades to subsequent outcomes. Surveys explore multiple facets of employment,8 lifestyle, and satisfaction.9 Bar passage has been examined from the perspective of race and origin.10
The findings of the present research contribute to prior empirical research that relates law school grades, LSAT, and
3. See, e.g., Ian Ayres & Richard Brooks, Does Affirmative Action Reduce the Number of Black Lawyers?, 57 Stan. L. Rev. 1807 (2005); Cecil J. Hunt II, Guests in Another's House: An Analysis of Racially Disparate Bar Performance, 23 Fla. St. U. L. Rev. 721 (1996); Richard O. Lempert et al., Michigan's Minority Graduates in Practice: The River Runs Through Law School, 25 Law & Soc. Inquiry 395 (2000); Jane E. Cross, The Bar Examination in Black and White: The Black-White Bar Passage Gap and the Implications for Minority Admissions to the Legal Profession, 18 Nat'l Black L.J. 63 (2004-05); Timothy T. Clydesdale, A Forked River Runs Through Law School: Toward Understanding Race, Gender, Age, and Related Gaps in Law School Performance and Bar Passage, 29 Law & Soc. Inquiry 711 (2004). 4. See, e.g., R. Michael Cassidy, Beyond Practical Skills: Nine Steps for Improving Legal Education Now, 53 B.C. L. Rev. 1515 (2012); William R. Slomanson, Pouring Skills Content Into Doctrinal Bottles, 61 J. Legal Educ. 683 (2012); Stephen Gerst and Maria L. Bahr, Teaching Professional Skills and Values: An Alumni Assessment, 5 Phoenix L. Rev. 487 (2012). 5. See, e.g., Joshua M. Silverstein, In Defense of Mandatory Curves, 34 U. Ark. Little Rock L. Rev. 253 (2012); Jeffrey Evans Stake, Making the Grade: Some Principles of Comparative Grading, 52 J. Legal Educ. 583, 618 (2002); Daniel Keating, Ten Myths About Law School Grading, 76 Wash. U.L.Q. 171 (1998); Jay M. Feinman, Law School Grading, 65 UMKC L. Rev. 647 (1997); Robert C. Downs & Nancy Levit, If it Can't be Lake Woebegone: A Nationwide Survey of Law School Grading and Grade Normalization Practices, 65 UMKC L. Rev. 819 (1997); Deborah Waire Post, Power and the Morality of Grading-A Case Study and a Few Critical Thoughts on Grade Normalization, 65 UMKC L. Rev. 777 (1997); Nicholas L. Georgakopoulos, Relative Rank: A Remedy for Subjective Absolute Grades, 29 Conn. L. Rev. 445 (1996); Nancy H. Kaufman, A Survey of Law School Grading Practices, 44 J. Legal Educ. 415 (1994); Richard A. Epstein, Grade Normalization, 44 S. Cal. L. Rev. 707 (1970-71). 6. See, e.g., Paul T. Wangerin, Calculating Rank-in-Class Numbers: The Impact of Grading Differences Among Law School Teachers, 51 J. Legal Educ. 98 (2001); Nicholas L. Georgakopoulos, Relative Rank: A Remedy for Subjective Absolute Grades, 29 Conn. L. Rev. 445 (1996). 7. See, e.g., John L. Grant, The Single Standard in Grading, 29 Colum. L. Rev. 920 (1929). 8. Tom Ginsburg & Jeffrey A. Wolf, The Market for Elite Law Firm Associates, 31 Fla. St. U.L. Rev. 909, 925 (2004). 9. See, e.g., Kenneth G. Dau-Schmidt, Jeffrey E. Stake, Kaushik Mukhopadhaya, Timothy A. Haley, “The Pride of Indiana”: An Empirical Study of the Law School Experience and Careers of Indiana University School of Law-Bloomington Alumni, 81 Ind. L.J. 1427 (2006). See also, Richard Delgado & Jean Stefancic, Can Lawyers Find Happiness?, 58 Syracuse L. Rev. 241 (2007); Lawrence R. Richard, Psychological Type and Job Satisfaction Among Practicing Lawyers in the United States, 29 Cap. U. L. Rev. 979 (2002); Martin E.P. Seligman et al., Why Lawyers are Unhappy, 23 Cardozo L. Rev. 33 (2001). 10. Keith A. Kaufman, V. Holland LaSalle-Ricci, Carol R. Glass, Diane B. Arnkoff, Passing the Bar Exam: Psychological, Educational, and Demographic Predictors of Success, 57 J. Legal Educ. 205 (2007); Stephen P. Klein and Roger Bolus, The Size and Source of Differences in Bar Exam Passing Rates Among Racial and Ethnic Groups. 66 The Bar Examiner 8 (1997).
4 Nicholas L. Georgakopoulos DRAFT
undergraduate grades to bar passage.11 The relation of choice of bar preparation course to bar passage is novel. The finding here that law school grades relate strongly to bar passage is consistent with some prior findings that law school grades relate strongly with bar passage12 and career success.13 The finding here that LSAT has a weak relation (albeit stronger than uGPA) with law school grades and bar passage is consistent with prior findings, including the finding that LSAT score is an imperfect predictor of law school performance.14
Previous studies have explored the effect of preparing law students for the bar through law school classes.15 Some tension may appear between their findings that bar preparation through law school courses is predictive of bar passage and the conclusion of this study that the choice of bar review has little consequence. Law school courses are fundamentally different than bar preparation courses. Law school courses are not lectures but involve interaction and guidance of the students, whereas bar preparation courses are primarily lectures. This realization resolves the conflict. The evidence here is strictly about bar-preparation-type instruction and
11. Cf. Clifford E. Lunneborg and Patricia W. Lunneborg, The Prediction of Different Criteria of Law School Performance, 26 Educ. & Psychol. Measurement 935 (1966); Phillips Cutright, Karen Cutright, and Douglass G. Boshkoff, Course Selection, Student Characteristics and Bar Examination Performance: The Indiana University Law School Experience, 27 J. Legal Educ. 127 (1975). 12. Stephen P. Klein and Roger Bolus, The Size and Source of Differences in Bar Exam Passing Rates Among Racial and Ethnic Groups, 66 The Bar Examiner 8 (1997) (GPA is three times more accurate than LSAT as a predictor of bar passage); see also Linda F. Wightman, LSAC National Longitudinal Bar Passage Study (Newtown, Pa., 1998) (finding GPA the most predictive of bar passage and then LSAT; not finding an effect of UGPA; finding 68% of the variation unexplained). By contrast, GPA and LSAT explain slightly over 40% of the variation in this sample leaving only 60% unexplained variation. 13. Richard H. Sander & Jane Bambauer, The Secret of My Success: How Status, Prestige and School Performance Shape Legal Careers (2010) working paper, available at http://papers.ssrn.com/sol3/papers.cfm?abstract_id=1640058 (visited May 5, 2013). 14. William D. Henderson, The LSAT, Law School Exams, and Meritocracy: The Surprising and Undertheorized Role of Test-Taking Speed, 82 Tex. L. Rev. 975 (2004). See also sources cited in note 12; cf. Donald E. Powers, Long-Term Predictive and Construct Validity of Two Predictors of Law School Performance, 74 J. Educ. Psychol. 568, 570 (1982) (comparing the predictive power of LSAT and undergraduate GPA and concluding that “LSAT mak[es] its greatest contribution in early [law school] years and UGPA in later years”). 15. Committee on Bar Admissions and Lawyer Performance and Richard A. White, AALS Survey of Law Schools on Programs and Courses Designed to Enhance Bar Examination Performance, 52 J. Legal Educ. 453 (2002); Derek Alphran, Tanya Washington, Vincent Eagan, Yes We Can, Pass the Bar. University of the District of Columbia, David A. Clarke School of Law Bar Passage Initiatives and Bar Pass Rates—From the Titanic to the Queen Mary!, 14 U. D.C. L. Rev. 9 (2011).

2013 BAR PASSAGE: GPA AND LSAT, NOT BAR REVIEWS 5
is not inconsistent with the idea that more law-school-course-type preparation may predict bar passage.
III. THE DATASET
The dataset consists of the graduates of the Indiana University Robert H. McKinney School of Law, Indianapolis, who took the Indiana bar examinations in the two sittings in 2012. The law school is in the second tier of the US News and World Report ranking of law schools, has a faculty reputation index slightly exceeding its ranking, has a legal writing program that is often ranked in the top ten, is very competitively priced to in-state applicants being a public law school, and compared to other similarly ranked law schools likely has a smaller capacity to offer scholarships to its students. It has a full-time and a part time program, with the full time students having somewhat better incoming credentials than part-time students. Students switch at will between full- and part-time during their study. This law school is part of an urban campus that combines the state’s land-grant university, Purdue University, and its liberal arts university, Indiana University, into Indiana University Purdue University Indianapolis (IUPUI). The campus has about 22 thousand undergraduate students, 8 thousand graduate students, and 2 thousand full-time academic staff. The urban nature of the campus means that part-time students often hold full time employment in businesses and government and bring that background to the classroom experience. Several students are foreign and several enroll for the first time as transfer students in upperclass years. The state has three other law schools, two ranked in the top tier that are somewhat smaller and do not offer part time programs and one ranked significantly lower than this law school. The McKinney School of Law has not significantly changed its grading policy or its graduation GPA requirement recently. Students are graded on the standard GPA scale from 0 to 416 with means (“”) in classes with 20 or more students of 3.1 and of 3.4 in smaller classes with a standard deviation (“”) of .6 in both cases. To graduate, students must have a GPA of 2.3 or above.
16. The possible GPA values of grades (and their letters) are 4(A), 3.7(A-), 3.3(B+), 3(B), 2.7(B-), 2.3(C+), 2(C), 1.7(C-), 1.3(D+), 1(D), and F(0).

6 Nicholas L. Georgakopoulos DRAFT
The data were collected by the law school’s office of the Dean of Students from the school’s records and the voluntary submission of enrollee lists by bar review courses to the school. They consist of several details for all graduates of this law school that include LSAT, undergraduate GPA (uGPA), law school GPA, first year law school GPA (1L GPA) if at the school, and outcome of the State Bar examination. The basic quantification of these graduates appears in table 1 with the sample’s descriptive statistics. These graduates have an average LSAT of 154 (σ=5.9) and an average undergraduate GPA of 3.4 (σ=.36), an average final law school GPA of 3.06 (σ=.35), and an average first year GPA of 2.97 (σ=.42).17 The deviation in LSAT scores and undergraduate GPAs may be larger than typical due to cost and location advantages of this school, which is inexpensive and the only law school in Indianapolis, a state-capital and the 12th largest United States city with a strong manufacturing and healthcare focus in its economy.
The data span two bar examinations, February and July of 2012, as well as the number of times each graduate has taken the bar exam. The data include the graduates’ choice of bar preparation course. The nationally dominant bar review course, BarBri, is present in three forms in the February subsample, its morning program, its evening program, and its online version. In the July subsample, BarBri appears as either “live” or online. This state also has a local competitor to BarBri, IndyBar Review, which did not further categorize its data. The state makes available its basic bar examination statistics online and they complement the data.18
The analysis focuses on two groups of graduates, those taking the bar for the first time and those taking the bar for the second time. The motivation for excluding the rest is that whatever relation bar passage may have to the graduates’ experience in law school, more than a year later it would be sufficiently weakened that drawing inferences would not be proper. An aspect of the data is consistent with this assumption. The relation of second-time takers’ performance on the bar to their credentials is much weaker
17. Differences from class statistics reported elsewhere are possible because the sample only includes the graduates who take the Indiana bar examination whereas other statistics account for all admitted students or all graduating students. 18. Indiana reports the statistics for its bar examination at http://www.in.gov/judi-ciary/ble/2360.htm (visited May 4, 2013) which also reports archived statistics since February 2002. The passing rate has not changed significantly in the last ten years.
2013 BAR PASSAGE: GPA AND LSAT, NOT BAR REVIEWS 7
than that of first time takers (see table 3 and contrast table 7 to 6 and figures 7 and 8 to 3 and 4).
IV. DESCRIPTIVE STATISTICS
The main features of the dataset appear in table 1. The school’s graduates taking these bar examinations are 309, com-prising 36% of the state’s exam takers, who are 866. This school’s proportion of exam takers is slightly larger in July, when it reaches 40% with 230 graduates out of 572 state candidates, and slightly lower in February, when it drops to 27% with 79 out of 294. Since other law schools in the state do not offer part-time programs, one may have expected the school’s graduates to form a smaller portion of the July examination, where full-time graduates should predo-minate, rather than February, which might attract disproportionately more part-time graduates. The opposite phenomenon appears. This school’s graduates form a greater fraction of the July than the February examination. A possible explanation is that other, full-time schools’ graduates take the Indiana bar examination as a second bar examination in February, after having taken a different bar examination first, the July after they graduate.
The differences of success rates and the qualifications of the graduates between those taking the bar for the first time and those taking it for the second time are not statistically significant but exhibit the expected selection bias. Second time takers have been selected for having failed their first bar exam. Compared to first time takers, second timers have a lower pass rate, 51.5% instead of 78.6%, a lower law school GPA, 2.84 instead of 3.15, lower 1L GPA, 2.74 instead of 3.07, lower LSAT, 151 instead of 155, and slightly lower undergraduate GPA, 3.34 instead of 3.41. Pronoun-ced as these differences may appear, they are not statistically significant.

Table 1. Descriptive statistics of the sample and the subsamples.
Entire Sample February '12 subsample July '12 subsample
N 309 State: 866 36% 79 State: 294 27% 230 State: 572 40% Avg St. D. Min. Max. N Avg St. D. Min. Max. N Avg St. D. Min. Max. N
GPA 3.06 0.35 2.33 3.92 299 2.88 0.33 2.33 3.71 70 3.11 0.34 2.35 3.92 229 LSAT 153.70 5.86 139 169 304 151.60 5.98 139 164 77 154.41 5.64 139 169 227 uGPA 3.39 0.36 2.37 4 306 3.35 0.37 2.49 3.91 77 3.40 0.36 2.37 4 229
1LGPA 2.97 0.42 1.94 3.97 286 2.82 0.43 1.94 3.77 77 3.02 0.41 2.00 3.97 209 Bar pass overall 71.52% State: 72% 58.23% State: 67% 76.09% State: 75%
Bar pass on 1st try 78.63% State: 80% 65.22% State: 76% 81.68% State: 81% GPA of 1st timers 3.15 0.32 2.42 3.92 238 3.04 0.31 2.57 3.71 37 3.17 0.32 2.42 3.92 201
LSAT - " - 154.57 5.59 139 169 245 151.80 6.40 139 164 45 155.20 5.19 141 169 200 uGPA - " - 3.41 0.35 2.37 4 248 3.40 0.32 2.78 3.87 46 3.41 0.36 2.37 4 202 1L GPA - " - 3.07 0.38 2 3.97 225 2.98 0.39 2.02 3.77 45 3.09 0.38 2 3.97 180
Bar pass on 2nd try 51.52% 56.25% 47.06% GPA of 2nd timers 2.84 0.25 2.43 3.59 33 2.85 0.23 2.43 3.27 16 2.84 0.26 2.49 3.59 17
LSAT - " - 151.19 5.63 139 160 32 153.40 5.33 143 160 15 149.24 5.14 139 156 17 uGPA - " - 3.34 0.39 2.64 3.91 31 3.32 0.47 2.64 3.91 14 3.35 0.32 2.66 3.85 17 1L GPA - " - 2.74 0.36 2.02 3.68 32 2.79 0.35 2.14 3.53 15 2.70 0.37 2.02 3.68 17
The school’s overall bar passage rate of 71.5% is barely distinguishable from that of the state, 72.3%. Again, the July figures are slightly different than February. In July the school’s graduates pass marginally more (with 76%) than the state experience (75%) while in February the school’s graduates pass less (58%) than the state (67%). (The pattern of a lower February overall passage rate than that in July repeats itself in the other years of the Indiana bar examination.) The success rates of first time takers exhibit the same patterns. The underlying pattern is that the school’s graduates perform equally well as the population in the July subsample but worse than the population in the February subsample. The fall ’11 graduates of the school compared to their cohort perform worse than those who graduated in the spring of ’12 compared to theirs.
The previous qualifications of the first-time bar-exam takers of these two groups have the same relationship, although again the differences are not statistically significant. The graduates taking the July ’12 bar examination for the first time have higher law school GPA, higher 1L GPA, and higher LSAT than those taking it in February.
The opposite pattern appears in second-time takers of the bar. Those taking the bar for the second time in July ’12 (who likely graduated in the Fall of ’11 and took the bar for the first time in February ’12) perform worse (passing at a 47% rate) than those taking the bar for the second time in February ’12 (who likely graduated in the spring of ’11, took their first bar exam in July ’11, and pass with a 56% rate).
The previous qualifications of the second-time takers exhibit differences that are consistent with the above pattern. The cohort taking the bar exam for the second time in July ’12 has lower 1L GPA and LSAT than that taking the exam for the second time in February. However, both groups of second timers have the same average law school GPA.
These differences are not statistically significant and may fade out in a larger sample. If not, a likely underlying pattern is one where this school’s regular-season graduates (who graduate in May or spring) perform better and have better qualifications than its off-season graduates compared to other schools. If further research pursues this issue, the salient question is identifying the source of this pattern, the reason that this school, despite having a significant part-time program, produces spring graduates with better qualifica-tions and bar passage prospects than fall graduates compared to
2 Nicholas L. Georgakopoulos DRAFT
other schools which, confoundingly, likely do not have part-time programs and, therefore, one would expect their students taking the February bar to have been adversely selected for failure in July. A possible explanation may be that other schools’ graduates disproportionately first take the bar exams of other jurisdictions the July after they graduate and then take the Indiana bar in February.
Table 2 shows the descriptive statistics of the first time ta-kers depending on which bar preparation course they take. The columns correspond to the choices of bar preparation courses: BarBri AM (in February) or Live (in July), BarBri online, BarBri PM (only offered in February), IndyBar, unknown, and none. Two options dominate, with most graduates (131 or 53%) choosing the slightly less expensive IndyBar compared to the daytime BarBri course (81 or 33%). A few (15 or 6%) students take the online BarBri and a few more (17 or 7%) are not included in the rolls of the bar preparation courses. After attempts to contact them, the few who answered had taken a bar preparation course. One student acknowledged not taking any bar preparation course to the Dean of Students before the collection of the data.
The fluctuation in the bar passage rates seems to stem mostly from the July subsample, because in the February subsample, the bar passage rates that correspond to all the preparation courses are very similar. While the differences are not statistically significant, the daytime BarBri course has the highest passage rate (85% overall and 87.5% in July) and the IndyBar the lowest (78% overall and 80% in July). The other qualifications (uGPA, LSAT, 1LGPA, and GPA) do not present any discernible patterns.
The rationale for the weak relation of law school performan-ce to bar passage in bar examinations subsequent to the first rever-ses when considering the effect of bar preparation courses. Since the influence of law school learning may fade, the influence of the bar preparation course may increase proportionately. This would argue that studying the 61 repeat takers would produce a clearer ranking of the effectiveness of bar preparation courses. However, almost two thirds of the repeat takers fall in the unknown category. In those who remain and contrary to the better results that BarBri has for first time takers, IndyBar produces a slightly higher passing rate. The difference is not statistically significant.

2013 BAR PASSAGE: GPA AND LSAT, NOT BAR REVIEWS 3
Table 2. Descriptive statistics of first time bar exam takers by bar prep course.
All First Time Takers: N: 248
BarBri
AM/Live BarBri OnLine
BarBri PM
IndyBar Unknwn None
N 81/33% 15/6% 3/1% 131/53% 17/7% 1
GPA 3.16 3.09 3.21 3.16 3.00 2.99
LSAT 155.31 154.00 157.00 154.19 154.38 149.00
uGPA 3.40 3.52 3.54 3.41 3.34 2.95
1LGPA 3.16 3.09 3.21 3.16 3.00 2.99
Bar Pass 85.19% 80.00% 66.67% 77.86% 58.82% 0.00%
February '12 subsample N: 46
N 9/20% 3/7% 3/7% 20/43% 11/24% 0
GPA 2.94 2.88 3.21 3.08 3.04 -
LSAT 150.56 149.33 157.00 150.15 155.40 -
uGPA 3.52 3.38 3.54 3.35 3.38 -
1LGPA 2.94 2.88 3.21 3.08 3.04 -
Bar Pass 66.67% 66.67% 66.67% 65.00% 63.64% -
July '12 subsample N: 202
N 72/36% 12/6% 0 111/55% 6/3% 1
GPA 3.17 3.15 - 3.18 2.94 2.99
LSAT 155.90 155.17 - 154.93 152.67 149.00
uGPA 3.38 3.56 - 3.42 3.26 2.95
1LGPA 3.17 3.15 - 3.18 2.94 2.99
Bar Pass 87.50% 83.33% - 80.18% 50.00% 0.00%
The sample undergoes three types of analysis. First, maxi-
mum likelihood probit regressions seek to identify the relation of bar passage to student grade point averages in law school and as undergraduates, and to their scores in the Law School Aptitude Test (LSAT). Second, ordinary least squares regressions explore the relationship between GPA, uGPA, and LSAT. Finally, chi-tests and regressions with dummy variables explore the consequence of the choice among bar preparation courses.
V. PROBIT REGRESSIONS OF BAR PASSAGE ON GPA, LSAT AND UGPA
Five probit models are applied to the graduates taking the bar exam, four to those taking the exam for the first time and one to
4 Nicholas L. Georgakopoulos DRAFT
those taking it for the second time.19 The dependent variable in all is bar passage. The explanatory variables are different combinations of law school GPA (“GPA”), LSAT score (“LSAT”), undergraduate GPA (“uGPA”), and first year GPA (“1L GPA”). When first year GPA is used, an upperclass GPA (‘UPgpa”) is calculated by inference and used instead of the overall GPA. The inference is possible because 1L GPA is about a third of that.
The estimation method is maximum likelihood. Table 3 reports the models and coefficient estimates of the five probit regressions underlying the analysis.
The graduates’ educational qualifications do not have explanatory power with regard to second-time bar exam takers. The last (fifth) column reports the results of the probit regression of the success of graduates taking the bar exam for the second time. The column’s label is “2nd w uGPA.” The independent variables are GPA, LSAT, and uGPA. No estimate of a coefficient is significantly different from zero. The variation in the rate of bar passage that the model explains is minimal as the pseudo R2 is under 8%.
All the other probit regression models examine success on the first bar exam. Law school GPA as an explanatory variable is included in all four models. The model reported by the column labelled “1st on GPA” (second column) examines the relation of bar passage to only GPA. While it produces statistical significance, the variation of the outcomes that GPA alone explains is less than that explained by the three more complex models that also include other explanatory variables. The pseudo R2 of the model using GPA alone is 33% while those of the more complex models are at 40%.
All the three more complex models include LSAT scores as a second explanatory variable. All three, therefore, relate bar success to GPA and LSAT. Two include a third variable. The third variable in one model is undergraduate GPA (uGPA) and in the other the third variable is 1L GPA. 19. The usual ordinary least squares linear regression analysis explores the relationships between one or more explanatory or independent variables and a resulting dependent variable when both take a range of values. The explanatory or independent variables, usually also take ranges of values but some may occasionally be binary, 0-1, yes-no, “dummy” variables. The linear regression is not appropriate for analyzing bar passage. The dependent variable is bar passage, which is binary rather than a value. Appropriate regression methods for binary dependent variables are the logistic regression and the probit regression. The probit regression rests on the ubiquitous normal distribution. This makes its results easier to restate in the more familiar terms and graphs of the normal distribution. Therefore, the analysis here proceeds with the probit regression.

2013 BAR PASSAGE: GPA AND LSAT, NOT BAR REVIEWS 5
The third variable in the probit model reported by the third column, labelled “1st w uGPA,” is the undergraduate GPA. Under-graduate GPA does not have any explanatory power in this sample.20
The last probit regression with a third independent variable is that of the fourth column, labeled “1st UPgpa 1LGPA” where the third variable is the GPA the graduates obtained during their first year of law school. An important caveat is that 1L GPA is about a third of the overall GPA. To avoid double-counting 1L GPA, the analysis infers the students’ exclusively upperclass GPA.21 The probit regression uses the inferred upperclass GPA (UPgpa) instead of the overall GPA. Both 1L GPA and upperclass GPA reach statistical significance at the 1% level but each detracts from the significance of the other, which is to be expected since they are strongly correlated (their correlation is 0.764). While both first year and upperclass GPA are statistically significant, the model brings minimal gains in explanatory power. The variation in the bar pass rate that this model explains, the pseudo R2 of 40.9%, barely ekes out that of the fist column, 40.2%.
All the probit models of first time bar success indicate that the estimates of the coefficients for the GPA and the LSAT have a statistically significant single-tailed difference from zero at a better than 0.1% confidence level (except when 1L GPA erodes that of upperclass GPA but even then they both maintain 1%-level confidence). All these models explain a significant fraction of the variation of bar passage rates. Pseudo R2 is over 40%. The analysis focuses on the probit models of the first column, “1st on GPA&LSAT,” and the fourth column, “1st UPgpa 1LGPA,” the probit regressions of first time bar passage on GPA and LSAT or on upperclass GPA, 1L GPA, and LSAT.
20. The result that undergraduate GPA has no explanatory power is in agreement with Wightman, supra note 12, but contrary to Douglas Rush and Hisako Matsuo, Does Law School Curriculum Affect Bar Examination Passage? An Empirical Analysis of Factors Related to Bar Examination Passage between 2001 and 2006 at a Midwestern Law School, 57 J. Legal Educ. 224 (2007). 21. Assuming that the first year receives about a third weight, the relation of UPgpa, 1LGPA and GPA is ( 1LGPA + 2 UPgpa ) / 3 = GPA. Solving for UPgpa gives UPgpa = (3 GPA – 1LGPA) / 2. Because some students begin as part-time students on a four-year track, for them 1L GPA is a quarter rather than a third of their final GPA and this calculation slightly overweighs their 1L GPA.

6 Nicholas L. Georgakopoulos DRAFT
Table 3. Probit regression models and results.
1st on
GPA&LSAT1st on GPA
1st w uGPA
1st UPgpa 1LGPA
2nd w uGPA
GPA estimate 3.292 3.379 3.317 1.644 1.488
st. err. 0.507 0.466 0.540 0.650 0.345
t-stat p-val 100.000% 100.000% 100.000% 99.395% 80.459%
LSAT estimate 0.089 0.089 0.092 0.039
st .err. 0.024 0.024 0.025 0.044
t-stat p-val 99.988% 99.988% 99.983% 80.459%
uGPA estimate -0.049 -0.001
st. err. 0.364 0.345
t-stat p-val 44.612% 49.900%
1LGPA estimate 1.469
st. err. 0.471
t-stat p-val 99.898%
Intercept estimate -22.843 -9.410 -22.741 -22.615 -10.011
st. err. 4.065 1.380 4.137 4.259 7.187
Method Probit ML Probit ML Probit ML Probit ML Probit ML
N 235 238 235 215 32
Pseudo R2 40.234% 33.490% 40.241% 40.927% 7.957%
A. Irrelevance of Undergraduate GPA
The probit regression model of the third column, “1st w uGPA,” sought to explain bar passage with three independent variables, undergraduate GPA, law school GPA, and LSAT score. However, the undergraduate GPA has no explanatory power. The estimate of its coefficient is essentially zero (-0.045) whereas its error is much larger (0.36). Undergraduate GPA has no predictive value for bar passage on the first try in the sample.
B. The Extraordinary Power of Law School GPA
The most striking result of the analysis is the accuracy with which the law school GPA predicts bar passage on the first try.22
22. Professor Silverstein has argued for inflating grades of law school by eliminating Cs. These data suggest that if this school had adopted such a measure without (a) increasing the graduation cutoff from 2.3; and (b) changing the number of gradations in the remaining grading range (without, for example, interjecting additional grades between B and A so as to recover the differentiation lost by the elimination of Cs) then it would have provided two types of disservice

2013 BAR PASSAGE: GPA AND LSAT, NOT BAR REVIEWS 7
This is visible in the probit models of the first and fourth columns but also in the simple frequency table 4. Graduates with a GPA below 2.6 pass the bar at a less than 10% rate, with two out of 21 students passing. Students with a GPA over 3.2 pass the bar at a well over 95% rate, with three graduates out of 110 failing.
Table 4. Frequencies of success at the first sitting for the bar exam.
Range: Passing: Actual Fraction (pass/all):
2.3-2.4 0% 0/2
2.4-2.5 14% 1/7
2.5-2.6 8% 1/12
2.6-2.7 21% 4/19
2.7-2.8 43% 9/21
2.8-2.9 47% 9/19
2.9-3 79% 15/19
3-3.1 74% 26/35
3.1-3.2 73% 16/22
3.2-3.3 94% 29/31
3.3-3.4 100% 20/20
3.4-3.5 100% 21/21
3.5-3.6 95% 21/22
3.6-3.7 100% 8/8
3.7-3.8 100% 6/6
3.8-3.9 100% 1/1
3.9-4 100% 1/1
The extraordinary power of GPA to predict bar passage diminishes dramatically for graduates taking the bar for a second time. The second time takers are significantly fewer in number. As a corollary of the high success rate of graduates with GPAs above 3.2 on their first try, very few such graduates appear in this subsample. The success rates, however, do not change nearly as fast
to its students and the bar. The school would have graduated many more students who wouldn’t have a realistic chance of passing the bar, and the school would have eroded the ability of GPA to predict bar passage (more generally, the school would have diluted the value of the GPA signal). A diluted GPA signal would make ranking errors more likely: the phenomenon of a weaker student obtaining a greater GPA than a stronger student would become more likely. Of the employers who interview at this law school, none use a GPA cutoff to determine which students they will interview; they only use ranking. Cf Joshua M. Silverstein, A Case for Grade Inflation in Legal Education, 47 U.S.F.L. REV. 487 (2013) (advocating the elimination of C grades but also advocating a concurrent increase of the graduation hurdle and the addition of intermediate grades).
8 Nicholas L. Georgakopoulos DRAFT
as in the subsample of first-time takers. From GPAs of 2.5 to GPAs of 3.1, success rates hover about 50%.
Table 5. Frequencies of success at the second sitting for the bar exam.
Range: Passing: Actual Fraction (pass/all):
2.3-2.5 0% 0/2
2.5-2.7 56% 5/9
2.7-2.9 45% 5/11
2.9-3.1 50% 3/6
3.1-3.3 75% 3/4
3.3-3.5 - 0/0
3.5-3.7 100% 1/1
3.7-4.0 - 0/0
Figures 1 and 2 illustrate the estimated bar passage probabilities indicated by the normal distributions of the probit model of column 1 of table 3, “1st by GPA&LSAT.” Figure 1 shows bar passage probability by GPA. It plots three normal distribution cumulative probability functions. The middle one uses an LSAT that corresponds to the sample average (154.6). The other two use LSATs one standard deviation below (149) and one above (160.2). GPA, on the horizontal axis, ranges from 2.3 (the graduation hurdle) to 4 (the maximum possible). The vertical axis represents pass rate on bar exam, from 0% to 100%. A graduate with the average LSAT who barely graduates (i.e., receives a 2.3 GPA) has under 10% predicted probability of passing the bar but over 90% if graduating with a GPA over 3.15. A graduate with a relatively high LSAT score, one standard deviation above average, i.e., 160, if barely graduated, still has only 20% probability of passing the bar and exceeds 90% by obtaining a GPA over 2.97. A graduate with a low LSAT score, one standard deviation below average, i.e., 149, if barely graduated, has an under 3% probability of passing the bar but exceeds 90% by obtaining a GPA over 3.3.

2013 BAR PASSAGE: GPA AND LSAT, NOT BAR REVIEWS 9
Figure 1. Probit prediction of bar passage at the first try by GPA for three LSAT scores.
0%
10%
20%
30%
40%
50%
60%
70%
80%
90%
100%
2.3 2.4 2.5 2.6 2.7 2.8 2.9 3 3.1 3.2 3.3 3.4 3.5 3.6 3.7 3.8 3.9 4
160 (+1σ) 154 (avg) 149 (-1σ)LSAT:
While both GPA and LSAT reach statistical significance in explaining bar passage rates, LSAT presents a weaker effect.
C. The Attenuated Power of LSAT
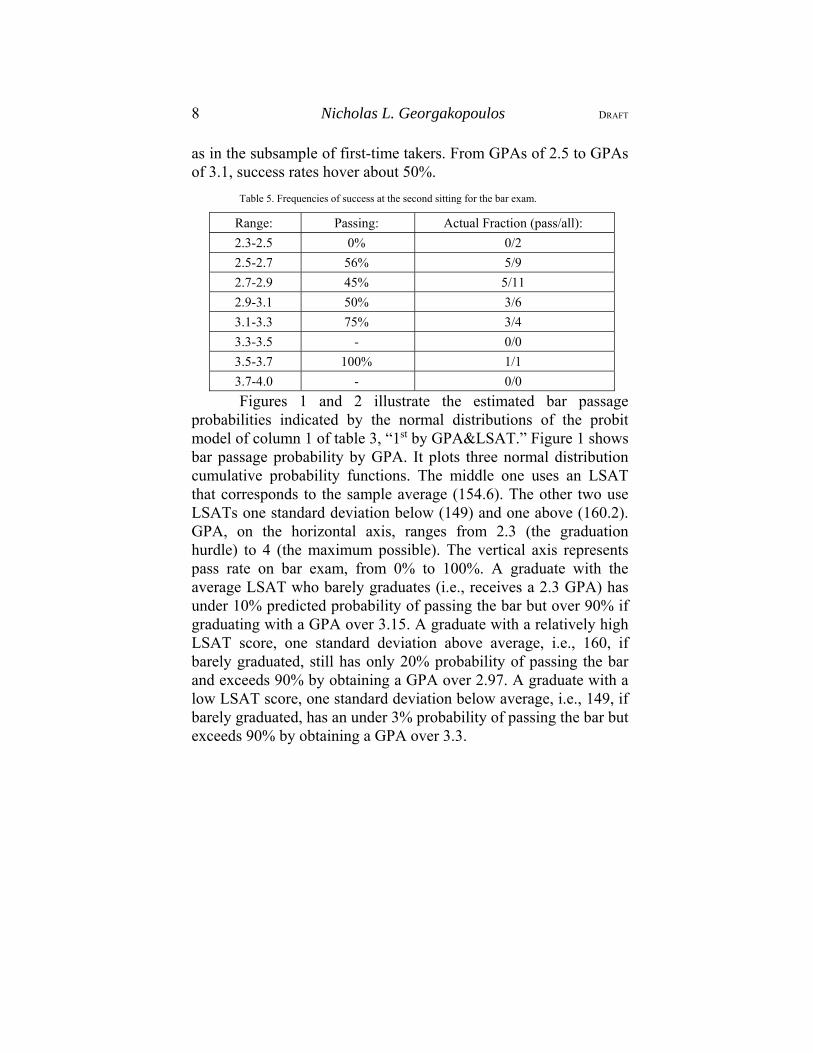
Figure 2 shows bar passage probability by LSAT following the same principles of the previous figure. It plots three normal distributions. The middle one uses a GPA that corresponds to the sample average (3.15). The other two use GPAs one standard deviation above (3.47) and one below (2.83). LSAT, on the horizontal axis, ranges from 139 (the minimum at this law school) to 170. The vertical axis again represents pass rate, from 0% to 100%. A graduate with the average GPA with the lowest LSAT of 139 has a little under 50% predicted probability of passing the bar but over 90% if having an LSAT of 154. A graduate with a high GPA, one standard deviation above average, i.e., 3.47, even if with the worst LSAT of 139, has an almost 85% probability of passing the bar and exceeds 90% if LSAT was over 142. A graduate with a low GPA, one standard deviation below average, i.e., 2.83, if having the bad LSAT of 139, has an under 14% probability of passing the bar and exceeds 90% if LSAT was 166 or more.
The comparatively mild influence of LSAT is apparent by the reduced speed by which the predicted bar passage probability increases as LSAT increases compared to GPA in the previous figure.
10 Nicholas L. Georgakopoulos DRAFT
Figure 2. Probit prediction of bar passage at the first try by LSAT for three GPA scores.
0%
10%
20%
30%
40%
50%
60%
70%
80%
90%
100%
139 144 149 154 159 164 169
3.47 (+1σ) 3.14 (avg) 2.83 (‐1σ)GPA:
The different effects that LSAT and GPA have are open to interpretation. One might argue that law school exams are merely more similar to bar exams than the LSAT is. However, the variation of the types of performance on which law school grades are based (in-class and take-home essay exams, in-class multiple choice exams, research papers, legal writing assignments, and clinical courses) and the variation of performance required at the bar exam (research and writing in the multi-state performance exam, multiple-choice analysis questions in the multi-state bar exam, and essay answers in the state component) suggest that both law school grading and the bar examination are quite multifaceted. This undermines the notion of accidental similarity. To the extent that multifaceted similarity exists, it likely is the result of intentional design of the bar exam to test the candidates on these skills and the law school to teach them (arguably because both consider that these skills correlate with good lawyering). If this hypothesis holds, then the fact that the law school succeeds in arming the students with these skills is consistent with the students’ needs for the bar exam and for legal practice and is, therefore, laudable.
A possible (and consistent with the above) interpretation would consider LSAT correlated with natural skill or reasoning and GPA correlated with learned legal reasoning and performance.23
23. The opposite is also possible, that LSAT scores are the result of learning while law school performance measures innate talent. The variety of law school instruction and the changes in grades depending on work make this the less intuitive interpretation.

2013 BAR PASSAGE: GPA AND LSAT, NOT BAR REVIEWS 11
This interpretation would turn the results to bear on the nature versus nurture debate. From this perspective and in the case of bar exam passage in this sample, nurture dominates nature as a predictor of bar passage.
D. The Relevance of Upperclass GPA
Particularly interesting is the phenomenon that 1L GPA and upperclass GPA are both statistically significant in explaining bar passage. Granted, both are components of law school GPA, but they have significant differences. Students follow a predetermined course of study in the first year, while upperclass courses are in their vast majority electives. First year courses tend to be large (with the exception of legal writing). Several first year courses are year-long, continuing into the second semester. Upperclass courses are smaller, and many have the size of a seminar. First year courses produce an average grade of 3.1 (the school curve requires that grading produce a mean between 2.9 and 3.1 in large courses). Small courses produce an average grade near 3.4. Finally, the upperclass GPA includes research paper grades, legal writing grades, and clinical course grades.
The concern, therefore, is that students may select upper-class courses for easy grades rather than educational strategy and preference for legal specialty. Causation, however, may easily run in the opposite direction. Students may obtain higher grades in upperclass years because they take courses that they enjoy or in which they intend to specialize, and therefore perform better than in a prescribed curriculum. A corollary is that students not only score better in courses that they choose but that students learn better in the courses that they choose and are smaller compared to mandated and larger courses.
To attempt to interpret the results, compare three theories of upperclass grades: shopping, inflation, and learning. According to the shopping theory, students who need to raise their GPA determine which upperclass courses give easy grades and take those. According to the inflation theory, upperclass courses cease to distinguish significantly among students and give high grades to most. According to the learning theory, students who significantly raise their GPA in upperclass courses do so because the likely small size of the classes and the fact that the student selected the class,

12 Nicholas L. Georgakopoulos DRAFT
which may indicate student interest or motivation, combine to produce a better educational outcome for the student.
The three theories have different implications for the relation of bar passage to upperclass GPA and 1L GPA and for the correlation between 1L GPA and upperclass GPA. If what drives upperclass course selection is easy grading, then, holding 1L GPA constant, upperclass GPA would not increase bar passage and may even reduce it. 1L GPA would be positively related to bar passage and very likely be much more strongly predictive than upperclass GPA, the effect of which may be even negative. Moreover, the correlation between 1L GPA and UPgpa would likely be negative or very weak.
If upperclass grades are mere grade inflation, then the higher grades that students earn in upperclass courses would produce little learning and would have little effect on bar passage. Under this hypothesis, we should expect to see a weak relation, if any, between upperclass GPA and bar passage; 1L GPA would capture most of the relation of grades to bar passage. The correlation between 1L GPA and UPgpa should be very weak.
Finally, if student preferences result in choice of courses that produce a better education for the students, then, despite the greater upperclass grades, we should expect to observe upperclass GPA having a positive relation to bar passage. Both upperclass and 1L GPA would be positively related to bar passage. The 1L GPA and UPgpa would show strong correlation.
The data show upperclass GPA increases bar passage very strongly. Also, the correlation of 1L GPA with UPgpa is .764, quite strong. Therefore, the data are inconsistent with the first two theories, shopping and inflation. The third, that students learn more in electives, is fully consistent with the data. The educational policy implication of adopting the third theory favors elective courses and weakens the rationale for adhering to the mandatory nature of the first year curriculum.
VI. LINEAR REGRESSIONS OF GPA ON LSAT AND UGPA
The strong predictive power of GPA for bar passage is an important finding. However, the interpretation of its power depends on its relation with the other variables that law schools use for admissions, undergraduate GPA and LSAT. Linear OLS regressions explore these relations.
2013 BAR PASSAGE: GPA AND LSAT, NOT BAR REVIEWS 13
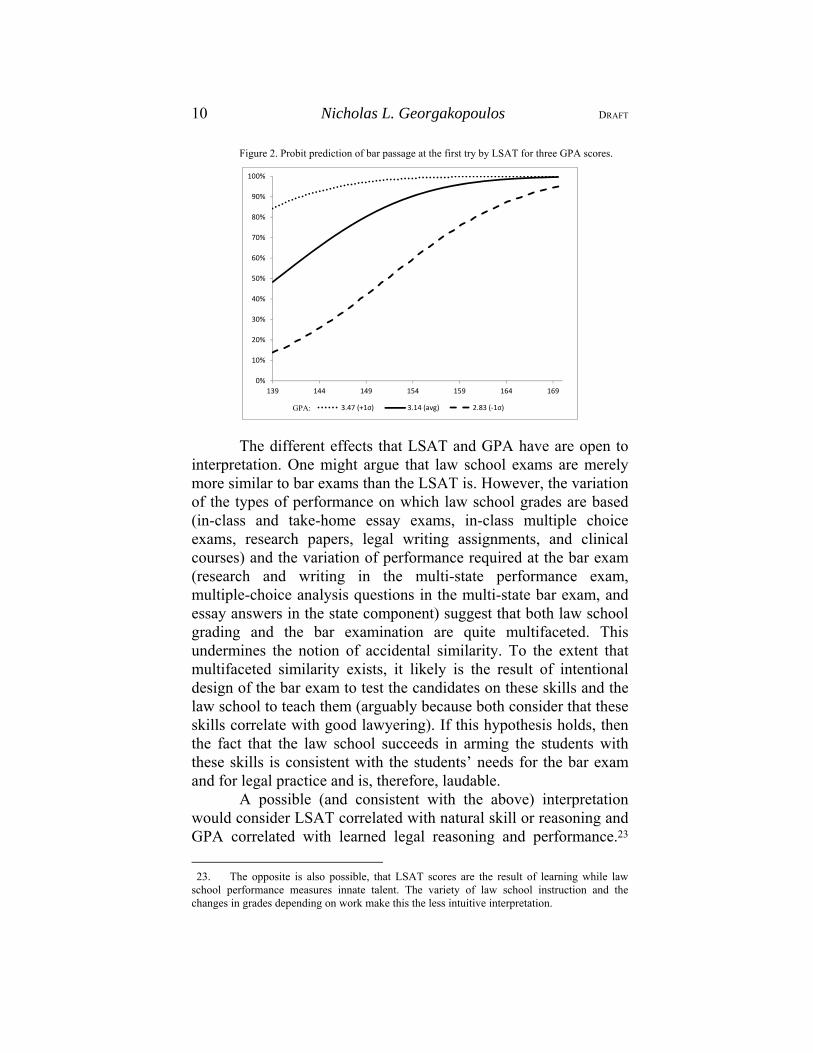
Table 6. OLS models of regressions of 1st time bar takers’ GPA on LSAT and uGPA.
LSAT uGPA Both LSAT estimate 0.020 0.298
st.err. 0.003 0.052 t-stat p-val 100.00% 100.00%
UGPA estimate 0.3164 0.0186 st.err. 0.0558 0.0033 t-stat p-val 100.00% 100.00%
Intercept estimate 0.114 2.068 -0.745 st. err. 0.541 0.191 0.530
Std. error of estimate: 0.301 0.303 0.283 Method OLS OLS OLS
N 235 238 235 R2 11.9% 12.0% 22.7% Fstat p-val: 0.000006% 0.000004% 0.000002%
Table 6 reports the result of three OLS regression models. The final law school GPA is the dependent variable in all models. Explanatory variables are LSAT, undergraduate GPA, or both. Due to the large number of observations, the regressions produce strong statistical confidence that LSAT and uGPA increase GPA. However, the variation of the outcome that the models explain is low. When one independent variable is used the models explain 12% of the variation (R2 is 11.9% and 12%). When regressing GPA on both variables, in the last column, the model explains 23% of the observed variation of GPA (R2 is 22.7%). The inaccuracy of the GPA that the models predict is also reflected in the standard error of the estimated GPA, which is about .3 in all models. In other words, if given a student’s LSAT and uGPA the model predicts a law GPA of 3.0, the 95% confidence interval for this student’s predicted GPA starts at 2.4 and reaches 3.6. At one end passing the bar is a less than 10% proposition and at the other more than 99%.
A. The Noisy Prediction of Law GPA
The linear regression models explain little of the variation of law school GPA and predict it with a large error. Consider, howe-ver, the inputs of those regressions: undergraduate GPA and LSAT. Those are virtually the only quantitative measures that law schools
14 Nicholas L. Georgakopoulos DRAFT
use to guide their admission decisions. Granted, they predict law school GPA but not nearly as accurately as one would like. Essen-tially, success in law school is quite different than what either of these variables measure. LSAT attempts to measure reasoning ability but is revealed to be weakly related to legal reasoning. Undergraduate GPA may measure organizational capacity, skill in the undergraduate field of study, and commitment. Again, those are weakly related to success in law school.
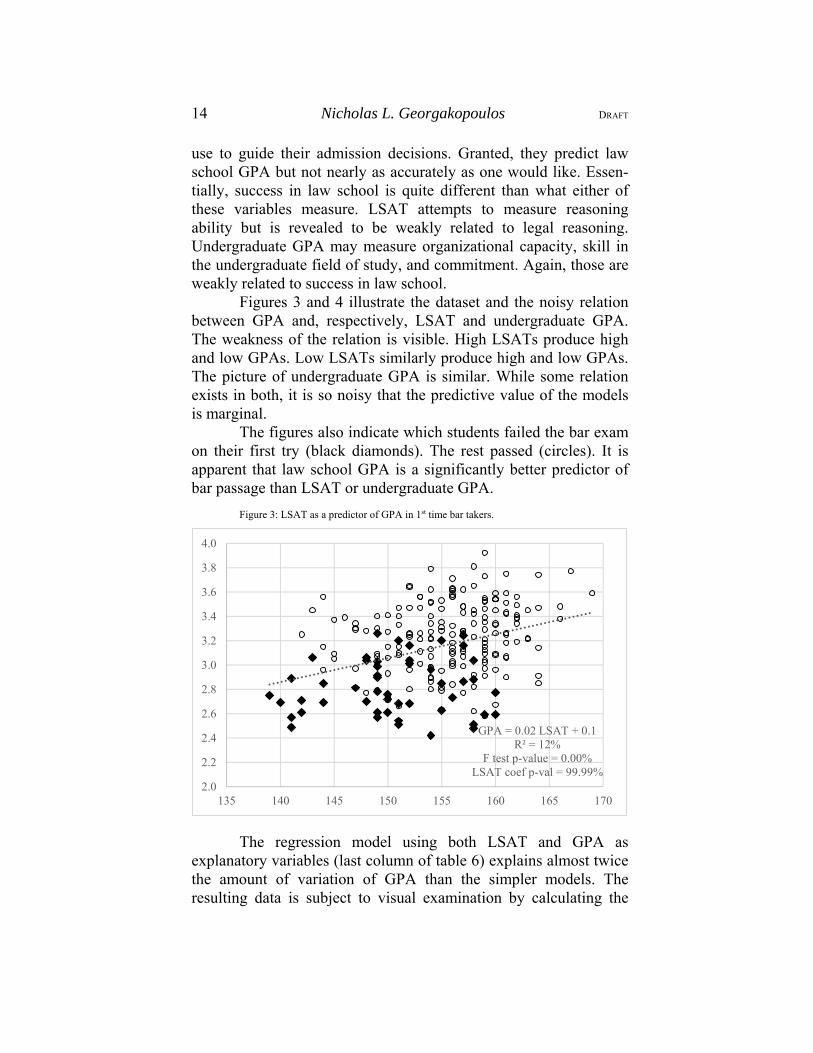
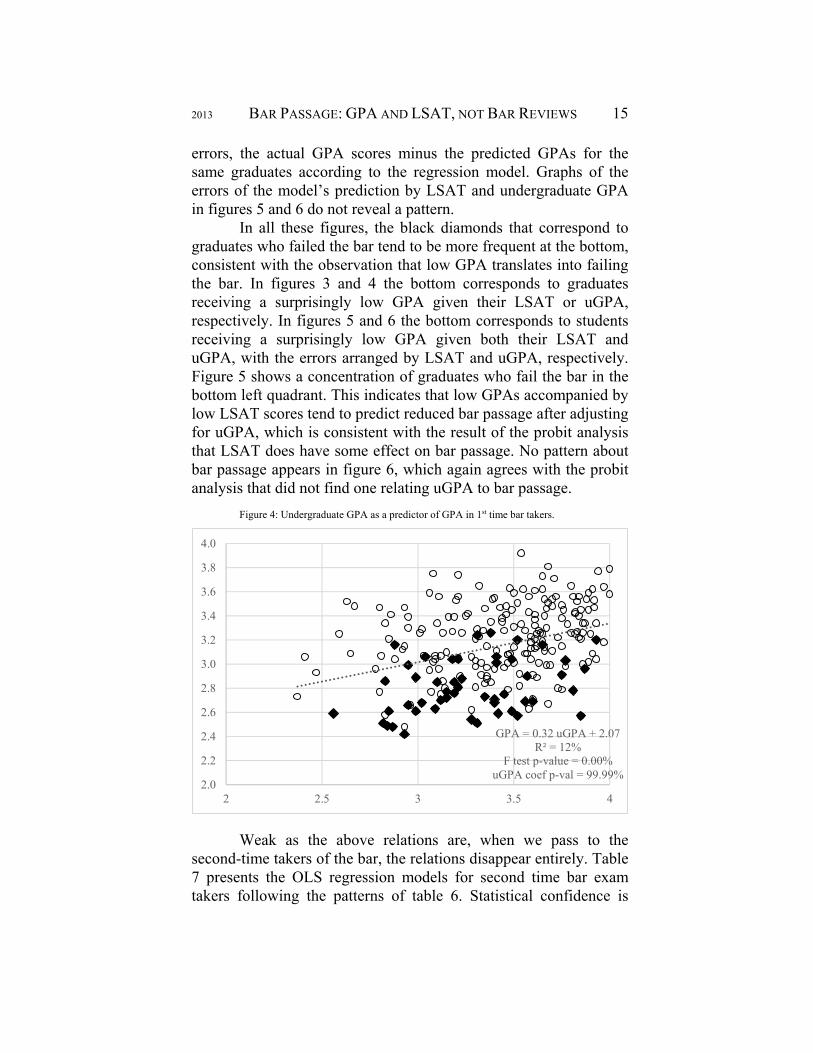
Figures 3 and 4 illustrate the dataset and the noisy relation between GPA and, respectively, LSAT and undergraduate GPA. The weakness of the relation is visible. High LSATs produce high and low GPAs. Low LSATs similarly produce high and low GPAs. The picture of undergraduate GPA is similar. While some relation exists in both, it is so noisy that the predictive value of the models is marginal.
The figures also indicate which students failed the bar exam on their first try (black diamonds). The rest passed (circles). It is apparent that law school GPA is a significantly better predictor of bar passage than LSAT or undergraduate GPA.
Figure 3: LSAT as a predictor of GPA in 1st time bar takers.
GPA = 0.02 LSAT + 0.1R² = 12%
F test p-value = 0.00%LSAT coef p-val = 99.99%
2.0
2.2
2.4
2.6
2.8
3.0
3.2
3.4
3.6
3.8
4.0
135 140 145 150 155 160 165 170
The regression model using both LSAT and GPA as explanatory variables (last column of table 6) explains almost twice the amount of variation of GPA than the simpler models. The resulting data is subject to visual examination by calculating the
2013 BAR PASSAGE: GPA AND LSAT, NOT BAR REVIEWS 15
errors, the actual GPA scores minus the predicted GPAs for the same graduates according to the regression model. Graphs of the errors of the model’s prediction by LSAT and undergraduate GPA in figures 5 and 6 do not reveal a pattern.
In all these figures, the black diamonds that correspond to graduates who failed the bar tend to be more frequent at the bottom, consistent with the observation that low GPA translates into failing the bar. In figures 3 and 4 the bottom corresponds to graduates receiving a surprisingly low GPA given their LSAT or uGPA, respectively. In figures 5 and 6 the bottom corresponds to students receiving a surprisingly low GPA given both their LSAT and uGPA, with the errors arranged by LSAT and uGPA, respectively. Figure 5 shows a concentration of graduates who fail the bar in the bottom left quadrant. This indicates that low GPAs accompanied by low LSAT scores tend to predict reduced bar passage after adjusting for uGPA, which is consistent with the result of the probit analysis that LSAT does have some effect on bar passage. No pattern about bar passage appears in figure 6, which again agrees with the probit analysis that did not find one relating uGPA to bar passage.
Figure 4: Undergraduate GPA as a predictor of GPA in 1st time bar takers.
GPA = 0.32 uGPA + 2.07R² = 12%
F test p-value = 0.00%uGPA coef p-val = 99.99%
2.0
2.2
2.4
2.6
2.8
3.0
3.2
3.4
3.6
3.8
4.0
2 2.5 3 3.5 4
Weak as the above relations are, when we pass to the second-time takers of the bar, the relations disappear entirely. Table 7 presents the OLS regression models for second time bar exam takers following the patterns of table 6. Statistical confidence is

16 Nicholas L. Georgakopoulos DRAFT
absent and the amount of GPA variation that the models explain is trivial, under 5%.
Figures 7 and 8 replicate the figures 3 and 4 for second-time bar exam takers. No patterns appear.
Table 7. Models of OLS regressions of 2nd time bar takers’ GPA on LSAT and uGPA.
LSAT uGPA Both LSAT estimate 0.006 0.009
st.err. 0.008 0.008 t-stat p-val 77.49% 86.51%
UGPA estimate -0.0200 -0.0101 st.err. 0.1147 0.1145 t-stat p-val 43.15% 46.50%
Intercept estimate 1.945 2.929 1.502 st. err. 1.189 0.386 1.324
Std. error of estimate: 0.250 0.251 0.250 Method OLS OLS OLS
N 32 31 31 R2 1.9% 0.1% 4.4% Fstat p-val: 45.02% 86.31% 42.73%
This disconnect between credentials and bar passage that the subsample of second time takers produces is striking and puzzling. Failing the bar on the first sitting appears to relate strongly with the lack of relations between GPA, LSAT, and uGPA. Exploring and explaining this would be a fruitful avenue for further research. A plausible interpretation is that a large fraction of these graduates internalized legal analysis less than their uGPA and LSAT would predict, and now also pass the bar less than their law GPA would predict. Perhaps they are hard workers—taking the bar a second time is no picnic, after all—or have some other ability that helps their law GPA while masking their reduced legal analytical toolset (perhaps rhetorical or writing skill or recall of much precedent), so their GPA is less predictive than expected. As a result they also fail their first attempt to pass the bar, and likely their second. If this theory is correct, what these graduates need to pass the bar is not more of the memorization that bar preparation courses provide but a return to the law school classroom for strengthening their legal analysis.

Figure 5. GPA prediction error (actual minus prediction) against LSAT, 1st time takers.
-1.0
-0.8
-0.5
-0.3
0.0
0.3
0.5
0.8
1.0
139 144 149 154 159 164 169
Figure 6. GPA prediction error (actual minus prediction) against uGPA, 1st time takers.
-1.0
-0.8
-0.5
-0.3
0.0
0.3
0.5
0.8
1.0
2 2.5 3 3.5 4
Figure 7. LSAT as a predictor of GPA in 2nd time bar exam takers.
2.0
2.2
2.4
2.6
2.8
3.0
3.2
3.4
3.6
3.8
4.0
135 140 145 150 155 160 165 170
Figure 8. Undergraduate GPA as a predictor of GPA in 2nd time bar exam takers.
2.0
2.2
2.4
2.6
2.8
3.0
3.2
3.4
3.6
3.8
4.0
2 2.5 3 3.5 4
18 Nicholas L. Georgakopoulos DRAFT
VII. ANALYSIS OF BAR PREPARATION COURSES
Bar preparation courses train graduates to take the bar examination. They have an approximately two month duration and occur after graduation, from mid May to mid July for the July bar exam, and from mid December to mid February for the February bar exam. The bar review courses offer the student a quick and intense study of the topics covered by the bar examination. Graduates who attend the courses obtain study materials and spend a few hours each day observing a lecture, live, on tape, or online.
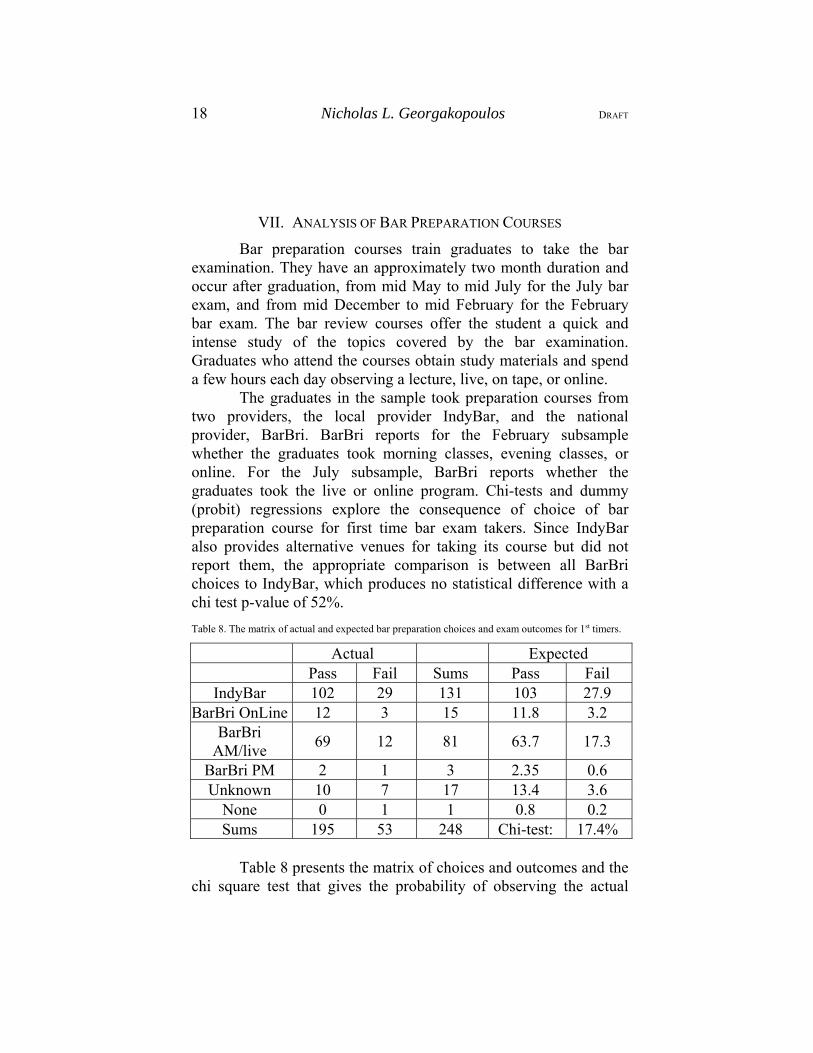
The graduates in the sample took preparation courses from two providers, the local provider IndyBar, and the national provider, BarBri. BarBri reports for the February subsample whether the graduates took morning classes, evening classes, or online. For the July subsample, BarBri reports whether the graduates took the live or online program. Chi-tests and dummy (probit) regressions explore the consequence of choice of bar preparation course for first time bar exam takers. Since IndyBar also provides alternative venues for taking its course but did not report them, the appropriate comparison is between all BarBri choices to IndyBar, which produces no statistical difference with a chi test p-value of 52%.
Table 8. The matrix of actual and expected bar preparation choices and exam outcomes for 1st timers.
Actual Expected Pass Fail Sums Pass Fail
IndyBar 102 29 131 103 27.9 BarBri OnLine 12 3 15 11.8 3.2
BarBri AM/live
69 12 81 63.7 17.3
BarBri PM 2 1 3 2.35 0.6 Unknown 10 7 17 13.4 3.6
None 0 1 1 0.8 0.2 Sums 195 53 248 Chi-test: 17.4%
Table 8 presents the matrix of choices and outcomes and the
chi square test that gives the probability of observing the actual
2013 BAR PASSAGE: GPA AND LSAT, NOT BAR REVIEWS 19
outcomes by chance, here if all bar preparation courses produced the same 78% success rate as this subsample. Differences hardly exist between the predicted and the actual outcomes. Only BarBri AM/live does a little better than expected and the unknown group a little worse. The difference does not reach statistical significance. The same result arises from applying the chi test to the choices and bar exam outcomes of second time takers of the bar exam and all non-first-time takers.
A probit repression using dummy variables confirms this result. The model seeks to explain bar passage by GPA, LSAT, and bar preparation dummies for any BarBri and for IndyBar (but no dummy variables for unknown and none).24 The probit regression favors BarBri but without statistical significance. To translate the probit coefficient into changes in the probability of passing the bar requires one to posit a GPA and LSAT. A student with average GPA and LSAT (3.14 and 154.6), receives a 6% boost in the probability of passing the bar from IndyBar (from 88% to 94%) whereas the same student receives a 12% boost from BarBri (from 86% to 98%). Without varying LSAT, the maximum of the difference of the effect that the probit analysis predicts occurs at a GPA of 2.69, at which value BarBri boosts passage probability by 35% (from 29% to 65% after rounding) whereas IndyBar boosts it by 16% (from 35% to 50% after rounding), a 19% difference.
An interesting further extrapolation from the weak relevance of the choice among bar preparation courses exists and further research should explore it. The premise is that bar review courses are unlikely to be identical. BarBri uses national teaching talent while IndyBar uses local instructors. Evening and online courses do not use live instruction while some daytime classes do have live instruction. Evening and online courses may correlate with distractions from employment or family more than daytime courses. If these differences were significant, then the choice of bar
24. The resulting coefficients (standard errors and t-test p-values for difference from zero in parentheses) are GPA 3.5 (.5, 99.9999%), LSAT .09 (.02, 99.99%), IndyBar .4 (.4, 83%); BarBri .9 (.4, 98%). BarBri has a statistically significant difference from zero but it is not statistically different from IndyBar because their difference is smaller than their standard errors. Observations number 235 and the pseudo R2 is .428. Compare this R2 to the one that the first model of table 3 which is .402. Including the bar preparation choice only increased the fraction of the variation that the model predicts by 2.6% and much of this power is coming from the difference between the graduates with an unknown preparation (possibly none) and those who do have an indication of bar preparation course choice. An unreported probit regression using a single dummy for any preparation course produces a pseudo R2 of .412, showing that differentiating between preparation courses only increases the R2 by 1.6%.
20 Nicholas L. Georgakopoulos DRAFT
preparation course should have consequences for bar passage but those fade compared to law school GPA. Instead, law school GPA has the leading relation to bar passage.
One might question the conclusion of the importance of in-class teaching on the basis that perhaps the strong results from in-class teaching is an idiosyncrasy of the Indiana bar examination, while other bar examinations may not depend as much on in-class teaching but more on bar preparation material. This doubt is weakened by the fact that bar passage depends strongly on the multi-state components of the bar exam, which are nationally administered and common for all states. Indiana weighs the multi-state components of the bar exam as 70% of the total.25 The heavy weighing of the multi-state components undermines the notion that the Indiana examination may rely on in-class instruction in an unusual way. The importance of the multi-state components should also produce an advantage for the national provider of bar preparation, BarBri, if bar preparation was significant in determining bar passage.
Therefore, a likely interpretation is that bar preparation is an activity where the quality or style of instruction has relatively little consequence for passing the bar, whereas law school instruction has significant impact. This interpretation would be consistent with the notion that bar preparation is rote memorization and stands in contrast to the learning of legal analysis in law school, which seems to be what makes the difference in passing the bar examination.
VIII. CONCLUSION: NURTURE AND LEGAL ANALYSIS RATHER
THAN NATURE AND MEMORIZATION
The victor of this analysis, especially if corroborated by similar studies in other jurisdictions, is legal instruction in small elective classes. Law school GPA relates strongly with bar passage. LSAT, which may plausibly relate to innate ability, has a much noisier relation to bar passage. Undergraduate GPA has no significant effect. The choice among bar preparation courses also has no significant consequence, undermining the concept that students may need better memorization and suggesting that students failing the bar may be best served by taking more law school
25. See Indiana Judicial Branch, Board of Law Examiners, Bar Exam Information, available at http://www.in.gov/judiciary/ble/2363.htm (visited May 5, 2013).
2013 BAR PASSAGE: GPA AND LSAT, NOT BAR REVIEWS 21
courses. The importance of upperclass GPA undermines claims of grade inflation and strategic shopping for high grades by students. Legal education emerges from this analysis not merely unscathed but strengthened. The data only question the adherence to the Langdelian first year structure and open the possibility that making the first year more flexible with electives may improve student education.


![[MS-LSAT]: Local Security Authority (Translation Methods ...pirate-network.com/data/Windows_Server_Protocols/[MS-LSAT].pdf · 1 / 82 [MS-LSAT] - v20160714 Local Security Authority](https://img.dokumen.tips/doc/110x75/5eab229d83e6d838411d838b/ms-lsat-local-security-authority-translation-methods-pirate-ms-lsatpdf.jpg)