Embed Size (px)
Citation preview

Ernst & Young LLP
C O N S O L I D A T E D F I N A N C I A L S T A T E M E N T S
Banner Health and Subsidiaries Years Ended December 31, 2020 and 2019 With Report of Independent Auditors
2009-3583569
Banner Health and Subsidiaries
Consolidated Financial Statements
Years Ended December 31, 2020 and 2019
Contents
Report of Independent Auditors.......................................................................................................1
Consolidated Financial Statements
Consolidated Balance Sheets ...........................................................................................................3 Consolidated Statements of Income .................................................................................................5 Consolidated Statements of Changes in Net Assets ........................................................................6 Consolidated Statements of Cash Flows ..........................................................................................7 Notes to Consolidated Financial Statements ....................................................................................8
A member firm of Ernst & Young Global Limited
Ernst & Young LLP 101 E. Washington Street Suite 910 Phoenix, AZ 85004
Tel: +1 602 322 3000 ey.com
2009-3583569 1
Report of Independent Auditors
The Board of Directors Banner Health
We have audited the accompanying consolidated financial statements of Banner Health and Subsidiaries, which comprise the consolidated balance sheets as of December 31, 2020 and 2019, and the related consolidated statements of income, changes in net assets and cash flows for the years then ended, and the related notes to the consolidated financial statements.
Management’s Responsibility for the Financial Statements
Management is responsible for the preparation and fair presentation of these financial statements in conformity with U.S. generally accepted accounting principles; this includes the design, implementation and maintenance of internal control relevant to the preparation and fair presentation of financial statements that are free of material misstatement, whether due to fraud or error.
Auditor’s Responsibility
Our responsibility is to express an opinion on these financial statements based on our audits. We conducted our audits in accordance with auditing standards generally accepted in the United States. Those standards require that we plan and perform the audit to obtain reasonable assurance about whether the financial statements are free of material misstatement.
An audit involves performing procedures to obtain audit evidence about the amounts and disclosures in the financial statements. The procedures selected depend on the auditor’s judgment, including the assessment of the risks of material misstatement of the financial statements, whether due to fraud or error. In making those risk assessments, the auditor considers internal control relevant to the entity’s preparation and fair presentation of the financial statements in order to design audit procedures that are appropriate in the circumstances, but not for the purpose of expressing an opinion on the effectiveness of the entity’s internal control. Accordingly, we express no such opinion. An audit also includes evaluating the appropriateness of accounting policies used and the reasonableness of significant accounting estimates made by management, as well as evaluating the overall presentation of the financial statements.
We believe that the audit evidence we have obtained is sufficient and appropriate to provide a basis for our audit opinion.
A member firm of Ernst & Young Global Limited
2009-3583569 2
Opinion
In our opinion, the financial statements referred to above present fairly, in all material respects, the consolidated financial position of Banner Health and Subsidiaries at December 31, 2020 and 2019, and the consolidated results of their operations and their cash flows for the years then ended in conformity with U.S. generally accepted accounting principles.
March 15, 2021
2020 2019
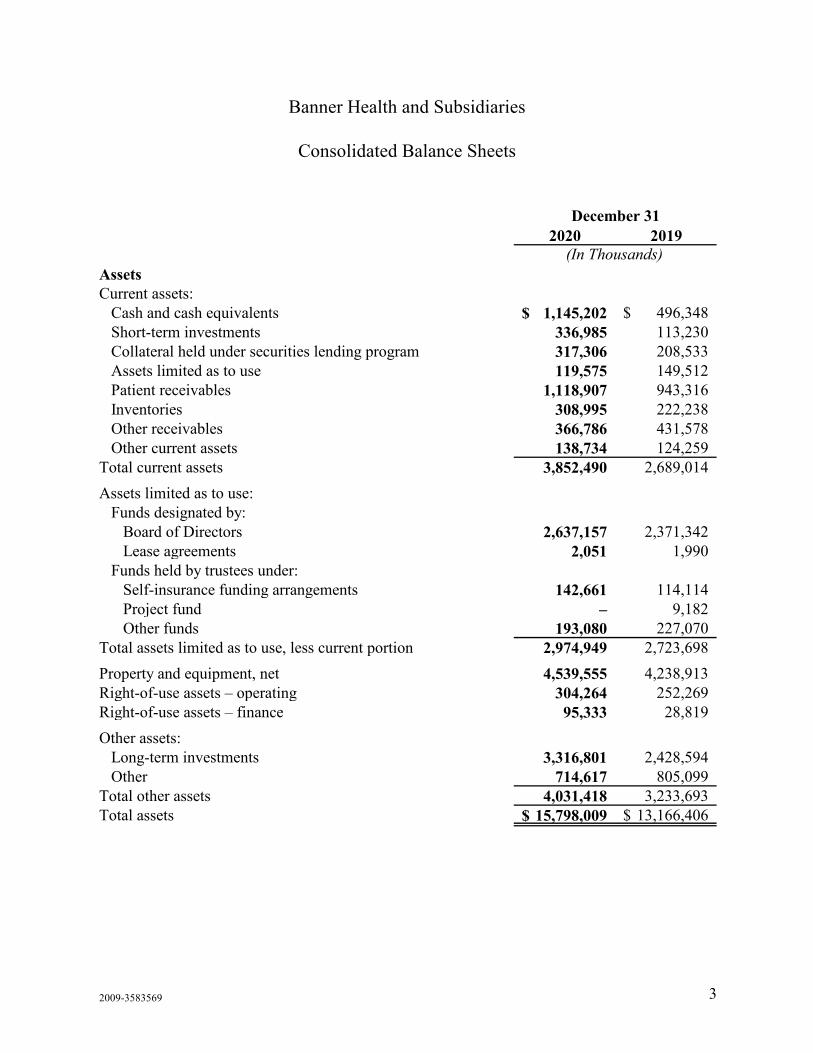
Assets Current assets:
Cash and cash equivalents 1,145,202$ 496,348$ Short-term investments 336,985 113,230 Collateral held under securities lending program 317,306 208,533 Assets limited as to use 119,575 149,512 Patient receivables 1,118,907 943,316 Inventories 308,995 222,238 Other receivables 366,786 431,578 Other current assets 138,734 124,259
Total current assets 3,852,490 2,689,014 Assets limited as to use:
Funds designated by: Board of Directors 2,637,157 2,371,342 Lease agreements 2,051 1,990
Funds held by trustees under: Self-insurance funding arrangements 142,661 114,114 Project fund – 9,182 Other funds 193,080 227,070
Total assets limited as to use, less current portion 2,974,949 2,723,698 Property and equipment, net 4,539,555 4,238,913 Right-of-use assets – operating 304,264 252,269 Right-of-use assets – finance 95,333 28,819 Other assets:
Long-term investments 3,316,801 2,428,594 Other 714,617 805,099
Total other assets 4,031,418 3,233,693 Total assets 15,798,009$ 13,166,406$
December 31
(In Thousands)
Banner Health and Subsidiaries
Consolidated Balance Sheets
2009-3583569 3
2020 2019
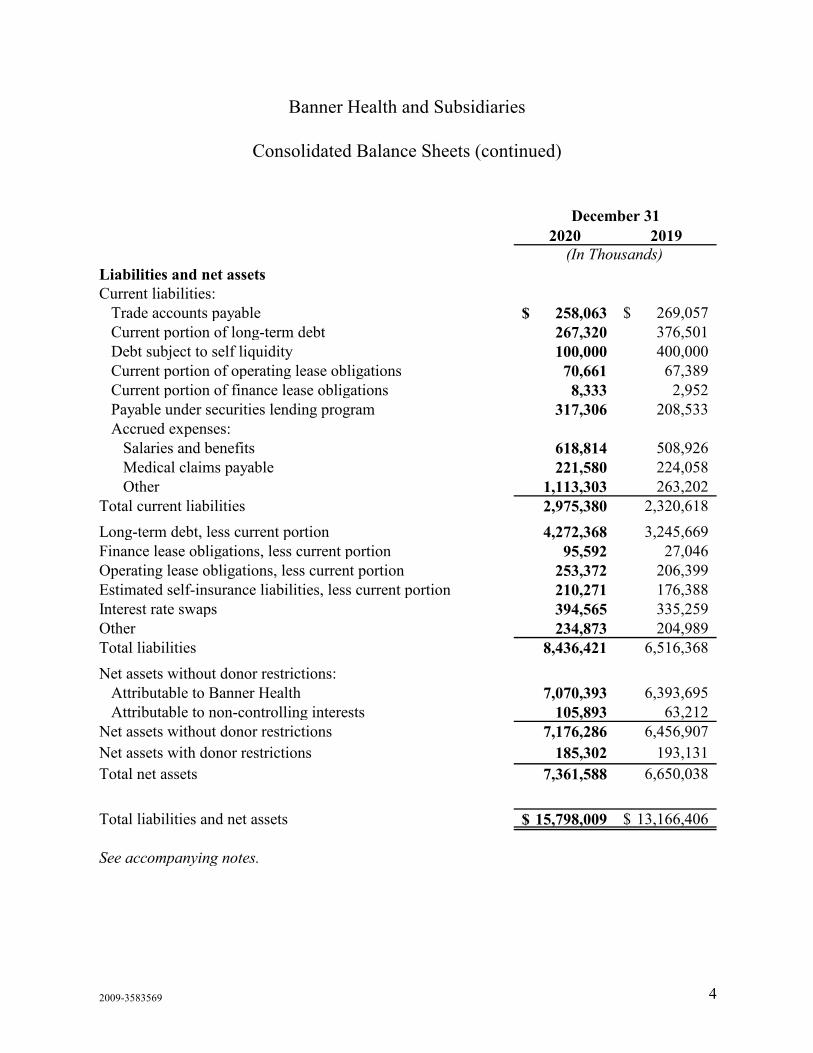
Liabilities and net assets Current liabilities:
Trade accounts payable 258,063$ 269,057$ Current portion of long-term debt 267,320 376,501 Debt subject to self liquidity 100,000 400,000 Current portion of operating lease obligations 70,661 67,389 Current portion of finance lease obligations 8,333 2,952 Payable under securities lending program 317,306 208,533 Accrued expenses:
Salaries and benefits 618,814 508,926 Medical claims payable 221,580 224,058 Other 1,113,303 263,202
Total current liabilities 2,975,380 2,320,618 Long-term debt, less current portion 4,272,368 3,245,669 Finance lease obligations, less current portion 95,592 27,046 Operating lease obligations, less current portion 253,372 206,399 Estimated self-insurance liabilities, less current portion 210,271 176,388 Interest rate swaps 394,565 335,259 Other 234,873 204,989 Total liabilities 8,436,421 6,516,368 Net assets without donor restrictions:
Attributable to Banner Health 7,070,393 6,393,695 Attributable to non-controlling interests 105,893 63,212
Net assets without donor restrictions 7,176,286 6,456,907 Net assets with donor restrictions 185,302 193,131 Total net assets 7,361,588 6,650,038
Total liabilities and net assets 15,798,009$ 13,166,406$ See accompanying notes.
December 31
(In Thousands)
Banner Health and Subsidiaries
Consolidated Balance Sheets (continued)
2009-3583569 4

2020 2019 Revenues:
Net patient service revenue 7,370,066$ 7,000,985$ Medical insurance premiums 2,251,394 1,983,929 Other revenue 775,651 441,734
Total revenues 10,397,111 9,426,648 Expenses:
Salaries and benefits 4,735,854 4,270,282 Supplies 1,643,337 1,496,296 Physician and professional fees 249,382 234,778 Medical claims cost, net of Banner claims of $380,836
and $408,291 in 2020 and 2019, respectively 1,547,525 1,495,898 Depreciation and amortization 499,880 468,302 Interest 146,155 132,229 Purchased services 640,387 599,264 Other 623,664 529,241
Total expenses 10,086,184 9,226,290 Operating income 310,927 200,358 Other income (loss):
Investment income – realized 56,807 170,219 Investment gain – unrealized 319,529 375,459 Income from alternative investments 72,030 95,464 Investment income, net 448,366 641,142 Unrealized loss on interest rate swaps (59,533) (76,724) Other (69,248) (10,994)
Total other income 319,585 553,424 Excess of revenues over expenses 630,512 753,782 Less excess of revenues over expenses attributable to
non-controlling interests 43,827 26,951 Excess of revenues over expenses attributable
to Banner Health 586,685$ 726,831$
See accompanying notes.
Year Ended December 31
(In Thousands)
Banner Health and Subsidiaries
Consolidated Statements of Income
2009-3583569 5
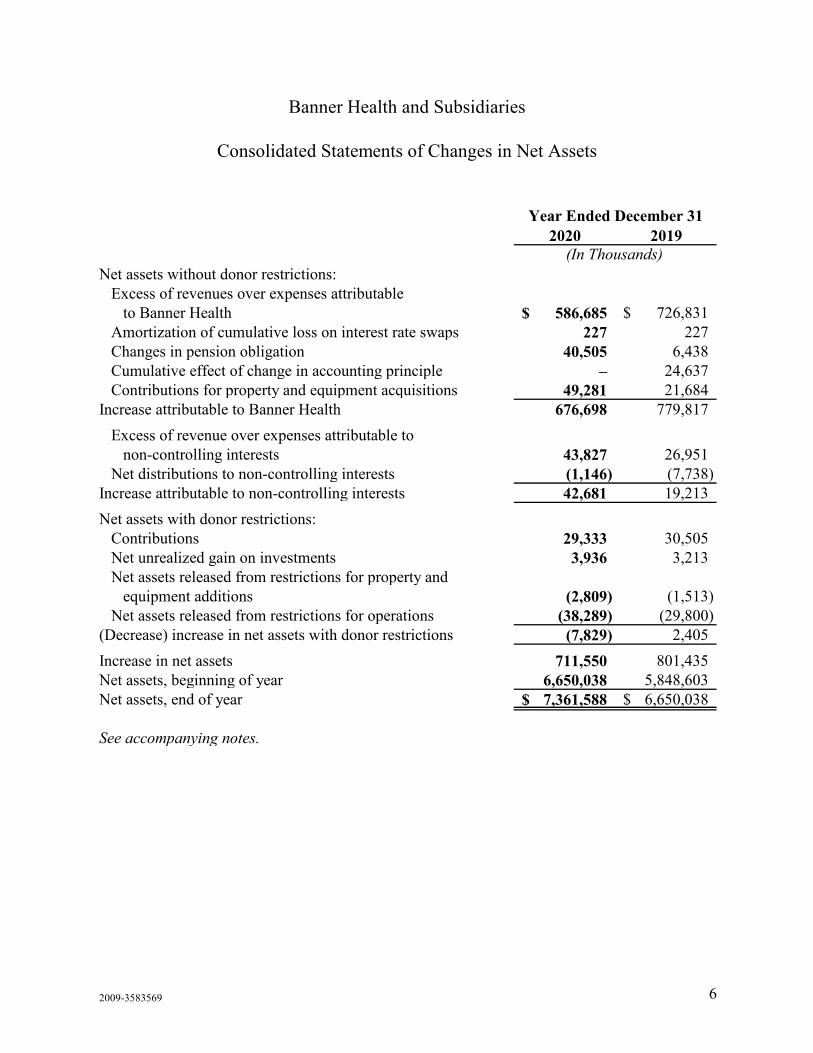
2020 2019 Net assets without donor restrictions:
Excess of revenues over expenses attributable to Banner Health 586,685$ 726,831$
Amortization of cumulative loss on interest rate swaps 227 227 Changes in pension obligation 40,505 6,438 Cumulative effect of change in accounting principle – 24,637 Contributions for property and equipment acquisitions 49,281 21,684
Increase attributable to Banner Health 676,698 779,817
Excess of revenue over expenses attributable to non-controlling interests 43,827 26,951
Net distributions to non-controlling interests (1,146) (7,738) Increase attributable to non-controlling interests 42,681 19,213 Net assets with donor restrictions:
Contributions 29,333 30,505 Net unrealized gain on investments 3,936 3,213 Net assets released from restrictions for property and
equipment additions (2,809) (1,513) Net assets released from restrictions for operations (38,289) (29,800)
(Decrease) increase in net assets with donor restrictions (7,829) 2,405 Increase in net assets 711,550 801,435 Net assets, beginning of year 6,650,038 5,848,603 Net assets, end of year 7,361,588$ 6,650,038$
See accompanying notes.
Year Ended December 31
(In Thousands)
Banner Health and Subsidiaries
Consolidated Statements of Changes in Net Assets
2009-3583569 6
2020 2019
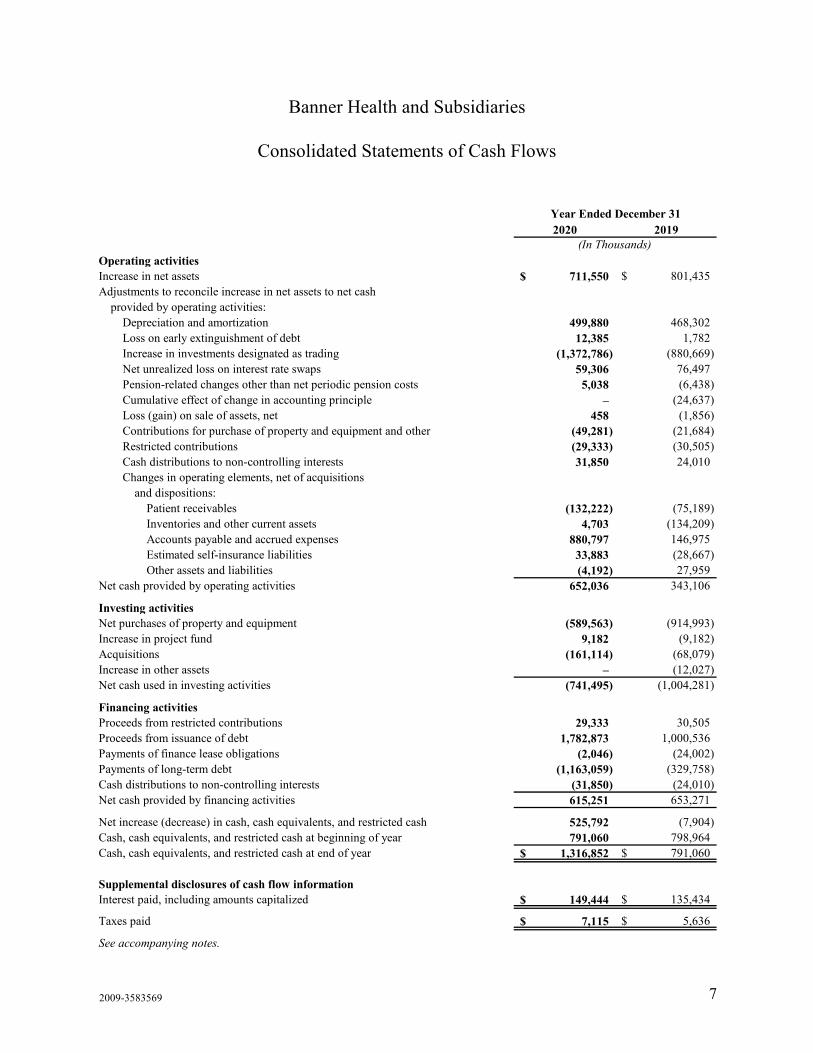
Operating activities Increase in net assets 711,550$ 801,435$ Adjustments to reconcile increase in net assets to net cash
provided by operating activities: Depreciation and amortization 499,880 468,302 Loss on early extinguishment of debt 12,385 1,782 Increase in investments designated as trading (1,372,786) (880,669) Net unrealized loss on interest rate swaps 59,306 76,497 Pension-related changes other than net periodic pension costs 5,038 (6,438) Cumulative effect of change in accounting principle – (24,637) Loss (gain) on sale of assets, net 458 (1,856) Contributions for purchase of property and equipment and other (49,281) (21,684) Restricted contributions (29,333) (30,505) Cash distributions to non-controlling interests 31,850 24,010 Changes in operating elements, net of acquisitions
and dispositions: Patient receivables (132,222) (75,189) Inventories and other current assets 4,703 (134,209) Accounts payable and accrued expenses 880,797 146,975 Estimated self-insurance liabilities 33,883 (28,667) Other assets and liabilities (4,192) 27,959
Net cash provided by operating activities 652,036 343,106 Investing activities Net purchases of property and equipment (589,563) (914,993) Increase in project fund 9,182 (9,182) Acquisitions (161,114) (68,079) Increase in other assets – (12,027) Net cash used in investing activities (741,495) (1,004,281) Financing activities Proceeds from restricted contributions 29,333 30,505 Proceeds from issuance of debt 1,782,873 1,000,536 Payments of finance lease obligations (2,046) (24,002) Payments of long-term debt (1,163,059) (329,758) Cash distributions to non-controlling interests (31,850) (24,010) Net cash provided by financing activities 615,251 653,271 Net increase (decrease) in cash, cash equivalents, and restricted cash 525,792 (7,904) Cash, cash equivalents, and restricted cash at beginning of year 791,060 798,964 Cash, cash equivalents, and restricted cash at end of year 1,316,852$ 791,060$ Supplemental disclosures of cash flow information Interest paid, including amounts capitalized 149,444$ 135,434$
Taxes paid 7,115$ 5,636$ See accompanying notes.
Year Ended December 31
(In Thousands)
Banner Health and Subsidiaries
Consolidated Statements of Cash Flows
2009-3583569 7

2009-3583569 8
Banner Health and Subsidiaries
Notes to Consolidated Financial Statements
December 31, 2020
1. Description of Business
Banner Health is a nonprofit corporation exempt from income taxes under Internal Revenue Code Section 501(c)(3) and applicable state income tax codes. Banner Health and its subsidiaries (collectively, Banner) own, control, or lease hospitals, clinics, nursing homes, clinical laboratories, ambulatory surgery centers, urgent care centers, free-standing imaging centers, home health agencies, a captive insurance company, a foundation, an accountable health care organization, a Medicaid managed care health plan and related Medicare Advantage health plan, and other health care-related organizations in six western states. Banner also holds controlling interests in several health care-related business ventures (see Note 2) and non-controlling interests in several other entities that are accounted for under the equity method of accounting (see Note 8).
2. Significant Accounting Policies
Basis of Consolidation
The accompanying consolidated financial statements reflect the consolidated operations of all owned and leased operating units of Banner and its wholly owned subsidiaries. Banner also holds controlling interests in the following business ventures. The business venture financial results are included within Banner’s consolidated financial statements. Banner records the unrelated investor’s ownership share of these business ventures as non-controlling interest.
Sonora Quest Laboratories, LLC
The Sonora Quest Laboratories, LLC (SQL) business venture was formed in 1997. Banner holds a 51% controlling interest and Quest Diagnostics of Arizona, Inc. (Quest) holds a 49% non-controlling interest. SQL provides a broad range of laboratory services to Arizona physicians, hospitals, and other health care providers.
BHSM Rehabilitation, LLC
In December 2017, Banner and Select Medical (Select) entered into a business venture that operates Banner’s and Select’s Arizona inpatient and outpatient rehabilitation services. The business venture, BHSM Rehabilitation, LLC (BHSM), began operations on May 1, 2018. Banner holds a 51% controlling interest in BHSM and Select holds a 49% non-controlling interest.
2009-3583569 9
Banner Health and Subsidiaries
Notes to Consolidated Financial Statements (continued)
2. Significant Accounting Policies (continued)
Banner Atlas JV, LLC
In December 2018, Banner and Atlas Healthcare Partners, LLC (Atlas) entered a business venture that operates Banner’s ambulatory surgery centers. The business venture is named Banner Atlas JV, LLC, with Banner holding a 75% controlling interest and Atlas holding a 25% non-controlling interest. Atlas manages the ambulatory surgery centers via a management service agreement and works with Banner to develop additional ambulatory surgical facilities in Banner’s primary markets. Banner Atlas JV, LLC will always maintain a controlling interest in each surgery center.
All significant intercompany accounts and transactions have been eliminated in consolidation.
Subsequent Events
Subsequent events have been evaluated through March 15, 2021, the date the accompanying consolidated financial statements were issued. There were no subsequent events requiring recognition in the consolidated financial statements.
Fair Value of Financial Instruments
The carrying values of financial instruments classified as current assets and current liabilities approximate fair value. The fair values of other financial instruments are disclosed in their respective notes.
Cash, Cash Equivalents, and Restricted Cash
Cash and cash equivalents consist primarily of cash and highly liquid marketable securities with an original maturity of three months or less when purchased by Banner.
Banner Health and Subsidiaries
Notes to Consolidated Financial Statements (continued)
2009-3583569 10
2. Significant Accounting Policies (continued)
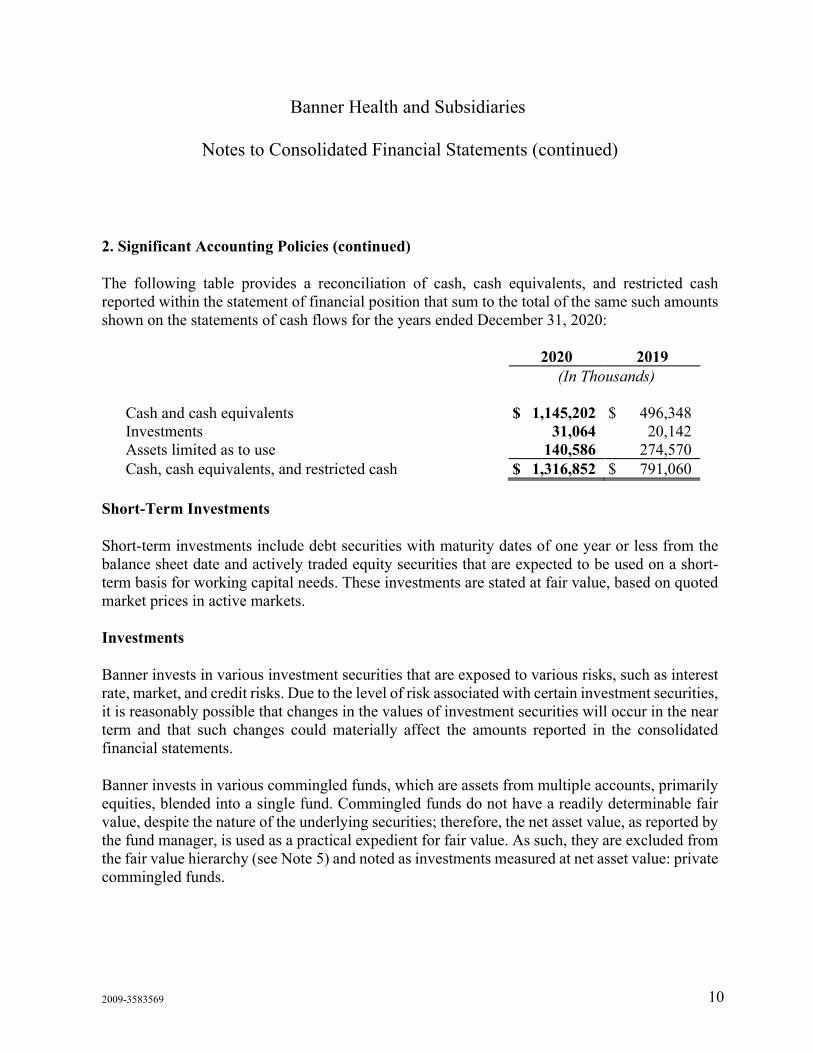
The following table provides a reconciliation of cash, cash equivalents, and restricted cash reported within the statement of financial position that sum to the total of the same such amounts shown on the statements of cash flows for the years ended December 31, 2020:
2020 2019 (In Thousands) Cash and cash equivalents $ 1,145,202 $ 496,348 Investments 31,064 20,142 Assets limited as to use 140,586 274,570 Cash, cash equivalents, and restricted cash $ 1,316,852 $ 791,060
Short-Term Investments
Short-term investments include debt securities with maturity dates of one year or less from the balance sheet date and actively traded equity securities that are expected to be used on a short-term basis for working capital needs. These investments are stated at fair value, based on quoted market prices in active markets.
Investments
Banner invests in various investment securities that are exposed to various risks, such as interest rate, market, and credit risks. Due to the level of risk associated with certain investment securities, it is reasonably possible that changes in the values of investment securities will occur in the near term and that such changes could materially affect the amounts reported in the consolidated financial statements.
Banner invests in various commingled funds, which are assets from multiple accounts, primarily equities, blended into a single fund. Commingled funds do not have a readily determinable fair value, despite the nature of the underlying securities; therefore, the net asset value, as reported by the fund manager, is used as a practical expedient for fair value. As such, they are excluded from the fair value hierarchy (see Note 5) and noted as investments measured at net asset value: private commingled funds.
Banner Health and Subsidiaries
Notes to Consolidated Financial Statements (continued)
2009-3583569 11
2. Significant Accounting Policies (continued)
Banner invests in alternative investments, mainly hedge funds, through limited partnerships. Banner accounts for its ownership interests in these alternative investments under the equity method of accounting, based on the net asset value per share of the fund held by Banner. The net asset value is determined based on the estimated fair value of each of the underlying investments held in the hedge fund. However, the hedge fund investment holdings may include investments in private investment funds whose values have been estimated by the hedge fund managers in the absence of readily ascertainable fair values. Due to the inherent uncertainty of these estimates, these values may differ from the values that would have been used had a ready market for these investments existed. The investment income recorded is based on Banner’s proportionate share of the hedge fund portfolio’s change in net asset value during the year. The alternative investment income is primarily recorded within income from alternative investments on the consolidated statement of income, with the remainder recorded as a change to restricted net assets for those funds that have been restricted by the donor.
Certain of Banner’s alternative investments are subject to redemption lockup periods or have capital call commitments. As of December 31, 2020, approximately $211,195,000 of Banner’s alternative investments were subject to a two-year redemption lockup period. In addition, certain of Banner’s alternative investment agreements follow a capital call structure, of which Banner has committed up to approximately $415,500,000. Of that total, Banner has made capital contributions of $193,305,000 as of December 31, 2020, resulting in up to approximately $222,195,000 in uncalled commitments.
Banner uses derivative financial instruments in its investment portfolio to moderate changes in value due to fluctuations in the financial markets. Banner has not designated its derivatives related to marketable securities as hedged financial instruments. Accordingly, the change in the fair value of derivatives is recognized as a component of investment income. Banner’s fixed-income manager has executed a master netting arrangement for each of the derivative instruments held by the same counterparty, which are legally offset as the instrument is settled. Banner’s derivative contracts in a net loss position were reported on a net basis on the accompanying consolidated balance sheets as of December 31, 2020 and 2019. As of December 31, 2020, approximately $97,276,000 of gross derivative assets and approximately $97,073,000 of gross derivative liabilities were netted together within investments. As of December 31, 2019, approximately $175,008,000 of gross derivative assets and approximately $174,803,000 of gross derivative liabilities were netted together within investments (see Note 5).

Banner Health and Subsidiaries
Notes to Consolidated Financial Statements (continued)
2009-3583569 12
2. Significant Accounting Policies (continued)
Investment income, including interest and dividends, realized gains and losses on investments, unrealized gains and losses on investments, and income on alternative investments, is included in excess of revenues over expenses, unless the income or loss is restricted by donor or law.
Assets Limited as to Use
Assets limited as to use include marketable securities that have been designated for use as determined by the Banner Board of Directors, such as for property and equipment replacement and expansion, payments under lease agreements, assets held by trustees, and assets held as collateral by counterparties under interest rate swap agreements.
Securities Lending Program
Banner participates in securities lending transactions through its custodian whereby Banner lends a portion of its investments to various brokers in exchange for collateral for the securities loaned, usually on a short-term basis. Collateral provided by the brokers consists of cash and securities and is maintained at levels approximating 104% of the fair value of the securities on loan, adjusted for market fluctuations. Banner maintains effective control of the loaned securities through its custodian during the term of the arrangement in that the securities may be recalled at any time. Under the terms of the agreement, the borrower must return the same, or substantially the same, investments that were borrowed. The value of collateral held for loaned securities is reported in current assets as collateral held under securities lending program, and a corresponding obligation is reported in current liabilities as a payable under securities lending program on the accompanying consolidated balance sheets. At December 31, 2020 and 2019, the fair value of the collateral provided on behalf of Banner was approximately $317,306,000 and $208,533,000, respectively. At December 31, 2020 and 2019, the fair value of securities on loan was approximately $300,585,000 and $200,303,000, respectively.
Patient Receivables
Net patient accounts receivable and net patient service revenues have been adjusted to the estimated amounts expected to be received based on contractual rates for services rendered, inclusive of an estimated implicit price concession. These estimated amounts are subject to further adjustments upon review by third-party payors.
Banner Health and Subsidiaries
Notes to Consolidated Financial Statements (continued)
2009-3583569 13
2. Significant Accounting Policies (continued)
Inventories
Inventories, consisting principally of supplies, are stated at the lower of cost or net realizable value, determined on a first-in, first-out basis.
Property and Equipment
Property and equipment are stated at cost, if purchased, or at fair value on the date received, if donated, less accumulated depreciation and amortization.
Depreciation is provided on a straight-line basis over the estimated useful lives of the property and equipment, which range from 2 to 20 years for major movable equipment and from 5 to 40 years for buildings and fixed equipment. Amortization of leasehold improvements is provided on a straight-line basis over the shorter of the lease period or the estimated useful lives.
Long-Lived Asset Impairment
Banner reviews long-lived assets, other than goodwill, for impairment when events or changes in business conditions indicate that their carrying values may not be recoverable. Banner considers assets to be impaired and writes them down to fair value if expected undiscounted cash flows are less than the carrying amounts. Fair value is the present value of the associated discounted cash flows.
Goodwill
Purchases of acquired businesses are allocated to the assets acquired and liabilities assumed based on the estimated fair values on the respective acquisition dates. Based on these values, the excess purchase price over the fair value of the net assets acquired is allocated to goodwill.
Banner evaluates goodwill for impairment at least annually, and more frequently if indicators of impairment are encountered. Banner completes its annual impairment test during the fourth quarter to determine whether there are events or circumstances that indicate it is more likely than not that the reporting units’ fair values are less than their carrying amounts.
Banner Health and Subsidiaries
Notes to Consolidated Financial Statements (continued)
2009-3583569 14
2. Significant Accounting Policies (continued)
If indicators of impairment are identified, goodwill is tested at the reporting unit level, defined as an operating segment or one level below an operating segment, with the fair value of the reporting unit being compared with its carrying amount, including goodwill. If the fair value of a reporting unit exceeds its carrying amount, goodwill of the reporting unit is not considered to be impaired. Banner did not identify any indicators of impairment, and no impairment was recorded, for 2020 or 2019.
Costs of Borrowing
Debt issuance costs are deferred and amortized over the term of the related bond using the straight-line method, which approximates the effective interest method.
Interest incurred on borrowed funds during the period of construction of capital assets is capitalized as a component of the cost of acquiring those assets.
Self-Insurance Programs
In connection with self-insurance programs, accounts have been established for the purpose of accumulating assets based on actuarial determinations. These assets can be used only for the payment of professional liability, general liability, workers’ compensation, employment liability, employee group life insurance claims, health plan stop-loss coverage, and related expenses. It is Banner’s policy to record the expense and related liability for professional liability, general liability, workers’ compensation, employment liability, and employee group life insurance losses based upon undiscounted actuarial estimates.
Net Assets
Net assets, revenues, gains, and losses are classified based on the existence or absence of donor-or grantor-imposed restrictions. Net assets and changes therein are classified and reported as follows:
Net Assets Without Donor Restrictions – Net assets available for use in general operations and not subject to donor restrictions.
Banner Health and Subsidiaries
Notes to Consolidated Financial Statements (continued)
2009-3583569 15
2. Significant Accounting Policies (continued)
Net Assets With Donor Restrictions – Net assets subject to donor-imposed restrictions. Some donor-imposed restrictions are temporary in nature, such as those that will be met by the passage of time or other events specified by the donor. Other donor-imposed restrictions are perpetual in nature, where the donor stipulates that resources be maintained in perpetuity. Donor-imposed restrictions are released when a restriction expires, that is, when the stipulated time has elapsed, when the stipulated purpose for which the resource was restricted has been fulfilled, or both. Net assets with donor restrictions are primarily restricted for capital projects, Alzheimer’s research, oncology, and pediatric programs.
Contributions
Banner records contributions upon receipt of an unconditional promise to give. Gifts, bequests, and other promises or receipts restricted by donors as to use or time period are recorded as net assets with donor restriction until used in the manner designated or upon expiration of the time period restriction. Donated property and equipment are recorded at fair value at the date received. Unrestricted contributions received are recorded as other income.
Performance Indicator
Banner’s performance indicator is the excess of revenues over expenses, which includes all changes in net assets without donor restrictions other than changes in the amortization of cumulative loss on interest rate swaps, contributions for property and equipment acquisitions, changes in pension funded status, and the cumulative effect of changes in accounting principle.
Net Patient Service Revenue
Net patient service revenue is reported at the amount to which Banner expects to be entitled in exchange for providing patient care. These amounts are due from patients, third-party payors (including health insurers and government programs), and others and include variable consideration for retroactive revenue adjustments due to settlement of ongoing and future audits, reviews, and investigations.
Banner Health and Subsidiaries
Notes to Consolidated Financial Statements (continued)
2009-3583569 16
2. Significant Accounting Policies (continued)
Banner uses a portfolio approach to account for categories of patient contracts as a collective group, rather than recognizing revenue on an individual contract basis. The portfolios consist of major payor classes for inpatient revenue and major payor classes and types of services provided for outpatient revenue. Based on historical collection trends and other analyses, Banner believes that revenue recognized by utilizing the portfolio approach approximates the revenue that would have been recognized if an individual contract approach were used.
Banner’s initial estimate of the transaction price for services provided to patients is determined by reducing the total standard charges related to the patient services provided by various elements of variable consideration, including contractual adjustments, discounts, implicit price concessions, and other reductions to Banner’s standard charges. Banner determines the transaction price associated with services provided to patients who have third-party payor coverage based on the reimbursement terms outlined in contractual agreements, Banner’s discount policies, and historical experience. For uninsured and underinsured patients who do not qualify for charity care, Banner determines the transaction price associated with services on the basis of charges reduced by implicit price concessions. Implicit price concessions included in the estimate of the transaction price are based on Banner’s historical collection experience for applicable patient portfolios. Patients who meet Banner’s criteria for free care are provided care without charge; such amounts are not reported as revenue. Subsequent changes to the estimate of the transaction price are generally recorded as adjustments to net patient service revenue in the period of the change.
Net patient service revenue is recognized as performance obligations are satisfied, even though Banner bills patients and third-party payors several days after the services are performed and/or the patient is discharged. Performance obligations are determined based on the nature of the services provided by Banner. Net patient service revenue for performance obligations satisfied over time is recognized based on actual charges incurred to date in relation to total expected charges. Banner believes that this method provides a reasonable depiction of the transfer of services over the term of the performance obligation based on the services needed to satisfy the obligation. Generally, performance obligations satisfied over time relate to patients receiving inpatient acute care services. Banner measures the performance obligation from admission into the hospital to the point when it is no longer required to provide services to that patient, which is generally at the time of discharge. Revenue for performance obligations satisfied at a point in time is recognized when goods or services are provided, and Banner does not believe it is required to provide additional goods or services to the patient.

Banner Health and Subsidiaries
Notes to Consolidated Financial Statements (continued)
2009-3583569 17
2. Significant Accounting Policies (continued)
Banner has determined that the nature, amount, timing, and uncertainty of revenue and cash flows are affected by the payors, the lines of business that render services to patients, and the timing of when revenue is recognized and billed. Net patient service revenue for the years ended December 31 by payor is as follows:
2020 2019 (In Thousands) Commercial and contracted payors $ 3,515,210 $ 3,307,456 Medicare 2,558,472 2,482,209 Medicaid 1,192,500 1,043,125 Self-pay 103,884 168,195 $ 7,370,066 $ 7,000,985
Deductibles, copayments, and coinsurance under third-party payment programs, which are the patient’s responsibility, are included within the primary payor category in the table above.
Net patient service revenue for the years ended December 31 by line of business, is as follows:
2020 2019 (In Thousands) Hospital $ 6,042,608 $ 5,824,260 Physician services 655,029 668,198 Laboratory 385,477 291,924 Ambulatory and other 286,952 216,603 $ 7,370,066 $ 7,000,985
Banner Health and Subsidiaries
Notes to Consolidated Financial Statements (continued)
2009-3583569 18
2. Significant Accounting Policies (continued)
State Supplemental Programs
Banner’s academic medical centers are eligible to receive supplemental payments from the Arizona Health Care Cost Containment System (AHCCCS), Arizona’s Medicaid program, by qualifying as sponsoring institutions of Graduate Medical Education (GME) programs. Supplemental payments are paid annually after the completion of the state’s fiscal year and are based on each hospital’s inpatient Medicaid days, number of residents, and actual costs to maintain the program. Banner accrues the estimated supplemental payments over the fiscal year, as they are earned based on Medicaid utilization. The payments are recorded as part of net patient service revenue, as they are considered additional reimbursement for care provided to AHCCCS patients. The total revenue recognized for the years ended December 31, 2020 and 2019, was approximately $114,607,000 and $124,213,000, respectively.
Medical Insurance Premiums and Medical Claim Costs
Banner Health Network (BHN), a wholly owned accountable care organization, has entered into risk contracts with insurance companies whereby BHN receives monthly premiums, and is responsible for the enrolled members’ claims. For the years ended December 31, 2020 and 2019, BHN recorded premium revenue from insurance companies of approximately $398,598,000 and $500,591,000, respectively. BHN incurred health care claims for services rendered to enrolled members of approximately $384,419,000 and $536,516,000 for the years ended December 31, 2020 and 2019, respectively. Included in the total paid health care claims were payments to Banner Health of approximately $160,651,000 and $202,086,000 for the years ended December 31, 2020 and 2019, respectively, which are eliminated upon consolidation. BHN has recorded a medical claim liability, associated with claims incurred but not yet paid, of approximately $47,565,000 and $41,258,000 as of December 31, 2020 and 2019, respectively. Included in the medical claim liability were amounts owed to Banner Health of approximately $11,231,000 and $20,904,000 for the years ended December 31, 2020 and 2019, respectively, which are eliminated upon consolidation. BHN is also a participant in the Medicare Shared Savings Plan (MSSP), a shared risk program with the Centers for Medicare & Medicaid Services (CMS). In 2020, BHN received a $3,908,000 MSSP shared risk gain for the 2019 contract year.
Banner Health and Subsidiaries
Notes to Consolidated Financial Statements (continued)
2009-3583569 19
2. Significant Accounting Policies (continued)
The Banner-University Health Plans (BUHP) include University Care Advantage and University Family Care. BUHP has entered into contracts with AHCCCS and CMS to provide health insurance services for enrolled members. In October 2018, University Family Care was awarded a three-year AHCCCS Complete Care contract, with the option to extend up to four years, which is in addition to the AHCCCS long-term care contract that was awarded on October 1, 2017. University Care Advantage’s contract with CMS is a calendar year contract, which can be renewed annually.
For the years ended December 31, 2020 and 2019, BUHP recorded premium revenue from AHCCCS and CMS of approximately $1,733,595,000 and $1,483,338,000, respectively. BUHP incurred health care claims for services rendered to enrolled members of approximately $1,539,494,000 and $1,371,550,000 for the years ended December 31, 2020 and 2019, respectively. Included in the total paid health care claims were payments to Banner Health of approximately $220,185,000 and $201,987,000 for the years ended December 31, 2020 and 2019, respectively, which are eliminated upon consolidation. BUHP has recorded a medical claim liability, associated with claims incurred but not yet paid and/or received, of approximately $188,301,000 and $199,494,000 as of December 31, 2020 and 2019, respectively. Included in the medical claim liability were amounts owed to Banner Health of approximately $36,267,000 and $44,057,000 as of December 31, 2020 and 2019, respectively, which are eliminated upon consolidation.
Use of Estimates
The preparation of the consolidated financial statements in conformity with accounting principles generally accepted in the United States requires management to make estimates and assumptions that affect the reported amounts of assets and liabilities and disclosure of contingent assets and liabilities at the date of the consolidated financial statements. Estimates also affect the reported amounts of revenues and expenses during the reporting period. Actual results could differ from those estimates.
Banner Health and Subsidiaries
Notes to Consolidated Financial Statements (continued)
2009-3583569 20
2. Significant Accounting Policies (continued)
New Accounting Pronouncements
In February 2016, the Financial Accounting Standards Board (FASB) issued Accounting Standards Update (ASU) 2016-02, Leases (Topic 842), a new lease accounting standard, which was codified as Accounting Standards Codification 842, Leases. This accounting standard requires companies that lease assets to recognize a right-of-use asset and a lease liability, initially measured at the present value of the lease payments, on their balance sheets. This accounting standard also requires additional disclosures about the amount, timing, and uncertainty of cash flows arising from leases and is effective for fiscal years beginning after December 15, 2018. Banner adopted this accounting standard on January 1, 2019, and recorded right-of-use assets of approximately $491,695,000, lease obligations of approximately $507,599,000, and a transition adjustment, which increased net assets without donor restriction by approximately $24,637,000.
In August 2018, the FASB issued ASU 2018-13, Fair Value Measurement (Topic 820): Disclosure Framework – Changes to the Disclosure Requirements for Fair Value Measurement, which changes the disclosure requirements for fair value measurement. The accounting standard was effective for Banner for fiscal years, and interim periods within those fiscal years, beginning after December 15, 2019, and there was not a significant impact on the Banner’s consolidated financial statements.
3. Charity Care and Services That Benefit the Community
In furtherance of its charitable purpose, Banner provides a broad range of benefits to the communities it serves, including offering various community-based social service programs and several health-related educational programs. These services are designed and provided to improve the general standards of health for the communities.
Included in services to the communities are programs directed at the poor and persons who cannot afford health care due to inadequate resources and/or who are uninsured or underinsured. Non-elective, medically necessary care provided by Banner is rendered, regardless of the patient’s ability to pay, and Banner’s charity care policy offers various discounts from billed charges based on the patient’s family’s income.
Banner Health and Subsidiaries
Notes to Consolidated Financial Statements (continued)
2009-3583569 21
3. Charity Care and Services That Benefit the Community (continued)
In addition to providing traditional charity care, Banner assumes the unpaid costs of Medicaid and other indigent public programs; provides services for the community through health promotion and education, health clinics, and screenings, all of which cannot be billed or can be operated only on a deficit basis; assumes the unpaid costs of training health professionals, such as medical residents, nursing students, and students in allied health professions; provides community health research; and provides cash and in-kind donations of equipment, supplies, or staff time made on behalf of the community.
Banner’s cost accounting system is used to quantify the estimated charity care costs, which include both direct and indirect costs, for providing patient care at each facility. During 2020 and 2019, costs incurred by Banner in the provision of charity care, the unpaid costs of programs directed at the poor, the education of health professionals, research activities, and the costs of supporting other community programs were approximately $591,672,000 and $603,426,000, respectively. Charity care is reported based on the cost of services provided for which charges are written off in accordance with Banner’s charity care policy, but does not include the amount, if any, for which the patient remains responsible.
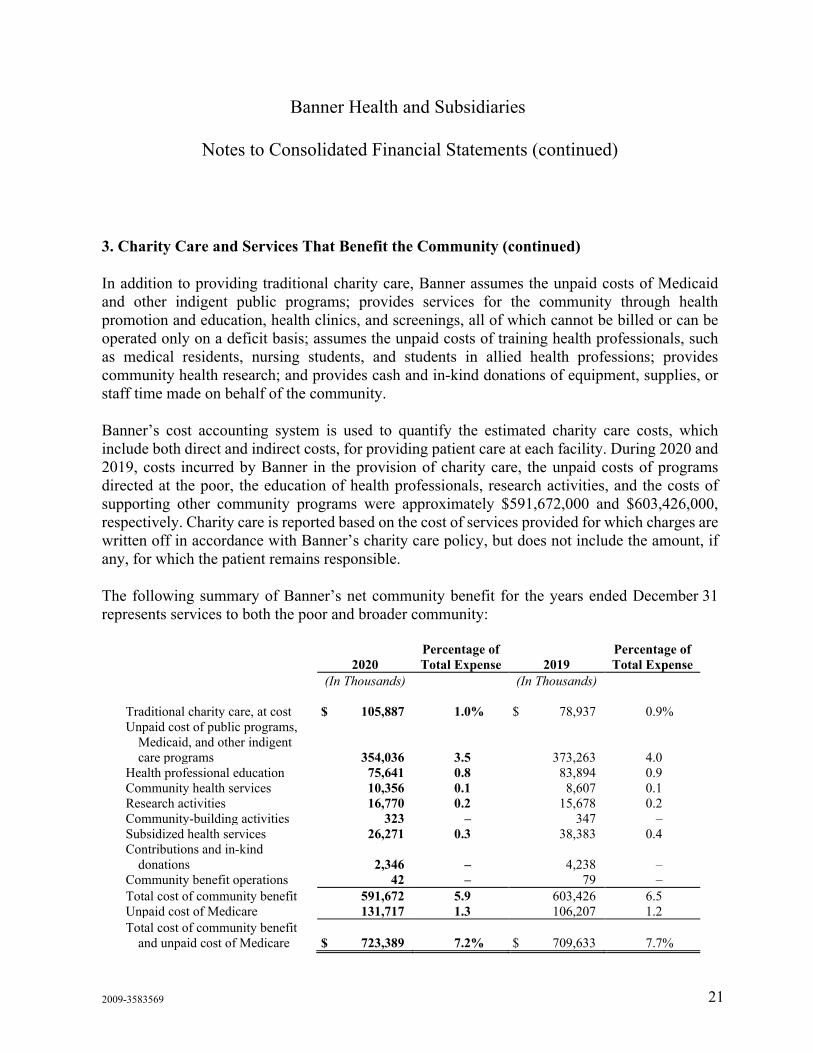
The following summary of Banner’s net community benefit for the years ended December 31 represents services to both the poor and broader community:
2020
Percentage of Total Expense 2019
Percentage of Total Expense
(In Thousands) (In Thousands) Traditional charity care, at cost $ 105,887 1.0% $ 78,937 0.9% Unpaid cost of public programs,
Medicaid, and other indigent care programs 354,036 3.5 373,263 4.0
Health professional education 75,641 0.8 83,894 0.9 Community health services 10,356 0.1 8,607 0.1 Research activities 16,770 0.2 15,678 0.2 Community-building activities 323 – 347 – Subsidized health services 26,271 0.3 38,383 0.4 Contributions and in-kind
donations 2,346 – 4,238 – Community benefit operations 42 – 79 – Total cost of community benefit 591,672 5.9 603,426 6.5 Unpaid cost of Medicare 131,717 1.3 106,207 1.2 Total cost of community benefit
and unpaid cost of Medicare $ 723,389 7.2% $ 709,633 7.7%

Banner Health and Subsidiaries
Notes to Consolidated Financial Statements (continued)
2009-3583569 22
3. Charity Care and Services That Benefit the Community (continued)
Traditional Charity Care is the cost of services for which reimbursement is not pursued, in accordance with Banner’s policy to provide health care services free of charge or on a discounted fee schedule to those who cannot afford health care due to inadequate resources and/or who are uninsured or underinsured.
Unpaid Cost of Public Programs is the shortfall created when Banner receives payments below the cost for patients enrolled in publicly supported programs, such as Medicare and Medicaid.
Health Professional Education includes the unpaid costs of training health professionals, such as medical residents, nursing students, and students in allied health professions.
Community Health Services include costs for health education and related activities designed to improve the health of the community. Community health education programs, community-based clinical services, and health care support services are included. No patient bills are generated for these services.
Research Activities include clinical and community health research, as well as studies on health care delivery.
Community-Building Activities include the costs of programs that develop the community through physical improvements, economic development, support system enhancements, environmental improvements, leadership development, coalition building, community health improvement advocacy, and workforce enhancement.
Subsidized Health Services include costs for billed services that are subsidized by Banner. These include services offered despite a financial loss because they are needed in the community and either other providers are unwilling to provide the services or the services would, otherwise, be unable to meet patient demand.
Contributions and In-Kind Donations include cash donations, grants, and in-kind donations to the community at large and other tax-exempt organizations.
Community Benefit Operations include costs of directly planning, evaluating, and managing community benefit activities.
Banner Health and Subsidiaries
Notes to Consolidated Financial Statements (continued)
2009-3583569 23
4. Concentrations of Credit Risk
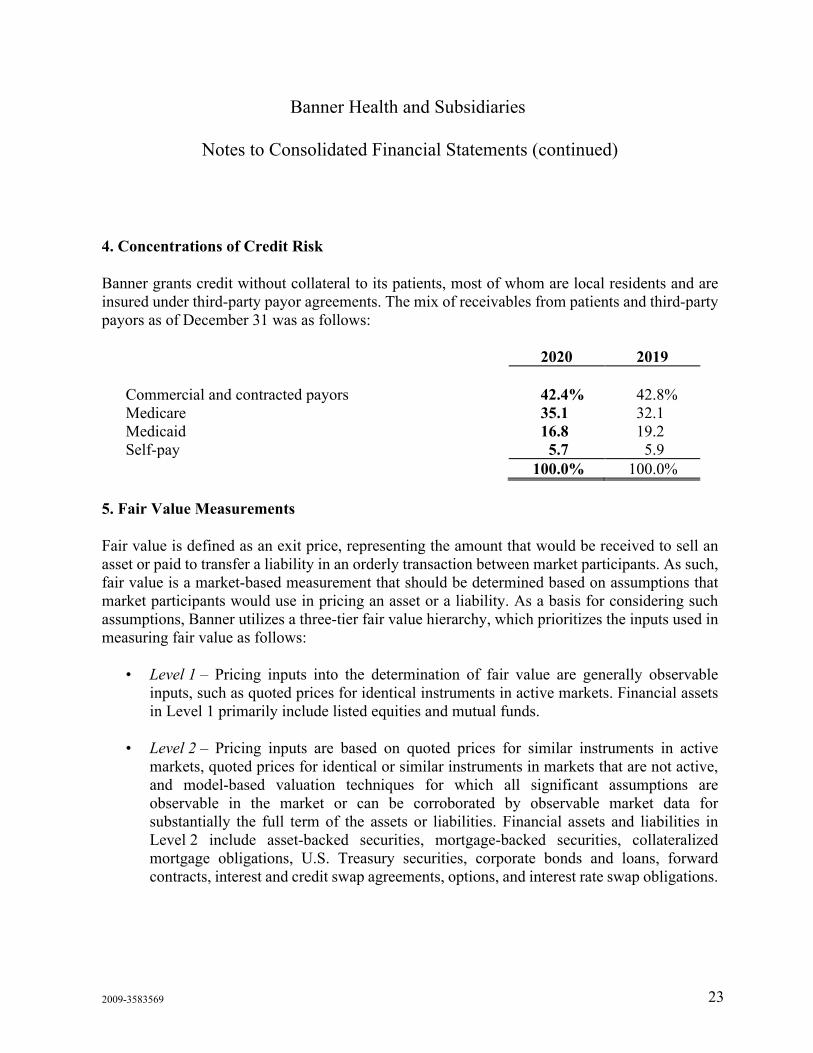
Banner grants credit without collateral to its patients, most of whom are local residents and are insured under third-party payor agreements. The mix of receivables from patients and third-party payors as of December 31 was as follows:
2020 2019 Commercial and contracted payors 42.4% 42.8% Medicare 35.1 32.1 Medicaid 16.8 19.2 Self-pay 5.7 5.9 100.0% 100.0%
5. Fair Value Measurements
Fair value is defined as an exit price, representing the amount that would be received to sell an asset or paid to transfer a liability in an orderly transaction between market participants. As such, fair value is a market-based measurement that should be determined based on assumptions that market participants would use in pricing an asset or a liability. As a basis for considering such assumptions, Banner utilizes a three-tier fair value hierarchy, which prioritizes the inputs used in measuring fair value as follows:
• Level 1 – Pricing inputs into the determination of fair value are generally observable inputs, such as quoted prices for identical instruments in active markets. Financial assets in Level 1 primarily include listed equities and mutual funds.
• Level 2 – Pricing inputs are based on quoted prices for similar instruments in active markets, quoted prices for identical or similar instruments in markets that are not active, and model-based valuation techniques for which all significant assumptions are observable in the market or can be corroborated by observable market data for substantially the full term of the assets or liabilities. Financial assets and liabilities in Level 2 include asset-backed securities, mortgage-backed securities, collateralized mortgage obligations, U.S. Treasury securities, corporate bonds and loans, forward contracts, interest and credit swap agreements, options, and interest rate swap obligations.

Banner Health and Subsidiaries
Notes to Consolidated Financial Statements (continued)
2009-3583569 24
5. Fair Value Measurements (continued)
• Level 3 – Pricing inputs are generally unobservable and include situations where there is little, if any, market activity for the investment. The inputs into the determination of fair value require management’s judgment or estimation of assumptions that market participants would use in pricing the assets or liabilities. The fair values are, therefore, determined using factors that involve considerable judgment and interpretation, including, but not limited to, private and public comparables, third-party appraisals, discounted cash flow models, and fund manager estimates.
Assets and liabilities measured at fair value are based on one of the following valuation techniques:
(a) Market approach – prices and other relevant information generated by market transactions involving identical or comparable assets or liabilities
(b) Income approach – techniques to convert future amounts to a single present amount based on market expectations (including present value techniques, option pricing, and excess earnings models)
Banner received restricted pledges and contributions of approximately $29,333,000 and $30,505,000 for the years ended December 31, 2020 and 2019. The restricted contributions were measured based on the actual cash received or for pledges receivable, using discounted cash flow projections. Approximately $5,148,000 and $7,981,000 of these restricted contributions were recorded as pledges receivable as of December 31, 2020 and 2019, respectively.
Banner’s investment in alternative investments of approximately $1,264,535,000 and $1,141,939,000 as of December 31, 2020 and 2019, respectively, is accounted for using the equity method of accounting. Accordingly, the alternative investments are omitted from the following schedule of financial instruments measured at fair value.
There have not been any changes in any of the investments’ fair value level classification between Level 1 and Level 2 in 2020 or 2019. Banner has no Level 3 investments.

Banner Health and Subsidiaries
Notes to Consolidated Financial Statements (continued)
2009-3583569 25
5. Fair Value Measurements (continued)
Quoted Prices in Active
Markets for
Significant Other
Observable Significant
Unobservable Valuation December 31, Identical Assets Inputs Inputs Technique 2020 (Level 1) (Level 2) (Level 3) (a, b)
Cash and cash equivalents $ 171,650 $ 170,650 $ 1,000 $ – a Collateral held under securities lending (primarily
cash and debt securities) 317,306 175,355 141,951 – a Mutual funds:
Mutual funds – U.S. funds 1,535,757 1,535,757 – – a Mutual funds – International 506,758 506,758 – – a
Total mutual funds 2,042,515 2,042,515 – – Debt securities:
U.S. Treasury/government obligations 497,250 – 497,250 – a Corporate bonds/non-U.S. government bonds 443,385 – 443,385 – a Asset-backed securities 308,239 – 308,239 – a Commercial mortgage-backed securities 58,629 – 58,629 – a Non-government-backed collateralized mortgages 33,164 – 33,164 – a Government mortgage-backed securities 181,048 – 181,048 – a Government commercial-backed securities 12,615 – 12,615 – a
Total debt securities 1,534,330 – 1,534,330
Repurchase agreements 7,294 – 7,294 – a
Equity securities: U.S. equity securities 96,835 96,835 – – a International equity securities 10 10 – – a
Total equity securities 96,845 96,845 – –
Derivative securities: Future contracts 38,928 38,928 – – a Forward contracts 55,802 – 55,802 – a Net credit swaps 2,546 – 2,546 – a
Subtotal derivative assets 97,276 38,928 58,348 –
Future contracts (38,239) (38,239) – – a Forward contracts (57,291) – (57,291) – a Option agreements (21) – (21) – a Net credit swaps (1,522) – (1,522) – a
Subtotal derivative liabilities (97,073) (38,239) (58,834) –
Total investments in the fair value hierarchy $ 4,170,143 $ 2,486,054 $ 1,684,089 $ –
Investments measured at net asset value: private commingled funds 1,734,906
Total fair value investments $ 5,905,049
Short-term investments $ 336,985 Collateral held under securities lending agreements 317,306 Assets limited as to use 3,094,524 Long-term investments 3,316,801 Other assets – Banner Foundation restricted funds 106,273 Less alternative investments 1,264,535 Less split-dollar life insurance 2,305 Total fair value investments $ 5,905,049
Interest rate swaps included in other long-term liabilities $ (394,565) $ – $ (394,565) $ – b
Banner Health and Subsidiaries
Notes to Consolidated Financial Statements (continued)
2009-3583569 26
5. Fair Value Measurements (continued)
Quoted Prices in Active
Markets for
Significant Other
Observable Significant
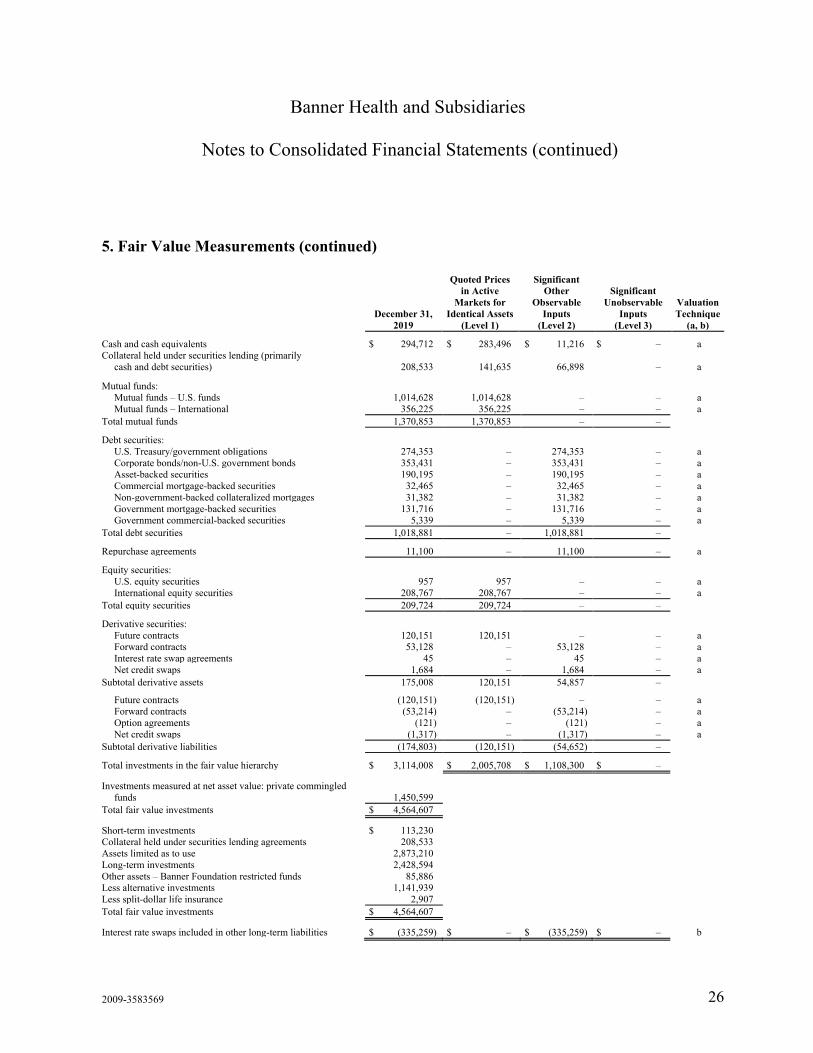
Unobservable Valuation December 31, Identical Assets Inputs Inputs Technique 2019 (Level 1) (Level 2) (Level 3) (a, b)
Cash and cash equivalents $ 294,712 $ 283,496 $ 11,216 $ – a Collateral held under securities lending (primarily
cash and debt securities) 208,533 141,635 66,898 – a Mutual funds:
Mutual funds – U.S. funds 1,014,628 1,014,628 – – a Mutual funds – International 356,225 356,225 – – a
Total mutual funds 1,370,853 1,370,853 – –
Debt securities: U.S. Treasury/government obligations 274,353 – 274,353 – a Corporate bonds/non-U.S. government bonds 353,431 – 353,431 – a Asset-backed securities 190,195 – 190,195 – a Commercial mortgage-backed securities 32,465 – 32,465 – a Non-government-backed collateralized mortgages 31,382 – 31,382 – a Government mortgage-backed securities 131,716 – 131,716 – a Government commercial-backed securities 5,339 – 5,339 – a
Total debt securities 1,018,881 – 1,018,881 –
Repurchase agreements 11,100 – 11,100 – a
Equity securities: U.S. equity securities 957 957 – – a International equity securities 208,767 208,767 – – a
Total equity securities 209,724 209,724 – –
Derivative securities: Future contracts 120,151 120,151 – – a Forward contracts 53,128 – 53,128 – a Interest rate swap agreements 45 – 45 – a Net credit swaps 1,684 – 1,684 – a
Subtotal derivative assets 175,008 120,151 54,857 –
Future contracts (120,151) (120,151) – – a Forward contracts (53,214) – (53,214) – a Option agreements (121) – (121) – a Net credit swaps (1,317) – (1,317) – a
Subtotal derivative liabilities (174,803) (120,151) (54,652) –
Total investments in the fair value hierarchy $ 3,114,008 $ 2,005,708 $ 1,108,300 $ –
Investments measured at net asset value: private commingled funds 1,450,599
Total fair value investments $ 4,564,607
Short-term investments $ 113,230 Collateral held under securities lending agreements 208,533 Assets limited as to use 2,873,210 Long-term investments 2,428,594 Other assets – Banner Foundation restricted funds 85,886 Less alternative investments 1,141,939 Less split-dollar life insurance 2,907 Total fair value investments $ 4,564,607
Interest rate swaps included in other long-term liabilities $ (335,259) $ – $ (335,259) $ – b

Banner Health and Subsidiaries
Notes to Consolidated Financial Statements (continued)
2009-3583569 27
5. Fair Value Measurements (continued)
Investment income consisted of the following for the years ended December 31:
2020 2019 (In Thousands) Interest and dividend income $ 74,427 $ 86,584 Net realized (loss) gain on sales of marketable securities (14,763) 84,810 Realized and unrealized gain from alternative investments,
including amount recorded in net assets with donor restriction 72,859 96,064
Net realized gain on derivative instruments 1,958 3,477 Net unrealized gain on marketable securities 324,072 376,498 Net unrealized (loss) gain on derivative instruments (1,214) 136 457,339 647,569 Less investment loss credited to other revenue, restricted
equity, and capitalized bond project funds 8,973 6,427 Investment income, net $ 448,366 $ 641,142
6. Liquidity
Financial assets available for general expenditure within one year of the balance sheet date consist of the following as of December 31:
2020 2019 (In Thousands) Cash and cash equivalents $ 1,145,202 $ 496,348 Patient receivables 1,118,907 943,316 Other receivables 366,786 431,578 Short-term investments 336,985 113,230 Funds designated by Board of Directors and lease
agreements 2,639,208 2,373,332 Long-term investments 3,316,801 2,428,594 $ 8,923,889 $ 6,786,398
Banner Health and Subsidiaries
Notes to Consolidated Financial Statements (continued)
2009-3583569 28
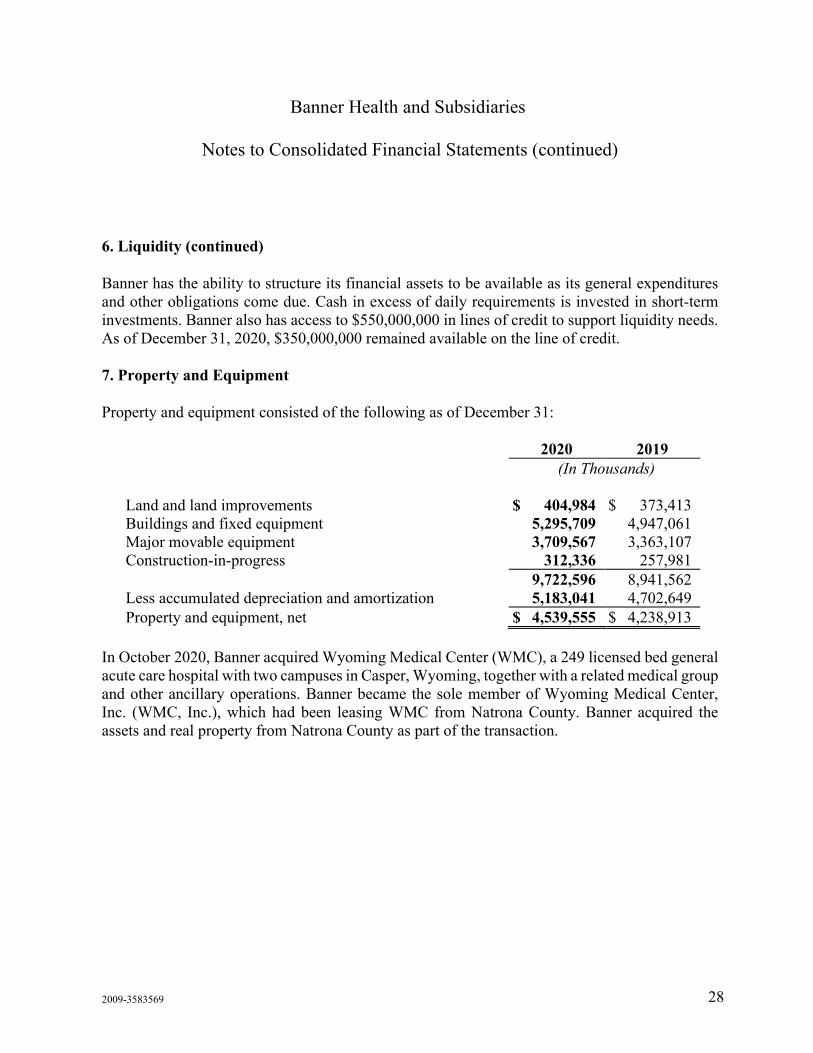
6. Liquidity (continued)
Banner has the ability to structure its financial assets to be available as its general expenditures and other obligations come due. Cash in excess of daily requirements is invested in short-term investments. Banner also has access to $550,000,000 in lines of credit to support liquidity needs. As of December 31, 2020, $350,000,000 remained available on the line of credit.
7. Property and Equipment
Property and equipment consisted of the following as of December 31:
2020 2019 (In Thousands) Land and land improvements $ 404,984 $ 373,413 Buildings and fixed equipment 5,295,709 4,947,061 Major movable equipment 3,709,567 3,363,107 Construction-in-progress 312,336 257,981 9,722,596 8,941,562 Less accumulated depreciation and amortization 5,183,041 4,702,649 Property and equipment, net $ 4,539,555 $ 4,238,913
In October 2020, Banner acquired Wyoming Medical Center (WMC), a 249 licensed bed general acute care hospital with two campuses in Casper, Wyoming, together with a related medical group and other ancillary operations. Banner became the sole member of Wyoming Medical Center, Inc. (WMC, Inc.), which had been leasing WMC from Natrona County. Banner acquired the assets and real property from Natrona County as part of the transaction.
Banner Health and Subsidiaries
Notes to Consolidated Financial Statements (continued)
2009-3583569 29
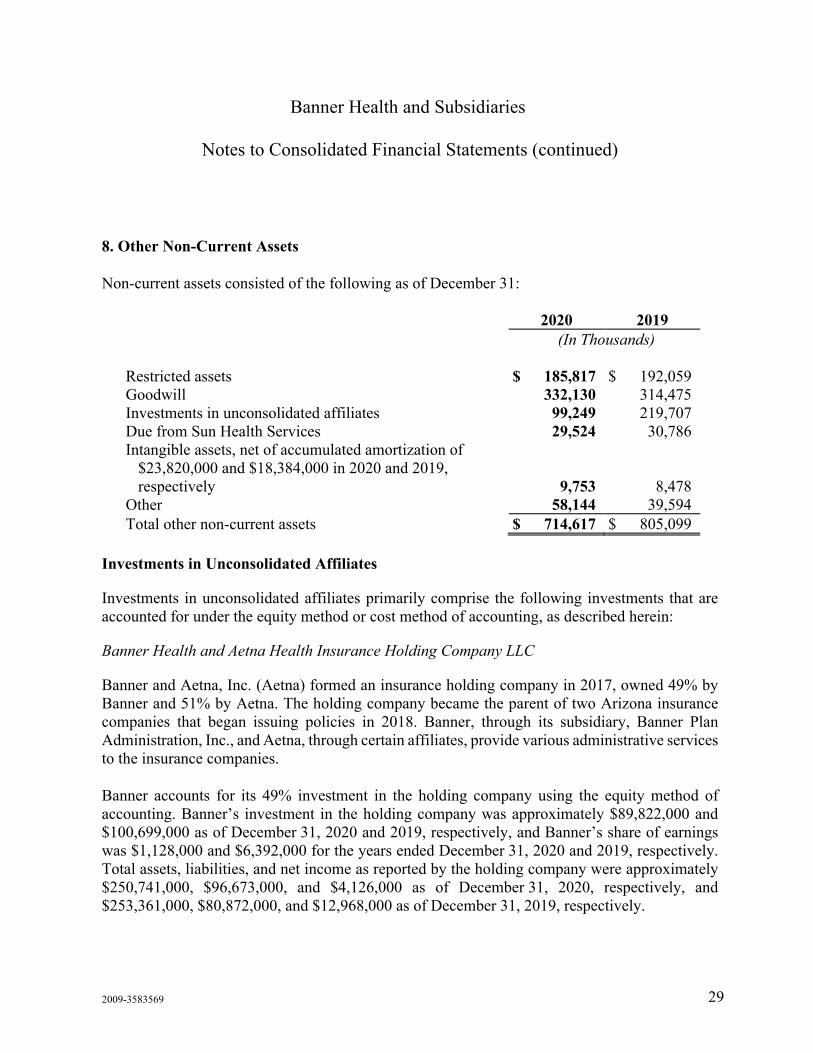
8. Other Non-Current Assets
Non-current assets consisted of the following as of December 31:
2020 2019 (In Thousands) Restricted assets $ 185,817 $ 192,059 Goodwill 332,130 314,475 Investments in unconsolidated affiliates 99,249 219,707 Due from Sun Health Services 29,524 30,786 Intangible assets, net of accumulated amortization of
$23,820,000 and $18,384,000 in 2020 and 2019, respectively 9,753 8,478
Other 58,144 39,594 Total other non-current assets $ 714,617 $ 805,099
Investments in Unconsolidated Affiliates
Investments in unconsolidated affiliates primarily comprise the following investments that are accounted for under the equity method or cost method of accounting, as described herein:
Banner Health and Aetna Health Insurance Holding Company LLC
Banner and Aetna, Inc. (Aetna) formed an insurance holding company in 2017, owned 49% by Banner and 51% by Aetna. The holding company became the parent of two Arizona insurance companies that began issuing policies in 2018. Banner, through its subsidiary, Banner Plan Administration, Inc., and Aetna, through certain affiliates, provide various administrative services to the insurance companies.
Banner accounts for its 49% investment in the holding company using the equity method of accounting. Banner’s investment in the holding company was approximately $89,822,000 and $100,699,000 as of December 31, 2020 and 2019, respectively, and Banner’s share of earnings was $1,128,000 and $6,392,000 for the years ended December 31, 2020 and 2019, respectively. Total assets, liabilities, and net income as reported by the holding company were approximately $250,741,000, $96,673,000, and $4,126,000 as of December 31, 2020, respectively, and $253,361,000, $80,872,000, and $12,968,000 as of December 31, 2019, respectively.

Banner Health and Subsidiaries
Notes to Consolidated Financial Statements (continued)
2009-3583569 30
8. Other Non-Current Assets (continued)
Due from Sun Health Services
Banner and Sun Health Services are parties to a Support and Maintenance Agreement in which Sun Health Services provides an annual contribution to Banner, calculated under the terms of the agreement and, subject to certain contractual limitations and conditions, to support projects at facilities previously owned by Sun Health Corporation (the predecessor of Sun Health Services), or at other future Banner projects in the northwestern section of the Phoenix metropolitan area. Capital project commitments from Sun Health Services as of December 31, 2020 and 2019, were approximately $37,208,000 and $50,416,000, respectively, and are recorded as restricted assets within other non-current assets.
In addition to the capital project commitment, Sun Health Services also funds the Sun Health defined pension plan obligation, which was acquired by Banner and in accordance with the terms outlined in the acquisition agreement. Banner has recorded a receivable from Sun Health Services of approximately $29,524,000 and $30,786,000 as of December 31, 2020 and 2019, respectively, representing the unfunded plan obligation.
Banner Health and Subsidiaries
Notes to Consolidated Financial Statements (continued)
2009-3583569 31
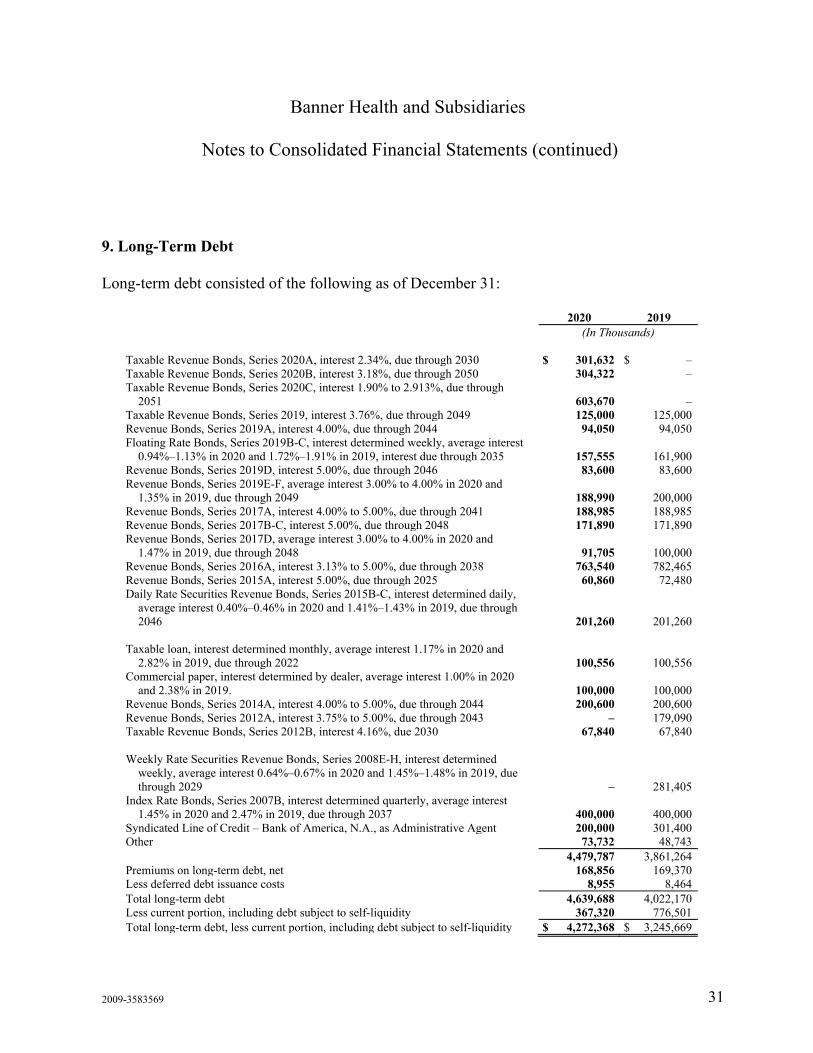
9. Long-Term Debt
Long-term debt consisted of the following as of December 31:
2020 2019 (In Thousands) Taxable Revenue Bonds, Series 2020A, interest 2.34%, due through 2030 $ 301,632 $ – Taxable Revenue Bonds, Series 2020B, interest 3.18%, due through 2050 304,322 – Taxable Revenue Bonds, Series 2020C, interest 1.90% to 2.913%, due through
2051 603,670 – Taxable Revenue Bonds, Series 2019, interest 3.76%, due through 2049 125,000 125,000 Revenue Bonds, Series 2019A, interest 4.00%, due through 2044 94,050 94,050 Floating Rate Bonds, Series 2019B-C, interest determined weekly, average interest
0.94%–1.13% in 2020 and 1.72%–1.91% in 2019, interest due through 2035 157,555 161,900 Revenue Bonds, Series 2019D, interest 5.00%, due through 2046 83,600 83,600 Revenue Bonds, Series 2019E-F, average interest 3.00% to 4.00% in 2020 and
1.35% in 2019, due through 2049 188,990 200,000 Revenue Bonds, Series 2017A, interest 4.00% to 5.00%, due through 2041 188,985 188,985 Revenue Bonds, Series 2017B-C, interest 5.00%, due through 2048 171,890 171,890 Revenue Bonds, Series 2017D, average interest 3.00% to 4.00% in 2020 and
1.47% in 2019, due through 2048 91,705 100,000 Revenue Bonds, Series 2016A, interest 3.13% to 5.00%, due through 2038 763,540 782,465 Revenue Bonds, Series 2015A, interest 5.00%, due through 2025 60,860 72,480 Daily Rate Securities Revenue Bonds, Series 2015B-C, interest determined daily,
average interest 0.40%–0.46% in 2020 and 1.41%–1.43% in 2019, due through 2046 201,260 201,260
Taxable loan, interest determined monthly, average interest 1.17% in 2020 and
2.82% in 2019, due through 2022 100,556 100,556 Commercial paper, interest determined by dealer, average interest 1.00% in 2020
and 2.38% in 2019. 100,000 100,000 Revenue Bonds, Series 2014A, interest 4.00% to 5.00%, due through 2044 200,600 200,600 Revenue Bonds, Series 2012A, interest 3.75% to 5.00%, due through 2043 – 179,090 Taxable Revenue Bonds, Series 2012B, interest 4.16%, due 2030 67,840 67,840 Weekly Rate Securities Revenue Bonds, Series 2008E-H, interest determined
weekly, average interest 0.64%–0.67% in 2020 and 1.45%–1.48% in 2019, due through 2029 – 281,405
Index Rate Bonds, Series 2007B, interest determined quarterly, average interest 1.45% in 2020 and 2.47% in 2019, due through 2037 400,000 400,000
Syndicated Line of Credit – Bank of America, N.A., as Administrative Agent 200,000 301,400 Other 73,732 48,743 4,479,787 3,861,264 Premiums on long-term debt, net 168,856 169,370 Less deferred debt issuance costs 8,955 8,464 Total long-term debt 4,639,688 4,022,170 Less current portion, including debt subject to self-liquidity 367,320 776,501 Total long-term debt, less current portion, including debt subject to self-liquidity $ 4,272,368 $ 3,245,669
Banner Health and Subsidiaries
Notes to Consolidated Financial Statements (continued)
2009-3583569 32
9. Long-Term Debt (continued)
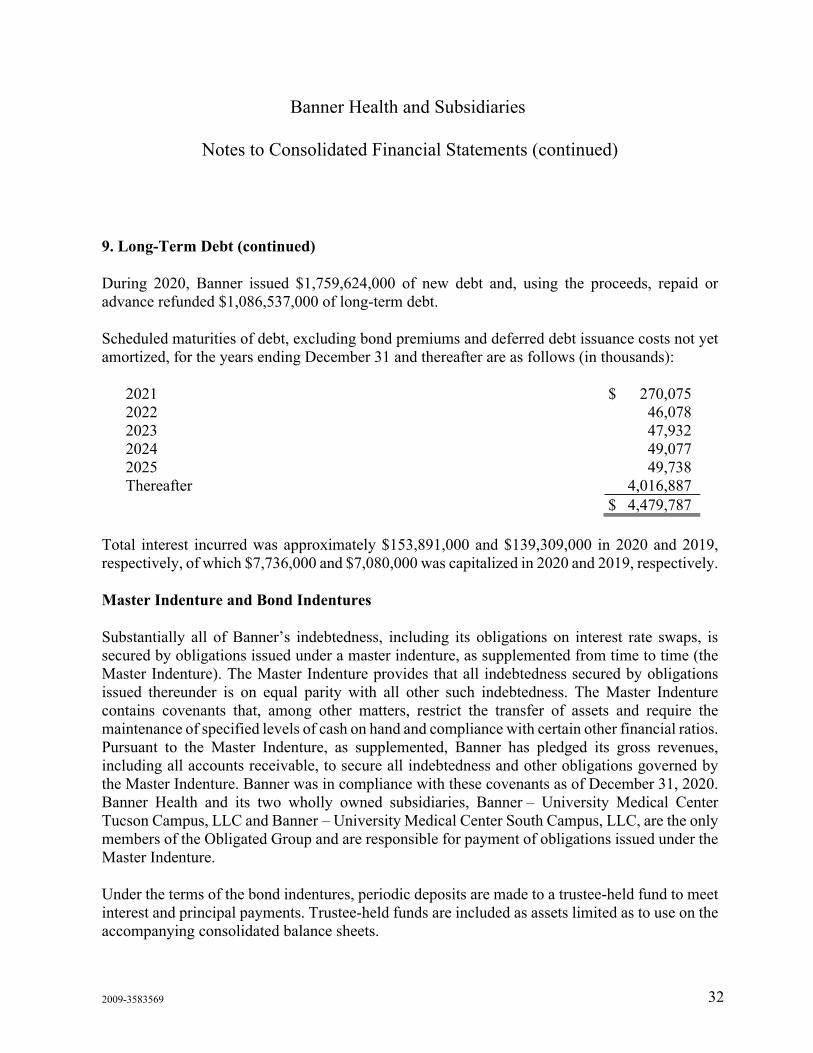
During 2020, Banner issued $1,759,624,000 of new debt and, using the proceeds, repaid or advance refunded $1,086,537,000 of long-term debt.
Scheduled maturities of debt, excluding bond premiums and deferred debt issuance costs not yet amortized, for the years ending December 31 and thereafter are as follows (in thousands):
2021 $ 270,075 2022 46,078 2023 47,932 2024 49,077 2025 49,738 Thereafter 4,016,887 $ 4,479,787
Total interest incurred was approximately $153,891,000 and $139,309,000 in 2020 and 2019, respectively, of which $7,736,000 and $7,080,000 was capitalized in 2020 and 2019, respectively.
Master Indenture and Bond Indentures
Substantially all of Banner’s indebtedness, including its obligations on interest rate swaps, is secured by obligations issued under a master indenture, as supplemented from time to time (the Master Indenture). The Master Indenture provides that all indebtedness secured by obligations issued thereunder is on equal parity with all other such indebtedness. The Master Indenture contains covenants that, among other matters, restrict the transfer of assets and require the maintenance of specified levels of cash on hand and compliance with certain other financial ratios. Pursuant to the Master Indenture, as supplemented, Banner has pledged its gross revenues, including all accounts receivable, to secure all indebtedness and other obligations governed by the Master Indenture. Banner was in compliance with these covenants as of December 31, 2020. Banner Health and its two wholly owned subsidiaries, Banner – University Medical Center Tucson Campus, LLC and Banner – University Medical Center South Campus, LLC, are the only members of the Obligated Group and are responsible for payment of obligations issued under the Master Indenture.
Under the terms of the bond indentures, periodic deposits are made to a trustee-held fund to meet interest and principal payments. Trustee-held funds are included as assets limited as to use on the accompanying consolidated balance sheets.

Banner Health and Subsidiaries
Notes to Consolidated Financial Statements (continued)
2009-3583569 33
9. Long-Term Debt (continued)
Certain of Banner’s bonds are subject to a remarketing agreement whereby bondholders have the right to tender their bonds to Banner for repurchase at the end of the interest rate period if the bonds are not resold to a new purchaser. Banner has entered into several direct pay letter of credit agreements with third-party banks, which will pay for any tendered bonds if they are not resold to a new purchaser. As of December 31, 2020, Banner had entered into direct pay letter of credit agreements associated with the Revenue Bonds Series 2015B and 2015C. There were no advances outstanding on the direct pay letter of credit agreements as of December 31, 2020. The direct pay letter of credit agreement supports the 2015C Revenue Bond’s long-term debt classification.
Interest Rate Swap Agreements
Banner has multiple interest rate swap contracts that effectively convert the variable rate of certain bonds into fixed rates. Banner’s obligations under the swap agreements are secured by the Master Indenture.
The interest rate swaps do not qualify for hedge accounting treatment under accounting standards for derivative instruments and hedging activities. The derivative mark-to-market adjustments resulted in unrealized losses of approximately $(59,533,000) and $(76,724,000) for the years ended December 31, 2020 and 2019, respectively, recorded in excess of revenues over expenses. The net realized portion of the interest rate swaps for the years ended December 31, 2020 and 2019, recorded as an increase to interest expense, was approximately $37,631,000 and $26,432,000, respectively.
Each of the interest rate swap agreements has collateral posting thresholds based on the counterparties’ bond ratings. At the AA- rating level, Banner and its counterparty must post collateral when the mark-to-market value exceeds $35,000,000–$88,000,000, depending on the counterparty. For two of Banner’s counterparties, no collateral is required. At December 31, 2020 and 2019, Banner had approximately $38,892,000 and $101,619,000, respectively, of collateral outstanding with its counterparties. The fair value of the collateral is reported as assets limited as to use – other funds on the accompanying consolidated balance sheets.
As of December 31, 2020 and 2019, the estimated fair value of the interest rate swaps resulted in an imputed obligation of $394,565,000 and $335,259,000, respectively, which is recorded in interest rate swaps on the accompanying consolidated balance sheets. The fair value of the swaps is based on the forward London Interbank Offered Rate curve, with a blended average duration of 7 to 21 years.

Banner Health and Subsidiaries
Notes to Consolidated Financial Statements (continued)
2009-3583569 34
9. Long-Term Debt (continued)
On June 29, 2020, partial novations of interest rate swap agreements were completed between Morgan Stanley to Mizuho Capital Markets LLC and between Merrill Lynch Capital Services, Inc. to Bank of New York Mellon. The Mizuho Capital Markets LLC partial novation begins January 1, 2025, and expires July 1, 2029, and the Bank of New York Mellon partial novation begins July 1, 2025, and expires October 1, 2031. Approximately $125,000,000 of collateral was returned as a result of the partial novations. Morgan Stanley and Merrill Lynch swap agreements remain in effect for the balance of the swap terms following expiration of the partial novations, including the collateral posting requirements.
10. Estimated Self-Insurance Liabilities
Banner has obtained insurance through a combination of purchased and self-insurance programs for professional and general liability claims, workers’ compensation claims, and several other insurance programs to address claims incurred as part of Banner’s ongoing business operations, including directors and officers, auto, environmental, aviation, cybersecurity, property, employee life insurance, and certain physicians’ prior acts coverage. Banner is self-insured for several of its insurance programs through its wholly owned captive, Banner Indemnity, Ltd. (BIL).
Banner’s professional and general liability is self-insured through BIL. Since July 1, 2015, Banner is self-insured, on a claims-made basis, for the first $15,000,000 of each professional liability claim and the first $10,000,000 in aggregate of general liability claims. BIL also provides an excess liability policy with a single limit of $150,000,000 per claim and in the aggregate for the period July 1, 2020, through July 1, 2021. This policy is fully reinsured by reinsurance carriers with an A.M. Best rating of A-VII or better.
Under its self-insured professional and general liability program, Banner contributes actuarially determined amounts to BIL to fund estimated ultimate losses. Banner has accrued estimates for asserted and incurred but not reported claims. The actuarially determined claim liabilities were approximately $192,887,000 and $181,990,000, of which $28,765,000 and $45,995,000 has been recorded as current liabilities on the accompanying consolidated balance sheets as of December 31, 2020 and 2019, respectively. Self-insurance liabilities are undiscounted at December 31, 2020 and 2019.
Banner Health and Subsidiaries
Notes to Consolidated Financial Statements (continued)
2009-3583569 35
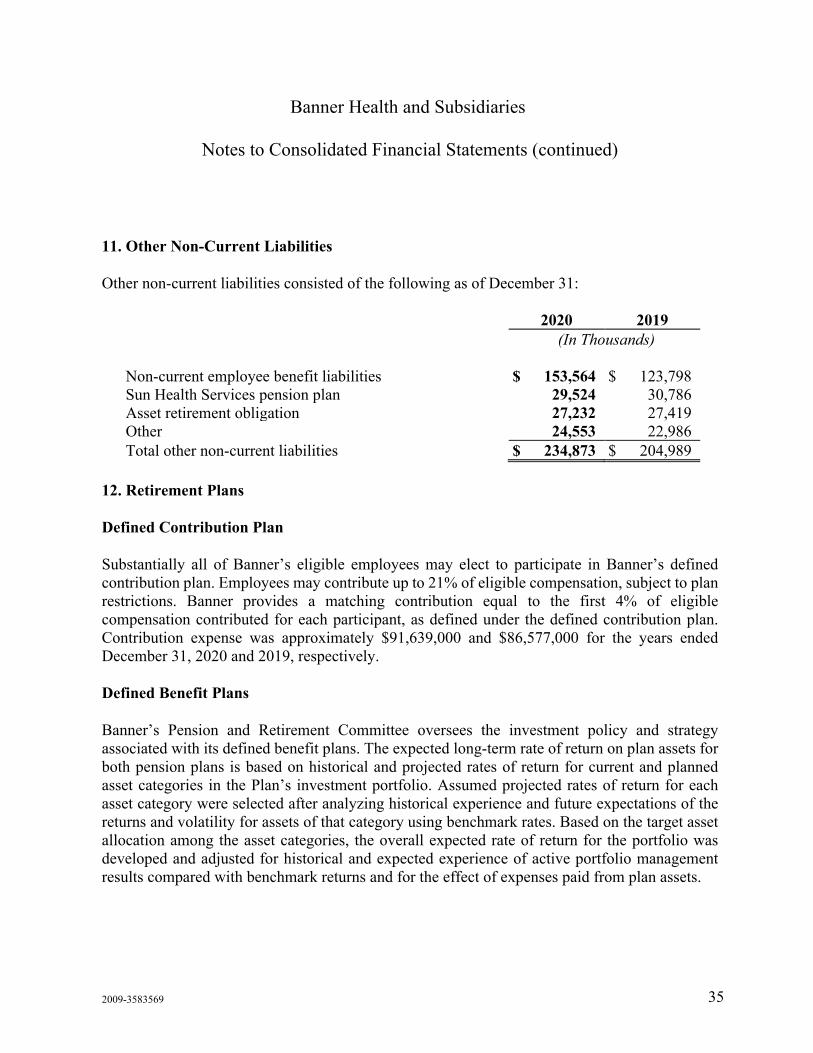
11. Other Non-Current Liabilities
Other non-current liabilities consisted of the following as of December 31:
2020 2019 (In Thousands) Non-current employee benefit liabilities $ 153,564 $ 123,798 Sun Health Services pension plan 29,524 30,786 Asset retirement obligation 27,232 27,419 Other 24,553 22,986 Total other non-current liabilities $ 234,873 $ 204,989
12. Retirement Plans
Defined Contribution Plan
Substantially all of Banner’s eligible employees may elect to participate in Banner’s defined contribution plan. Employees may contribute up to 21% of eligible compensation, subject to plan restrictions. Banner provides a matching contribution equal to the first 4% of eligible compensation contributed for each participant, as defined under the defined contribution plan. Contribution expense was approximately $91,639,000 and $86,577,000 for the years ended December 31, 2020 and 2019, respectively.
Defined Benefit Plans
Banner’s Pension and Retirement Committee oversees the investment policy and strategy associated with its defined benefit plans. The expected long-term rate of return on plan assets for both pension plans is based on historical and projected rates of return for current and planned asset categories in the Plan’s investment portfolio. Assumed projected rates of return for each asset category were selected after analyzing historical experience and future expectations of the returns and volatility for assets of that category using benchmark rates. Based on the target asset allocation among the asset categories, the overall expected rate of return for the portfolio was developed and adjusted for historical and expected experience of active portfolio management results compared with benchmark returns and for the effect of expenses paid from plan assets.
Banner Health and Subsidiaries
Notes to Consolidated Financial Statements (continued)
2009-3583569 36
12. Retirement Plans (continued)
Banner Retirement Income Plan
Banner completed the termination process for a non-contributory defined benefit pension plan (the Plan) during the year ended December 31, 2020. Benefit accruals under the Plan had been frozen since 2002. The Plan’s benefit obligation was transferred to a third-party insurance company, which became primarily obligated to fund future benefits to Plan participants. The Plan’s assets were used to purchase annuity contracts through the third-party insurance company. As part of the termination, Banner recognized $46,400,000 of accumulated plan losses as pension expense, within other non-operating expense.
Sun Health Pension Plan
Under the terms of the agreement for the purchase of Sun Health Corporation, Banner assumed sponsorship of the Sun Health Pension Plan, a defined benefit plan, and the Sun Health Pension Plan Trust (the Trust). Sun Health Services retained the obligation to fund any required contributions to the Trust to meet the Employee Retirement Income Security Act of 1974 minimum funding requirements, and Sun Health Services retains the right to any excess assets that may exist upon termination of the Sun Health Pension Plan. Benefit accruals under the Sun Health Pension Plan have been frozen since May 2007, except for certain employees whose salary benefits were not frozen until 2014. At December 31, 2020 and 2019, Banner recorded a non-current liability of approximately $29,524,000 and $30,786,000, respectively, representing the unfunded liability under the Sun Health Pension Plan, and a long-term receivable from Sun Health Services in the same amount on the accompanying consolidated balance sheets (see Note 8).
Wyoming Medical Center Pension Plan
Banner acquired the Wyoming Medical Center Pension Plan as the sole member of WMC, Inc. Termination of the plan is expected to be completed in 2021. The plan has a funding surplus of $5,314,000 as of December 31, 2020, recorded as a non-current asset. The fair value of plan assets and benefit obligation as of December 31, 2020, is $67,936,000 and $62,622,000, respectively.
Banner Health and Subsidiaries
Notes to Consolidated Financial Statements (continued)
2009-3583569 37
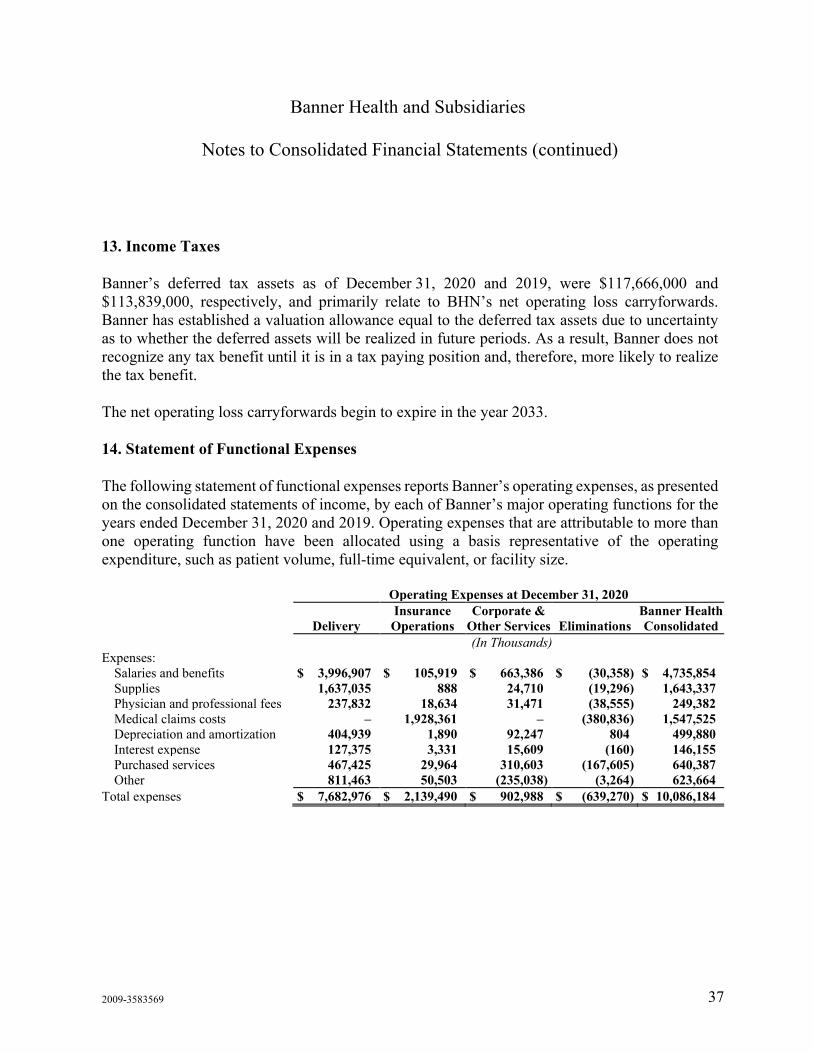
13. Income Taxes
Banner’s deferred tax assets as of December 31, 2020 and 2019, were $117,666,000 and $113,839,000, respectively, and primarily relate to BHN’s net operating loss carryforwards. Banner has established a valuation allowance equal to the deferred tax assets due to uncertainty as to whether the deferred assets will be realized in future periods. As a result, Banner does not recognize any tax benefit until it is in a tax paying position and, therefore, more likely to realize the tax benefit.
The net operating loss carryforwards begin to expire in the year 2033.
14. Statement of Functional Expenses
The following statement of functional expenses reports Banner’s operating expenses, as presented on the consolidated statements of income, by each of Banner’s major operating functions for the years ended December 31, 2020 and 2019. Operating expenses that are attributable to more than one operating function have been allocated using a basis representative of the operating expenditure, such as patient volume, full-time equivalent, or facility size.
Operating Expenses at December 31, 2020
Delivery Insurance Operations
Corporate & Other Services Eliminations
Banner Health Consolidated
(In Thousands) Expenses:
Salaries and benefits $ 3,996,907 $ 105,919 $ 663,386 $ (30,358) $ 4,735,854 Supplies 1,637,035 888 24,710 (19,296) 1,643,337 Physician and professional fees 237,832 18,634 31,471 (38,555) 249,382 Medical claims costs – 1,928,361 – (380,836) 1,547,525 Depreciation and amortization 404,939 1,890 92,247 804 499,880 Interest expense 127,375 3,331 15,609 (160) 146,155 Purchased services 467,425 29,964 310,603 (167,605) 640,387 Other 811,463 50,503 (235,038) (3,264) 623,664
Total expenses $ 7,682,976 $ 2,139,490 $ 902,988 $ (639,270) $ 10,086,184

Banner Health and Subsidiaries
Notes to Consolidated Financial Statements (continued)
2009-3583569 38
14. Statement of Functional Expenses (continued)
Operating Expenses at December 31, 2019
Delivery Insurance Operations
Corporate & Other Services
Eliminations
Banner Health Consolidated
(In Thousands) Expenses:
Salaries and benefits $ 3,688,057 $ 93,977 $ 606,077 $ (117,829) $ 4,270,282 Supplies 1,518,685 1,448 (10,176) (13,661) 1,496,296 Physician and professional fees 234,801 11,294 27,013 (38,330) 234,778 Medical claims costs – 1,908,066 (3,877) (408,291) 1,495,898 Depreciation and amortization 387,381 1,810 79,110 1 468,302 Interest expense 134,063 2,761 (4,531) (64) 132,229 Purchased services 445,557 29,953 292,973 (169,219) 599,264 Other 745,297 47,666 (261,824) (1,898) 529,241
Total expenses $ 7,153,841 $ 2,096,975 $ 724,765 $ (749,291) $ 9,226,290 15. Commitments and Contingencies
Leases
As of January 1, 2019, Banner recorded a right-of-use asset of approximately $491,695,000, a lease obligation of approximately $507,599,000, and a cumulative effect adjustment to the opening balance of net assets without donor restriction of $24,637,000. The transition adjustment relates to the reversal of the property and equipment lease obligations that were recognized as a sale leaseback as of December 31, 2019. Banner also elected a package of practical expedients to not reassess existing or expired contracts, lease classification, or initial direct costs for existing leases. Short-term leases (12 months or less) will not be subject to the new standard per Banner’s accounting policy. Included in the lease term are any renewal options reasonably certain of being exercised. Banner uses a risk-free discount rate commensurate with the lease term to determine the present value of lease payments used to record the right-of-use asset and related lease liability.
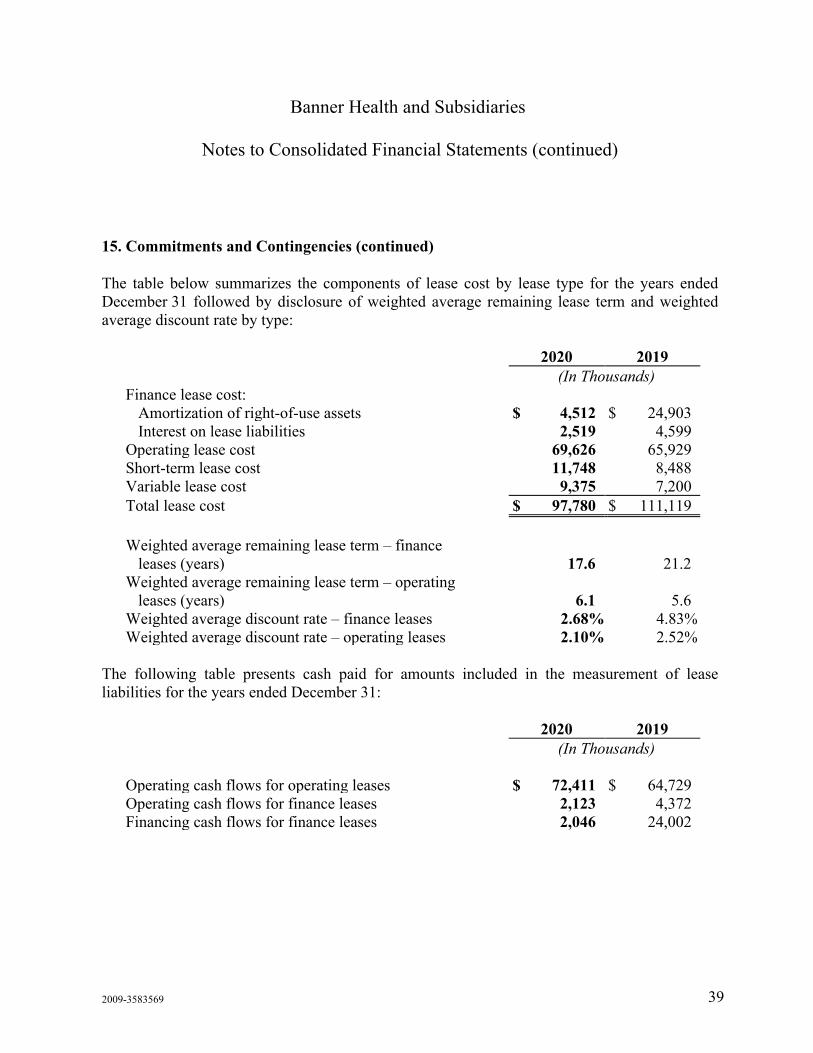
Banner Health and Subsidiaries
Notes to Consolidated Financial Statements (continued)
2009-3583569 39
15. Commitments and Contingencies (continued)
The table below summarizes the components of lease cost by lease type for the years ended December 31 followed by disclosure of weighted average remaining lease term and weighted average discount rate by type:
2020 2019 (In Thousands) Finance lease cost:
Amortization of right-of-use assets $ 4,512 $ 24,903 Interest on lease liabilities 2,519 4,599
Operating lease cost 69,626 65,929 Short-term lease cost 11,748 8,488 Variable lease cost 9,375 7,200 Total lease cost $ 97,780 $ 111,119 Weighted average remaining lease term – finance
leases (years) 17.6 21.2 Weighted average remaining lease term – operating
leases (years) 6.1 5.6 Weighted average discount rate – finance leases 2.68% 4.83% Weighted average discount rate – operating leases 2.10% 2.52%
The following table presents cash paid for amounts included in the measurement of lease liabilities for the years ended December 31:
2020 2019 (In Thousands) Operating cash flows for operating leases $ 72,411 $ 64,729 Operating cash flows for finance leases 2,123 4,372 Financing cash flows for finance leases 2,046 24,002
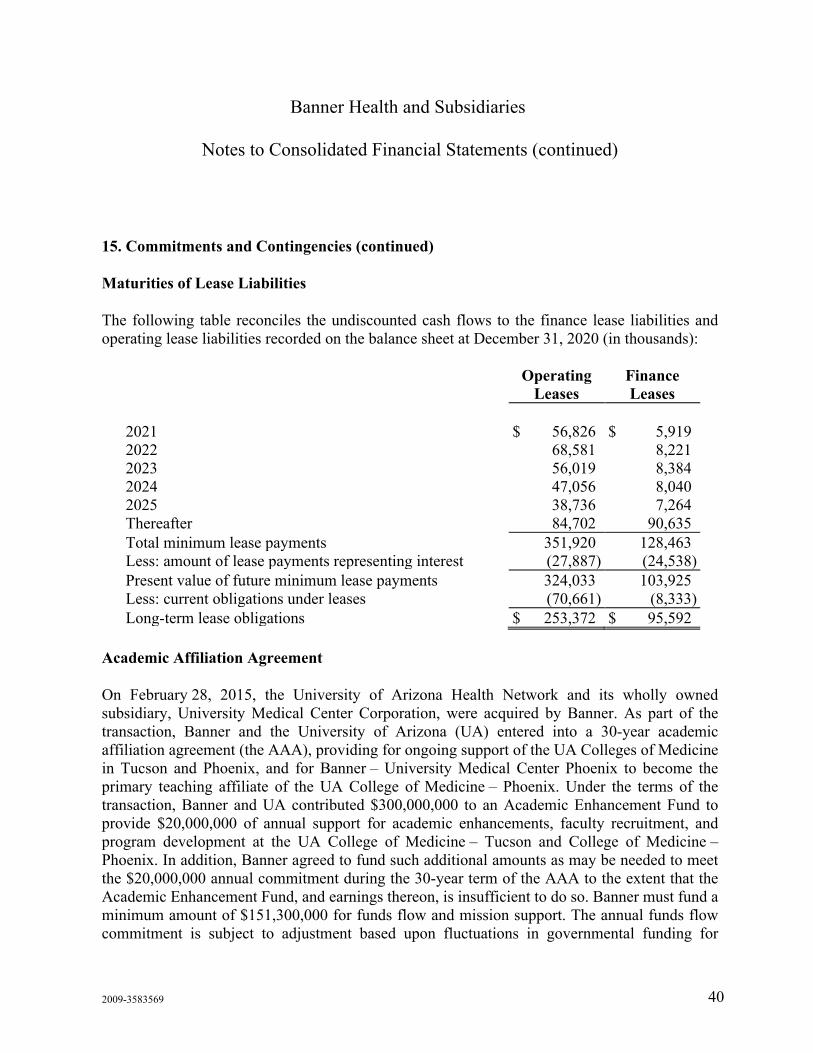
Banner Health and Subsidiaries
Notes to Consolidated Financial Statements (continued)
2009-3583569 40
15. Commitments and Contingencies (continued)
Maturities of Lease Liabilities
The following table reconciles the undiscounted cash flows to the finance lease liabilities and operating lease liabilities recorded on the balance sheet at December 31, 2020 (in thousands):
Operating Leases
Finance Leases
2021 $ 56,826 $ 5,919 2022 68,581 8,221 2023 56,019 8,384 2024 47,056 8,040 2025 38,736 7,264 Thereafter 84,702 90,635 Total minimum lease payments 351,920 128,463 Less: amount of lease payments representing interest (27,887) (24,538) Present value of future minimum lease payments 324,033 103,925 Less: current obligations under leases (70,661) (8,333) Long-term lease obligations $ 253,372 $ 95,592
Academic Affiliation Agreement
On February 28, 2015, the University of Arizona Health Network and its wholly owned subsidiary, University Medical Center Corporation, were acquired by Banner. As part of the transaction, Banner and the University of Arizona (UA) entered into a 30-year academic affiliation agreement (the AAA), providing for ongoing support of the UA Colleges of Medicine in Tucson and Phoenix, and for Banner – University Medical Center Phoenix to become the primary teaching affiliate of the UA College of Medicine – Phoenix. Under the terms of the transaction, Banner and UA contributed $300,000,000 to an Academic Enhancement Fund to provide $20,000,000 of annual support for academic enhancements, faculty recruitment, and program development at the UA College of Medicine – Tucson and College of Medicine – Phoenix. In addition, Banner agreed to fund such additional amounts as may be needed to meet the $20,000,000 annual commitment during the 30-year term of the AAA to the extent that the Academic Enhancement Fund, and earnings thereon, is insufficient to do so. Banner must fund a minimum amount of $151,300,000 for funds flow and mission support. The annual funds flow commitment is subject to adjustment based upon fluctuations in governmental funding for
Banner Health and Subsidiaries
Notes to Consolidated Financial Statements (continued)
2009-3583569 41
15. Commitments and Contingencies (continued)
graduate medical education. Banner funded approximately $282,988,000 and $302,872,000 relating to the AAA funds flow and mission support for the years ended December 31, 2020 and 2019, respectively.
Compliance with Laws and Regulations
The health care industry is subject to numerous laws and regulations of federal, state, and local governments. These laws and regulations include, but are not necessarily limited to, matters such as licensure, accreditation, government health care program participation requirements, reimbursement for patient services, and Medicare and Medicaid fraud and abuse. Government activity has increased with respect to investigations and allegations concerning possible violations of fraud and abuse statutes and regulations by health care providers. Violations of these laws and regulations could result in expulsion from government health care programs, together with the imposition of significant fines and penalties, as well as significant repayments for patient services previously billed. Compliance with such laws and regulations can be subject to future review and interpretation, as well as regulatory actions unknown or unasserted at this time.
16. COVID-19
The outbreak of COVID-19, a respiratory disease caused by a novel strain of coronavirus, has and will continue to have significant adverse impacts on the operations and financial condition of health care providers generally. The treatment of this contagious disease at health care facilities has resulted in a temporary shutdown or diversion of patients from those facilities and in staffing and supply shortages. Elective procedures and other patient care appointments are being deferred and individuals may otherwise avoid medical treatment unrelated to COVID-19, resulting in reduced patient volumes and operating revenues at outpatient facilities.
A variety of federal, state, and local efforts have been initiated in response to the COVID-19 crisis, the largest of which is the Coronavirus Aid, Relief and Economic Security Act (the CARES Act) that was enacted on March 27, 2020. The CARES Act is a federal stimulus package designed to provide emergency assistance to individuals and businesses, including hospitals and other health care providers. Banner has received approximately $452,000,000 in Provider Relief Funds from the CARES Act to cover unreimbursed health-care-related expenses attributable to the public health emergency and lost revenues resulting from COVID-19 as of December 31, 2020. Approximately $316,000,000 of these funds have been recognized as other operating revenue for the year ended December 31, 2020. Banner follows grant accounting to recognize the stimulus

Banner Health and Subsidiaries
Notes to Consolidated Financial Statements (continued)
2009-3583569 42
16. COVID-19 (continued)
funding as other operating revenue based on guidance from the U.S. Department of Health & Human Services. An additional $24,000,000 was recognized as an increase to unrestricted net assets as reimbursement for emergent capital purchases made in response to the pandemic. The remaining $112,000,000 is recorded as a current liability and is expected to be used to offset qualifying unreimbursed expenses or lost revenue related to the pandemic over the first half of 2021. In addition, Banner received $654,000,000 of Medicare Advance and Accelerated Payments, recorded as a current liability, to help support liquidity needs in the short term. The advanced payments will be recouped over 12 to 18 months, beginning in April 2021.

EY | Building a better working world
EY exists to build a better working world, helping to create long-term value for clients, people and society and build trust in the capital markets.
Enabled by data and technology, diverse EY teams in over 150 countries provide trust through assurance and help clients grow, transform and operate.
Working across assurance, consulting, law, strategy, tax and transactions, EY teams ask better questions to find new answers for the complex issues facing our world today.
EY refers to the global organization, and may refer to one or more, of the member firms of Ernst & Young Global Limited, each of which is a separate legal entity. Ernst & Young Global Limited, a UK company limited by guarantee, does not provide services to clients. Information about how EY collects and uses personal data and a description of the rights individuals have under data protection legislation are available via ey.com/privacy. EY member firms do not practice law where prohibited by local laws. For more information about our organization, please visit ey.com.
Ernst & Young LLP is a client-serving member firm of Ernst & Young Global Limited operating in the US.
© 2021 Ernst & Young LLP. All Rights Reserved.
ey.com