Embed Size (px)
Citation preview
Columbia Law School Columbia Law School
Scholarship Archive Scholarship Archive
Faculty Scholarship Faculty Publications
2007
Bankruptcy Decision Making: An Empirical Study of Continuation Bankruptcy Decision Making: An Empirical Study of Continuation
Edward R. Morrison Columbia Law School, [email protected]
Follow this and additional works at: https://scholarship.law.columbia.edu/faculty_scholarship
Part of the Bankruptcy Law Commons, Business Organizations Law Commons, and the Law and
Economics Commons
Recommended Citation Recommended Citation Edward R. Morrison, Bankruptcy Decision Making: An Empirical Study of Continuation, 50 J. L. & ECON. 381 (2007). Available at: https://scholarship.law.columbia.edu/faculty_scholarship/2265
This Article is brought to you for free and open access by the Faculty Publications at Scholarship Archive. It has been accepted for inclusion in Faculty Scholarship by an authorized administrator of Scholarship Archive. For more information, please contact [email protected].

381
[Journal of Law and Economics, vol. 50 (May 2007)]� 2007 by The University of Chicago. All rights reserved. 0022-2186/2007/5002-0014$10.00
Bankruptcy Decision Making: An EmpiricalStudy of Continuation Bias in Small-
Business Bankruptcies
Edward R. Morrison Columbia University
Abstract
Many small businesses attempt to reorganize under Chapter 11 of the U.S.Bankruptcy Code, but most are ultimately liquidated instead. Little is knownabout this shutdown decision. It is widely suspected that the bankruptcy processexhibits a continuation bias, allowing failing businesses to linger under theprotection of the court, which resists liquidation even when it is optimal. Thispaper examines the shutdown decision in a sample of Chapter 11 bankruptcycases filed in a typical bankruptcy court over the course of a year. The presenceof continuation bias is tested along several dimensions—the extent of managerialcontrol over the bankruptcy process, the accuracy and speed with which viableand nonviable businesses are distinguished, and the characteristics of the hazardof shutdown compared with the predictions of a formal model. Contrary toconventional wisdom, the paper finds that continuation bias is either absent orempirically unimportant.
1. Introduction
Many critics argue that Chapter 11 of the U.S. Bankruptcy Code is an inefficientmechanism for reorganizing financially distressed corporations. Chapter 11 isfederal law. It gives managers of distressed corporations a nonwaivable right tofile a bankruptcy petition and thereby halt all creditor collection efforts formonths (or years) as the managers draft and then negotiate a plan of reorgan-
I am grateful to the members of my thesis committee, Douglas Baird, Gary Becker, and SteveKaplan, for support and detailed comments. I also thank Jennifer Arlen, Kenneth Ayotte, Ian Ayres,Theodore Eisenberg, Jeffrey Gordon, Marcel Kahan, Avery Katz, Thomas Miles, Mark Ramseyer,Robert Rasmussen, Mark Roe, David Skeel, George Triantis, Elizabeth Warren, Eugene Wedoff, twoanonymous referees, and seminar participants at Vanderbilt University, Georgetown University, YaleUniversity, Columbia University, Northwestern University, University of Pennsylvania, New YorkUniversity, Cornell University, Harvard University, and University of Virginia for helpful comments.I am particularly indebted to the judges of the United States Bankruptcy Court for the NorthernDistrict of Illinois for permitting access to the court’s electronic records. Felton Booker, Jeong Song,Christopher Swart, and Robert Tennenbaum provided excellent research assistance. Financial supportfrom the John M. Olin Foundation and the Lynde and Harry Bradley Foundation is gratefullyacknowledged.
This content downloaded from 128.059.178.073 on September 27, 2018 12:05:34 PMAll use subject to University of Chicago Press Terms and Conditions (http://www.journals.uchicago.edu/t-and-c).
382 The Journal of LAW& ECONOMICS
ization. The process of drafting and negotiating a plan is costly. Bris, Welch, andZhu (2006) find that it generates direct administrative costs ranging from 2 to10 percent of firm value. The process also generates significant indirect costs, asHotchkiss (1995), Opler and Titman (1994), and others have emphasized. Busi-nesses that should be liquidated are allowed to linger indefinitely under theprotection of the court. Chapter 11 prevents or retards the reallocation of theassets even when a failing business’s assets may have greater value in the handsof another owner. Rent-seeking competition among secured and unsecured cred-itors dominates a process overseen by judges who lack business training and arebiased in favor of preserving businesses that should be liquidated (see, for ex-ample, Bris, Welch, and Schwartz 2005; Bebchuk and Chang 1992; Baird 1986).These ex post inefficiencies are as evident in large-business cases (Weiss andWruck 1998) as they are in small-business cases (Aghion, Hart, and Moore 1994,p. 871; LoPucki 1983), and as Schwartz (1997) argues, these inefficiencies increasethe cost of capital ex ante.
That is the traditional view of Chapter 11. In this paper, I present evidencethat challenges the traditional view as it applies to small-business Chapter 11cases.1 Using a sample of all corporate Chapter 11 filings in the Chicago areaduring 1998,2 I find that the direct and indirect costs of small-business Chapter11 cases are small. Nearly 60 percent of these businesses were shut down. Thecourt either dismissed the Chapter 11 case, permitting liquidation under statelaw, or converted it to a Chapter 7 proceeding under the U.S. Bankruptcy Code,which mandates automatic liquidation. Among businesses that were shut down,the decision to dismiss or convert the case came quickly. For 50 percent of thesebusinesses, the shutdown decision was made within 3 months of filing. For 70percent, it was made within 5 months. For the businesses that failed, then, theChapter 11 process was remarkably short. As a general matter, it took no moretime than did rival procedures.3
Moreover, the Chapter 11 process appears to sort effectively between businessesthat are viable and those that are not. Biases commonly ascribed to the systemare largely absent from the data. Neither creditors nor debtors (managers orequity holders) dominate the bankruptcy process. Instead, bankruptcy judgesplay a major role in filtering failing businesses from viable ones, and they appearto be able to do this job well. The businesses that are liquidated quickly exhibit
1 Small businesses make up the vast majority of the filings. Other recent empirical work, althoughnot focusing on small-business Chapter 11 cases, reinforces the view that the costs of reorganizationare not as large as usually thought (see, for example, Maksimovic and Phillips 1998; Andrade andKaplan 1998; Gilson 1997).
2 The filings were lodged in the United States Bankruptcy Court for the Northern District ofIllinois, Eastern Division, whose jurisdiction encompasses Chicago and outlying areas.
3 A mandatory auction regime would likely take between 2 and 9 months (see the sources citedin footnote 20). Thorburn (2000) finds that Swedish auctions take between 1.5 months (for themedian business) and 2.4 months (for the mean business). Other commonly proposed alternativesto Chapter 11—see, for example, Aghion, Hart, and Moore (1992)—contemplate a process that takesseveral months to run.
This content downloaded from 128.059.178.073 on September 27, 2018 12:05:34 PMAll use subject to University of Chicago Press Terms and Conditions (http://www.journals.uchicago.edu/t-and-c).
Small-Business Bankruptcies 383
markers of economic distress, such as an inability to pay ongoing expenses evenafter obtaining bankruptcy protection. In contrast, reorganized businesses exhibitmarkers of financial distress, such as overexpansion.
Finally, patterns characterizing the duration to shutdown—especially the non-monotonicity of the hazard rate and the inverse correlation between the hazardrate and the volatility of earnings—are consistent with an economic model ofoptimal decision making developed by Morrison (2003) and Baird and Morrison(1999, 2001). Taken together, these findings suggest that the small-business Chap-ter 11 process has significantly lower cost and displays significantly less bias thanis commonly thought.
Because the paper’s findings are based on data from small-business bank-ruptcies, I cannot, of course, generalize to cases involving large corporations,such as Conseco, Kmart, and United Airlines.4 The data are, however, well suitedto studying the costs of and potential bias in the Chapter 11 process generally.Small businesses have relatively simple operations and capital structures, andthe probability of shutdown in bankruptcy exceeds 50 percent (shutdown is arelatively rare event in large corporate bankruptcies). In addition, according tothe National Bankruptcy Review Commission (1997), small businesses make upat least 85 percent of all Chapter 11 filings.5 The findings presented here shedlight on the bankruptcy process in the vast majority of cases.
The paper is organized as follows. Section 2 describes the data set and presentssummary statistics. Section 3 shows that the data are inconsistent with conven-tional accounts of continuation bias. Section 4 examines the same data again,using a formal model of the shutdown decision, and again finds little evidenceof bias. Section 5 concludes.
2. Data Sources
The data are drawn primarily from case files of the Northern District of Illinois,Eastern Division (hereafter, Northern District), and from records of the Secretaryof State of Illinois. The Northern District was chosen because of the size of itsjurisdiction, its similarity to other courts, and the availability of data. TheNorthern District’s jurisdiction encompasses Chicago, Cook County, and out-lying counties within the Chicago-Naperville-Joliet metropolitan division—thethird largest in the United States (see U.S. Census Bureau 2003). Like mostbankruptcy courts, the Northern District receives Chapter 11 filings from pre-dominantly small businesses. During the 1990s, filings by large publicly tradedcorporations were generally filed in the District of Delaware and Southern District
4 These cases, like those studied in this paper, were filed in the Northern District of Illinois.5 A “small business” is defined as one with $5 million or less in debt. See National Bankruptcy
Review Commission (1997, p. 631).
This content downloaded from 128.059.178.073 on September 27, 2018 12:05:34 PMAll use subject to University of Chicago Press Terms and Conditions (http://www.journals.uchicago.edu/t-and-c).

384 The Journal of LAW& ECONOMICS
of New York (see, for example, Ayotte and Skeel 2006; Rasmussen and Thomas2000).6
I accessed the Northern District’s case files using an online database, PublicAccess to Court Electronic Records (PACER),7 which contains images of everyfiling and judicial order in cases filed after January 1, 1998. I supplemented thisdatabase with another, ILREC, an Illinois public records database available onLexis-Nexis. It identifies the founders, founding dates, and (where applicable)termination dates of most businesses in PACER.
This study focuses on outcomes in cases filed during 1998, the first year ofavailable data. For each case, I used PACER to obtain information about thebusiness’s finances (assets, debt, cash flow, and the like), history (including eventsthat led to the bankruptcy petition), and experience in bankruptcy (time inbankruptcy, types of motions filed by the debtor and its creditors, types of courtorders, and so on). The ILREC database was used to obtain information aboutthe dates of business founding and termination.
2.1. Sample Selection
According to Northern District records,8 184 Chapter 11 petitions were filedduring 1998 by corporations and individual debtors. Not all filings are relevantto the analysis here. This paper is concerned with the effect of Chapter 11 onthe reallocation of assets, especially the decision to reorganize or liquidate adistressed business. Chapter 11 filings by corporations outside the real estatesector present the simplest context in which to study this decision. Individualsmay file Chapter 11 petitions, but their filings involve two separate issues—afresh start for the individual and, sometimes, the continuation of a business.Only a fraction of all individual filings involve businesses. Some are submittedby individuals who want to avoid liquidation of nonexempt assets under Chapter7 of the Bankruptcy Code. The code offers individual debtors an opportunityto keep these assets by filing a Chapter 13 bankruptcy petition, but this type ofbankruptcy proceeding is available only to debtors with sufficiently small debts(see 11 U.S.C. sec. 109(e)). Thus, an individual may file a Chapter 11 petitionif he or she wants to avoid a Chapter 7 liquidation but fails the Chapter 13eligibility requirements. Even among Chapter 11 filings in which an individualseeks to preserve a sole proprietorship, it is difficult to study the effect of the
6 Matters have changed substantially in recent years. As LoPucki (2007) shows, three of the largestcorporate bankruptcies in U.S. history (Conseco, Inc., UAL Corp., and Kmart Corp.) were filed inthe Northern District of Illinois during 2002.
7 The database, Public Access to Court Electronic Records (PACER), is available for a fee (http://pacer.uscourts.gov). The Northern District waived the fee in my case.
8 The original list of filings was prepared at my request by the staff of the Northern District. Thelist includes 185 filings, but one is actually a 1997 filing, which was dropped. The list also excludesfour creditor-initiated, involuntary Chapter 7 cases that were later converted to Chapter 11 cases.
This content downloaded from 128.059.178.073 on September 27, 2018 12:05:34 PMAll use subject to University of Chicago Press Terms and Conditions (http://www.journals.uchicago.edu/t-and-c).
Small-Business Bankruptcies 385
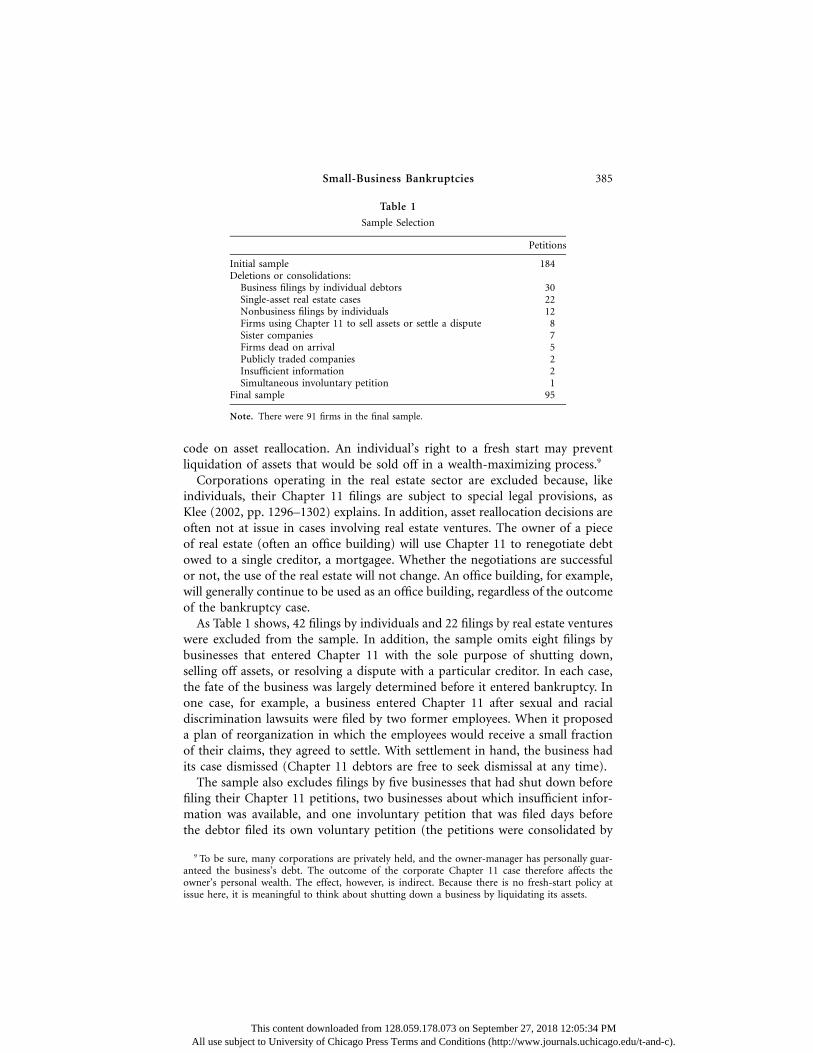
Table 1
Sample Selection
Petitions
Initial sample 184Deletions or consolidations:
Business filings by individual debtors 30Single-asset real estate cases 22Nonbusiness filings by individuals 12Firms using Chapter 11 to sell assets or settle a dispute 8Sister companies 7Firms dead on arrival 5Publicly traded companies 2Insufficient information 2Simultaneous involuntary petition 1
Final sample 95
Note. There were 91 firms in the final sample.
code on asset reallocation. An individual’s right to a fresh start may preventliquidation of assets that would be sold off in a wealth-maximizing process.9
Corporations operating in the real estate sector are excluded because, likeindividuals, their Chapter 11 filings are subject to special legal provisions, asKlee (2002, pp. 1296–1302) explains. In addition, asset reallocation decisions areoften not at issue in cases involving real estate ventures. The owner of a pieceof real estate (often an office building) will use Chapter 11 to renegotiate debtowed to a single creditor, a mortgagee. Whether the negotiations are successfulor not, the use of the real estate will not change. An office building, for example,will generally continue to be used as an office building, regardless of the outcomeof the bankruptcy case.
As Table 1 shows, 42 filings by individuals and 22 filings by real estate ventureswere excluded from the sample. In addition, the sample omits eight filings bybusinesses that entered Chapter 11 with the sole purpose of shutting down,selling off assets, or resolving a dispute with a particular creditor. In each case,the fate of the business was largely determined before it entered bankruptcy. Inone case, for example, a business entered Chapter 11 after sexual and racialdiscrimination lawsuits were filed by two former employees. When it proposeda plan of reorganization in which the employees would receive a small fractionof their claims, they agreed to settle. With settlement in hand, the business hadits case dismissed (Chapter 11 debtors are free to seek dismissal at any time).
The sample also excludes filings by five businesses that had shut down beforefiling their Chapter 11 petitions, two businesses about which insufficient infor-mation was available, and one involuntary petition that was filed days beforethe debtor filed its own voluntary petition (the petitions were consolidated by
9 To be sure, many corporations are privately held, and the owner-manager has personally guar-anteed the business’s debt. The outcome of the corporate Chapter 11 case therefore affects theowner’s personal wealth. The effect, however, is indirect. Because there is no fresh-start policy atissue here, it is meaningful to think about shutting down a business by liquidating its assets.
This content downloaded from 128.059.178.073 on September 27, 2018 12:05:34 PMAll use subject to University of Chicago Press Terms and Conditions (http://www.journals.uchicago.edu/t-and-c).

386 The Journal of LAW& ECONOMICS
Table 2
Firm Characteristics for the Northern District and the 1998 Survey ofSmall Business Finance (SSBF) Samples
Northern District SSBF
!20 employees, % 83.9 83.1Age in years, median (mean) 6.9 (12.6) 13.0 (13.7)Assets in dollars, median (mean) 114,160 (664,540) 320,971 (713,102)Debt in dollars, median (mean) 511,752 (2,429,858) 191,660 (462,848)Debt/assets, median (mean) 3.37 (16.82) .59 (.65)Standard Industrial Classification number, %:
Construction (15–17) 12.6 11.2Primary manufacturing (20–39) 10.5 11.7Transportation (40–46, 48) 4.2 3.3Wholesale trade (4813, 50–51) 3.2 11.3Retail trade (52–59) 11.6 15.2Eating and drinking places (58) 16.8 3.6Insurance agents and real estate (60–69) 3.1 2.7Business services (47, 49, 70–79) 21.1 23.9Professional services (80–89) 16.8 17.1
Note. The samples exclude farming, mining, and real estate. Reported means for the SSBF sample areestimates of population averages and were computed using survey weights. Reported medians are the 50thpercentile of the raw, unweighted data.
the bankruptcy court). The sample also consolidates filings by sister companies(the court did so as well), which reduced the number of filings by seven.10 Aftermaking these exclusions, the sample consists almost entirely of small, privatelyheld businesses. To preserve the homogeneity of the sample, filings by two largepublicly traded businesses were excluded as well. The final sample consists of95 filings by 91 businesses (three businesses filed multiple petitions during 1998;although each petition was counted separately,11 the analysis here would notchange in a meaningful way if the repeat filings were dropped).
2.2. Summary Statistics
The sample businesses are generally quite small, as Table 2 shows. While theU.S. Small Business Administration (2001, p. 18 n. 1) defines a small businessas one with fewer than 500 employees, 81 percent of the businesses in this studyhad fewer than 20 employees, and 96 percent had fewer than 100 employees.In terms of capital structure, the businesses were similarly small. Nearly 50percent had less than $100,000 in assets; 75 percent had less than $1 million.Perhaps unsurprisingly for these types of businesses, most were young; in 63percent of the cases, the business was less than 10 years old. They were also
10 For example, three outlets of one retailer filed separate Chapter 11 petitions. The court con-solidated these petitions; so does this study.
11 Although counted separately, these petitions are treated as potentially correlated cases in thestatistical analysis, which computes robust standard errors that permit correlation across petitionsfiled by the same business.
This content downloaded from 128.059.178.073 on September 27, 2018 12:05:34 PMAll use subject to University of Chicago Press Terms and Conditions (http://www.journals.uchicago.edu/t-and-c).
Small-Business Bankruptcies 387
owned and managed by a family or fewer than six investors (86 percent fellwithin this category).
Although small, the businesses in this sample are not markedly different fromsmall businesses generally. Table 2 compares the Northern District sample to theFederal Reserve Board’s 1998 Survey of Small Business Finances (SSBF), a na-tionally representative sample of businesses with 500 or fewer employees (seeBitler, Robb, and Wolken 2001).12 In over 80 percent of the cases in the SSBFsample and in the Northern District sample, the businesses have fewer than 20employees. The industrial composition of both samples is also roughly com-parable, the only noticeable differences being a smaller number of eating anddrinking places and a larger number of wholesale trade establishments in theSSBF. These differences surely reflect the relatively high failure rates in someindustries, such as restaurants. They may also reflect the small size of the samplestudied here (95 filings by 91 businesses). Other important differences includeage (the median SSBF business is twice as old), asset size (sample businesses arehalf as large), and leverage (five times as large in sample businesses). Thesedifferences reflect, in part, the distressed condition of the sample businesses.Most small businesses fail within the first 4–6 years of existence (Knaup 2005;Bates and Nucci 1989); cash and other assets diminish and debt burdens mountas they descend into bankruptcy.
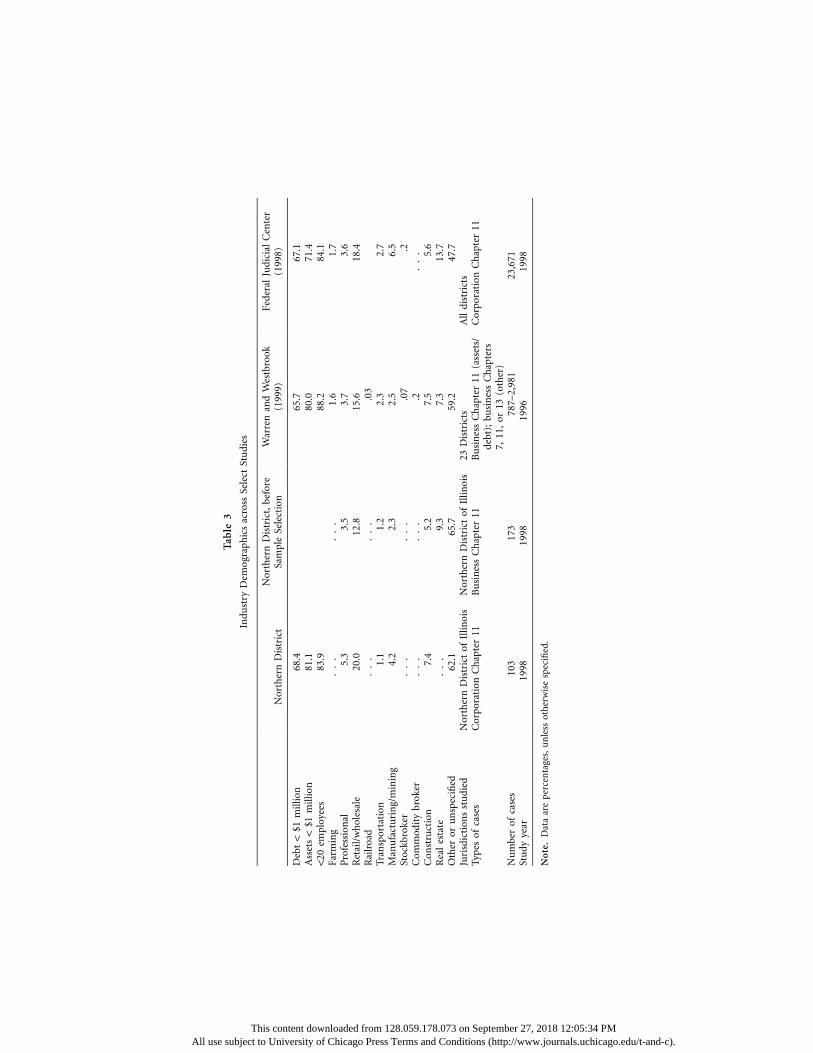
The characteristics of the Northern District cases are typical of small-businessbankruptcies throughout the country. Table 3 compares the Northern Districtsample to businesses in two recent surveys—the Warren and Westbrook (1999)study of bankruptcy filings in the most and least active court in every judicialcircuit in 1994 and the Federal Judicial Center (FJC) database of all Chapter 11cases closed during 1998 (see Federal Judicial Center 1998). Debt, asset, andemployment levels are similar across all surveys. For example, 68.4 percent ofbusinesses in the Northern District had less than $1 million in debt; the per-centages from the Warren and Westbrook and FJC surveys are 65.7 percent and73.4 percent, respectively. Industry demographics are somewhat comparableacross the surveys as well. Instead of the Standard Industrial Classification system,Table 3 uses the industry classifications listed on the “face sheet” of the bank-ruptcy petition.13 After sample selection (described in Table 1), Table 3 showsthat the sample employed here is roughly comparable, with a few exceptions,14
to those in other studies.
12 The survey excludes businesses operating in the agricultural, financial, and government sectors.The 1998 Survey of Small Business Finances data can be downloaded from the Federal Reserve BoardWeb site (http://www.federalreserve.gov/pubs/oss/oss3/ssbf98/ssbf98home.html).
13 This classification is seriously flawed, both because it is quite crude and because debtors arefrequently unsure about the appropriate classification for their businesses. Nevertheless, it is usedin the vast majority of studies, including Warren and Westbrook (1998, pp. 529–30). It is the onlybenchmark available.
14 As Table 3 shows, the Northern District survey contains fewer transportation and real estatebusinesses and more professional and unclassified businesses than both the Warren and Westbrook(1999) and Federal Judicial Center (1998) surveys. These differences, however, are largely a product
This content downloaded from 128.059.178.073 on September 27, 2018 12:05:34 PMAll use subject to University of Chicago Press Terms and Conditions (http://www.journals.uchicago.edu/t-and-c).
Tab
le3
Indu
stry
Dem
ogra
phic
sac
ross
Sele
ctSt
udi
es
Nor
ther
nD
istr
ict
Nor
ther
nD
istr
ict,
befo
reSa
mpl
eSe
lect
ion
War
ren
and
Wes
tbro
ok(1
999)
Fede
ral
Judi
cial
Cen
ter
(199
8)
Deb
t!
$1m
illio
n68
.465
.767
.1A
sset
s!
$1m
illio
n81
.180
.071
.4!
20em
ploy
ees
83.9
88.2
84.1
Farm
ing
..
..
..
1.6
1.7
Pro
fess
ion
al5.
33.
53.
73.
6R
etai
l/w
hol
esal
e20
.012
.815
.618
.4R
ailr
oad
..
..
..
.03
Tran
spor
tati
on1.
11.
22.
32.
7M
anu
fact
uri
ng/
min
ing
4.2
2.3
2.5
6.5
Stoc
kbro
ker
..
..
..
.07
.2C
omm
odit
ybr
oker
..
..
..
.2.
..
Con
stru
ctio
n7.
45.
27.
55.
6R
eal
esta
te.
..
9.3
7.3
13.7
Oth
eror
un
spec
ified
62.1
65.7
59.2
47.7
Juri
sdic
tion
sst
udi
edN
orth
ern
Dis
tric
tof
Illin
ois
Nor
ther
nD
istr
ict
ofIl
linoi
s23
Dis
tric
tsA
lldi
stri
cts
Type
sof
case
sC
orpo
rati
onC
hap
ter
11B
usi
nes
sC
hap
ter
11B
usi
nes
sC
hap
ter
11(a
sset
s/de
bt);
busi
nes
sC
hap
ters
7,11
,or
13(o
ther
)
Cor
pora
tion
Ch
apte
r11
Nu
mbe
rof
case
s10
317
378
7–2,
981
23,6
71St
udy
year
1998
1998
1996
1998
No
te.
Dat
aar
epe
rcen
tage
s,u
nle
ssot
her
wis
esp
ecifi
ed.
This content downloaded from 128.059.178.073 on September 27, 2018 12:05:34 PMAll use subject to University of Chicago Press Terms and Conditions (http://www.journals.uchicago.edu/t-and-c).

Small-Business Bankruptcies 389
2.3. Outcomes of Chapter 11 Cases
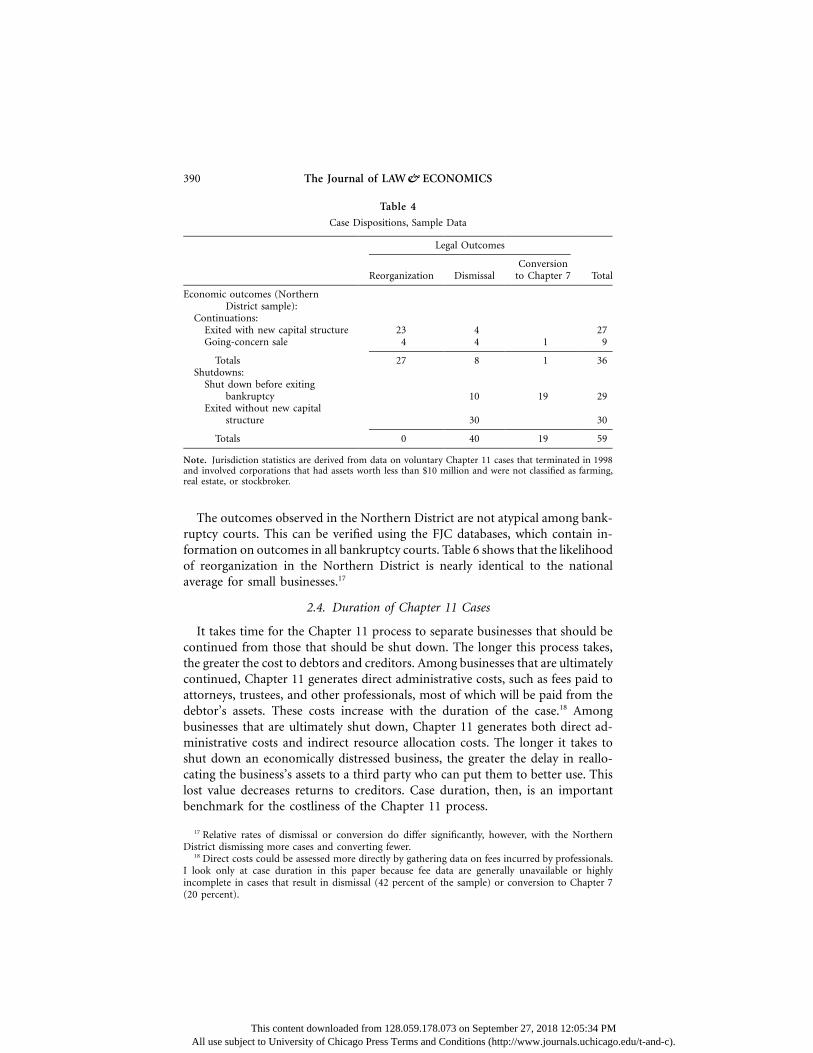
Thirty-six corporations—38 percent of the sample—emerged from bankruptcyintact, either through a debt restructuring or a going-concern sale. As Table 4illustrates, these continuations included 27 businesses that exited with a newcapital structure, either through a formal plan of reorganization or informalrenegotiation with key creditors (in which case, the business sought dismissalof the Chapter 11 proceeding after achieving the renegotiation). Another ninebusinesses underwent going-concern sales. Some sales were accomplished in thecontext of a plan of reorganization; others were consummated under section363 of the Bankruptcy Code (which allows sales of a business’s assets), and thedebtor sought dismissal or conversion to Chapter 7 when the sale was complete.
In 59 cases—62 percent of the sample—the business was shut down or forcedto exit Chapter 11 without a new capital structure, which in most cases resultedin the corporation’s liquidation. As Table 4 shows, these shutdowns included 29cases in which the debtor corporation was shut down and its assets distributedto creditors, either in a Chapter 7 proceeding or in state law proceedings afterthe case was dismissed. In the remaining 30 cases, the bankruptcy judge dismissedthe corporation’s bankruptcy petition and thereby exposed it to potential li-quidation under state law. The judge dismissed these cases for a variety of reasons,including the corporation’s failure to file financial schedules, pay fees, hire anattorney, or show that it had a reasonable chance of reorganizing successfully.In each case, the business exited without a new capital structure and was vul-nerable to suit by creditors in state courts. As Table 5 illustrates, most businessessuffered liquidation either immediately or soon after exiting bankruptcy. Thistable assumes that a business operated for an entire year if any evidence—drawnfrom Web sites, newspapers, public records maintained by the Illinois Secretaryof State, or subsequent bankruptcy petitions by the business or its owners—suggests that the corporation operated at any point during that year.15
Most businesses ceased operations immediately or within 1 year of exitingChapter 11. Thus, for the majority of businesses, dismissal of a Chapter 11petition is accompanied by a high probability of liquidation, much like a con-version to Chapter 7. A judge will often dismiss a case, instead of converting itto Chapter 7, if the debtor has no assets unencumbered by liens.16 With no assetsavailable to unsecured creditors, there is no benefit to a Chapter 7 proceeding,which generates administrative costs.
of the sample selection methodology used here. The second column shows that, if Chapter 11 filingsby real estate enterprises and individuals are added back to the sample, the differences across thesamples decrease substantially.
15 If, for example, Illinois records indicate that a business dissolved during the second year afterexiting bankruptcy, I assumed the business was active both years. If state records indicate that thebusiness dissolved in the same year that it exited bankruptcy, I assumed the business was activeduring that year only if other data sources confirmed the activity. Otherwise, I assumed the businessdissolved immediately after exiting.
16 Eugene R. Wedoff, former chief judge of the United States Bankruptcy Court for the NorthernDistrict of Illinois, personal interview with the author, December 3, 2002.
This content downloaded from 128.059.178.073 on September 27, 2018 12:05:34 PMAll use subject to University of Chicago Press Terms and Conditions (http://www.journals.uchicago.edu/t-and-c).
390 The Journal of LAW& ECONOMICS
Table 4
Case Dispositions, Sample Data
Legal Outcomes
TotalReorganization DismissalConversion
to Chapter 7
Economic outcomes (NorthernDistrict sample):
Continuations:Exited with new capital structure 23 4 27Going-concern sale 4 4 1 9
Totals 27 8 1 36Shutdowns:
Shut down before exitingbankruptcy 10 19 29
Exited without new capitalstructure 30 30
Totals 0 40 19 59
Note. Jurisdiction statistics are derived from data on voluntary Chapter 11 cases that terminated in 1998and involved corporations that had assets worth less than $10 million and were not classified as farming,real estate, or stockbroker.
The outcomes observed in the Northern District are not atypical among bank-ruptcy courts. This can be verified using the FJC databases, which contain in-formation on outcomes in all bankruptcy courts. Table 6 shows that the likelihoodof reorganization in the Northern District is nearly identical to the nationalaverage for small businesses.17
2.4. Duration of Chapter 11 Cases
It takes time for the Chapter 11 process to separate businesses that should becontinued from those that should be shut down. The longer this process takes,the greater the cost to debtors and creditors. Among businesses that are ultimatelycontinued, Chapter 11 generates direct administrative costs, such as fees paid toattorneys, trustees, and other professionals, most of which will be paid from thedebtor’s assets. These costs increase with the duration of the case.18 Amongbusinesses that are ultimately shut down, Chapter 11 generates both direct ad-ministrative costs and indirect resource allocation costs. The longer it takes toshut down an economically distressed business, the greater the delay in reallo-cating the business’s assets to a third party who can put them to better use. Thislost value decreases returns to creditors. Case duration, then, is an importantbenchmark for the costliness of the Chapter 11 process.
17 Relative rates of dismissal or conversion do differ significantly, however, with the NorthernDistrict dismissing more cases and converting fewer.
18 Direct costs could be assessed more directly by gathering data on fees incurred by professionals.I look only at case duration in this paper because fee data are generally unavailable or highlyincomplete in cases that result in dismissal (42 percent of the sample) or conversion to Chapter 7(20 percent).
This content downloaded from 128.059.178.073 on September 27, 2018 12:05:34 PMAll use subject to University of Chicago Press Terms and Conditions (http://www.journals.uchicago.edu/t-and-c).

Small-Business Bankruptcies 391
Table 5
Postbankruptcy Experience of Firms That Exited without aNew Capital Structure ( )N p 30
Frequency (%)
Evidence of shutdown:No evidence of postexit operations 12No evidence of operations more
than 1 year after exiting 7Total 19 (63.3)
Evidence of continuation:Survived more than 1 year 10Sold off as going concern within 1
year of exiting 1Total 11 (36.7)
Case duration is remarkably short in the Northern District, as Table 7 illus-trates. Among the 36 businesses that were continued, nearly two-thirds exitedin less than 1 year. More surprisingly, the Chapter 11 process identified over 70percent of nonviable businesses within 6 months; 44 percent were identifiedwithin 3 months. Only 8.5 percent of cases involving nonviable businesses (fivecases) were still ongoing after 1 year. Relative to any reasonable benchmark, aprocess that determines the fate of a business within 5 months is quick. Variousbusiness brokerages, for example, report that a period of between 4 and 9 monthsis typically needed to sell a business.19 Auctions in other contexts, such as FederalCommunications Commission spectrum auctions (Cramton 1997), typically re-quire a similar amount of time.
The Northern District’s speed may be atypical among bankruptcy courts gen-erally. Table 8 uses FJC (1998, 1999) data to compare case duration in theNorthern District with the duration in other jurisdictions. Unlike Table 7, whichmeasures duration from case filing to confirmation, dismissal, or conversion,Table 8 measures duration from filing to case closure. This is the only way tomeasure duration in the FJC data. Case closure, however, typically occurs monthsor even years after confirmation or conversion. The delay is caused by effortsto determine the claims and relative priority of creditors (especially in casesresulting in confirmation), sell assets, and recover preferential transfers.20 Theseefforts may be an important part of determining how the value of the businessis divided among claimants, but they have no bearing on the key economicdecision about how the business’s assets are deployed. That decision is made
19 Some examples include Sunbelt, Sell a Business: FAQ (Frequently Asked Questions) (http://www.sunbeltnetwork.com/sell-business/faq.jsp), which reports that a period of 60–180 days is oftenneeded to conduct a liquidation, and Brookmoor Adams Advisors, Frequently Asked Questions (http://www.brookmooradams.com/faq.htm), which reports a duration of 6–9 months.
20 For example, in a separate study of Northern District cases, Baird and Morrison (2005a, p. 968)found that most adversary proceedings were brought after confirmation or conversion. An adversaryproceeding is a bankruptcy procedure for recovering prebankruptcy payments to favored creditorsor other parties, disputing the validity or dischargeability of debt, and other limited purposes. Anadversary proceeding can greatly delay case closure.
This content downloaded from 128.059.178.073 on September 27, 2018 12:05:34 PMAll use subject to University of Chicago Press Terms and Conditions (http://www.journals.uchicago.edu/t-and-c).

392 The Journal of LAW& ECONOMICS
Table 6
Case Dispositions, %: Federal Judicial Center (1998, 1999) Data
Jurisdiction Reorganization DismissalConversion
to Chapter 7
Northern District ( )N p 470 33.2 43.6 23.2All jurisdictions ( )N p 13,457 30.7 29.9 39.4
Note. Statistics are derived from data on voluntary Chapter 11 cases that terminated in 1998 and involvedcorporations that had assets worth less than $10 million and were not classified as farming, real estate, orstockbroker.
when the court confirms, dismisses, or converts the case. Nonetheless, no com-prehensive studies have looked closely at the duration to these events. They haveinstead looked at the duration to case closure.
Using data on duration to case closure, Table 8 shows that, among casesresulting in confirmation, the median duration in the Northern District wassignificantly shorter (at the 1 percent level) than the median duration nationally.The opposite, however, is true for cases resulting in dismissal. In contrast toboth of these figures, the median duration to conversion does not differ signif-icantly between the Northern District and the rest of the nation. Taken togetherwith the statistics on outcomes by jurisdiction in Table 4, these observationssuggest that, relative to other jurisdictions, the Northern District reorganizesabout as many businesses but does so more quickly, dismisses more businessesbut does so more slowly, and converts fewer cases but does so in about the sameamount of time. Overall, decision making in the Northern District is faster thanthat in other jurisdictions. The analysis that follows should be viewed with thesedifferences in mind.21
3. Continuation Bias in Chapter 11 Cases
Traditional accounts of Chapter 11, such as LoPucki (1983), argue that thebankruptcy process is biased in favor of preserving businesses that are econom-
21 Among the possible reasons for faster decision making in the Northern District, the most likelyseems to be its motion practice, which is different from other courts. The Northern District permitsthe parties to a case to schedule motions (for example, a debtor’s motion to use cash collateral ora creditor’s motion to lift the automatic stay). In addition, motions are presented orally to the judge,who typically renders a decision by the end of the hearing (Eugene R. Wedoff, former chief judgeof the United States Bankruptcy Court for the Northern District of Illinois, personal interview withthe author, December 3, 2002; Squires 1998). Because only 2 days’ notice is required for mostmotions, a party can file a motion and receive a decision in days. (U.S. Bankruptcy Court for theNorthern District of Illinois [2003, rules 9013-1–9] explains that the notice period is enlarged to 20days for motions proposing the sale of assets outside the ordinary course, conversion to Chapter 7or dismissal, and other significant events. See also Fed. R. Bankr. P. 2002[a]). Opposing counsel neednot draft a response; he or she may present an argument orally to the judge. As a result, the judge’sdecision will be based not only on the paper record but also on open-ended discussion with theparties. Judges can respond quickly to news that a business is failing. By contrast, in other jurisdictionsmotions are filed with the court clerk, opportunity is given for opposing counsel to draft a response,and the judge often renders a decision without conducting a hearing. Weeks or months may passbefore a motion is decided.
This content downloaded from 128.059.178.073 on September 27, 2018 12:05:34 PMAll use subject to University of Chicago Press Terms and Conditions (http://www.journals.uchicago.edu/t-and-c).

Small-Business Bankruptcies 393
Table 7
Duration to Confirmation, Conversion, or Dismissal of Chapter 11 Casesin the Northern District Sample
Duration% All Cases
( )N p 95% Continuations
( )N p 36% Shutdowns
( )N p 59
≤1 month 4.2 .0 6.8≤3 months 31.6 11.1 44.1≤6 months 51.6 19.4 71.2≤9 months 76.8 58.3 88.1≤12 months 81.1 63.9 91.5Median duration (months) 5.7 8.3 3.4
ically distressed and should be liquidated immediately. This continuation bias,it is thought, arises from the control incumbent managers exercise over thebankruptcy process. The opposite bias could, of course, arise if creditors controlthe bankruptcy process. Seeking immediate payment, creditors could push theprocess toward liquidation of viable businesses.
Data from the Northern District offer three methods for testing whether theChapter 11 process exhibits either bias. One is based on the procedural historyof the bankruptcy case: if managers exercise significant control over the Chapter11 process, creditors should have little success in terminating a case—throughdismissal, conversion to Chapter 7, or lifting the automatic stay—without in-cumbent managers’ consent. If, instead, creditors control the bankruptcy process,we should see frequent, successful motions to terminate a case. A second test isbased on the postbankruptcy history of reorganized businesses: if a substantialnumber fail and subsequently reenter bankruptcy, managers may have sufficientcontrol over the process to prevent liquidation of nonviable businesses.22 A thirdtest is based on a comparison of businesses that are shut down in bankruptcywith those that exit intact: if these businesses are indistinguishable, the bank-ruptcy process may be catering to creditors (who force shutdown of viablebusinesses) or debtors (who force continuation of nonviable businesses). Thefollowing sections implement each test. As applied to the Northern District data,none of the tests points to the presence of significant continuation bias.
3.1. A Test Based on Procedural History
Continuation bias might be inferred from one party’s dominance of the pro-cess. LoPucki (1983), for example, found in his 1981 study of Chapter 11 casesfiled in St. Louis that the debtor was “in full control” because bankruptcy judgeswere passive and prevented creditors from exercising any meaningful influence
22 Hotchkiss (1995) and LoPucki and Kalin (2001) apply a similar test to study bias in the Chapter11 cases of large, publicly traded corporations. An even better test is one that tracks the assets oftroubled businesses (including businesses that do not resort to Chapter 11) and evaluates theirproductivity before and after the distress is resolved (either in or outside of a bankruptcy proceeding).Maksimovic and Phillips (1998) develop such a test. Data limitations make it impossible to implementit here.
This content downloaded from 128.059.178.073 on September 27, 2018 12:05:34 PMAll use subject to University of Chicago Press Terms and Conditions (http://www.journals.uchicago.edu/t-and-c).

394 The Journal of LAW& ECONOMICS
Table 8
Duration in Months to Case Closure in the Federal Judicial Center Data, 1998–99
Jurisdiction
Case Outcome
All Cases Reorganization Dismissal Conversion
Northern District:Median duration 18.9 21.4 12.0 51.1Closed within 12 months (%) 31.1Closed within 24 months (%) 57.9
All cases:Median duration 27.6 29.4 9.4 49.7Closed within 12 months (%) 23.4Closed within 24 months (%) 45.1
Note. Statistics are derived from data on voluntary Chapter 11 cases that closed in 1998 and involvedcorporations that had assets worth less than $10 million and were not classified as farming, real estate, orstockbroker.
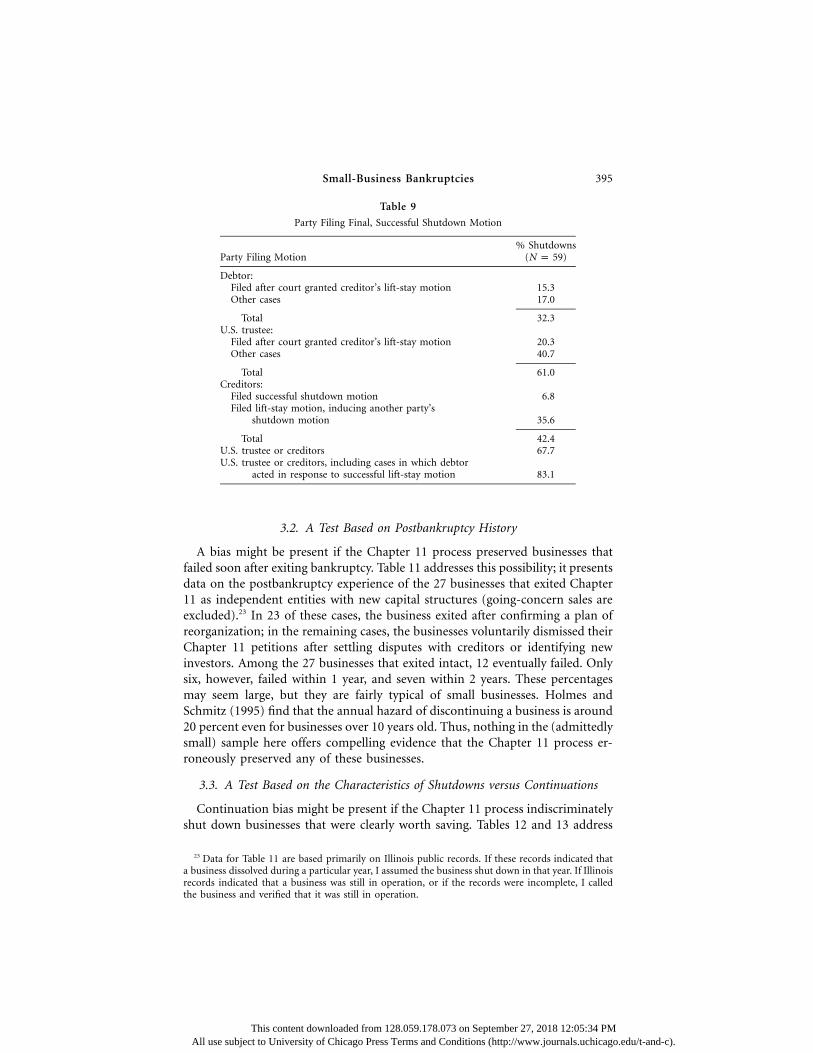
over the process. There is no evidence of similar control—either by debtors orcreditors—in the Northern District data. As Tables 9 and 10 illustrate, a partyother than the debtor was responsible for nearly 68 percent of all shutdowns.Here a shutdown motion is defined narrowly as a motion to dismiss or converta case to Chapter 7. Under this definition, about one-third of all shutdowns arevoluntary decisions by the debtor, who moved to dismiss or convert its ownChapter 11 filing. But this number is an overestimate because in nine cases (15.3percent of shutdowns) the debtor filed a shutdown motion after the court grantedcreditor motions to lift the automatic stay and seize core assets of the business.For these debtors, there was no meaningful choice other than to file a motionto convert or dismiss their petitions. These motions then arguably reflect creditorcontrol over the bankruptcy process. If we add them to the motions actuallyfiled by creditors and trustees, we find that a party other than the debtor wasactually or effectively responsible for 83 percent of all shutdowns. Thus, debtorsdid not dominate the process.
Nor did creditors or the U.S. trustee dominate the bankruptcy process. Courtsfrequently denied creditors’ motions to lift the automatic stay, dismiss or converta case to Chapter 7, or achieve other relief that would lead to shutdown. Forexample, creditors filed these motions in 67.7 percent of shutdowns (40 cases;see Table 10), but judges granted them in only 42 percent of the cases (25 cases;see Table 9). More strikingly, creditors filed at least one shutdown motion in58.4 percent of continuations (21 cases; see Table 10). Obviously, all of thesemotions were denied; the debtor business exited intact. The U.S. trustee filedsimilar, unsuccessful motions in 22.3 percent of continuations. These statisticsstrongly suggest that no party with a predictable bias—debtors or creditors—completely dominates the bankruptcy process; to the contrary, bankruptcy judgesappear to play an important role in determining when a business should be shutdown.
This content downloaded from 128.059.178.073 on September 27, 2018 12:05:34 PMAll use subject to University of Chicago Press Terms and Conditions (http://www.journals.uchicago.edu/t-and-c).
Small-Business Bankruptcies 395
Table 9
Party Filing Final, Successful Shutdown Motion
Party Filing Motion% Shutdowns
( )N p 59
Debtor:Filed after court granted creditor’s lift-stay motion 15.3Other cases 17.0
Total 32.3U.S. trustee:
Filed after court granted creditor’s lift-stay motion 20.3Other cases 40.7
Total 61.0Creditors:
Filed successful shutdown motion 6.8Filed lift-stay motion, inducing another party’s
shutdown motion 35.6
Total 42.4U.S. trustee or creditors 67.7U.S. trustee or creditors, including cases in which debtor
acted in response to successful lift-stay motion 83.1
3.2. A Test Based on Postbankruptcy History
A bias might be present if the Chapter 11 process preserved businesses thatfailed soon after exiting bankruptcy. Table 11 addresses this possibility; it presentsdata on the postbankruptcy experience of the 27 businesses that exited Chapter11 as independent entities with new capital structures (going-concern sales areexcluded).23 In 23 of these cases, the business exited after confirming a plan ofreorganization; in the remaining cases, the businesses voluntarily dismissed theirChapter 11 petitions after settling disputes with creditors or identifying newinvestors. Among the 27 businesses that exited intact, 12 eventually failed. Onlysix, however, failed within 1 year, and seven within 2 years. These percentagesmay seem large, but they are fairly typical of small businesses. Holmes andSchmitz (1995) find that the annual hazard of discontinuing a business is around20 percent even for businesses over 10 years old. Thus, nothing in the (admittedlysmall) sample here offers compelling evidence that the Chapter 11 process er-roneously preserved any of these businesses.
3.3. A Test Based on the Characteristics of Shutdowns versus Continuations
Continuation bias might be present if the Chapter 11 process indiscriminatelyshut down businesses that were clearly worth saving. Tables 12 and 13 address
23 Data for Table 11 are based primarily on Illinois public records. If these records indicated thata business dissolved during a particular year, I assumed the business shut down in that year. If Illinoisrecords indicated that a business was still in operation, or if the records were incomplete, I calledthe business and verified that it was still in operation.
This content downloaded from 128.059.178.073 on September 27, 2018 12:05:34 PMAll use subject to University of Chicago Press Terms and Conditions (http://www.journals.uchicago.edu/t-and-c).

396 The Journal of LAW& ECONOMICS
Table 10
Motions Filed by Trustees and Creditors
Party Filing Motion ≥2 At least 1
Trustee:% Shutdowns 5.1 61.0% Continuations 5.6 22.3% All cases 5.3 46.3
Creditors:% Shutdowns 35.5 67.7% Continuations 25.1 58.4% All cases 31.6 63.9
Note. For shutdowns, N p 59; for continuations, N p 36;for all cases, N p 95.
this possibility.24 A business should be preserved if it suffers financial, not eco-nomic, distress. Because financial and economic distress are hard to distinguishempirically, Table 12 reports the frequency with which certain markers of eco-nomic distress were observed in the sample businesses. A business in economicdistress cannot rescue its business in Chapter 11. Nonetheless, the business mayenter bankruptcy in order to delay liquidation, extract concessions from creditors,or gamble on the business’s resurrection (see Baird and Morrison 2005b). Toaccomplish these goals, a business in economic distress will often ignore pro-cedural requirements, suspend payment for ongoing expenses, and try to divertvalue to insiders. I call these markers of economic distress.
Table 12 reports the frequency with which businesses exhibited these markers.Here I code a business as exhibiting a particular marker only if, in response tothe marker, the court dismissed the case or converted it to Chapter 7.25 Amongbusinesses that were shut down, about 79 percent exhibited obvious markers ofeconomic distress. It appears then that the Chapter 11 process is generally liq-uidating businesses that merit liquidation.
A similar story is told by Table 13, which reports the frequency with whichmarkers of financial distress were observed in the sample businesses. A businesssuffering financial, not economic, distress would be profitable but for its debtburden, which it shoulders as a result of unexpected shocks or past mistakes.Unexpected shocks include cash shortages from the bankruptcy of a major cus-tomer; past mistakes include overexpansion, cost overruns, malfeasance of formermanagers, and torts.26 Among businesses that exited bankruptcy intact, 71 percentexhibited these indicators of financial distress. Forty percent were recoveringfrom overexpansion; about 9 percent suffered temporary cash shortages from
24 Here the sample is limited to the 91 unique businesses in the sample; of these, 56 were shutdown.
25 Baird and Morrison (2005b) present additional detail on the methodology for coding the cases.26 These data were obtained from documents filed by the debtor business. Typically, a motion to
use cash collateral, disclosure statement, or other filing would contain at least a paragraph describingthe reasons for the debtor’s distress.
This content downloaded from 128.059.178.073 on September 27, 2018 12:05:34 PMAll use subject to University of Chicago Press Terms and Conditions (http://www.journals.uchicago.edu/t-and-c).

Small-Business Bankruptcies 397
Table 11
Postbankruptcy Experience of Firms That Exited withNew Capital Structures
PostbankruptcyExperience
Reorganizations( )N p 23
Reorganizationsand Dismissals
( )N p 27
% Frequency % Frequency
Failed within 1 year 17.4 4 22.2 6Failed in 1–2 years 4.3 1 3.7 1Failed 2� years later 17.4 4 18.5 5
Total failures 39.1 9 44.4 12
the loss of customers who had gone bankrupt or breached significant contracts;another 9 percent suffered cash shortages because they had underestimated thecosts of reconfiguring assets (converting a restaurant to a lounge would be anexample). These indicators of financial distress also characterized about 25 per-cent of businesses that were shut down.27 But most of these businesses exhibitedmarkers of both financial and economic distress. Only about 10 percent ofshutdowns exhibited markers of financial distress but no markers of economicdistress. Together, these figures suggest that the Chapter 11 process in theNorthern District did not systematically preserve nonviable businesses or liq-uidate viable ones.
4. A Formal Test of Continuation Bias
A basic task of the Chapter 11 process is to distinguish—filter—viable busi-nesses worth reorganizing from nonviable businesses that should be shut down(see White 1994). As Table 4 illustrates, the debtor exited bankruptcy intact inonly 36 of the 95 Chapter 11 petitions filed in the Northern District—less than40 percent. The bankruptcy process therefore filters the bulk of filings intoliquidation. Filtering is typically accomplished by granting the motion of a cred-itor or the U.S. trustee to lift the automatic stay and allow seizure of core assets,to dismiss the case and allow creditors to resort to their state law remedies, orto convert the case to Chapter 7 and commence liquidation. As Tables 9 and10 illustrate, these motions are made repeatedly during a Chapter 11 case beforea judge finally grants one. In this section, I develop a model of optimal filtering
27 This percentage understates the frequency with which shutdowns exhibited markers of financialdistress. Case files are much less extensive for businesses that are shut down than for businesses thatexit intact. The document with the most detailed information about the business—the disclosurestatement—is filed only when the debtor has assembled a plan of reorganization. But a plan ofreorganization is rarely assembled in cases that result in shutdown. In these cases, markers of financialdistress must instead be inferred from motions filed by the debtor (for example, motions to usecash collateral). If motions are not filed, or if they do not contain adequate information about thebusiness’s financial history, it is impossible to determine whether the business exhibited markers offinancial distress.
This content downloaded from 128.059.178.073 on September 27, 2018 12:05:34 PMAll use subject to University of Chicago Press Terms and Conditions (http://www.journals.uchicago.edu/t-and-c).

398 The Journal of LAW& ECONOMICS
Table 12
Evidence of Economic Distress
% Frequency
Ignored procedural requirements 62.5 35Failed to pay ongoing expenses 26.8 15Using Chapter 11 to favor insider creditors 1.8 1Any evidence of economic distress 78.6 44
and use its implications as a benchmark for evaluating outcomes in the NorthernDistrict.
4.1. A Simple Model of the Shutdown Decision
The process of filtering is analogous to a matching problem: the goal of thebankruptcy system is to identify good matches between businesses and the op-portunity to reorganize under Chapter 11 of the Bankruptcy Code. As conven-tionally understood, good matches involve businesses whose going-concern valueexceeds their liquidation value (this is called going-concern surplus). Going-concern surplus could derive from asset specificity, although Baird and Morrison(2005b) argue that this is unlikely because most small businesses have few spe-cialized assets other than the human capital of the owner-manager. Suplus couldinstead derive from synergies between the owner-manager’s human capital andthe business’s physical capital. Or it could derive from the transactions coststhat would be incurred if the physical assets were reallocated. These costs mightexceed the additional return the assets would generate in another owner-manager’s hands. Baird and Morrison (2005a) do not rule out these possibilities,and this paper takes no position on the source of going-concern surplus in smallbusinesses. This paper assumes, instead, that judges are trying to preserve busi-nesses with going-concern surplus, however defined. This may not be the sociallyoptimal goal, especially if surplus is absent from all businesses, but it is the goalthat the Bankruptcy Code directs judges to pursue.28 If data show that judicialbehavior is in fact consistent with pursuit of this goal, the data provide additionalevidence that judges do not display a systematic bias in favor of continuing orliquidating small businesses.
A business’s going-concern value will be uncertain at the outset of a bank-ruptcy case. This uncertainty will gradually decline as information is retrieved.As uncertainty declines and the parties update their beliefs regarding the valueof the business, they must decide whether reorganization efforts should continueor terminate. If termination is most attractive, creditors and the U.S. trustee willfile motions to dismiss the case, convert to Chapter 7, or lift the automatic stay
28 See, for example, United States v. Whiting Pools (462 U.S. 198, 202 [1983]): “By permittingreorganization, Congress anticipated that the business would continue to provide jobs, to satisfycreditors’ claims, and to produce a return for its owners. . . . Congress presumed that the assets ofthe debtor would be more valuable if used in a rehabilitated business than if ‘sold for scrap.’”
This content downloaded from 128.059.178.073 on September 27, 2018 12:05:34 PMAll use subject to University of Chicago Press Terms and Conditions (http://www.journals.uchicago.edu/t-and-c).

Small-Business Bankruptcies 399
Table 13
Evidence of Financial Distress
Shutdowns( )N p 59
Continuations( )N p 36
% Frequency % Frequency
Overexpansion 8.5 5 40.0 14Prepetition fraud or malfeasance 3.4 2 8.6 3Cash shortages from loss of customers 10.2 6 8.6 3Cost overruns from reconfiguring business 3.4 2 11.4 4Asbestos liability .0 0 2.9 1Any evidence of financial distress 25.4 15 71.4 25Any evidence of financial distress, excluding
cases exhibiting economic distress 10.2 6 71.4 25
to permit seizure of core assets. A debtor too may realize that its prospects arepoor and voluntarily seek dismissal or conversion. This is likely when neitheroutside lenders nor existing creditors will offer additional financing. A judge willgenerally grant a debtor’s motion to dismiss or convert; under the code, a debtorcan initiate or terminate a case at will, with some exceptions. A creditor’s motionwill be granted only after the judge independently assesses the value of thebusiness.
This process can be studied formally using a simple matching model29 drawnfrom the optimal stopping and job search literatures30 and set out in the Ap-pendix. This model allows us to identify characteristics of an ideal bankruptcyprocess that optimally filters good from bad matches as information about busi-ness quality is updated over time. For analytic convenience, the model assumesthat a wealth-maximizing planner (called, for convenience, the judge) runs theprocess. In reality, of course, the outcomes of the bankruptcy process are de-termined by negotiation and bargaining among debtors, creditors, trustees, andjudges. The model merely provides a theoretical benchmark against which wecan evaluate bankruptcy outcomes and test for the presence of continuationbias.
Two important implications emerge from this model. First, if a business’sestimated going-concern value at filing (G) is not significantly above or belowits liquidation value (L), the outcome of its Chapter 11 case should be correlatedwith the degree of uncertainty (U) surrounding the going-concern value. Thegreater the uncertainty, the longer the bankruptcy process should continue beforethe shutdown option is exercised. This is an options effect and reflects the
29 The process could also be analyzed using a real options model. The implications are roughlythe same, as Baird and Morrison (1999) show. Chen and Sundaresan (2003) develop a more generalmodel of the shutdown decision and extend it to consider debtor-in-possession financing.
30 These literatures study the optimal time to terminate an ongoing process; applications includea business’s decision to abandon a troubled project (Dixit and Pindyck 1994), a worker’s decisionto discontinue job search (Jovanovic 1979), and a counterparty’s decision to repudiate an ongoingcontract (Triantis and Triantis 1998).
This content downloaded from 128.059.178.073 on September 27, 2018 12:05:34 PMAll use subject to University of Chicago Press Terms and Conditions (http://www.journals.uchicago.edu/t-and-c).

400 The Journal of LAW& ECONOMICS
asymmetric effect of uncertainty in this context. The greater the uncertainty, thegreater the probability the business will prove to be a good match tomorrow.There is, of course, a higher probability that the business will prove to be a badmatch, but the business’s assets can be sold if this happens. The business’sliquidation value offers a hedge against the downside risk from waiting to liq-uidate.31 All else equal, then, the greater the uncertainty surrounding businessvalue, the longer a business should spend in Chapter 11.
This options effect, however, will be absent in cases in which the business’sgoing-concern value G is significantly above or below its liquidation value L. IfG is significantly above L, it is virtually certain that the business will be reor-ganized or restructured in bankruptcy. The probability of shutdown will be zeroor close to it, and the business will exit bankruptcy quickly. Conversely, if G issignificantly below L, the business will be shut down immediately.
The second implication of the model is that the probability (or hazard rate)of exercising the shutdown option should be hump shaped over time—lowinitially, then rising, and ultimately declining.32 The probability should be lowwhen a business first enters the bankruptcy process because uncertainty is high.As information is obtained and uncertainty resolved, the parties (debtor, cred-itors, judge) should have stronger incentives to exercise the option. The prob-ability of shutdown will therefore rise as ventures with no viability are discoveredand abandoned. Once the shutdown option is exercised in these cases, however,the only remaining ventures will be those with relatively high profitability (forthem, the shutdown option is “out of the money”) or those with highly uncertainprofitability. Some of these businesses will never be shut down; others will beshut down only after a delay, during which the decision maker gathers infor-mation about the businesses’ viability. Thus, the probability of shutdown shouldfall gradually over time. This is a selection effect.33
These two implications—the options effect and the selection effect—providesimple yet theoretically coherent benchmarks for evaluating existing practice inbankruptcy courts.
4.2. Evidence of the Selection Effect
The selection effect is evident in Figure 1, which shows a hump-shaped prob-ability of shutdown. The likelihood of shutdown (displayed in black bars) in-
31 Guiso and Parigi (1999) show that this implication can be reversed under certain conditions,although they find the options effect in their empirical work. The effect has also been observed inother studies, including Moel and Tufano (2002) and Ghosal and Loungani (2000).
32 Technically, the hump shape will characterize the probability (or hazard) of shutdown only ifthe value of the venture (going-concern value) is at least as great as its liquidation value when thedecision maker first considers whether to exercise the shutdown option. Otherwise, the business willbe shut down immediately. In the context of Chapter 11, this means that a hump-shaped patternwill be observed if most businesses file petitions only when their value as going concerns is at leastas great as their liquidation values (that is, few businesses file petitions when they are destined tobe shut down immediately by the bankruptcy judge).
33 This effect has been verified empirically in work applying matching models to labor markets(see, for example, Lane and Parkin 1998).
This content downloaded from 128.059.178.073 on September 27, 2018 12:05:34 PMAll use subject to University of Chicago Press Terms and Conditions (http://www.journals.uchicago.edu/t-and-c).

Small-Business Bankruptcies 401
Figure 1. Months to exit: frequencies for shutdowns and continuations
creases during the first 3 months of a bankruptcy petition, reaches a maximumaround 3 months, and then falls. Using a normal approximation to the binomial,as suggested by Chapman and Southwick (1991), the increase from months 1to 3 and the decrease from months 3 to 9 are both significant at the 5 percentconfidence level. Figure 2 plots the monthly hazard rate of shutdown, which iscomputed as the ratio of the number of businesses shut down to the numberof businesses not yet shut down in each month.34 Here, the increase from months1 to 3 is significant at the 5 percent level; the decrease from months 3 to 9 issignificant at the 10 percent level.
The hump-shaped pattern suggests an absence of continuation bias. Thisevidence must, of course, be seen in conjunction with the rest. By itself, thehump-shaped pattern is not conclusive; processes could produce it as well. Sup-pose, for example, that Northern District bankruptcy judges flip coins to de-termine a business’s fate and that, for some reason, most judges flip their coinswhen the case reaches the 3-month mark but some flip it earlier and some later.A decision-making rule of this sort would yield a similar hump-shaped pattern.But this sort of rule is inconsistent with the evidence presented in the previoussections, which shows that Northern District judges sort effectively between viableand nonviable businesses. Viewed in light of this evidence, the hump-shapedpatterns in Figures 1 and 2 offer additional reason to believe that continuationbias is absent in the Northern District.
34 I code a business as not yet shut down even if it has left the sample because it has been reorganized.I am implicitly assuming that such a business, which was cured of its financial distress, would nothave been shut down even if it remained in bankruptcy for an extended period.
This content downloaded from 128.059.178.073 on September 27, 2018 12:05:34 PMAll use subject to University of Chicago Press Terms and Conditions (http://www.journals.uchicago.edu/t-and-c).

402 The Journal of LAW& ECONOMICS
Figure 2. Months to exit: hazard rate for shutdowns
4.3. Evidence of the Options Effect
Three variables drive the options effect: a business’s estimated going-concernvalue (G), the uncertainty surrounding that estimate (U), and the liquidationvalue of the business’s assets (L). If the difference between G and L is not large,an increase in U should increase the amount of time that a business spends inChapter 11. It could also increase the probability that a business exits bankruptcyintact, but only if the business is reorganized or sold off at a point when significantuncertainty about its viability remains. This might occur, for example, if theparties to the bankruptcy process believe that it is cheaper to monitor the busi-ness’s viability outside of Chapter 11.
4.3.1. Proxies for Key Variables
The variable L can be estimated using a debtor’s financial schedules, whichoffer rough estimates (usually book value) of the value of its assets. We can,however, develop only rough proxies for G and U. The bankruptcy filings provideonly cursory information about the prepetition financial performance of theseprivately held businesses. Proxies for U can be derived from the observed vol-atility surrounding earnings of businesses in the same industry. One such proxyis the standard deviation of monthly returns on a portfolio of publicly tradedbusinesses in the same industry.35 This variable (Stockmarket Volatility) assumes
35 The proxy is computed using data from 1995–97, the 3 years prior to the bankruptcy filings inthis study (a 3-year window appears to be a standard time frame for assessing volatility). The stockreturn data were taken from (French 2006).
This content downloaded from 128.059.178.073 on September 27, 2018 12:05:34 PMAll use subject to University of Chicago Press Terms and Conditions (http://www.journals.uchicago.edu/t-and-c).
Small-Business Bankruptcies 403
a (weak) correlation between the volatility surrounding the earnings of publiclytraded businesses and those of privately held businesses in the same industry.
Another proxy for U is the cross-sectional variation in profitability amongsmall businesses in the same industry (and the same metropolitan area), whichcan be derived from the 1998 SSBF data. Because it uses data on small busi-nesses—the focus of this paper—this measure (SSBF Volatility) has advantagesrelative to stock market volatility. On the other hand, the latter measure istheoretically more attractive because it is based on variation in profitability withinbusinesses over time, not profitability across businesses at a single point in time.
A final proxy for U is the proportion of small businesses within a particularindustry that “die” each year (Industry Attrition Rate). The U.S. Census Bureauoffers dynamic data tracking the births and deaths of small businesses over time.36
Deaths are defined as closures, which could result from liquidation or frommerger with another business. Using these data, we can derive an average prob-ability (over the period 1995–97) that a business within a particular industrywill die over the course of a year. This measure is a useful proxy for U becauseit offers a rough measure of the relative risk of shutdown across industries.
Proxies for going-concern value (G) are harder to find. If we assume that abusiness’s going-concern value is correlated with industry conditions, one proxyfor a business’s G is the growth rate of earnings, employment, or number ofbusinesses in the same industry. If an industry is growing relatively fast, businessesin that industry may have relatively high going-concern values.
An alternative measure of G is whether the sample business entered bankruptcyas a result of overexpansion. As noted before, such a business is likely sufferingfinancial distress and may have going-concern surplus if it scales back its op-erations. Another, similar measure is whether the sample business, after enteringbankruptcy, filed a motion to use cash collateral. Many businesses have givenlenders security interests in cash and accounts receivable. To access these sourcesof liquidity, the businesses must obtain permission from either the lenders orthe court. In practice, courts are reluctant to grant permission over the objectionof lenders.37 Knowing this, debtor businesses rarely file motions to use cashcollateral without first obtaining the lenders’ permission. The filing of a motionto use cash collateral, then, offers some evidence that both the debtor and itsprimary creditors believe that the business has value as a going concern.
The difficulty with these proxies is that not all sample businesses with sig-nificant going-concern surplus will have suffered overexpansion problems orneed to file motions to use cash collateral. Thus, these proxies identify only someof the businesses with relatively high values for G.
36 Dynamic data on establishment births and deaths are constructed by the U.S. Census Bureaufor the United States Small Business Administration. See United States Small Business Administration,Office of Advocacy, Firm Size Data (http://www.sba.gov/advo/research/data.html). For more infor-mation, see Armington (1998).
37 Eugene R. Wedoff, former chief judge of the United States Bankruptcy Court for the NorthernDistrict of Illinois, personal interview with the author, December 3, 2002.
This content downloaded from 128.059.178.073 on September 27, 2018 12:05:34 PMAll use subject to University of Chicago Press Terms and Conditions (http://www.journals.uchicago.edu/t-and-c).
404 The Journal of LAW& ECONOMICS
These variables—L, G, and U—are not the only plausible factors affecting thelikelihood of shutdown in bankruptcy. Another factor is the business’s liquidity,as measured by cash holdings at the beginning of the case. Businesses withsignificant cash holdings are less dependant on outside sources of liquidity andmay be able to survive longer in Chapter 11. Another factor is the degree ofcreditor control, which can affect the amount of time a business spends inbankruptcy. I use several proxies for creditor control: leverage (debt divided byassets), the extent to which the business’s assets are encumbered by securityinterests, and whether the owner personally guaranteed the business debts. Otherfactors that may affect the shutdown decision are business characteristics (age,prior bankruptcy experience) and whether the business complied with bank-ruptcy procedures (by, for example, filing the requisite schedules).
4.3.2. Univariate Tests
An initial look at these variables is set out in Tables 14 and 15. Table 14compares businesses that exited before and after the median case duration. Themedian duration for shutdowns was 4 months. The median duration for thefull sample was 6 months. Table 15 compares shutdowns with businesses thatexited intact.
The proxies for U offer mixed results. Table 14 shows that two proxies—stockmarket volatility and SSBF volatility—are larger among cases where theduration to shutdown or exit exceeded the median (I call these “slow shutdowns”and “slow exits”). This is consistent with the options effect, but the results areonly marginally significant. The same pattern is evident in Table 15. The thirdproxy for U—industry attrition—is larger among slow shutdowns than amongquick shutdowns, which is also consistent with the options effect. In the fullsample, we see the opposite pattern: industry attrition is larger among quickthan among slow exits (Table 14) and among shutdowns than among contin-uations (Table 15). The differences, however, are not statistically significant.
The proxies for G are somewhat mixed as well. Industry growth—the averageannual increase in the number of businesses, by industry, during 1995–97—doesnot vary significantly between quick and slow shutdowns or between quick andslow exits (see Table 14) but is significantly larger among shutdowns than amongcontinuations (see Table 15). The same pattern emerges when we analyze theaverage annual increase in employment, by industry, for the same period. Thismay suggest that industry growth is a poor proxy for G, or it may reflect thepossibility that industries with high growth rates also have high earnings volatility(the correlation with stockmarket volatility is .35). The other proxies for G—overexpansion and motion to use cash collateral—exhibit patterns more con-sistent with the matching model: they are larger on average in cases that resultedin slow shutdown, slow exit, and continuation.
The remaining summary statistics in Tables 14 and 15 exhibit interestingpatterns. Table 14, for example, shows that quick shutdowns involved business
This content downloaded from 128.059.178.073 on September 27, 2018 12:05:34 PMAll use subject to University of Chicago Press Terms and Conditions (http://www.journals.uchicago.edu/t-and-c).

Tab
le14
Dif
fere
nce
sbe
twee
nC
ases
Term
inat
ing
befo
rean
daf
ter
Med
ian
Cas
eD
ura
tion
Cat
egor
y
Shu
tdow
ns
All
Cas
es
Qu
ick
Shu
tdow
ns
(≤4
Mon
ths)
Slow
Shu
tdow
ns
( 14
Mon
ths)
Qu
ick
Exi
ts(≤
6M
onth
s)Sl
owE
xits
(16
Mon
ths)
Stoc
km
arke
tvo
lati
lity
(U)
4.12
4(.
085)
4.24
8(.
121)
4.21
3(.
102)
4.28
9(.
093)
SSB
Fvo
lati
lity
(U)
.177
(.00
3).1
80(.
003)
.177
(.00
2).1
83∧
(.00
3)In
dust
ryat
trit
ion
rate
(U)
10.0
42(.
260)
10.5
24#
(.24
4)10
.123
(.21
2)10
.094
(.23
6)In
dust
rygr
owth
rate
(G)
1.32
8(.
201)
1.48
0(.
214)
1.21
1(.
171)
.975
(.18
0)O
vere
xpan
sion
prob
lem
s(G
).1
18(.
056)
.24*
(.08
7).2
24(.
060)
.478
**(.
074)
Cas
hco
llate
ral
mot
ion
s(G
).2
35(.
074)
.640
**(.
098)
.285
(.06
5).7
61**
(.06
4)Lo
gas
sets
(L)
11.0
79(.
311)
11.9
28**
(.33
3)11
.117
(.24
4)12
.491
**(.
271)
Log
cash
hol
din
gs6.
206
(.60
8)7.
636∧
(.66
9)6.
560
(.49
2)8.
183*
(.48
8)Le
vera
ge(l
ogde
bt/l
ogas
sets
)1.
166
(.02
6)1.
143∧
(.02
7)1.
169
(.02
6)1.
118
(.01
7)Se
cure
dde
bt≥
75%
ofas
sets
.618
(.08
5).5
60�
(.10
1).6
73(.
068)
.304
**(.
069)
Deb
tpe
rson
ally
guar
ante
ed.9
03(.
054)
.96
(.04
0).9
33(.
038)
.848
#(.
054)
Un
der
5ye
ars
old
.529
(.08
7).2
40*
(.05
4).4
90(.
072)
.174
**(.
057)
Wit
hou
tla
wye
r.0
88(.
049)
.0∧
(.0)
.061
(.03
5).0
22(.
022)
Pri
orba
nkr
upt
cyw
ith
in6
year
s.1
76(.
066)
.160
(.07
5).1
63(.
053)
.130
(.05
0)P
rior
ban
kru
ptcy
in19
98.0
59(.
041)
.040
(.04
0).0
62(.
035)
.022
(.02
2)In
com
plet
efi
nan
cial
sch
edu
les
.206
(.07
0).0
*(.
0).1
63(.
053)
.0**
(.0)
No
te.
Stan
dard
erro
rsar
ein
pare
nth
eses
.W
ith
inea
chgr
oup
(Sh
utd
own
san
dA
llC
ases
),th
edi
ffer
ence
sbe
twee
nqu
ick
and
slow
case
sar
ete
sted
.Sy
mbo
lsin
dic
ate
the
stat
isti
cal
sign
ifica
nce
ofth
edi
ffer
ence
s.∧
Sign
ifica
nt
atth
e15
%le
vel,
two-
taile
dt-
test
s.#Si
gnifi
can
tat
the
10%
leve
l,on
e-ta
iled
t-te
sts.
�Si
gnifi
can
tat
the
10%
leve
l,tw
o-ta
iled
t-te
sts.
*Si
gnifi
can
tat
the
5%le
vel,
two-
taile
dt-
test
s.**
Sign
ifica
nt
atth
e1%
leve
l,tw
o-ta
iled
t-te
sts.
This content downloaded from 128.059.178.073 on September 27, 2018 12:05:34 PMAll use subject to University of Chicago Press Terms and Conditions (http://www.journals.uchicago.edu/t-and-c).
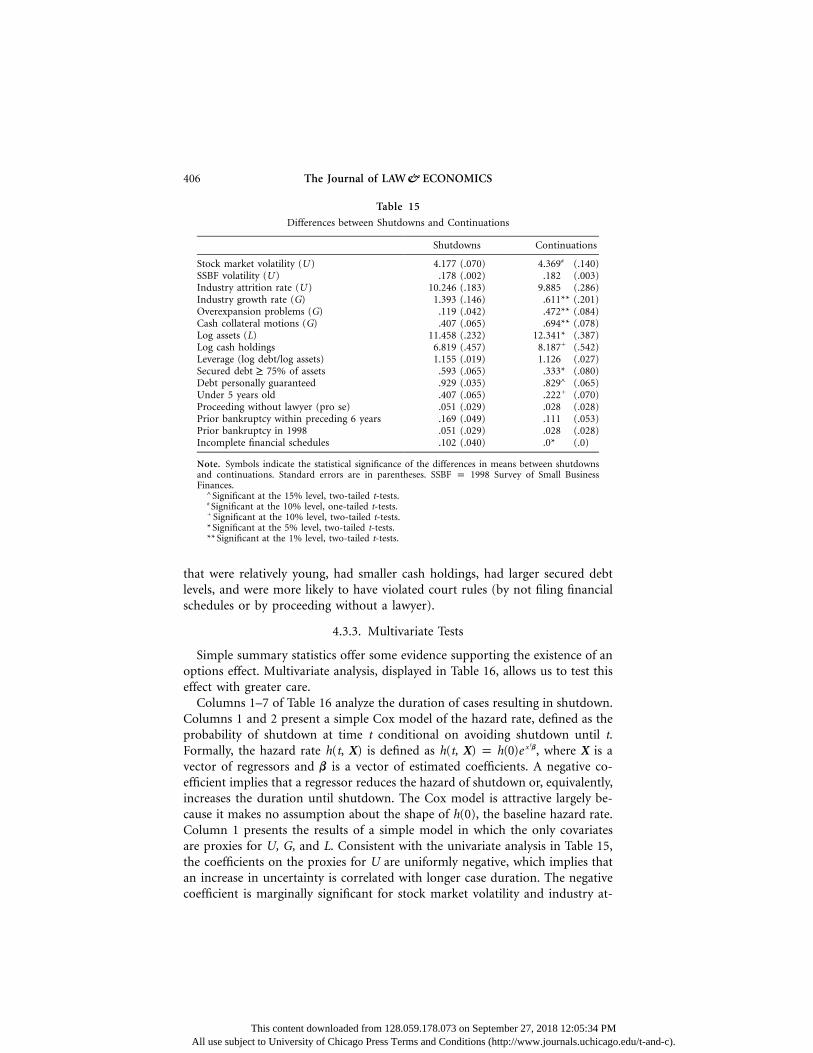
406 The Journal of LAW& ECONOMICS
Table 15
Differences between Shutdowns and Continuations
Shutdowns Continuations
Stock market volatility (U ) 4.177 (.070) 4.369# (.140)SSBF volatility (U ) .178 (.002) .182 (.003)Industry attrition rate (U ) 10.246 (.183) 9.885 (.286)Industry growth rate (G) 1.393 (.146) .611** (.201)Overexpansion problems (G) .119 (.042) .472** (.084)Cash collateral motions (G) .407 (.065) .694** (.078)Log assets (L) 11.458 (.232) 12.341* (.387)Log cash holdings 6.819 (.457) 8.187� (.542)Leverage (log debt/log assets) 1.155 (.019) 1.126 (.027)Secured debt ≥ 75% of assets .593 (.065) .333* (.080)Debt personally guaranteed .929 (.035) .829∧ (.065)Under 5 years old .407 (.065) .222� (.070)Proceeding without lawyer (pro se) .051 (.029) .028 (.028)Prior bankruptcy within preceding 6 years .169 (.049) .111 (.053)Prior bankruptcy in 1998 .051 (.029) .028 (.028)Incomplete financial schedules .102 (.040) .0* (.0)
Note. Symbols indicate the statistical significance of the differences in means between shutdownsand continuations. Standard errors are in parentheses. SSBF p 1998 Survey of Small BusinessFinances.
∧ Significant at the 15% level, two-tailed t-tests.# Significant at the 10% level, one-tailed t-tests.� Significant at the 10% level, two-tailed t-tests.* Significant at the 5% level, two-tailed t-tests.** Significant at the 1% level, two-tailed t-tests.
that were relatively young, had smaller cash holdings, had larger secured debtlevels, and were more likely to have violated court rules (by not filing financialschedules or by proceeding without a lawyer).
4.3.3. Multivariate Tests
Simple summary statistics offer some evidence supporting the existence of anoptions effect. Multivariate analysis, displayed in Table 16, allows us to test thiseffect with greater care.
Columns 1–7 of Table 16 analyze the duration of cases resulting in shutdown.Columns 1 and 2 present a simple Cox model of the hazard rate, defined as theprobability of shutdown at time t conditional on avoiding shutdown until t.Formally, the hazard rate h(t, ) is defined as h(t, , where is a
′x bX X) p h(0)e Xvector of regressors and is a vector of estimated coefficients. A negative co-b
efficient implies that a regressor reduces the hazard of shutdown or, equivalently,increases the duration until shutdown. The Cox model is attractive largely be-cause it makes no assumption about the shape of h(0), the baseline hazard rate.Column 1 presents the results of a simple model in which the only covariatesare proxies for U, G, and L. Consistent with the univariate analysis in Table 15,the coefficients on the proxies for U are uniformly negative, which implies thatan increase in uncertainty is correlated with longer case duration. The negativecoefficient is marginally significant for stock market volatility and industry at-
This content downloaded from 128.059.178.073 on September 27, 2018 12:05:34 PMAll use subject to University of Chicago Press Terms and Conditions (http://www.journals.uchicago.edu/t-and-c).

Small-Business Bankruptcies 407
trition. The third proxy—SSBF volatility—appears to have no independent pre-dictive value. Column 2 shows that little or nothing changes in the model whenthis variable is dropped (it is dropped in the remaining analysis as well). Overallthen, shutdown occurs later in time for businesses with relatively high indexesof U. Columns 1 and 2 show also that various measures of going-concern surplusare negatively correlated with the hazard rate, which is again consistent with thetheoretical model.
Column 3 augments the Cox model by adding other variables that may affectthe hazard of shutdown. The proxies for uncertainty remain negative but increasein significance. Among the newly added variables, cash holdings and leverageare strongly correlated with reductions in the hazard rate. Conversely, an increasein the hazard rate is likely when a business proceeds without a lawyer or hasfiled a bankruptcy petition in the preceding 6 years. These observations areunchanged when we eliminate repeat filings by the same business during thesample period (column 4).
Columns 5–7 test the robustness of these results by varying the underlyingdistribution of the baseline hazard rate, h(0). Each column assumes a differentdistribution: exponential (column 5), Weibull (6), and lognormal (7). The modelsapplying the exponential and Weibull distributions are models of the hazardrate, so a negative coefficient implies that an increase in the regressor reducesthe hazard rate and increases case length. In contrast, the model applying thelognormal distribution is a model of case length itself. Here the coefficients havethe opposite interpretation: a positive coefficient implies that an increase in theregressor is correlated with a longer case length. Thus, the positive coefficientsin column 6 are consistent with the negative coefficients in the other columns.
Note that that the results in Columns 1–7 are based on the subset of casesinvolving shutdowns ( ). Among these cases, the results show that theN p 59greater the uncertainty surrounding business viability (U), the longer the businessis allowed to continue operations in Chapter 11. The downside of these modelsis that they ignore cases in which the business exited bankruptcy intact.
Column 8 remedies this defect using a “cure,” or split-population, model (forapplications, see Berkson and Gage 1952; Schmidt and Witte 1989; Bandopa-dhyaya and Jaggia 2001). This model assumes that all sample businesses—eventhose that ultimately exited intact—were at risk of shutdown. Businesses thatexited intact—via a plan of reorganization or a going-concern sale—might havebeen shut down had they lingered in Chapter 11. The cure model simultaneouslyestimates the probability that a business will be shut down and the duration toshutdown.
Formally, the likelihood function for the cure model is assembled as follows.Following Schmidt and Witte (1989, pp. 148–49), let S be an unobservablevariable indicating whether a business will be shut down in bankruptcy if thebankruptcy judge is given sufficient time to gather information about it. Let Sequal one if a business will be shut down and zero otherwise. Assume that theprobability that S equals one is d: and . Next,Pr (S p 1) p d Pr (S p 0) p 1 � d
This content downloaded from 128.059.178.073 on September 27, 2018 12:05:34 PMAll use subject to University of Chicago Press Terms and Conditions (http://www.journals.uchicago.edu/t-and-c).

408
Tab
le16
Mod
els
ofth
eSh
utd
own
Dec
isio
nin
Ch
apte
r11
Haz
ard
Du
rati
onD
ura
tion
-C
ure
Log
it(1
)(2
)(3
)(4
)(5
)(6
)(7
)(8
)(9
)
Stoc
km
arke
tvo
lati
lity
(U)
�.3
32(.
170)
�.3
59∧
(.12
9)�
.514
�
(.09
9)�
.565
�
(.06
7)�
.229
∧
(.10
2)�
.435
∧
(.10
1).3
00�
(.08
7).3
80*
(.01
7)�
1.79
7*(.
028)
SSB
Fvo
lati
lity
(U)
�4.
574
(.64
7)In
dust
ryat
trit
ion
rate
(U)
�.1
91�
(.05
6)�
.174
*(.
046)
�.3
84**
(.00
1)�
.354
**(.
002)
�.1
42**
(.00
2)�
.389
**(.
001)
.115
*(.
038)
.095
�
(.09
2).2
85(.
284)
Indu
stry
grow
thra
te(G
)�
.034
(.80
9)�
.038
(.78
7)�
.182
(.39
5)�
.168
(.43
3)�
.095
(.28
6)�
.232
(.24
1).0
84(.
381)
.020
(.84
4)1.
472*
*(.
000)
Ove
rexp
ansi
onpr
oble
ms
(G)
�.4
09(.
292)
�.4
69(.
240)
�.5
89(.
239)
�.6
29(.
200)
�.3
16(.
133)
�.5
28(.
283)
.392
�
(.07
0).5
25*
(.02
0)�
2.09
5**
(.00
8)C
ash
colla
tera
lm
otio
ns
(G)
�.8
47*
(.02
4)�
.838
*(.
024)
�.7
45�
(.08
6)�
.556
(.16
9)�
.344
�
(.07
8)�
.608
(.14
9).4
13*
(.02
8).5
02*
(.01
1)�
2.64
4**
(.00
3)Lo
gas
sets
(L)
�.1
62(.
168)
�.1
57(.
175)
�.4
25(.
125)
�.4
60�
(.09
9)�
.147
(.13
1)�
.442
�
(.05
1).1
19(.
208)
.117
(.23
3).0
24(.
935)
Log
cash
hol
din
gs�
.155
*(.
021)
�.1
45*
(.02
4)�
.071
*(.
012)
�.1
48*
(.02
8).0
76**
(.00
6).0
78**
(.00
9)�
.107
(.40
3)Le
vera
ge(l
ogde
bt/l
ogas
sets
)�
4.58
6*(.
031)
�4.
801*
(.02
3)�
1.49
8(.
118)
�4.
456*
(.01
9)1.
006
(.34
9)1.
061
(.32
0)�
5.21
6�
(.06
2)
This content downloaded from 128.059.178.073 on September 27, 2018 12:05:34 PMAll use subject to University of Chicago Press Terms and Conditions (http://www.journals.uchicago.edu/t-and-c).
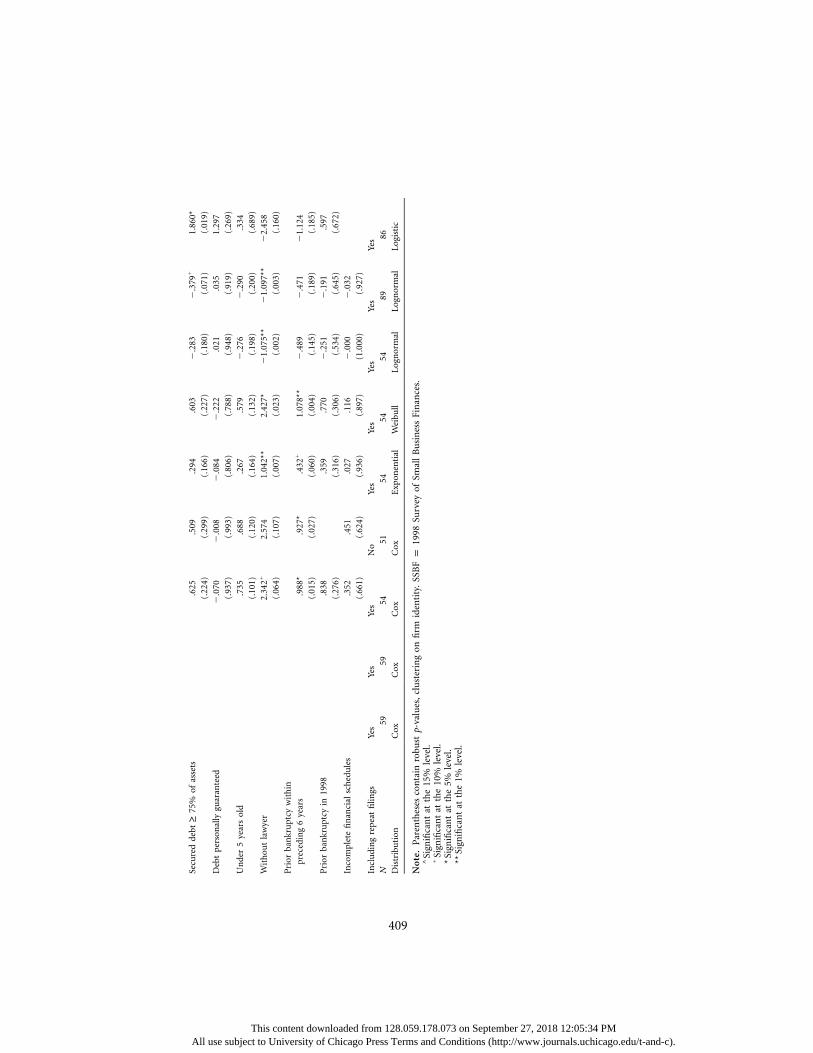
409
Secu
red
debt
≥75
%of
asse
ts.6
25(.
224)
.509
(.29
9).2
94(.
166)
.603
(.22
7)�
.283
(.18
0)�
.379
�
(.07
1)1.
860*
(.01
9)D
ebt
pers
onal
lygu
aran
teed
�.0
70(.
937)
�.0
08(.
993)
�.0
84(.
806)
�.2
22(.
788)
.021
(.94
8).0
35(.
919)
1.29
7(.
269)
Un
der
5ye
ars
old
.735
(.10
1).6
88(.
120)
.267
(.16
4).5
79(.
132)
�.2
76(.
198)
�.2
90(.
200)
.334
(.68
9)W
ith
out
law
yer
2.34
2�
(.06
4)2.
574
(.10
7)1.
042*
*(.
007)
2.42
7*(.
023)
�1.
075*
*(.
002)
�1.
097*
*(.
003)
�2.
458
(.16
0)P
rior
ban
kru
ptcy
wit
hin
prec
edin
g6
year
s.9
88*
(.01
5).9
27*
(.02
7).4
32�
(.06
0)1.
078*
*(.
004)
�.4
89(.
145)
�.4
71(.
189)
�1.
124
(.18
5)P
rior
ban
kru
ptcy
in19
98.8
38(.
276)
.359
(.31
6).7
70(.
306)
�.2
51(.
534)
�.1
91(.
645)
.597
(.67
2)In
com
plet
efi
nan
cial
sch
edu
les
.352
(.66
1).4
51(.
624)
.027
(.93
6).1
16(.
897)
�.0
00(1
.000
)�
.032
(.92
7)In
clu
din
gre
peat
filin
gsYe
sYe
sYe
sN
oYe
sYe
sYe
sYe
sYe
sN
5959
5451
5454
5489
86D
istr
ibu
tion
Cox
Cox
Cox
Cox
Exp
onen
tial
Wei
bull
Log
nor
mal
Log
nor
mal
Log
isti
c
No
te.
Par
enth
eses
con
tain
robu
stp-
valu
es,
clu
ster
ing
onfi
rmid
enti
ty.
SSB
Fp
1998
Surv
eyof
Smal
lB
usi
nes
sFi
nan
ces.
∧Si
gnifi
can
tat
the
15%
leve
l.�
Sign
ifica
nt
atth
e10
%le
vel.
*Si
gnifi
can
tat
the
5%le
vel.
**Si
gnifi
can
tat
the
1%le
vel.
This content downloaded from 128.059.178.073 on September 27, 2018 12:05:34 PMAll use subject to University of Chicago Press Terms and Conditions (http://www.journals.uchicago.edu/t-and-c).
410 The Journal of LAW& ECONOMICS
let t measure the amount of time a business spends in bankruptcy before beingshut down. Assume that t is distributed according to some cumulative distri-bution function G. Thus, the density of businesses that are shut down after tmonths in bankruptcy is . Let C be a dummy variable equal to oneg(tFS p 1)if the business exits bankruptcy intact and zero otherwise. The term C indicateswhether information about a business is censored: we know that the businessexited bankruptcy, but we do not know whether it would have been shut downhad it remained in bankruptcy. If a business exits bankruptcy without being shutdown, let T measure the amount of time the business spent in bankruptcy.
With these definitions in hand, we can assemble the likelihood function. Weobserve two kinds of firms in the data: shutdowns (indexed by i) and contin-uations (indexed by j). The probability of shutdown at time t is
Pr (S p 1)g(tFS p 1) p dg(tFS p 1).i i
The probability of continuation is
F F( )Pr (C p 1) p Pr (S p 0) � Pr (S p 1) Pr t 1 T S p 1j
( ) ( )p 1 � d �d 1 � G TFS p 1 .[ ]j
Therefore, the likelihood function is
( ) ( ) ( )L p dg tFS p 1 � 1 � d �d 1 � G TFS p 1 ,[ ] [ ]� � { }i ji j
where sums over businesses shut down in bankruptcy ( ) and sums� C p 0 �i j
over businesses that exited bankruptcy intact ( ). Estimates reported inC p 1column 8 assume that G is a lognormal distribution, a standard assumption insettings where the hazard rate is nonmonotonic, as it is here. The model alsoassumes, for simplicity, that d is a scalar with logistic distribution.38
Column 8 shows that the estimates derived from this cure model are roughlyidentical to those generated by a simple duration model with a lognormal baselinehazard. Combined with the results in columns 1–7, these results offer suggestiveevidence in favor of the options effect.
Instead of studying the duration to shutdown, column 9 analyzes the prob-ability of shutdown using a standard logit model. Here the subset of casesresulting in shutdown is compared with the subset resulting in continuation.The coefficients in column 9 measure the effect of changes in the control variableson the probability of shutdown. The dependent variable equals one if a caseresulted in shutdown and zero otherwise. Interestingly, only one of the proxiesfor uncertainty—stockmarket volatility—has the predicted negative effect. Theother proxy has a positive, but insignificant, coefficient. As in Table 15, proxiesfor going-concern surplus also have mixed coefficients. An increase in industrygrowth is strongly correlated with an increase in the probability of shutdown.
38 This simple model is estimated using Mario Cleve’s “lncure” program for STATA (http://www.stata.com/users/mcleves/lncure/).
This content downloaded from 128.059.178.073 on September 27, 2018 12:05:34 PMAll use subject to University of Chicago Press Terms and Conditions (http://www.journals.uchicago.edu/t-and-c).

Small-Business Bankruptcies 411
The opposite is true for the other proxies, overexpansion problems and cashcollateral motion. The logit model then offers only mixed support for the optionseffect. These results are unsurprising because it is hard to predict the effect ofuncertainty (U) in this model. The effect occurs only when the going-concernvalue (G) is close to liquidation value (L). If G far exceeds L, a business will bekept intact, regardless of U. In the sample, however, continuations include bothbusinesses in which G was close to L (where the options effect operates) as wellas those in which G far exceeded L (where the options effect is absent). Thisheterogeneity may explain the mixed results in column 9.
Together, the patterns reported here are generally consistent with the hy-pothesis that bankruptcy judges decide cases in order to identify and preservefirms with going-concern surplus. The hazard of shutdown is hump shaped, abusiness is more likely to exit bankruptcy intact if it has significant going-concernvalue, and a business is more likely to be shut down quickly if there is relativelylittle uncertainty about its value as a going concern. The conclusion does notimply that the behavior of bankruptcy judges is optimal. Few, if any, businessesin bankruptcy may have significant going-concern surplus worth saving (in theform of specialized physical capital), as Baird and Morrison (2005b) have argued.The results presented here show, instead, that judges act as if they are seekingout and preserving going-concern surplus.
5. Conclusion
Evidence gathered from the Northern District of Illinois supports the hy-pothesis that current practice in the bankruptcy courts exhibits no systematicbias in favor of saving nonviable businesses. The debtor’s managers are not incontrol, and businesses destined to fail are identified quickly. Viewed throughthe lens of a formal matching model of the bankruptcy process, the data againsuggest that bias commonly ascribed to the Chapter 11 process is either absentor empirically unimportant. The costs of small-business Chapter 11 cases aresmaller than commonly thought. Whether the benefits of Chapter 11 are largeenough to justify even these costs, however, is far from self-evident. A carefulexamination of the benefits of Chapter 11 is also needed.39
39 Another paper, Baird and Morrison (2005b), uses data from the Northern District to addressthis question as well. There we argue that the benefits of small-business Chapter 11 cases, like thecosts, are quite low, even when the business survives as a going concern.
This content downloaded from 128.059.178.073 on September 27, 2018 12:05:34 PMAll use subject to University of Chicago Press Terms and Conditions (http://www.journals.uchicago.edu/t-and-c).
412 The Journal of LAW& ECONOMICS
Appendix
A Matching Model of Chapter 11
Consider an idealized bankruptcy court that receives Chapter 11 petitions bya large number of businesses every period. When a case begins, the business’sliquidation value (R) is observable, but its going-concern value (V) is not. Theparties know only that a fraction, p, of the businesses have high going-concernvalue (H) and are worth reorganizing. The remaining businesses are low-valuebusinesses (L) that should be liquidated.
Although going-concern value is unobservable at the outset, information isrevealed over the course of the case, which lasts two periods. During period 1,the court receives a signal of business type. The signal is either good (g) or bad(b). Good signals occur with probability pg, bad with probability pb. Assumethat good signals are more likely to arise from type H than from type L businesses:
. The reverse is true for bad signals, which are more likely to arisep 1 pgFH gFL
from type L than from type H businesses: . Note thatp 1 p p � p pbFL bFH gFH bFH
and .1 p � p p 1gFL bFL
At the end of period 1, after receiving the signal, the judge must decide whetherto liquidate the business or allow it to continue in operation, at least until thenext period. If the business is liquidated, the return to creditors is R. If it isallowed to continue, the judge will receive an additional signal of business qualityin period 2. Again, the signal will be either g or b. After receiving this signal,the judge has a final opportunity to liquidate the business. If the business is notliquidated, it exits bankruptcy and operates for one more period, at the end ofwhich its true value (H or L) is revealed. If it is type H, the business is sold offas a going concern and the payoff to creditor is H. If it is type L, the businessis liquidated, with a payoff to creditors.R 1 L
There is a cost to waiting. Every period, the parties incur administrative andother costs equal to c. The judge fully internalizes these costs in his or herdecision-making calculus.
There is an opportunity, then, to liquidate a Chapter 11 debtor at the end ofeach period. What is the optimal time to exercise this shutdown option? We cancharacterize the optimal decision via backward induction.
Start with period 2. The judge’s decision depends on the signals received todate. If the signals in periods 1 and 2 were {g, g}—meaning that good signalswere received in both periods—the best estimate of the business’s going concernis
E(VFgg) p Pr (HFgg)H � Pr (LFgg)R,
where
2p pgFHPr (HFgg) p
2 2 ( )p p � p 1 � pgFH gFL
This content downloaded from 128.059.178.073 on September 27, 2018 12:05:34 PMAll use subject to University of Chicago Press Terms and Conditions (http://www.journals.uchicago.edu/t-and-c).
Small-Business Bankruptcies 413
and
2 ( )p 1 � pgFL
Pr (LFgg) p ,2 2 ( )p p � p 1 � pgFH gFL
using Bayes’s rule. Given this estimate of business value, the judge must decidewhether to liquidate the business immediately or allow it to continue to period3. If it is liquidated, the return to creditors is ; if it is allowed to continue,R � 2cthe expected return to creditors next period is . More formally, theE(VFgg) � 3cjudge’s problem is
( )max E VFgg �c, R .{ }
There is a threshold liquidation value such that the judge is indifferentR*gg
between liquidating and permitting continuation. If a business’s liquidation valueR exceeds , the business will be liquidated; if it is below , the business willR* R*gg gg
be preserved, at least temporarily. This threshold is equal to
1R* p H � c.gg Pr (HFgg)
Analogous expressions40 characterize the threshold liquidation value— , ,R* R*gb bg
and —when the judge has received different signals of business quality inR*bb
periods 1 and 2.These period 2 thresholds have important characteristics. First, the thresholds
are larger for businesses with better histories: , becauseR* 1 R* p R* 1 R*gg gb bg bb
.41 This means that judges are lessPr (HFgg) 1 Pr (HFbg) p Pr (HFgb) 1 Pr (HFbb)willing to terminate businesses that have generated better signals of quality. Moreimportant, these thresholds are increasing in the variance of business quality,
. Holding average quality— —constant, var-2 2j p p(1 � p)(H � L) pH � (1 � p)Liance in business quality increases as the difference between H and L increases.Consider an increase in H and decrease in L that raises variance but holds averagequality constant. Since and all other thresholds are increasing in H, allR*gg
thresholds will rise. This property reflects the option value of liquidation. Al-though increases in variance reduce the value of type L businesses, a judge canavoid the downside risk by liquidating the business for payoff . Thanks toR 1 Lthis insurance, an increase in variance can only increase the potential payoff tocreditors.
Turn now to period 1. At the end of the period, after observing a signal, the
40 and .R* p R* p H � [1/ Pr (HFgb)] c R* p H � [1/ Pr (HFbb)] cgb bg bb41 If , then 2 2 2 2 2Pr (HFgg) 1 Pr (HFbb) [(p ) p]/[(p ) p � (p ) (1 � p)] 1 [(p ) p]/[(p ) p �gFH gFH gFL bFH bFH
, which is equivalent to . The last inequality holds because2 2 2(p ) (1 � p)] (p /p ) 1 (p /p )bFL bFL bFH gFL gFH
and . Similar calculations show that andp 1 p p ! p Pr (HFgg) 1 Pr (HFgb) Pr (HFgb) 1gFH gFL bFH bFL
.Pr (HFbb)
This content downloaded from 128.059.178.073 on September 27, 2018 12:05:34 PMAll use subject to University of Chicago Press Terms and Conditions (http://www.journals.uchicago.edu/t-and-c).

414 The Journal of LAW& ECONOMICS
judge has his or her first opportunity to liquidate the business. His or her problemis
( )max E VFs �c, R ,{ }
where s denotes the signal broadcast in period 1. The optimal decision dependson the relationship between the period 2 thresholds , , and and theR* R* R*gg gb bb
business’s liquidation value R. We need to consider four cases.Case 1: . This implies that, even if the business generates good signalsR 1 R*gg
in both periods 1 and 2, its liquidation value will still exceed its expected going-concern value. Under these conditions, it makes sense to liquidate the businessimmediately at the end of period 1. It makes no sense to permit continuationbecause the judge will always liquidate the business at the end of period 2. Thehistory of signals will be irrelevant in light of the large payoff from liquidation.
Case 2: . Here the liquidation value of the business is so small thatR ! R*bb
it almost always makes sense to permit continuation. Suppose the judge permitscontinuation. At the end of the next period—period 2—the judge will permitcontinuation again, regardless of the history of signals, because the payoff tocreditors is so low. Given that continuation will be permitted at the end of period2, it is optimal to permit continuation at the end of period 1 unless the liquidationvalue R is close to the threshold .42 If it is close, the cost of waiting, c, swampsR*bb
the gains.Case 3: . Under these conditions, a judge will liquidate a busi-R* ! R ! R*gb gg
ness at the end of period 2 if it broadcast a bad signal at any time. Knowingthis at the end of period 1, the judge will liquidate any business with a badperiod 1 signal. Suppose, then, that the business had a good period 1 signal.The judge’s problem is
( )max Pr (gFg) E VFgg �c �Pr (bFg)R � c, R ,[ ]{ }
where and are the probabilities of good and bad signals in periodPr (gFg) Pr (bFb)2, respectively, given a good signal in period 1. In this problem, liquidation isoptimal if R exceeds the threshold
1 1R* p H � � c,g3 [ ]p Pr (HFg) Pr (HFgg)gFH
which can be derived through repeated application of Bayes’s rule. This thresholdis clearly less than . It will also be greater than if the first term in bracketsR* R*gg gb
is not too large.
42 Suppose, for example, that the period 1 signal is b. Given that continuation will be permittedin period 2, the judge’s problem is . The threshold liquidation value for thismax {E (VFb) � 2c, R}problem is . If , continuation will be permitted in both periods 1R* p H � [2/ Pr (HFb)] c R ! R*b2 b2
and 2. By assumption, . As long as there is an R such that , then liquidation mayR ! R* R* ! R ! R*bb b2 bb
be optimal in period 1, even though it is not in period 2. Such a region exists if Pr (HFb) �.2 Pr (HFbb) ! 0
This content downloaded from 128.059.178.073 on September 27, 2018 12:05:34 PMAll use subject to University of Chicago Press Terms and Conditions (http://www.journals.uchicago.edu/t-and-c).

Small-Business Bankruptcies 415
Case 4: . Here the business will be kept intact at the end ofR* ! R ! R*bb gb
period 2 if it broadcasts a good signal at any time. Liquidation is optimal onlywhen a business broadcasts consistently bad signals. Knowing this at the end ofperiod 1, the judge will permit continuation of any business with a good period1 signal, provided per-period costs are not too high.43 Suppose then that theperiod 1 signal is b, which implies that the business will be preserved in period2 only if the second signal is g. The judge solves
( )max Pr (gFb) E VFgb �c �Pr (bFb)R � c,R ,[ ]{ }
which yields the threshold
1 1R* p H � � c.b4 [ ]p Pr (HFb) Pr (HFgb)gFH
Thus, a business will avoid liquidation, even with a bad first-period signal, if Ris less than . Note that .R* R* ! R*b4 b4 g3
Given these thresholds, we can determine how the probability (and hazard)of liquidation varies over the course of a case. To illustrate, assume that liqui-dation is never optimal at the outset of the case, before any information hasbeen gathered. Recall that liquidation is optimal at the end of period 1, regardlessof the signal, if R exceeds or . To avoid immediate liquidation at the startR* R*gg g3
of the case, assume that R falls below these thresholds (ruling out case 1 andpart of case 3). Assume, in addition, that R is not so low that liquidation isnever optimal; we are interested in cases where liquidation is a real possibility.Recall that liquidation is never optimal if R is less than or , provided per-R* R*bb b4
period costs are not large. Assume that R exceeds both thresholds and that costsare low (ruling out case 2 and part of case 4).
These assumptions imply that the probability of liquidation is zero at thebeginning of period 1. The assumptions also imply that R falls within two possibleranges: or .R* ! R ! R* R* ! R ! R*b4 gb gb g3
Consider region 1: . Here a business will be liquidated if theR* ! R ! R*b4 gb
period 1 signal is bad, which occurs with probability Pr (b) p p p �bFH
. This means that, at the end of period 2, the only businesses will bep (1 � p)bFL
those with good period 1 signals and either good or bad period 2 signals. Noneof these businesses will be liquidated, because R is less than . The probabilityR*gb
of liquidation is therefore zero in period 2.44 Thus, the hazard of liquidation ishump shaped when R lies in region 1: the hazard is zero at the start of period
43 More formally, the judge’s problem is . The business will be kept intactmax {E (VFg) � 2c, R}so long as R is less than the threshold , defined by . If c is small, it willR* R* p H � [2/ Pr (HFg)] cg4 g4
never be optimal to liquidate if the period 1 signal is good.44 At the end of period 3, the business will be liquidated if it is revealed to be type L, the probability
of which is . Thus, if , the hazard of shutdown will rise again in the final period,Pr (LFg) R* ! R ! R*b4 gb
when full information is available.
This content downloaded from 128.059.178.073 on September 27, 2018 12:05:34 PMAll use subject to University of Chicago Press Terms and Conditions (http://www.journals.uchicago.edu/t-and-c).

416 The Journal of LAW& ECONOMICS
1, rises to at the end of the period, and then falls again to zero at the endPr (b)of period 2.
Turn now to region 2: . Once again, a business will be liquidatedR* ! R ! R*gb g3
at the end of period 1 if the judge received a bad signal, which occurs withprobability . Liquidation will occur at the end ofPr (b) p p p � p (1 � p)bFH bFL
period 2 only if a second bad signal was received. Thus, the period 2 probabilityof liquidation is , which is smallerPr (bFg) p p Pr (HFg) � p [1 � Pr (HFg)]bFH bFL
than because and . Again we have a hump-shapedPr (b) Pr (HFg) 1 p p ! pbFH bFL
hazard: it is zero at the start of period 1, rises to at the end of that period,Pr (b)and then falls to at the end of period 2.45Pr (bFg)
These conclusions rest, of course, on the assumption that a business’s liqui-dation value R is neither too large nor too small relative to its expected going-concern value. If its liquidation value is high (relative to its going-concern value),the judge will order liquidation immediately after it enters bankruptcy (that is,at the beginning of period 1). The probability of liquidation, and the hazardrate, would decline monotonically over time. Alternatively, if the business’s li-quidation value is very low, the probability of liquidation might be low (or zero)throughout the case. It would only rise in period 3, after the firm has exitedbankruptcy and the parties have full information about business value.
References
Armington, Catherine. 1998. Statistics of U.S. Businesses—Microdata and Tables. Workingpaper. U.S. Small Business Administration, Washington, D.C.
Aghion, Phillipe, Oliver Hart, and John Moore. 1992. The Economics of BankruptcyReform. Journal of Law, Economics, and Organization 8:523–46.
———. 1994. Improving Bankruptcy Procedure. Washington University Law Quarterly72:849–72.
Andrade, Gregor, and Steven N. Kaplan. 1998. How Costly Is Financial (Not Economic)Distress? Evidence from Highly Leveraged Transactions That Became Distressed. Journalof Finance 53:1443–93.
Ayotte, Kenneth M., and David A. Skeel, Jr. 2006. An Efficiency-Based Explanation forCurrent Corporate Reorganization Practice. University of Chicago Law Review 73:425–68.
Baird, Douglas G. 1986. The Uneasy Case for Corporate Reorganizations. Journal of LegalStudies 15:127–47.
Baird, Douglas G., and Edward R. Morrison. 1999. Optimal Timing and Legal Decision-Making: The Case of the Liquidation Decision in Bankruptcy. John M. Olin Programin Law and Economics Working Paper No. 86. University of Chicago Law School,Chicago.
———. 2001. Bankruptcy Decision-Making. Journal of Law, Economics, and Organization17:356–72.
45 The hazard will also be positive at the end of period 3. The judge will liquidate type L businessesthat had good signals in periods 1 and 2. The probability of liquidation is therefore , whichPr (LFgg)may be larger or smaller than .Pr (bFg)
This content downloaded from 128.059.178.073 on September 27, 2018 12:05:34 PMAll use subject to University of Chicago Press Terms and Conditions (http://www.journals.uchicago.edu/t-and-c).

Small-Business Bankruptcies 417
———. 2005a. Adversary Proceedings in Bankruptcy: A Sideshow. American BankruptcyLaw Journal 79:951–72.
———. 2005b. Serial Entrepreneurs and Small Business Bankruptcies. Columbia LawReview 105:2310–68.
Bandopadhyaya, Arindam, and Sanjiv Jaggia. 2001. An Analysis of Second Time aroundBankruptcies Using a Split-Population Duration Model. Journal of Empirical Finance8:201–18.
Bates, Timothy, and Alfred Nucci. 1989. An Analysis of Small Business Size and the Rateof Discontinuance. Journal of Small Business Management 27:1–7.
Bebchuk, Lucien Arye, and Howard F. Chang. 1992. Bargaining and the Division of Valuein Corporate Reorganization. Journal of Law, Economics, and Organization 8:253–79.
Berkson, Joseph, and Robert P. Gage. 1952. Survival Curve for Patients following Treat-ment. Journal of the American Statistical Association 47:501–15.
Bitler, Marianne P., Alicia M Robb, and John D. Wolken. 2001. Financial Services Usedby Small Businesses: Evidence from the 1998 Survey of Small Business Finances. FederalReserve Bulletin 87:183–205.
Bris, Arturo, Ivo Welch, and Alan Schwartz. 2005. Who Should Pay for Bankruptcy Costs?Journal of Legal Studies 34:295–341.
Bris, Arturo, Ivo Welch, and Ning Zhu. 2006. The Costs of Bankruptcy: Chapter 7 Li-quidation vs. Chapter 11 Reorganization. Journal of Finance 61:1253–1303.
Chapman, Kenneth S., and Lawrence Southwick, Jr. 1991. Testing the Matching Hypoth-esis: The Case of Major League Baseball. American Economic Review 81:1352–60.
Chen, Nan, and Suresh Sundaresan. 2003. The Optimal Bankruptcy Resolution and theRole of Debtor in Possession Financing. Working paper. Columbia Business School,New York.
Cramton, Roger C. 1997. The FCC Spectrum Auctions: An Early Assessment. Journal ofEconomics and Management Strategy 6:431–95.
Dixit, Avinash K., and Robert S. Pindyck. 1994. Investment under Uncertainty. Princeton,N.J.: Princeton University Press.
FJC (Federal Judicial Center). 1998. Federal Court Cases: Integrated Data Base BankruptcyPetitions, 1998 (computer file). Ann Arbor, Mich.: Inter-university Consortium forPolitical and Social Research.
———. 1999. Federal Court Cases: Integrated Data Base Bankruptcy Petitions, 1999(computer file). Ann Arbor, Mich.: Inter-university Consortium for Political and SocialResearch.
French, Kenneth R. 2006. 48 Industry Portfolios. http://www.mba.tuck.dartmouth.edu/pages/faculty/ken.french/data_library.html.
Ghosal, Vivek, and Prakash Loungani. 2000. The Differential Impact of Uncertainty onInvestment in Small and Large Businesses. Review of Economics and Statistics 82:338–49.
Gilson, Stuart C. 1997. Transaction Costs and Capital Structure Choice: Evidence fromFinancially Distressed Firms. Journal of Finance 52:161–96.
Guiso, Luigi, and Giuseppe Parigi. 1999. Investment and Demand Uncertainty. QuarterlyJournal of Economics 114:185–227.
Holmes, Thomas J., and James A. Schmitz. 1995. On the Turnover of Business Firms andBusiness Managers. Journal of Political Economy 103:1005–38.
Hotchkiss, Edith S. 1995. Postbankruptcy Performance and Management Turnover. Jour-nal of Finance 50:3–21.
This content downloaded from 128.059.178.073 on September 27, 2018 12:05:34 PMAll use subject to University of Chicago Press Terms and Conditions (http://www.journals.uchicago.edu/t-and-c).

418 The Journal of LAW& ECONOMICS
Jovanovic, Boyan. 1979. Job Matching and the Theory of Turnover. Journal of PoliticalEconomy 87:972–90.
Klee, Kenneth. 2002. One Size Fits Some: Single Asset Real Estate Bankruptcy Cases. Cor-nell Law Review 87:1285–1332.
Knaup, Amy E. 2005. Survival and Longevity in the Business Employment DynamicsData. Monthly Labor Review, May.
Lane, Julia, and Michael Parkin. 1998. Turnover in an Accounting Firm. Journal of LaborEconomics 16:702–17.
LoPucki, Lynn M. 1983. The Debtor in Full Control—Systems Failure under Chapter 11of the Bankruptcy Code? Installments 1 and 2. American Bankruptcy Law Journal 57:99–126, 247–73.
———. 2007. Web BRD: Lynn M. LoPucki’s Bankruptcy Research Database. http://lopucki.law.ucla.edu/.
LoPucki, Lynn M., and Sara D. Kalin. 2001. The Failure of Public Company Bankruptciesin Delaware and New York: Empirical Evidence of a “Race to the Bottom.” VanderbiltLaw Review 54:231–73.
Maksimovic, Vojislav, and Gordon Phillips. 1998. Asset Efficiency and Reallocation De-cisions of Bankrupt Firms. Journal of Finance 53:1495–1532.
Moel, Alberto, and Peter Tufano. 2002. When Are Real Options Exercised? An EmpiricalStudy of Mine Closings. Review of Financial Studies 15:35–64.
Morrison, Edward R. 2003. Bankruptcy Decision-Making: An Empirical Study of Small-Business Bankruptcies. Unpublished dissertation. University of Chicago, Departmentof Economics.
National Bankruptcy Review Commission. 1997. Bankruptcy: The Next Twenty Years.Washington, D.C.: U.S. Government Printing Office.
Opler, Tim C., and Sheridan Titman. 1994. Financial Distress and Corporate Performance.Journal of Finance 49:1015–40.
Rasmussen, Robert K., and Randall S Thomas. 2000. Timing Matters: Promoting ForumShopping by Insolvent Corporations. Northwestern University Law Review 94:1357–1408.
Schmidt, Peter, and Ann Dryden Witte. 1989. Predicting Recidivism Using “Split Pop-ulation” Survival Time Models. Journal of Econometrics 40:141–59.
Schwartz, Alan. 1997. Contracting about Bankruptcy. Journal of Law, Economics, andOrganization 13:127–46.
Squires, John Q. 1998. Fifteen Common Bankruptcy Practice Errors and How to AvoidThem. DCBA Brief Online, June. http://www.dcba.org/brief/judpractice/0698.htm.
Thorburn, Karin. 2000. Bankruptcy Auctions: Costs, Debt Recovery, and Firm Survival.Journal of Financial Economics 58:337–68.
Triantis, Alexander J., and George G. Triantis. 1998. Timing Problems in Contract BreachDecisions. Journal of Law and Economics 41:163–207.
U.S. Census Bureau. 2003. Population in Metropolitan and Micropolitan Statistical Areasin Alphabetical Order and Numerical and Percent Change for the United States andPuerto Rico: 1990 and 2000. http://www.census.gov/population/www/cen2000/phc-t29.html.
United States Bankruptcy Court for the Northern District of Illinois. 2003. Local Rules (adopt-ed June 1, 2003). http://www.ilnb.uscourts.gov/Proplocalrules/localrulesrev3approved.pdf.
U.S. Small Business Administration. 2001. The State of Small Business: A Report of thePresident, 1999–2000. Washington, D.C.: U.S. Government Printing Office.
This content downloaded from 128.059.178.073 on September 27, 2018 12:05:34 PMAll use subject to University of Chicago Press Terms and Conditions (http://www.journals.uchicago.edu/t-and-c).
Small-Business Bankruptcies 419
Warren, Elizabeth, and Jay Lawrence Westbrook. 1999. Financial Characteristics of Busi-nesses in Bankruptcy. American Bankruptcy Law Journal 73:499–589.
Weiss, Lawrence A., and Karen Wruck. 1998. Information Problems, Conflicts of Interest,and Asset-Stripping: Chapter 11’s Failure in the Case of Eastern Airlines. Journal ofFinancial Economics 48:55–97.
White, Michelle J. 1994. Corporate Bankruptcy as a Filtering Device: Chapter 11 Reor-ganizations and Out-of-Court Debt Restructurings. Journal of Law, Economics, andOrganization 10:268–95.
This content downloaded from 128.059.178.073 on September 27, 2018 12:05:34 PMAll use subject to University of Chicago Press Terms and Conditions (http://www.journals.uchicago.edu/t-and-c).