Embed Size (px)
Citation preview

Federal Reserve Bank of New YorkStaff Reports
The Bankruptcy Abuse Prevention and Consumer Protection Act:Means-Testing or Mean Spirited?
Adam B. AshcraftAstrid A. Dick
Donald P. Morgan
Staff Report no. 279March 2007
This paper presents preliminary findings and is being distributed to economistsand other interested readers solely to stimulate discussion and elicit comments.The views expressed in the paper are those of the authors and are not necessarilyreflective of views at the Federal Reserve Bank of New York or the FederalReserve System. Any errors or omissions are the responsibility of the authors.

The Bankruptcy Abuse Prevention and Consumer Protection Act:Means-Testing or Mean Spirited?Adam B. Ashcraft, Astrid A. Dick, and Donald P. MorganFederal Reserve Bank of New York Staff Reports, no. 279March 2007JEL classification: G33, K35
Abstract
Thousands of U.S. households filed for bankruptcy just before the bankruptcy lawchanged in 2005. That rush-to-file was more pronounced, we find, in states with moregenerous bankruptcy exemptions and lower credit scores. We take that finding asevidence that the new law effectively reduces exemptions, which in turn should reducethe “demand” for bankruptcy and the resulting losses to suppliers of consumer credit. We expect the savings to suppliers will be shared with borrowers by way of lower credit card rates, although credit card spreads have not yet fallen. If cheaper credit is the upside of the new law, the downside is reduced bankruptcy “insurance” against bad luck. The overall impact of the new law on the average household depends on how one weighs those two sides.
Key words: personal bankruptcy, consumption smoothing, insurance, competition
Ashcraft: Federal Reserve Bank of New York (e-mail: [email protected]). Dick:Federal Reserve Bank of New York (e-mail: [email protected]). Morgan: Federal ReserveBank of New York (e-mail: [email protected]). The authors thank Beverly Hirtle, Kevin Stiroh, and Todd Zywicki for helpful comments. Matthew Botsch and Anna Petersonprovided excellent research assistance. The views expressed in this paper are those of theauthors and do not necessarily reflect the position of the Federal Reserve Bank of New Yorkor the Federal Reserve System.

1
I. Introduction
The Bankruptcy Abuse Prevention and Consumer Protection Act (BAPCPA) of 2005
makes it costlier to file for personal bankruptcy. Higher income filers with sufficient
means, as determined by recent income (relative to the state median) and expenses, must
continue paying on their debts for five years under chapter 13. All filers must undergo
six months of mandatory credit counseling, provide additional documentation, and pay
higher filing fees. Access to state homestead and property exemptions that protect assets
of chapter 7 filers will be limited by a residency requirement.1
That BAPCPA will reduce future demand for bankruptcy is obvious from the
unprecedented rush-to-file just before BAPCPA took effect last October (Chart 1).
Chapter 7 filing rates per household increased by about one third between 2005:Q3 and
2005:4. In D.C., the rate doubled.
According to Nunez and Rosenthal (2006), Congress hardened personal bankruptcy
law in response to persistent lobbying by consumer lenders, especially credit card banks,
whose unsecured claims on borrowers were the first to be discharged under Chapter 7
Lenders blamed the steady rise in personal filing rates (Chart 2) on “soft” bankruptcy law
that motivated households to borrow more than they could afford, with the bankruptcy
option in mind, then repay less than they could afford in the event of bankruptcy. In
textbook terms, lenders claimed that soft bankruptcy laws were increasing the demand for
bankruptcy by strategic borrowers.
Opposing BAPCPA were consumer advocates and the bankruptcy bar, the lawyers
and trustees who administer bankruptcy procedures in the U.S. (Steel 2001). Their side
dismisses the strategic aspects of consumer bankruptcy decisions, stressing instead the
accidents that may trigger bankruptcy: illness, unemployment, divorce, etc. (Sullivan et
al. 1989, Himmelstein et al. 2005). Their side sees bankruptcy as a last resort form of
1 In pseudo corporate-legal terms, Chapter 7 means liquidation: filers turn over any non-exempt assets that are not already owned by secured creditors. Remaining debts are discharged, so filer’s own their future income free and clear. Chapter 13 is reorganization: filers’ keep even non-exempt assets but agree to continue payments out of future income. Reorganizations are subject to approval by a federal trustee. Exemptions are set by state. Before BAPCPA, the liquidate (7) or re-organize (13) decision was jointly determined by filers and trustee. The means test under BAPCPA limits that discretion.

2
insurance against such calamities, so to reduce the supply of bankruptcy insurance, as
BAPCPA may, seems mean spirited.2
Lawmakers caught between those forces face Goldilock’s dilemma. Laws that are
too soft reduce the supply of household credit (Gropp et al. 1997). Laws that are too
hard expose borrowers to all sorts of accidents may reduce entrepreneurship (Fan and
White 2003, Armour and Cummings 2005). In fact, some E.U. nations have recently
softened their consumer bankruptcy laws partly to spur entrepreneurship. Erring in either
direction has first-order consequences on household welfare.3
With that debate as background, this article asks whether the means test under
BAPCPA take U.S. bankruptcy law a step closer to the socially optimal law. We
approach the question from a variety of perspectives.
Section II takes an institutional-theoretic view. We argue that a means test is a
step toward the sort of income indexed debt contracts that risk averse borrowers would
choose of their own accord. Income indexing obligates borrowers to repay more or less
of their debt depending on their income, much like a means test. However, if income
verification costs are prohibitive (Townsend 1979), or if contracting innovations by the
private sector are stymied by free rider problems, welfare enhancing contracts (such as
income-indexed contracts) may not be privately available or enforceable. Franks and
Sussman (2005) argue that the state can improve on private contracting outcomes (by
internalizing innovation externalities), but self-interest may bias the “bankruptcy bar”
(Steel 2004) toward soft laws. Conflicting interests and suspicions about the intent of
changes in bankruptcy law can also cause the law to cycle between soft and hard. Our
brief review of the evolution of U.S. consumer bankruptcy law seems consistent with
those predictions.
2 For example, Krugman (2005) condemns BAPCPA as another step toward “privatization of risk” that takes U.S. society a step further toward a “debt-peonage.” Rhetoric over BABPCA echoes the debates over welfare reform in the mid 1980s
The banking and credit-card companies that bankrolled the new law … want us to believe that it is designed to capture wild spenders who finance lavish lifestyles before ducking behind the protection of bankruptcy when the bills come due. But this contemporary retelling of the myth of the welfare queen dissolves under scrutiny (New York Times, October 3, 2005)
3 Consumer spending accounts for roughly two-thirds of aggregate U.S. spending, much of it financed by debt, so any change in consumer credit markets automatically matters for aggregate spending. The hardening of U.S. law will also affect hospitals, whose claims on uninsured patients are discharged under chapter 7.

3
Section III reviews empirical studies of how bankruptcy laws affect the demand for
bankruptcy and the supply of credit. A number of studies confirm that soft bankruptcy
laws and falling stigma have increased the demand for bankruptcy. High bankruptcy
demand, in turn, reduces the supply of credit. On the other hand, bankruptcy demand
also depends on accidents, especially health shocks, thus justifying concerns that
reducing the supply of bankruptcy also reduces the supply of insurance to unlucky
households.
Section IV studies the rush-to-file just before BAPCPA became effective in October
of 2005 to determine what sorts of households stand to lose the most under BAPCPA.
Consistent with the strategic view, we find that the rush-to-file was significantly higher in
states with higher exemption rates, and that exemption rates have their largest impact in
states with troubled borrowers (low FICO scores).
Section V looks for credit supply effects of BAPCPA at a number of stages in the
production process, from the credit card banks who originate loans, to the credit card
backed securities the loans get turned into, to the third party debt collectors who buy
discharged credit card loans. Event studies show that stock prices of debt collectors and
(some) credit card banks increased as BAPCPA passed through Congress. We document
that chargeoffs of credit card loans are now at historical lows since the rush-to-file ended,
but note that interest rates paid by borrowers have not yet responded, and document that
the excess spread paid to issuers of credit card asset-backed securities, remains at
historical highs.
Section VI discusses recent simulations of how harder bankruptcy rules affect welfare
for the representative household. In our view, these computable models offer the best
hope for answering our question because they take into account how a hardening of the
law affects both the supply of credit and the supply of insurance against income risk and
other shocks. Unfortunately, the models deliver conflicting answers.
Section VII takes up a crucial assumption in all these models: perfect competition
in consumer credit markets. Under that assumption, all the benefit of hardening
bankruptcy laws gets passed on to borrowers. However, if competition is weak,
increased creditor protection translates into increased profits for lenders instead of lower
interest rates for borrowers. While there are legitimate reasons to expect “sticky” credit

4
card rates (Ausubel 1991, Stango and Knittel 2003, Calem, Gordy, and Mester 2006), our
VAR analysis of the relationship between credit card spreads and chargeoffs shows that
spreads do indeed eventually decline as chargeoffs decline. Given that credit card write-
offs in the first quarter of 2006 were at their lowest in nearly twenty years, we predict
lower credit card rates in the near future.
Although we predict that BACPA will increase consumer credit supply, we have to
end more ambiguously on the question we set out to answer: will BAPCPA improve
overall welfare for the typical household? The welfare calculus is complicated because
the costs and benefits of BAPCPA fall unevenly. Increased credit supply benefits all
borrowers, more or less. The downside, reduced supply of bankruptcy insurance, is
harder to evaluate because we cannot be sure who that most affects. If the marginal filer
fits the strategic model, social conscience may be assuaged. But if the marginal filer is
truly unlucky, BAPCPA will indeed seem hard-hearted. The rush-to-file before
BAPCPA included both strategic and accident-prone types, so in the end, we cannot say
for sure whether the increased supply of consumer credit we expect from BAPCPA is
enough to offset the reduced supply of insurance for risky (as opposed to strategic) filers.
II. Means Testing as Innovation and the Forces Opposing It
We argue that means testing resembles an income indexed debt, a potentially welfare
improving innovation in financial contracts. We then discuss the forces that might oppose
such innovations.
II.1 Means Testing as Income Indexed Debt
If borrowers have random income and are risk averse, they will prefer financial
contracts with future repayment that increase with realized income. We illustrate using a
standard, two-period credit model. Let c denote household consumption in period one or
period two. Utility from consumption equals U(c). Utility is increasing in consumption,
U’(c) >0, but at a diminishing rate, U’’( c) < 0. Second period utility gets discounted
by δ < 1.
Suppose household income equals zero today period and 2 on payday, i.e. next
period. Without credit, household consumption equals income each period, so total utility
equals U(0) + δU(2). That rags to riches consumption pattern is suboptimal, so
households will demand credit to smooth their consumption. Given sufficient

5
competition among lenders, households should be able to borrow at the safe rate of
interest, R. Households will borrow (b) until the marginal utility of consuming another
unit in today equals the discounted, marginal disutility of repaying the debt on payday,
i.e., U’(b) = δRU’(2-Rb). Total utility at optimal borrowing equals U(b*) + δU(2-Rb*).
If b* > 0, household utility must be higher with credit than without. Lenders raise
welfare in this particular scenario by providing a pure credit service: they let households
smooth their income as their income changes over time. In the special case of log utility
where u(c) = ln(c), we have c1* = b* = 2/[R(1+δ)] and c2
* = 2δ/(1+δ). The optimal
amount of smoothing is driven by the interest rate R and the discount rate δ.
If future income is risky, lenders can also provide a form of insurance along with
credit. Suppose half of households will earn income next period equal to 1 while the
other half earn income equal to 3 (so median income equals 2). If household income is
freely observable, a strong assumption, debt payments can be tied to future income: p1
and p3. The optimal contract {b,p1,p3} maximizes household’s expected utility subject to
lenders covering their cost of funds. The first-order conditions for the optimal contract
imply (Appendix A.1):
(1) U’(b)/R = δU’(1- p1) = δU’(3- p3)
Notice that the optimal debt payments are increasing in income: p3 > p1. Borrowers
prefer income-indexing payments to a fixed payment contract where p3 = p1 because of
the insurance provided. Note that lenders can provide these credit-insurance contracts at
the same price per unit as ordinary credit. Credit-insurance costs the same because 1)
lenders can diversify the income risk and 2) the insurance does not invite any moral
hazard or adverse selection, i.e., households are not able to influence or hide future
income.
The means test under BAPCPA is one step toward income-indexed debt contracts.
In effect, the means test says households with income below the median for their state
qualify for discharge, but households with sufficient means must repay debt over time.

6
If means testing is preferable to borrowers, the puzzle is why lenders did not offer
income indexed debt contracts on their own, before BAPCPA.4 High contracting costs
are one obvious answer: if debt payments are tied to income, some borrowers will be
motivated to conceal income to minimize their debt payments.5 However we model it,
the potential to cheat will limit the contracts lenders can feasibly offer households.
Imagine there are Thruthies (T) and Falsies (F). T cannot tell a lie. F lie when
worthwhile. The gain from lying equals the difference in debt payments in income states
1 and 3: U(3 - p1) - U(3- p3). The cost of lying equals f ≥ 0. Think of f as the accounting
costs of hiding income, plus any stigma falsies suffer from faking bankruptcy. Lenders
cannot tell T from F ex ante or ex post, all they know is the proportion of T and F at
large: T, 1- T. Keeping F honest requires U(3 - p1) - U(3- p3) ≤ f. Lenders can only
collect income, not flesh, so they are bound by p1 ≤ 1.
The optimal contract maximizes welfare for Truthies subject to 1) lenders
breaking even, 2) Falsies tell the truth, and 3) the boundary condition. 6 The FOC for
this problem can be written (Appendix A.2):
(2) U’(b)/R = δU’(1- p1) - IU’(3-p1)2/T + B2/T= δU’(3- p3){1 + I2/Tδ}.
where I and B represent the shadow value of the incentive compatibility constraint and
the boundary condition. If the incentive and boundary constraints do not bind, then B= I
=0, and (2) is the same as (1). In that unconstrained case, truthies (and falsies) get
maximum feasible consumption smoothing and insurance. They demand b* and pay p1*
and p3* as their income dictates.
4 In fact, consumer lenders have tried to sell unemployment-credit insurance, wherein borrowers’ debt payments are reduced or forgiven in the event the borrower becomes unemployed, but demand for the product has not seemed high, perhaps because it is expensive, or perhaps because borrowers realize that bankruptcy provides implicit insurance. 5 Standard, non-income contingent debt contracts tend to dominate income-indexed contracts when income verification costs are high (Townsend 1979). 6 The revelation principle, an important theorem in game theory, justifies our focus on contracts where falsies do not lie in equilibrium, i.e., incentive compatible contracts. The revelation principle says we can derive general properties of all equilibria with asymmetric information by analyzing the set of incentive-compatible contracts. For further discussion see Meyerson (1979) or his website: http://home.uchicago.edu/~rmyerson/research/revnprl.pdf

7
If the incentive constraint binds, I > 0, borrowers wind up with less insurance
against income risk. Lenders must lower p3 and raise p1 relative to p3* and p1*, hence:
δRU’(3- p3) < U’(b*) < δRU’(1- p1).
This model illustrates three points. First, when functioning perfectly, credit
markets allow consumption smoothing over time and across events, i.e., credit markets
can provide insurance. In other words, when designed correctly, the bankruptcy option
increases welfare. Second, the moral hazard invited by credit insurance degrades both
credit market functions, so households’ standard of living fluctuates more over time and
across events. Third, the mere existence of falsies, strategic filers in other words, reduces
welfare for truthies and falsies.7 Falsies are hoist by their own petard. It follows that
everyone loses when the cost of falsifying declines, due to decreased stigma, for example.
Conversely, everyone gains when falsification costs increase. The extra reporting
requirements under BAPCPA increase falsification costs.
If harder bankruptcy laws benefit all, why are laws ever too soft? Franks and
Sussman (2005) argue that bankruptcy judges and lawyers who administer bankruptcy
proceedings may be biased toward soft laws because soft laws increase demand for
bankruptcy.8
II.2 Opposing Forces
Bankruptcy is about dividing a fixed pie of income and assets. The proceedings
are zero-sum so naturally interests are bound to conflict. All else the same, creditors
prefer harder bankruptcy rules. Debtors obviously prefer softer rules, especially ex post.
The state may have an interest if there are external, social, costs associated with
bankruptcy not borne by individual creditors and debtors.9
David Skeel (2001) catalogues the opposing forces that have shaped U.S.
bankruptcy law since the 18th century. The bankruptcy bar--the lawyers, trustees, and
judges who administer bankruptcy proceedings in the U.S.—was and is an important
7 If falsies could promise not to lie, and keep their promise, everyone would be better off. Absent an entire population of promise keepers, however, lenders can only sell contracts that keep falsies honest. 8 Franks and Sussman (2005)is more about commercial credit and bankruptcy, but many of the principles seem to extend to consumer contracts. 9 The state justified intervention in corporate bankruptcy proceedings in the 19th century on the grounds that hard nosed creditors pushing for liquidation of bankrupt railroads ignored the “going concern” value of

8
force. The bar’s main interest, according to Steel, is to insure its own existence by
resisting repeated efforts to shift routine bankruptcy proceedings from courts to an
administrative branch of the government, as in most countries. Harvard law professor
Elizabeth Warren is an ardent opponent of BABCPA. Her survey findings that up to half
of filers cite medical emergencies as the cause of their filing (Himmelstein et al. 2005)
has made her an influential advocate of the accidents model of bankruptcy demand. The
law and economics school of legal analysis, associated with University of Chicago law
professor, Richard Posner, emphasizes efficiency over fairness and equity as the guiding
principle in legal design. Law-econ scholars are more sympathetic to the strategic model
of bankruptcy demand, and tend to applaud BAPCPA.10
U.S. personal bankruptcy law has evolved fitfully. Congress passed laws in 1800,
1841, and 1867, but repealed each shortly after. The first, lasting law was passed in
1898. The first substantive change, the Chandler Act of 1938, provided for partial
repayment over time by adding Chapter13. Congress left the choice between Chapter 7
or 13 to filers and the trustees overseeing bankruptcy.
The first overall reform in U.S. personal bankruptcy law was BRA 1978
(Bankruptcy Reform Act of 1978). BRA 1978 was motivated by a rise in personal filing
rates over the 1970s that barely registers on the scale of filings these days. Creditors
lobbied Congress for relief in two ways: a means test to determine eligibility for debt
discharge and limits on homestead and property exemptions. Congress voted against a
means test. They did pass a uniform federal exemption, but they made it non-binding on
states (Steel 2001).
Steel (p. 156) summarizes the reforms embodied in the BRA 1978 as “mildly pro-
debtor.” Casual facts bear that out. Households did not rush-to-file before BRA 1978
took effect (unlike with BAPCPA), nor did filings decrease after, they accelerated.11
those enterprises to society at large (Franks and Sussman 2005). The fresh start concept in personal bankruptcy has a similar rationale. 10 See the Becker-Posner blog for a law-econ view of BAPCPA 11 In hindsight, 1978 was not an auspicious time to tighten bankruptcy rules, for two reasons. For one, disinflation in the early 1980s, to the extent it was unanticipated, was an undeserved transfer of wealth from debtors to creditors. Were creditor protections increased, the transfer would have been larger, and the disruptions to fortunes in the farming states even more severe. For another, deregulation of credit card interest rates in 1978 made credit cards and revolving credit increasingly available to the middle and lower

9
Has U.S. consumer bankruptcy law cycled, as hypothesized in Franks and
Sussman (2005)? The Chandler Act of 1938 and BRA 1978 both gave personal filers
other options, Chapter 13 and uniform exemption, respectively.12 Additional options
should not make people worse off, so both reforms can be seen as steps toward softer
laws. BAPCPA, by contrast, takes options away with the means test. Those three
observations, though noisy (because other things changed with each reform), are
consistent with the cyclical hypothesis.
U.S. personal bankruptcy law is certainly softer than in most E.U. nations, even
after the hardening of laws here and softening that has occurred abroad in recent years
(Armour and Cumming 2006). After BAPCPA, filers with sufficient means must
continue paying debt for five years before any remaining debt is discharged. Spain and
Italy never allow discharge. Germany softened its laws in 1999 to allow discharge after
seven years. The U.K. shortened time-to-discharge from three years to one year in 2004.
The homestead and other exemptions in the U.S. are also relatively generous. Six
states allow unlimited homestead exemptions.13 By contrast, filers in most other
industrial nations keep only “personal effects, tools of her trade, and a subsistence
allowance.”
III. Household Bankruptcy Demand and the Supply of Credit
A variety of studies find evidence consistent with the view that softer laws,
measured usually by differences in exemptions, tend to increase the demand for
bankruptcy. We review a number of such studies below sorted by the fineness of their
data: household, county, etc. Household level studies are relatively rare owing to the
paucity of data collected on individual filers. In our review, we focus on findings for or
against the two competing models of bankruptcy demand: strategic versus accidents.
Fay, Hurst, and White (2002) study PSID (Panel Study of Income Dynamics) data
from 1996. Their data included 254 filers. They compared that sample of filers to a much
income households. Tightening bankruptcy rules at the same time might have made those novice borrowers easy marks for lenders intent on manipulation. 12 Chapter 13 is a valuable option to wealthy filers with high non-exempt assets. Congress expected ordinary filers might prefer Chapter 13 (to avoid any extra stigma from a discharge)but few do: Chapter 7 filings outnumber Chapter 13 by more than 2 to 1. 13 Homestead exemptions are unlimited in Texas , South Dakota, Oklahoma, Florida, Iowa, and Kansas.
10
larger sample of non-filers to identify determinants of bankruptcy demand. Consistent
with the strategic model, they find that differences in the net benefit of filing, computed
based on individual debt, income, assets, and exemptions (as determined by residence),
played a major role in the decision to file. Individual filing probabilities were are also
increasing in the aggregate filing rate in the individual’s district, suggesting that rising
aggregate bankruptcy is reducing the stigma cost of filing.14 Both those results are
consistent with the strategic model. By contrast, they find that unemployment,
unemployment, divorce, and medical problems were not significant determinants,
contrary to the accidents model.
Gross and Souleles (2002) study a unique dataset of credit card accounts
comprising 1000s of cardholders who ultimately went bankrupt. Consistent with the
accidents model, they find that the probability of bankruptcy is increasing with
unemployment and the lack of insurance. However, changes in those sorts of risk explain
only a small fraction of the rise in bankruptcy observed over their sample period (1995-
1997). They conclude, like Fay et al (2002) that declining stigma has increased the
demand for bankruptcy. Domowitz and Sartain (1999) combine data from the Survey of
Consumer Finances and a survey of filers conducted by the U.S. General Accounting
Office. The two major determinants of the probability of filing, they conclude, are high
credit card debt, and high medical debt (above two percent of filer income).
Elul and Subramanian (2002) use PSID data to test for “forum shopping,” i.e.
whether people with a propensity toward bankruptcy move to states with high bankruptcy
exemptions.15 They estimate a statistically significant, but economically small effect: of
1.6 million moves to high exemption states: perhaps 17,000 are motivated by the
additional bankruptcy benefit.
Using county data, Edmiston (2006) uncovers many bankruptcy correlates,
including gambling (Chart 2 and Chart 3) Given quite a long list of controls for
economic and health conditions and other variables that might influence bankruptcy rates
(and casino locations), he estimates that filing rates in counties with a Casino are about 4
14 Feedback between individual and aggregate behavior can cause unstable, “tipping point” dynamics: if higher aggregate filings lower individual stigma, and if lower individual stigma increases aggregate filings, steady-state filings may expand until all households for whom filing would be financially beneficial—18 percent of households by Fay et al, (2002) calculations--will file.

11
percent higher than in counties that are 100 miles away from a Casino.16 Filing rates are
also higher in counties in states with higher bankruptcy exemptions, consistent with the
strategic model. Consistent with the accidents model, on the other hand, he also finds
that filing rates are higher in counties with higher rates of disability and lower rates of
insurance coverage.
Himmelstein et al (2005) provide what may be the most influential evidence for
the accidents model of bankruptcy demand. From their survey of over 1600 filers, they
find that medical expenses are cited as the reason for filing in anywhere from 25 percent
to 50 percent of filings. Deaths, births, and illness are especially common reasons given
by filers for their bankruptcies.17
While there is disagreement over the relative role of strategy versus accidents in
determining bankruptcy demand, there is more unanimity that soft bankruptcy laws
reduce the supply of credit to consumers and entrepreneurs. Households in states with
unlimited homestead exemptions borrow less and pay more for credit (Gropp et al
1996).18 Small firms in unlimited exemption states pay higher interest rates, borrow less,
and are more likely to report being turned down for credit (Berkowitz and White 2004).
Households in states with “debtor-friendly” limits on home foreclosure wind up with
substantially smaller mortgages (Pence 2003). In an international study covering 129
countries, Dyzankov et al. (2005) establish that higher creditor protection (implying less
debtor protection) is associated with higher ratios of private credit to GDP.19
We take three points from these empirical studies of bankruptcy demand. First,
bankruptcy demand is partly strategic and partly accidental, not just one or the other.
15 O.J. Simpson, for example. 16 Bankruptcy with discharge gives borrowers a put option on their own (non-exempt) assets. Option values increase with risk, as any smart gambler knows. Gambling addictions, incidentally, are counted as a medical condition in Himmelstein et al. (2005). 17 The descriptive statistics analyzed by Himmelstein et al (2005) do not let them identify the marginal impact of medical debt on the probability of filing. Zywicki (2005) looks askance at Himmelstein et al. (2005) 18 An ancillary finding in Gropp et al. (1996) suggests that high exemptions cause credit to be relocated toward wealthier households. At the margin, raising already high exemptions provides only additional protection for wealthy households that had some unprotected assets at the old exemption level, so demand from wealthy households increases with the level of exemptions. 19 For a set of 21 countries that changed creditor protections over the studies sample period, they estimate that increasing their creditor rights index by 1 (on a scale of 1-4) increases the average annual growth rate of private credit/GDP by 16.5 percentage points in the three years after the reform relative to the three years preceding reform.

12
Second, the demand for bankruptcy has increased as stigma costs have fallen. The
relative importance of strategy, bad luck, and declining stigma is debatable. Third, softer
bankruptcy laws reduce the supply of credit.20
IV. Differences in the Rush-to-File across States
Chapter 7 filing rates spiked just before BAPCPA took effect last October (Chart 1).
Differences in the rush-to-file across states provide some indication of who expect to lose
the most from the tighter bankruptcy provisions under BAPCPA. To investigate, we
regressed the percentage change in Chapter 7 filings per household between 2005:Q4 and
2005:Q3 for each state and Washington D.C. on state bankruptcy exemptions, economic
conditions, and proxies for the health risks emphasized in the accidents model. We find
evidence consistent with both models.21
Definitions and summary statistics for the regression variables are reported in
Table 1. RUSH, the dependent variable in all regressions, equals the percentage change
in Chapter 7 filings between 2005:Q4 and 2005:Q3. EXEMPTION equals the mortgage
exemption for married couples in each state. UNLIMITED equals one for states with
unlimited exemptions and zero for other states. FICO equals the average FICO across
the state. Higher FICO implies higher risk.
Some limitations of the data should be noted. First, the data are measured at the
state, not individual, level. Averaging does not matter for exemptions as that variable is
the same across all individuals within a state, but for variables that vary across
individuals within a state, averaging induces measurement error that bias estimates of that
variables impact on RUSH downward. Second, several variables were observed before
2005, another potential measurement error. Lastly, the provenance of the FICO variable
is uncertain as that variable was obtained from a poorly documented website.
20 In recent work, Dick and Lehnert (2006) find that at least some of the rise in bankruptcy can be attributed to the increase in credit market competition following banking deregulation in the 1980s and early 90s. With the removal of banking restrictions and the ensuing use of enhanced risk-screening technologies, consumers, and in particular those in higher risk classes, have had greater access to credit. This is especially interesting since the rising trend in consumer bankruptcy is usually associated with greater economic distress, or even consumer fraud, as mentioned earlier. 21 State asset exemptions only apply under Chapter 7. The means test under BACPA limits access to chapter 7. Thus, BACPA effectively limits the value of exemptions for households with adequate means.

13
Table 2 reports regressions of RUSH on the exemption variables and controls for
state economic conditions. Given economic conditions, Model (1) indicates that RUSH
is not significantly correlated with either exemption variable or FICO. Model (2), by
contrast, indicates that RUSH was significantly higher in states with high exemption and
low FICO scores. Model (2) makes more sense than model (1); we would only expect
BAPCPA to increase (current) demand for bankruptcy for high risk (low FICO)
households who also live in states with high exemptions. We would not expect low risk
households to file regardless of exemptions.22 Models (3) and (4), where the sample is
split at the median FICO (684), make the same point; the exemption coefficients are
much larger and more nearly significant in low FICO states than in high FICO states.
Somewhat surprisingly, RUSH was higher in states with higher median income.23
That might reflect that credit demand (and the potential for bankruptcy) is increasing in
income, or, that households (mistakenly) thought that the means tests would be based on
national, not state, median income. RUSH is also higher in states with higher poverty
rates. Both of those “income effects” are larger in low FICO states.
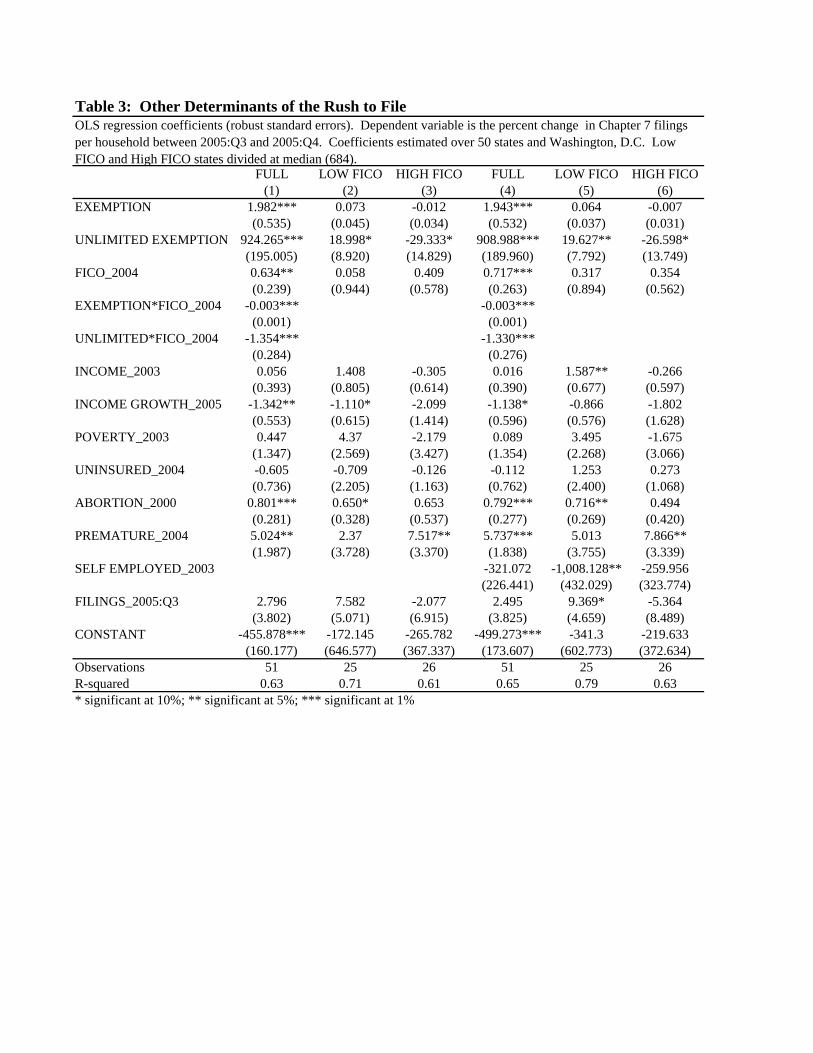
Table 3 reports regressions that include various health risks. RUSH is higher in
states with higher rates of ABORTION and PREMATURE births (Model 1). One
standard deviation increase in PREMATURE (about 1.4 %) increases RUSH by about 6.4
percentage points, a sizable effect. PREMATURE births are a costly medical emergency
that require intensive care to save the infant, so the link between RUSH and
PREMATURE may be consistent with the accidents model of bankruptcy.24 However,
both those results change when we split the sample at the median FICO score (model 2 an
model 3): RUSH is correlated with PREMATURE only in high FICO states.
ABORTION is correlated with RUSH only in low FICO states.25
22 Symmetrically, Model 2 also implies that the marginal effect of FICO on RUSH was lower in higher exemption states. State asset exemptions only apply under Chapter 7. The means test under BAPCPA limits access to chapter 7. Thus, BACPA effectively limits the value of exemptions for households with adequate means. 23 Edmiston (2006) finds that county filing rates are increasing in (county level) income. 24 According to http://www.marchofdimes.com/aboutus/14458_15365.asp, the average cost of a premature baby (to employers) is $46,610 versus $2,830 for a healthy, full-term baby. Mother’s of premature babies averaged 29.1 days out-of-office in the first six months after delivery, versus 18.9 days for mothers of full-term babies. 25 The correlation between RUSH and ABORTION (or lawyers per capital, or population density) is insignificant if the regression excludes D.C. None of the other reported results change substantively with

14
RUSH was not higher in states with higher rates of self employment (Table 3:
models 4-6). If anything, RUSH was negatively correlated with SELPEMPLOYMENT.26
That finding may provide some assurance to those worried that BAPCPA will reduce
entrepreneurship.
In sum, our decomposition of the rush-to-file before BAPCPA took effect in 2005
shows that RUSH was significantly higher in states with more generous bankruptcy
exemptions. That finding obviously squares with the strategic view of bankruptcy
demand. On the other hand, rush was higher in states with higher rates a premature
births, a costly medical emergency. That finding may square with the accidents view of
bankruptcy demand, though we have to wonder why the link between RUSH and
PREMATURE was not higher in states with more high risk (low FICO) households, as
one would naturally expect.
Credit Supply Side Effects of BAPCPA.
We look for credit supply effects of BAPCPA at a number of stages in the supply
chain, from the credit card banks who originate loans, to the credit card backed securities
the loans get transformed into, to the third party debt collectors who buy discharged
credit card loans. The events studies in the next section show that while the passage of
BAPCPA was a nonevent for credit card companies, the reform is associated with
positive stock price reactions for debt collectors. We also document that credit card
spreads and APRs have not fallen yet
V.1 Credit Card Lenders and Debt Collectors
We estimate a market model using stock prices for 435 publicly-listed banks and
BHCs (bank holding companies). Following standard procedure, we estimate each
bank’s beta using daily stock prices over 2004, the year before BAPCPA was introduced
in Congress.27 For the actual event study, we use daily market-adjusted returns over 82
D.C. excluded. Excluding Louisiana (where hurricane Katrina struck in 2005) does not change any of the main results we discuss in the paper. 26 RUSH was not correlated with the gender of the trustee overseeing bankruptcy petitions. 27 Specifically, we estimate a CAPM of bank returns on SP500 market returns, which we then use to obtain predicted bank returns for 2005, and thereby abnormal bank returns. We use the latter as our dependent variable in the event study. Event study researchers usually assume that abnormal returns are independent across firms. The independence assumption is inappropriate here because bankruptcy reform (potentially) affected all banks. Following the portfolio methodology in Jaffe (1974) and Brown and Warner (1980, 1985), we take the average actual bank returns for each trading day and estimate this average return as a

15
trading days throughout January and April of 2005. To allow for information leakages
occurring before any event, and lagged reactions, we use various event windows around
each date.
Table 4 reports the cumulative abnormal returns (CARs) around each of six dates
that our research identified as dates where news on prospects for BAPCPA might have
reached the market. 28 Some events were positive and some negative, but the overall
effect was not significantly different from zero. For the average (publicly traded) bank,
in other words, BAPCPA was a “non-event.”
Table 4 also reports cumulative abnormal returns for the four publicly-traded
TPDC (third party debt collectors) identified in DeLaney (2005). TPDC buy charged-off
credit card loans from credit card banks at deep discounts. The TDPC gets to keep any
funds it collects from borrower. If a borrower files bankruptcy, all creditors, the TDPC
included, must cease collection efforts. If the higher costs of filing under BAPCPA
reduces borrowers’ “demand” for bankruptcy, or forces them to postpone filing, then all
else the same, TDPC collections per account should rise. Consistent with the hypothesis,
we find that with the window of -1 day/+5 days, abnormal returns for debt collectors
were (17.1%) and significant at the 3 percent level.
Table 5A reports regressions of CAR on bank size (assets) and loan portfolio
shares (credit cards and mortgages).29 Note that our regressions alternatively contain an
indicator variable for whether the bank has any credit card loans, since about half of the
banks in our sample fall in such category. We also include the charge-off levels for the
loan portfolio.
The impact of the reform on credit card banks stock returns depends on whether
MBNA enters the regressions. With MBNA included, stock returns of credit card banks
were lower than for other banks as BAPCPA wound through Congress. With MBNA
excluded, stock returns for credit card banks were higher than for other banks while
function of the market return. We use the estimated beta to calculate abnormal returns for the bank portfolio we used in our event study. 28On January 24, 2005 there was a news release of the potential introduction of the Bill in the house, as reports surfaced that Senator Grassley planned to bring the bill up once again. The following day, an American Banker article documents the troubles the bill had had in the past but suggests that the current political environment could be more favorable to passage this time around. 29 The dependent variable equals the sum of the abnormal returns across all event days, where abnormal returns are calculated from a bank-specific market model

16
BAPCPA was in play.30 In particular, a one standard deviation increase in the credit card
loan share increases abnormal returns in the amount of 0.8%.31 However, there appears
to be no difference between credit banks and the rest when we replace the credit card loan
share for the indicator variable which takes on the value of one if the bank has any credit
card loans, and zero otherwise. Moreover, when we rerun the event study on credit card
banks alone (those with any credit card loans), the reform continues to be a nonevent
even for this subsample.
V.2 Credit Card Asset-Backed Securities (CCABS)
CCABS are a by product of the credit card securitization process. Credit card
issuers pool card accounts, then sell them to a trust. The trust finances the purchase by
selling CCABS to investors. The trust earns the interest and fees paid by card holders
and inter-change-fees. Charge-offs of problem accounts count as an expense for the
trust.32
The rush-to-file last year caused high charge-offs in prime and sub-prime CCABS
markets, but since then, charge-offs have been at historic lows (Chart 6) The cumulative
decline in charge-offs since January 2006 more than compensates for the higher charge-
30 MBNA credit card loans (as a share of assets) was 34%, compared to 6.4% for Simmons First National, 5.6% for Citigroup, 5.3% for JPMorganChase, and 4.6% for Bank of America. According to Wikipedia, MBNA was one of the major contributors to BAPCPA. 31 The negative association between abnormal returns and the credit card loan share when we include MBNA could reflect contaminating events. MBNA was reported to miss its earning estimates for the first quarter of 2005, an event that can cause sharp drops in stock prices (Stable Value Credit Update, Standish Mellon, March 2006). Rumors of MBNAs acquisition by Bank of America, officially announced in June, 2005, may have been circulating by the first quarter of 2005, the same time Congress was debating BAPCPA. Buyout rumors, and their denials, can cause sharp fluctuations in stock prices for the rumored target. 32 CCABS issued by the trust are almost always rated by the rating agencies, as they are typically placed with investors facing investment mandates. The rating agencies simulate the cash flows of the trust using baseline assumptions about key inputs (portfolio yield, monthly payment rate, charge-offs, and purchase rate), and then check to be sure that investors in are paid interest and principal in full when these inputs are stressed. In order to attain a higher rating, the trust must meet these obligations during more highly-stressed conditions. The trust uses several features to attain the desired credit rating for a particular instrument: tranching the cash flows from collateral (adding subordination), over-collateralizing the portfolio (selling receivables at a discount of par, creating an equity tranche for the issuer), trapping excess spread in an account, creating of a cash collateral account (loan from third party that provides collateralized insurance), or purchasing of credit insurance (unfunded insurance sold by a third party). Investors are also protected from loss by covenants that trigger early or rapid amortization. These events can be triggered by the performance of the seller/servicer (default, failure to transfer new receivables when needed), or can be triggered by the performance of the collateral (excess spread, seller participation, par value of portfolio relative to par value of tranches). The most common performance trigger is a restriction that the three-month average excess spread must not fall below zero, implying that this is an important figure followed by investors and reported by the rating agencies.

17
offs caused by the rush-to-file, suggesting that BAPCPA will permanently reduce
bankruptcy demand.
The difference between trust income and expenses is called excess spread. Excess
spread is escrowed as a cushion against future losses for trust investors, but is eventually
returned to the issuer as profit. The rush-to-file last year caused excess spreads to fall as
charge-offs rose, but low chargeoffs since then have pushed excess spread to historic
highs (Chart 7). The fact that excess spreads remain high even after the rush to file
suggests that credit card issuers have not yet passed any benefit from reform on to
borrowers in the form of lower interest rates.
VI. The Ambiguous Impact of Means Testing In Simulations.
Even if soft bankruptcy laws reduce the supply of credit, harder bankruptcy laws
are not necessarily better for the average person. Perhaps the extra insurance provided by
debtor-friendly bankruptcy laws is worth the loss of credit? Economists have simulated
models that compute that tradeoff. The models are more fully articulated versions of the
credit model we discussed in section II: risk averse households demand credit supplied
by perfectly competitive lenders. Household income fluctuates over time so credit helps
households smooth their consumption. Households are strategic: they demand credit
with the bankruptcy option in mind. The benefit of bankruptcy depends on the rules
embedded into the model, but the main benefit is a discharge of unpaid debts. The cost
of bankruptcy is temporary exclusion from credit markets and stigma. Once calibrated
with numerical values, one can compute how a hardening in laws changes borrowing,
interest rates, and household welfare.33 These simulations strike us as the best, if not
only, way to answer the question of how means testing affects welfare for the typical
household. Unfortunately, if not surprisingly, the answer depends on the model.
Table 6 summarizes results from four recent studies. All models predict that
means testing would increase the supply of credit, so interest rates fall and borrowing by
the typical household increases. The extra borrowing helps households maintain their
standard of living (consumption) as their income fluctuates over time. The downside is
that if borrowers have a very large drop in income, bankruptcy will be harder. In

18
Chatterjee et al. (2005) and Athreya (2002), the benefit from lower interest rates forever-
after more than compensates for the cost of losing the option of immediate discharge.
Thus, the average household is expected to be better off with a means testing rule than
without, i.e., they would agree, ex ante, to submit to means testing.34
More recent, extended models conclude that means testing would lower welfare. Li
and Sartre (2006) add labor and capital to the basic model. They predict that a means test
would lower production for two reasons. First, bankrupt people would be less likely to
work if their future wages were “taxed” to repay debts. Second, increased consumer
borrowing (due to increased supply) would crowd out business investment, thus lowering
worker productivity. They figure the loss utility from lower production, plus the loss of
bankruptcy insurance, more than offsets the gain from increased consumer credit
supply.35
Livshits et al. (2006) consider an entirely different risk for households: expense
shocks that drain income. They estimate the expense and probability of three major
expenses—uncovered medical bills, divorce, and unplanned, unwanted pregnancies—
from vital statistics, then simulate how a means test works when households face those
risks, plus income fluctuations.36 Welfare is “marginally” higher (p. 21) under softer
bankruptcy rules because the extra insurance against the expense shocks more than
offsets the reduced supply of credit.
What is the bottom line from these simulation studies? First, the upside of benefits
derived from a harder bankruptcy law—increased credit supply—offsets the narrow
downside—less insurance against random (exogenous) income fluctuations. But the
33 The number of parameters in the models varies between 10 and 15 or so. Stigma is usually a free parameter determined by the condition that the filing rate predicted by the model equals the filing rate observed in fact. 34 In Athreya (2002), the welfare gains from removing the bankruptcy option mostly result from lower deadweight costs: legal fees and household stigma. Some may be dubious of that, since 1) stigma has been falling, and 2) BAPCPA may increase legal costs. 35 Li and Sartre (2006) assume a close economy, so the extra borrowing by households when discharge is eliminated crowds out business borrowing. The consequent reduction in business capital lowers labor productivity, reduces labor demand, and lowers output. Their model predicts that a tightening of exemption levels leads to lower interest rates and higher debt/income ratios, contrary to the facts in Gropp et al. (1996). See Han and Li (2004) for estimates of the labor supply effects of bankruptcy before BAPCPA.. 36 A divorce shock in their model costs $36,558. An unplanned, unwanted birth costs $24,000. A medical shock costs $102,462. Given these estimates, they compare household welfare under a forgiving

19
downside of harder bankruptcy laws may be broader than that—harder laws may reduce
labor supply and productivity, and they also reduce insurance against expensive
accidents, like medical shocks, divorce, unwanted, or premature births. With those
knock-on effects considered, the downside may outweigh the upside.
VII. Credit Card Competition and Future Credit Card Spreads.
All the models just discussed assume perfect competition in consumer credit
markets. This section discusses reasons to doubt that assumption. Those doubts
notwithstanding, we predict that reduced demand for bankruptcy under BAPCPA will
lead to lower credit card interest rates.
VI.1 Doubts About Credit Card Competition37
Ausubel (1991) argues that a particular type of adverse selection hinders
competition among credit card lenders. In his model, credit card lenders who lower rates
may attract the wrong kind of customers, namely the interest sensitive borrowers who
expect to main large balances.38 Persistently high--“sticky”--credit card APRs
throughout the 1980s (despite falling market interest rates), high profits for credit card
banks, and evidence that some households do in fact underestimate their own demand for
credit card loans.39
Ausubel’s (1991) adverse selection explanation for sticky credit card rates does
not seem to apply when lenders costs are falling because of reduced bankruptcy demand.
Ausubel (1991) was out to explain why credit card rates remained high even as the cost
of funds to lenders had fallen. But BAPCPA lowers bankruptcy risk. Strict application
of Ausubel (1991) here implies a contradiction: lenders cannot lower spreads as
bankruptcy system with an unconditional discharge (as in the U.S. before BAPCPA) versus a very strict system with no discharge (as in some E.U. countries). 37 Credit card lending has become more concentrated: in 1997, the top four credit card companies earned 42 percent of industry revenues. In 2005, the top four companies earned 66 percent of industry revenues (Nader 2005). Visa and Mastercard clearly dominate the one aspect of the market and face constant threat of suit for anti-competitive behavior by the Department of Justice. 38 Lenders want to attract the “accidental” revolvers who do not expect to carry balances on their card but who wind up with positive (but not excessively risky) balances. Accidental borrowers, by definition, are relatively insensitive to interest rates. 39 Calem and Mester (1995) provide corroborating evidence: credit card borrowers with high balances are more likely to report being turned down when trying to transfer balances to a new card. Calem, Gordy, and Mester (2005) reaffirm that result. They (nevertheless) suggest several reasons why informational frictions, though still present, may be less of hang up today than in the 1980s. Increasingly accurate credit scoring models help lenders distinguish between low risk and high risk borrowers, thus guarding against adverse selection.

20
bankruptcy demand declines because they are worried that lower spreads will increase
bankruptcy demand (due to adverse selection).40 It is also worth noting that credit
scoring and other technological innovations since the in the last 15 years have made
credit card lenders increasingly adept at favorable (as opposed to adverse) selection
(Calem, Gordy, and Mester 2006). These points incline us to suspend our doubts about
credit card competition.
VII.1. Future Credit Card Rates
Chart 8 shows plots the spreads and charge-offs on actual credit cards (as opposed
the to credit card backed securities discussed above). The spread equals the credit card
APR minus interest rate on a 6 month Treasury bill. It appears that credit card spreads do
rise and fall with charge-offs. Note that charge-offs in 2006:1 were lower than at any
time since the early 1990s.
Chart 9 plots the impulse responses from a VAR (vector auto regression)
comprising the 6-month Treasury bill rate, credit card spread (APR – T-bill rate), and
credit card charge-offs (xoffs). The variables entered the VAR in that order.
Consistent with Ausubel (1991), the left, middle row panel shows that a positive
shock to the T-bill rate cause spreads on credit card to fall substantially. Credit card
rates, in other words, are sticky with respect to the cost of funds.
The bottom, left panel shows that higher chargeoffs cause higher spreads. The
pass from chargeoffs to spreads is not immediate, or complete, but neither is it trivial: a
50 basis points increase in chargeoffs causes spreads to rise by about 25 basis points.41
Chargeoffs in February 2006 were about 120 basis points lower than in August 2005,
before the rush-to-file. If nothing else changes, we predict credit card spreads will
eventually fall from pre-BAPCPA levels.
VIII. Conclusions and Policy Implications
Given sufficient competition, the upside from the hardening of personal
bankruptcy laws under BAPCPA is predictable: increased consumer credit supply. By
40 Were the opposite true, why would not have observed that borrowers in states with lower exemptions pay lower interest rates (Gropp et al. 2002). This reasoning implies an ancillary test of Ausubel’s (1991) theory: interest rates on unsecured credit should be more persistent as market rates fall in countries or states with less creditor protection.

21
making it tougher to discharge debt, demand for bankruptcy will fall, and losses (to
lenders) in the event of bankruptcy should fall. Both effects act to lower costs to lenders.
Reducing bankruptcy demand will have a knock on effect; as filing becomes less
commonplace, the stigma from filing will increase which further reduces demand.
If competitive forces are strong enough in the credit card market, these savings should be
passed on to consumers via lower rates and greater access to credit. Notwithstanding the
doubts we raised about credit card competition, we predict that lower demand for
bankruptcy under BACPA will eventually lead to lower credit card rates. The downside
of harder laws is reduced insurance against uninsured illness, divorce, and unwanted or
premature births. Thus, even if the average household is better off with BAPCPA, the
one to two percent of households at risk of bankruptcy may be worse off.42
We see two implications for policymakers. First, if adverse selection ala Ausubel
(1991) appears to be holding up credit card rates, policymakers could consider a
coordinated lowering of rates that would avoid adverse selection. Second, if BAPCPA is
associated with more hard luck cases of bankruptcy due to accidents, policymakers might
consider ways to improve explicit insurance against those risks.
41 The results are robust to alternative orderings. Adding more lags does not change the response of spreads to charge-offs, but reduces significance. 42 Hardening the law may also reduce entrepreneurship, though the evidence on that point is mixed

22
Appendix
A1. Optimal Contract with Random Income
The optimal contract (b,p1 ,p3) maximizes the Lagrangian
U(b) + .5δ{U(1- p1) + U(3- p3)} + β[ .5(p1 +p3) – Rb],
where β represents the shadow value on the lenders’ breakeven constraints. The FOC
(first-order conditions) for {b,p1,p3} are:
FOC_b: U’(b) = βR,
FOC_p1: δ U’(1-p1) = β,
FOC_p3: δ U’(3-p3) = β.
Thus equation (1): U’(b)/R = δU’(1- p1) = δU’(3- p3)
A2. Optimal Contract with Truthies and Falsies.
The contract {b,p1,p3} that maximizes welfare for Truthies maximizes the Lagrangian
T[ U(b) + .5δ{U(1- p1) + U(3- p3)}] + I[f + U(3 – p3) - U(3- p1)] + B[1- p1] + β[ .5(p1 +p3) –Rb], .
where I and B represent the shadow value of the incentive compatibility constraint and
the boundary condition. The FOC (first-order conditions) are
FOC_b: TU’(b)= βR,
FOC_p1: U’(1-p1) δT/2 + B - IU’(3-p1) = β/2,
FOC_p3: U’(3-p3)( δT/2 +I)= β/2.
Proposition: If the boundary constraint binds, the incentive constraint also binds.
Proof: Suppose p1 = 1, so B >0, but I = 0. FOC_p1 and FOC_p3 imply sign B = sign
{U’(3- p3) - U’(0)} < 0, a contradiction (unless p3 = 3).

23
The budget constraint always binds under perfect competition, so we can
eliminate β and combine the FOC to obtain equation (2):
(2) U’(b)/R = δU’(1- p1) - IU’(3-p1)2/T + B2/T= δ U’(3- p3){1 + I2/Tδ}.

24
References
Armour, John and Douglas Cumming (2005). “Bankruptcy Law and Entrepreneurship,” ESRC Centre for Business Research, University of Cambridge, Working Paper No. 300.
Ausubel, Lawrence, (1991) “The Failure of Competition in the Credit Card Market,” American Economic Review, Vol. 81, No. 1, pp. 50-81.
Athreya, Kartik B. (2002). “Welfare implications of the Bankruptcy Reform Act of 1999,” Journal of Monetary Economics, 49: 1567-1595.
Berkowitz, Jeremy and Michelle J. White (2004). “Bankruptcy and Small Firm’s Access to Credit,” RAND Journal of Economics, Vol. 35, No. 1, Spring 2004, pp. 69-84.
Calem, Paul S., and Loretta J. Mester, “Consumer Behavior and the Stickness of Credit-Card Interest Rates,” American Economic Review, Vol. 85, No. 5 (Dec., 1995). pp. 1327-1336
Calem, Paul S., Gordy, Michael B., and Loretta J. Mester (2006). “Switching Costs and Adverse Selection in the Market for Credit Cards: New Evidence,” Journal of Banking and Finance.
Chan, Sewell (2006). “An Outcry Rises as Debt Collectors Play Rough,” New York Times, July 5, p.1.
Chatterjee, Satyajit, Dean Corbae, Makoto Nakajima, and Jose-Victor Rios-Rull (2005). “A Quantitative Theory of Unsecured Consumer Credit with Risk of Default,” Federal Reserve Bank of Philadelphia, Working Paper No. 05-18.
Davenport, Todd (2005). “Reconsidering the ‘Win’ on Bankruptcy Reform,” The American Banker, December 19, p. 1.
DeLaney, Steven, (2005). “Bankruptcy Reform-A Win-Win for Consumers and Creditors—Sorry Lawyers!” Ryan Beck & Co. Report, April 12
Dick, Astrid and Andreas Lehnert (2006). “Personal Bankruptcy and Credit Market Competition,” working paper.
Domowitz, Ian and Robert Sartain, “Determinants of the Consumer Bankruptcy Decision,” Journal of Finance, Vol. LIV, No. 1, February, p. 403-420.
Dyjankov, Simeon, McLiesh, C., and Schliefer, A. “Private Credit in 129 Countries,” NBER Working Paper 11078, January 2005.
Edminston, Kelly (2006) “A New Perspective on Rising Non-Business Bankruptcy Filing Rates: Analyzing The Regional Factors,” Federal Reserve Bank of Kansas City Economic Review, Second Quarter, V. 91, No. 2, p. 55-83.
Elul, Ronel and Narayanan Subramanian (2002). “Forum-Shopping and Personal Bankruptcy,” Journal of Financial Services Research, 21:3 pp. 233-255.

25
Franks, Julian, and Oren Sussman (2005). “Financial Innovation and Corporate Bankruptcy,” Journal of Financial Intermediation, Vol. 14, No. 3, pp. 283-317.
Fan, W. and M.J. White (2003). “Personal Bankruptcy and the Level of Entrepreneurial Activity,” Journal of Law and Economics, 46: 543-567.
Fay, S., E. Hurst and M.J. White (2002). “The Household Bankruptcy Decision,” American Economic Review, 92: 706-718.
Gan, Li and Tarun Sabarwal (2005), “A Simple Test of Adverse Events and Strategic Timing Theories of Consumer Bankruptcy,” National Bureau of Economic Research Working Paper 11763.
Gropp, R., J.K. Scholz, and M.J. White (1997). “Personal Bankruptcy and Credit Supply and Demand,” Quarterly Journal of Economics, 112: 217-251.
Gross, David B and Nickolas S. Souleles (2004) “An Empirical Analysis of Personal Bankruptcy and Delinquency, “The Review of Financial Studies, Spring 2002, Vol. 15, No. 1, pp. 319-347.
Han, Song and Wenli Li (2004). "Fresh start or head start? The effect of filing for personal bankruptcy on the labor supply," Finance and Economics Discussion Series 2004-28, Board of Governors of the Federal Reserve System (U.S.).
Himmelstein, David, Elizabeth Warren, Deborah Thorne, and Steffie Woolhandler (2005) “Illness and Injury as Contributors to Bankruptcy,” Health Affairs, web exclusive, February 2.
Knittel, Christopher R. and Victor Stango (2003). Price Ceiling as Focal Points for Tacit Collusion: Evidence from the Credit Card Market.” American Economic Review, 93: 1703-1729.
Kratz, Ellen Florian. “Profiting from the Bankruptcy Bill,” Fortune, May 2, 2005.
Krugman, Paul (2005). “The Debt-Peonage Society,” New York Times, March 8, p.23
Li, Wenli and Pierre-Daniel Sarte (2006). “U.S. consumer bankruptcy choice: The importance of general equilibrium effects,” Journal of Monetary Economics, Vol. 53, Issue 3, pp. 613-631.
Lin, E.Y. and M.J. White (2001) “Bankruptcy and the Market for Mortgage and Home Improvement Loans,” Journal of Urban Economics, 50: 138-162.
Livshits, Igor, James MacGee and Michèle Tertilt (2006). “Consumer Bankruptcy: A Fresh Start,” The American Economic Review (forthcoming)
Mester, Loretta (2002). “Is the Personal Bankruptcy System Bankrupt,” Federal Reserve Bank of Philadelphia Business Review, Q1, 2002, pp. 31 -44
Myerson, R. 1979. “Incentive-compatibility and the bargaining problem.” Econometrica 47, 61–73.
26
Nader, Fouad H., (2005). “The Credit Card Industry,” Background Paper No. 15, August 25, Pitney Bowes.
Nunez Stephen, and Howard Rosenthal (2006). “Bankruptcy ‘Reform’ in Congress: Creditors, Committees, Ideology, and Floor Voting in the Legislative Process,” The Journal of Law, Economics, and Organization, Vol. 20, No. 2, p 527-557.
Skeel, David A. (2001). Debt’s Dominion. Princeton: Princeton University Press, 2001.
White, M. J. (1998). “Why Don’t More Households File For Bankruptcy?” Journal of Law, Economics, and Organization, Vol. 14:2, pp. 205-231, October.
White, M.J. (Forthcoming). “Abuse or Protection: Economics of Bankruptcy Reform under BAPCPA,” University of Illinois Law Review.
Townsend, Robert (1979) “Optimal Contracts and Competitive Contracts with Costly State Verification,” Journal of Economic Theory, 21, 265-93.
Zywicki, Todd J. (2005) “An Economic Analysis of the Consumer Bankruptcy Crises,” Northwestern University Law Review, Vol. 99, No. 4.

Chart 1: The Rush to File Before BAPCPA Took Effect in October, 2005Plotted are number of filings per week each year.
Source: NBKRC (National Bankruptcy Research Council) and Lundquist Consulting
0
20,000
40,000
60,000
80,000
100,000
120,000
140,000
160,000
180,000
200,000
220,000
240,000
260,000
280,000
300,000
320,000
1 3 5 7 9 11 13 15 17 19 21 23 25 27 29 31 33 35 37 39 41 43 45 47 49 51
20022003200420052006

Chart 2: Annual Bankruptcy Filings (non-business) Per 1000 Households
0
2
4
6
8
10
12
14
16
18
20
1947 1952 1957 1962 1967 1972 1977 1982 1987 1992 1997 2002
Per 1
000
Hou
seho
lds
Sources: Administrative Office of the U.S. Courts; American Bankruptcy Institute. Years measured July-June over 1947-1985 and January-December post 1985. Bankruptcy filings not available in 1949 and 1955.
BRA 1978
BAPCPA

Chart 3: Bankruptcy Filing Rates by County (top) and Casino Locations (bottom)
Source: Edmiston (2006)
Source: Edmiston (2006)

Statistics calculated over 50 States and Washington D.C .Variable Definition (units) Mean Std. Dev. Min MaxRUSH Change in Chapter 7 filings between 2005:Q4 and 2005:Q3 (%) 32.17 17.36 -5.9 104.1EXEMPTION State homestead exemption ($1000) 78.63 83.82 0 463.1UNLIMITED EXEMPTION Indicator = 1 if no limit on homestead exemption (0 if limited) 0.12 0.33 0 1FICO_2004 Average FICO (Fair Issacs) credit score in state 683.14 14.48 651 710INCOME_2003 Median income in state (nominal $1000) 63.50 10.33 45.9 87.4INCOME GROWTH_2005 Growth in state personal income over 2005 (%) 4.63 2.25 -9.1 7.5POVERTY RATE_2003 Percent of state households with income below poverty level 9.51 3.13 5.1 18.5UNINSURED RATE_2004 Percent of state residents without health insurance 14.44 3.33 8.9 25.0ABORTION RATE_2000 Abortions per 1000 women aged 15-44 17.44 11.31 0.9 68.1PREMATURE_2004 Underweight births (percent of all state births) 8.08 1.31 6.0 11.6FILINGS_2005:Q3 Chapter 7 filings per 1000 persons in 2005:Q3 1.48 0.53 0.4 2.8SELF EMPLOYED_2003 Self employed persons per capita in 2003 0.065 0.009 0.048 0.091
Table 1: Variable Definitions and Summary Statistics
Sources: RUSH calculated by authors. Exemptions are from Gropp et al. Other variables are from Statistical Abstract of the United States

LOW FICO HIGH FICO (1) (2) (3) (4)
EXEMPTION 0.011 2.181** 0.092 -0.021(0.033) (0.880) (0.064) (0.028)
UNLIMITED EXEMPTION 0.374 782.655*** 23.323** -23.730*(6.956) (232.168) (8.561) (12.804)
FICO_2004 -0.075 0.576* 0.350 -0.403(0.277) (0.299) (0.505) (0.559)
EXEMPTION*FICO_2004 -0.003**(0.001)
UNLIMITED*FICO_2004 -1.146***(0.340)
INCOME_2003 1.150*** 1.058** 2.312** 0.331(0.402) (0.418) (0.913) (0.354)
INCOME GROWTH_2005 0.016 -0.529 -0.517 -0.307(1.194) (1.165) (0.968) (1.461)
POVERTY_2003 4.125* 4.205* 7.357** -0.070(2.334) (2.461) (2.899) (2.063)
FILINGS_2004:Q3 -1.246 -1.495 4.478 -10.294(4.808) (4.415) (5.323) (11.038)
CONSTANT -28.197 -465.701** -433.723 307.207(212.990) (221.755) (361.898) (385.437)
Observations 51 51 25 26R-squared 0.30 0.41 0.57 0.49* significant at 10%; ** significant at 5%; *** significant at 1%
Table 2: Higher Rush to File in High Exemption States Reported are regression coefficients (standard errors). Dependent variable is the percent change in Chapter 7 filings per household between 2005:Q3 and 2005:Q4. Coefficients estimated over 50
FULLstates and Washington, D.C. Low FICO and High FICO divided at median (684).
FULL LOW FICO HIGH FICO FULL LOW FICO HIGH FICO(1) (2) (3) (4) (5) (6)
EXEMPTION 1.982*** 0.073 -0.012 1.943*** 0.064 -0.007(0.535) (0.045) (0.034) (0.532) (0.037) (0.031)
UNLIMITED EXEMPTION 924.265*** 18.998* -29.333* 908.988*** 19.627** -26.598*(195.005) (8.920) (14.829) (189.960) (7.792) (13.749)
FICO_2004 0.634** 0.058 0.409 0.717*** 0.317 0.354(0.239) (0.944) (0.578) (0.263) (0.894) (0.562)
EXEMPTION*FICO_2004 -0.003*** -0.003***(0.001) (0.001)
UNLIMITED*FICO_2004 -1.354*** -1.330***(0.284) (0.276)
INCOME_2003 0.056 1.408 -0.305 0.016 1.587** -0.266(0.393) (0.805) (0.614) (0.390) (0.677) (0.597)
INCOME GROWTH_2005 -1.342** -1.110* -2.099 -1.138* -0.866 -1.802(0.553) (0.615) (1.414) (0.596) (0.576) (1.628)
POVERTY_2003 0.447 4.37 -2.179 0.089 3.495 -1.675(1.347) (2.569) (3.427) (1.354) (2.268) (3.066)
UNINSURED_2004 -0.605 -0.709 -0.126 -0.112 1.253 0.273(0.736) (2.205) (1.163) (0.762) (2.400) (1.068)
ABORTION_2000 0.801*** 0.650* 0.653 0.792*** 0.716** 0.494(0.281) (0.328) (0.537) (0.277) (0.269) (0.420)
PREMATURE_2004 5.024** 2.37 7.517** 5.737*** 5.013 7.866**(1.987) (3.728) (3.370) (1.838) (3.755) (3.339)
SELF EMPLOYED_2003 -321.072 -1,008.128** -259.956(226.441) (432.029) (323.774)
FILINGS_2005:Q3 2.796 7.582 -2.077 2.495 9.369* -5.364(3.802) (5.071) (6.915) (3.825) (4.659) (8.489)
CONSTANT -455.878*** -172.145 -265.782 -499.273*** -341.3 -219.633(160.177) (646.577) (367.337) (173.607) (602.773) (372.634)
Observations 51 25 26 51 25 26R-squared 0.63 0.71 0.61 0.65 0.79 0.63* significant at 10%; ** significant at 5%; *** significant at 1%
Table 3: Other Determinants of the Rush to File OLS regression coefficients (robust standard errors). Dependent variable is the percent change in Chapter 7 filings per household between 2005:Q3 and 2005:Q4. Coefficients estimated over 50 states and Washington, D.C. Low FICO and High FICO states divided at median (684).

Table 4: Cumulative Abnormal Returns on Stocks of Banks and Debt Collectors As BAPCPA Passes Through CongressReported around cumulative abnormal returns over various windows (in days) around each event
Date Event (-1/5) (-1/3) (-1/0 ) (-1/5) (-1/3) (-1/0 )1/24/2006 News Bill Will Be Introduced 0.37 * 0.36 ** 0.12 *** -0.60 -2.18 ** -3.29 ***2/1/2006 Introduced In Senate 0.38 * 0.35 * 0.47 *** 4.12 *** 3.59 *** 2.70 ***2/17/2006 Passes Senate Judiciary Comm. -0.37 ** -0.26 ** 0.06 -1.14 -2.45 *** -2.96 ***3/10/2006 Passes Senate 0.65 *** 0.43 *** -0.01 3.53 ** 0.94 0.444/14/2006 Passes House 0.80 *** 0.02 -0.28 *** 5.67 *** 1.94 *** 1.31 ***4/20/2006 Signed By President -0.32 * -0.04 -0.07 5.49 *** 6.43 *** 1.36 ***
Total effect 1.51 0.86 0.28 17.08 ** 8.26 0.45Trading days = 82R-sq 0.31 0.24 0.12 0.34 0.3 0.12* significant at 10%; ** significant at 5%; *** significant at 1%.
Banks Debt CollectorsWindow: Window:

Table 5A: Regression Model Relating Bank CAR to Bank Portfolio Shares Dependent variable = CAR (%) from (-1/3) event window. Statistically significant results (5 percent or lower) in bold.
With MBNA
Without MBNA
With MBNA
Without MBNA
Assets (logs) -0.768 *** -0.970 *** -0.895 *** -0.864 ***Credit card loan share -58.434 *** 75.287 **Positive credit card loans (=1) -0.110 -0.211Real estate loan share 2.905 3.142 4.015 2.800Non-performing credit card loan share 3.184 3.306 2.070 2.472Non-performing real estate loan share -38.444 -44.350 -40.094 -41.127Constant 9.603 ** 12.158 *** 10.769 *** 11.062 ***N 409 408 409 408R-sq 0.09 0.07 0.07 0.06
Table 5B: Regression Variable Summary Statistics Variable Mean Std. Dev.CAR (%) -0.362 6.882Assets (logs 14.301 1.618Credit card l 0.003 0.018Real estate l 0.498 0.150Non-perform 0.005 0.024Non-perform 0.007 0.011State homes 53727 63446Zero credit c 0.582 0.494N = 409

Table 6: Impact of Means Test on Household Welfare: Summary of Simulation Studies study markets reform simulated market impact change in welfare
Chatterjee et al. (2002) credit means test interest rate ↓ ↑borrowing ↑
Arthreya (2002) credit means test interest rate ↓ ↑borrowing ↑
Livshits et al. (2006) credit no discharge interest rate ↓ marginally ↓borrowing ↑
Li and Sartre (2006) credit means test interest rate ↓ unchanged or ↓labor borrowing ↑
capital labor ↓capital ↓
lower asset exemption interest rate ↑ ↑borrowing ↓
labor ↑capital ↑

Chart 4: Credit Card Chargeoffs Have Fallen, But Spreads Remain HighPlotted is speads on credit card asset backed securities (top line) and chargeoffs on same (bottom line)
2.00
4.00
6.00
8.00
10.00
12.00
14.00
16.00
May-04 Aug-04 Nov-04 Feb-05 May-05 Aug-05 Nov-05 Feb-06 May-06
Per
cent
of P
ortfo
lio P
ar
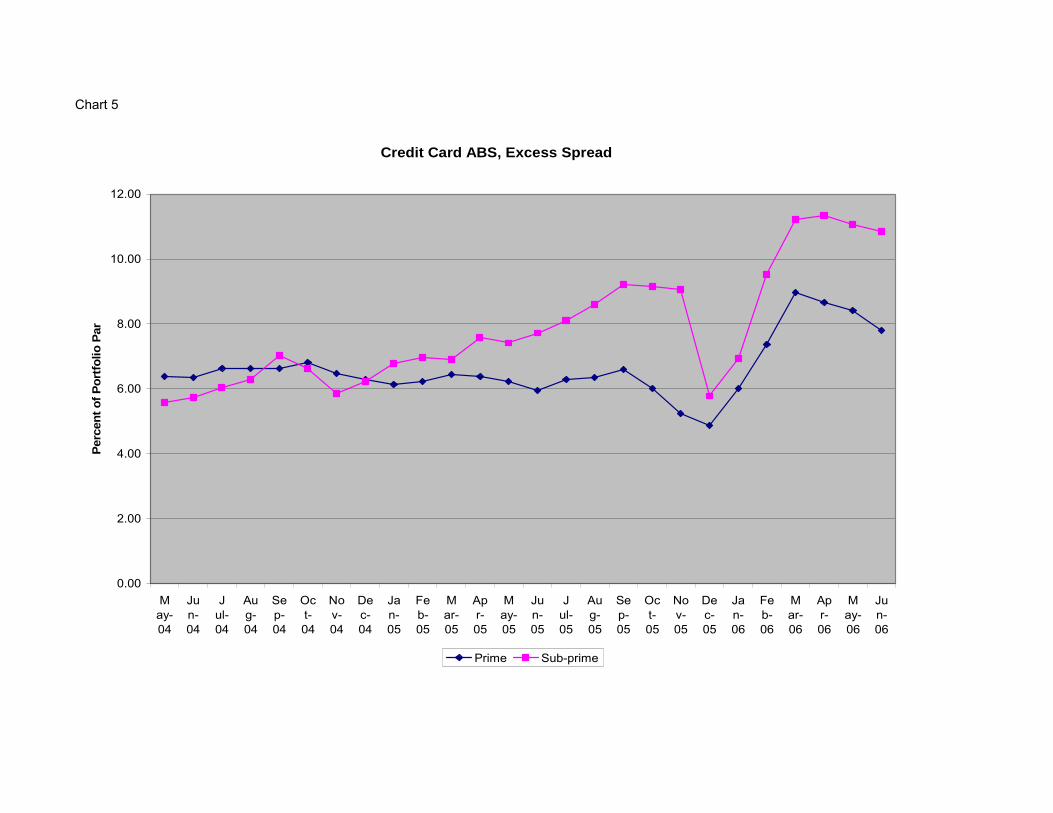
Chart 5
Credit Card ABS, Excess Spread
0.00
2.00
4.00
6.00
8.00
10.00
12.00
May-04
Jun-04
Jul-04
Aug-04
Sep-04
Oct-04
Nov-04
Dec-04
Jan-05
Feb-05
Mar-05
Apr-05
May-05
Jun-05
Jul-05
Aug-05
Sep-05
Oct-05
Nov-05
Dec-05
Jan-06
Feb-06
Mar-06
Apr-06
May-06
Jun-06
Perc
ent o
f Por
tfolio
Par
Prime Sub-prime

Chart 6: Credit Card Spreads Rise and Fall with Credit Card Chargeoffs (xoffs)
2006q1
05
1015
Per
cent
age
Poi
nts
1985q1 1990q1 1995q1 2000q1 2005q1Date
spread xoffs
Source: Federal Reserve Statistical Release G.19, Consumer CreditData are quartely, not seasonally adjusted, annual percentage rates (APR) Regulation Z. Credit Card rate before November 1994 is the stated APR averaged across all credit card accounts at all reporting banks. Thereafter, the rate represents the rate only on accounts assessed interest, which is the annualized ratio of total finance charges at all reporting banks to the total average daily balances against which the finance charges were assessed.

Chart 7: Lower Credit Card Chargeoffs Lead to Lower Credit Card Spreads Plotted is each panel is response of second variable listed to impulse in first variable.Responses estimated from VAR (vector autoregression) comprising Treasury Bill rate (6 month), credit card spread (APR - T bill rate), and credit card chargeoff (xoff) rate.VAR estimated over 1985:Q1 - 2005:Q4Shaded areas represent 95% confidence interval. Lower left panel shows that one standarddeviation shock to XOFFS (about 50 basis points) leads to decline in SPREAD of about 25 basis.