Embed Size (px)
Citation preview
WP/08/215
Banking Structure and Credit Growth in Central and Eastern European Countries
Burcu Aydın

© 2008 International Monetary Fund WP/08/215 IMF Working Paper IMF Institute
Banking Structure and Credit Growth in Central and Eastern European Countries
Prepared by Burcu Aydın1
Authorized for distribution by Enrica Detragiache
September 2008
Abstract
This Working Paper should not be reported as representing the views of the IMF. The views expressed in this Working Paper are those of the author(s) and do not necessarily represent those of the IMF or IMF policy. Working Papers describe research in progress by the author(s) and are published to elicit comments and to further debate.
Recent developments have increased questions about vulnerabilities in Central and Eastern European Countries (CEE) that are experiencing credit booms. This paper analyzes the role of foreign-owned banks in these credit booms. The results show that the CEE countries depend on foreign banks, and these foreign banks depend on interbank funding. Lending by foreign banks seems driven by economic growth and interest rate margins. This lending appears independent of economic but not financial conditions in the foreign bank’s home country. JEL Classification Numbers: C23, G21, G32
Keywords: Credit Growth, CEE, Foreign Banks, Parent Banks, Panel Data
Author’s E-Mail Address: [email protected]
1 I would like to thank Robert Dekle, John Ham, Cheng Hsiao, Selahattin Imrohoroglu and Enrica Detragiache; and I am greatly indebted to Wim Fonteyne. Also, I would like to thank the seminar participants at the International Monetary Fund and the University of Southern California. Last, I would like to thank to Nada Choueiri, Alexander Hoffmaister, Tonny Lybek and Sònia Muñoz for their valuable comments.

2
Contents
I. Introduction ........................................................................................................................... 4 II. The Impact of Foreign Bank Ownership.............................................................................. 6
A. Introduction...................................................................................................................... 6 B. Data .................................................................................................................................. 8 C. Methodology .................................................................................................................... 9 D. Concerns about Multicollinearity................................................................................... 11 E. Results ............................................................................................................................ 11 F. Robustness: Impact of Real Exchange Rate Jumps on the Value of Credit Growth...... 14 G. Robustness: Concerns about Endogeneity of the Foreign Ownership Variable ............ 14
III. The Role of Foreign Parent Banks.................................................................................... 16
A. Introduction.................................................................................................................... 16 B. Data for Foreign Owned CEE Banks ............................................................................. 17 C. Empirical Model............................................................................................................. 17 D. Results............................................................................................................................ 18 E. Robustness: Do Parent Banks Have Different Managerial Strategies?.......................... 20
IV. Conclusion ........................................................................................................................ 21 Appendix................................................................................................................................. 23
A. Data Sources .................................................................................................................. 23 B. Data Analysis ................................................................................................................. 24
Summary Statistics for CEE Banks ................................................................................ 24 Summary Statistics for CEE Subsidiaries and their Parent Banks ................................. 25
References............................................................................................................................... 27

3
Figures Figure 1: Ownership Structure by Regions............................................................................... 7 Figure 2: Credit Growth across Bank Ownership Types in the CEE Countries..................... 43
Tables Table 1: Market Share of Assets of Foreign-Owned Banks in the CEE Countries .................. 5 Table 2: Coverage of Dataset as a Percent of Total Banking Assets of each CEE Country .. 23 Table 3: Determinants of Bank Credit Growth in the CEE countries..................................... 32 Table 4: Determinants of Bank Credit Growth in the CEE countries..................................... 33 Table 5: Replicate of Table 3, Inflation Adjusted Credit Growth as the Dependent Variable34 Table 6: Replicate of Table 4, Inflation Adjusted Credit Growth as the Dependent Variable35 Table 7: Panel Data Probit Estimation Results for Foreign Ownership Variable................... 36 Table 8: Hausman Specification Test for Foreign Ownership Dummy ................................. 37 Table 9: List of Parent Banks and their Affiliated Companies............................................... 38 Table 10: Determinants of Bank Credit Growth in the Foreign-Owned CEE Subsidiaries ... 40 Table 11: Determinants of Bank Credit Growth in the Foreign-Owned CEE Subsidiaries ... 41 Table 12: FE Regression Results for Cross-Sectional Varying Coefficients ......................... 42 Table 13: Test of Different Coefficient Estimates across Affiliated Banks ........................... 43 Table 14: Summary Statistics for the CEE Countries............................................................. 44 Table 15: Summary Statistics for Parent Banks and their CEE Subsidiaries ......................... 44

4
I. INTRODUCTION
Since the 1990s, domestic credit as a share of GDP has been on a steep upward path
in the Central and Eastern European (CEE) countries2. This has been accompanied by many positive developments, including solid economic growth that brought incomes closer to western European levels and financial integration with more developed countries3. This paper studies credit growth in the CEE countries from two perspectives. First, it investigates the role of foreign-owned banks. Banks dominate the financial systems of the CEE countries, and most of these banks are foreign-owned4. Credit provision therefore depends in large part on the behavior of these foreign-owned banks. To the extent that they behave differently than domestically-owned banks, they could have a particular impact on the nature and risks of credit dynamics. Second, the paper investigates to what extent the behavior of foreign-owned banks in the CEE countries depends on developments affecting their parent banks.
The literature points out various advantages of foreign bank ownership. First, foreign
banks can increase the availability of credit to the private sector in financially underdeveloped markets. Because foreign banks can also borrow from their parent banks -a majority of foreign banks is owned by large multinational banks- and/or from other banks -by relying on the reputation of its parent bank. In this strand of the literature, De Haas and Lelyveld (2002) study foreign bank ownership in five Central European economies, and conclude that there is a positive relationship between foreign banks and private sector credit growth. Clarke et al (2003) show that foreign banks are not restricted by domestic market conditions, and this allows them to increase their lending much faster than the domestic banks. Detragiache and Gupta (2006) discuss that the relative ease of raising funds from international markets would allow foreign banks to sustain credit growth during a period of financial distress. Lensink and Hermes (2004) show that foreign banks increase competition in CEE banking systems, thus causing an outward shift in the supply of credit. This shift in the supply of credit reduces the equilibrium spread between bank lending and borrowing rates and increases equilibrium borrowing in the country. Second, foreign banks bring financial know-how, technology, and networks into a country, thus improving the efficiency and quality of financial intermediation in general and of credit provision in particular5. Micco et al (2004) show that foreign bank entry to less developed markets is important in improving 2 Bulgaria, Czech Republic, Estonia, Hungary, Latvia, Lithuania, Poland, Romania, Slovakia and Slovenia.
3 Cottarelli et al (2003) estimate an equilibrium level of bank-credit-to-GDP ratio and find results supporting that the CEE countries are experiencing a convergence and financial deepening process.
4 Around 70 percent of the total CEE banking assets are controlled by foreigners by the 2000s (ECB, eurostat).
5 Banking system indicators, such as information technology, risk management and credit evaluation, improved in the CEE countries between 1990s and 2000s (ECB, 2005a) during the foreign acquisition of the CEE banks.

5
efficiency, and Bonin et al (2005) present evidence of foreign banks bringing know-how into the CEE countries. Third, foreign banks can smooth the negative effects of banking crises. For Malaysia, Detragiache and Gupta (2006) show that foreign banks –but only the foreign banks which are not focused in Asia- performed better during the Asian financial crises, in terms of profitability and loan quality; and they did not leave the country in the aftermath of the banking crisis.6
Nonetheless, the presence of foreign banks also comes with some potential
disadvantages and risks. First, foreign banks may engage in cream skimming, i.e. lend only to the most creditworthy and profitable (high-end) customers. This could render smaller domestic banks less profitable and more fragile, possibly driving them out of business. If so, [large] parts of the private sector may face reduced access to credit. Detragiache et al. (2006) study the impact of foreign banks operating in poor countries and show that a strong foreign bank existence may reduce credit growth and access to credit for the private sector. Second, foreign banks could cut back on lending due to exogenous developments at the parent bank/headquarters. Martinez-Peria et al. (2002) suggest that an economic downturn in the home market may cause a multinational bank to reduce its operations company wide. De Haas and Lelyveld (2003) analyze credit stability in Eastern Europe during business cycles, and show that foreign banks reduce credit in the host country when their home country is in an economic downturn. Third, foreign banks may contribute to a sudden stop (i.e., an abrupt end or reversal of capital inflows), and are more likely to leave a country altogether when the host market conditions are not very desirable. In this regard, Caballero (2002) shows that foreign banks in Chile shifted a significant portion of their portfolio towards foreign assets during the late 1990s Chilean credit crunch.
Table 1: Market Share of Assets of Foreign-Owned Banks in the CEE Countries
Foreign Branches and Subsidiaries % Market Share2000 2001 2002 2003 2004 2005
Slovenia n.a. 15.0 16.6 18.5 20.0 22.5Latvia n.a. 45.2 41.9 45.7 48.6 58.5Hungary n.a. 59.21 60.1 56.7 59.0 58.8Poland n.a. 68.9 67.3 67.7 67.7 67.1Lithuania n.a. 75.6 84.4 84.1 83.9 84.1Czech Republic n.a. 77.1 93.2 96.0 96.1 93.4Slovakia 85.0 92.4 95.6 96.3 96.7 99.5Estonia n.a. 97.9 97.4 97.4 98.1 99.2
Source: ECB
6 However, one should mention that after the Asian crisis, Malaysia put in place capital controls, which may have distorted the behavior of banks.
6
This paper tries to gain insights in the balance of these benefits, disadvantages and risks in the particular case(s) of the CEE countries, where foreign bank ownership became dominant by the 2000s (Table 1). The paper studies foreign banks in the context of the rapid credit growth that these countries have been experiencing. To do so, it conducts an empirical analysis using fixed effect panel estimation on data covering the period 1988-2005.
Section II analyzes differences in behavior between foreign and domestic banks in
terms of credit growth in the CEE countries. Four main results emerge. First, credit growth is higher in foreign than in domestic banks. However when separating domestic banks into private and state-owned banks, this result no longer holds, as private domestically-owned banks have even higher credit growth than foreign ones. Second, foreign-owned banks relied increasingly on interbank funding during the 2000s, while domestic sources (mainly customer deposits) lost importance over time. Third, as more banks entered into the CEE markets during the 2000s, interest margins declined and credit supply increased, which reduced the cost of borrowing and increased equilibrium credit in the CEE economies. Fourth, high economic growth and relatively high CEE interest rates, much higher than the euro-area rates, are the driving forces behind lending by foreign banks in the CEE markets.
Section III analyzes linkages between the behavior of foreign-owned banks in the
CEE countries and developments at their parent banks. Three major results emerge from the analysis in this section. First, there is no significant difference across parent banks in terms of their impact on the growth of credit in their CEE subsidiaries. Second, in terms of foreign parent banks’ characteristics, the results show that the size and profitability of the parent bank affect positively, but increasing cost structure of the parent affects negatively, the amount of credit supplied by the CEE subsidiary. Third, the results show that economic growth in the CEE markets is an important driver of credit growth, whereas growth in the home market plays no role. However, declining interest margins in the home market are a motivation for the parent banks to increase credit in the CEE countries. The remainder of the paper is composed into three sections. Section II provides the analysis on the determinents of credit growth by considering the variations across bank ownership types. Then, section III presents the analysis for the determinents of credit growth for foreign banks operating in the CEE countries by considering differences across their parent banks. Last, section IV concludes and provides a discussion on the policy implications of this paper.
II. THE IMPACT OF FOREIGN BANK OWNERSHIP
A. Introduction
The banking sector is the main source of credit growth in the CEE countries, and foreign-owned banks constitute a majority in the CEE banking system (Figure 1). Therefore

7
any indicator that affects the credit distribution of foreign banks will also affect the credit growth in the CEE economies. Given this background, this section analyzes the extent that foreign-owned banks are different from the domestically-owned banks in terms of a bank’s motivation to fund and to increase its lending.
Figure 1: Ownership Structure by Regions
7
7 The drop in the number of banks in year 2005 is due to the lag of reporting to the BankScope database.

8
This section, in particular, tests four main hypotheses. First, credit grows more
rapidly in foreign-owned banks. Second, foreign banks increase their lending through borrowing from other banks, in other words, they are not restricted by domestic market funding. Third, foreign bank entry reduces the cost of borrowing through increased competition. Fourth, economic growth and high interest rates are the two main motivations for foreign banks to operate in the CEE markets.
In testing these hypotheses, this paper uses a panel data set, described in the next
section, Data; and uses a fixed-effect estimation method which is described under Methodology. Results from the panel data estimation are provided following methodology; and robustness of these results in terms of exogeneity of the explanatory variables and use of real credit growth are discussed last.
B. Data
The analysis in this section uses an unbalanced panel dataset covering 18 years from 1988 to 2005, comprised of bank level data for the 72 largest banks of the ten CEE countries and their macroeconomic data8. Appendix, A. Data Sources provides the data bases used for the micro-and-macroeconomic variables, and it also provides the details for the set up of the foreign ownership dummy.
The dependent variable in this analysis is the bank-level credit growth, and this
analysis seeks to find its determinants through various bank-level and macroeconomic variables. Definitions and characteristics of these variables are explained under Appendix B, Data Analysis, Summary Statistics for CEE Banks.
During the 1990s, inflation was a major issue in most of the CEE countries. To
reduce the impact of inflation, and also to express all variables in the same unit, all bank-level and macroeconomic variables are converted into millions of euro9. Further, bank-level variables are then transformed into ratios, and macroeconomic variables are used either in ratios or in real terms. Nevertheless, in order to eliminate the impact of any large fluctuations in the macroeconomic variables during the 1990s, the econometric analysis is also applied separately for the 1990s and the 2000s.
8 The banks in the sample account for at least 60 percent of the total banking assets in any of the countries. A more precise distribution of the coverage is provided in Table 2, in Appendix A.
9 Results of this section are also reproduced by generating the dependent variable from inflation adjusted data in case of overestimation errors due to possible jumps in the real exchange rate. This reproduction is provided in this section, in part F. Results show that the coefficient estimates and the standard errors are robust for dependent variable generated from exchange rate adjusted data.
9
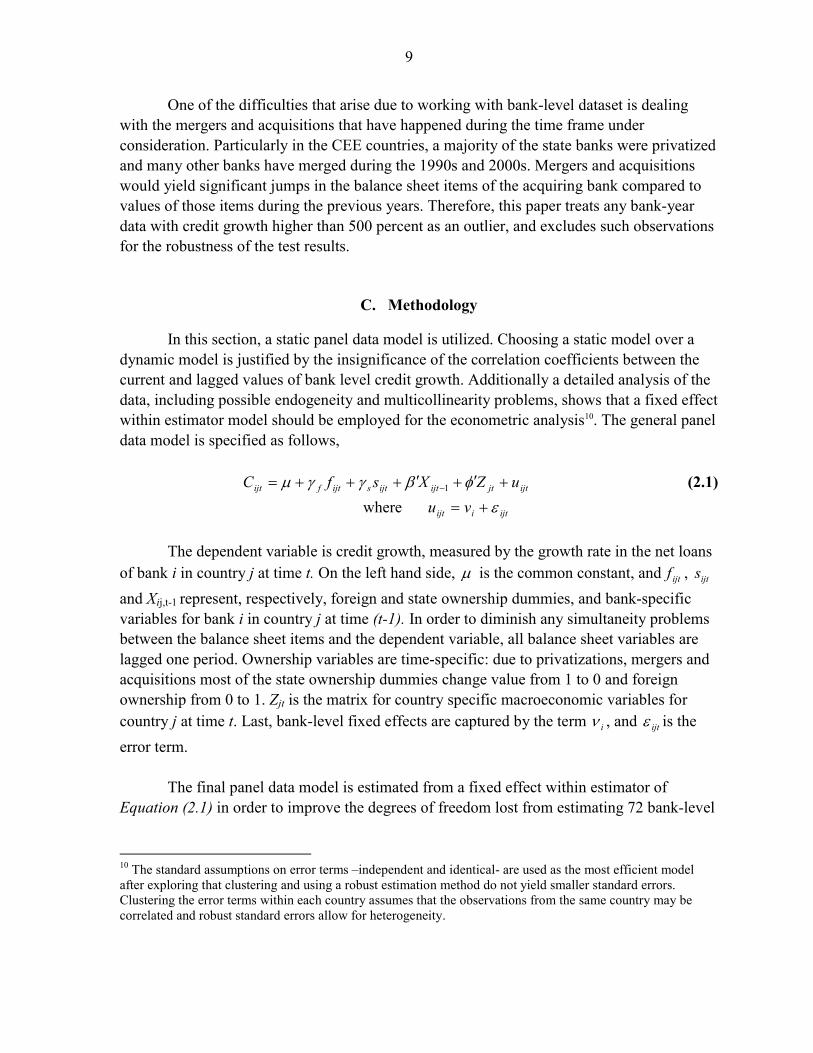
One of the difficulties that arise due to working with bank-level dataset is dealing with the mergers and acquisitions that have happened during the time frame under consideration. Particularly in the CEE countries, a majority of the state banks were privatized and many other banks have merged during the 1990s and 2000s. Mergers and acquisitions would yield significant jumps in the balance sheet items of the acquiring bank compared to values of those items during the previous years. Therefore, this paper treats any bank-year data with credit growth higher than 500 percent as an outlier, and excludes such observations for the robustness of the test results.
C. Methodology
In this section, a static panel data model is utilized. Choosing a static model over a dynamic model is justified by the insignificance of the correlation coefficients between the current and lagged values of bank level credit growth. Additionally a detailed analysis of the data, including possible endogeneity and multicollinearity problems, shows that a fixed effect within estimator model should be employed for the econometric analysis10. The general panel data model is specified as follows,
ijtjtijtijtsijtfijt uZXsfC +′+′+++= − φβγγμ 1 (2.1)
where ijtiijt vu ε+= The dependent variable is credit growth, measured by the growth rate in the net loans
of bank i in country j at time t. On the left hand side, μ is the common constant, and ijtf , ijts and Xij,t-1 represent, respectively, foreign and state ownership dummies, and bank-specific variables for bank i in country j at time (t-1). In order to diminish any simultaneity problems between the balance sheet items and the dependent variable, all balance sheet variables are lagged one period. Ownership variables are time-specific: due to privatizations, mergers and acquisitions most of the state ownership dummies change value from 1 to 0 and foreign ownership from 0 to 1. Zjt is the matrix for country specific macroeconomic variables for country j at time t. Last, bank-level fixed effects are captured by the term iν , and ijtε is the error term.
The final panel data model is estimated from a fixed effect within estimator of
Equation (2.1) in order to improve the degrees of freedom lost from estimating 72 bank-level
10 The standard assumptions on error terms –independent and identical- are used as the most efficient model after exploring that clustering and using a robust estimation method do not yield smaller standard errors. Clustering the error terms within each country assumes that the observations from the same country may be correlated and robust standard errors allow for heterogeneity.

10
fixed effect coefficients. The fixed effect within estimator is achieved by subtracting
)( CC ij − from both sides, where ∑=
=iT
t i
ijtij
TC
C1
and ∑=
=iN
i
ij
NCC
1
.
In order to control for any unspecified macro effect, time-specific-country dummies
are also introduced as a substitute for Zjt. Because the macroeconomic variables are collinear with the time-specific country dummies, in order to observe the coefficient of the macroeconomic variables, time-specific-country dummies are introduced separately. The introduction of these dummy variables controls the impact of a year-specific macroeconomic shock that is peculiar to each CEE country11. Equation (2.1s) below provides this substitute equation, where djt denotes the matrix for the time-specific-country dummies:
ijtjtijtijtsijtfijt udXsfC +′+′+++= − φβγγμ ~1 (2.1s)
Last, Equation (2.1) is modified into Equation (2.2), in order to allow the interaction
of the foreign and state ownership dummies with bank-specific and macroeconomic variables. Then, Equation (2.2) is expressed in terms of fixed effect within estimator as aforementioned in this section.
[ ] [ ]+′+′+′+++= −−− 111 ijtijtsijtijtfijtijtsijtfijt XsXfXsfC βββγγμ
[ ] [ ] ijtjtijtjtijtfjt uZssZfZ +′+′+′+ φφφ (2.2) The 1990s have a different structure than the 2000s for the CEE countries. The 1990s
was a period of transition and turbulence for the CEE countries. During the first half of this period, the CEE banks had the transition from centrally planned to market economies. During the second half of the 1990s, there was still turbulence due to the impact of the banking crises and the recapitalization programs. On the other hand, the 2000s was a period of robust economic growth and rapid financial integration, and the CEE banks were more mature in this period. The t-tests, performed for the mean comparison of variables for the 1990s and 2000s (see Appendix, B. Data Analysis, Summary Statistics for CEE Banks and Table 14), support the statistical evidence for the difference of these two samples. Additionally, the change in the sign and significance of the coefficients generated from the regression analysis from these two samples, 1990s and 2000s, shows that there is a structural break in the dataset. Therefore, the regression analysis is performed separately for the 1990s and 2000s due to this structural break.
11 Both Akaike and Bayesian information criteria indicate that the fixed effect estimation model is improved after the introduction of these time-specific-country dummies.

11
D. Concerns about Multicollinearity
A relevant issue in a multivariate regression analysis is the collinearity of regressors with each other. Most of the regressors are significantly correlated with each other, even though the correlation coefficients in most cases are small. However, the coefficients across similar measurement variables are large in magnitude, such as the variables for bank profitability and efficiency or macroeconomic variables. In order to eliminate any multicollinearity problem, the paper introduces highly and significantly correlated variables in separate regression equations.
E. Results
Foreign banks have higher credit growth than domestic banks; however state-owned banks are the underlying reason for this result. Figure 2 plots average credit growth across different ownership types in the CEE countries from 1992 to 2005. This figure shows that foreign banks have higher credit growth compared to domestically-owned banks for all the years except three: 1992, 2003, and 2004. Even though there is a significant correlation between credit growth and foreign bank ownership, the paper investigates whether this statement is valid across different domestic ownership types. After differentiating credit growth across domestically-owned banks, i.e.; between private and state-owned banks, the regression analysis shows that the coefficient for foreign ownership dummy is significant and negative for the second half of the dataset (See Table 3)12. This indicates that foreign banks had lower credit growth rates than the private domestically-owned banks during the 2000s. There are several explanations for this result. First, some of the private domestically-owned banks are part of a big conglomerate group. The affiliated companies have more incentive to
12 Since the paper uses fixed effect within estimation model, the coefficient estimates for the constant and the ownership dummies are inflated as they also reflect the impact of the bank-level fixed effects. Below, equation (2.1)* is a modification of equation (2.1) into a fixed effect within estimator representation, to show the impact of the bank-level fixed effects on the constant term.
++−′++−++−++=+− − )()()()()( 1 XXXsssfffCCC ijijtijijtsijijtfijijt βγγυμ
)()( 1 εεεφ +−++−′+ − ijijtjjt ZZZ (2.1)*
Where, ∑=
=Ti
t i
ijtij T
yy
1
and ∑∑==
=Ti
tijt
N
iy
Ny
11
1
In the equation above, μ is the coefficient for the private domestic bank and ν is the bank-level fixed effect. However, neither of these coefficients are unique, and therefore they are estimated jointly under the constant
term, *μ , where υμμ +=* .
12
raise their funding needs via the associated bank13. Second, private domestically-owned banks have longer-term relationships with the domestic companies, which puts them in a better position compared to the foreign-owned banks that were opened up as a greenfield investment. Third, foreign banks might engage in “cherry picking” behavior that is they lend only to the high-end customers and leave the more risky-smaller firms without funding. However, one should note that this is the least likely option, considering the high credit growth rates in the foreign-owned banks.
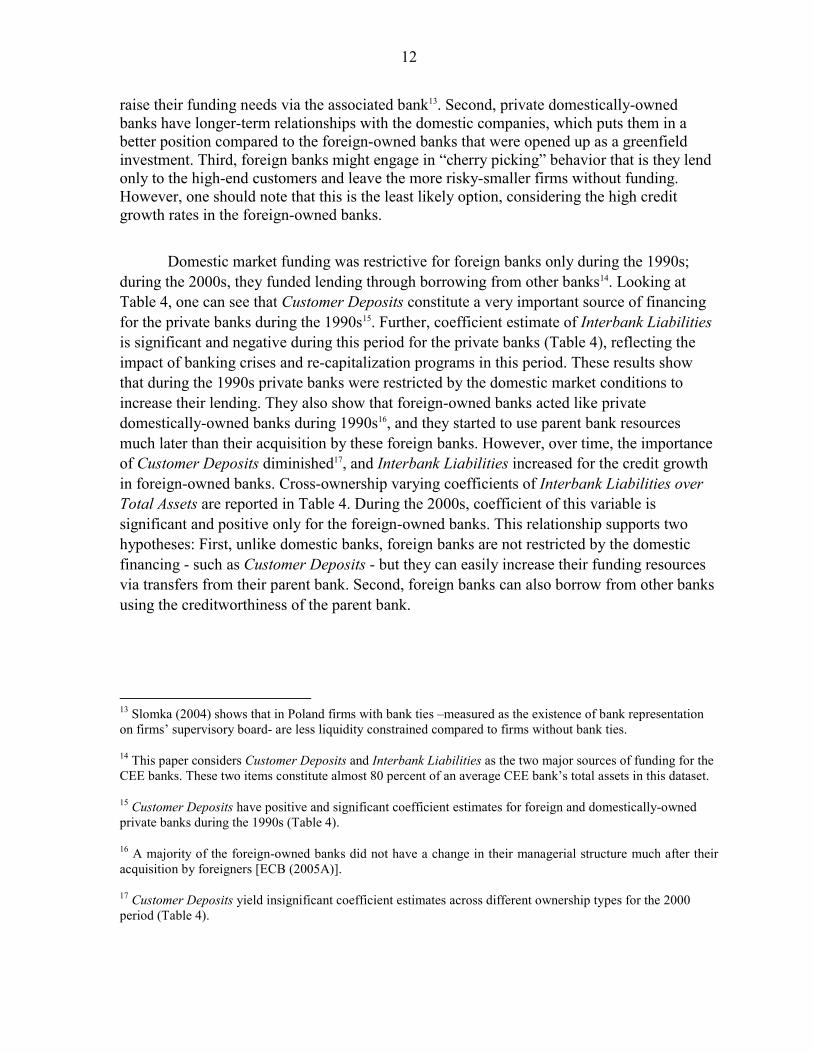
Domestic market funding was restrictive for foreign banks only during the 1990s;
during the 2000s, they funded lending through borrowing from other banks14. Looking at Table 4, one can see that Customer Deposits constitute a very important source of financing for the private banks during the 1990s15. Further, coefficient estimate of Interbank Liabilities is significant and negative during this period for the private banks (Table 4), reflecting the impact of banking crises and re-capitalization programs in this period. These results show that during the 1990s private banks were restricted by the domestic market conditions to increase their lending. They also show that foreign-owned banks acted like private domestically-owned banks during 1990s16, and they started to use parent bank resources much later than their acquisition by these foreign banks. However, over time, the importance of Customer Deposits diminished17, and Interbank Liabilities increased for the credit growth in foreign-owned banks. Cross-ownership varying coefficients of Interbank Liabilities over Total Assets are reported in Table 4. During the 2000s, coefficient of this variable is significant and positive only for the foreign-owned banks. This relationship supports two hypotheses: First, unlike domestic banks, foreign banks are not restricted by the domestic financing - such as Customer Deposits - but they can easily increase their funding resources via transfers from their parent bank. Second, foreign banks can also borrow from other banks using the creditworthiness of the parent bank.
13 Slomka (2004) shows that in Poland firms with bank ties –measured as the existence of bank representation on firms’ supervisory board- are less liquidity constrained compared to firms without bank ties.
14 This paper considers Customer Deposits and Interbank Liabilities as the two major sources of funding for the CEE banks. These two items constitute almost 80 percent of an average CEE bank’s total assets in this dataset.
15 Customer Deposits have positive and significant coefficient estimates for foreign and domestically-owned private banks during the 1990s (Table 4).
16 A majority of the foreign-owned banks did not have a change in their managerial structure much after their acquisition by foreigners [ECB (2005A)].
17 Customer Deposits yield insignificant coefficient estimates across different ownership types for the 2000 period (Table 4).
13
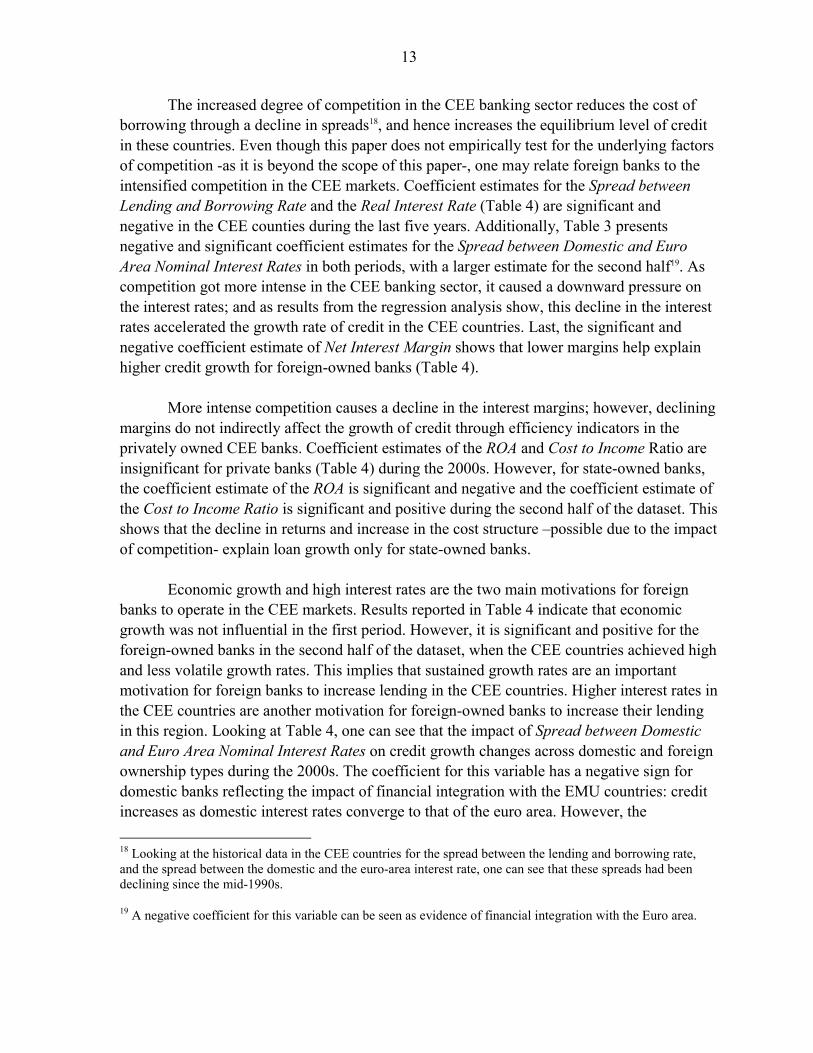
The increased degree of competition in the CEE banking sector reduces the cost of borrowing through a decline in spreads18, and hence increases the equilibrium level of credit in these countries. Even though this paper does not empirically test for the underlying factors of competition -as it is beyond the scope of this paper-, one may relate foreign banks to the intensified competition in the CEE markets. Coefficient estimates for the Spread between Lending and Borrowing Rate and the Real Interest Rate (Table 4) are significant and negative in the CEE counties during the last five years. Additionally, Table 3 presents negative and significant coefficient estimates for the Spread between Domestic and Euro Area Nominal Interest Rates in both periods, with a larger estimate for the second half19. As competition got more intense in the CEE banking sector, it caused a downward pressure on the interest rates; and as results from the regression analysis show, this decline in the interest rates accelerated the growth rate of credit in the CEE countries. Last, the significant and negative coefficient estimate of Net Interest Margin shows that lower margins help explain higher credit growth for foreign-owned banks (Table 4).
More intense competition causes a decline in the interest margins; however, declining
margins do not indirectly affect the growth of credit through efficiency indicators in the privately owned CEE banks. Coefficient estimates of the ROA and Cost to Income Ratio are insignificant for private banks (Table 4) during the 2000s. However, for state-owned banks, the coefficient estimate of the ROA is significant and negative and the coefficient estimate of the Cost to Income Ratio is significant and positive during the second half of the dataset. This shows that the decline in returns and increase in the cost structure –possible due to the impact of competition- explain loan growth only for state-owned banks.
Economic growth and high interest rates are the two main motivations for foreign banks to operate in the CEE markets. Results reported in Table 4 indicate that economic growth was not influential in the first period. However, it is significant and positive for the foreign-owned banks in the second half of the dataset, when the CEE countries achieved high and less volatile growth rates. This implies that sustained growth rates are an important motivation for foreign banks to increase lending in the CEE countries. Higher interest rates in the CEE countries are another motivation for foreign-owned banks to increase their lending in this region. Looking at Table 4, one can see that the impact of Spread between Domestic and Euro Area Nominal Interest Rates on credit growth changes across domestic and foreign ownership types during the 2000s. The coefficient for this variable has a negative sign for domestic banks reflecting the impact of financial integration with the EMU countries: credit increases as domestic interest rates converge to that of the euro area. However, the 18 Looking at the historical data in the CEE countries for the spread between the lending and borrowing rate, and the spread between the domestic and the euro-area interest rate, one can see that these spreads had been declining since the mid-1990s.
19 A negative coefficient for this variable can be seen as evidence of financial integration with the Euro area.

14
coefficient for Spread between Domestic and Euro Area Nominal Interest Rates has a positive sign for foreign banks indicating that foreign banks enter to the CEE markets for higher-than-home-market interest rates.
F. Robustness: Impact of Real Exchange Rate Jumps on the Value of Credit Growth
In this paper, one may question the soundness of the dependent variable. As mentioned under the data analysis, credit growth is calculated from the loan data which is converted into millions of euro. As the economic theory suggests, a change in the value of nominal exchange rate would reflect price changes one to one as long as the real exchange rate stays constant over time. However, this may not hold in case of jumps in the value of the real exchange rate. Considering that the 1990s was a period of high inflation for many of the CEE countries, such jumps in the value of real exchange rate may cause the credit growth to be over-estimated. Due to these concerns, this section reproduces the results of Table 3 and Table 4 by using a new credit growth variable which is estimated from the inflation adjusted data20. The new estimation results are reported in Table 5 and Table 6.
By comparing the estimation results provided in Table 3 to Table 5 and Table 4 to
Table 6, one can see that the coefficient estimates and the standard errors are very close to each other21. The estimation results provided in this section does not yield any significant difference between the uses of these two dependent variables. These results show that any possible jumps in the value of the real exchange rate was not persistent enough to bias the original estimation results.
G. Robustness: Concerns about Endogeneity of the Foreign Ownership Variable
In the literature, it is largely accepted that the acquisition of state-owned banks by foreigners is not a random process but that the best performing state banks are purchased by foreigners. For the CEE case, it might also be argued that governments are not privatizing state banks in a random fashion but banks with a retail-banking focus –such as the ones with a larger customer base or branch network- are the ones that are being privatized. In order to overcome this issue several procedures are used in this paper. First, the dataset contains the largest banks of the CEE countries. If one were to consider that size of the bank is an
20 The new dependent variable is highly correlated with our initial credit growth variable. The correlation coefficient is 0.85, with p-value 0.00, during the 1990s; and 0.97, with p-value 0.00, during the 2000s.
21 For the 1990s, which should be a period of more concern, only one variable loses significance, ROA reported in Table 5. For the 2000s, again only one variable loses significance, real interest rate reported in Table 6; however, one should mention that the standard error of this coefficient estimate is very close to the one reported in Table 4.

15
important characteristic for foreign investors’ acquisitions decisions22, then there is less variation across state-owned banks of the CEE countries. Second, a fixed effect within estimator method is used for the panel data estimations. Applying fixed effects rather than the random effect model eliminates possible concerns about correlation between the foreign ownership dummy and any bank specific error component of the random effects model. Third, with respect to the correlation between ownership dummy and time-varying bank-specific variables, many important measures of bank profitability, liquidity, size, and soundness are incorporated into the regression equation. Lastly, an instrumental variable model is considered.
The instrumental variable model is estimated by using a two-stage least-squares
(TSLS) generalization of the fixed effects panel data estimator. For the choice of instruments, this paper considered bank-level and macroeconomic variables which are assumed to be independent of the error term of the credit growth equation but they explain the variation in the foreign ownership dummy. Nevertheless, the choice of instruments for foreign bank ownership is not a straight forward decision. In order to choose the instruments which best explain the variation in the foreign ownership dummy a panel data probit estimation method is utilized23. Table 7 provides the estimation results of this model for various candidate instrumental variables. Looking at this table, one can see that Model 6 has the smallest information criteria values. Therefore the regressors of this model are used as the optimal instrumental variables.
After deciding the optimal instruments, a TSLS generalization of the fixed effects
panel data model is used to estimate the impact of the foreign bank ownership on credit growth24. In the first stage, the foreign-ownership variable is regressed on the variables of Model 6. In the second stage, the predicted values of this variable - which were obtained from the first stage - and other possible regressors are used as the independent variables of the credit growth estimation. The same model of the second stage is then estimated without employing the instruments but the foreign ownership dummy by itself and the other regressors, which were used in the second stage of the TSLS regression. After obtaining the coefficient estimates from both methods, a Hausman specification test is performed to see whether the coefficient estimates of the two models are systematically different.
Table 8 provides the Hausman specification test results for two different models. The
first model covers the whole sample and the results indicate that treating the foreign ownership variable as exogenous, given the fixed effect model, does not have any deleterious
22 Size of a bank may provide information about the number of its branch networks. It may be easier for banks with more branches to increase its customer base, and hence, its credit growth.
23 A random effects probit model is employed for the estimations, and the model assumes a normal distribution function for the bank-specific error term.
24 The estimator assumes that the idiosyncratic error term in the credit growth equation is uncorrelated with any of the regressors. However, since the bank-specific error term is assumed to be constant, this variable may be correlated with the independent variables of that equation.
16
impact on the consistency of coefficient estimates. The data analysis indicated that there is a structural break, and therefore, Hausman test covering the 2000s period is also reported in addition to the one for the entire sample. The result again supports that there is no systematic difference across the estimated coefficients. Regarding the test results provided in Table 8, the paper assumes that a foreign investor’s acquisition decision is not shaped by the credit growth pattern of a specific bank, conditional on the bank-specific fixed effect.
III. THE ROLE OF FOREIGN PARENT BANKS
A. Introduction
As stated in the previous section, foreign-owned banks behave differently in terms of funding, and they operate in the CEE countries for high economic growth and interest margins. After establishing these facts, this section of the article investigates the influence of the parent banks on the funding and credit extension decision of the foreign-owned banks operating in the CEE countries. In particular the analysis is focused on three main questions.
The first question focuses on the impact of the bank level characteristics of a parent
bank –size, profitability and efficiency- on the CEE credit growth. The paper tests three hypotheses for this question. First, foreign banks, which are owned by larger parents, extend more credit. Second, parent banks extend more credit to their CEE subsidiaries when they themselves are more profitable. Third, parent banks are cost concerned that is when their overall costs increase, parent banks focus on consolidation rather than expansion.
The second question investigates the importance of home market –the country where
the parent bank is located- and the host market –the country where the CEE subsidiary operates- conditions for the growth of credit in the CEE subsidiaries. In particular it tests for three main hypotheses. First, parent bank lending is procylical with the macroeconomic conditions in the CEE countries. Second, parent bank lending is procylical with the macroeconomic conditions at its headquarter. Third, parent banks increase lending to the CEE countries when interest rates in the home market are low compared to those in the host market.
The third question investigates whether it is important to differentiate amongst
foreign banks in terms of who owns that bank. In particular, it tests for the hypothesis that different parent banks have different management strategies for the growth of credit in their CEE subsidiaries.
In order to test these hypotheses, this section merges the data from the previous
section with a new dataset for the parent banks. The following section, Data for Foreign Owned CEE Banks, explains the characteristics of the parent bank data. Similar to Section I, a panel data estimation model is employed for the analysis, and this method is explained under the section Empirical Model. The results from this analysis are provided in the following section, Results. Then, the homogeneity of the regression coefficients are tested in case of any variations across parent banks under the section Robustness: Do Parent Banks Have Different Managerial Strategies?.

17
B. Data for Foreign Owned CEE Banks
The data of this section combines the CEE subsidiary data from the previous section with a new one for the foreign parent banks which own these subsidiaries. This combination yields an unbalanced panel dataset, which covers 16 years (1990-2005), and 59 banks, comprised of 18 parent banks and their 41 CEE subsidiaries. The explanation of the variables and the characteristics of the data are provided in the Summary Statistics for CEE Subsidiaries and their Parent Banks in Appendix B.
Table 9 matches the foreign parent banks and their CEE subsidiaries as of the last
accounting date of that subsidiary. First, this table shows that there are 18 parent banks controlling the biggest foreign-owned banks in the CEE region. In particular, Austrian and German banks have a strong equity stake in the Central European Countries. Second, there is a clustering across foreign banks: a parent bank prefers to open a subsidiary in countries that are in close proximity to headquarter. For example, one can see that Scandinavian countries operate in Baltic countries, whereas Western European countries such as Austria and Germany have subsidiaries in the Central European countries. Third, clustering of the parent banks reveals that the major foreign players in the CEE banking system are Western Europeans25. This finding indicates that the business cycles in Western Europe and the monetary policy of this region, in particular the European Central Bank policy, may have a significant impact on the credit growth pattern of the CEE countries.
C. Empirical Model
After a detailed study of the data, including possible multicollinearity problems, a fixed effect within estimator model is employed for the econometric analysis. Choosing a static model over a dynamic model is justified by the insignificance of the correlation coefficients between the current and lagged values of bank level credit growth. The general panel data model is specified as follows,
PHijt
Ht
PHt
PHjt
PHijt
PHijt ZXZXC υφβφβμ +++++= 22221111 (3.1)
where, itiPHijt u+= αυ
The dependent variable is credit growth in a CEE subsidiary, measured by the
percentage growth rate in the net loans of that bank. In Equation (3.1), subscript i is for the CEE subsidiary, j denotes the country in which the subsidiary is operating – also known as 25 The only two exceptions in this sample are one Japanese bank operating in the Czech Republic and the U.S. bank Citigroup having subsidiaries in Poland.

18
‘the host country’, and t is the time subscript. Further, P is a superscript denoting the parent bank of the CEE subsidiary, and H denotes the country where the headquarters is located, or ‘the home country’. On the left hand side of Equation (3.1), μ is the common constant; X1 and X2, respectively are the matrices for all the bank-specific variables for the CEE subsidiary and the parent bank; β1 and β2 respectively are the vectors of coefficients for the banking variables of the CEE subsidiary and the parent bank. In order to minimize simultaneity problems between the balance sheet items and the dependent variable, all balance sheet variables are lagged one period. Z1 and Z2 respectively are the matrices for country specific macroeconomic variables and φ 1 and φ 2 are the vectors of coefficients for these variables.
Last, time-specific-host-country dummies and year dummies are introduced to the
fixed effects model. Introduction of these dummies will capture the impact of time-specific macroeconomic shocks, which is peculiar to each host country, and which is not captured by the macroeconomic indicators. However, as it was the case in the previous section of this paper, these dummies are collinear with the host-country macro variables. Therefore they are introduced as a substitute for these macro variables. Both Akaike and Bayesian information criteria indicate that the model is improved after the introduction of these time-specific-host-country dummies.
D. Results
Credit tends to grow faster the larger the size of the parent bank. The size of the parent bank, which is measured by the ln(Total Assets), is significant and positive as it is presented in Table 10. This shows that as the parent bank grows there are more resources for the CEE subsidiary to use in their host country. Since the CEE subsidiary is much smaller in scale compared to its parent bank (refer to Table 15), a big parent company allows the subsidiary to increase the lending more easily via the resources coming from the parent bank. Additionally, the increase in the importance of Interbank Liabilities as a source of funding for the CEE subsidiaries highlights the importance of the size of a parent bank. Customer Deposits over Total Assets and Interbank Liabilities over Total Assets are the two main sources of financing for the CEE subsidiaries. Even though both means of funding are significant for the growth rate of credit (Table 10), looking at the regressions results for the most recent five years, one can see that Interbank Liabilities over Total Assets have larger coefficient estimates26. This indicates that over time subsidiaries can easily raise their funds either from their parent bank, or through borrowing from other banks via the credibility of their parent company. Last, the positive impact of the euro-area money growth on the CEE
26 Interbank Liabilities cover deposits from banks, usually from a correspondent. These funds are short-to-medium term in maturity.

19
credit growth may also supports this finding. The coefficient for Euro-Area M3 Growth is positive and significant (Table 11). This may indicate the portion of the credit in the CEE countries which is financed through the EMU markets.
Parent banks operate in the CEE for high profit opportunities, but they do not cut CEE lending when profitability in the multinational is in decline. Results in Table 10 show that interest margin of the parent bank is significant and positive for the CEE credit growth. A positive coefficient shows that parent banks increase credit in the CEE subsidiaries more during their rosy times. However, looking at the last five years of the dataset, one can see that Net Interest Margin becomes insignificant. The amount of competition in the financially developed markets increased much more in the 2000s. Since saturated markets yield less profit, interest margins in the home markets declined sharply. However, a decline in these margins does not create a similar effect for the CEE credit growth. This indicates that parent banks do not cut lending when their profitability worsens.
A parent bank tends to reduce lending in its subsidiary if it becomes more costly to
operate. As reported in Table 10, Cost to Income Ratio of the parent bank has a significant and negative coefficient. This indicates that parent banks are more cost concerned, and they tend to decrease the lending in the subsidiary if they are incurring high operational costs relative to their income27. Parent banks have to be more concerned about the operational costs because they operate under very tight interest margins. The coefficient estimate for Cost to Income Ratio gets larger for the last five years, and this shows that the cost sensitiveness of the parent banks increases more when there is less room for profit.
Credit growth is procyclical with the host country conditions. In all the regression
results presented in Table 10, Real GDP Growth Rate has a positive and significant coefficient. This indicates that business cycles in the host country have a direct effect on the credit growth in the CEE subsidiaries: credit grows more during the expansionary periods and less during recessions.
Credit growth is not responsive to the home country conditions. A major concern over
foreign ownership is the possibility that a parent bank may cut lending in their subsidiaries if they face negative shocks in the home country. However, as provided in Table 11, the coefficient estimates for Real GDP Growth Rate in the home country are insignificant in both samples. Since a majority of parent banks own subsidiaries which operate in other than home markets, a negative shock at their headquarters has less influence in the growth of credit for these affiliated banks.
Tight spreads in the home market is a motivation for parent banks to increase lending
in their subsidiaries operating in the CEE countries. Looking at the estimation results in
27 However, one should mention that Cost to Income measures cost as a percentage of income. A change in the value of this variable would not show whether it is driven by a change in cost or a change in income.

20
Table 11, for the last five years of the dataset, coefficient for the Spread between Lending and Borrowing Rate is significant and negative for parent banks. This is because parent banks have to operate under very tight spreads in their home markets, in particular during the second half of the dataset. Since the home country offers less room for profit, these banks need to move to other markets to earn profits from relatively higher spreads. Additionally, the spread for the host market turns insignificant when jointly introduced to the regression with home market spreads during the last five years of the dataset. This implies that the home market has dominance in the credit growth pattern of the subsidiary during these years. Last, the influence of the euro area interest rate also indicates a similar relationship. The coefficient for Short-Term Euro-Area Nominal Interest Rates is significant and negative (Table 11). This indicates that as the interest rates are falling in the EMU countries, the home market for a majority of the parent banks, they increase the lending in their host countries which are operating under higher interest rates.
E. Robustness: Do Parent Banks Have Different Managerial Strategies?
In all the models that were considered in this section, we assumed common coefficients across parent banks. Since the paper tracks the importance of the managerial impact of parent banks on the credit growth of the CEE subsidiaries, a relevant extension is to allow the coefficients to vary across parent banks and then to test for their equality. Therefore, Equation (3.1) is modified in order to capture parent bank specific coefficients.
PHijt
P
Ht
P
P
PHt
P
P
PHjt
P
P
PHijt
PPHijt ZXZXC υφβφβμ +++++= ∑∑∑∑
Θ∈Θ∈Θ∈Θ∈22221111 (3.2)
In Equation (3.2) all the variables of interest are allowed to vary across different
parent banks. After obtaining the estimation results, any difference in a coefficient across parent banks will indicate the variation on the managerial impact due to difference in ownership. The numbers of affiliated banks that are owned by the same parent company vary from one to six and the number of balance sheet years available for each bank changes from one to sixteen. This characteristic of the dataset creates a restriction for estimating Equation (3.2) for each parent bank separately. Therefore, Equation (3.2) and the common coefficient test are applied only to the groups where a parent bank owns at least three subsidiaries. Among these parent banks, the minimum number of banking year observations is 22 and the maximum is 43. Due to the limited number of banking year observations, these models used only the three most important regressors for credit growth: Total Assets over GDP, Interbank Liabilities over Total Assets, and Real GDP Growth. These regressors control the size of a bank, its financing stream, and also the business cycles in the country that it is operating in. Table 12 provides the estimation results for the three variations of Equation (3.2) with these aforementioned regressors.

21
After obtaining the coefficient estimates from Table 12, a Wald test is performed for each regressor for the null hypothesis that all coefficients are equal across different parent banks. Table 13 reports the F statistics of the Wald test for each regressor and for each model. Looking at this table, the test statistic fails to reject the equality of the coefficient estimates for each of the three most important regressors. Since the data restrictions make it difficult to apply the same test across each parent bank in the dataset, the results obtained from these three parent banks are assumed to be valid across other parent banks owning subsidiaries in the CEE countries.
IV. CONCLUSION
This paper analyzes the sources of rapid credit growth in the CEE countries, and the risks and vulnerabilities associated with it. In the CEE countries, banks -in particular the foreign banks- have been a major source for providing credit in these markets. This paper studies the impact of foreign banks in the growth pattern of this credit. The results coming from the analysis of this paper have several policy implications.
This paper finds that foreign-owned banks on average have higher loan growth rates
than domestically-owned banks. However, by the 2000s the estimation results indicate that the credit growth rate of foreign banks is higher than the state-owned banks, but significantly lower than that of domestically-owned private banks.
An important question regarding the high credit growth rate in the CEE countries is
about the sustainability of this credit growth. This paper shows that high economic growth in the CEE markets and low domestic interest rates that the parent banks face in their countries are the underlying reason for foreign banks to extend their operations to the CEE markets. Interest rate spreads between the CEE markets and the head quarters have lost their significance recently. Even though the CEE countries are likely to keep high economic growth rates in the future due to significantly lower GDP per capita levels, an important question arises from this results, and that is whether the parent banks will be as willing to extend lending to the CEE markets when the CEE financial markets mature and the growth rates decelerate. However, in the sustainability of credit growth in the CEE countries, one should also foresee that stock markets will gain more importance when the CEE financial markets mature, and this will lessen the impact of a decline in bank credit on the CEE economies.
The results indicate that the sources for funding bank loans changed over time and
across ownership types, in particular, after the 2000s. In the earlier periods, foreign banks acted like private domestically-owned banks, and customer deposits constituted a very important source of funding for them to increase lending. However, over time, foreign-owned banks started to obtain lending from their parent banks and/or other big banks -by relying on the reputation of the parent bank. As external borrowing is significant for the

22
foreign banks operating in the CEE countries, an important concern arises related to the risks of this increased dependence to the foreign interbank markets: extensive borrowing from the foreign interbank markets may create vulnerabilities for the foreign banks operating in the CEE countries considering the current credit crunch in the financially developed markets.
In terms of profitability, the degree of competition in the CEE markets increased, and
hence caused a decline in the profit margins. By the 2000s, cost and efficiency indicators lost importance in the growth of credit for private banks, but remained important for state-owned banks. The insignificance of these indicators for private banks shows the importance of the ‘know-how’ effect that foreign banks bring to the CEE countries. The regression results related to efficiency indicators show that the cost structure of the parent bank is important. Parent banks tend to reduce the CEE lending when the operational costs in the entire conglomerate increase. Even though the parent bank is cost concerned due to the tight profit margins it is facing, the CEE subsidiaries incur higher costs to increase their lending. In this regard, a policy advice for the CEE authorities is to increase the information sharing between the CEE subsidiaries and their foreign parent banks.
Last, the macroeconomic analysis shows that high economic growth and financial
deepening, via the decline in interest rates, were very important factors in driving the high credit growth in the CEE countries during the 1990s. These spreads will lose importance over time. However, the business cycle will keep its importance and an economic downturn will have a negative influence on the credit growth pattern. Therefore this is an indication that the CEE banks need to have prudential banking regulations and supervision to control very risky bank lending when the business environment is not so welcoming. CEE policymakers should make sure that the CEE banks have extra buffers in case of a slowdown in the economy.

23
APPENDIX
A. Data Sources
The macroeconomic dataset is obtained from three main sources: International Financial Statistics, World Economic Outlook, and Eurostat. Alternatively, the micro level data is obtained from; BankScope, the Banker’s Almanac, Privatization Barometer, MIGA, the World Bank, European central banks, and individual bank’s web sites.
The balance sheet data was gathered from BankScope for the largest banks of that
country28. The number of banks covered varies per country and the criterion in this decision is to have as many banks as to account for at least 60 percent of the country’s total banking sector assets. To be more precise, Table 2 lists the total banking assets of each CEE country in this dataset as a percentage of the total banking assets of that country for the years 2000 and 2004.
Table 2: Coverage of Dataset as a Percent of Total Banking Assets of each CEE Country
2000 2004 2000 2004
Bulgaria 91% 88% Lithuania 95% 89%Czech Republic 81% 67% Poland 87% 84%Estonia 97% 90% Romania 83% 73%Hungary 88% 78% Slovakia 96% 73%Latvia 96% 89% Slovenia 83% 72%
Source: BankScope
In BankScope, balance sheet information is reported under two different accounting
standards. In order to standardize the dataset, all the balance sheets that are reported under the International Financial Reporting Standards (IFRS) are used when available, and Generally Accepted Accounting Principles (GAAP) is used otherwise. Also in this dataset, balance sheet statements are available under consolidated and unconsolidated accounts29. For the CEE countries, both consolidated and unconsolidated accounts are used according to the availability of balance sheet information. Use of different statements for these countries should not create any inconsistency, as most banks operating in Central and Eastern Europe
28 The banking sector in the CEE countries are highly concentrated and the largest 4 or 5 banks hold around 72 percent of the total banking sector assets in a CEE country [ECB (2005A)].
29 Consolidated statements contain the balance sheet information of all the companies affiliated with that bank. If a bank has extended its operations abroad, then the consolidated statements capture the foreign business transactions of that multinational bank. On the other hand, unconsolidated statements cover only the domestic business transactions of a bank.
24
are small and domestically focused30. Consolidated statements are used for parent banks because a significant amount of balance sheet items of parent banks are due to the activities of their subsidiaries or branches operating in different countries31. Therefore, use of consolidated statements is necessary to capture the whole activities of these multinational banks.
A major challenge for this study was to obtain bank ownership information. In
BankScope, the ownership structure is available only with respect to the last accounting year. It would be misleading to rely only on BankScope information because many of the banks, in particular those operating in the CEE countries, had experienced major changes in ownership. In order to have the full history of the changes in ownership, several resources are used. Banker’s Almanac is utilized for an individual bank’s ownership history and Privatization Barometer, MIGA and the World Bank is used for any listed privatization transactions. If a bank is not listed in any of these datasets, central bank and/or individual bank web sites are used as needed for change in ownership information.
The ownership of banks is classified under three categories: state, private domestic,
and foreign-owned. This paper differs from other papers in the literature in terms of its determination of ownership. Many papers classify a bank as foreign if the share of its capital controlled by all foreign shareholders combined is above a certain threshold level. This paper classifies a bank as foreign-owned when there is a single foreign investor holding the majority of shares. This distinction is important, as this paper tracks the influence of the foreign owner on the behavior of its subsidiary. State ownership is decided according to whether the state has a controlling majority stake. All banks that are not classified as foreign or state-owned are listed under the private domestic ownership category.
B. Data Analysis
Summary Statistics for CEE Banks Table 14 provides the summary statistics for the CEE banks. This is an unbalanced
panel from 1988 to 2005. During 1990s, the CEE countries had major changes in their banking system, and throughout this transition, they also experienced banking crises. Therefore, Table 14 presents the data statistics separately for the earlier and later years, and the whole sample. The first sample (S1) covers the period 1988 to 2000, and S2 is from 2001 onwards. Looking at Table 14, a majority of the statistics change over time. In Table 14, Net
30 Banks operating in the CEE countries, do not extend their operations abroad [ECB (2005A)] – except a few banks operating in Hungary.
31 Consolidating the parent bank balance statements will not cause a double counting of the CEE balance sheet statements. Because the share of total CEE banking assets constitute only a small share of the total EU banking sector assets [ECB (2005C)]. As of December 2005, the highest share of the CEE assets as a percentage of group assets was less than 45%, and it did not constitute a share of more than 12% in any group’s assets except three [RZB Group (2006)].

25
Loan Growth is calculated as the percentage change in the net loans of a bank outstanding. In order to eliminate outliers, any bank year with credit growth rates greater than 500 percent is eliminated. Table 14 shows that Net Loan Growth is significantly higher in the 2000s, and this indicates financial deepening. Table 14 shows that the CEE countries are dominated by foreign banks: 66 percent of the banks became foreign. Additionally, state ownership declined significantly over time, from 52 percent to 10, showing that the majority of the CEE banks are private banks. Total Assets over GDP is a measure for the size of a bank, and as given in Table 14, this statistic has a bigger mean for the earlier years of the sample. Since most of the banks before the transition were state owned, a larger mean for the earlier period of the sample reflects the characteristics of these large state-owned enterprises: there were very few but very large banks during the centrally planned economies. The liquidity structure in the CEE banks shows change over time. During the centrally planned economies, banks did not act as financial intermediaries but rather as entities for account keeping. As the banking system in the CEE countries matured, the percentage of Customer Deposits over Total Assets increased. Additionally the decline in Interbank Liabilities over Total Assets is an indication of banks becoming more independent from the government. High Interbank Liabilities may also show the state subsidies during the CEE banking crises in the 1990s. Looking at Table 14, one can see that there are no significant differences in CEE profitability over time. Return on Equity (ROE) and Return on Assets (ROA) determine a bank’s efficiency in generating income by using capital and asset respectively. Net Interest Margin is the difference between the Interest Income and Interest Expense of a bank, divided by its Average Earning Assets. Even though the Net Interest Margin declined over time in the CEE banks, ROE and ROA remained unchanged over time. Cost to Income Ratio is given by Operating Costs as percent of Total Income. Even though the mean of this ratio is increasing over time, its variance is declining. Soundness measures show improvement over time. Loan Loss Provisions are the net allowances that banks make against bad or impaired loans. Since the data for Nonperforming Loans is not available, this variable divided by Total Assets is used as a proxy for the asset quality of a bank. Total Capital Ratio is another measure for the soundness of a bank and it is given by Total Capital divided by Risk Weighted Assets. This ratio gets smaller as the risky assets of a bank get larger. Macroeconomic indicators show that the CEE countries are having higher growth rates and financial deepening. Real GDP Growth increased from 3 percent to 5 percent during the 2000s. Both Spread 1 –between banks’ lending and borrowing rate- and Spread 2 –between domestic and Euro nominal interest rates- declined and this indicates economic and financial integration.
Summary Statistics for CEE Subsidiaries and their Parent Banks
Table 15 provides the summary statistics for parent banks and their subsidiaries
operating in the CEE countries. Because a majority of the parent banks has their headquarters in the EMU countries, the last four statistics are not reported separately for parent banks. Looking at this table, one can see that the statistics of interest vary significantly across parent banks and their CEE subsidiaries. First, parent banks are very big banks. Total Assets are significantly larger for parent banks. Second, parent banks grow slower: Net Loan Growth for the CEE subsidiary is considerably higher than the parent bank. This characteristic is a reflection of the growth theory: big entities grow slower. Third, the mean and variance in profitability and efficiency measures are much smaller for parent banks - except for Cost to
26
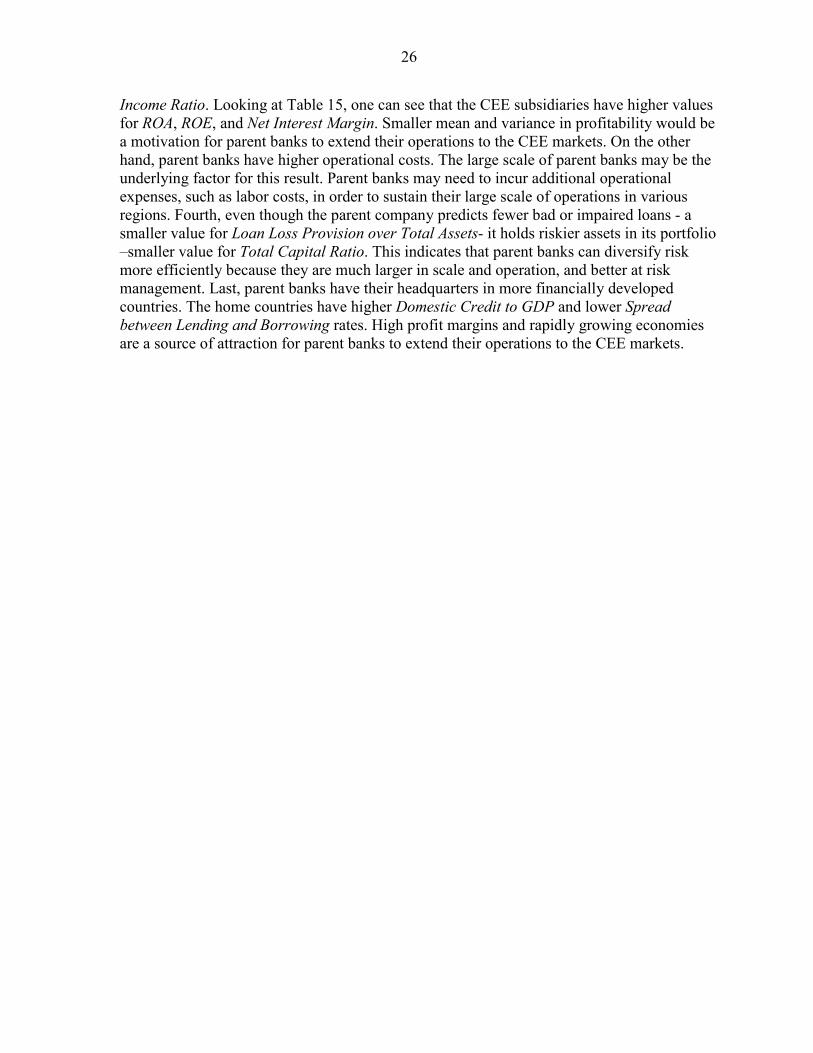
Income Ratio. Looking at Table 15, one can see that the CEE subsidiaries have higher values for ROA, ROE, and Net Interest Margin. Smaller mean and variance in profitability would be a motivation for parent banks to extend their operations to the CEE markets. On the other hand, parent banks have higher operational costs. The large scale of parent banks may be the underlying factor for this result. Parent banks may need to incur additional operational expenses, such as labor costs, in order to sustain their large scale of operations in various regions. Fourth, even though the parent company predicts fewer bad or impaired loans - a smaller value for Loan Loss Provision over Total Assets- it holds riskier assets in its portfolio –smaller value for Total Capital Ratio. This indicates that parent banks can diversify risk more efficiently because they are much larger in scale and operation, and better at risk management. Last, parent banks have their headquarters in more financially developed countries. The home countries have higher Domestic Credit to GDP and lower Spread between Lending and Borrowing rates. High profit margins and rapidly growing economies are a source of attraction for parent banks to extend their operations to the CEE markets.
27
REFERENCES
Altunbas, Y., L. Evans and P. Molyneux, 2001, “Bank Ownership and Efficiency,” Journal of Money, Credit and Banking, Vol. 33, No. 4, pp. 926-54.
Barajas, A., R. Steiner and N. Salazar, 2000, “The Impact of Liberalization and Foreign
Investment in Colombia’s Financial Sector,” Journal of Development Economics, Vol. 63, pp. 157-196.
Baltagi, B. and H., 2003, “Econometric Analysis of Panel Data,” Wiley, Third Edition. Berger, A., R. DeYoung, H. Genay and F. Udell, 2000, “Globalization of Financial
Institutions: Evidence from Cross-Border Banking Performance,” Brookings Papers on Economic Activity, Vol. 2, pp. 23-158.
Berger, A., S. Bonime, L. Goldberg and L. White, 2004, “The Dynamics of Market Entry:
The Effects of Mergers and Acquisitions on Entry in the Banking Industry,” Journal of Business, Vol. 77, pp. 797-834.
Bonin, J. P., I. Hasan and P. Wachtel, 2005, “Bank performance, efficiency and ownership in
transition countries”, Journal of Banking & Finance, 29 pp. 31–53. Bonin, J. P., P. Wachtel, 2003, “Financial Sector Development in Transition Economies:
Lessons from the First Decade,” Financial Markets, Institutions & Instruments, Volume 12, Number 1, pp. 1-66(66).
Breyer, P., 2004, “Central and Eastern Europe — The Growth Market for Austrian Banks,”
Oesterreichische Nationalbank, Journal Monetary Policy & the Economy, Issue 3, pp. 63-88.
Brzoza-Brzezina, M., 2005, "Lending Booms in the New EU Member States: Will Euro
Adoption Matter?" ECB Working Paper, No. 543. Caballero, R. J., 2002, “Coping with Chile’s External Vulnerability: A Financial Problem”,
Cetral Bank of Chile Working Papers, No. 154. Caprio, G. and D. Klingebiel, 2002, “Episodes of Systematic and Borderline Banking
Crises,” World Bank, Washington, DC, mimeo. Cottarelli, C., G. Dell’Ariccia and I. V. Hollar, 2003, “Early Birds, Late Risers, and Sleeping
Beauties: Bank Credit Growth to the Private Sector in Central and Eastern Europe and the Balkans,” IMF Working Paper, No. 03/213.
Claessens, S., A. Demirguç-Kunt and H. Huizinga, 2001, “How Does Foreign Entry Affect
Domestic Banking Markets?,” Journal of Banking and Finance, Vol. 25 pp. 891-911.

28
Clarke, G., R. Cull, L. D’Amato and A. Molinari, 1999, “The Effect of Foreign Entry on Argentina’s Domestic Banking Sector,” Unpublished paper.
Clarke, G., R. Cull, M. Soledad Martinez Peria and S. M. Sánchez, 2003, “Foreign Bank
Entry: Experience, Implications for Developing Economies, and Agenda for Further Research,” World Bank Research Observer, Vol. 18, No. 1, pp. 25-59.
De Nicolò, G., and E. Loukoianova, 2007, “Bank Ownership, Market Structure and Risk,”
International Monetary Fund, WP/07/215. De Haas, R.T.A. and I. Van Lelyveld, 2006, “Foreign Banks and Credit Stability in Central
and Eastern Europe. A Panel Data Analysis”, Journal of Banking and Finance, Elsevier, vol. 30(7), pp. 1927-1952.
De Haas, R.T.A. and I. Van Lelyveld, 2003, "Foreign Bank Penetration and Private Sector
Credit in Central and Eastern Europe," Netherlands Central Bank, DNB Staff Reports (discontinued), Vol. 91.
Demirgüç-Kunt, A. and H. Huizinga, 1998, “Determinants of Commercial Bank Interest
Margins and Profitability: Some International Evidence,” Unpublished paper. Demirgüç-Kunt, A., L. Laeven, and R. Levine, 2003, “Regulations, Market Structure,
Institutions, and the Cost of Financial Intermediation.” National Bureau of Economic Research, Inc, No. 9890.
Denizer, C., 1999, “Foreign Entry in Turkey’s Banking Sector, 1980-97,” World Bank Policy
Research Working Paper, Washington D.C., WPS 2462. Detragiache, E., and P. Gupta, 2006, "Foreign banks in emerging market crises: Evidence
from Malaysia," Journal of Financial Stability, Elsevier, vol. 2(3), pages 217-242, October.
Detragiache E., P. Gupta and T. Tressel, 2006, "Foreign Banks in Poor Countries: Theory
and Evidence", IMF Working Papers 06/18, International Monetary Fund. Detragiache, E., and A. Demirgüç-Kunt, 1997, "The Determinants of Banking Crises -
Evidence from Developing and Developed Countries," IMF Working Papers 97/106, International Monetary Fund.
Detragiache, E., and A. J. Hamann, 1997, "Exchange Rate-Based Stabilization in Western
Europe - Greece, Ireland, Italy and Portugal," IMF Working Papers 97/75, International Monetary Fund.
European Central Bank, 1999, “Possible Effects of EMU on the EU Banking Systems in the
Medium to Long Term,” European Central Bank, Frankfurt am Main.
29
European Central Bank, 2006, “Macroeconomic and financial stability challenges for acceding and candidate countries,” European Central Bank, Occasional Paper No. 48.
European Central Bank, 2005A, “Banking Structures in the New EU Member States,”
European Central Bank, Frankfurt am Main. European Central Bank, 2005B, “EU Banking Structures,” European Central Bank, Frankfurt
am Main. European Central Bank, 2005C, “EU Banking Sector Stability,” European Central Bank,
Frankfurt am Main. European Commission, 2004A, “Reviewing adjustment dynamics in EMU: from overheating
to overcooling,” European Commission Economic Papers, European Economy, No. 198, Brussels.
European Commission, 2004B, “The Portuguese economy after the boom,” European
Commission Occasional Papers, European Economy, No. 8, Brussels. Gormley, T. A., 2007, "Banking Competition in Developing Countries: Does Foreign Bank
Entry Improve Credit Access?". Available at Social Science Research Network: http://ssrn.com/abstract=879244.
Gourinchas, P.O., R. Valdes and O. Landerretche, 2001, “Lending Booms: Latin America
and the World,” NBER Working Paper, No. 8249. Gruben, W. C. and R. McComb, 1997, “Liberalization, privatization, and crash: Mexico’s
banking system in the 1990s,” Federal Reserve Bank of Dallas Economic and Financial Policy Review, No. 9701, 21-30.
Gruben, W. C., and R. McComb, 2003, “Privatization, Competition, and Supercompetition in
the Mexican Commercial Banking System,” Journal of Banking and Finance, Vol. 27, pp. 229-49.
Haber, S., 2005, “Banking with and without Deposit Insurance: Mexico’s Banking
Experiments, 1884-2004,” Mimeo. Stanford University. Hanousek, J., E. Kocenda and J. Svejnar, 2004, “Ownership, Control and Corporate
Performance after Large-Scale Privatization,” William Davidson Institute Working Paper, No. 652.
Hsiao, C., 2003, “Analysis of Panel Data” Cambridge University Press. International Monetary Fund, 2006, “Financial Soundness Indicators: Compilation Guide,”
International Monetary Fund, ISBN/ISSN: 978-1-58906-385-3.

30
Kraft, E. and L. Jankov, 2005 "Does Speed Kill? Lending Booms and their Consequences in Croatia," Journal of Banking and Finance Vol. 29, No. 1, pp. 105-121.
Kraft, E., 2006, "How Competitive is Croatia's Banking System?," Croatian National Bank
Working Papers, No. W-14, March. Lambregts, E. and D. Ottens, 2006, “The Roots of Banking Crises in Emerging Market
Economics: A Panel Data Approach,” De Nederderlandsche Bank, Monetary and Economic Policy Department, Working Paper, No. 084.
Lensink, R. and N. Hermes, 2004, “The Short-Term Effects of Foreign Bank Entry on
Domestic Bank Behaviour: Does Economic Development Matter?,” Journal of Banking and Finance, No. 28, pp. 553-568.
Levine, R., 2002, “Denying Foreign Bank Entry: Implications for Bank Interest Margins,”
Banco Central de Chile, L. Ahumada and R. Fuentes eds., Bank Competition. Maechler, A., S. Mitra and W. DeLisle, 2006, “Exploring Financial Risks and Vulnerabilities
in New and Potential EU Member States,” forthcoming, IMF Working Paper. Martinez P., M. Soledad and A. Mody, 2004, “How Foreign Participation and Market
Concentration Impact Bank Spreads: Evidence from Latin America,” Journal of Money, Credit and Banking, Vol. 36, No. 3 (June), pp. 511-537.
Martinez-Peria, M.S., A. Powell and I. Vladkova Hollar, 2002, “Banking on Foreigners: The
Behavior of International Bank Lending to Latin America, 1985–2000”, Working Paper.
Mayer, T., 2006, “Beware of the EMU trap,” Focus Europe, Deutsche Bank AG Global
Markets Research , pp.8-15. Mian, A., 2003, “Foreign, Private Domestic, and Government Banks: New Evidence from
Emerging Markets,” Mimeo, Graduate School of Business, University of Chicago. Micco, A. and U. Panizza, 2006, “Bank Ownership and Lending Behavior,” Central Bank of
Chile Working Papers, No. 369. Micco, A., U. Panizza and M. Yañez, 2004, "Bank Ownership and Performance," Inter-
American Development Bank, Research Department Working Papers, No. 1016. Ottens D., E. Lambregts and S. Poelhekke, 2005, "Credit Booms in Emerging Market
Economies: A Recipe for Banking Crises?," DNB Working Papers 046, Netherlands Central Bank, Research Department.
RZB Group, 2006, “CEE Banking Sector Report”, Raiffeisen Centrobank AG, Vienna.

31
Slomka A., 2004, “Bank Ties and Firms’ Performance in a Transition Economy: Evidence on Investment-Cash Flow Sensitivity in Poland,” Warsaw School of Economics, 164 Al. Niepodleglosci, Warsaw.
Sturm, J.-E. and B. Williams, 2004, “Foreign Bank Entry, Deregulation and Bank Efficiency:
Lessons from the Australian Experience,” Journal of Banking and Finance, No. 28, pp. 1775-1799.
Tamirisa N. and D. Igan, 2006, “Credit Growth and Bank Soundness in New Member
States,” IMF Working Paper, Washington D.C. Terrones, M. and E. Mendoza, 2004, “Are Credit Booms in Emerging Markets a Concern?,”
World Economic Outlook, IMF, Washington. Thornton L., 2003, “Comparison of Key Standardards (IFRS, US GAAP and Eurosystem)
with Reference to Central Banks”, Central Banking Publications, Extract from Accounting Standards for Central Banks.
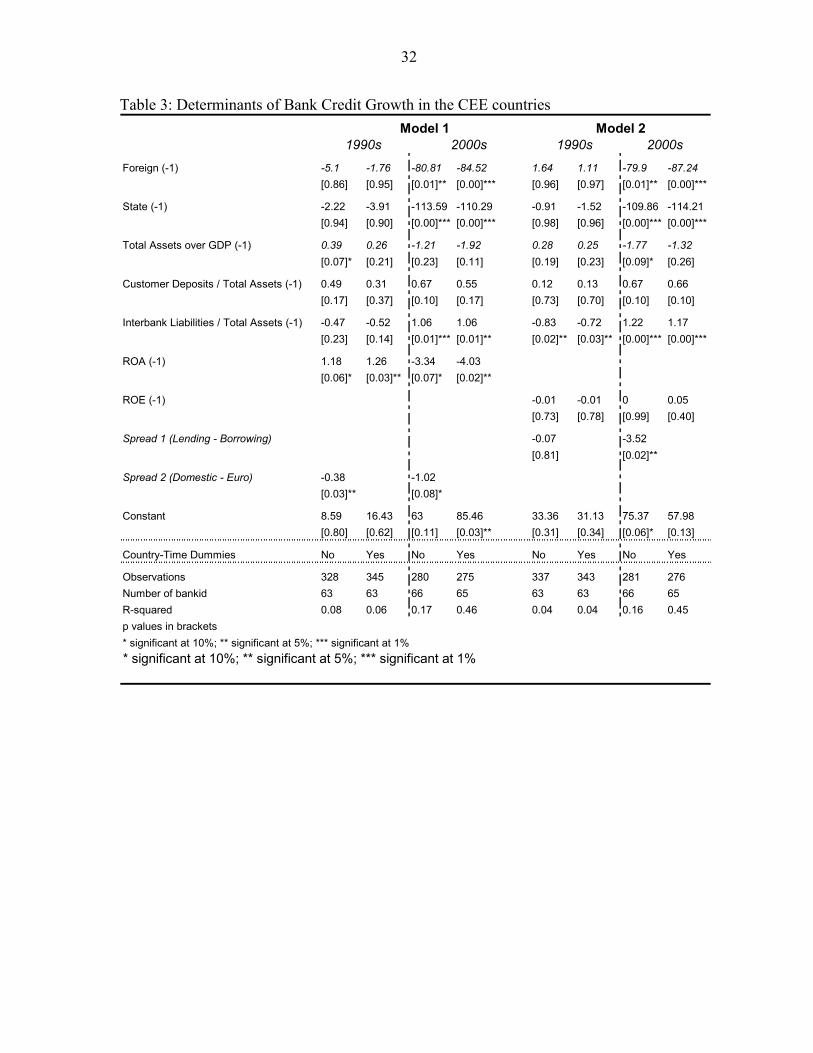
32
Table 3: Determinants of Bank Credit Growth in the CEE countries
Foreign (-1) -5.1 -1.76 -80.81 -84.52 1.64 1.11 -79.9 -87.24[0.86] [0.95] [0.01]** [0.00]*** [0.96] [0.97] [0.01]** [0.00]***
State (-1) -2.22 -3.91 -113.59 -110.29 -0.91 -1.52 -109.86 -114.21[0.94] [0.90] [0.00]*** [0.00]*** [0.98] [0.96] [0.00]*** [0.00]***
Total Assets over GDP (-1) 0.39 0.26 -1.21 -1.92 0.28 0.25 -1.77 -1.32[0.07]* [0.21] [0.23] [0.11] [0.19] [0.23] [0.09]* [0.26]
Customer Deposits / Total Assets (-1) 0.49 0.31 0.67 0.55 0.12 0.13 0.67 0.66[0.17] [0.37] [0.10] [0.17] [0.73] [0.70] [0.10] [0.10]
Interbank Liabilities / Total Assets (-1) -0.47 -0.52 1.06 1.06 -0.83 -0.72 1.22 1.17[0.23] [0.14] [0.01]*** [0.01]** [0.02]** [0.03]** [0.00]*** [0.00]***
ROA (-1) 1.18 1.26 -3.34 -4.03[0.06]* [0.03]** [0.07]* [0.02]**
ROE (-1) -0.01 -0.01 0 0.05[0.73] [0.78] [0.99] [0.40]
Spread 1 (Lending - Borrowing) -0.07 -3.52[0.81] [0.02]**
Spread 2 (Domestic - Euro) -0.38 -1.02[0.03]** [0.08]*
Constant 8.59 16.43 63 85.46 33.36 31.13 75.37 57.98[0.80] [0.62] [0.11] [0.03]** [0.31] [0.34] [0.06]* [0.13]
Country-Time Dummies No Yes No Yes No Yes No Yes
Observations 328 345 280 275 337 343 281 276Number of bankid 63 63 66 65 63 63 66 65R-squared 0.08 0.06 0.17 0.46 0.04 0.04 0.16 0.45p values in brackets* significant at 10%; ** significant at 5%; *** significant at 1%* significant at 10%; ** significant at 5%; *** significant at 1%
Model 11990s 2000s
Model 21990s 2000s

33
Tabl
e 4:
Det
erm
inan
ts o
f Ban
k C
redi
t Gro
wth
in th
e C
EE c
ount
ries
1990
s20
00s
1990
s20
00s
1990
s20
00s
1990
s20
00s
Fore
ign
(-1)
-29.
28-8
9.05
104.
4-3
2.09
-7.1
4-9
5.74
-13.
99-1
34.3
9[0
.44]
[0.0
1]**
[0.0
3]**
[0.5
8][0
.82]
[0.0
0]**
*[0
.64]
[0.0
3]**
Stat
e (-
1)-4
8.74
-113
.44
108.
64-1
01.0
3-6
.96
-148
.31
21.3
5-2
30.8
2[0
.20]
[0.0
0]**
*[0
.03]
**[0
.07]
*[0
.83]
[0.0
0]**
*[0
.51]
[0.0
1]**
*
TA /
GD
P (-
1)-3
.41
-1.5
10.
02-1
.77
0.18
-1.1
0.06
-1.4
7[0
.00]
***
[0.1
3][0
.95]
[0.0
9]*
[0.5
0][0
.23]
[0.8
4][0
.13]
Inte
rban
k Li
abs
/-2
.22
-0.2
1C
usto
mer
Dep
/2.
510.
19-0
.02
0.64
0.09
0.61
TA (-
1)[0
.00]
***
[0.6
9]TA
(-1)
[0.0
0]**
*[0
.73]
[0.9
5][0
.08]
*[0
.81]
[0.1
3]
* For
eign
1.28
1.25
* Fo
reig
n-1
.74
-0.4
6In
terb
ank
Liab
. /
-0.8
71
-1.0
51.
18[0
.12]
[0.0
6]*
[0.0
3]**
[0.5
1]TA
(-1)
[0
.01]
**[0
.00]
***
[0.0
1]**
*[0
.00]
***
* Sta
te2.
011.
31*
Stat
e-2
.26
-0.2
2Lo
an L
oss
Pro
v /
-5.5
5.33
Cos
t/Inc
ome(
-1)
0-0
.09
[0.0
2]**
[0.3
2][0
.00]
***
[0.8
5]TA
(-1)
[0
.03]
**[0
.39]
[0.9
8][0
.87]
RO
A (-
1)3.
34-2
.33
Net
Int.
Mar
gin
(-1)
-0.0
51.
89* F
orei
gn0.
25-4
.98
* For
eign
0.19
0.37
[0.0
3]**
[0.5
8][0
.96]
[0.4
9][0
.95]
[0.4
7][0
.16]
[0.4
8]
* For
eign
-2.8
3-0
.49
* Fo
reig
n-6
.19
-7.2
5* S
tate
1.83
10.4
8* S
tate
-0.1
41.
39[0
.30]
[0.9
2][0
.01]
***
[0.0
9]*
[0.5
2][0
.27]
[0.3
1][0
.10]
* Sta
te-1
.89
-18.
86*
Stat
e-0
.21
-2.3
7R
GD
P G
row
th0.
881.
2Sp
read
10.
78-6
.19
[0.2
9][0
.02]
**[0
.87]
[0.6
1][0
.21]
[0.4
1](L
end
- Bor
row
)[0
.59]
[0.0
3]**
Rea
l Int
. Rat
e0.
69-3
.42
Spr
ead
20.
39-2
.42
* For
eign
-0.8
23.
09* F
orei
gn1.
434.
99[0
.57]
[0.0
8]*
(Dom
estic
- Eu
ro)
[0.4
5][0
.10]
*[0
.46]
[0.0
9]*
[0.4
0][0
.12]
* For
eign
0.71
2.87
* Fo
reig
n-0
.78
3.09
* Sta
te0.
376.
23* S
tate
-0.8
91.
4[0
.66]
[0.2
0][0
.19]
[0.0
7]*
[0.6
1][0
.13]
[0.5
5][0
.66]
* Sta
te-0
.07
-2.8
1*
Stat
e-1
.16
0.78
[0.9
6][0
.43]
[0.0
4]**
[0.6
6]
Con
stan
t98
.26
115.
21-9
0.85
106.
1350
.11
48.8
727
.57
104.
37[0
.00]
***
[0.0
0]**
*[0
.03]
**[0
.02]
**[0
.15]
[0.1
9][0
.42]
[0.0
9]*
Obs
erva
tions
296
243
331
279
314
266
329
274
Num
ber o
f ban
kid
5758
6365
6065
6365
R-s
quar
ed0.
20.
240.
150.
150.
130.
230.
10.
22p
valu
es in
bra
cket
s*
sign
ifica
nt a
t 10%
; ** s
igni
fican
t at 5
%; *
** s
igni
fican
t at 1
%*
Fore
ign
and
* St
ate
deno
tes
the
inte
ract
ion
of th
e fo
reig
n an
d st
ate
owne
rshi
p du
mm
ies,
resp
ectiv
ely,
with
var
iabl
e re
porte
d ab
ove
them
.
Mod
el 1
Mod
el 4
Mod
el 2
Mod
el 3
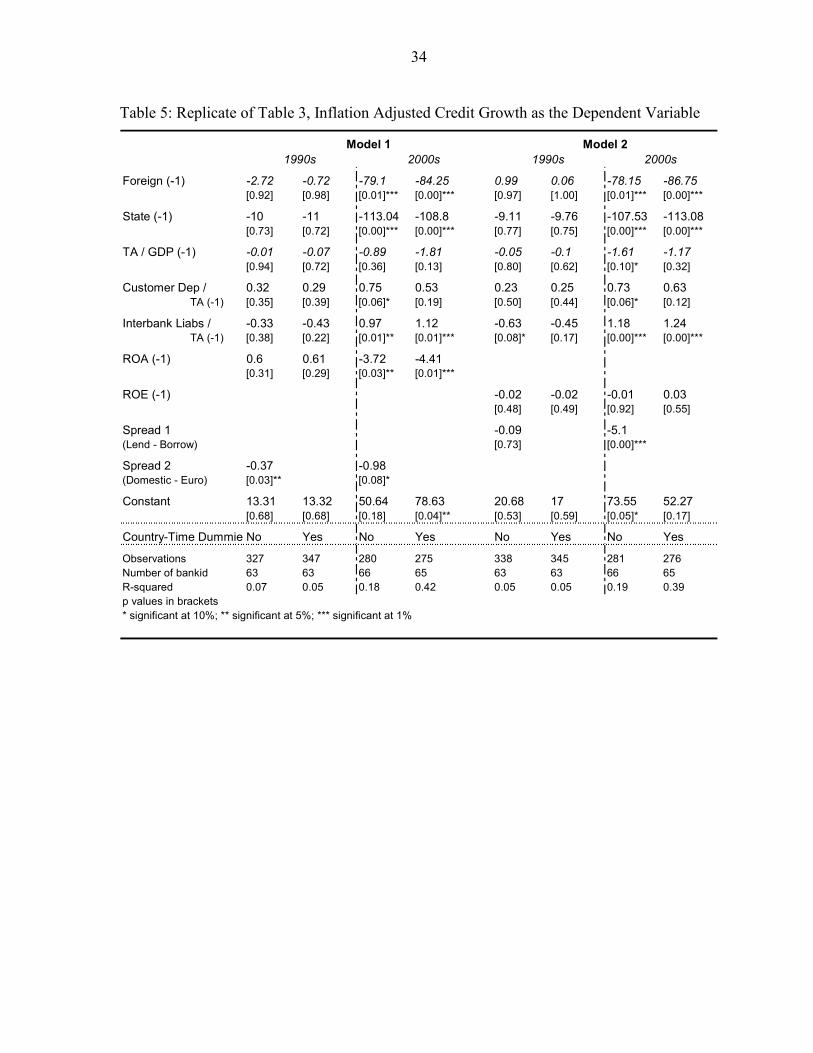
34
Table 5: Replicate of Table 3, Inflation Adjusted Credit Growth as the Dependent Variable
Foreign (-1) -2.72 -0.72 -79.1 -84.25 0.99 0.06 -78.15 -86.75[0.92] [0.98] [0.01]*** [0.00]*** [0.97] [1.00] [0.01]*** [0.00]***
State (-1) -10 -11 -113.04 -108.8 -9.11 -9.76 -107.53 -113.08[0.73] [0.72] [0.00]*** [0.00]*** [0.77] [0.75] [0.00]*** [0.00]***
TA / GDP (-1) -0.01 -0.07 -0.89 -1.81 -0.05 -0.1 -1.61 -1.17[0.94] [0.72] [0.36] [0.13] [0.80] [0.62] [0.10]* [0.32]
Customer Dep / 0.32 0.29 0.75 0.53 0.23 0.25 0.73 0.63TA (-1) [0.35] [0.39] [0.06]* [0.19] [0.50] [0.44] [0.06]* [0.12]
Interbank Liabs / -0.33 -0.43 0.97 1.12 -0.63 -0.45 1.18 1.24TA (-1) [0.38] [0.22] [0.01]** [0.01]*** [0.08]* [0.17] [0.00]*** [0.00]***
ROA (-1) 0.6 0.61 -3.72 -4.41[0.31] [0.29] [0.03]** [0.01]***
ROE (-1) -0.02 -0.02 -0.01 0.03[0.48] [0.49] [0.92] [0.55]
Spread 1 -0.09 -5.1(Lend - Borrow) [0.73] [0.00]***
Spread 2 -0.37 -0.98(Domestic - Euro) [0.03]** [0.08]*
Constant 13.31 13.32 50.64 78.63 20.68 17 73.55 52.27[0.68] [0.68] [0.18] [0.04]** [0.53] [0.59] [0.05]* [0.17]
Country-Time DummiesNo Yes No Yes No Yes No Yes
Observations 327 347 280 275 338 345 281 276Number of bankid 63 63 66 65 63 63 66 65R-squared 0.07 0.05 0.18 0.42 0.05 0.05 0.19 0.39p values in brackets* significant at 10%; ** significant at 5%; *** significant at 1%
Model 1 Model 21990s 2000s 1990s 2000s

35
Tabl
e 6:
Rep
licat
e of
Tab
le 4
, Inf
latio
n A
djus
ted
Cre
dit G
row
th a
s the
Dep
ende
nt V
aria
ble
1990
s20
00s
1990
s20
00s
1990
s20
00s
1990
s20
00s
Fore
ign
(-1)
-20.
5-8
7.74
93.7
2-3
2.95
-20.
47-9
6.68
0.99
-135
.07
[0.5
6][0
.01]
**[0
.04]
**[0
.55]
[0.5
1][0
.00]
***
[0.9
7][0
.02]
**
Stat
e (-
1)-4
7.2
-114
.37
130.
08-1
14.2
5-1
5.37
-150
.30
-1.6
4-2
13.7
5[0
.18]
[0.0
0]**
*[0
.00]
***
[0.0
3]**
[0.6
3][0
.00]
***
[0.9
6][0
.01]
***
TA /
GD
P (-
1)-2
.51
-1.3
2-0
.34
-1.4
6-0
.05
-0.9
3-0
.28
-1.3
4[0
.00]
***
[0.1
8][0
.17]
[0.1
4][0
.84]
[0.3
1][0
.31]
[0.1
4]
Inte
rban
k Li
abs
/-2
.21
-0.2
3C
usto
mer
Dep
/2.
530.
210.
170.
690.
20.
69TA
(-1)
[0.0
0]**
*[0
.66]
TA (-
1)[0
.00]
***
[0.6
8][0
.62]
[0.0
6]*
[0.5
8][0
.07]
*
* For
eign
1.19
1.25
* For
eign
-1.7
3-0
.26
Inte
rban
k Li
ab. /
-0
.61
1.02
-0.7
71.
17[0
.12]
[0.0
6]*
[0.0
3]**
[0.6
9]TA
(-1)
[0
.08]
*[0
.00]
***
[0.0
5]**
[0.0
0]**
*
* Sta
te2.
021.
38* S
tate
-2.5
90.
12Lo
an L
oss
Prov
/-4
.88
4.99
Cos
t/Inc
ome(
-1)
-0.0
2-0
.12
[0.0
1]**
[0.2
9][0
.00]
***
[0.9
1]TA
(-1)
[0
.05]
**[0
.42]
[0.8
5][0
.80]
RO
A (-1
)2.
87-2
.52
Net
Int.
Mar
gin
(-1)
-0.1
42.
11* F
orei
gn2.
84-4
.47
* For
eign
0.1
0.44
[0.0
5]**
[0.5
5][0
.87]
[0.4
2][0
.47]
[0.5
2][0
.45]
[0.3
7]
* For
eign
-3.8
8-0
.40
* For
eign
-3.5
5-7
.78
* Sta
te0.
7510
.43
* Sta
te-0
.05
1.2
[0.1
3][0
.93]
[0.0
9]*
[0.0
6]*
[0.7
9][0
.28]
[0.7
2][0
.13]
* Sta
te-1
.45
-18.
64* S
tate
-1.7
6-2
.91
RG
DP
Gro
wth
1.48
0.73
Spre
ad 1
-0.1
4-7
.24
[0.3
8][0
.02]
**[0
.14]
[0.5
1][0
.03]
**[0
.62]
(Len
d - B
orro
w)
[0.9
2][0
.01]
***
Rea
l Int
. Rat
e0.
49-2
.96
Spre
ad 2
0.27
-2.4
5* F
orei
gn1.
33.
16* F
orei
gn-0
.57
3.47
[0.6
6][0
.13]
(Dom
estic
- E
uro)
[0.5
8][0
.08]
*[0
.24]
[0.0
9]*
[0.7
4][0
.25]
* For
eign
0.6
2.63
* For
eign
-0.9
82.
85* S
tate
0.74
6.44
* Sta
te0.
081.
72[0
.69]
[0.2
4][0
.08]
*[0
.07]
*[0
.29]
[0.1
2][0
.96]
[0.5
7]
* Sta
te1.
2-3
.38
* Sta
te-0
.67
1.1
[0.3
2][0
.34]
[0.2
0][0
.51]
Con
stan
t79
.53
111.
61-9
6.51
89.2
830
.13
44.8
4116
25.1
810
3.01
[0.0
0]**
*[0
.00]
***
[0.0
1]**
[0.0
4]**
[0.3
8][0
.23]
[0.4
7][0
.07]
*O
bser
vatio
ns29
524
333
027
931
626
633
027
4N
umbe
r of b
anki
d57
5863
6560
6563
65R
-squ
ared
0.22
0.24
0.14
0.16
0.17
0.21
0.07
0.25
p va
lues
in b
rack
ets
* sig
nific
ant a
t 10%
; ** s
igni
fican
t at 5
%; *
** s
igni
fican
t at 1
%* F
orei
gn a
nd *
Stat
e de
note
s th
e in
tera
ctio
n of
the
fore
ign
and
stat
e ow
ners
hip
dum
mie
s, re
spec
tivel
y, w
ith v
aria
ble
repo
rted
abov
e th
em.
Mod
el 1
Mod
el 2
Mod
el 3
Mod
el 4

36
Table 7: Panel Data Probit Estimation Results for Foreign Ownership Variable
Model 1 Model 2 Model 3 Model 4 Model 5 Model 6
Total Assets over GDP (-1) 0.03 0.03 0.01 0.02 0.02 0.01
[0.01]*** [0.03]** [0.35] [0.07]* [0.09]* [0.34]Loan Loss Provision/Total Assets (-1) -0.13 -0.18 -0.12 -0.16 -0.2 -0.07
[0.03]** [0.01]*** [0.05]* [0.01]*** [0.00]*** [0.23]Total Capital Ratio (-1) 0.03 0.04 0.06 0.04 0.05 0.05
[0.06]* [0.01]** [0.00]*** [0.01]** [0.00]*** [0.00]***Spread bw Domestic and Euro Interest Rates -0.08 -0.06 -0.04
[0.00]*** [0.00]*** [0.02]**ROA (-1) -0.11 -0.12 -0.08
[0.02]** [0.01]** [0.06]*Net Interest Margin (-1) -0.23 -0.21
[0.00]*** [0.00]***Spread between lending and borrowing Rate -0.23 -0.2 -0.21
[0.00]*** [0.00]*** [0.00]***Constant -0.13 -0.12 0.74 0.84 0.69 1.65
[0.79] [0.81] [0.18] [0.11] [0.19] [0.01]***AIC 342.79 337.24 323.31 336.15 331.78 320.85
BIC 367.07 365.56 355.65 360.53 360.21 349.28Observations 423 422 421 430 429 429Number of bankid 62 62 62 62 62 62p values in brackets* significant at 10%; ** significant at 5%; *** significant at 1%

37
Table 8: Hausman Specification Test for Foreign Ownership Dummy
Model 1: Whole Sample(b) (B) (b-B) [diag(Vb-VB)]1/2
IV No IV Diff. Standard Error
Foreign 90.31 -26.80 117.11 77.84State 78.70 -31.12 109.82 74.30ROE (-1) -0.03 -0.05 0.02 0.01Real GDP Growth 3.54 2.92 0.62 0.37
B = inconsistent under Ha, efficient under Ho; obtained from xtregTest: Ho: difference in coefficients not systematic
chi2(4) = (b-B)'[(V_b-V_B)^(-1)](b-B) = 2.87 Prob>chi2 = 0.5801
Model 2: For the Sample of 2001-2005(b) (B) (b-B) [diag(Vb-VB)]1/2
IV No IV Diff. Standard Error
Foreign 173.74 33.21 140.53 126.70Customer Dep./Total Assets (-1) 0.85 0.70 0.15 0.32Interbank Liab./Total Assets (-1) 1.04 1.20 -0.16 0.18Real GDP Growth 2.01 2.32 -0.31 0.99
B = inconsistent under Ha, efficient under Ho; obtained from xtregTest: Ho: difference in coefficients not systematic
chi2(4) = (b-B)'[(V_b-V_B)^(-1)](b-B) = 2.15 Prob>chi2 = 0.71
Notes: IV: Uses the two-stage least-squares within estimatorNo IV: Uses within estimator
Instrumented: ForeignInstruments: Total Assets over GDP(-1), Net Interest Margin(-1),
Loan Loss Provn/TA(-1), Total Capital Ratio (-1)and Spread

38
Table 9: List of Parent Banks and their Affiliated Companies
Parent Company Home Country
CEE Subsidiary Host Country Last Accounting Date
Austria Ceska Sporitelna Czech Republic 12/2005
Austria Erste Bank Hungary Rt Hungary 12/2004
Austria Romanian Commercial Bank Romania 12/2005
Austria Slovak Savings Bank Slovakia 12/2005
Austria First Building Savings Bank Slovakia 12/2004
Raiffeisen International Austria Raiffeisenbank EAD Bulgaria 12/2004
Austria Raiffeisen Bank Zrt Hungary 12/2005
Austria Tatra Banka Slovakia 12/2004
Austria Raiffeisen Bank SA Romania 12/2004
HVB Bank Germany HVB Bank Biochim ad Bulgaria 12/2004
Germany HVB Bank Czech Republic Czech Republic 12/2004
Germany HVB Bank Hungary Rt. Hungary 12/2004
Germany Bank BPH SA Poland 12/2004
Germany UniBanka Slovakia 12/2005
Germany HVB Bank Slovakia Slovakia 12/2004
SOCIÉTÉ GÉNÉRALE France Komercni Banka Czech Republic 12/2005
France BRD-Groupe Societe Generale Romania 12/2004
France SKB Banka DD Slovenia 12/2004
KBC GROEP NV Belgium Ceskoslovenska Obchodni Czech Republic 12/2005
Belgium K&H Bank Hungary 12/2005
Banca Intesa SPA Italy CIB Közép Hungary 12/2005
Italy Vseobecna Uverova Banka Slovakia 12/2005
Unicredito Italiano SPA Italy Bulbank AD Bulgaria 12/2005
Italy Bank Pekao SA Poland 12/2005
Die Erste Österreichische Spar-Casse

39
Table 9, Continued
Parent Company Home Country
CEE Subsidiary Host Country Last Accounting Date
SAMPO PLC Finland AS Sampo Pank Estonia 12/2005
Finland AB Sampo Bankas Lithuania 12/2005
DNB NOR Bank ASA Norway AB DnB NORD Bankas Lithuania 12/2005
Norway AS DnB NORD Banka Latvia 12/2005
Sweden SEB Eesti Ühispank Estonia 12/2004
Sweden SEB Latvijas Unibanka Latvia 12/2004
Sweden SEB Vilniaus Bankas Lithuania 12/2005
SWEDBANK AB Sweden HansaPank Estonia 3/2005
Sweden Hansabanka Latvia 12/2005
Sweden AB Bankas Hansabankas Lithuania 12/2005
Commerzbank AG Germany BRE Bank Poland 12/2005
ALPHA BANK AE Greece Alpha Bank Romania Romania 12/2005
EFG Eurobank Ergasias Greece Bulgarian Post Bank Bulgaria 12/2004
National Bank of Greece Greece United Bulgarian Bank Bulgaria 12/2005
ING GROEP NV Netherlands ING Bank Slaski Poland 12/2005
Nomura of Japan Japan Investicni a Postovni Banka Czech Republic 12/1998
CITIGROUP INC US Bank Handlowy w Warszawie Poland 12/2004
Skandinaviska Enskilda Banken AB
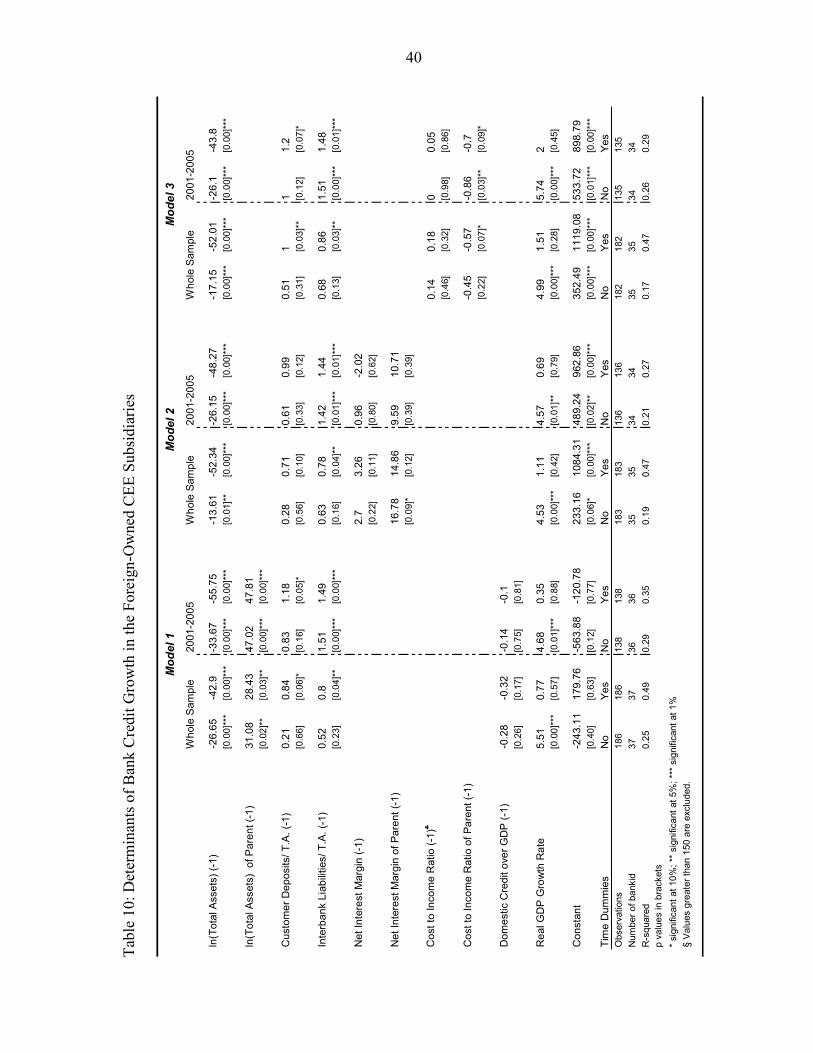
40
Tabl
e 10
: Det
erm
inan
ts o
f Ban
k C
redi
t Gro
wth
in th
e Fo
reig
n-O
wne
d C
EE S
ubsi
diar
ies
ln(T
otal
Ass
ets)
(-1)
-26.
65-4
2.9
-33.
67-5
5.75
-13.
61-5
2.34
-26.
15-4
8.27
-17.
15-5
2.01
-26.
1-4
3.8
[0.0
0]**
*[0
.00]
***
[0.0
0]**
*[0
.00]
***
[0.0
1]**
[0.0
0]**
*[0
.00]
***
[0.0
0]**
*[0
.00]
***
[0.0
0]**
*[0
.00]
***
[0.0
0]**
*
ln(T
otal
Ass
ets)
of P
aren
t (-1
)31
.08
28.4
347
.02
47.8
1[0
.02]
**[0
.03]
**[0
.00]
***
[0.0
0]**
*
Cus
tom
er D
epos
its/ T
.A. (
-1)
0.21
0.84
0.83
1.18
0.28
0.71
0.61
0.99
0.51
11
1.2
[0.6
6][0
.06]
*[0
.16]
[0.0
5]*
[0.5
6][0
.10]
[0.3
3][0
.12]
[0.3
1][0
.03]
**[0
.12]
[0.0
7]*
Inte
rban
k Li
abili
ties/
T.A
. (-1
)0.
520.
81.
511.
490.
630.
781.
421.
440.
680.
861.
511.
48[0
.23]
[0.0
4]**
[0.0
0]**
*[0
.00]
***
[0.1
6][0
.04]
**[0
.01]
***
[0.0
1]**
*[0
.13]
[0.0
3]**
[0.0
0]**
*[0
.01]
***
Net
Inte
rest
Mar
gin
(-1)
2.7
3.26
0.96
-2.0
2[0
.22]
[0.1
1][0
.80]
[0.6
2]
Net
Inte
rest
Mar
gin
of P
aren
t (-1
)16
.78
14.8
69.
5910
.71
[0.0
9]*
[0.1
2][0
.39]
[0.3
9]
Cos
t to
Inco
me
Rat
io (-
1)♣
0.14
0.18
00.
05[0
.46]
[0.3
2][0
.98]
[0.8
6]
Cos
t to
Inco
me
Rat
io o
f Par
ent (
-1)
-0.4
5-0
.57
-0.8
6-0
.7[0
.22]
[0.0
7]*
[0.0
3]**
[0.0
9]*
Dom
estic
Cre
dit o
ver G
DP
(-1)
-0.2
8-0
.32
-0.1
4-0
.1[0
.26]
[0.1
7][0
.75]
[0.8
1]
Rea
l GD
P G
row
th R
ate
5.51
0.77
4.68
0.35
4.53
1.11
4.57
0.69
4.99
1.51
5.74
2[0
.00]
***
[0.5
7][0
.01]
***
[0.8
8][0
.00]
***
[0.4
2][0
.01]
**[0
.79]
[0.0
0]**
*[0
.28]
[0.0
0]**
*[0
.45]
Con
stan
t-2
43.1
117
9.76
-563
.88
-120
.78
233.
1610
84.3
148
9.24
962.
8635
2.49
1119
.08
533.
7289
8.79
[0.4
0][0
.63]
[0.1
2][0
.77]
[0.0
6]*
[0.0
0]**
*[0
.02]
**[0
.00]
***
[0.0
0]**
*[0
.00]
***
[0.0
1]**
*[0
.00]
***
Tim
e D
umm
ies
No
Yes
No
Yes
No
Yes
No
Yes
No
Yes
No
Yes
Obs
erva
tions
186
186
138
138
183
183
136
136
182
182
135
135
Num
ber o
f ban
kid
3737
3636
3535
3434
3535
3434
R-s
quar
ed0.
250.
490.
290.
350.
190.
470.
210.
270.
170.
470.
260.
29p
valu
es in
bra
cket
s*
sign
ifica
nt a
t 10%
; **
sign
ifica
nt a
t 5%
; ***
sig
nific
ant a
t 1%
§ V
alue
s gr
eate
r tha
n 15
0 ar
e ex
clud
ed.
2001
-200
5W
hole
Sam
ple
2001
-200
5W
hole
Sam
ple
2001
-200
5W
hole
Sam
ple
Mod
el 3
Mod
el 1
Mod
el 2
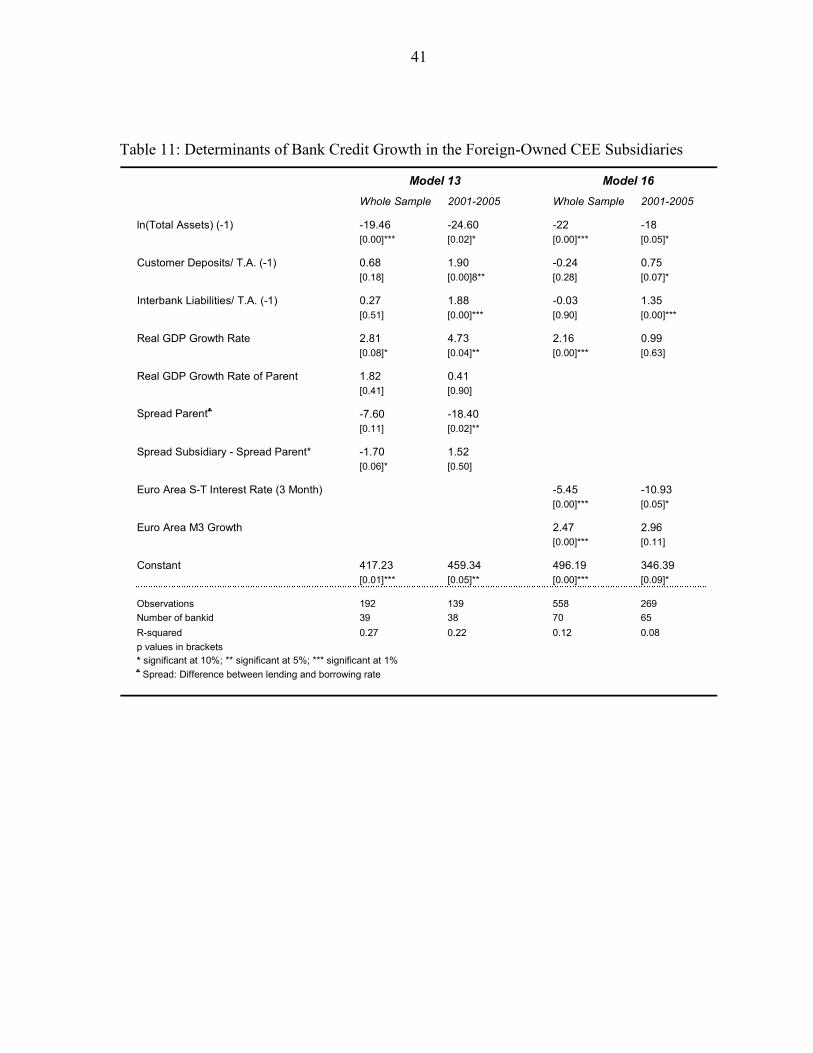
41
Table 11: Determinants of Bank Credit Growth in the Foreign-Owned CEE Subsidiaries
Whole Sample 2001-2005 Whole Sample 2001-2005
ln(Total Assets) (-1) -19.46 -24.60 -22 -18[0.00]*** [0.02]* [0.00]*** [0.05]*
Customer Deposits/ T.A. (-1) 0.68 1.90 -0.24 0.75[0.18] [0.00]8** [0.28] [0.07]*
Interbank Liabilities/ T.A. (-1) 0.27 1.88 -0.03 1.35[0.51] [0.00]*** [0.90] [0.00]***
Real GDP Growth Rate 2.81 4.73 2.16 0.99[0.08]* [0.04]** [0.00]*** [0.63]
Real GDP Growth Rate of Parent 1.82 0.41[0.41] [0.90]
Spread Parent♣ -7.60 -18.40[0.11] [0.02]**
Spread Subsidiary - Spread Parent* -1.70 1.52[0.06]* [0.50]
Euro Area S-T Interest Rate (3 Month) -5.45 -10.93[0.00]*** [0.05]*
Euro Area M3 Growth 2.47 2.96[0.00]*** [0.11]
Constant 417.23 459.34 496.19 346.39[0.01]*** [0.05]** [0.00]*** [0.09]*
Observations 192 139 558 269Number of bankid 39 38 70 65R-squared 0.27 0.22 0.12 0.08p values in brackets* significant at 10%; ** significant at 5%; *** significant at 1%♣ Spread: Difference between lending and borrowing rate
Model 16Model 13

42
Table 12: FE Regression Results for Cross-Sectional Varying Coefficients
Model 1 Model 2 Model 3
ln(Total Assets) (-1)H -23.34 -21.4[0.00]*** [0.00]***
ln(Total Assets) (-1)E 1.85 -16.22[0.94] [0.59]
ln(Total Assets) (-1)SW -37.47 -24.94[0.00]*** [0.00]***
ln(Total Assets) (-1)SK -48.78 -36[0.00]*** [0.00]***
Real GDP GrowthH 3.99 -5.74[0.25] [0.20]
Real GDP GrowthE 3.44 3.38[0.55] [0.67]
Real GDP GrowthSW 7.39 0.72[0.02]** [0.85]
Real GDP GrowthSK 3.58 -1.85[0.14] [0.50]
Interbank Liabilities/ T.A. (-1)H -0.48 -0.71[0.27] [0.27]
Interbank Liabilities/ T.A. (-1)E 3.91 0.95[0.19] [0.71]
Interbank Liabilities/ T.A. (-1)SW 1.32 2.36[0.19] [0.06]*
Interbank Liabilities/ T.A. (-1)SK -0.41 -1.1[0.55] [0.20]
Constant 587.17 551.87 54.77[0.00]*** [0.00]*** [0.00]***
Observations 99 99 103Number of bankid 17 18 17R-squared 0.4 0.37 0.09
p values in brackets* significant at 10%; ** significant at 5%; *** significant at 1%H denotes HVB Bank (Germany), E denotes Die Erst Bank (Austria)SW denotes Swedbank (Sweden), SK denotes Skandinavska bank (Sweden)
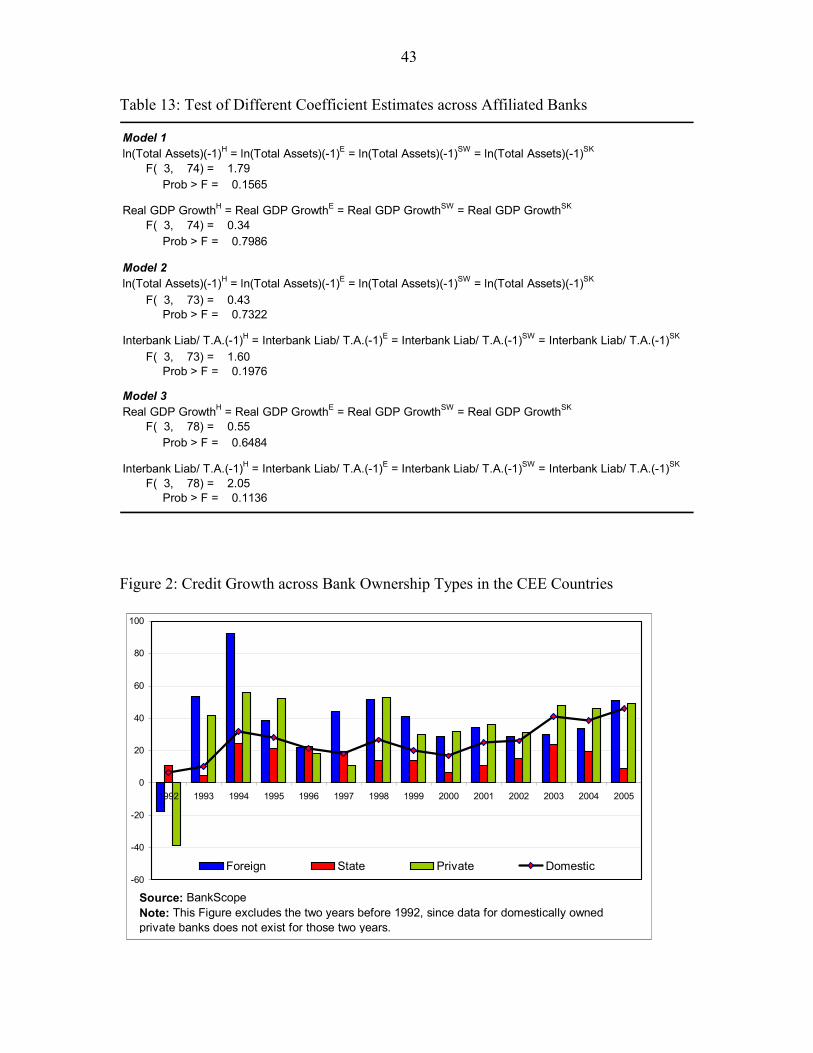
43
Table 13: Test of Different Coefficient Estimates across Affiliated Banks
Model 1ln(Total Assets)(-1)H = ln(Total Assets)(-1)E = ln(Total Assets)(-1)SW = ln(Total Assets)(-1)SK
F( 3, 74) = 1.79 Prob > F = 0.1565
Real GDP GrowthH = Real GDP GrowthE = Real GDP GrowthSW = Real GDP GrowthSK
F( 3, 74) = 0.34 Prob > F = 0.7986
Model 2ln(Total Assets)(-1)H = ln(Total Assets)(-1)E = ln(Total Assets)(-1)SW = ln(Total Assets)(-1)SK
F( 3, 73) = 0.43 Prob > F = 0.7322
Interbank Liab/ T.A.(-1)H = Interbank Liab/ T.A.(-1)E = Interbank Liab/ T.A.(-1)SW = Interbank Liab/ T.A.(-1)SK
F( 3, 73) = 1.60 Prob > F = 0.1976
Model 3Real GDP GrowthH = Real GDP GrowthE = Real GDP GrowthSW = Real GDP GrowthSK
F( 3, 78) = 0.55 Prob > F = 0.6484
Interbank Liab/ T.A.(-1)H = Interbank Liab/ T.A.(-1)E = Interbank Liab/ T.A.(-1)SW = Interbank Liab/ T.A.(-1)SK
F( 3, 78) = 2.05 Prob > F = 0.1136
Figure 2: Credit Growth across Bank Ownership Types in the CEE Countries
-60
-40
-20
0
20
40
60
80
100
1992 1993 1994 1995 1996 1997 1998 1999 2000 2001 2002 2003 2004 2005
Foreign State Private Domestic
Source: BankScopeNote: This Figure excludes the two years before 1992, since data for domestically owned private banks does not exist for those two years.
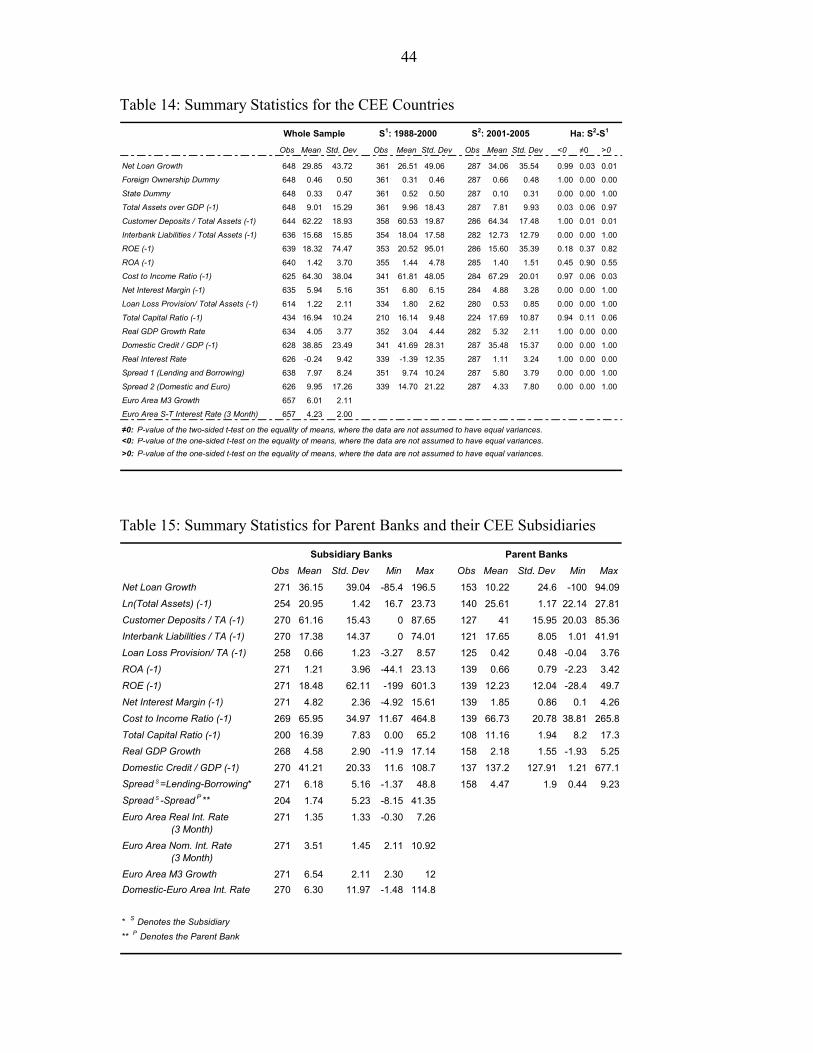
44
Table 14: Summary Statistics for the CEE Countries
Obs Mean Std. Dev Obs Mean Std. Dev Obs Mean Std. Dev <0 ≠0 >0
Net Loan Growth 648 29.85 43.72 361 26.51 49.06 287 34.06 35.54 0.99 0.03 0.01
Foreign Ownership Dummy 648 0.46 0.50 361 0.31 0.46 287 0.66 0.48 1.00 0.00 0.00
State Dummy 648 0.33 0.47 361 0.52 0.50 287 0.10 0.31 0.00 0.00 1.00
Total Assets over GDP (-1) 648 9.01 15.29 361 9.96 18.43 287 7.81 9.93 0.03 0.06 0.97
Customer Deposits / Total Assets (-1) 644 62.22 18.93 358 60.53 19.87 286 64.34 17.48 1.00 0.01 0.01
Interbank Liabilities / Total Assets (-1) 636 15.68 15.85 354 18.04 17.58 282 12.73 12.79 0.00 0.00 1.00
ROE (-1) 639 18.32 74.47 353 20.52 95.01 286 15.60 35.39 0.18 0.37 0.82
ROA (-1) 640 1.42 3.70 355 1.44 4.78 285 1.40 1.51 0.45 0.90 0.55
Cost to Income Ratio (-1) 625 64.30 38.04 341 61.81 48.05 284 67.29 20.01 0.97 0.06 0.03
Net Interest Margin (-1) 635 5.94 5.16 351 6.80 6.15 284 4.88 3.28 0.00 0.00 1.00
Loan Loss Provision/ Total Assets (-1) 614 1.22 2.11 334 1.80 2.62 280 0.53 0.85 0.00 0.00 1.00
Total Capital Ratio (-1) 434 16.94 10.24 210 16.14 9.48 224 17.69 10.87 0.94 0.11 0.06
Real GDP Growth Rate 634 4.05 3.77 352 3.04 4.44 282 5.32 2.11 1.00 0.00 0.00
Domestic Credit / GDP (-1) 628 38.85 23.49 341 41.69 28.31 287 35.48 15.37 0.00 0.00 1.00
Real Interest Rate 626 -0.24 9.42 339 -1.39 12.35 287 1.11 3.24 1.00 0.00 0.00
Spread 1 (Lending and Borrowing) 638 7.97 8.24 351 9.74 10.24 287 5.80 3.79 0.00 0.00 1.00
Spread 2 (Domestic and Euro) 626 9.95 17.26 339 14.70 21.22 287 4.33 7.80 0.00 0.00 1.00
Euro Area M3 Growth 657 6.01 2.11
Euro Area S-T Interest Rate (3 Month) 657 4.23 2.00
≠0: P-value of the two-sided t-test on the equality of means, where the data are not assumed to have equal variances.<0: P-value of the one-sided t-test on the equality of means, where the data are not assumed to have equal variances.>0: P-value of the one-sided t-test on the equality of means, where the data are not assumed to have equal variances.
S1: 1988-2000 S2: 2001-2005 Ha: S2-S1Whole Sample
Table 15: Summary Statistics for Parent Banks and their CEE Subsidiaries
Obs Mean Std. Dev Min Max Obs Mean Std. Dev Min Max
Net Loan Growth 271 36.15 39.04 -85.4 196.5 153 10.22 24.6 -100 94.09Ln(Total Assets) (-1) 254 20.95 1.42 16.7 23.73 140 25.61 1.17 22.14 27.81Customer Deposits / TA (-1) 270 61.16 15.43 0 87.65 127 41 15.95 20.03 85.36Interbank Liabilities / TA (-1) 270 17.38 14.37 0 74.01 121 17.65 8.05 1.01 41.91Loan Loss Provision/ TA (-1) 258 0.66 1.23 -3.27 8.57 125 0.42 0.48 -0.04 3.76ROA (-1) 271 1.21 3.96 -44.1 23.13 139 0.66 0.79 -2.23 3.42ROE (-1) 271 18.48 62.11 -199 601.3 139 12.23 12.04 -28.4 49.7Net Interest Margin (-1) 271 4.82 2.36 -4.92 15.61 139 1.85 0.86 0.1 4.26Cost to Income Ratio (-1) 269 65.95 34.97 11.67 464.8 139 66.73 20.78 38.81 265.8Total Capital Ratio (-1) 200 16.39 7.83 0.00 65.2 108 11.16 1.94 8.2 17.3Real GDP Growth 268 4.58 2.90 -11.9 17.14 158 2.18 1.55 -1.93 5.25Domestic Credit / GDP (-1) 270 41.21 20.33 11.6 108.7 137 137.2 127.91 1.21 677.1Spread S =Lending-Borrowing* 271 6.18 5.16 -1.37 48.8 158 4.47 1.9 0.44 9.23Spread S -Spread P ** 204 1.74 5.23 -8.15 41.35Euro Area Real Int. Rate 271 1.35 1.33 -0.30 7.26
(3 Month)
Euro Area Nom. Int. Rate 271 3.51 1.45 2.11 10.92(3 Month)
Euro Area M3 Growth 271 6.54 2.11 2.30 12Domestic-Euro Area Int. Rate 270 6.30 11.97 -1.48 114.8
* S Denotes the Subsidiary
** P Denotes the Parent Bank
Parent BanksSubsidiary Banks