Embed Size (px)
Citation preview
Banking stability and the financial cycle: the Spanish experience
Ana Lozano-Vivas*
Universidad de Malaga
Flores Martínez AlbaBanco Europeo de Finanzas
Abstract
This paper defines the special characteristics of the financial cycle in Spain during the period 1995-2016 and investigates to what extent the stability of the banking system attenuates or exacerbates the financial cycle. The findings of these two empirical analyses highlight that the financial cycle in Spain is accurately defined by the credit-to-GDP ratio, credit-to-private non-financial sector and residential property prices. Moreover, the credit-to-GDP gap represents a good early warning indicator of the banking crisis in Spain. Finally, an exogenous deviation of actual loan loss provisions-to-total loans ratio from its potential value leads to smoothing of the cycle. Thus, the Spanish dynamic provisions regulation seems to be a good instrument to use as a macroprudential tool to deal with the pro-cyclicality of the financial system.
Keywords: financial cycle, crisis, banking stability, macroprudential regulation. JEL classification: E3, E32, G01, G21, G28.
Resumen
En el presente artículo se definen las características del ciclo financiero en España durante el periodo 1995-2016 y, además, se analiza hasta qué punto la estabilidad del Sistema Bancario atenúa o exacerba el ciclo financiero. Los resultados obtenidos en estos dos análisis empíricos ponen de relieve que el ciclo financiero en España se define con precisión por la relación crédito/PIB, el crédito al sector privado no financiero y los precios de los inmuebles residenciales y que la brecha crédito/PIB, respecto a su tendencia a largo, representa un buen indicador adelantado de la crisis bancaria en España. Por otra parte, los resultados indican que una desviación exógena del valor real respecto al valor potencial del ratio provisiones sobre préstamos totales ayuda a suavizar el ciclo. Este último resultado parece indicar que la regulación española de las «provi-siones dinámicas» puede ser considerada como una buena herramienta macroprudencial para combatir la prociclicidad del sistema financiero.
Palabras claves: ciclo financiero, crisis, estabilidad bancaria, regulación macroprudencial.Clasificación JEL: E3, E32, G01, G21, G28.
* Ana Lozano-Vivas gratefully acknowledges financial support from the Spanish Ministry of Education (Project ECO2014-52345-P).
12 CUADERNOS ECONÓMICOS DE ICE N.O 92
1. Introduction
The big recession generated during the last financial crisis, with its associated enormous costs in terms of output loss and unemployment, has led academics and policymakers to pay attention to and deeply analyze the financial cycle, in order to understand the reasons for its booms and busts and the interaction between the real economy and the financial system. This effort raises the need to build bridges between macroeconomics and financial stability. In this regard, a new debate on the need for new macroprudential policy in addition to macroeconomic stabilization policy emerges. The argument is put forward to circumvent the risks that can emerge due to non-synchronization between the economic and financial cycles (Claessens et al., 2012).
Not surprisingly, understanding financial cycles and how the financial market affects the real economy have become important research topics, within which the effect of financial system stability has become the cornerstone. In this regard, interest has peaked towards comprehending monetary policy and financial cycle fluctuations, including their central role in the amplification and generation of shocks, not only in normal times but, more importantly, in times of financial distress (Schularick and Taylor, 2012). Accordingly, the question of how recent changes in the financial system affects financial stability and monetary policy has been analyzed by Mendoza and Terrones (2008), Hume and Sentance (2009) and Adrian and Shin (2010). In a similar vein, Beck et al. (2014) highlight that, after the recent experience of financial crisis, financial and monetary stability cannot necessarily be targeted independently of each other, since monetary policy transmission depends of the state of the banking system.
On the other hand, a new strand of literature has arisen where macro-economic models feature financial instability (Gertler and Karadi, 2011; Gertler and Kiyotaki, 2011, and Brunnermeier and Sannikov, 2014, among others). Goodhart et al. (2004) and Segoviano et al. (2006) were the first authors to introduce default heterogeneous banks in macroeconomic models in order to account for systemic risk analysis. Previous standard literature on macro models with credit frictions (Bernanke and Gertler 1989, Kiyotaki and Moore 1997, and Bernanke et al., 1999) showed financial accelerators in regular business cycle fluctuations, but did not include key elements portraying financial instability.
The aforementioned work suggests that the stability of the financial system is important since it can attenuate or exacerbate the financial cycle. Similarly, Adrian and Shin (2010) call attention to the importance of the financial system, due to its impact on the real economy and its key role as provider of credit. Consequently, the important role that stability of financial systems has taken in this new scenario has steered banking supervisors in many countries to promote financial soundness by adopting new regulatory rules. Basel III was designed with the objective of improving the banking sector’s ability to absorb shocks arising from financial and economic stress, whatever the source, and in this way reducing the risk of spillover
BANKING STABILITY AND THE FINANCIAL CYCLE: THE SPANISH EXPERIENCE 13
from the financial sector to the real economy. The new reforms of micro and macroprudential regulation are designed to manage the economic and financial cycle at any given moment to avoid the risk of potential growth and to reduce volatility. The reforms require a better understanding of the stylized empirical regularities of the financial cycle, with its booms and busts, in order to explain how the stability of a financial system is associated with financial cycles. In this regard, Borio (2003) stresses that an understanding of financial cycles and its drivers is essential for the correct management of macroprudential policy. Claessens et al. (2011) provide a comprehensive analysis of financial cycles and recognize that, although there is a large literature analyzing various aspects of the financial markets, understanding of financial cycles is still limited.
The aim of the present paper is to contribute to the literature aimed at understanding financial cycles by defining the financial cycle accurately, as well as attempting to evaluate the extent to which the financial cycle responds to improvements in banking stability.
The first step of our research strategy is to precisely define the financial cycle. To do that, we follow the strategy set up by Drehmann et al. (2012) where we search for and select a number of variables indicating the build-up of systemic risk associated with periods of excessive credit growth. The use of alternative variables allows us to select those variables better able to describe the situation of the specific country under analysis. By using frequency-based filter analysis, it is possible to isolate fluctuations at different frequencies in the data, distinguishing the cyclical component and the time-trend component. We perform such analyses on the case study of Spain. An advantage of using just one country is that it helps to accurately define the financial cycle because, in contrast to business cycles, no obvious «natural» financial cycle measure is available. Recent literature shares a broad description of the financial cycle but struggles to come up with a unique indicator, since the adopted indicators differ between countries (Stremmel, 2015a).
After defining what is considered a financial cycle, we next analyze the actual situation of the banking sector in terms of risk-taking, i.e. the level of banking stability in the financial cycle. In particular, we pay attention to the elements of regulatory frameworks oriented to limit risk-taking, through which the banking sector may achieve stability. In addition, we evaluate the extent to which the financial cycle responds to impulse banking regulation measures aimed at broadening financial stability. While the actual situation of the banking sector in terms of risk-taking during the financial cycle is analyzed from the data, we use Vector Autoregressive models (VARs) (Sims, 1980) to assess whether better financial soundness of banks could help stabilize the financial cycle.
Under the premise that stability of financial systems is important when explaining booms and busts of the financial cycle, and that the new regulatory framework has been oriented to promote financial soundness, we consider as relevant proxies of stability those that compound the most important regulatory tools used by policymakers to attenuate financial cycles, and in particular credit growth. In this
14 CUADERNOS ECONÓMICOS DE ICE N.O 92
regard, we use: (i) the equity-to-total assets; (ii) the liquidity ratio; and (iii) the loan loss provisions over total loans. Furthermore, we use the Z-score as a proxy of the average probability to the default of the banking system.
To perform our analysis we use a sample containing quarterly data information from 1995Q1 to 2016Q4 for Spain. To our knowledge, this is the first paper to accurately analyze the financial cycle in Spain by using a large set of variables. No study until now has evaluated the response of the financial cycle to regulatory measures aimed at promoting stability in Spain. Moreover, this is the first paper that, in addition to using the standard proxies of regulatory tools, uses an average measure of the probability of default (Z-score) in this kind of analysis.
Our results support the conclusion that, among those indicators selected, the best for defining and describing the financial cycle in Spain is the credit-to-GDP ratio, the credit-to-private non-financial sector, and the residential property prices. Along with the financial cycle, the credit-to-GDP gap has been measured and the results suggest that acts as a good early indicator of the financial crisis in Spain. The results show that risk-taking of banks in Spain increases during the boom of the financial cycle, and decreases during the bust. Additionally, the results corroborate the importance of financial stability to attenuate or exacerbate the financial cycle. In particular, the financial cycle responds to impulse of liquidity ratio, loan loss provisions-to-total loans ratio and to Z-score during the upturn, while during the downturn it responds to impulse of loans loss provision-to-total loans ratio and marginally responds to impulse of Z-score. In particular, while the increasing banking soundness from the liquidity ratio and probability of default of the banks during the boom phase expands the financial cycle, a shock on loans loss provisions-to-total loans ratio attenuates the financial cycle during the boom. Conversely, during the bust phase of the cycle, improvements on the loans loss provision-to-total loans ratio helps to alleviate the contractions of the financial cycle and Z-score shock has a marginal negative effect. Thus, loan loss provisions to total loans seems to act as a good shock absorber of the financial stress reducing the risk of spillover to the financial cycle.
This paper is organized as follows: firstly, section 2 introduces the method used to describe the financial cycle. Section 3 presents the indicators and method used to analyze how banking stability is related to the financial cycle. Sections 3 and 4 then present the data and the results, respectively, with section 5 offering a conclusion.
2. Financial cycle
In order to describe the financial cycle, it is necessary to set its definition, how it can be measured and the methodology to be used. Based on the literature about the financial cycle there is no consensus on its definition, neither on methods to measure it. Borio (2012) defines the financial cycle as the self-reinforcing interactions between perceptions of value and risk, attitudes towards risk, and financing constraints, which translate into booms followed by busts. According to Borio (2012) the main feature
BANKING STABILITY AND THE FINANCIAL CYCLE: THE SPANISH EXPERIENCE 15
of the financial cycle is the parsimoniousness of the cycle in terms of credit and property prices. The lower frequency with respect to the financial cycle, its «peaks», are closely associated with systemic banking crises and, in the end, it is possible to measure the build-up of financial crisis risk using gaps (e.g. deviation of the ratio of credit-to-GDP to its trend) to support the force of leading indicators. Stremmel (2015b) stresses that the understanding of cyclical movements of financial variables is crucial for a correct design of macroprudential policies.
As pointed out above, there is also a lack of consensus on how to measure the financial cycle. Several studies have shed light on this issue. In terms of variables used, it is important to extract as much information as possible and, at the same time, to keep the number of variables as parsimonious as possible, while ensuring they are easily understandable. Borio et al. (1994) describe empirically the behavior of the relationship between credit, asset prices and real economic activity, setting the basis for future work. Drehmann et al. (2012) explore a range of variables that could characterize the financial cycle: credit, the credit-to-GDP ratio, property prices, equity prices and an aggregate asset price index, choosing finally the first three variables as the best fit. More recently, Stremmel (2015a) considers different credit aggregates, asset prices and banking sector indicators for 11 European countries in order to capture the characteristics of the financial cycle, developing a synthetic measure. Drehmann et al. (2012) and Stremmel (2015a) obtained similar results in terms of the best-fitted selection of variables (credit, credit-to-GDP and property prices).
Regarding the methodology used to measure the cycle, Claessens et al. (2011) employed cycle-dating methods (turning-point analysis) for a large number of countries to identify peaks and troughs in credit, property prices, and equity prices; on the other hand, Aikman et al. (2015) relied on frequency-based filters to document the relationship between the credit cycle and the business cycle, finding a distinct credit cycle with length and amplitude exceeding those of the business cycle, and with credit booms closely related to banking crises. Drehmann et al. (2012) also employed frequency-based filters in their understanding of cyclical movements of financial variables used to define the financial cycle.
The first goal of this paper is to contribute to the understanding of stylized empirical regularities of the financial cycle, with its booms and busts. To do that, we exploit the definition of a financial cycle used by Borio (2012). To detect the variables that indicate the build-up of systemic risk associated with periods of excessive credit growth (in line with the recommendation of the European Systemic Risk Board), we searched for and selected a number of variables which, based on their characteristics and the data availability for Spain, can be considered the building blocks of the aforementioned cycle. Those variables are: (i) measures of potential overvaluation of property prices (residential property prices); (ii) measures of credit development (credit-to-private sector non-financial sector, credit-to-GDP ratio, and M3 money supply); (iii) measures of external imbalances (current account balance, Spanish investments abroad, foreign investments in Spain); (iv) measures of the strength
16 CUADERNOS ECONÓMICOS DE ICE N.O 92
of bank balance sheets (the Monetary Financial Institutions, MFI) (net financial transactions, net interest revenue of the MFI, banking sector leverage, financial corporations’ debt-to-equity ratio); and (v) measures of the private sector debt burden (non-financial sector transactions, household debt ratio).
The methodology used to define the financial cycle relies on the «frequency-based filter analysis», which uses statistical filters to isolate fluctuations at different frequencies in the data, distinguishing between short- and medium-term fluctuations. As it is well-known, the study of the business cycle has focused on the behavior of macroeconomic data, with cycles lasting between one and eight years. In this research, we focus on two types of cyclical patterns: those with the same periodicity as the business cycle and those with considerably longer periodicity. This approach is similar to the one used by Comin and Gertler (2006) who studied the behavior of medium-term macroeconomic cycles for the US economy. Following Comin and Gertler (2006) and Drehmann et al. (2012), we employ a band-pass filter to isolate short-term cycles, with a duration between 5 and 32 quarters. For medium-term cycles we employ a duration between 32 and 120 quarters1.
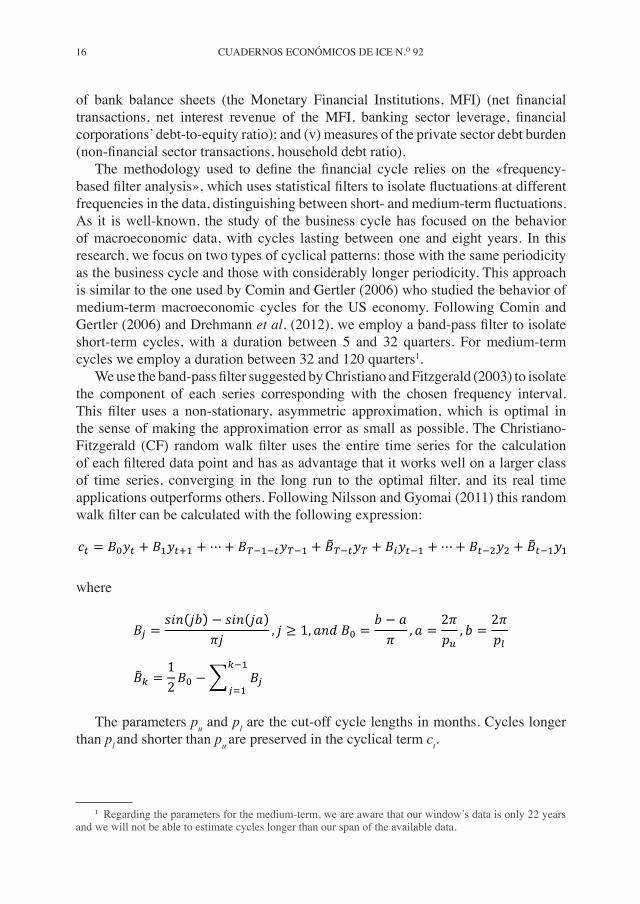
We use the band-pass filter suggested by Christiano and Fitzgerald (2003) to isolate the component of each series corresponding with the chosen frequency interval. This filter uses a non-stationary, asymmetric approximation, which is optimal in the sense of making the approximation error as small as possible. The Christiano- Fitzgerald (CF) random walk filter uses the entire time series for the calculation of each filtered data point and has as advantage that it works well on a larger class of time series, converging in the long run to the optimal filter, and its real time applications outperforms others. Following Nilsson and Gyomai (2011) this random walk filter can be calculated with the following expression:
8
employaband-passfiltertoisolateshort-termcycles,withadurationbetween5and32
quarters.Formedium-termcyclesweemployadurationbetween32and120quarters.1
We use the band-pass filter suggested by Christiano and Fitzgerald (2003) to
isolate thecomponentofeachseriescorrespondingwith thechosen frequency interval.
Thisfilterusesanon-stationary,asymmetricapproximation,whichisoptimalinthesense
of making the approximation error as small as possible. The Christiano-Fitzgerald (CF)
randomwalk filter uses the entire time series for the calculation of each filtered data
pointandhasasadvantagethatitworkswellonalargerclassoftimeseries,convergingin
the long run to the optimal filter, and its real time applications outperforms others.
FollowingNilssonandGyomai (2011) this randomwalk filter canbecalculatedwith the
followingexpression:
𝑐𝑐! = 𝐵𝐵!𝑦𝑦! + 𝐵𝐵!𝑦𝑦!!! +⋯+ 𝐵𝐵!!!!!𝑦𝑦!!! + 𝐵𝐵!!!𝑦𝑦! + 𝐵𝐵!𝑦𝑦!!! +⋯+ 𝐵𝐵!!!𝑦𝑦! + 𝐵𝐵!!!𝑦𝑦!
where
𝐵𝐵! =𝑠𝑠𝑠𝑠𝑠𝑠 𝑗𝑗𝑗𝑗 − 𝑠𝑠𝑠𝑠𝑠𝑠 𝑗𝑗𝑗𝑗
𝜋𝜋𝜋𝜋, 𝑗𝑗 ≥ 1, 𝑎𝑎𝑎𝑎𝑎𝑎 𝐵𝐵! =
𝑏𝑏 − 𝑎𝑎𝜋𝜋
, 𝑎𝑎 =2𝜋𝜋𝑝𝑝!, 𝑏𝑏 =
2𝜋𝜋𝑝𝑝!
𝐵𝐵! =12𝐵𝐵! − 𝐵𝐵!
!!!
!!!
The parameterspu andpl are the cut-off cycle lengths inmonths. Cycles longer
thanplandshorterthanpuarepreservedinthecyclicaltermct.
Inadditiontothefinancialcycle,wemeasuredanearlywarningindicator(EWI)of
bankingcrises inourstudy. Inordertoselectsuchan indicator,weconsideredboththe
work of Alessi and Detken (2011), about building an early warning system aimed at
supporting policy decisions about when to activate macroprudential tools targeting
excessive credit growthand leverage, and thatofDrehmannand Juselius (2013), about
the evaluation of several EWIs based on their performance relative to the
macroprudential policy maker’s decision. Drehmann et al. (2012) included several
1Regarding the parameters for the medium-term, we are aware that our window’s data is only 22 years and we will not be able to estimate cycles longer than our span of the available data.
where
8
employaband-passfiltertoisolateshort-termcycles,withadurationbetween5and32
quarters.Formedium-termcyclesweemployadurationbetween32and120quarters.1
We use the band-pass filter suggested by Christiano and Fitzgerald (2003) to
isolate thecomponentofeachseriescorrespondingwith thechosen frequency interval.
Thisfilterusesanon-stationary,asymmetricapproximation,whichisoptimalinthesense
of making the approximation error as small as possible. The Christiano-Fitzgerald (CF)
randomwalk filter uses the entire time series for the calculation of each filtered data
pointandhasasadvantagethatitworkswellonalargerclassoftimeseries,convergingin
the long run to the optimal filter, and its real time applications outperforms others.
FollowingNilssonandGyomai (2011) this randomwalk filter canbecalculatedwith the
followingexpression:
𝑐𝑐! = 𝐵𝐵!𝑦𝑦! + 𝐵𝐵!𝑦𝑦!!! +⋯+ 𝐵𝐵!!!!!𝑦𝑦!!! + 𝐵𝐵!!!𝑦𝑦! + 𝐵𝐵!𝑦𝑦!!! +⋯+ 𝐵𝐵!!!𝑦𝑦! + 𝐵𝐵!!!𝑦𝑦!
where
𝐵𝐵! =𝑠𝑠𝑠𝑠𝑠𝑠 𝑗𝑗𝑗𝑗 − 𝑠𝑠𝑠𝑠𝑠𝑠 𝑗𝑗𝑗𝑗
𝜋𝜋𝜋𝜋, 𝑗𝑗 ≥ 1, 𝑎𝑎𝑎𝑎𝑎𝑎 𝐵𝐵! =
𝑏𝑏 − 𝑎𝑎𝜋𝜋
, 𝑎𝑎 =2𝜋𝜋𝑝𝑝!, 𝑏𝑏 =
2𝜋𝜋𝑝𝑝!
𝐵𝐵! =12𝐵𝐵! − 𝐵𝐵!
!!!
!!!
The parameterspu andpl are the cut-off cycle lengths inmonths. Cycles longer
thanplandshorterthanpuarepreservedinthecyclicaltermct.
Inadditiontothefinancialcycle,wemeasuredanearlywarningindicator(EWI)of
bankingcrises inourstudy. Inordertoselectsuchan indicator,weconsideredboththe
work of Alessi and Detken (2011), about building an early warning system aimed at
supporting policy decisions about when to activate macroprudential tools targeting
excessive credit growthand leverage, and thatofDrehmannand Juselius (2013), about
the evaluation of several EWIs based on their performance relative to the
macroprudential policy maker’s decision. Drehmann et al. (2012) included several
1Regarding the parameters for the medium-term, we are aware that our window’s data is only 22 years and we will not be able to estimate cycles longer than our span of the available data.
The parameters pu and pl are the cut-off cycle lengths in months. Cycles longer than pl and shorter than pu are preserved in the cyclical term ct.
1 Regarding the parameters for the medium-term, we are aware that our window’s data is only 22 years and we will not be able to estimate cycles longer than our span of the available data.
BANKING STABILITY AND THE FINANCIAL CYCLE: THE SPANISH EXPERIENCE 17
In addition to the financial cycle, we measured an early warning indicator (EWI) of banking crises in our study. In order to select such an indicator, we considered both the work of Alessi and Detken (2011), about building an early warning system aimed at supporting policy decisions about when to activate macroprudential tools targeting excessive credit growth and leverage, and that of Drehmann and Juselius (2013), about the evaluation of several EWIs based on their performance relative to the macroprudential policy maker’s decision. Drehmann and Juselius (2013) included several practical aspects of the problem, such as difficulties in assessing the costs and benefits of various policy measures, as well as requirements for the timing and stability of EWIs. As a result of this process, they found that, under the above criteria, the credit-to-GDP gap is the best indicator at long horizons.
As a result of the above mentioned studies, we calculated the «standardized credit-to-GDP Gap», meaning the deviation of the ratio of credit-to-GDP from its long-term trend. This trend is calculated using the Hodrick-Prescott filter with a smoothing parameter –lambda– of 400.000 (following the methodology for the measurement and calculation of the credit-to-GDP gap in accordance with the BCBS’s guidance (ERRB/2014/1)). The aim of this calculation is to check whether the credit-to-GDP gap is a good EWI for the case of Spain; that is, whether this EWI would be able to warn about financial crises in Spain.
3. Financial stability and the financial cycle
According to the European Central Bank (ECB), financial stability is the condition in which the financial system –comprised of financial intermediaries, markets and market infrastructures– is capable of withstanding shocks and the unravelling of financial imbalances, thereby mitigating the likelihood of disruptions in the financial intermediation process, severe enough to significantly impair the allocation of savings to profitable investment opportunities.
Policymakers and academic researchers have focused on a number of quantitative measures in order to assess financial stability and strengthen the ability of banks to absorb shocks. The set of Financial Soundness Indicators developed by the International Monetary Fund (IMF, 2006), or the framework for macro-prudential analysis adopted by the Banking Supervision Committee (BSC, 2005, 2008), are examples of this. The ECB has an interest in monitoring these indicators for its own work on compiling macro-prudential indicators (MPIs), as an acknowledgment that micro-prudential regulation may have been more procyclical than expected and with the aim to remove the deficiencies in risk measurement and/or distortions to incentives which contributed to the credit boom and, in turn, the financial cycle.
Based on the premise that financial stability matters for the financial cycle, the second aim of the paper is to evaluate how stable the banking system in Spain was during the financial cycle and whether the financial cycle responds to improvements in banking stability. To address this purpose, and in line with the above, we use a set of structural
18 CUADERNOS ECONÓMICOS DE ICE N.O 92
banking sector2 features which are expected to have an influence on the financial cycle. In particular, we contemplate as relevant proxies of stability those features that compound the most important regulatory tools used by policymakers to attenuate financial cycles, and in particular credit growth; i.e., the ratio of capital-to-total assets, the liquidity ratio, and the ratio of loan loss provisions-to-total loans. Additionally, we define the Z-score as a proxy of the overall probability to default of the banking sector. In particular, we take into consideration the following four proxies for banking stability:
ii(i) According to the Bank of International Settlements (BIS) an underlying cause of the global financial crisis was the build-up of excessive on- and off-balance sheet leverage in the banking system. In many cases, banks built up excessive leverage while apparently maintaining strong risk-based capital ratios. In line with this, the Basel III framework has brought a simple, transparent, non-risk-based leverage ratio –the assets-to-capital ratio– to act as a supplementary measure of the risk-based capital requirements. The purpose of this leverage ratio is to make the capital framework robust to the inherent errors and uncertainties in assigning risk weights (for example, a bank with low average risk weights would be able to fund its assets with a substantial amount of debt and only very little equity, resulting a structure particularly susceptible to small errors in weights assignment). Several authors are working from this perspective: Gambacorta and Karmakar (2014) found that the Basel III leverage ratio is significantly more countercyclical than the risk-weighted regulatory capital ratio; on the other hand, Schoenmaker (2015) proposed a regulatory approach for restricting debt financing as an amplification mechanism across the financial system. Following the direction of Basel III, the ratio of capital-to-total asset is used in our analysis.
i(ii) The level of liquidity influences the ability of a banking system to withstand shocks. For instance, a large shock could cause a loss of confidence in the banking sector by market participants or depositors, resulting in a liquidity crisis. As the European Central Bank (2008) reflects, liquidity risk has two dimensions: the first is related to funding, meaning the ability of banks to meet their liabilities, unwind or settle their positions as they become due; and the second is related to the market. We focus in the first, in respect of which we chose the liquid asset ratio suggested by Lamas (2016). This ratio is defined as the sum of cash, deposits in central banks, and public debt maintained in their own balance-sheet, against the total asset ratio; it reflects the proportion of the most liquid assets on the balance-sheet.
(iii) Dynamic provisions are a macroprudential tool used to enhance bank soundness and to help mitigate part of the pro-cyclical tendencies of the banking system (Saurina, 2009). The degree of loan-loss provisioning is an important quantitative indicator for assessing the health of the banking
2 We pay attention to the banking sector because is the most relevant in the Spanish financial sector. Additionally, it is interesting as well because Spain suffered an important restructuration of this sector due to the financial crisis.
BANKING STABILITY AND THE FINANCIAL CYCLE: THE SPANISH EXPERIENCE 19
sector. Jiménez et al. (2012) found evidence that provisions built up prior to the crisis helped to absorb the impact of the crisis on bank lending, although the overall stock of provisions was too small to absorb the very large credit losses that banks suffered. Taking this into account, following Saurina (2009), we work with the ratio of loans loss provisions-to-total loans, in order to study the counter-cyclical nature of dynamic provisions.
(iv) A bank’s Z-score is a common measure of stability of the banking system, where it captures the probability of default of a country’s banking system. This measure compares the buffer of a country’s banking system (capitalization and returns) with the volatility of those returns. It is estimated as the sum of return on assets and the return on equity ratio, divided by the standard deviation of return on assets (computed using a one-year moving window):
12
thevolatilityofthosereturns.Itisestimatedasthesumofreturnonassetsandthe
return on equity ratio, divided by the standard deviation of return on assets
(computedusingaone-yearmovingwindow):
𝑍𝑍 − 𝑠𝑠𝑠𝑠𝑠𝑠𝑠𝑠𝑠𝑠 =𝑅𝑅𝑅𝑅𝑅𝑅+ 𝑅𝑅𝑅𝑅𝑅𝑅𝑆𝑆𝑆𝑆𝑆𝑆𝑆𝑆.𝑅𝑅𝑅𝑅𝑅𝑅
WhereROAisdefinedasprofitabilityovertotalassets,ROEisdefinedasprofitability
over total equity and Stdv.ROAmeasures the standard deviation of ROA. Higher Z-
scoresrepresentalowerprobabilityofdefault;thus,giventhatonegoalofourpaper
istoassesstheabilityofthefinancialcycletoabsorbshocksonfinancialstability,this
proxy could capture information regarding measures of regulation such as those
aimedatsafeguardingthesafetynetofthebankingsystem.
Our research strategy to analyze the relationship between the financial cycle and
banking sector stability is composed of two steps. For the first step, we will take a
preliminaryfirstlookatthedataonwhetherthemainproxiesdefinedaboveweremoving
with the cycle or not in Spain. After that, we resort to the VARmodel to analyze the
impulse response functions of the financial cycle to a shock on banking stability. Such
analysisisperformedduringthedownturnandtheupturnofthefinancialcycle.
The econometric VAR framework is useful for analyzing the relationships between
differenttimeserieswhenendogeneityamongvariablesexists.Becausebankingstability
is a process that is not independent from the financial cycle, then the VAR is an
appropriateframework.Moreover,theVARhasanadditionaladvantageinthatitimposes
fewtheoretical restrictions.Sinceweusedifferentproxiesofbankingstability,weusea
multivariateframeworkoftheVARmodel.
Xingyuan and Shinagawa (2014) is the only paper we found in the literature that
analysestheresponseofthefinancialcycletochangesinfinancialsoundnessindicatorsin
Where ROA is defined as profitability over total assets, ROE is defined as profitability over total equity and Stdv.ROA measures the standard deviation of ROA. Higher Z-scores represent a lower probability of default; thus, given that one goal of our paper is to assess the ability of the financial cycle to absorb shocks on financial stability, this proxy could capture information regarding measures of regulation such as those aimed at safeguarding the safety net of the banking system.
Our research strategy to analyze the relationship between the financial cycle and banking sector stability is composed of two steps. For the first step, we will take a preliminary first look at the data on whether the main proxies defined above were moving with the cycle or not in Spain. After that, we resort to the VAR model to analyze the impulse response functions of the financial cycle to a shock on banking stability. Such analysis is performed during the downturn and the upturn of the financial cycle.
The econometric VAR framework is useful for analyzing the relationships between different time series when endogeneity among variables exists. Because banking stability is a process that is not independent from the financial cycle, then the VAR is an appropriate framework. Moreover, the VAR has an additional advantage in that it imposes few theoretical restrictions. Since we use different proxies of banking stability, we use a multivariate framework of the VAR model.
Xingyuan and Shinagawa (2014) is the only paper we found in the literature that analyses the response of the financial cycle to changes in financial soundness indicators in a selected group of European countries. Our work differs from their study on three issues: (i) we define accurately the financial cycle for the case of Spain, while they only define the credit growth; (ii) we use a wider set of financial soundness indicators; and (iii) we include the Z-score as a proxy of the average soundness of the Spanish banking sector.

20 CUADERNOS ECONÓMICOS DE ICE N.O 92
4. Data
Our empirical analysis uses macro level variables covering the period 1995Q1-2016Q4. It includes information from Spain. Three data sources are used: the BIS database, the ECB database, and the Bank of Spain (BE) database.
In order to accurately describe the financial cycle we start by using information on residential property prices, credit-to-private non-financial sector, credit-to-GDP ratio, M3 money supply, current account balance, Spanish investments abroad, foreign investments in Spain, MFI net financial transactions, net interest revenue of the MFI, banking sector leverage, financial corporations’ debt-to-equity ratio, non-financial sector transactions, and the household debt ratio. The information for those variables was obtained from the BIS database and the statistical database warehouse of the ECB.
Regarding the information used to define the equity-to-asset ratio, liquidity ratio, loan loss provision-to-total loans ratio, and the Z-score, the data source was the statistics database of the BE on the total banking sector in Spain. This information was extracted monthly and then transformed into quarterly terms to match these variable to the quarterly frequency of the financial cycle.
5. Empirical results
In order to address the two main goals of the present paper, i.e. to define the special characteristics of the financial cycle of Spain and to analyze to what extent the stability of the banking system attenuates or exacerbates the financial cycle, we start this section by displaying the characteristics of the financial cycle in Spain and then examining the actual risk behavior of the Spanish banking sector during the financial cycle, including how the financial cycle in Spain responds to channels aimed at promoting the stability of the banking sector.
5.1. The financial cycle
To describe the financial cycle based on the given definition, stated methodology and using the variables discussed in Section 2, we start by characterizing cycles in individual series to determine what variables must be chosen to describe the financial cycle for Spain. In this regard, we compare the behavior of the short –and medium-term cycles with individual variables3–. To detect which of the variables accurately define the financial cycle in Spain, we compare the behavior of all
3 Among the variables considered, several take positive and negative values. A modified transformation log was applied to the series taking positive and negative values. We use the log-modulus transformation (JOHN and DRAPER, 1980) that is a modification of the log transformation to help us maintain the
BANKING STABILITY AND THE FINANCIAL CYCLE: THE SPANISH EXPERIENCE 21
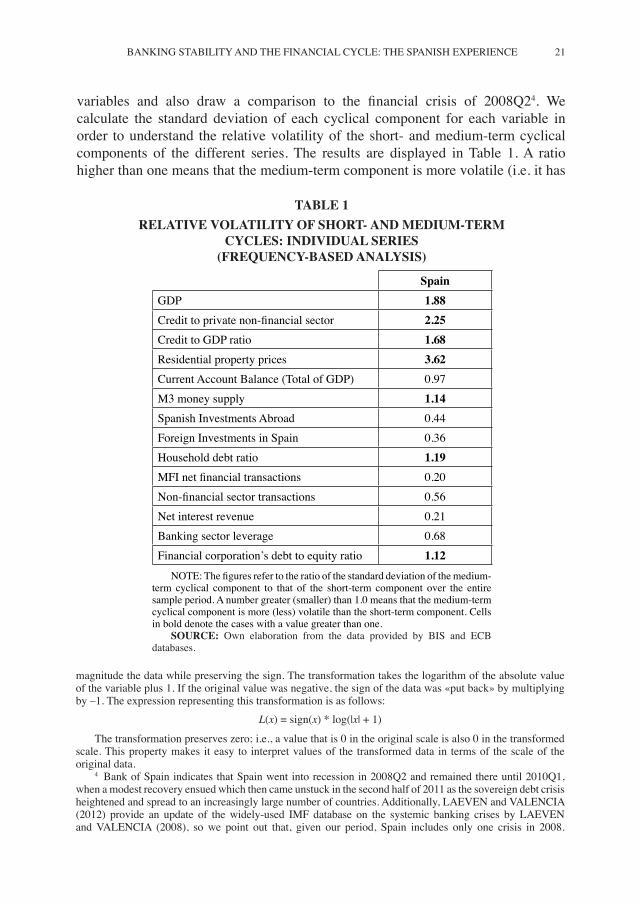
TABLE 1 RELATIVE VOLATILITY OF SHORT- AND MEDIUM-TERM
CYCLES: INDIVIDUAL SERIES (FREQUENCY-BASED ANALYSIS)
SpainGDP 1.88Credit to private non-financial sector 2.25Credit to GDP ratio 1.68Residential property prices 3.62Current Account Balance (Total of GDP) 0.97M3 money supply 1.14Spanish Investments Abroad 0.44Foreign Investments in Spain 0.36Household debt ratio 1.19MFI net financial transactions 0.20Non-financial sector transactions 0.56Net interest revenue 0.21Banking sector leverage 0.68Financial corporation’s debt to equity ratio 1.12
NOTE: The figures refer to the ratio of the standard deviation of the medium-term cyclical component to that of the short-term component over the entire sample period. A number greater (smaller) than 1.0 means that the medium-term cyclical component is more (less) volatile than the short-term component. Cells in bold denote the cases with a value greater than one.
SOURCE: Own elaboration from the data provided by BIS and ECB databases.
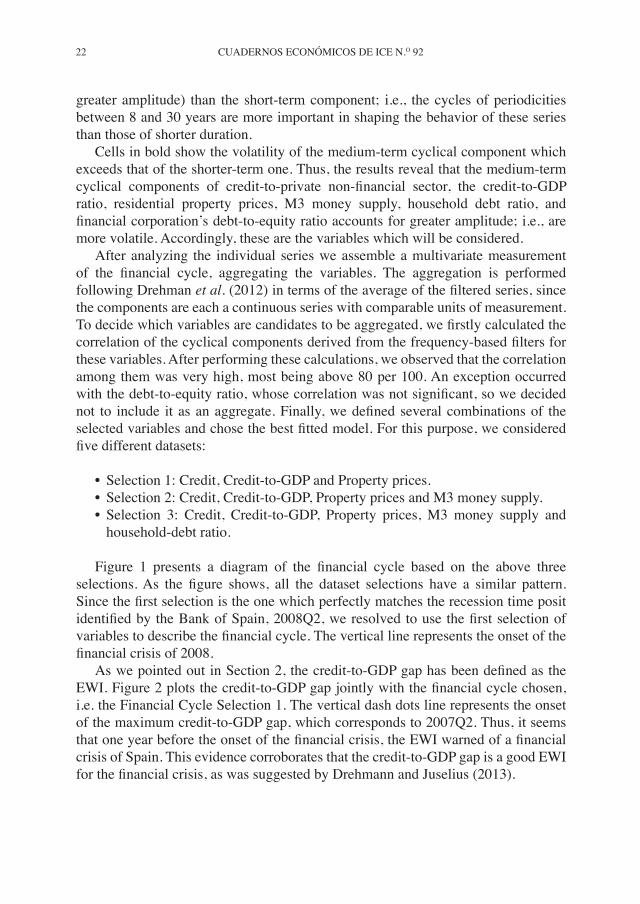
variables and also draw a comparison to the financial crisis of 2008Q24. We calculate the standard deviation of each cyclical component for each variable in order to understand the relative volatility of the short- and medium-term cyclical components of the different series. The results are displayed in Table 1. A ratio higher than one means that the medium-term component is more volatile (i.e. it has
magnitude the data while preserving the sign. The transformation takes the logarithm of the absolute value of the variable plus 1. If the original value was negative, the sign of the data was «put back» by multiplying by –1. The expression representing this transformation is as follows:
L(x) = sign(x) * log(|x| + 1)
The transformation preserves zero; i.e., a value that is 0 in the original scale is also 0 in the transformed scale. This property makes it easy to interpret values of the transformed data in terms of the scale of the original data.
4 Bank of Spain indicates that Spain went into recession in 2008Q2 and remained there until 2010Q1, when a modest recovery ensued which then came unstuck in the second half of 2011 as the sovereign debt crisis heightened and spread to an increasingly large number of countries. Additionally, LAEVEN and VALENCIA (2012) provide an update of the widely-used IMF database on the systemic banking crises by LAEVEN and VALENCIA (2008), so we point out that, given our period, Spain includes only one crisis in 2008.
22 CUADERNOS ECONÓMICOS DE ICE N.O 92
greater amplitude) than the short-term component; i.e., the cycles of periodicities between 8 and 30 years are more important in shaping the behavior of these series than those of shorter duration.
Cells in bold show the volatility of the medium-term cyclical component which exceeds that of the shorter-term one. Thus, the results reveal that the medium-term cyclical components of credit-to-private non-financial sector, the credit-to-GDP ratio, residential property prices, M3 money supply, household debt ratio, and financial corporation’s debt-to-equity ratio accounts for greater amplitude; i.e., are more volatile. Accordingly, these are the variables which will be considered.
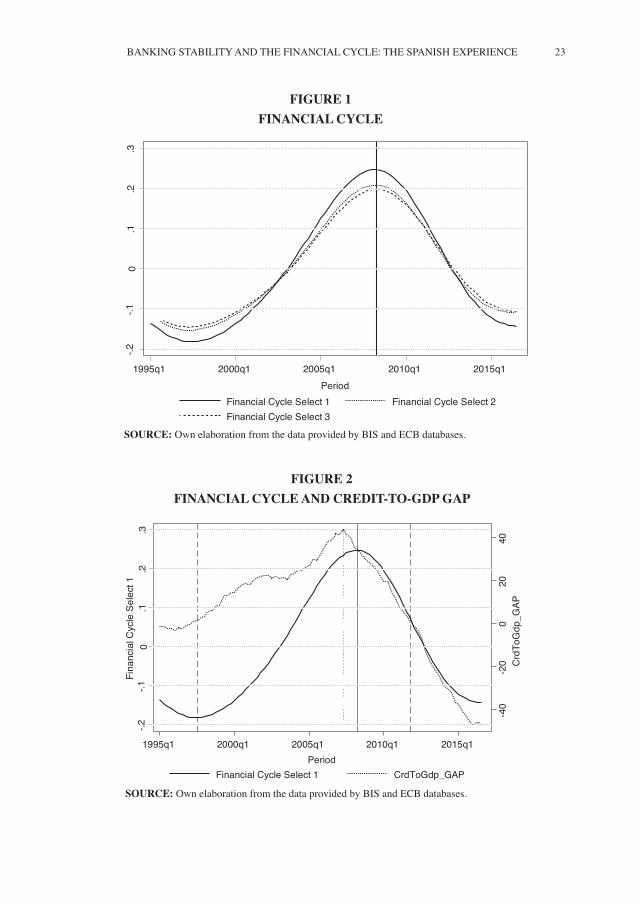
After analyzing the individual series we assemble a multivariate measurement of the financial cycle, aggregating the variables. The aggregation is performed following Drehman et al. (2012) in terms of the average of the filtered series, since the components are each a continuous series with comparable units of measurement. To decide which variables are candidates to be aggregated, we firstly calculated the correlation of the cyclical components derived from the frequency-based filters for these variables. After performing these calculations, we observed that the correlation among them was very high, most being above 80 per 100. An exception occurred with the debt-to-equity ratio, whose correlation was not significant, so we decided not to include it as an aggregate. Finally, we defined several combinations of the selected variables and chose the best fitted model. For this purpose, we considered five different datasets:
• Selection 1: Credit, Credit-to-GDP and Property prices.• Selection 2: Credit, Credit-to-GDP, Property prices and M3 money supply.• Selection 3: Credit, Credit-to-GDP, Property prices, M3 money supply and
household-debt ratio.
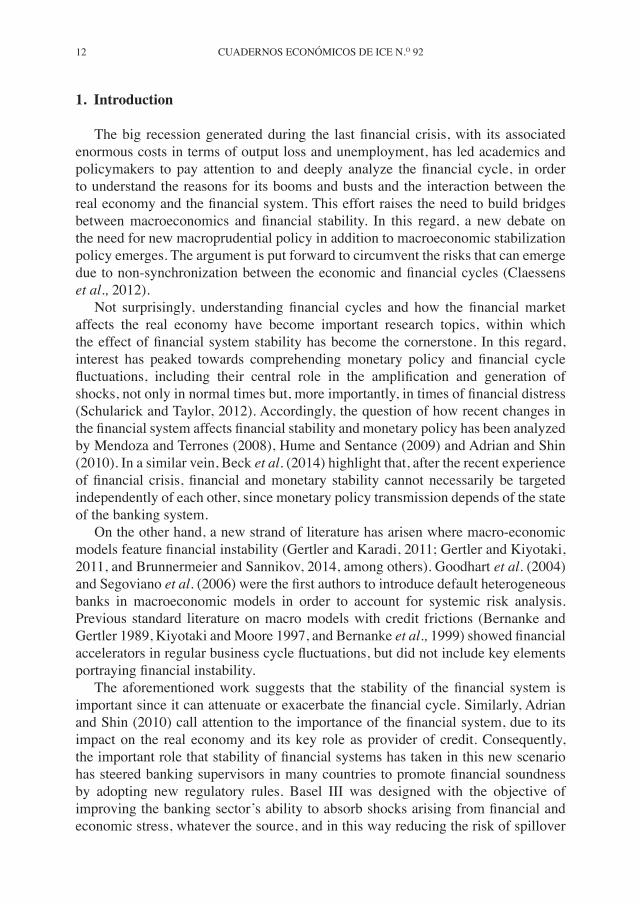
Figure 1 presents a diagram of the financial cycle based on the above three selections. As the figure shows, all the dataset selections have a similar pattern. Since the first selection is the one which perfectly matches the recession time posit identified by the Bank of Spain, 2008Q2, we resolved to use the first selection of variables to describe the financial cycle. The vertical line represents the onset of the financial crisis of 2008.
As we pointed out in Section 2, the credit-to-GDP gap has been defined as the EWI. Figure 2 plots the credit-to-GDP gap jointly with the financial cycle chosen, i.e. the Financial Cycle Selection 1. The vertical dash dots line represents the onset of the maximum credit-to-GDP gap, which corresponds to 2007Q2. Thus, it seems that one year before the onset of the financial crisis, the EWI warned of a financial crisis of Spain. This evidence corroborates that the credit-to-GDP gap is a good EWI for the financial crisis, as was suggested by Drehmann and Juselius (2013).
BANKING STABILITY AND THE FINANCIAL CYCLE: THE SPANISH EXPERIENCE 23
-.2-.1
0.1
.2.3
1995q1 2000q1 2005q1 2010q1 2015q1Period
Financial Cycle Select 1 Financial Cycle Select 2Financial Cycle Select 3
-40
-20
020
40C
rdTo
Gdp
_GAP
-.2-.1
0.1
.2.3
Fina
ncia
l Cyc
le S
elec
t 1
1995q1 2000q1 2005q1 2010q1 2015q1Period
Financial Cycle Select 1 CrdToGdp_GAP
FIGURE 2FINANCIAL CYCLE AND CREDIT-TO-GDP GAP
FIGURE 1FINANCIAL CYCLE
SOURCE: Own elaboration from the data provided by BIS and ECB databases.
SOURCE: Own elaboration from the data provided by BIS and ECB databases.

24 CUADERNOS ECONÓMICOS DE ICE N.O 92
5.2. Banking stability and the financial cycle
Following our research strategy, once we obtained the financial cycle, we analyzed the actual situation of the banking sector in terms of risk-taking during the financial cycle. In particular, we paid attention to the elements of regulatory frameworks aimed at limiting risk-taking, by which method the banking sector may maintain its stability. Afterwards we evaluated to what extend the financial cycle responds to impulse from banking indicators aimed at broadening financial stability.
5.3. Actual banking stability and the financial cycle
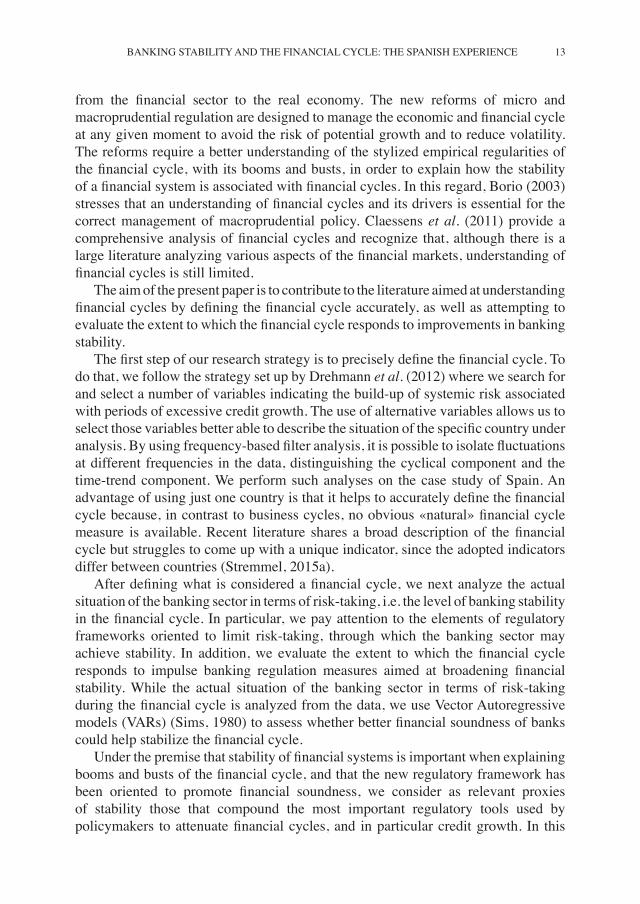
Regarding the evolution of the proxies of bank stability during the financial cycle, as seen in the data, Figure 3 plots the behavior the banking system adopted in terms of equity over total assets (i.e., the ratio of capital-to-total assets) alongside the financial cycle for Spain. The figure shows that the Spanish banking system had, on average, a declining trend of the capital-asset ratio until just after the onset of the financial crisis. This trend becomes positive during most of the downturn of the financial cycle. It seems that, on average, the banking system in Spain functioned with higher levels of leverage (a lower capital-asset ratio) during the boom of the financial cycle than during the bust phase. This could be explained by the fact that, during the boom, the market had no expectations of impairment on assets, where greater leverage implies a lower cost of resources and consequently greater profitability. Conversely, after a financial crisis, banks will move to even more secure levels than before, driven mainly by regulatory requirements.
1.7
1.8
1.9
22.
12.
2eq
toas
s_ln
-.2-.1
0.1
.2.3
Fina
ncia
l Cyc
le S
elec
t 1
1995q1 2000q1 2005q1 2010q1 2015q1Period
Financial Cycle Select 1 eqtoass_ln
FIGURE 3FINANCIAL CYCLE AND EQUITY-ASSET RATIO
SOURCE: Own elaboration from the data provided by BIS, ECB and BE databases.
BANKING STABILITY AND THE FINANCIAL CYCLE: THE SPANISH EXPERIENCE 25
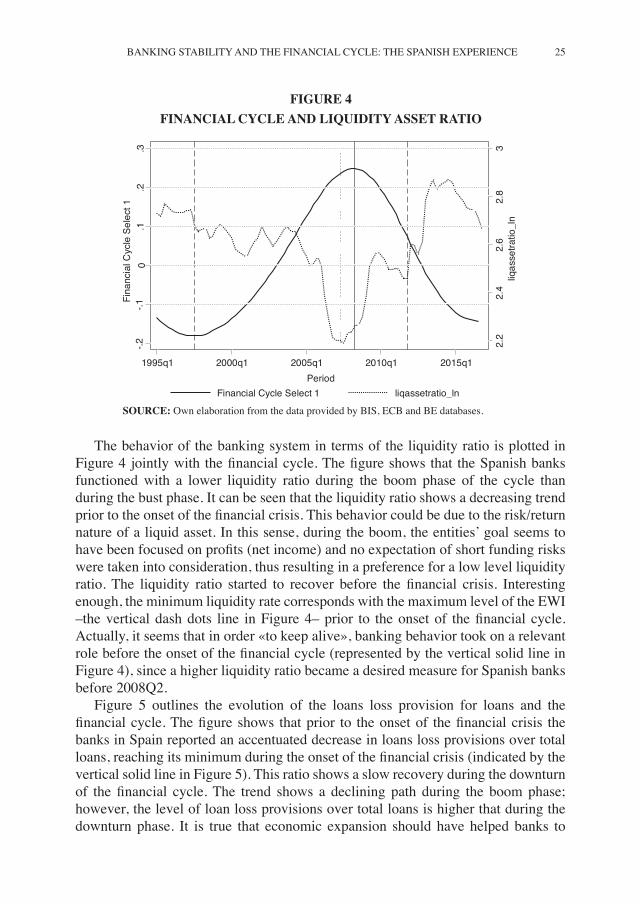
The behavior of the banking system in terms of the liquidity ratio is plotted in Figure 4 jointly with the financial cycle. The figure shows that the Spanish banks functioned with a lower liquidity ratio during the boom phase of the cycle than during the bust phase. It can be seen that the liquidity ratio shows a decreasing trend prior to the onset of the financial crisis. This behavior could be due to the risk/return nature of a liquid asset. In this sense, during the boom, the entities’ goal seems to have been focused on profits (net income) and no expectation of short funding risks were taken into consideration, thus resulting in a preference for a low level liquidity ratio. The liquidity ratio started to recover before the financial crisis. Interesting enough, the minimum liquidity rate corresponds with the maximum level of the EWI –the vertical dash dots line in Figure 4– prior to the onset of the financial cycle. Actually, it seems that in order «to keep alive», banking behavior took on a relevant role before the onset of the financial cycle (represented by the vertical solid line in Figure 4), since a higher liquidity ratio became a desired measure for Spanish banks before 2008Q2.
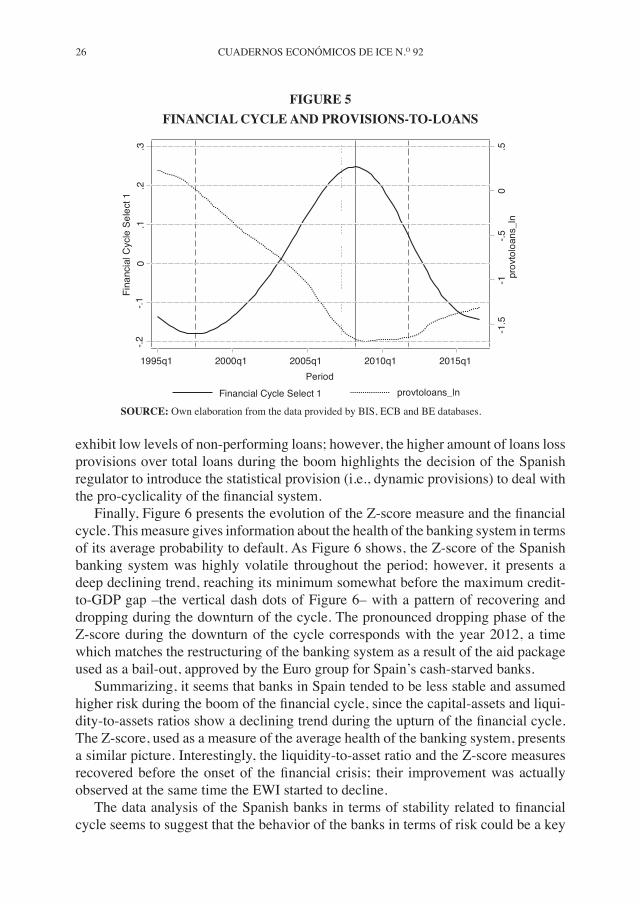
Figure 5 outlines the evolution of the loans loss provision for loans and the financial cycle. The figure shows that prior to the onset of the financial crisis the banks in Spain reported an accentuated decrease in loans loss provisions over total loans, reaching its minimum during the onset of the financial crisis (indicated by the vertical solid line in Figure 5). This ratio shows a slow recovery during the downturn of the financial cycle. The trend shows a declining path during the boom phase; however, the level of loan loss provisions over total loans is higher that during the downturn phase. It is true that economic expansion should have helped banks to
FIGURE 4FINANCIAL CYCLE AND LIQUIDITY ASSET RATIO
2.2
2.4
2.6
2.8
3liq
asse
tratio
_ln
-.2-.1
0.1
.2.3
Fina
ncia
l Cyc
le S
elec
t 1
1995q1 2000q1 2005q1 2010q1 2015q1Period
Financial Cycle Select 1 liqassetratio_ln
SOURCE: Own elaboration from the data provided by BIS, ECB and BE databases.
26 CUADERNOS ECONÓMICOS DE ICE N.O 92
exhibit low levels of non-performing loans; however, the higher amount of loans loss provisions over total loans during the boom highlights the decision of the Spanish regulator to introduce the statistical provision (i.e., dynamic provisions) to deal with the pro-cyclicality of the financial system.
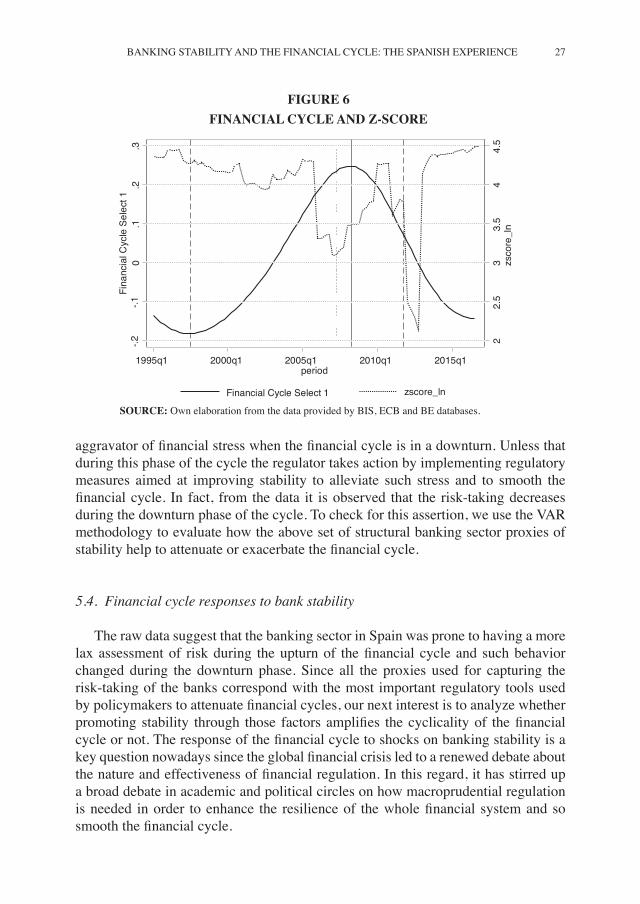
Finally, Figure 6 presents the evolution of the Z-score measure and the financial cycle. This measure gives information about the health of the banking system in terms of its average probability to default. As Figure 6 shows, the Z-score of the Spanish banking system was highly volatile throughout the period; however, it presents a deep declining trend, reaching its minimum somewhat before the maximum credit-to-GDP gap –the vertical dash dots of Figure 6– with a pattern of recovering and dropping during the downturn of the cycle. The pronounced dropping phase of the Z-score during the downturn of the cycle corresponds with the year 2012, a time which matches the restructuring of the banking system as a result of the aid package used as a bail-out, approved by the Euro group for Spain’s cash-starved banks.
Summarizing, it seems that banks in Spain tended to be less stable and assumed higher risk during the boom of the financial cycle, since the capital-assets and liqui-dity-to-assets ratios show a declining trend during the upturn of the financial cycle. The Z-score, used as a measure of the average health of the banking system, presents a similar picture. Interestingly, the liquidity-to-asset ratio and the Z-score measures recovered before the onset of the financial crisis; their improvement was actually observed at the same time the EWI started to decline.
The data analysis of the Spanish banks in terms of stability related to financial cycle seems to suggest that the behavior of the banks in terms of risk could be a key
-1.5
-1-.5
0.5
prov
tolo
ans_
ln
-.2-.1
0.1
.2.3
Fina
ncia
l Cyc
le S
elec
t 1
1995q1 2000q1 2005q1 2010q1 2015q1Period
Financial Cycle Select 1 provtoloans_ln
FIGURE 5FINANCIAL CYCLE AND PROVISIONS-TO-LOANS
SOURCE: Own elaboration from the data provided by BIS, ECB and BE databases.
BANKING STABILITY AND THE FINANCIAL CYCLE: THE SPANISH EXPERIENCE 27
aggravator of financial stress when the financial cycle is in a downturn. Unless that during this phase of the cycle the regulator takes action by implementing regulatory measures aimed at improving stability to alleviate such stress and to smooth the financial cycle. In fact, from the data it is observed that the risk-taking decreases during the downturn phase of the cycle. To check for this assertion, we use the VAR methodology to evaluate how the above set of structural banking sector proxies of stability help to attenuate or exacerbate the financial cycle.
5.4. Financial cycle responses to bank stability
The raw data suggest that the banking sector in Spain was prone to having a more lax assessment of risk during the upturn of the financial cycle and such behavior changed during the downturn phase. Since all the proxies used for capturing the risk-taking of the banks correspond with the most important regulatory tools used by policymakers to attenuate financial cycles, our next interest is to analyze whether promoting stability through those factors amplifies the cyclicality of the financial cycle or not. The response of the financial cycle to shocks on banking stability is a key question nowadays since the global financial crisis led to a renewed debate about the nature and effectiveness of financial regulation. In this regard, it has stirred up a broad debate in academic and political circles on how macroprudential regulation is needed in order to enhance the resilience of the whole financial system and so smooth the financial cycle.
22.
53
3.5
44.
5zs
core
_ln
-.2-.1
0.1
.2.3
Fina
ncia
l Cyc
le S
elec
t 1
1995q1 2000q1 2005q1 2010q1 2015q1period
Financial Cycle Select 1 zscore_ln
FIGURE 6FINANCIAL CYCLE AND Z-SCORE
SOURCE: Own elaboration from the data provided by BIS, ECB and BE databases.
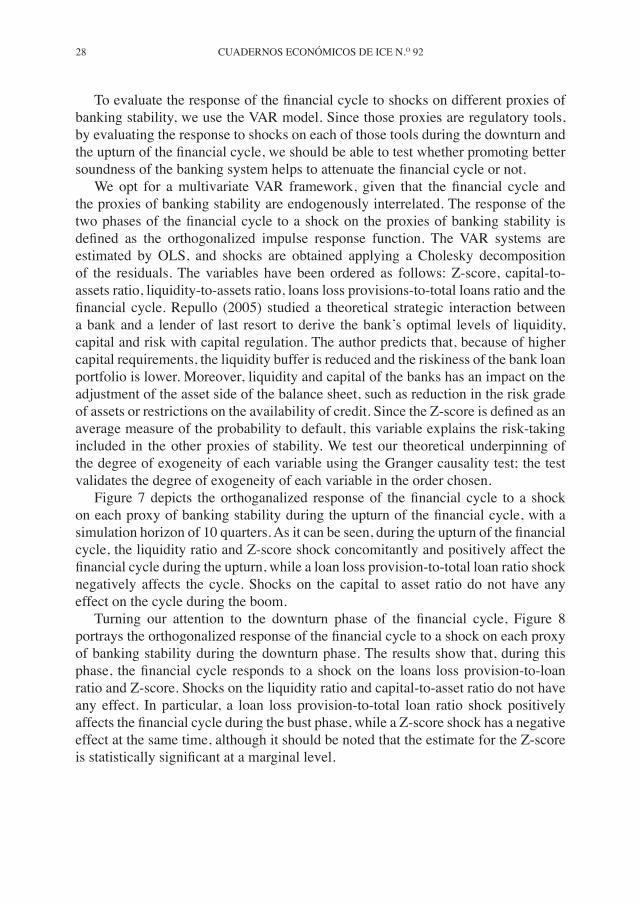
28 CUADERNOS ECONÓMICOS DE ICE N.O 92
To evaluate the response of the financial cycle to shocks on different proxies of banking stability, we use the VAR model. Since those proxies are regulatory tools, by evaluating the response to shocks on each of those tools during the downturn and the upturn of the financial cycle, we should be able to test whether promoting better soundness of the banking system helps to attenuate the financial cycle or not.
We opt for a multivariate VAR framework, given that the financial cycle and the proxies of banking stability are endogenously interrelated. The response of the two phases of the financial cycle to a shock on the proxies of banking stability is defined as the orthogonalized impulse response function. The VAR systems are estimated by OLS, and shocks are obtained applying a Cholesky decomposition of the residuals. The variables have been ordered as follows: Z-score, capital-to-assets ratio, liquidity-to-assets ratio, loans loss provisions-to-total loans ratio and the financial cycle. Repullo (2005) studied a theoretical strategic interaction between a bank and a lender of last resort to derive the bank’s optimal levels of liquidity, capital and risk with capital regulation. The author predicts that, because of higher capital requirements, the liquidity buffer is reduced and the riskiness of the bank loan portfolio is lower. Moreover, liquidity and capital of the banks has an impact on the adjustment of the asset side of the balance sheet, such as reduction in the risk grade of assets or restrictions on the availability of credit. Since the Z-score is defined as an average measure of the probability to default, this variable explains the risk-taking included in the other proxies of stability. We test our theoretical underpinning of the degree of exogeneity of each variable using the Granger causality test; the test validates the degree of exogeneity of each variable in the order chosen.
Figure 7 depicts the orthoganalized response of the financial cycle to a shock on each proxy of banking stability during the upturn of the financial cycle, with a simulation horizon of 10 quarters. As it can be seen, during the upturn of the financial cycle, the liquidity ratio and Z-score shock concomitantly and positively affect the financial cycle during the upturn, while a loan loss provision-to-total loan ratio shock negatively affects the cycle. Shocks on the capital to asset ratio do not have any effect on the cycle during the boom.
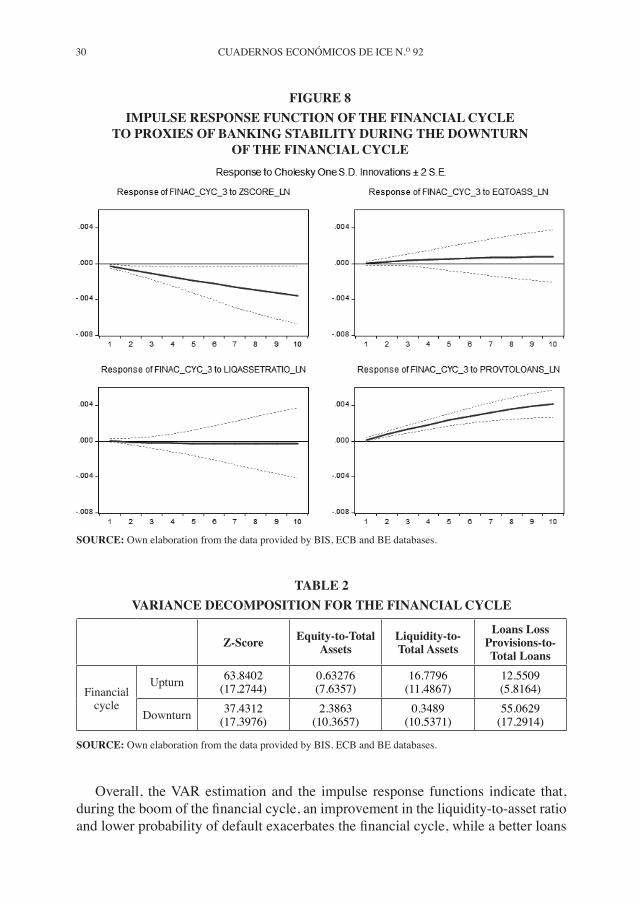
Turning our attention to the downturn phase of the financial cycle, Figure 8 portrays the orthogonalized response of the financial cycle to a shock on each proxy of banking stability during the downturn phase. The results show that, during this phase, the financial cycle responds to a shock on the loans loss provision-to-loan ratio and Z-score. Shocks on the liquidity ratio and capital-to-asset ratio do not have any effect. In particular, a loan loss provision-to-total loan ratio shock positively affects the financial cycle during the bust phase, while a Z-score shock has a negative effect at the same time, although it should be noted that the estimate for the Z-score is statistically significant at a marginal level.

BANKING STABILITY AND THE FINANCIAL CYCLE: THE SPANISH EXPERIENCE 29
FIGURE 7IMPULSE RESPONSE FUNCTION OF THE FINANCIAL CYCLE
TO PROXIES OF BANKING STABILITY DURING THE UPTURN OF THE FINANCIAL CYCLE
Table 2 reports the variance decomposition for the financial cycle. It indicates the proportions of the financial cycle which are explained by shocks to the variables on banking stability. The table reports the effect of shocks over a 10 quarter time period. The results show, consistent with the impulse response function, that, during the upturn of the financial cycle, the Z-score and the liquidity-to-total assets have the largest influence on the financial cycle, explaining on average 80 per 100 of the cycle. However, it is the variable loan loss provision-to-total loans ratio which explains the largest changes in the financial cycle during the downturn, around 55 per 100, while during the upturn it explained 12.6 per 100. The variance of the capital-to-total assets ratio has a non-significant effect on the financial cycle, although its effect increases during the downturn phase of the financial cycle.
SOURCE: Own elaboration from the data provided by BIS, ECB and BE databases.
30 CUADERNOS ECONÓMICOS DE ICE N.O 92
FIGURE 8 IMPULSE RESPONSE FUNCTION OF THE FINANCIAL CYCLE
TO PROXIES OF BANKING STABILITY DURING THE DOWNTURN OF THE FINANCIAL CYCLE
Overall, the VAR estimation and the impulse response functions indicate that, during the boom of the financial cycle, an improvement in the liquidity-to-asset ratio and lower probability of default exacerbates the financial cycle, while a better loans
TABLE 2 VARIANCE DECOMPOSITION FOR THE FINANCIAL CYCLE
Z-Score Equity-to-Total Assets
Liquidity-to-Total Assets
Loans Loss Provisions-to-Total Loans
Financial cycle
Upturn 63.8402(17,2744)
0.63276(7.6357)
16.7796(11.4867)
12.5509(5.8164)
Downturn 37.4312(17.3976)
2.3863(10.3657)
0.3489(10.5371)
55.0629(17.2914)
SOURCE: Own elaboration from the data provided by BIS, ECB and BE databases.
SOURCE: Own elaboration from the data provided by BIS, ECB and BE databases.
BANKING STABILITY AND THE FINANCIAL CYCLE: THE SPANISH EXPERIENCE 31
loss provisions-to-total loans ratio attenuates it; however, the improvements in the loans loss provisions-to-total loans ratio during the downturn of the financial cycle helps to smooth the contraction phase of the cycle intensively and to some degree lower probability to default exercises the opposite effect.
During the cycle boom, the improvements in liquidity-to-total assets ratio and the improvements in the probability to default are apparently not a binding constraint. Actually, an improvement in the liquidity ratio and probability to default could be related more to the banks’ favorable financial performance than to the result of deliberate efforts to strengthen stability; however, improvement of the loans loss provisions-to-total loans is a result of the regulatory effort to improve stability using the dynamic provisions onset in Spain in the mid-2000s.
Overall, the results show that promoting banking stability through higher loans loss provisions-to-total loans tightens the financial cycle during the boom phase and helps to smooth the contraction phase of the cycle. Thus, the results suggest that the regulatory tool of countercyclical dynamic provision can smooth the cycle in the boom phase, while in bad times it strengthens firms’ finances and performance. Accordingly, it seems to work as a macroprudential tool able to enhance banks’ soundness and to help mitigate part of the procyclicality of the banking system.
Lastly, regarding policies taken during the downturn of the cycle oriented to safeguard the financial system –such as the aid package used as a bail-out, approved by the Euro group for Spain’s banks– were useful to restore the stability of the banking system, since the Z-score improve during the downturn phase, but this improvement in stability seems to reduce the financing channel to the real economy through financial intermediaries5.
6. Conclusions
After the financial crisis new reform on micro and macroprudential regulation were urged to manage the economic and financial cycle and avoid the potential growth of risk, reducing volatility. The understanding of the stylized empirical regularities of the financial cycle, with its booms and busts, and the question of how to explain the stability of financial system and its relationship with financial cycles became critical areas for research. In contrast to business cycles, no obvious «natural» financial cycle measures are available.
The current paper attempts to define the financial cycle accurately and to evaluate the extent to which the financial cycle responds to improvements in banking stability. We performed analyses on the particular case of Spain. We defined the financial cycle by selecting a wide set of variables indicating the build-up of systemic risk associated
5 OTERO-IGLESIAS et al. (2016). Point out that one of the most striking factors of the Spanish banking crisis was the delay in taking the key decisions to tackle the problems. The negative effect of the Z-score could be a result of this circumstance.
32 CUADERNOS ECONÓMICOS DE ICE N.O 92
with periods of excessive credit growth, using frequency-based filter analysis, and we used the VARs framework to assess whether better financial soundness of banks could help diminish the financial cycle.
Our results strengthen the conclusion that the best indicators for defining and describing the financial cycle in Spain are the credit-to-GDP ratio, the credit-to-private non-financial sector, and residential property prices. We found that the credit-to-GDP gap is a good earlier indicator of financial crisis in Spain.
After a financial or economic crisis hits, banks and policymakers are pressured to take action to safeguard the financial system. We contemplate as relevant proxies of stability those that compound the most important regulatory tools used by policymakers to attenuate financial cycles and to promote financial soundness. Specifically, we looked at the equity to total assets, the liquidity ratio, and the loans loss provisions over total loans. Furthermore, we used the Z-score as proxy of the average probability to default of the banking system. The results show that the risk-taking of banks in Spain increased during the boom of the financial cycle, and failed during the bust. Additionally, the findings support how financial stability is important to attenuate or exacerbate the financial cycle. In particular, the financial cycle responds during the upturn to shocks on the liquidity ratio, the loan loss provisions-to-total loans ratio, and the Z-score, and during to the downturn to the impulse of loans loss provision-to-total loans ratio and of Z-scores, although weakly to shock on the latter.
Although, during the cycle boom, an improvement in the liquidity ratio and probability of default could be related more to the banks’ favorable financial performance rather than being the result of deliberate efforts to strengthen stability (Xingyuan and Shinagawa, 2014), improvements to loans loss provisions-to-total loans is deemed a result of regulatory effort to improve stability, specifically the onset of dynamic provisions in Spain was in the mid-2000s. Furthermore, it is well known that the crisis forced to the governments and central bank restore the stability of the financial institutions by undertaking extraordinary emergency measures, e.g. recapitalization, implicit and explicit guarantee and restructuring the banking industry through mergers (Allen et al., 2015). In this vein, the Spanish banking sector required of public intervention ending in a fully-fledged financial bail-out. The impact of such guarantee scheme in terms of emergency measures taken in Spain seems to be reflected along the evolution of the Z-score which improves markedly after 2012.
Overall, the results suggest that the regulatory requirement on dynamic provisions enhances bank soundness and helps to mitigate part of the procyclicality of the banking system. Thus, in line with the objective under Basel III of improving the banking sector’s ability to absorb shocks in order to reduce the risk of spillover from the financial sector to the real economy, our findings confirm that the Spanish dynamic provisions seem to be a useful macroprudential instrument to address pro-cyclicality. Lastly, the negative effect of the Z-score shock during the bust phase of the cycle, although weak in terms of statistical significance, may indicate that bank
BANKING STABILITY AND THE FINANCIAL CYCLE: THE SPANISH EXPERIENCE 33
stability is a necessary but not sufficient condition to obtain the desired effects on the financial cycle. Probably, a sufficient condition should be that policymakers were capable of implementing right stability measures at the right time.
References
[1] ADRIAN, T. and SHIN, H.S. (2010). «Financial Intermediaries and monetary policy». Handbook of Monetary Economics. Edited by Benjamin M. Friedman and Michael Woodford, 3, 601-650.
[2] AIKMAN, D.; HALDANE, A.G. and NELSON, B.D. (2015). «Curbing the credit Cycle». The Economic Journal, 125 (587), 1072-1109.
[3] ALESSI, L. and DETKEN, C. (2011). «Quasi real time early warning indicators for costly asset pricy boom/bust cycles: A role for global liquidity». European Journal of Political Economic, 27 (3), 520-533.
[4] ALLEN, F.; CARLETTI, E.; GOLDSTEIN, I. and LEONELLO, A. (2015). «Moral hazard and government guarantees in the banking industry». Journal of Financial Regulation, 1-21.
[5] BANKING SUPERVISION COMMITTEE (2005). Compliance and the compliance function in banks. BIS.
[6] BANKING SUPERVISION COMMITTEE (2008). Implementation of the compliance principles. BIS.
[7] BECK, T.; COLCIAGO, A. and PFAIJFAR, D. (2014). «The role of financial intermediaries in monetary policy transmission». Journal of Economic Dynamics and Control, 43, 1-11.
[8] BERNANKE, B. and GERTLER, M. (1989). «Agency Costs, Net Worthand Business Fluctuations». American Economic Review, 79, 14-31.
[9] BERNANKE, B.; GERTLER, M. and GILCHRIST, S. (1999). «The Financial Accelerator in a Quantitative Business Cycle Framework», in John B. Taylor and Michael Woodford (eds.), Handbook of Macroeconomics, 1, Chapter 21, 1341-1393, Elsevier.
[10] BORIO, C. (2003). «Towards a Macroprudential Framework for Financial Supervision and Regulation?». CESifo, 49 (2), 181-215.
[11] BORIO, C. (2012). «The financial cycle and macroeconomics: What have we learnt?». BIS Working Papers, No. 395.
[12] BORIO, C.; KENNEDY, N. and PROWSE S. (1994). «Exploring aggregate asset price fluctuations across countries: measurement, determinants and monetary policy implications». BIS Economic Papers, No. 40, Basel, April.
[13] BRUNNERMEIER, M. K. and SANNIKOV, Y. (2014). «A Macroeconomic Model with a Financial Sector». American Economic Review, 104 (2), 379-421.
[14] CHRISTIANO, L. J. and FITZGERALD, T. J. (2003). «The band-pass Filter». International Economic Review, 44 (2), 435-65.
[15] CLAESSENS, S.; KOSE, M. and TERRONES, M. (2011). «Financial Cycles: What? How? When?». IMF Working Paper, No. WP/11/76.
[16] CLAESSENS, S.; KOSE, M. A. and TERRONES, M. E. (2012). «How do business and financial cycles interact?». Journal of International Economics, 87 (1), 178-190.
34 CUADERNOS ECONÓMICOS DE ICE N.O 92
[17] COMIN, D. and GERTLER, M. (2006). «Medium-term business cycles». American Economic Review, 96 (3), 523-51.
[18] DREHMANN, M.; BORIO, B. and TSATSARONIS, K. (2012). «Characterizing the financial cycle: do not lose sight of the medium term». BIS Working Papers, No. 380.
[19] DREHMANN, M. and JUSELIUS, M. (2013). «Evaluating early warning indicators of banking crises: Satisfying policy requirements». BIS Working Papers, No. 421.
[20] EUROPEAN SYSTEMIC RISK BOARD (2014). Recommendation of the European Systemic Risk Board of 18 June 2014 on guidance for setting countercyclical buffer rates (ESRB/2014/1) (2014/C 293/01).
[21] GAMBACORTA, L. and KARMAKAR, S. (2016). «Leverage and risk weighted capital requirements». BIS Working Paper, No. 586.
[22] GERTLER, M. and KIYOTAKI, N. (2011). «Financial Intermediation and Credit Policy in Business Cycle Analysis», in M. Woodford and B. M. Friedman (eds.), Handbook of Monetary Economics, North Holland, Elsevier.
[23] GERTLER, M. and KARADI, P. (2011). «A Model of Unconventional Monetary Policy». Journal of Monetary Economics, 58 (1), 17-34.
[24] GOODHART, CH.; HOFMANN, B. and SEGOVIANO, M. (2004). «Bank Regulation and Macroeconomic Fluctuations». Oxford Review of Economic Policy, 20 (4), 591-615.
[25] HUME, M. and SENTENCE, A. (2009). «The global credit boom: Challenges for macroeconomics and policy». Journal of International Money and Finance, 28 (8), 1426–1461.
[26] INTERNATIONAL MONETARY FUND (2006). Financial Soundness Indicators: Compilation guide. Washington D.C.
[27] JIMÉNEZ, G.; ONGENA, S.; PEYRÓ J. L. and SAURINA, J. (2012). «Macroprudential Policy, Countercyclical Bank Capital Buffers and Credit Supply: Evidence from the Spanish Dynamic Provisioning Experiments». Working Papers, No. 628, Barcelona Graduate School of Economics.
[28] JOHN, N. R. and DRAPER, J.A. (1980). «An alternative family of transformations». Applied Statistics, 29 (2), 190-197.
[29] KIYOTAKI, N. and MOORE, J. (1997). «Credit Cycles». Journal of Political Economy, 105 (2), 211-48.
[30] LAMAS, M. (2016). «Riesgo de liquidez sistémica. Indicadores para el sistema banca-rio español». BE Working Paper.
[31] LAEVEN, L. and VALENCIA, F. (2008). «Systemic Banking Crises: A New Databa-se». IMF Working Paper, WP/08/224, International Monetary Fund.
[32] LAEVEN, L. and VALENCIA, F. (2012). «Systemic Banking Crises Database: An Up-date». IMF Working Paper, WP/12/163, International Monetary Fund.
[33] MENDOZA, E. and TERRONES, M. E. (2008). «An Anatomy of Credit Booms: Evi-dence from Macro Aggregates and Micro Data». NBER Working Paper No. 14049.
[34] NILSON, R. and GYOMAI, G. (2011). «Cycle Extraction». OECD Statistics Directorate Working Paper, 39.
[35] OTERO-IGLESIAS, M.; ROYO, S. and STEINBERG, R. (2016). The Spanish financial crisis: Lessons for the European Banking Union. Informe El Cano, 20. Real Instituto Elcano, Royal Institute.
[36] REPULLO, R. (2015). «Liquidity, risk taking and the lender of las resort». International Journal of Central Banking, 1 (2), 47-80.
BANKING STABILITY AND THE FINANCIAL CYCLE: THE SPANISH EXPERIENCE 35
[37] SAURINA, J. (2009). «Loan loss provisions in Spain. A working macroprudential tool». Revista Financiera del Banco de España.
[38] SEGOVIANO, M.; GOODHART, C. H. and HOFMANN, B. (2006). «Default, Growth and Asset Prices». IMF Working Paper 06/226 Sept.
[39] SCHULARICK, M. and TAYLOR, A. M. (2012). «Credit Booms Gone Bust: Monetary Policy, Leverage Cycles and Financial Crises». American Economic Review, 102 (2), 1029-1061.
[40] SCHOENMAKER, D. (2015). «Regulating the financial cycle: An integrated approach with a leverage ratio». Economics Letters, 136, 70-82.
[41] SIMS, C. A. (1980). «Macroeconomics and Reality». Econometrica, 48, 1-48.[42] STREMMEL, H. (2015). Capturing the financial cycle in Europe. WP 1811, European
Central Bank.[43] STREMMEL, H. (2015). The relationship between structural and cyclical features of
the EU financial sector. WP 1812, European Central Bank.[44] XINGYUAN, C. H. and SHINAGAWA, Y. (2014). «Financial Soundness indicators
and the characteristics of financial cycles», IMF Working Paper 14/14.