Embed Size (px)
Citation preview
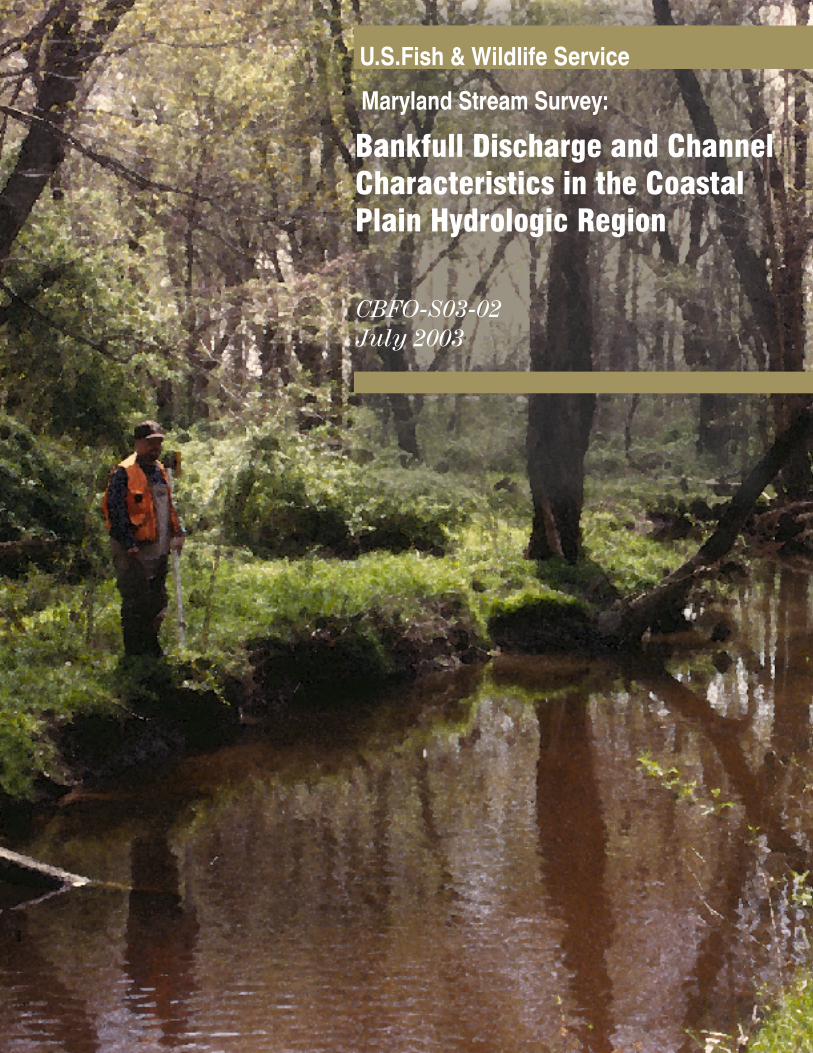
U.S.Fish & Wildlife Service
Bankfull Discharge and ChannelCharacteristics in the CoastalPlain Hydrologic Region
Maryland Stream Survey:
CBFO-S03-02July 2003
MARYLAND STREAM SURVEY: BANKFULL DISCHARGE AND
CHANNEL CHARACTERISTICS OF STREAMS IN THE COASTAL
PLAIN HYDROLOGIC REGION
By: Tamara L. McCandless
U.S. Fish & Wildlife Service Chesapeake Bay Field Office CBFO-S03-02
Prepared in cooperation with:
Maryland State Highway Administration and
U.S. Geological Survey Copies of this report are available at www.fws.gov/r5cbfo
Annapolis, MD 2003
Bankfull discharge and channel characteristics of streams in the Coastal Plain hydrologic region
ii
TABLE OF CONTENTS
EXECUTIVE SUMMARY iii ACKNOWLEDGEMENTS vi LIST OF FIGURES vii LIST OF TABLES vii SYMBOLS AND ABBREVIATIONS viii
INTRODUCTION 1
METHODS 1 Selection of Gage Sites 1
RESULTS AND DISCUSSION 4 Summary of General Site Characteristics 4 Rosgen Stream Types 5 Bankfull Discharge 11
Indicators 11 By Drainage Area 13 Recurrence Interval 18
Cross-section Relationships 19 By Drainage Area 19 By Bankfull Discharge 24
Resistance Relationships 25
CONCLUSIONS 26
APPLICATIONS 27 Use of Regression Relationships for Design Purposes 27
LITERATURE CITED 29
APPENDIX A Site characteristics for selected USGS gage station survey sites in the Coastal Plain physiographic province
Bankfull discharge and channel characteristics of streams in the Coastal Plain hydrologic region
iii
EXECUTIVE SUMMARY
As public demand increases for restoring the physical, biological, and aesthetic characteristics of degraded rivers, engineers and environmental managers are attempting to design in accordance with the natural tendencies of rivers in flood protection, channel stabilization, stream crossing, channel realignment, and watershed management projects. For these endeavors, designers need information on regional hydrologic relationships to evaluate and predict the dimension, pattern, and profile of natural rivers.
Empirical relationships between dimensions of bankfull channel geometry (i.e., width, mean depth, cross-sectional area) and water discharge or drainage area are useful in stream assessment and development of preliminary design concepts. The applicability of the derived predictive equations is limited to rivers similar to those providing the data. Thus, empirical relationships for channel geometry are applicable only for rivers in specific hydro-physiographic regions with relatively homogeneous climate, geology, and vegetation.
This report is the third and final report of the Maryland Stream Survey project, a series examining the relationship of stream dimensions versus drainage areas for several physiographic provinces within Maryland. This report presents the findings from 14 survey sites of the Coastal Plain, partitioned by Eastern and Western Coastal Plain (ECP and WCP) where appropriate. The first report presented the results from 23 survey sites in the Maryland Piedmont (MD Piedmont) and the second report presented the results from 14 survey sites in the Allegheny Plateau/Valley and Ridge (AP/VR) hydro-physiographic region. The Maryland Stream Survey is a cooperative effort between the U.S. Department of Interior, Fish and Wildlife Service, Maryland State Highway Administration, and the U.S. Geological Survey with the short-term goal to determine appropriate relationships of stream characteristics on a statewide basis. The long-term goal is to provide the State Highway Administration and others with background information on stream geometry for use in developing hydraulic designs for culverts and small bridges that maintain, as much as possible, the natural bankfull channel dimensions.
For this report, we surveyed gaged streams in the Coastal Plain hydro-physiographic provinces to examine for relationships between: 1) Drainage area and bankfull discharge (the discharge that fills the active channel to bankfull stage), 2) Drainage area and bankfull stream dimensions (active channel dimensions at bankfull stage), 3) Bankfull discharge and stream dimensions, and 4) Relative roughness and total channel hydraulic resistance.
We also classified each reach according to the Rosgen classification system for natural rivers and considered the utility of the classification system in the development of explanations for the observed trends in the above relationships.
The database of stream characteristics serves as a source of information on basic channel characteristics at the time of the surveys, for anyone involved with work affecting bankfull discharge and channel characteristics of streams in the Coastal Plain (CP) hydrologic region. The analyses from the stream surveys provide regional channel geometry relationships useful for
Bankfull discharge and channel characteristics of streams in the Coastal Plain hydrologic region
iv
watershed management, emergency watershed protection, and other stream restoration and protection efforts.
FINDINGS Rosgen ClassificationThe results of this survey support the applicability of the Rosgen classification system to Coastal Plain streams. However, the limited number of stream types observed prevents the examination of stream type for explaining some of the observed variability in stream characteristics in this region.Bankfull IndicatorsThe floodplain break/top of bank was the dominant indicator associated with the bankfull discharge for Coastal Plain streams. Bankfull DischargeBankfull discharge is significantly related to drainage area for both Eastern and Western Coastal Plain and there is a significant difference in the relationship between the two regions.Bankfull Discharge Recurrence IntervalThe recurrence intervals for the bankfull discharge associated with the dominant indicators in the Coastal Plain range from 1.04 - 1.37 years, and average 1.2 years.Cross-section Relationships by Drainage AreaWidth, mean depth, and cross-sectional area are all significantly related to drainage area. Of the three parameters, cross-sectional area has the greatest percent of the variability in size explained by drainage area, followed by width and mean depth. Cross-section Relationships by Bankfull DischargeWidth, mean depth, and cross-sectional area are all significantly related to bankfull discharge. Of the three parameters, cross-sectional area has the greatest percent of the variability in size explained by drainage area, followed by mean depth and width. Resistance RelationshipsCoastal Plain streams have the same general trend in channel roughness as streams surveyed by Limerinos (1970) but the Coastal Plain streams have higher average resistance.
CONCLUSIONS ¶ All surveyed streams in the Coastal Plain, MD Piedmont, and AP/VR were classified using
the Rosgen stream classification system supporting the applicability of this system to Maryland streams.
¶ The dominant geomorphic indicator of bankfull discharge for the three regions is the floodplain break.
¶ There are well-defined relationships between bankfull discharge and drainage area in the three regions surveyed.
¶ The drainage area and bankfull discharge relationship is significantly different between the three regions surveyed with the MD Piedmont region having more bankfull discharge per unit drainage area followed by AP/VR, WCP, and ECP.
Bankfull discharge and channel characteristics of streams in the Coastal Plain hydrologic region
v
¶ There are well-defined relationships for surveyed streams between drainage area and bankfull channel dimensions in the three regions.
¶ The Coastal Plain and AP/VR streams have less bankfull cross-sectional area per unit drainage area than MD Piedmont streams.
¶ The Coastal Plain streams surveyed have less bankfull width per unit drainage area compared to the MD Piedmont and AP/VR.
¶ The Coastal Plain streams surveyed have less bankfull mean depth per unit drainage area than the MD Piedmont streams.
APPLICATIONS Use of Regression Relationships for Design PurposesSeveral caveats exist for these relationships, and they should not be used for detailed design specifications. ¶ Relationships are representative of a restricted range of basin and reach characteristics (e.g.,
drainage area, geology, land use, etc.) and must be used with caution when applying to other streams across the regions surveyed.
¶ While we do not consider any of the reaches represented here to be in a state of rapid adjustment, we have no information about the relative rates of lateral or down-valley meander migration.
¶ Relationships are not necessarily representative of “reference reach conditions”. These relationships provide no information about ecological parameters, and may not represent “good” habitat conditions.
Given these caveats, we recommend the use of these relationships in stream assessments and planning studies. The information can provide preliminary conceptual design parameters for streams with a similar range of discharge, sediment, slope, and entrenchment conditions. However, channel designers need to identify discrete project goals and objectives, with respect to both physical and biological desired conditions, and determine the appropriate design parameters for achieving those conditions. Additional field information is needed to determine appropriate design values for shear stress, critical shear stress and sediment transport relationships. In most cases, the best guidance for finer scale aspects of channel design will come from carefully selected reference reaches that closely match the controlling conditions at the project reach, and exhibit those characteristics specifically identified as design objectives. The results of this study may best serve as a guide to the expected range of dimensions for bankfull channels at ungaged reaches.
Bankfull discharge and channel characteristics of streams in the Coastal Plain hydrologic region
vi
ACKNOWLEDGEMENTSThe Maryland Stream Survey is a cooperative effort between the U.S. Department of Interior, Fish and Wildlife Service (Service), Maryland State Highway Administration (SHA), and the U.S. Geological Survey (USGS). Many people contributed to the effort represented by this report, however any errors are strictly the responsibility of the author. This survey and report would not be possible without the work of the Service’s Stream Habitat Assessment and Restoration Program personnel who spent many hours in all weather conditions surveying streams in the Coastal Plain, particularly Christopher Eng, Mark Secrist, Richard Starr, Paige Brown, and Jason Darby. Eng and Secrist contributed greatly to the development of survey information, processing field data, and Appendix production.The Service, U.S. Environmental Protection Agency, USGS, Federal Highway Administration, and SHA provided funding for this work.
Advisory Panel The Service and SHA have obtained the cooperation of the state and federal agencies involved in the review of stream projects through a formal Partnering Agreement and formation of a Maryland Stream Survey Advisory Panel. It is important that all interested agencies agree to the approach and objectives of the survey. The agencies agreed that, upon review and acceptance by the Advisory Panel, the information would provide a useful tool for evaluating the effects of proposed projects in streams, wetlands, and flood plains.
Maryland Department of the Environment, Water Management Administration Maryland Department of Natural Resources, Chesapeake and Coastal Watershed Service Maryland State Highway Administration Natural Resources Conservation ServiceU.S. Army Corps of Engineers, Baltimore District, Regulatory Branch U.S. Federal Highway Administration, Maryland Division U.S. Fish and Wildlife Service U.S. Forest Service
Bankfull discharge and channel characteristics of streams in the Coastal Plain hydrologic region
vii
LIST OF FIGURES
1. Survey site locations in the Coastal Plain hydro-physiographic province. 2. Coastal Plain survey sites compared with Rosgen classification criteria (Rosgen 1996). 3. Coastal Plain meander width ratios compared to Rosgen stream types (Rosgen 1996). 4. Comparison of Coastal Plain, AP/VR, and MD Piedmont average values of Rosgen stream type delineative criteria (Rosgen 1996). 5. Typical bankfull indicators. 6. Distribution of primary bankfull indicators. 7. Percent of sites exhibiting geomorphic indicators of bankfull stage. 8. Bankfull discharge as a function of drainage area for Eastern and Western Coastal Plain
survey sites. 9. Two-year recurrence interval discharge as a function of drainage area partitioned by Eastern and Western Coastal Plain survey sites. 10. Comparison of bankfull discharge and drainage area for all regions surveyed. 11. Frequency of recurrence interval for field-estimated bankfull discharge. 12. Bankfull channel dimensions as a function of drainage area for Coastal Plain survey sites
(n = 14).13. Comparison of Coastal Plain, MD Piedmont, and AP/VR for bankfull cross-sectional area by
drainage area. 14. Comparison of Coastal Plain, MD Piedmont, and AP/VR for bankfull width by drainage area. 15. Comparison of Coastal Plain, MD Piedmont, and AP/VR for bankfull mean depth by
drainage area. 16. Comparison of Coastal Plain, MD Piedmont, and AP/VR for bankfull width/depth ratio by
drainage area. 17. Bankfull channel dimensions as a function of bankfull discharge for Coastal Plain survey
sites (n = 14). 18. Resistance as a function of relative roughness. Coastal Plain survey sites compared with
Limerinos (1970). Samples with relative roughness greater than 300 are labeled as solid triangles and are not included in regression analysis.
LIST OF TABLES
1. USGS Gage Stations. 2. Summary of site location and basin characteristics for study reaches at USGS gage stations in
the Coastal Plain physiographic province. 3. Coastal Plain survey sites - Rosgen stream classification delineative values. 4. Summary data for Coastal Plain, AP/VR, and MD Piedmont survey sites. 5. Bankfull discharge versus drainage area. 6. Comparison of relationships between bankfull discharge and drainage area.7. Cross-section dimensions versus drainage area. 8. Comparison of relationships between bankfull dimensions and drainage area. 9. Cross-section dimensions versus bankfull discharge. 10. Comparison of relationships between bankfull channel dimensions and bankfull discharge.
Bankfull discharge and channel characteristics of streams in the Coastal Plain hydrologic region
viii
SYMBOLS AND ABBREVIATIONS
Symbol Definition AP Allegheny Plateau cfs Cubic feet per second CP Coastal Plain d Mean bankfull depth D50 Median particle size D84 Particle size at which 84 percent of sample is smaller DA Drainage area ECP Eastern Coastal Plain g Gravitational acceleration MWR Meander width ratio “n” Manning’s roughness coefficient p Probability Q Discharge Qbkf Bankfull discharge R Hydraulic radius s Second S Slope sd Standard deviation u Mean velocity VR Valley and Ridge XS-Area Bankfull cross-sectional area W Bankfull width Wblt Belt width WCP Western Coastal Plain
Bankfull discharge and channel characteristics of streams in the Coastal Plain hydrologic region
1
INTRODUCTIONThis report is the third and final report of the Maryland Stream Survey project, a series examining the relationship of stream dimensions versus drainage areas for several physiographic provinces within Maryland. This report presents the findings from 14 survey sites of the Coastal Plain, partitioned by Eastern and Western Coastal Plain (ECP and WCP) where appropriate. The first report presented the results from 23 survey sites in the Maryland Piedmont (MD Piedmont) and the second report presented the results from 14 survey sites in the Allegheny Plateau/Valley and Ridge (AP/VR) hydro-physiographic region. The Maryland Stream Survey is a cooperative effort between the U.S. Fish and Wildlife Service (Service), Maryland State Highway Administration (SHA), and the U.S. Geological Survey (USGS) with the short-term goal to develop appropriate relationships of stream characteristics on a statewide basis. The long-term goal is to provide the SHA and others with the information needed to develop hydraulic designs for culverts and small bridges that maintain, as much as possible, the natural bankfull channel dimensions.
For this report, we surveyed gaged streams in the Coastal Plain hydro-physiographic province to test for relationships between: 1) Drainage area and bankfull discharge, 2) Drainage area and bankfull stream dimensions, 3) Bankfull discharge and stream dimensions, and 4) Relative roughness and flow resistance.
We also classified each reach according to the Rosgen classification system of natural rivers and examined the utility of such classification for explaining the observed variability in the above relationships.
METHODSDetailed discussions on site selection, analysis of gage records, bankfull definition and indicators, and data analysis are provided in the first report of the Maryland Stream Survey: Bankfull Discharge and Channel Characteristics in the Piedmont Hydrologic Region (McCandless and Everett 2002). Appendix B, Protocols for Field Surveys at Gage Stations, in the aforementioned report, provides detailed field survey methods used to collect data for these studies. The regional relationships are developed using multiple basins in the same physiographic region. The continuity equation (Q = XS-Area * u) is used to estimate velocity. The regional relationships are presented here using simple power functions and do not include information on additional boundary conditions which may influence and maintain stream shape, such as land use/land cover, sediment discharge, basin relief, and vegetation.
Selection of Gage SitesWe surveyed fourteen gage sites (Figure 1, Table 1) selected from the network of stations operated by the USGS, Maryland-Delaware-D.C. District, in the Coastal Plain physiographic province. Site selection criteria are based on specifications associated with Leopold (1994) and the Rosgen Stream Classification system (1996) and are provided in Appendix B, Protocols for Field Surveys at Gage Stations (McCandless and Everett 2002).
Bankfull discharge and channel characteristics of streams in the Coastal Plain hydrologic region
2
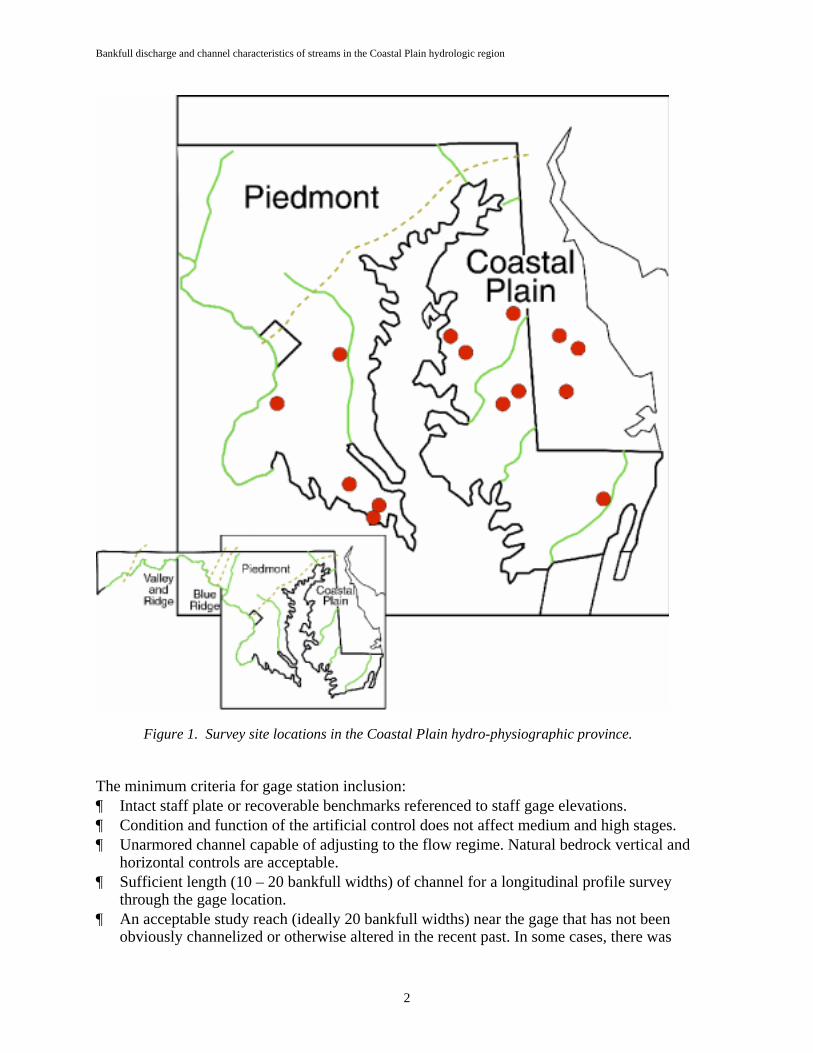
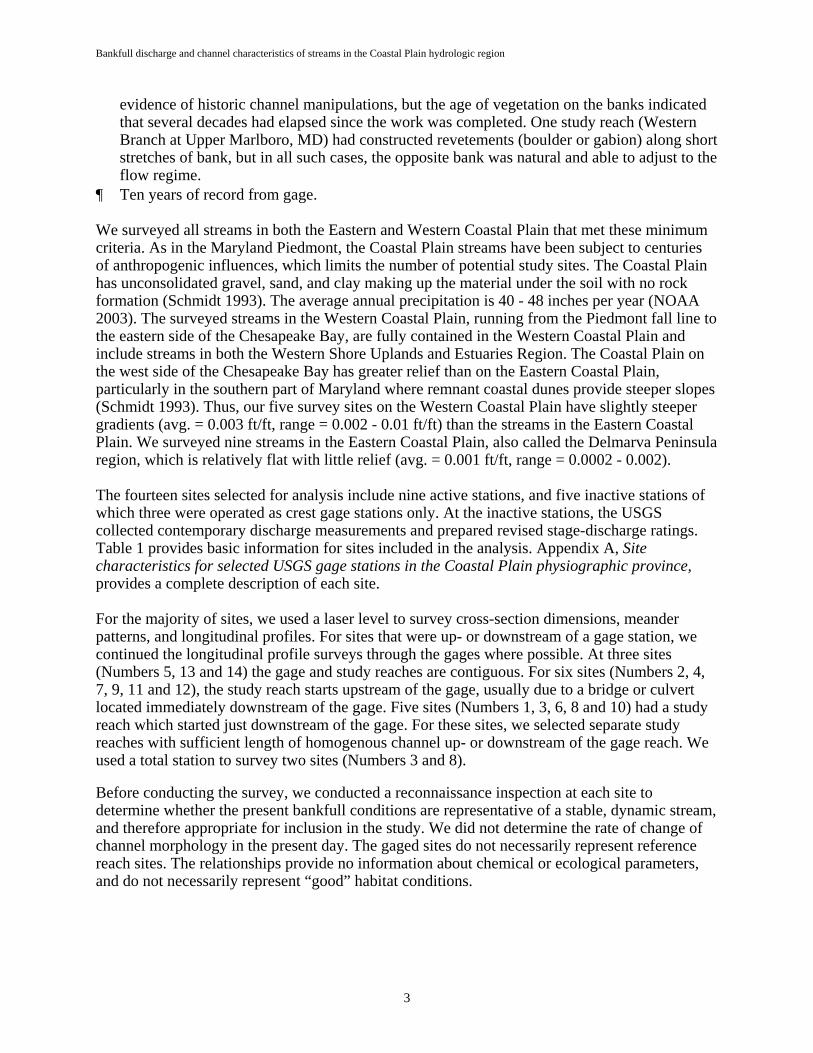
Figure 1. Survey site locations in the Coastal Plain hydro-physiographic province.
The minimum criteria for gage station inclusion: ¶ Intact staff plate or recoverable benchmarks referenced to staff gage elevations. ¶ Condition and function of the artificial control does not affect medium and high stages. ¶ Unarmored channel capable of adjusting to the flow regime. Natural bedrock vertical and
horizontal controls are acceptable. ¶ Sufficient length (10 – 20 bankfull widths) of channel for a longitudinal profile survey
through the gage location. ¶ An acceptable study reach (ideally 20 bankfull widths) near the gage that has not been
obviously channelized or otherwise altered in the recent past. In some cases, there was
Bankfull discharge and channel characteristics of streams in the Coastal Plain hydrologic region
3
evidence of historic channel manipulations, but the age of vegetation on the banks indicated that several decades had elapsed since the work was completed. One study reach (Western Branch at Upper Marlboro, MD) had constructed revetements (boulder or gabion) along short stretches of bank, but in all such cases, the opposite bank was natural and able to adjust to the flow regime.
¶ Ten years of record from gage.
We surveyed all streams in both the Eastern and Western Coastal Plain that met these minimum criteria. As in the Maryland Piedmont, the Coastal Plain streams have been subject to centuries of anthropogenic influences, which limits the number of potential study sites. The Coastal Plain has unconsolidated gravel, sand, and clay making up the material under the soil with no rock formation (Schmidt 1993). The average annual precipitation is 40 - 48 inches per year (NOAA 2003). The surveyed streams in the Western Coastal Plain, running from the Piedmont fall line to the eastern side of the Chesapeake Bay, are fully contained in the Western Coastal Plain and include streams in both the Western Shore Uplands and Estuaries Region. The Coastal Plain on the west side of the Chesapeake Bay has greater relief than on the Eastern Coastal Plain, particularly in the southern part of Maryland where remnant coastal dunes provide steeper slopes (Schmidt 1993). Thus, our five survey sites on the Western Coastal Plain have slightly steeper gradients (avg. = 0.003 ft/ft, range = 0.002 - 0.01 ft/ft) than the streams in the Eastern Coastal Plain. We surveyed nine streams in the Eastern Coastal Plain, also called the Delmarva Peninsula region, which is relatively flat with little relief (avg. = 0.001 ft/ft, range = 0.0002 - 0.002).
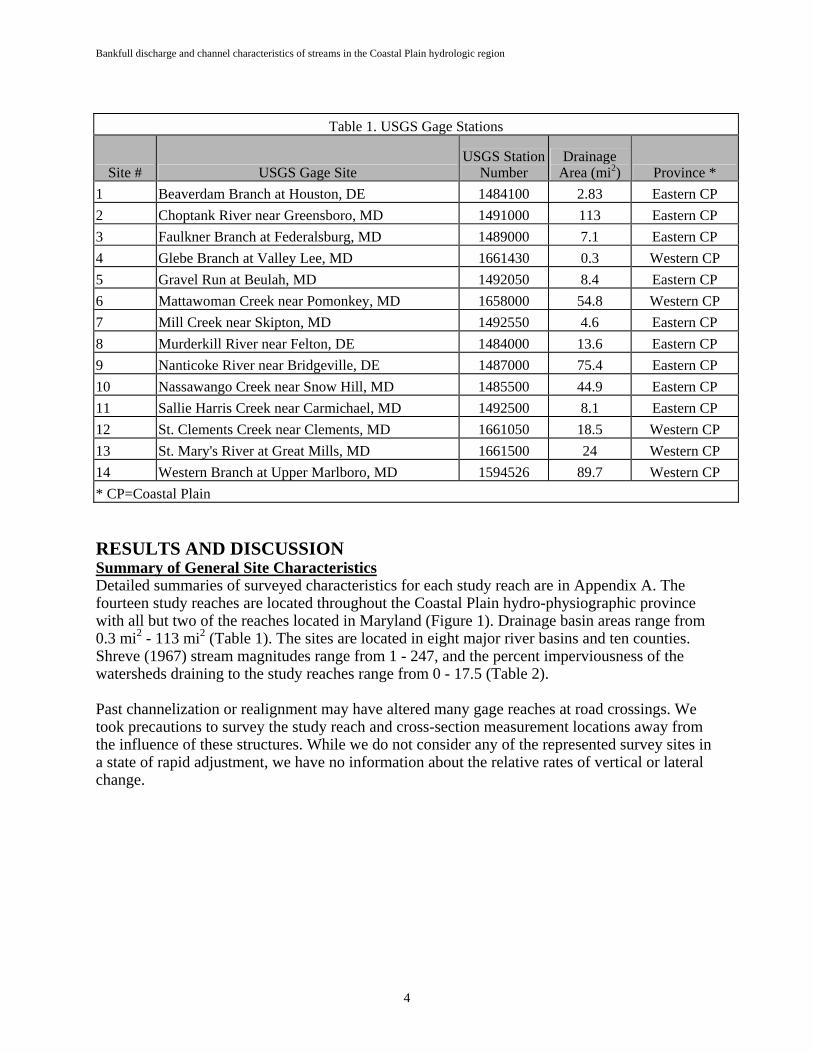
The fourteen sites selected for analysis include nine active stations, and five inactive stations of which three were operated as crest gage stations only. At the inactive stations, the USGS collected contemporary discharge measurements and prepared revised stage-discharge ratings. Table 1 provides basic information for sites included in the analysis. Appendix A, Sitecharacteristics for selected USGS gage stations in the Coastal Plain physiographic province,provides a complete description of each site.
For the majority of sites, we used a laser level to survey cross-section dimensions, meander patterns, and longitudinal profiles. For sites that were up- or downstream of a gage station, we continued the longitudinal profile surveys through the gages where possible. At three sites (Numbers 5, 13 and 14) the gage and study reaches are contiguous. For six sites (Numbers 2, 4, 7, 9, 11 and 12), the study reach starts upstream of the gage, usually due to a bridge or culvert located immediately downstream of the gage. Five sites (Numbers 1, 3, 6, 8 and 10) had a study reach which started just downstream of the gage. For these sites, we selected separate study reaches with sufficient length of homogenous channel up- or downstream of the gage reach. We used a total station to survey two sites (Numbers 3 and 8).
Before conducting the survey, we conducted a reconnaissance inspection at each site to determine whether the present bankfull conditions are representative of a stable, dynamic stream, and therefore appropriate for inclusion in the study. We did not determine the rate of change of channel morphology in the present day. The gaged sites do not necessarily represent reference reach sites. The relationships provide no information about chemical or ecological parameters, and do not necessarily represent “good” habitat conditions.
Bankfull discharge and channel characteristics of streams in the Coastal Plain hydrologic region
4
Table 1. USGS Gage Stations
Site # USGS Gage Site USGS Station
Number Drainage
Area (mi2) Province * 1 Beaverdam Branch at Houston, DE 1484100 2.83 Eastern CP 2 Choptank River near Greensboro, MD 1491000 113 Eastern CP 3 Faulkner Branch at Federalsburg, MD 1489000 7.1 Eastern CP 4 Glebe Branch at Valley Lee, MD 1661430 0.3 Western CP 5 Gravel Run at Beulah, MD 1492050 8.4 Eastern CP 6 Mattawoman Creek near Pomonkey, MD 1658000 54.8 Western CP 7 Mill Creek near Skipton, MD 1492550 4.6 Eastern CP 8 Murderkill River near Felton, DE 1484000 13.6 Eastern CP 9 Nanticoke River near Bridgeville, DE 1487000 75.4 Eastern CP 10 Nassawango Creek near Snow Hill, MD 1485500 44.9 Eastern CP 11 Sallie Harris Creek near Carmichael, MD 1492500 8.1 Eastern CP 12 St. Clements Creek near Clements, MD 1661050 18.5 Western CP 13 St. Mary's River at Great Mills, MD 1661500 24 Western CP 14 Western Branch at Upper Marlboro, MD 1594526 89.7 Western CP * CP=Coastal Plain
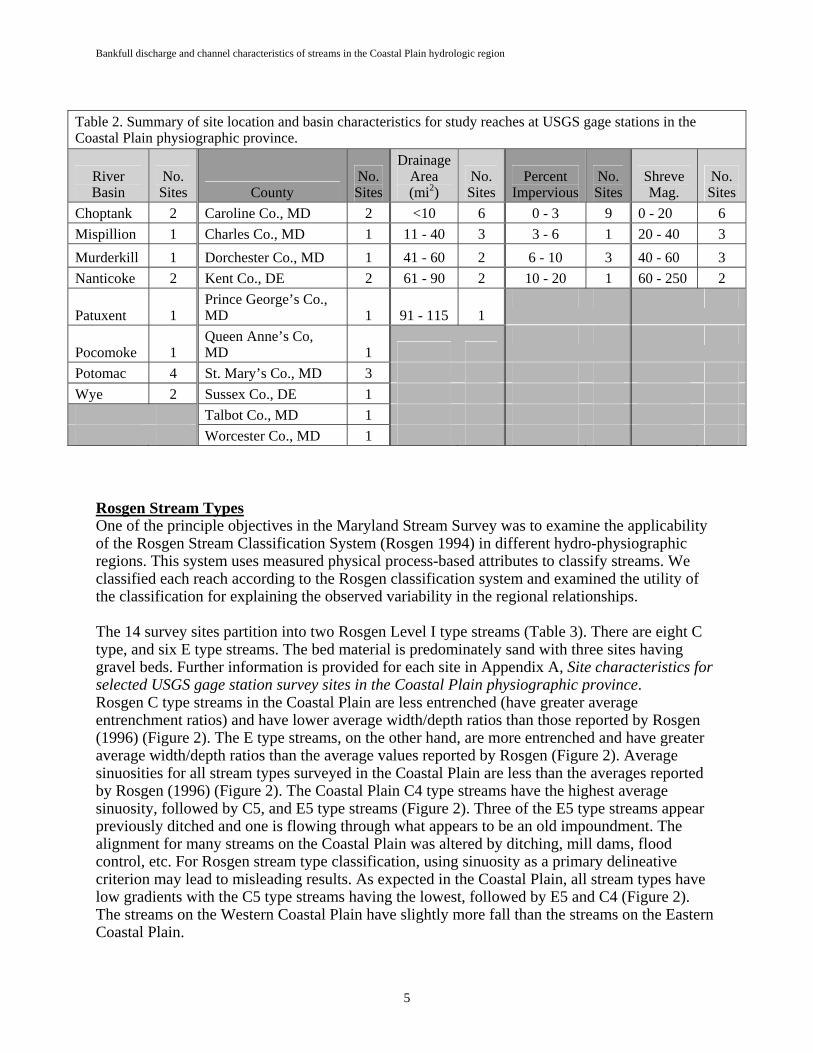
RESULTS AND DISCUSSION Summary of General Site CharacteristicsDetailed summaries of surveyed characteristics for each study reach are in Appendix A. The fourteen study reaches are located throughout the Coastal Plain hydro-physiographic province with all but two of the reaches located in Maryland (Figure 1). Drainage basin areas range from 0.3 mi2 - 113 mi2 (Table 1). The sites are located in eight major river basins and ten counties. Shreve (1967) stream magnitudes range from 1 - 247, and the percent imperviousness of the watersheds draining to the study reaches range from 0 - 17.5 (Table 2).
Past channelization or realignment may have altered many gage reaches at road crossings. We took precautions to survey the study reach and cross-section measurement locations away from the influence of these structures. While we do not consider any of the represented survey sites in a state of rapid adjustment, we have no information about the relative rates of vertical or lateral change.
Bankfull discharge and channel characteristics of streams in the Coastal Plain hydrologic region
5
Table 2. Summary of site location and basin characteristics for study reaches at USGS gage stations in the Coastal Plain physiographic province.
RiverBasin
No.Sites County
No.Sites
DrainageArea(mi2)
No.Sites
PercentImpervious
No.Sites
ShreveMag.
No.Sites
Choptank 2 Caroline Co., MD 2 <10 6 0 - 3 9 0 - 20 6 Mispillion 1 Charles Co., MD 1 11 - 40 3 3 - 6 1 20 - 40 3 Murderkill 1 Dorchester Co., MD 1 41 - 60 2 6 - 10 3 40 - 60 3 Nanticoke 2 Kent Co., DE 2 61 - 90 2 10 - 20 1 60 - 250 2
Patuxent 1 Prince George’s Co., MD 1 91 - 115 1
Pocomoke 1 Queen Anne’s Co, MD 1
Potomac 4 St. Mary’s Co., MD 3 Wye 2 Sussex Co., DE 1
Talbot Co., MD 1 Worcester Co., MD 1
Rosgen Stream TypesOne of the principle objectives in the Maryland Stream Survey was to examine the applicability of the Rosgen Stream Classification System (Rosgen 1994) in different hydro-physiographic regions. This system uses measured physical process-based attributes to classify streams. We classified each reach according to the Rosgen classification system and examined the utility of the classification for explaining the observed variability in the regional relationships.
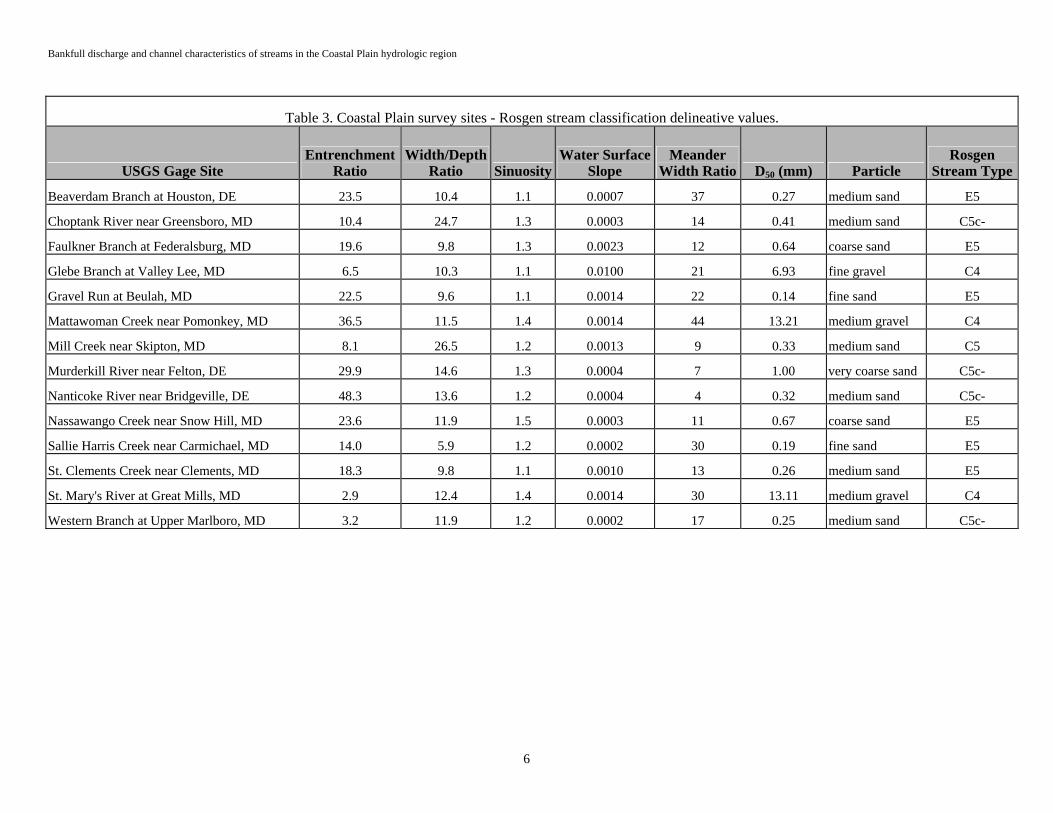
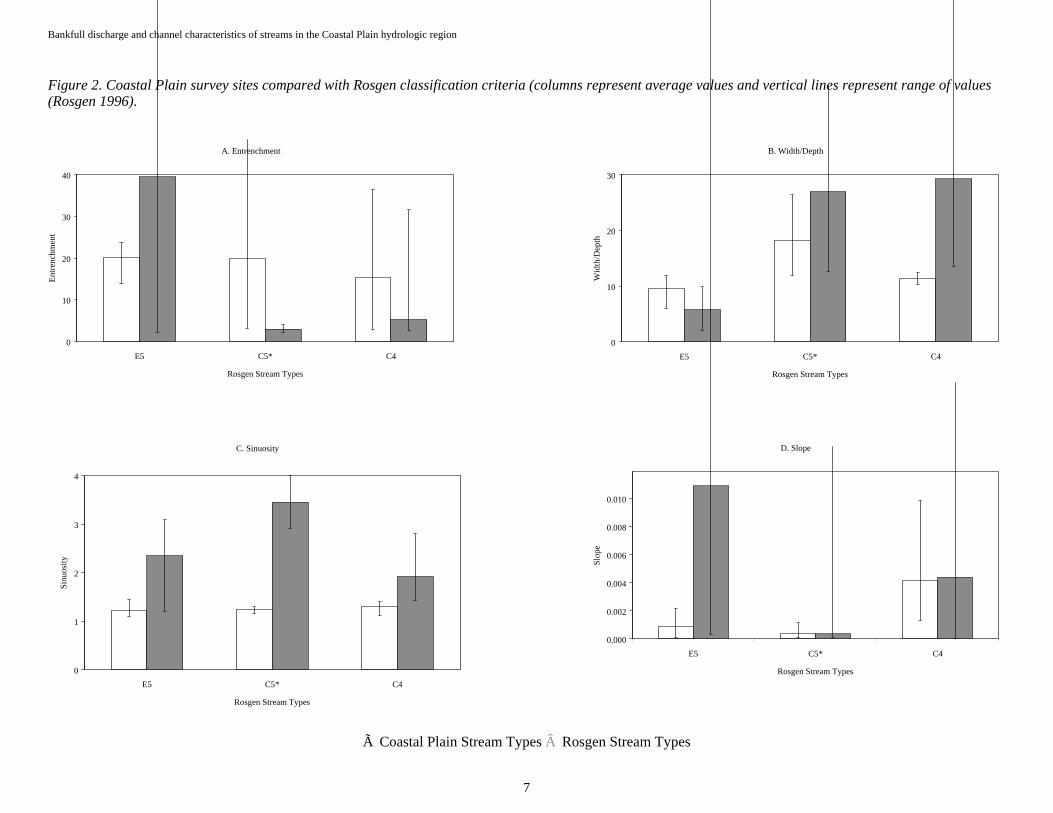
The 14 survey sites partition into two Rosgen Level I type streams (Table 3). There are eight C type, and six E type streams. The bed material is predominately sand with three sites having gravel beds. Further information is provided for each site in Appendix A, Site characteristics for selected USGS gage station survey sites in the Coastal Plain physiographic province.Rosgen C type streams in the Coastal Plain are less entrenched (have greater average entrenchment ratios) and have lower average width/depth ratios than those reported by Rosgen (1996) (Figure 2). The E type streams, on the other hand, are more entrenched and have greater average width/depth ratios than the average values reported by Rosgen (Figure 2). Average sinuosities for all stream types surveyed in the Coastal Plain are less than the averages reported by Rosgen (1996) (Figure 2). The Coastal Plain C4 type streams have the highest average sinuosity, followed by C5, and E5 type streams (Figure 2). Three of the E5 type streams appear previously ditched and one is flowing through what appears to be an old impoundment. The alignment for many streams on the Coastal Plain was altered by ditching, mill dams, flood control, etc. For Rosgen stream type classification, using sinuosity as a primary delineative criterion may lead to misleading results. As expected in the Coastal Plain, all stream types have low gradients with the C5 type streams having the lowest, followed by E5 and C4 (Figure 2). The streams on the Western Coastal Plain have slightly more fall than the streams on the Eastern Coastal Plain.
Bankfull discharge and channel characteristics of streams in the Coastal Plain hydrologic region
6
Table 3. Coastal Plain survey sites - Rosgen stream classification delineative values.
USGS Gage Site Entrenchment
RatioWidth/Depth
Ratio SinuosityWater Surface
SlopeMeander
Width Ratio D50 (mm) ParticleRosgen
Stream Type
Beaverdam Branch at Houston, DE 23.5 10.4 1.1 0.0007 37 0.27 medium sand E5
Choptank River near Greensboro, MD 10.4 24.7 1.3 0.0003 14 0.41 medium sand C5c-
Faulkner Branch at Federalsburg, MD 19.6 9.8 1.3 0.0023 12 0.64 coarse sand E5
Glebe Branch at Valley Lee, MD 6.5 10.3 1.1 0.0100 21 6.93 fine gravel C4
Gravel Run at Beulah, MD 22.5 9.6 1.1 0.0014 22 0.14 fine sand E5
Mattawoman Creek near Pomonkey, MD 36.5 11.5 1.4 0.0014 44 13.21 medium gravel C4
Mill Creek near Skipton, MD 8.1 26.5 1.2 0.0013 9 0.33 medium sand C5
Murderkill River near Felton, DE 29.9 14.6 1.3 0.0004 7 1.00 very coarse sand C5c-
Nanticoke River near Bridgeville, DE 48.3 13.6 1.2 0.0004 4 0.32 medium sand C5c-
Nassawango Creek near Snow Hill, MD 23.6 11.9 1.5 0.0003 11 0.67 coarse sand E5
Sallie Harris Creek near Carmichael, MD 14.0 5.9 1.2 0.0002 30 0.19 fine sand E5
St. Clements Creek near Clements, MD 18.3 9.8 1.1 0.0010 13 0.26 medium sand E5
St. Mary's River at Great Mills, MD 2.9 12.4 1.4 0.0014 30 13.11 medium gravel C4
Western Branch at Upper Marlboro, MD 3.2 11.9 1.2 0.0002 17 0.25 medium sand C5c-
Bankfull discharge and channel characteristics of streams in the Coastal Plain hydrologic region
7
Figure 2. Coastal Plain survey sites compared with Rosgen classification criteria (columns represent average values and vertical lines represent range of values (Rosgen 1996).
à Coastal Plain Stream Types  Rosgen Stream Types
A. Entrenchment
0
10
20
30
40
E5 C5* C4
Rosgen Stream Types
Entre
nchm
ent
B. Width/Depth
0
10
20
30
E5 C5* C4
Rosgen Stream Types
Wid
th/D
epth
C. Sinuosity
0
1
2
3
4
E5 C5* C4
Rosgen Stream Types
Sinu
osity
D. Slope
0.000
0.002
0.004
0.006
0.008
0.010
E5 C5* C4
Rosgen Stream Types
Slop
e
Bankfull discharge and channel characteristics of streams in the Allegheny Plateau/Valley and Ridge hydrologic region
8
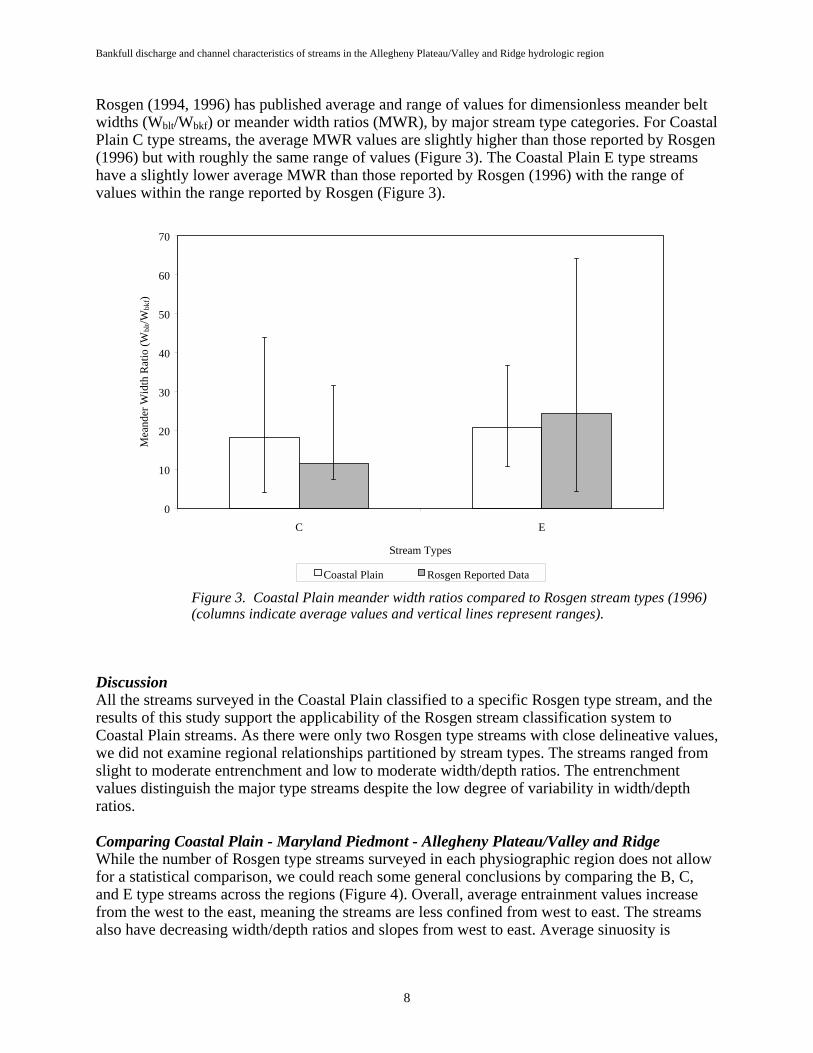
Rosgen (1994, 1996) has published average and range of values for dimensionless meander belt widths (Wblt/Wbkf) or meander width ratios (MWR), by major stream type categories. For Coastal Plain C type streams, the average MWR values are slightly higher than those reported by Rosgen (1996) but with roughly the same range of values (Figure 3). The Coastal Plain E type streams have a slightly lower average MWR than those reported by Rosgen (1996) with the range of values within the range reported by Rosgen (Figure 3).
Figure 3. Coastal Plain meander width ratios compared to Rosgen stream types (1996) (columns indicate average values and vertical lines represent ranges).
DiscussionAll the streams surveyed in the Coastal Plain classified to a specific Rosgen type stream, and the results of this study support the applicability of the Rosgen stream classification system to Coastal Plain streams. As there were only two Rosgen type streams with close delineative values, we did not examine regional relationships partitioned by stream types. The streams ranged from slight to moderate entrenchment and low to moderate width/depth ratios. The entrenchment values distinguish the major type streams despite the low degree of variability in width/depth ratios.
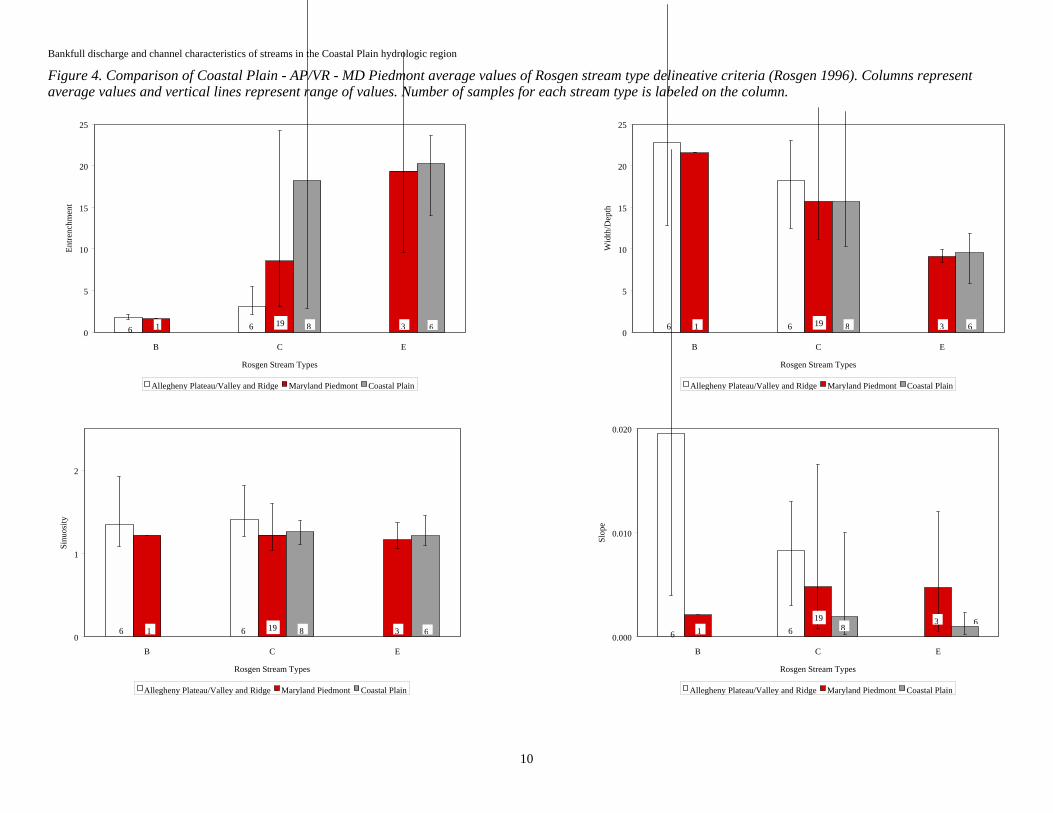
Comparing Coastal Plain - Maryland Piedmont - Allegheny Plateau/Valley and Ridge While the number of Rosgen type streams surveyed in each physiographic region does not allow for a statistical comparison, we could reach some general conclusions by comparing the B, C, and E type streams across the regions (Figure 4). Overall, average entrainment values increase from the west to the east, meaning the streams are less confined from west to east. The streams also have decreasing width/depth ratios and slopes from west to east. Average sinuosity is
0
10
20
30
40
50
60
70
C E
Stream Types
Mea
nder
Wid
th R
atio
(Wbl
t/Wbk
f)
Coastal Plain Rosgen Reported Data
Bankfull discharge and channel characteristics of streams in the Allegheny Plateau/Valley and Ridge hydrologic region
9
slightly higher in the AP/VR for B and C type streams, which may indicate alteration associated with Piedmont and Coastal Plain streams.
The average entrenchment values are higher for C and E type streams in the Coastal Plain than in the MD Piedmont. The width/depth and sinuosity average values for Coastal Plain and MD Piedmont C and E type streams are similar. As expected, the Coastal Plain average slope values for both C and E type streams are less than MD Piedmont C and E type streams.
Bankfull discharge and channel characteristics of streams in the Coastal Plain hydrologic region
10
Figure 4. Comparison of Coastal Plain - AP/VR - MD Piedmont average values of Rosgen stream type delineative criteria (Rosgen 1996). Columns represent average values and vertical lines represent range of values. Number of samples for each stream type is labeled on the column.
0
5
10
15
20
25
B C E
Rosgen Stream Types
Entre
nchm
ent
Allegheny Plateau/Valley and Ridge Maryland Piedmont Coastal Plain
6 1 6 19 8 3 60
5
10
15
20
25
B C E
Rosgen Stream Types
Wid
th/D
epth
Allegheny Plateau/Valley and Ridge Maryland Piedmont Coastal Plain
6 1 6 19 8 3 6
0
1
2
B C E
Rosgen Stream Types
Sinu
osity
Allegheny Plateau/Valley and Ridge Maryland Piedmont Coastal Plain
6 1 6 19 8 3 60.000
0.010
0.020
B C E
Rosgen Stream Types
Slop
e
Allegheny Plateau/Valley and Ridge Maryland Piedmont Coastal Plain
6 1 619
83 6
Bankfull discharge and channel characteristics of streams in the Coastal Plain hydrologic region
11
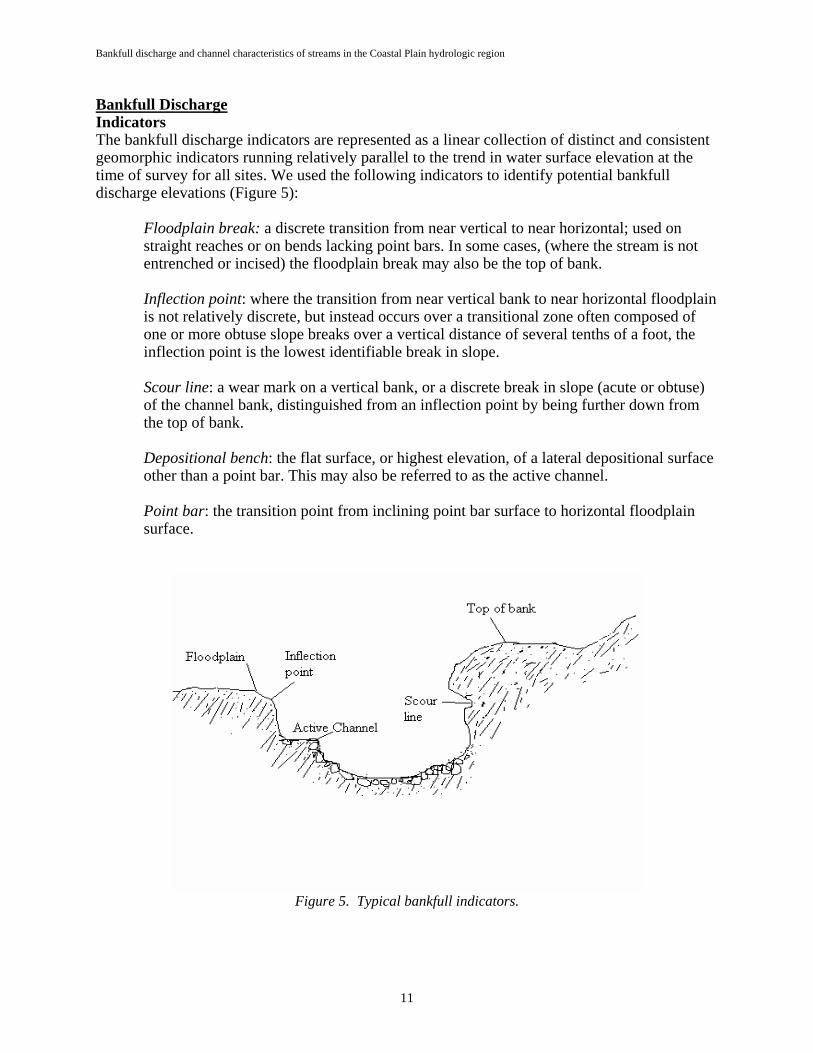
Bankfull DischargeIndicatorsThe bankfull discharge indicators are represented as a linear collection of distinct and consistent geomorphic indicators running relatively parallel to the trend in water surface elevation at the time of survey for all sites. We used the following indicators to identify potential bankfull discharge elevations (Figure 5):
Floodplain break: a discrete transition from near vertical to near horizontal; used on straight reaches or on bends lacking point bars. In some cases, (where the stream is not entrenched or incised) the floodplain break may also be the top of bank.
Inflection point: where the transition from near vertical bank to near horizontal floodplain is not relatively discrete, but instead occurs over a transitional zone often composed of one or more obtuse slope breaks over a vertical distance of several tenths of a foot, the inflection point is the lowest identifiable break in slope.
Scour line: a wear mark on a vertical bank, or a discrete break in slope (acute or obtuse) of the channel bank, distinguished from an inflection point by being further down from the top of bank.
Depositional bench: the flat surface, or highest elevation, of a lateral depositional surface other than a point bar. This may also be referred to as the active channel.
Point bar: the transition point from inclining point bar surface to horizontal floodplain surface.
Figure 5. Typical bankfull indicators.
Bankfull discharge and channel characteristics of streams in the Coastal Plain hydrologic region
12
For a detailed discussion on bankfull indicators, refer to the report Maryland Stream Survey: Bankfull Discharge and Channel Characteristics in the Piedmont Hydrologic Region(McCandless and Everett 2002).
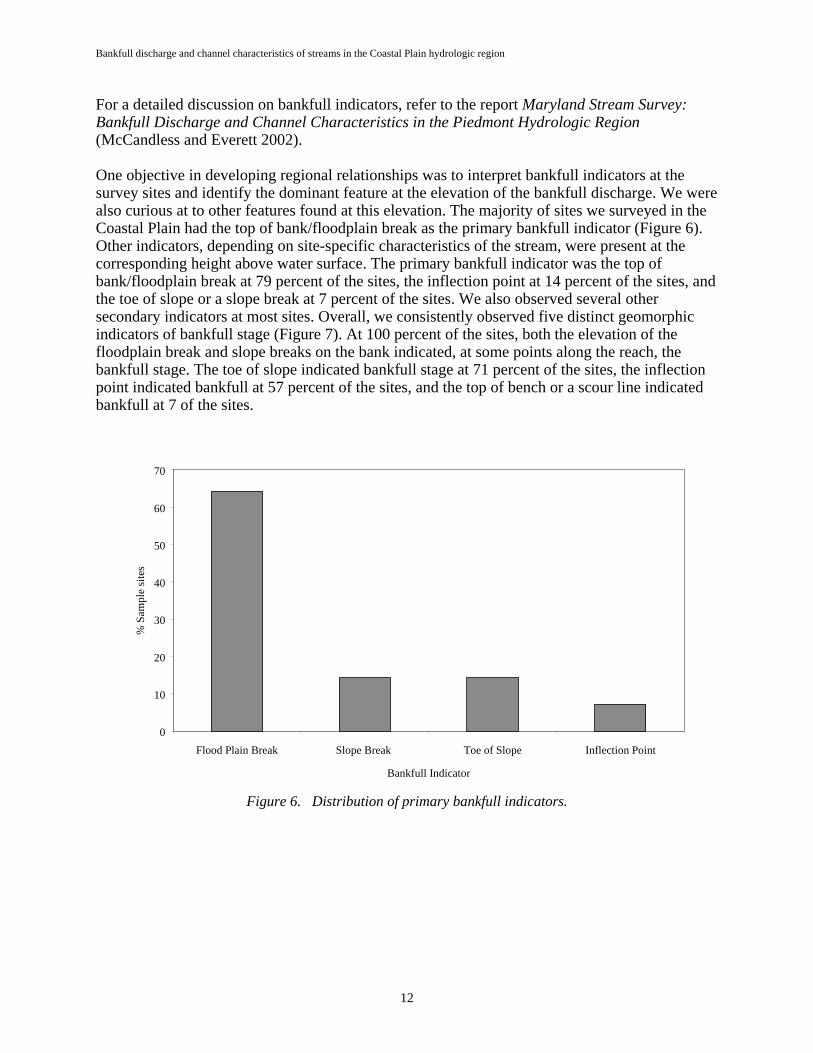
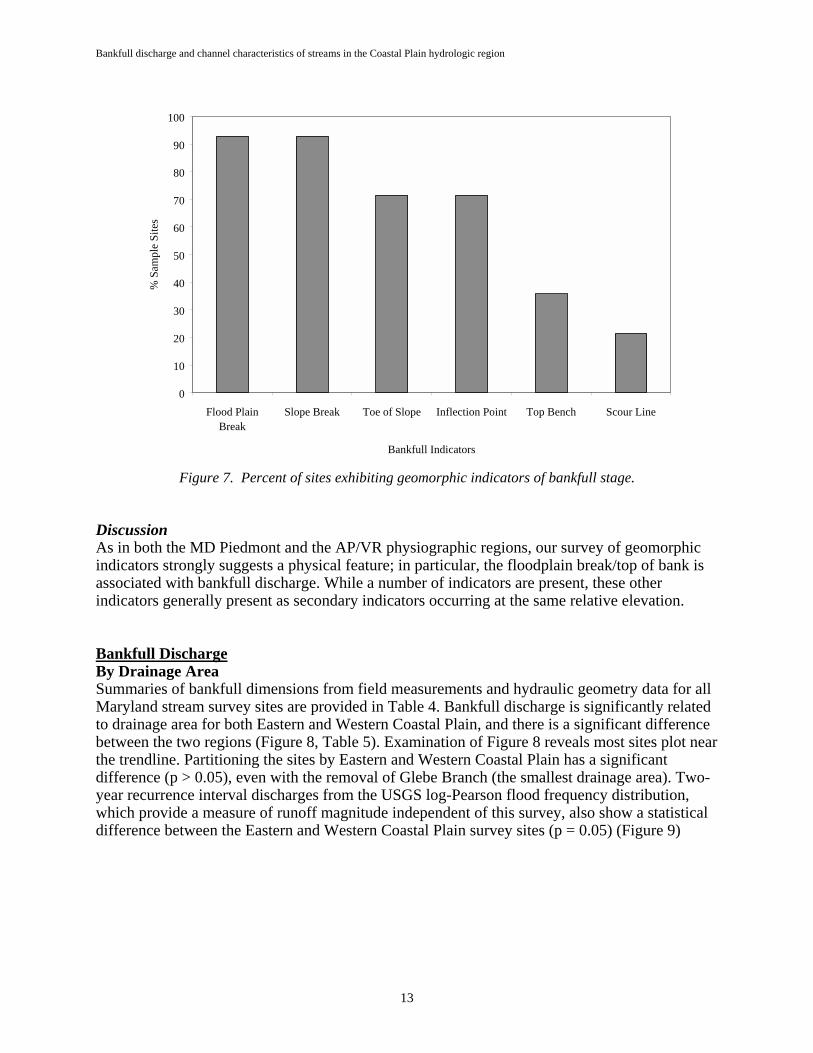
One objective in developing regional relationships was to interpret bankfull indicators at the survey sites and identify the dominant feature at the elevation of the bankfull discharge. We were also curious at to other features found at this elevation. The majority of sites we surveyed in the Coastal Plain had the top of bank/floodplain break as the primary bankfull indicator (Figure 6). Other indicators, depending on site-specific characteristics of the stream, were present at the corresponding height above water surface. The primary bankfull indicator was the top of bank/floodplain break at 79 percent of the sites, the inflection point at 14 percent of the sites, and the toe of slope or a slope break at 7 percent of the sites. We also observed several other secondary indicators at most sites. Overall, we consistently observed five distinct geomorphic indicators of bankfull stage (Figure 7). At 100 percent of the sites, both the elevation of the floodplain break and slope breaks on the bank indicated, at some points along the reach, the bankfull stage. The toe of slope indicated bankfull stage at 71 percent of the sites, the inflection point indicated bankfull at 57 percent of the sites, and the top of bench or a scour line indicated bankfull at 7 of the sites.
Figure 6. Distribution of primary bankfull indicators.
0
10
20
30
40
50
60
70
Flood Plain Break Slope Break Toe of Slope Inflection Point
Bankfull Indicator
% S
ampl
e si
tes
Bankfull discharge and channel characteristics of streams in the Coastal Plain hydrologic region
13
Figure 7. Percent of sites exhibiting geomorphic indicators of bankfull stage.
DiscussionAs in both the MD Piedmont and the AP/VR physiographic regions, our survey of geomorphic indicators strongly suggests a physical feature; in particular, the floodplain break/top of bank is associated with bankfull discharge. While a number of indicators are present, these other indicators generally present as secondary indicators occurring at the same relative elevation.
Bankfull DischargeBy Drainage Area Summaries of bankfull dimensions from field measurements and hydraulic geometry data for all Maryland stream survey sites are provided in Table 4. Bankfull discharge is significantly related to drainage area for both Eastern and Western Coastal Plain, and there is a significant difference between the two regions (Figure 8, Table 5). Examination of Figure 8 reveals most sites plot near the trendline. Partitioning the sites by Eastern and Western Coastal Plain has a significant difference (p > 0.05), even with the removal of Glebe Branch (the smallest drainage area). Two-year recurrence interval discharges from the USGS log-Pearson flood frequency distribution, which provide a measure of runoff magnitude independent of this survey, also show a statistical difference between the Eastern and Western Coastal Plain survey sites (p = 0.05) (Figure 9)
0
10
20
30
40
50
60
70
80
90
100
Flood PlainBreak
Slope Break Toe of Slope Inflection Point Top Bench Scour Line
Bankfull Indicators
% S
ampl
e Si
tes
Bankfull discharge and channel characteristics of streams in the Coastal Plain hydrologic region
14
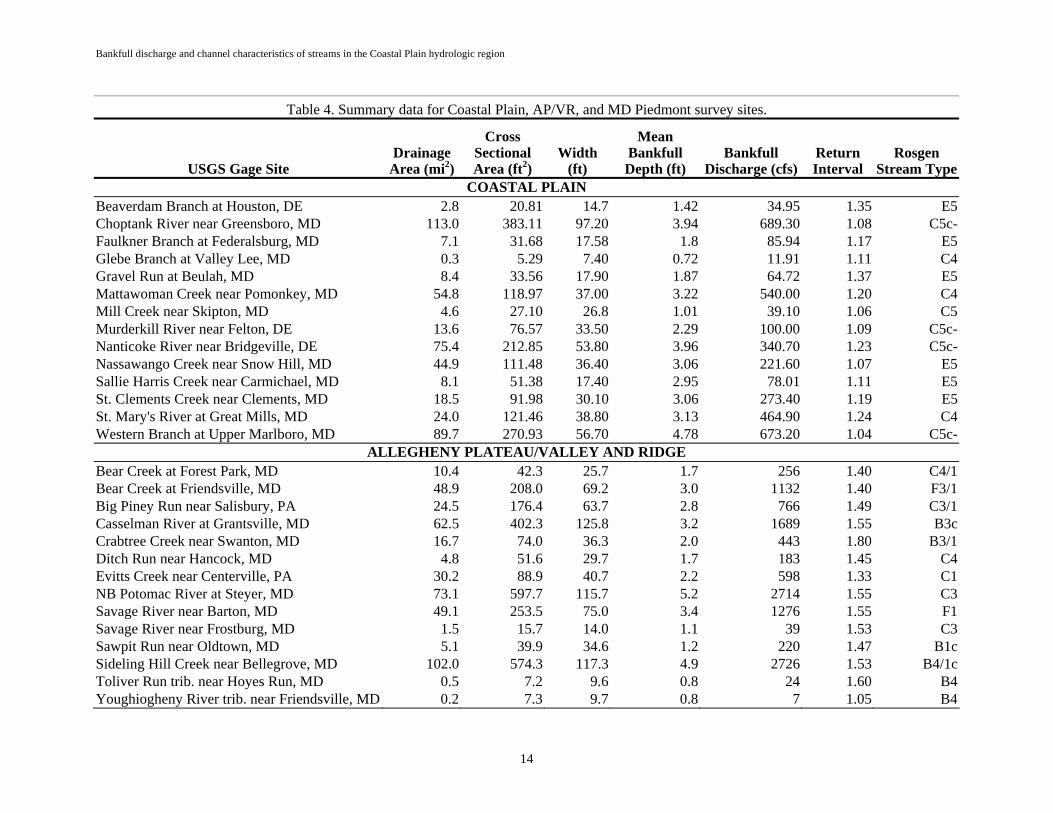
Table 4. Summary data for Coastal Plain, AP/VR, and MD Piedmont survey sites.
USGS Gage Site Drainage
Area (mi2)
CrossSectionalArea (ft2)
Width(ft)
MeanBankfullDepth (ft)
BankfullDischarge (cfs)
ReturnInterval
RosgenStream Type
COASTAL PLAINBeaverdam Branch at Houston, DE 2.8 20.81 14.7 1.42 34.95 1.35 E5Choptank River near Greensboro, MD 113.0 383.11 97.20 3.94 689.30 1.08 C5c-Faulkner Branch at Federalsburg, MD 7.1 31.68 17.58 1.8 85.94 1.17 E5Glebe Branch at Valley Lee, MD 0.3 5.29 7.40 0.72 11.91 1.11 C4Gravel Run at Beulah, MD 8.4 33.56 17.90 1.87 64.72 1.37 E5Mattawoman Creek near Pomonkey, MD 54.8 118.97 37.00 3.22 540.00 1.20 C4Mill Creek near Skipton, MD 4.6 27.10 26.8 1.01 39.10 1.06 C5Murderkill River near Felton, DE 13.6 76.57 33.50 2.29 100.00 1.09 C5c-Nanticoke River near Bridgeville, DE 75.4 212.85 53.80 3.96 340.70 1.23 C5c-Nassawango Creek near Snow Hill, MD 44.9 111.48 36.40 3.06 221.60 1.07 E5Sallie Harris Creek near Carmichael, MD 8.1 51.38 17.40 2.95 78.01 1.11 E5St. Clements Creek near Clements, MD 18.5 91.98 30.10 3.06 273.40 1.19 E5St. Mary's River at Great Mills, MD 24.0 121.46 38.80 3.13 464.90 1.24 C4Western Branch at Upper Marlboro, MD 89.7 270.93 56.70 4.78 673.20 1.04 C5c-
ALLEGHENY PLATEAU/VALLEY AND RIDGEBear Creek at Forest Park, MD 10.4 42.3 25.7 1.7 256 1.40 C4/1Bear Creek at Friendsville, MD 48.9 208.0 69.2 3.0 1132 1.40 F3/1Big Piney Run near Salisbury, PA 24.5 176.4 63.7 2.8 766 1.49 C3/1Casselman River at Grantsville, MD 62.5 402.3 125.8 3.2 1689 1.55 B3cCrabtree Creek near Swanton, MD 16.7 74.0 36.3 2.0 443 1.80 B3/1Ditch Run near Hancock, MD 4.8 51.6 29.7 1.7 183 1.45 C4Evitts Creek near Centerville, PA 30.2 88.9 40.7 2.2 598 1.33 C1NB Potomac River at Steyer, MD 73.1 597.7 115.7 5.2 2714 1.55 C3 Savage River near Barton, MD 49.1 253.5 75.0 3.4 1276 1.55 F1Savage River near Frostburg, MD 1.5 15.7 14.0 1.1 39 1.53 C3Sawpit Run near Oldtown, MD 5.1 39.9 34.6 1.2 220 1.47 B1cSideling Hill Creek near Bellegrove, MD 102.0 574.3 117.3 4.9 2726 1.53 B4/1cToliver Run trib. near Hoyes Run, MD 0.5 7.2 9.6 0.8 24 1.60 B4Youghiogheny River trib. near Friendsville, MD 0.2 7.3 9.7 0.8 7 1.05 B4
Bankfull discharge and channel characteristics of streams in the Coastal Plain hydrologic region
15
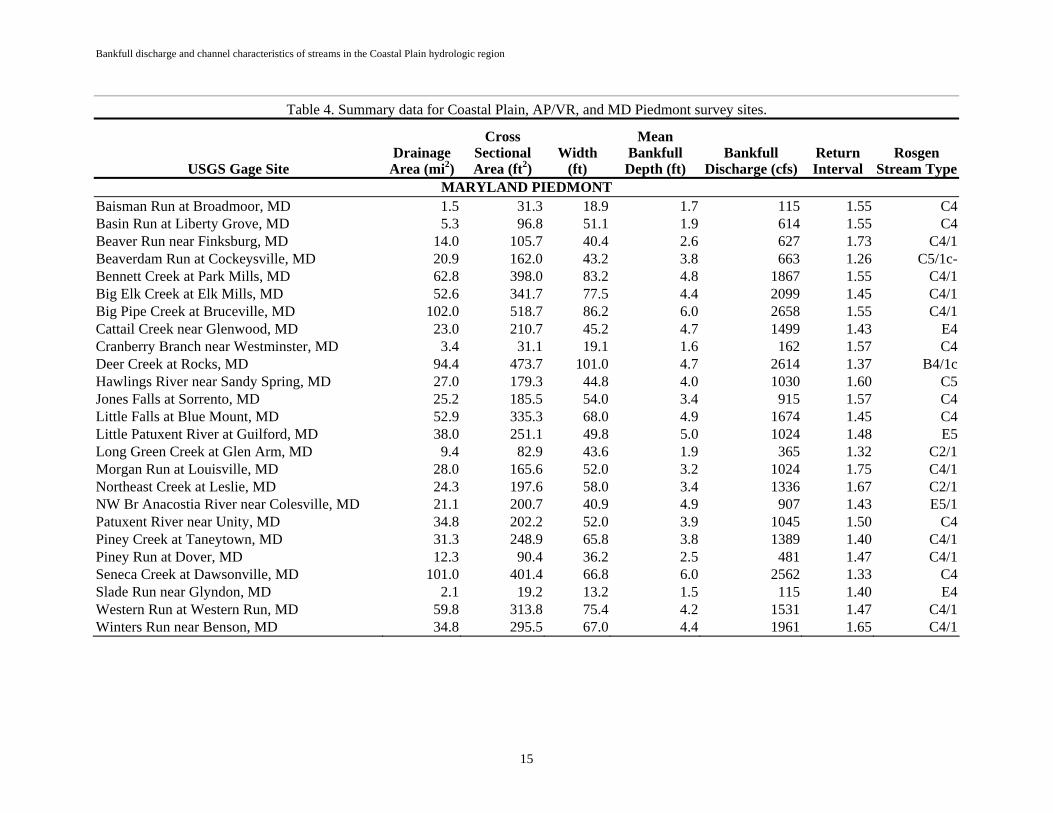
Table 4. Summary data for Coastal Plain, AP/VR, and MD Piedmont survey sites.
USGS Gage Site Drainage
Area (mi2)
CrossSectionalArea (ft2)
Width(ft)
MeanBankfullDepth (ft)
BankfullDischarge (cfs)
ReturnInterval
RosgenStream Type
MARYLAND PIEDMONT Baisman Run at Broadmoor, MD 1.5 31.3 18.9 1.7 115 1.55 C4Basin Run at Liberty Grove, MD 5.3 96.8 51.1 1.9 614 1.55 C4Beaver Run near Finksburg, MD 14.0 105.7 40.4 2.6 627 1.73 C4/1Beaverdam Run at Cockeysville, MD 20.9 162.0 43.2 3.8 663 1.26 C5/1c-Bennett Creek at Park Mills, MD 62.8 398.0 83.2 4.8 1867 1.55 C4/1Big Elk Creek at Elk Mills, MD 52.6 341.7 77.5 4.4 2099 1.45 C4/1Big Pipe Creek at Bruceville, MD 102.0 518.7 86.2 6.0 2658 1.55 C4/1Cattail Creek near Glenwood, MD 23.0 210.7 45.2 4.7 1499 1.43 E4Cranberry Branch near Westminster, MD 3.4 31.1 19.1 1.6 162 1.57 C4Deer Creek at Rocks, MD 94.4 473.7 101.0 4.7 2614 1.37 B4/1cHawlings River near Sandy Spring, MD 27.0 179.3 44.8 4.0 1030 1.60 C5Jones Falls at Sorrento, MD 25.2 185.5 54.0 3.4 915 1.57 C4Little Falls at Blue Mount, MD 52.9 335.3 68.0 4.9 1674 1.45 C4Little Patuxent River at Guilford, MD 38.0 251.1 49.8 5.0 1024 1.48 E5Long Green Creek at Glen Arm, MD 9.4 82.9 43.6 1.9 365 1.32 C2/1Morgan Run at Louisville, MD 28.0 165.6 52.0 3.2 1024 1.75 C4/1Northeast Creek at Leslie, MD 24.3 197.6 58.0 3.4 1336 1.67 C2/1NW Br Anacostia River near Colesville, MD 21.1 200.7 40.9 4.9 907 1.43 E5/1Patuxent River near Unity, MD 34.8 202.2 52.0 3.9 1045 1.50 C4Piney Creek at Taneytown, MD 31.3 248.9 65.8 3.8 1389 1.40 C4/1Piney Run at Dover, MD 12.3 90.4 36.2 2.5 481 1.47 C4/1Seneca Creek at Dawsonville, MD 101.0 401.4 66.8 6.0 2562 1.33 C4Slade Run near Glyndon, MD 2.1 19.2 13.2 1.5 115 1.40 E4Western Run at Western Run, MD 59.8 313.8 75.4 4.2 1531 1.47 C4/1Winters Run near Benson, MD 34.8 295.5 67.0 4.4 1961 1.65 C4/1
Bankfull discharge and channel characteristics of streams in the Coastal Plain hydrologic region
16
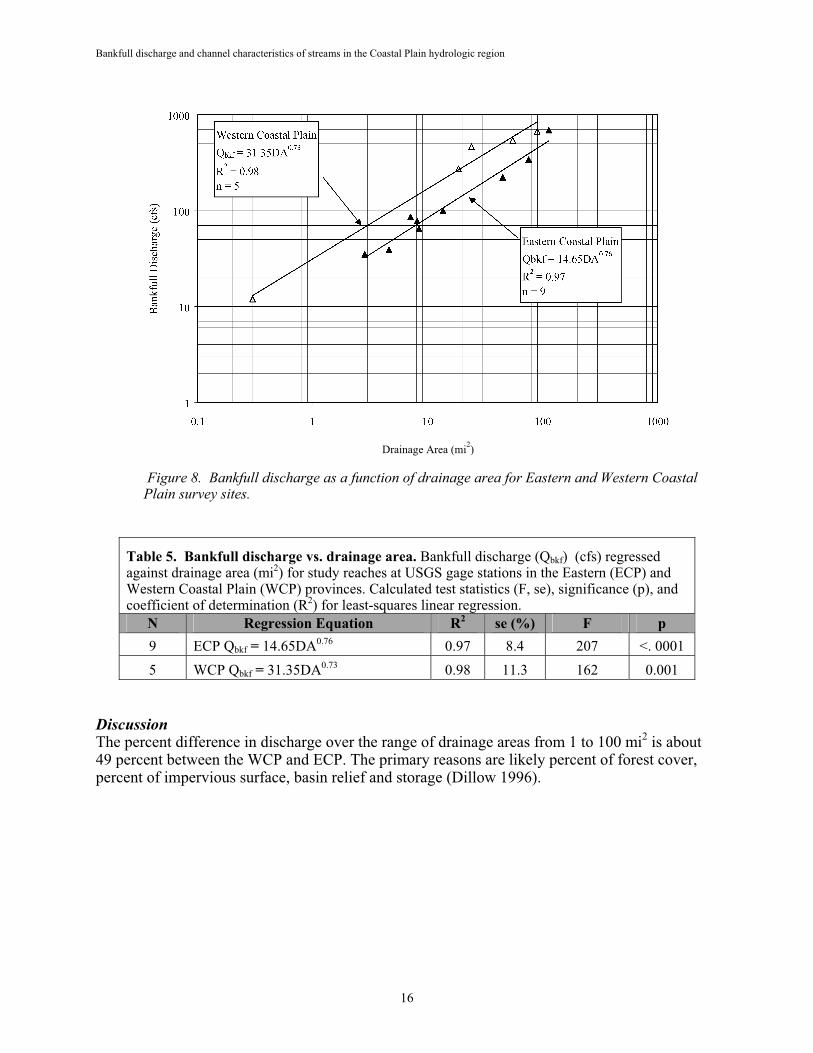
Figure 8. Bankfull discharge as a function of drainage area for Eastern and Western Coastal Plain survey sites.
Table 5. Bankfull discharge vs. drainage area. Bankfull discharge (Qbkf) (cfs) regressed against drainage area (mi2) for study reaches at USGS gage stations in the Eastern (ECP) and Western Coastal Plain (WCP) provinces. Calculated test statistics (F, se), significance (p), and coefficient of determination (R2) for least-squares linear regression.
N Regression Equation R2
se (%) F p
9 ECP Qbkf = 14.65DA0.76 0.97 8.4 207 <. 0001
5 WCP Qbkf = 31.35DA0.73 0.98 11.3 162 0.001
Discussion
The percent difference in discharge over the range of drainage areas from 1 to 100 mi2 is about
49 percent between the WCP and ECP. The primary reasons are likely percent of forest cover, percent of impervious surface, basin relief and storage (Dillow 1996).
Western Coastal Plain
Qbkf = 31.35DA0.73
R2 = 0.98
n = 5
Eastern Coastal Plain
Qbkf = 14.65DA0.76
R2 = 0.97
n = 9
1
10
100
1000
0.1 1 10 100 1000
Drainage Area (mi2)
Ban
kfu
ll D
isch
arg
e (c
fs)
Bankfull discharge and channel characteristics of streams in the Coastal Plain hydrologic region
17
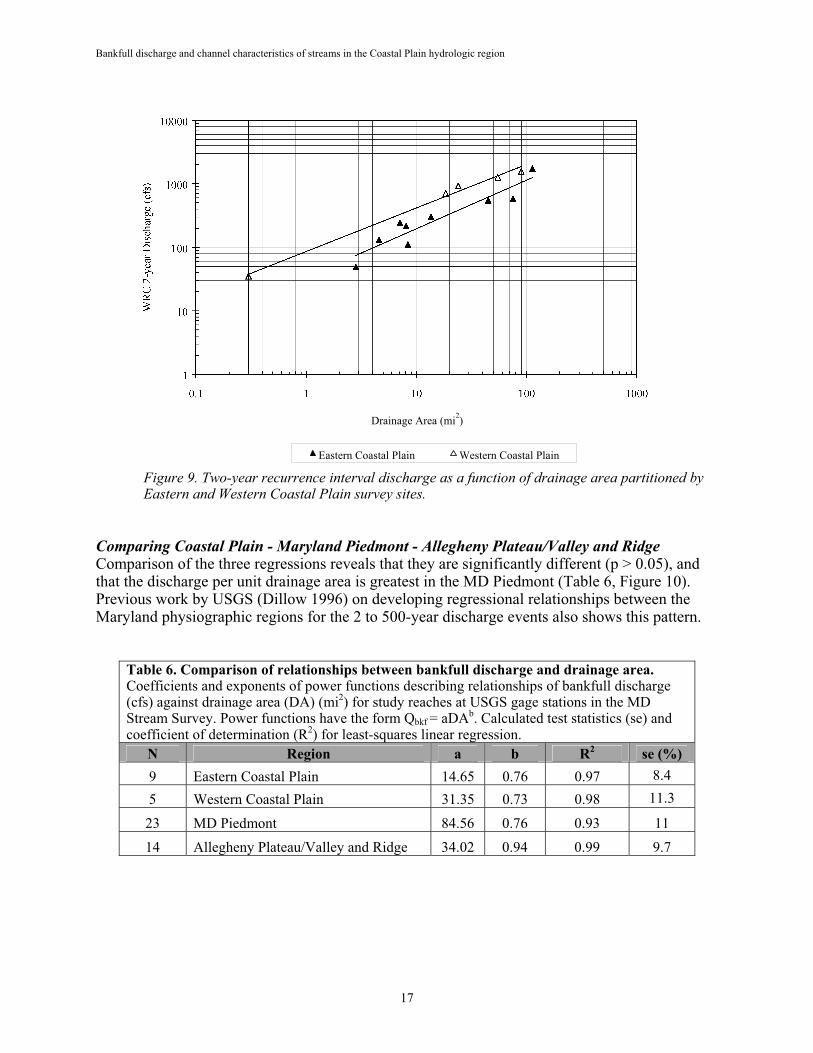
Figure 9. Two-year recurrence interval discharge as a function of drainage area partitioned by Eastern and Western Coastal Plain survey sites.
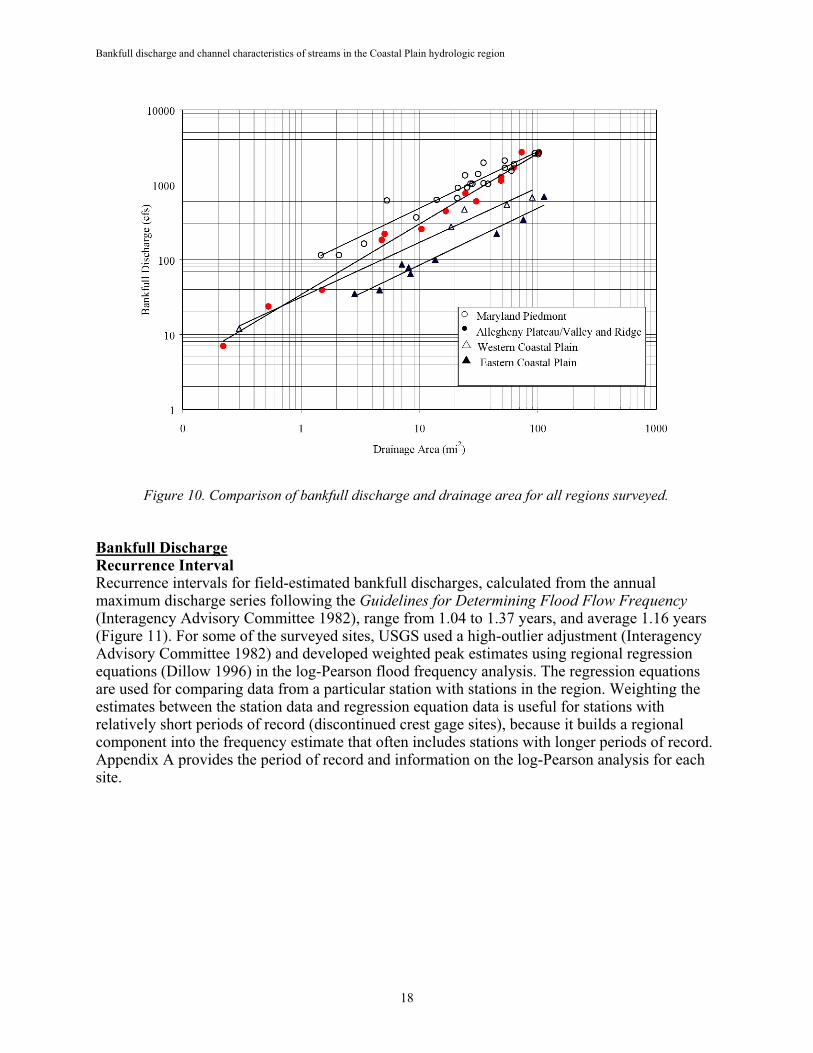
Comparing Coastal Plain - Maryland Piedmont - Allegheny Plateau/Valley and Ridge Comparison of the three regressions reveals that they are significantly different (p > 0.05), and that the discharge per unit drainage area is greatest in the MD Piedmont (Table 6, Figure 10). Previous work by USGS (Dillow 1996) on developing regressional relationships between the Maryland physiographic regions for the 2 to 500-year discharge events also shows this pattern.
Table 6. Comparison of relationships between bankfull discharge and drainage area. Coefficients and exponents of power functions describing relationships of bankfull discharge (cfs) against drainage area (DA) (mi2) for study reaches at USGS gage stations in the MD Stream Survey. Power functions have the form Qbkf = aDAb. Calculated test statistics (se) and coefficient of determination (R2) for least-squares linear regression.
N Region a
b R2 se (%)
9 Eastern Coastal Plain 14.65 0.76 0.97 8.4
5 Western Coastal Plain 31.35 0.73 0.98 11.3
23 MD Piedmont 84.56 0.76 0.93 11
14 Allegheny Plateau/Valley and Ridge 34.02 0.94 0.99 9.7
1
10
100
1000
10000
0.1 1 10 100 1000
Drainage Area (mi2)
WR
C 2
-yea
r D
isch
arg
e (c
fs)
Eastern Coastal Plain Western Coastal Plain
Bankfull discharge and channel characteristics of streams in the Coastal Plain hydrologic region
18
Figure 10. Comparison of bankfull discharge and drainage area for all regions surveyed.
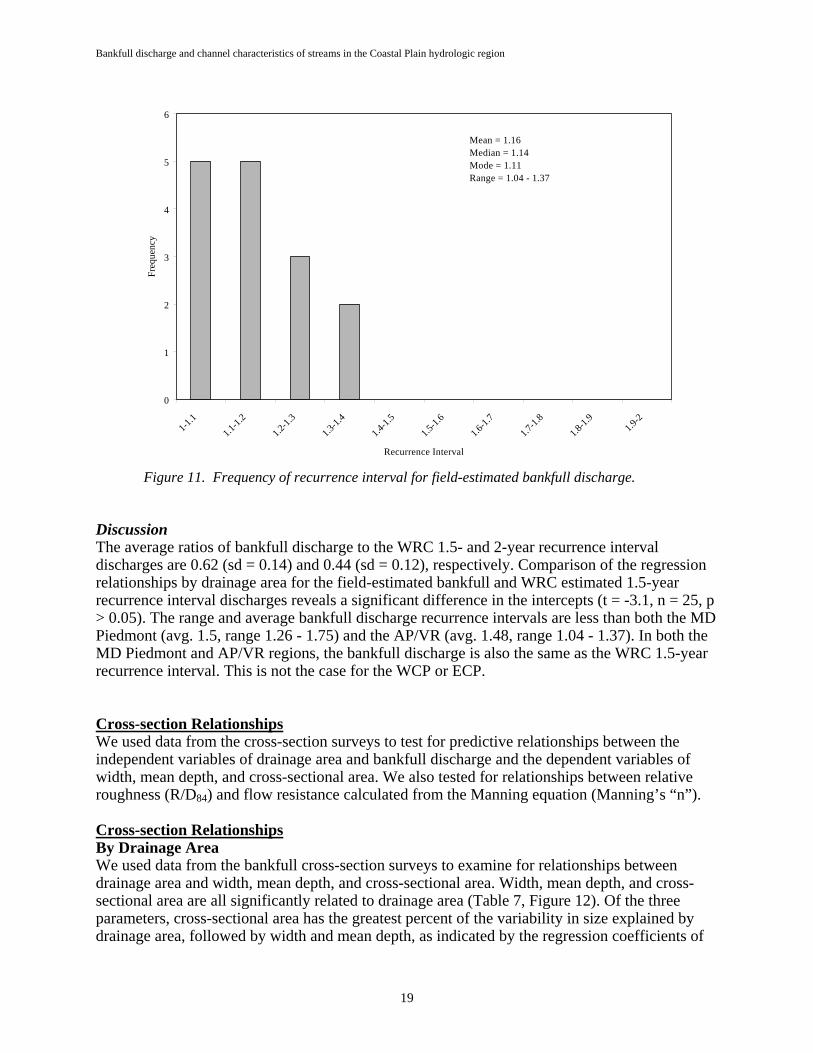
Bankfull Discharge Recurrence Interval Recurrence intervals for field-estimated bankfull discharges, calculated from the annual maximum discharge series following the Guidelines for Determining Flood Flow Frequency (Interagency Advisory Committee 1982), range from 1.04 to 1.37 years, and average 1.16 years (Figure 11). For some of the surveyed sites, USGS used a high-outlier adjustment (Interagency Advisory Committee 1982) and developed weighted peak estimates using regional regression equations (Dillow 1996) in the log-Pearson flood frequency analysis. The regression equations are used for comparing data from a particular station with stations in the region. Weighting the estimates between the station data and regression equation data is useful for stations with relatively short periods of record (discontinued crest gage sites), because it builds a regional component into the frequency estimate that often includes stations with longer periods of record. Appendix A provides the period of record and information on the log-Pearson analysis for each site.
1
10
100
1000
10000
0 1 10 100 1000
Drainage Area (mi2)
Ban
kfu
ll D
isch
arg
e (c
fs)
Maryland Piedmont
Allegheny Plateau/Valley and Ridge
Western Coastal Plain
Eastern Coastal Plain
Bankfull discharge and channel characteristics of streams in the Coastal Plain hydrologic region
19
Figure 11. Frequency of recurrence interval for field-estimated bankfull discharge.
DiscussionThe average ratios of bankfull discharge to the WRC 1.5- and 2-year recurrence interval discharges are 0.62 (sd = 0.14) and 0.44 (sd = 0.12), respectively. Comparison of the regression relationships by drainage area for the field-estimated bankfull and WRC estimated 1.5-year recurrence interval discharges reveals a significant difference in the intercepts (t = -3.1, n = 25, p > 0.05). The range and average bankfull discharge recurrence intervals are less than both the MD Piedmont (avg. 1.5, range 1.26 - 1.75) and the AP/VR (avg. 1.48, range 1.04 - 1.37). In both the MD Piedmont and AP/VR regions, the bankfull discharge is also the same as the WRC 1.5-year recurrence interval. This is not the case for the WCP or ECP.
Cross-section RelationshipsWe used data from the cross-section surveys to test for predictive relationships between the independent variables of drainage area and bankfull discharge and the dependent variables of width, mean depth, and cross-sectional area. We also tested for relationships between relative roughness (R/D84) and flow resistance calculated from the Manning equation (Manning’s “n”).
Cross-section RelationshipsBy Drainage Area We used data from the bankfull cross-section surveys to examine for relationships between drainage area and width, mean depth, and cross-sectional area. Width, mean depth, and cross-sectional area are all significantly related to drainage area (Table 7, Figure 12). Of the three parameters, cross-sectional area has the greatest percent of the variability in size explained by drainage area, followed by width and mean depth, as indicated by the regression coefficients of
0
1
2
3
4
5
6
1-1.1
1.1-1.
2
1.2-1.
3
1.3-1.
4
1.4-1.
5
1.5-1.
6
1.6-1.
7
1.7-1.
8
1.8-1.
91.9
-2
Recurrence Interval
Freq
uenc
yMean = 1.16Median = 1.14Mode = 1.11Range = 1.04 - 1.37
Bankfull discharge and channel characteristics of streams in the Coastal Plain hydrologic region
20
determination (R2 values). Partitioning the sites by WCP and ECP does not result in significant
differences in bankfull dimensions versus drainage area.
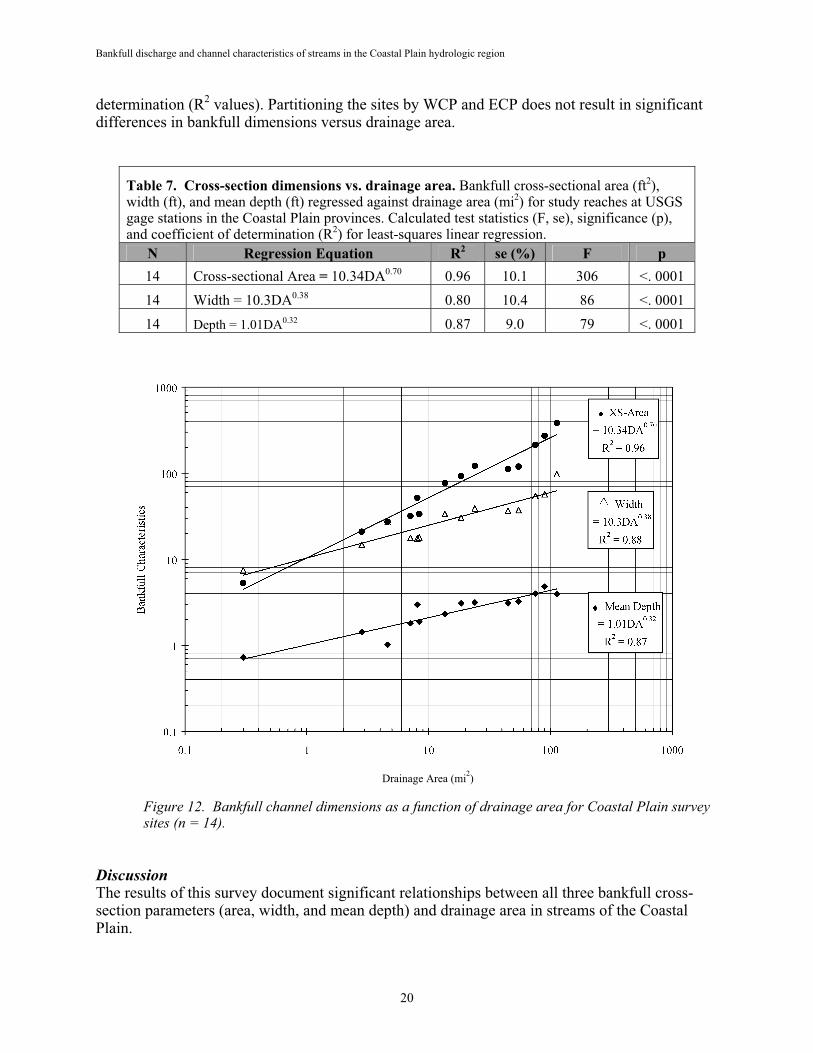
Table 7. Cross-section dimensions vs. drainage area. Bankfull cross-sectional area (ft2), width (ft), and mean depth (ft) regressed against drainage area (mi2) for study reaches at USGS gage stations in the Coastal Plain provinces. Calculated test statistics (F, se), significance (p), and coefficient of determination (R2) for least-squares linear regression.
N Regression Equation R2
se (%) F p
14 Cross-sectional Area = 10.34DA0.70 0.96 10.1 306 <. 0001
14 Width = 10.3DA0.38 0.80 10.4 86 <. 0001
14 Depth = 1.01DA0.32 0.87 9.0 79 <. 0001
Figure 12. Bankfull channel dimensions as a function of drainage area for Coastal Plain survey sites (n = 14).
Discussion
The results of this survey document significant relationships between all three bankfull cross-section parameters (area, width, and mean depth) and drainage area in streams of the Coastal Plain.
XS-Area
= 10.34DA0.70
R2 = 0.96
Width
= 10.3DA0.38
R2 = 0.88
Mean Depth
= 1.01DA0.32
R2 = 0.87
0.1
1
10
100
1000
0.1 1 10 100 1000
Drainage Area (mi2)
Ban
kfu
ll C
har
acte
rist
ics
Bankfull discharge and channel characteristics of streams in the Coastal Plain hydrologic region
21
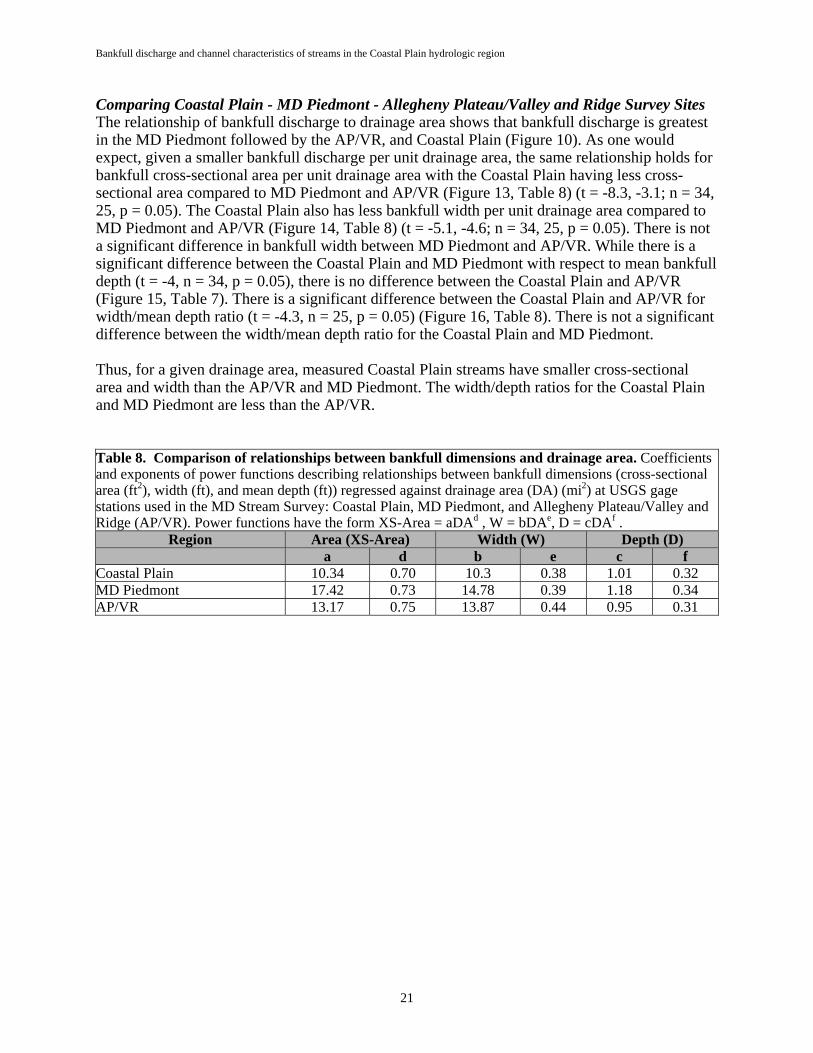
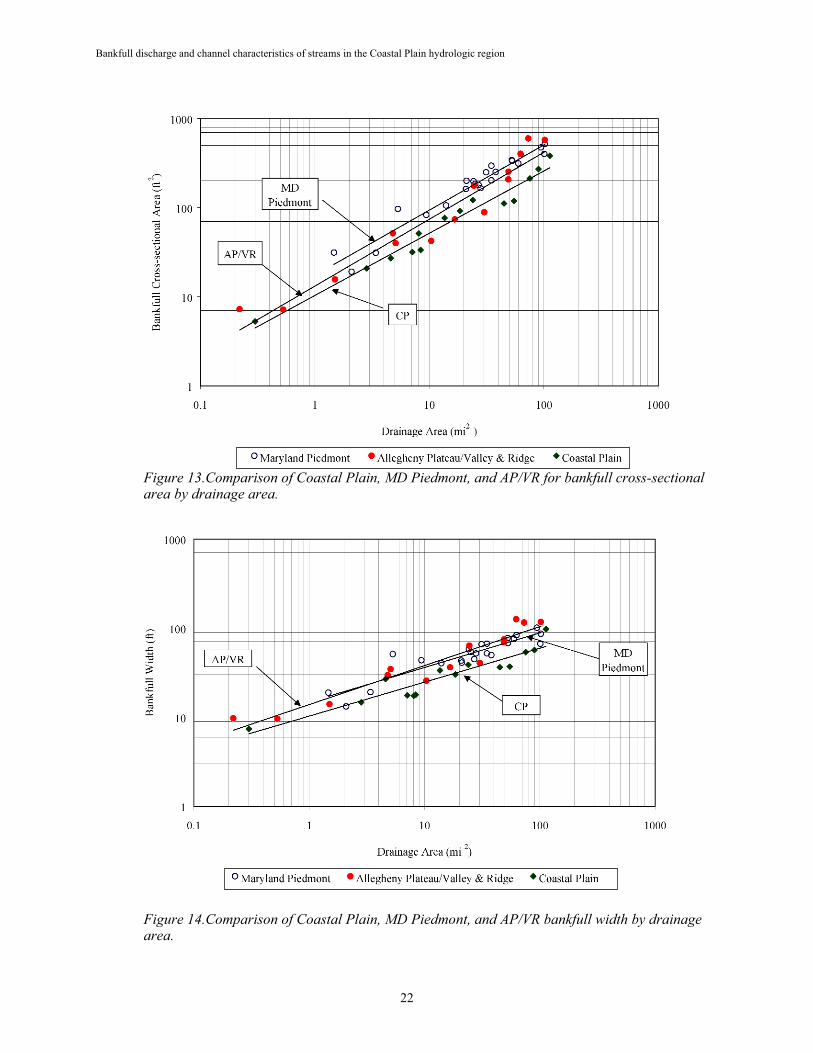
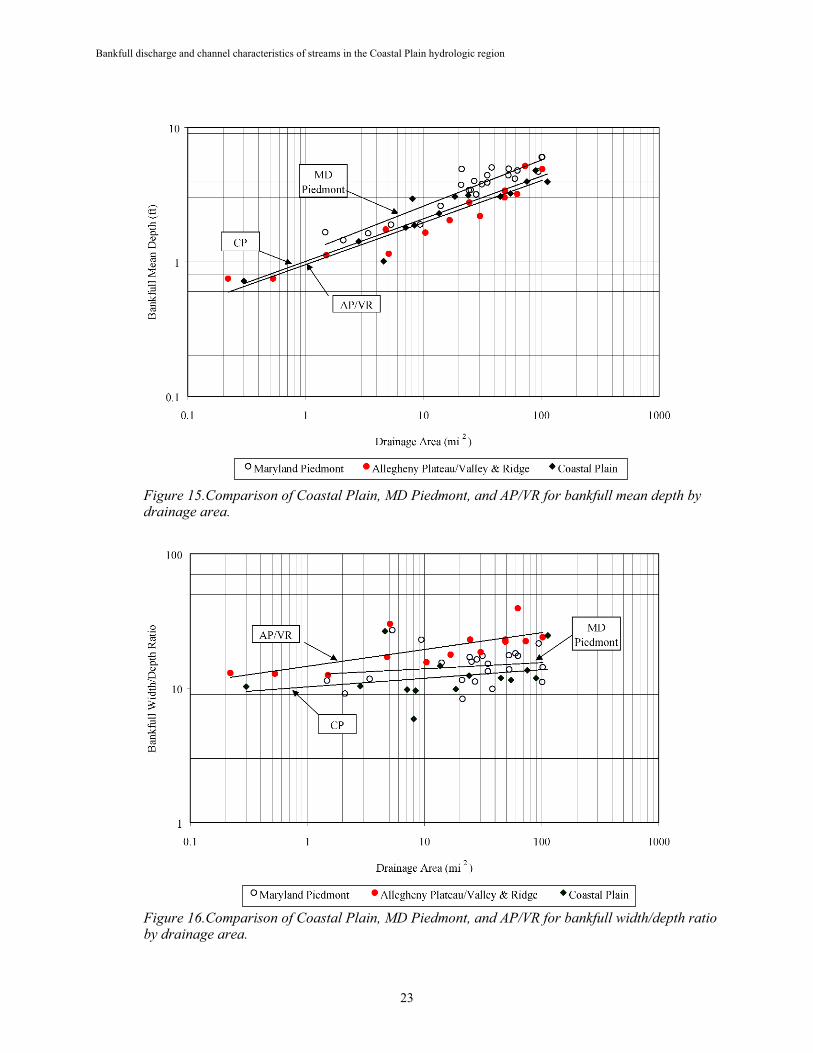
Comparing Coastal Plain - MD Piedmont - Allegheny Plateau/Valley and Ridge Survey Sites The relationship of bankfull discharge to drainage area shows that bankfull discharge is greatest in the MD Piedmont followed by the AP/VR, and Coastal Plain (Figure 10). As one would expect, given a smaller bankfull discharge per unit drainage area, the same relationship holds for bankfull cross-sectional area per unit drainage area with the Coastal Plain having less cross-sectional area compared to MD Piedmont and AP/VR (Figure 13, Table 8) (t = -8.3, -3.1; n = 34, 25, p = 0.05). The Coastal Plain also has less bankfull width per unit drainage area compared to MD Piedmont and AP/VR (Figure 14, Table 8) (t = -5.1, -4.6; n = 34, 25, p = 0.05). There is not a significant difference in bankfull width between MD Piedmont and AP/VR. While there is a significant difference between the Coastal Plain and MD Piedmont with respect to mean bankfull depth (t = -4, n = 34, p = 0.05), there is no difference between the Coastal Plain and AP/VR (Figure 15, Table 7). There is a significant difference between the Coastal Plain and AP/VR for width/mean depth ratio (t = -4.3, n = 25, p = 0.05) (Figure 16, Table 8). There is not a significant difference between the width/mean depth ratio for the Coastal Plain and MD Piedmont.
Thus, for a given drainage area, measured Coastal Plain streams have smaller cross-sectional area and width than the AP/VR and MD Piedmont. The width/depth ratios for the Coastal Plain and MD Piedmont are less than the AP/VR.
Table 8. Comparison of relationships between bankfull dimensions and drainage area. Coefficients and exponents of power functions describing relationships between bankfull dimensions (cross-sectional area (ft2), width (ft), and mean depth (ft)) regressed against drainage area (DA) (mi2) at USGS gage stations used in the MD Stream Survey: Coastal Plain, MD Piedmont, and Allegheny Plateau/Valley and Ridge (AP/VR). Power functions have the form XS-Area = aDAd , W = bDAe, D = cDAf .
Region Area (XS-Area) Width (W) Depth (D) a d b e c f
Coastal Plain 10.34 0.70 10.3 0.38 1.01 0.32 MD Piedmont 17.42 0.73 14.78 0.39 1.18 0.34 AP/VR 13.17 0.75 13.87 0.44 0.95 0.31
Bankfull discharge and channel characteristics of streams in the Coastal Plain hydrologic region
22
Figure 13.Comparison of Coastal Plain, MD Piedmont, and AP/VR for bankfull cross-sectional area by drainage area.
Figure 14.Comparison of Coastal Plain, MD Piedmont, and AP/VR bankfull width by drainage area.
1
10
100
1000
0.1 1 10 100 1000
Drainage Area (mi2
)
Ban
kfu
ll C
ross
-sec
tio
nal
Are
a (f
t2)
Maryland Piedmont Allegheny Plateau/Valley & Ridge Coastal Plain
MD
Piedmont
AP/VR
CP
1
10
100
1000
0.1 1 10 100 1000
Drainage Area (mi 2)
Ban
kfu
ll W
idth
(ft
)
Maryland Piedmont Allegheny Plateau/Valley & Ridge Coastal Plain
AP/VRMD
Piedmont
CP
Bankfull discharge and channel characteristics of streams in the Coastal Plain hydrologic region
23
Figure 15.Comparison of Coastal Plain, MD Piedmont, and AP/VR for bankfull mean depth by drainage area.
Figure 16.Comparison of Coastal Plain, MD Piedmont, and AP/VR for bankfull width/depth ratio by drainage area.
0.1
1
10
0.1 1 10 100 1000
Drainage Area (mi 2
)
Ban
kfu
ll M
ean
Dep
th (
ft)
Maryland Piedmont Allegheny Plateau/Valley & Ridge Coastal Plain
MD
Piedmont
CP
AP/VR
1
10
100
0.1 1 10 100 1000
Drainage Area (mi 2
)
Ban
kfu
ll W
idth
/Dep
th R
atio
Maryland Piedmont Allegheny Plateau/Valley & Ridge Coastal Plain
AP/VR
CP
MD
Piedmont
Bankfull discharge and channel characteristics of streams in the Coastal Plain hydrologic region
24
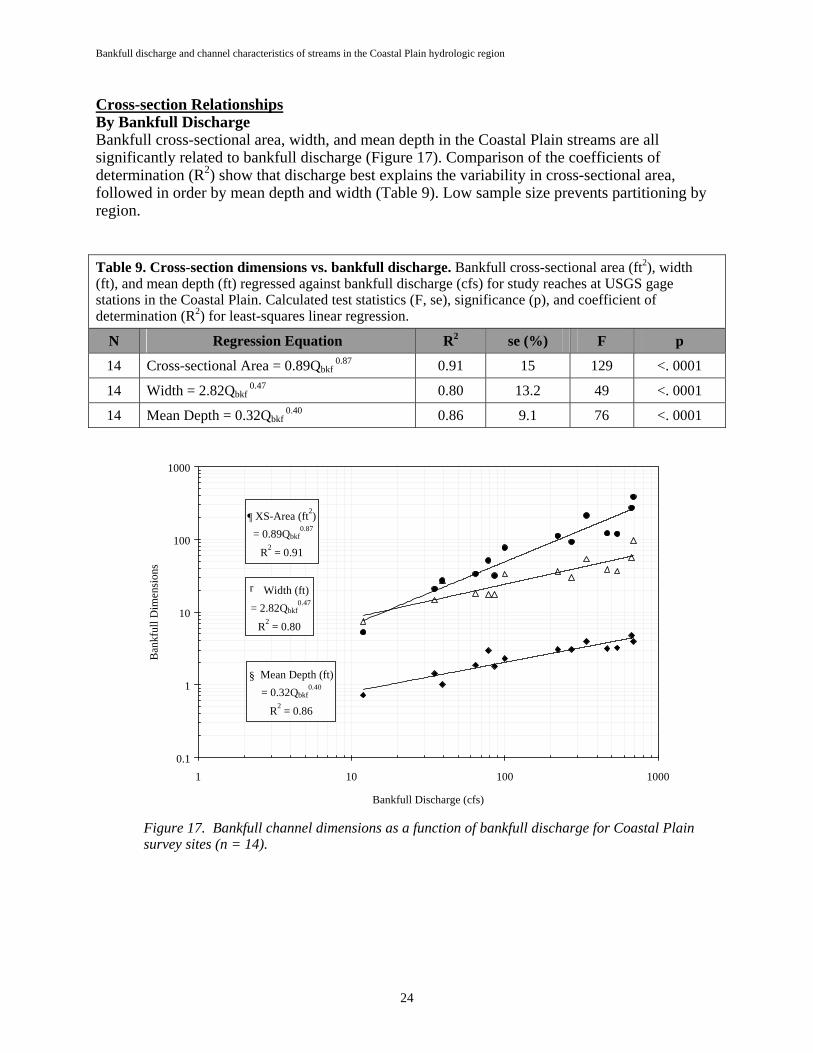
Cross-section RelationshipsBy Bankfull Discharge Bankfull cross-sectional area, width, and mean depth in the Coastal Plain streams are all significantly related to bankfull discharge (Figure 17). Comparison of the coefficients of determination (R2) show that discharge best explains the variability in cross-sectional area, followed in order by mean depth and width (Table 9). Low sample size prevents partitioning by region.
Table 9. Cross-section dimensions vs. bankfull discharge. Bankfull cross-sectional area (ft2), width (ft), and mean depth (ft) regressed against bankfull discharge (cfs) for study reaches at USGS gage stations in the Coastal Plain. Calculated test statistics (F, se), significance (p), and coefficient of determination (R2) for least-squares linear regression.
N Regression Equation R2 se (%) F p
14 Cross-sectional Area = 0.89Qbkf0.87 0.91 15 129 <. 0001
14 Width = 2.82Qbkf0.47 0.80 13.2 49 <. 0001
14 Mean Depth = 0.32Qbkf 0.40 0.86 9.1 76 <. 0001
Figure 17. Bankfull channel dimensions as a function of bankfull discharge for Coastal Plain survey sites (n = 14).
¶ XS-Area (ft2) = 0.89Qbkf
0.87
R2 = 0.91
r Width (ft) = 2.82Qbkf
0.47
R2 = 0.80
§ Mean Depth (ft)= 0.32Qbkf
0.40
R2 = 0.86
0.1
1
10
100
1000
1 10 100 1000
Bankfull Discharge (cfs)
Ban
kful
l Dim
ensi
ons
Bankfull discharge and channel characteristics of streams in the Coastal Plain hydrologic region
25
DiscussionThe results of this survey document significant relationships between all three bankfull cross-section parameters (area, width, and mean depth) and drainage area in streams of the Coastal Plain.
Comparing Coastal Plain - Maryland Piedmont - Allegheny Plateau/Valley and Ridge Table 10 lists the regression relationships for all sites surveyed in the MD stream survey. Low numbers of samples in the same range of bankfull discharge prevents examining the relationships between regions.
Table 10. Comparison of relationships between bankfull channel dimensions and bankfull discharge. Coefficients and exponents of power functions describing relationships between bankfull dimensions (cross-sectional area (ft2), width (ft), and mean depth (ft)) regressed against bankfull discharge (cfs) at USGS gage stations used in the MD stream survey: Coastal Plain, MD Piedmont, and Allegheny Plateau/Valley and Ridge (AP/VR). Power functions have the form XS-Area = aQbkf
d , W = bQbkf
e, D = cQbkff .
Region Area (XS-Area) Width (W) Depth (D) a d b e c f
Coastal Plain 0.89 0.87 2.82 0.47 0.32 0.40 MD Piedmont 0.28 0.94 1.46 0.52 0.19 0.42 AP/VR 0.79 0.8 2.65 0.47 0.3 0.33
Resistance RelationshipsIn the two previous studies for streams in the MD Piedmont and AP/VR physiographic provinces, an analysis was made of the relationship between relative roughness and channel resistance using the method developed by Limerinos (1970). Relative roughness is expressed as the ratio of hydraulic radius to the particle D84 (median diameter of the bed material particle size for which 84 percent is smaller). Channel resistance is expressed as n/R1/6. The general trend of Limerinos (1970) relationship (developed from gravel, cobble and boulder streams in California) is that channel resistance increases with increasing relative roughness. Data from the MD Piedmont and AP/VR streams followed this general relation (McCandless and Everett 2002, McCandless 2003). A similar analysis was performed for the Coastal Plain streams.
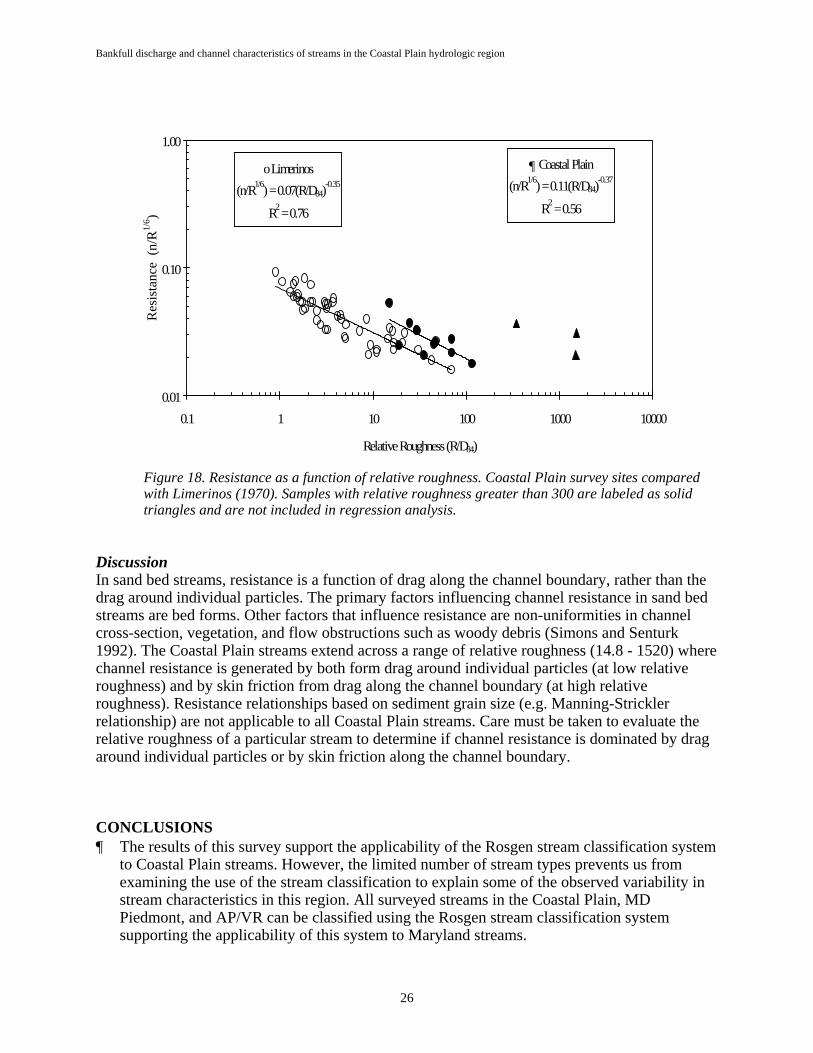
Channel resistance is plotted against relative roughness in Figure 18 for the Coastal Plain survey sites with the original data from Limerinos (1970). For relative roughness values less than 150, the Coastal Plain survey sites show the same general trend in channel resistance (i.e., a decrease in channel resistance as relative roughness increases) as the Limerinos (1970) data, but have higher average resistance. Six of the Coastal Plain survey sites possess relative roughness values that are above the range of Limerinos’ (1970) data (0.90 – 68.5). Three Coastal Plain survey sites with high relative roughness (R/D84 > 300) do not fit the Limerinos (1970) relationship. This is a reflection that many of the Coastal Plain streams are low-gradient (slope < 0.002), sand-bed streams rather than the gravel, cobble, and boulder bed streams that make up Limerinos’ (1970) dataset and the streams from the MD Piedmont and AV/PR datasets.
Bankfull discharge and channel characteristics of streams in the Coastal Plain hydrologic region
26
Figure 18. Resistance as a function of relative roughness. Coastal Plain survey sites compared with Limerinos (1970). Samples with relative roughness greater than 300 are labeled as solid triangles and are not included in regression analysis.
DiscussionIn sand bed streams, resistance is a function of drag along the channel boundary, rather than the drag around individual particles. The primary factors influencing channel resistance in sand bed streams are bed forms. Other factors that influence resistance are non-uniformities in channel cross-section, vegetation, and flow obstructions such as woody debris (Simons and Senturk 1992). The Coastal Plain streams extend across a range of relative roughness (14.8 - 1520) where channel resistance is generated by both form drag around individual particles (at low relative roughness) and by skin friction from drag along the channel boundary (at high relative roughness). Resistance relationships based on sediment grain size (e.g. Manning-Strickler relationship) are not applicable to all Coastal Plain streams. Care must be taken to evaluate the relative roughness of a particular stream to determine if channel resistance is dominated by drag around individual particles or by skin friction along the channel boundary.
CONCLUSIONS ¶ The results of this survey support the applicability of the Rosgen stream classification system
to Coastal Plain streams. However, the limited number of stream types prevents us from examining the use of the stream classification to explain some of the observed variability in stream characteristics in this region. All surveyed streams in the Coastal Plain, MD Piedmont, and AP/VR can be classified using the Rosgen stream classification system supporting the applicability of this system to Maryland streams.
o Limerinos(n/R1/6) = 0.07(R/D84)
-0.35
R2 = 0.76
¶ Coastal Plain (n/R1/6) = 0.11(R/D84)
-0.37
R2 = 0.56
0.01
0.10
1.00
0.1 1 10 100 1000 10000
Relative Roughness (R/D84)
Res
ista
nce
(n/R
1/6 )
Bankfull discharge and channel characteristics of streams in the Coastal Plain hydrologic region
27
¶ Streams are less entrenched, have smaller width/depth ratios, and have less slope as one moves from the western part of the state of Maryland to the Coastal Plain.
¶ The dominant geomorphic indicator of bankfull discharge for the three regions is the flood plain break.
¶ There is a well-defined relationship between drainage area and bankfull discharge in the Coastal Plain region with a significant difference between the Western Coastal Plain and Eastern Coastal Plain. The Western Coastal Plain has nearly twice as much discharge per unit drainage area compared to the Eastern Coastal Plain. There are well-defined relationships between bankfull discharge and drainage area in all regions surveyed.
¶ The drainage area and bankfull discharge relationship is significantly different between all regions surveyed with the MD Piedmont region having more bankfull discharge per unit drainage area followed by AP/VR, Western Coastal Plain, and Eastern Coastal Plain.
¶ There are well-defined relationships for the Coastal Plain streams between drainage area and bankfull channel dimensions. The most conservative relationship with drainage area is for cross-sectional area.
¶ There are well-defined relationships for surveyed streams between drainage area and bankfull channel dimensions in all regions.
¶ The Coastal Plain and AP/VR streams have less bankfull cross-sectional area per unit drainage area than MD Piedmont streams.
¶ The Coastal Plain streams surveyed have less bankfull width per unit drainage area compared to the MD Piedmont and AP/VR.
¶ The Coastal Plain streams surveyed have less bankfull mean depth per unit drainage area than the MD Piedmont streams.
¶ The Coastal Plain streams have significantly higher width/depth ratios compared with the MD Piedmont streams.
APPLICATIONS Use of Regression Relationships for Design PurposesSeveral caveats exist for these relationships, and they should not be used for detailed design specifications.
¶ Relationships are representative of a restricted range of basin and reach characteristics (e.g., drainage area, geology, land use, etc.) and must be used with caution when applying to streams across the Coastal Plain.
Bankfull discharge and channel characteristics of streams in the Coastal Plain hydrologic region
28
¶ While we do not consider any of the reaches represented here to be in a state of rapid adjustment, we have no information about the relative rates of lateral or down-valley meander migration.
¶ Relationships are not necessarily representative of “reference reach conditions”. These relationships provide no information about ecological parameters, and may not represent “good” habitat conditions.
¶ The range of Rosgen stream types represented by the data is low, with the majority represented as C and E type streams.
Given these caveats, we recommend using these relationships in stream assessments and planning studies. The information can provide preliminary conceptual design parameters for streams with a similar range of discharge, sediment, slope, and entrenchment conditions. However, channel designers need to identify discrete project goals and objectives, with respect to both physical and biological desired conditions, and determine the appropriate design parameters for achieving those conditions. Additional field information is needed to determine appropriate design values for shear stress, critical shear stress and sediment transport relationships. In most cases, the best guidance for finer scale aspects of channel design will come from carefully selected reference reaches that closely match the controlling conditions at the project reach, and exhibit those characteristics specifically identified as design objectives.
The intent for developing regional bankfull discharge and channel characteristics is to provide a database for refining estimates of bankfull channel dimensions in ungaged streams. As such, the data is intended primarily for use in stream assessments and for guidance in identifying expected (average), natural channel dimensions in ungaged streams.
Bankfull discharge and channel characteristics of streams in the Coastal Plain hydrologic region
29
LITERATURE CITED
1. Dillow, J.A. 1996. Technique for estimating magnitude and frequency of peak flows in Maryland. USGS Water-Resources Investigations Report 95-4154, pp. 55.
2. Interagency Advisory Committee on Water Data. 1982. Guidelines for determining flood flow frequency. Water Resources Council Bulletin 17B, 28 pp.
3. Leopold, L.B. 1994. A View of the River. Harvard University Press. Cambridge, Massachusetts. 298 pp.
4. Limerinos, J.T. 1970. Determination of the Manning coefficient from measured bed roughness in natural channels. Geological Survey Water Supply Paper 1898-B. U. S. Government Printing Office. Washington, D.C. 47 pp.
5. McCandless, T.L. and R.A. Everett. 2002. Maryland stream survey: Bankfull discharge and channel characteristics in the Piedmont hydrologic region. U.S. Fish and Wildlife Service, Annapolis, MD. CBFO-S02-02.
6. McCandless, T.L. 2003. Maryland stream survey: Bankfull discharge and channel characteristics in the Allegheny Plateau and the Valley and Ridge hydrologic region. U.S. Fish and Wildlife Service, Annapolis, MD. CBFO-S03-01.
7. NOAA Cooperative. 2003. 1961-1990 Station Normals. NRCS SNOTEL Station Normals, from PRISM Map on NRCS Web Site.
8. Rosgen, D.L. 1994. A classification of natural rivers. Catena, 22, 169-199.
9. -----. 1996. Applied River Morphology. Wildland Hydrology. Pagosa Springs, Colorado.
10. Schmidt, M. F. 1993. Maryland’s geology. Tidewater Publishers. Centreville, MD. 164 pp.
11. Shreve, R.L. 1967. Infinite topologically random channel networks. Journal of Geology, 75: 178-86.
12. Simons, D.B. and F. Sentürk. 1992. Sediment Transport Technology, Water Resources Publications, Littleton, Co.