Embed Size (px)
Citation preview

IOSR Journal of Business and Management (IOSRJBM)
ISSN: 2278-487X Volume 1, Issue 5 (July-Aug. 2012), PP 01-05 www.iosrjournals.org
www.iosrjournals.org 1 | Page
Customer Satisfaction: A Comparison of Public and Private Banks Of
Pakistan
1Waqar ul Haq
2Bakhtiar Muhammad
1ShaheedZulfikar Ali Bhutto Institute of Science and Technology, Islamabad 2Professor, Shaheed Zulfikar Ali Bhutto Institute of Science and Technology, Islamabad
Abstract: The purpose of conducting this research is to compare public and private sector banks of Pakistan by evaluating their customer satisfaction. This research is mainly based on primary data which has been collected
through a well-structured questionnaire (adapted from three different studies). The questionnaire has been
distributed to 351 different respondents on different chosen locations. This paper makes a useful contribution as
there are very low number of studies has been conducted in Pakistan on such areas like price, technology,
reliability, customer service, location and infrastructure. This research shows that customer satisfaction varies
from person to person and, bank managers need to conduct more researches in order to evaluate customer
satisfaction more strongly.
Keywords: Customer satisfaction, customer services, technology, reliability
I. Introduction 1.1 Customer Satisfaction: is a measure of how products and services provide by any organization meet
the expectations of a customer. It varies from person to person and service to service. A customer can be defined
as a user or potential user of banking services. A customer would include an account holder, or a person
carrying out casual business transactions with a bank. The efficiency of a banking sector depends upon how best
it can deliver services to its target customers. In order to survive in this competitive environment and provide
continual customer satisfaction, the banking services providers are required to frequently increase the quality of
services. In banking business it is seen that only 5% increase in customer retention can extend 35% profitability.
II. Literature Review 2.1 Entrance of Technology
Private sector Banks seem to have satisfied its customers with good services and they have been
successful in retaining their customers by providing better facilities than Public sector Banks. But, still Private
Banks need to go a long way to become customer‟s first preference. In an economy of innovative technologies and changing markets, each and every service quality variable has become important. New financial products
and services have to be continuously introduced in order to stay competent and Private Banks need to
concentrate more on their credit facilities and insurance services since customers do not have a very good
opinion about these facilities being offered by Private Banks also Public sector banks enjoy the trust of the
customers, which they have been leveraging to stay in the race however they need to improve their service
quality by improving their physical facility, infrastructure and giving proper soft skill trainings to their
employees(Puja et, al).
In the banking sector it is necessary to increased adoption of technology to better meet customer
requirements, improve efficiencies, reduce costs and ensure customer delight and it was the private sector and
foreign banks which established the technological revolution in Indian banking and considering the fact that in
the new economy, mind share leads to market share and mind share is influenced not only by the promotions
and advertisements but more importantly on favorable customer perception which in turn is based on satisfaction with regard to products, services and interaction (B. K. Tiwary).
The private sector banks are providing more satisfied ATM services then public sector banks and the
customer perception about Productivity, Security and Sensitivity, Cost Efficiency, Problem Handling,
Compensation and Contact services related to ATM service is very less in both the public sector and privates
sector banks, Therefore both kinds of banks should be aware about these facets of ATM service to improve
customers‟ satisfaction (Vijay M. Kumbhar).
The entry of information technology into the banking industry has created a revolution and it has
prompted commercial banks of India to design world-class customer service systems and practices, to meet the
growing customer needs. It is interesting to note that the results are consistent with the previous studies
conducted on customer service aspects, and it has been observed that the foreign and the new generation private
sector banks are serving the customers better (Rengasamy et, al).

Customer Satisfaction: A Comparison of Public and Private Banks of Pakistan
www.iosrjournals.org 2 | Page
2.2 Customers Perceptions and Expectations
Quality expectation and the valuation of services received are slightlymore in the private sector banks
as compared with the public sector banks. The effects for tactic since sectorial differentiation become veryblurry
as a result of increasing correspondence between services and struggle from linked and additional industries
(Peter et, al).
Service quality is one of main elements of customer satisfaction and their intention to purchase. However, the customers of public and private sector banks different in terms of their perception of service
quality. Private Banks have been observed to be higher on dimensions of service quality: effectiveness and
convenient while, the nationalized banks are better on the dimensions of price and consistency (Sachinet, al).
Private bank customers are more satisfied with the services then public banks. Managers in the banking
sector undertake significant efforts to conduct customer satisfaction surveys and it is appears that customers are
saying that they expect good products and quality to their banks and that may the only thing important to them
(Muhammad Naveed).
2.3 Image and Reputation of Banks
Some publicly owned banks are scoring well among customers but overall analysis shows that
satisfaction rate in customers of private banks is much higher than public sector banks and people will continue
the mortgage with private banks then public because they're impressed by the level of honesty of private banks (Colin Beasty).
2.4 Performance of Banks
After the privatizations of state-owned banks, their performances in comparison with other banking
groups have increased by 95%. The performance of private banks after privatization of state banks had
significant reduces and this reduction indicates that the share of the market of newly privatized state-owned
banks increased. Although the performance of privatized state banks after privatization has increased
significantly (Khodaei et, al).
The economic reforms and the entry of private players have cause nationalized banks to revamp their
services and product portfolios to incorporate new, innovative customer-centric schemes. Nowadays, due to the
rise in competition, customer satisfaction is considered to be the most important thing in retail services but there is no noteworthy difference in customer satisfaction of public sector and the private sector banks (Vigget, al).
2.5 Price and Packages
Cheque deposits and cheque clearing are most common services used by customers, the charges levied
by the bank on these services are higher in private and foreign banks then in nationalized banks. Their study also
shows that the customers of public banks were not much satisfied with the behavior of employee and
infrastructure, while customers of private and foreign banks were not much satisfied with high charges,
approachability and communication. They have also suggested that training on stress management and public
dealing should be imparted to the employees of nationalized banks and nationalized banks need to improve their infrastructure and ambience to compete with private and foreign banks in India (Surabhiet, al).
Credit cards have become a part of life. In recent years there was a lot of demand has been shown for
credit cards and there is a lot of scope for credit cards business in India. The credit cardholders consider eleven
'very important' variables which "Satisfied" them are: Joining Fee, Annual fee, Minimum payment due, Cash
withdrawal possibility, Availability of ATMs, Life Insurance Cover, Card replacement fee, Air insurance,
Baggage cover, lost card liability-after losing the card and lost card liability-before losing the card (Chennappa,
D; Eliat, M.J).
2.6 Location and Infrastructure
Good sites and suitable site of the branch are essential for bank branches for smooth operation of
banking business. When the private banks were compared with public banks, all the private banks have
excellent locations from business point of view compared to public banks in India and for providing better
service to customers proper training should be given to the staff by the banks also public sector banks should
invest and concentrate more on staff development where as private sector gives more priority on infrastructural
aspects. The rigid policy of public banks creates more dissatisfaction among the customers while for private
banks mostly the value of service is the key factor of satisfaction (Uma et, al).
2.7 Quality of Customer Services
First dimension of customer satisfaction for nationalized banks is Service Orientation but, for private
banks Service orientation appeared as second dimension and they focuses more on customer satisfaction and
nationalized banks give more importance to Flexibility in Use of Services, Vision and Competency. Also
customers of nationalized banks had not been given much importance by the executives. On the other hand

Customer Satisfaction: A Comparison of Public and Private Banks of Pakistan
www.iosrjournals.org 3 | Page
customers of private banks had been offered these services right from the beginning therefore, customers of
private banks more satisfied (Jitendra Kumar Mishra).
The consumers of nationalized banks are more satisfied with service quality, than private banks and it‟s
required to ascertain the key success aspects in the industry, in terms of satisfaction of customers by keeping in
view the growing market size and the strong competition (Pooja Mengi).
The Private Banks came to existence within the last ten years with the objective of to limit the
government intervention in banks and from since then they try hard to obtain customer satisfaction even after a
short period of existence. According to a survey the result shows that private sector banks are more popular to
obtain customer satisfaction than the public sector banks (Farzad Asgarian).
Satisfaction of customers is the most important forecaster of service quality of banking sector.
Management of banks should confirm that the banking atmosphere should focus on quick and fair services to
their customers. Public sector banks are contributing more credit facility to fishermen and farmers than private
banks and the State Government announcement of giving the agricultural loan has given more satisfaction to the
consumers of public banks (N. Senthi kumar et, al).
The effort towards ease of banking and accessibility is preferred by the customer who is more seen in
private banks then public and customer care and customer retention programs should take into consideration by
public banks. In Kuwait Muslim customers are satisfied more with accessibility of ATM machines in multiple
locations, funds safety, ease to use ATM machines and service quality provided, but the worse element which
has been noticed in this study was that the interest rate on loans, which was the indicator of that the most of
customer in Kuwait give more intention to loans (Khaled et, al).
Service quality is an important feature of customer satisfaction in Indian banking industry irrespective
of public sector and the private sector banks and Customer satisfaction is found to be strongly associated with
propensity to recommend (Monica Bedi)
. Some of the respondents choose the SBI bank is because the bank is proving more ATM facility to the
customers and many of the respondents are saying the reason to choose the services of the SBI bank is because
they are good in efficient customer service but many of the respondents are not aware of the many services
Provided by the SBI bank. The few are deposit of cash in ATM, request for cheque book in ATM, end of the
day balance in mobile, etc. While some of the respondents choose the ICICI bank is because the bank is more
reliable to the customers and many of the respondents are saying the reason to choose the services of the ICICI
bank is because they are good in efficient customer service and efficient complaint handling. So finally both the
banks are competing equally with each other but SBI bank is little bit below the line in customer complaints
handling when compared to ICICI bank (M.J. Vidhyaa).
III. Research Framework A research framework has been developed to compare customer satisfaction among private and public
sector banks of Pakistan which includes research methodology, research model and questionnaire.
3.1 Methodology
A method has been designed to meet the objectives of research. For this purpose a questionnaire has
been adapted from three different research studies [1.Salman Khalid et al (2011), 2.Uma Shankar et, al (2010)
and 3.Khaled Al-Hashash et, al (2008)] and circulated in 5 different cities of Pakistan (Sukkur, Lahore, Islamabad, Rawalpindi and Peshawar). This questionnaire consists of two different parts. The first part is
showing respondents personal data such as gender, bank type, income, age, qualification and the second part
asked respondent to rate their satisfaction level to their bank from “strongly agree” to “strongly disagree” on
such variables which lead to build strong relationship with customers such as prices, reliability, technology,
customer service, location and infrastructure etc. This questionnaire was given to 500 different respondents out
of which 351 questionnaires were returned. Most of these responses were conducted myself and rest through the
help of friends and family.

Customer Satisfaction: A Comparison of Public and Private Banks of Pakistan
www.iosrjournals.org 4 | Page
3.2 Research Model
IV. FINDINGS
4.1 Background of Respondents
The first part of this questionnaire was designed to collect personal information of respondents such as
their gender, Age, bank type, income and qualification and the investigation shows that 65% of the respondents
are male and 35% are female of which, 42% of the respondents are having their account in public banks and
58% have their account in private banks. 72.6% respondents are from age group 18 – 25 years, 16.9% are from age group 26 – 33 years, 5.7% are from age group 34 – 41 years, 1.7% is from age group 42 – 50 years and
3.1% are from age group 51+ years. In terms of qualification only 0.6% are under matric, 1.6% have done
matric, 4.4% respondents have done intermediate, 76.2% are graduated and 17% respondents are post graduated.
In income segment 26% of the respondents having less than 20 thousand, 11.8% have 21 – 30 thousand, 18.5%
earn 31 – 50 thousand, 33.5% earn 51 – 100K and only 10.2% of the respondents earn more than 100 thousand
per month.
4.2 Mean Std. Deviation of Each Question
Questions
N Minimum Maximum Mean
Std.
Deviation
My bank gives me good compensation. 349 1.00 5.00 1.8195 1.10592
Services charges my bank imposes is competitive. 350 1.00 5.00 2.0514 .93188
My bank gives good interest rate on saving accounts. 349 1.00 5.00 2.1519 1.06262
My bank provides variety of service charges. 350 1.00 5.00 2.2000 1.07325
My bank provides good credit facilities. 346 1.00 5.00 2.2659 1.19120
My bank doesn‟t charge unnecessarily for not
maintaining minimum balance in account.
346 1.00 5.00 2.3642 1.19917
My bank provides ATM service in multiple locations. 350 1.00 5.00 1.8971 1.05480
My bank provides good E-Banking service. 348 1.00 5.00 2.1810 1.05415
My bank provides Phone account service facilities. 346 1.00 5.00 2.1821 1.12357
My bank provides Internet banking service. 351 1.00 5.00 2.1368 1.14072
My bank provides safety for my funds. 349 1.00 5.00 1.9484 1.00440
My bank‟s image and reputation is good. 344 1.00 5.00 2.1686 1.11473
I have open account in this bank because for personal
relationship with any of the employee.
350 1.00 5.00 2.2486 1.25921
Location of my bank is convenient. 348 1.00 5.00 2.0460 1.14543
Customer
Satisfaction
Customer Satisfaction: A Comparison of Public and Private Banks of Pakistan
www.iosrjournals.org 5 | Page
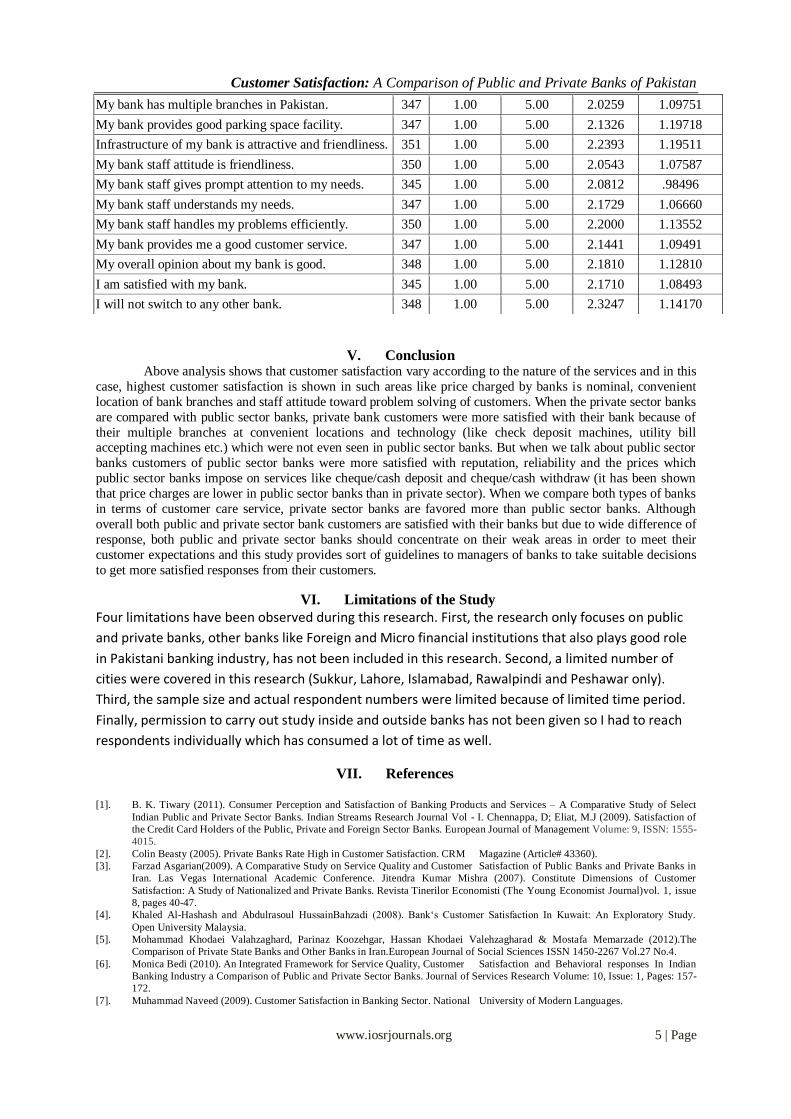
V. Conclusion Above analysis shows that customer satisfaction vary according to the nature of the services and in this
case, highest customer satisfaction is shown in such areas like price charged by banks is nominal, convenient
location of bank branches and staff attitude toward problem solving of customers. When the private sector banks
are compared with public sector banks, private bank customers were more satisfied with their bank because of
their multiple branches at convenient locations and technology (like check deposit machines, utility bill accepting machines etc.) which were not even seen in public sector banks. But when we talk about public sector
banks customers of public sector banks were more satisfied with reputation, reliability and the prices which
public sector banks impose on services like cheque/cash deposit and cheque/cash withdraw (it has been shown
that price charges are lower in public sector banks than in private sector). When we compare both types of banks
in terms of customer care service, private sector banks are favored more than public sector banks. Although
overall both public and private sector bank customers are satisfied with their banks but due to wide difference of
response, both public and private sector banks should concentrate on their weak areas in order to meet their
customer expectations and this study provides sort of guidelines to managers of banks to take suitable decisions
to get more satisfied responses from their customers.
VI. Limitations of the Study
Four limitations have been observed during this research. First, the research only focuses on public
and private banks, other banks like Foreign and Micro financial institutions that also plays good role
in Pakistani banking industry, has not been included in this research. Second, a limited number of
cities were covered in this research (Sukkur, Lahore, Islamabad, Rawalpindi and Peshawar only).
Third, the sample size and actual respondent numbers were limited because of limited time period.
Finally, permission to carry out study inside and outside banks has not been given so I had to reach
respondents individually which has consumed a lot of time as well.
VII. References
[1]. B. K. Tiwary (2011). Consumer Perception and Satisfaction of Banking Products and Services – A Comparative Study of Select
Indian Public and Private Sector Banks. Indian Streams Research Journal Vol - I. Chennappa, D; Eliat, M.J (2009). Satisfaction of
the Credit Card Holders of the Public, Private and Foreign Sector Banks. European Journal of Management Volume: 9, ISSN: 1555-
4015.
[2]. Colin Beasty (2005). Private Banks Rate High in Customer Satisfaction. CRM Magazine (Article# 43360).
[3]. Farzad Asgarian(2009). A Comparative Study on Service Quality and Customer Satisfaction of Public Banks and Private Banks in
Iran. Las Vegas International Academic Conference. Jitendra Kumar Mishra (2007). Constitute Dimensions of Customer
Satisfaction: A Study of Nationalized and Private Banks. Revista Tinerilor Economisti (The Young Economist Journal)vol. 1, issue
8, pages 40-47.
[4]. Khaled Al-Hashash and Abdulrasoul HussainBahzadi (2008). Bank„s Customer Satisfaction In Kuwait: An Exploratory Study.
Open University Malaysia.
[5]. Mohammad Khodaei Valahzaghard, Parinaz Koozehgar, Hassan Khodaei Valehzagharad & Mostafa Memarzade (2012).The
Comparison of Private State Banks and Other Banks in Iran.European Journal of Social Sciences ISSN 1450-2267 Vol.27 No.4.
[6]. Monica Bedi (2010). An Integrated Framework for Service Quality, Customer Satisfaction and Behavioral responses In Indian
Banking Industry a Comparison of Public and Private Sector Banks. Journal of Services Research Volume: 10, Issue: 1, Pages: 157-
172.
[7]. Muhammad Naveed (2009). Customer Satisfaction in Banking Sector. National University of Modern Languages.
My bank has multiple branches in Pakistan. 347 1.00 5.00 2.0259 1.09751
My bank provides good parking space facility. 347 1.00 5.00 2.1326 1.19718
Infrastructure of my bank is attractive and friendliness. 351 1.00 5.00 2.2393 1.19511
My bank staff attitude is friendliness. 350 1.00 5.00 2.0543 1.07587
My bank staff gives prompt attention to my needs. 345 1.00 5.00 2.0812 .98496
My bank staff understands my needs. 347 1.00 5.00 2.1729 1.06660
My bank staff handles my problems efficiently. 350 1.00 5.00 2.2000 1.13552
My bank provides me a good customer service. 347 1.00 5.00 2.1441 1.09491
My overall opinion about my bank is good. 348 1.00 5.00 2.1810 1.12810
I am satisfied with my bank. 345 1.00 5.00 2.1710 1.08493
I will not switch to any other bank. 348 1.00 5.00 2.3247 1.14170

Customer Satisfaction: A Comparison of Public and Private Banks of Pakistan
www.iosrjournals.org 6 | Page
[8]. M.J. Vidhyaa (2009). A Comparative study of customer services in ICICI (Industrial Credit And Investment Corporation Of India)
and SBI (State Bank of India). ICFAI National College, KEELKATTALAI.
[9]. N. Senthikumar, A.Ananth and A. Arulraj (2011). Impact of Corporate Social Responsibility on Customer Satisfaction in
Banking Service. African Journal of Business ManagementVol.5 (7), pp. 3028-3039.
[10]. Peter Kangis & Vassilis Voukelatos (1997). Private and Public Banks: A Comparison of Customer Expectations and
Perceptions. International Journal of Bank Marketing, Vol. 15 ISSN: 7, pp.279 - 287.
[11]. Puja Khatri & Yukti Ahuja (2010).Comparative Study of Customer Satisfaction in Indian Public Sector and Private Sector
Banks. International Journal of Engineering and Management Sciences Vol. 1: 42-51.
[12]. Pooja Mengi (2009). Customer Satisfaction with Service Quality: An Empirical Study of Public and Private Sector Banks. The
IUP Journal of Management Research, Vol. VIII, No. 9, pp. 7-17.Rengasamy Elango and Vijaya Kumar Gudep (2006). A
Comparative Study on the Service Quality and Customer Satisfaction among Private, Public and Foreign Banks. The IUP Journal of
Marketing ManagementIJMM10608.
[13]. Surabhi Singh &Renu Arora (2011). A Comparative Study of Banking Services and Customer Satisfaction in Public, Private and
Foreign Banks. Kamla- Raj, J Economics J Economics, 2(1): 45-56.
[14]. Uma Sankar Mishra, Bibhuti Bhusan Mishra, Swagat Praharaj & Ramchandra Mahapatra (2011). CRM in Banks: A Comparative
Study of Public and Private Sectors in India. European Journal of Social Sciences Volume 24.
[15]. Dr. Vijay M. Kumbhar (2011). Service Quality Perception and Customers Satisfaction in Internet Banking Service: A Case Study of
Public and Private Sector Banks. Cyber Literature Volume 4 Issue 2 ISSN 0972-0901.

IOSR Journal of Business and Management (IOSRJBM)
ISSN: 2278-487X Volume 1, Issue 5 (July-Aug. 2012), PP 06-08 www.iosrjournals.org
www.iosrjournals.org 6 | Page
Social Marketing: A Classic Case of Sustainability Model by Hindustan
Unilever Ltd.
Abstract: Growing consumer and increasing income growing of consumer opens many avenues for modern marketers to serve consumers. Market and society are the two sides of a single coin. To develop the society,
marketers have a greater role of sustainability. While manufacturing new product for the consumer group,
companies should take every precaution and necessary steps to protect the interest of the consumers as well as
safeguard the consumer’s priorities. A better and sustainable earth is also the concern for Govt. as well as
many companies of the globe, who are using resources of earth like water, minerals, trees etc for further
processing of their products. This paper focus on several steps initiated by HUL for their forthcoming as well as
current products, where company plans to launch many eco-friendly products which save mother earth as well
as protect consumer from any hazards.
Keywords: Sustainability, HUL, Consumer, Market. Social Marketing
I. Introduction: AMA defined Marketing as “Transfer of goods and services from producers/manufacturer to ultimate
consumers.” Social Marketing is the integration of Marketing Philosophy with changing nature of society.
Today consumer needs more comfort, quick solution for his problems, frequent change of his needs and
comfortable zone of shopping. This un-certainty ponders marketers to design their marketing planning in a more
systematic ways. The modified version of recently AMA definition on marketing somehow indicates towards
the above issues.
The revised definition of marketing as AMA stated is:
Marketing is → Creating (New Products Development.)
→ Communicating (Promotional Mix)
→ Supplying (SCM)
↓
→ Maintaining CRM with Consumers
In this process maintaining relationship with consumer play a pivotal role where company keeps every social change in the society into consideration while initiating any new plan of marketing.
II. HUL, A Milestone in FMCG Industry:
The46 billion FMCG giant HUL was formed in 1933 as Lever Brothers India Ltd. and came into being in 1956 as Hindustan Lever Ltd. through a merger of Lever brothers, Hindustan Vanaspati Mfg.co. Ltd.
and United Traders Ltd. HUL distribute its products through 2 million retail outlets across the country directly
and products are available in over 7.2 million outlets in the country. As per AC Nielsen market research data, two out of three Indians use HUL products. HUL is the market leader in Indian consumer products with
presence in over 20 consumer categories such as soaps, tea, detergents and shampoos.
Unilever Sustainable Living Plan (USPL) :
Unilever launched sustainable living plan in on 15th of November, 2010 at London, Rotterdam, New
York and New Delhi simultaneously. Under this plan, Unilever aims to achieve few goals by 2020. These goals
are :
Help more than one billion people to improve their health and well being.
Environment impact of their products should reduce to half of current status.
Outsource 100% of their agricultural raw materials sustainability.
Current Progress Report on Sustainability:
Unilever is on track in sustainable sourcing and livelihoods, but unable to reduce the environmental
impact. Company is currently focusing on seven major areas, where sustainability is required. These areas are :
Health and Hygiene
Nutrition
Waste foot print
Water foot print
Green house gases

Social Marketing: A Classic Case Of Sustainability Model By Hindustan Unilever Ltd.
www.iosrjournals.org 7 | Page
Sustainable sourcing
Better livelihoods
III. Health and Hygiene : According to UN estimates, over 2 billion people have limited access to safe drinking water. Many
Unilever brands offer hygiene benefits. Lifebuoy is one among them. By 2015, this brand aims to change the
hygiene behaviour of 1 billion consumers across Asia, Africa and Latin America by promoting the benefits of
hand washing at key times. In India, HUL has garnered immense learning from its years of experience in
conducting the Lifebuoy hand washing programme. The Madhya Pradesh Govt., impressed by the fact that the
incidence of diarrhea has dipped by 25% in a recent study. In Pakistan, Lifebuoy soap consumption has
increased by 8%. HUL‟s major toothpastes also play an important role helping to prevent tooth decay which is
one of the world‟s most common diseases and can lead to more serious health conditions. The simple practice of
brushing twice a day can make a big difference to oral health.
Also Pureit, company‟s in-home water purifier, provide water „as safe as boiled‟ without needing
electricity and at an affordable price to India‟s middle class consumers. “Khushiyon ka Doli” (Caravan of Happiness) is company‟s Lifebuoy brand promotional activities in rural India where it is reaching to 30 million
rural consumers directly.
IV. Nutrition: High level of obesity is now a concern for urban India where consumers are living more sedentary lives
and calorie rich foods are more available and affordable. Millions of the people around the globe remain hungry
or lack of essential nutrients in their diets. HUL, in its “Nutrition enhancement Programme” plans to improve
the nutritional quality. By 2020, company is planning to motivate around 100 million people to take its „Heart
Age‟ test for better and healthier lifestyle. Unilever has been gradually reducing salt levels in its products without changing its taste, as it is framed under the goal of company. The aim is to reduce the level of salt up to
the mark of 5 gm per day as based on globally dietary guidelines. Under food programme, company providing
micronutrient – enriched school meals to 95,000 school children of India, Bangladesh and Indonesia. Company
also committed to reduce saturated facts, Trans fat and calories from their different products to uplift
consumers‟ healthy eating habits.
V. Waste Foot Print:
Packaging is one of the important Ps defined by Marketing Scientists. It protects the products and
allows company to transport them safely from manufacturing base to consumer end. At the same time it can end up as waste, particularly in those countries where the infrastructure for recycling is poor. So company is
reducing the packaging and saving the materials, energy and transport. By 2020, company will reduce the
weight of packaging that what currently it is using by a third through light weighting materials. Company is
planning to provide consumers with refills for their home and personal care products to make it possible to reuse
the primary pack.
Sachets and pouches are an efficient use of packaging creating less waste by weight per milliliter of
product sold than bottles. Sachets play an important role in making everyday product affordable and accessible
to low income consumers. But recycling sachets really a challenging issue due to its low weight. But Unilever
introduce a technology called “Breakthrough Pyrolysis Process”, where used plastic sachets can be converted to
fuel. Company also eliminating PVC (Polyvinyl Chloride) from all its packaging by 2012. As company is the
firm believer of sustainability, hence it has joined hands with Bharti Retail to implement a programme called
„go recycle‟, where consumers are educated and informed about the practice of waste segregation. As a part or this programme, consumers were encouraged to bring empty plastic bottles and pouches of any brand from
selected FMCG categories. In return, the consumers were given discounts coupons for redemption.
VI. Water foot print: Water is a basic human need. The United Nations estimates that each person needs 20-50 liters per day
for drinking and daily tasks like cooking and washing. Water shortages are increasingly common and water
available per head or population will reduce further in the coming decade, as predicated by UN. Company is
committing to halve the water associated with the consumer use of its products by 2020. For Ex: Company is
planning to launch a dry shampoo that does not need water in a far easier way to reducing water consumption in the bathroom than pleading with them to use less water. The dry shampoo is spray on, absorbs oil from hair and
also lends volume. Company already introduced comfort one Ringe in Vietnam that reduces the use of water
from their buckets to one. Also introduces a leave on hair conditioner that doesn‟t need to be washed away. Also
a detergent that clean at room temperatures, doing away with the need for hot water at 70° Celsius in washing
machines.

Social Marketing: A Classic Case Of Sustainability Model By Hindustan Unilever Ltd.
www.iosrjournals.org 8 | Page
VII. Greenhouse Gases: By 2020 company is committing to halve the greenhouse gas impact of its products. Climate change
will have a growing impact on Unilever‟s business. Changing weather patterns put the suppliers of agriculture
raw materials in mess. So company is planning to set greenhouse gas reduction targets across the valve chain- from sourcing, manufacturing, transport and refrigeration all the way through to consumer use of the products.
Most of the greenhouse gas emissions are come from the hot water needed to use company‟s soaps and
shampoos in the shower. So company is persuading consumers to take shorter showers. By 2020, Co2 emissions
from global logistics network will be below the level of target set for 2010. Truck transportation may replace
with rail or ship to reduce Co2. Also it plans to improve the Energy efficiency of its warehouses.
VIII. Sustainable Sources: Half of Unilever‟s raw materials come from either farms or forests. Agriculture and forestry are the
largest contributors to global greenhouse gas emissions and are the major drivers of climate change. So Unilever is committed to sourcing sustainably all agricultural raw materials by 2020. By 2015, company will purchase all
palm oil from certified sustainable sourcing, for soy beans target set is 2014 and for soy oil by 2020.
Unilever‟s master brand Lipton tea bags will source from Rainforest Alliance certified estates by 2015.
Company will purchase 100%. Sustainable fruits and vegetables by 2015. Sustainable sunflower oil, Rapeseed
oil and diary will be sourced by the company by 2020.
IX. Better Livelihood: Company plans to help small holder farmers and Micro-entrepreneurs under project Shakti. It will
increase the numbers or Shakti Ammas from 45,000 to 75,000 in 2015. To strengthen the project, Company introduced the concept of “Shaktimaan” under which men of Shakti families are given bicycle to cover
surrounding villages to increase HUL‟s distribution and sales as well as enhance the income of Shakti families.
Currently 30,000 Shaktimaans are working across India. HUL is also partnering with a leading public sector
bank in India for enabling banking service to rural consumers and low income people is Shakti villages. HUL is
also entered into a partnership on telecom distribution with a leading telecom company to sell its products and
servicing across rural India. This initiative will help Shakti entrepreneurs to increase their income by selling
telecom products and services to retailers, as well as directly to consumers.
X. Conclusion : Unilever, as in the USLP, has put out a list of clean wants- all focused on sustainability- like fighting
viruses, reduction of salt in food products, preserving food naturally, storing renewable energy, sustainable
showering, and finally twisting the consumer behavior through its nobly created sustainable models. These
factors are also helping company to increase its goodwill and support the sales volume target. Any social
initiatives must be verified and weighted according to the consumer‟s perception and Unilever perfectly did the
same by keeping its ideas fit to the shoes of consumer‟s mentality.
Reference : www.unilever.com/sustainble-living www.hul.co.in
www.wikipedia.com
HUL Bets on innovations to Reach Sustainable goal, The Economics Time, 25th April 2012

IOSR Journal of Business and Management (IOSRJBM)
ISSN: 2278-487X Volume 1, Issue 5 (July-Aug. 2012), PP 09-19 www.iosrjournals.org
www.iosrjournals.org 9 | Page
An Empirical Study of Servqual as a Tool for Service Quality
Measurement
Sabrina Tazreen Lecturer. (Marketing)
Faculty of Business Administration, University of Science and Technology Chittagong.
Abstract: To survive and excel in today’s competitive market organizations must realize the significance of
customer-oriented business philosophies and quality management approaches in managing the business.
Customers are becoming more aware of their requirements. Their expectations and perceptions are continually
evolving making it more difficult for the service providers to measure and manage services effectively and
efficiently. Implementation of total quality in the service industry is comparatively more complex and difficult due
to the fact that quality of services cannot be defined objectively. Additionally, service industry by nature has less control over factors which affect quality. Very few methods are considered to be effective measurement tools for
services so far while a number of methods have been introduced and practiced for measuring the quality of
physical goods. This paper attempts to highlight the implication of SERVQUAL, one of the widely accepted
methods for measuring service quality. The SERVQUAL methodology is briefly demonstrated by a small survey
conducted on a randomly selected bunch of customers regarding the service quality provided by a particular
commercial bank. The paper concludes with some recommendations regarding further research topics related
to service quality measurement.
I. Introduction:
A woman walked up to the branch manager of a bank. "Are you hiring any help?" she asked. "No," he said. "We already have all the staff we need."
"In that case, would you mind trying to find someone to help me in the safe deposit area?" she asked.
This story is just a comical representation of a customer‟s dissatisfactory reaction resulted from a
service failure of a bank. The term Customer Satisfaction has become the prime concern of most of the
organizations to be competitive in the industry. Determining and meeting customer expectation regarding
services is the key to make satisfied customers and the best way for determining customers‟ needs and
expectation is the use of surveys and researches- the key vehicle for understanding customer expectations and
perceptions of services.
This paper attempts to focus the implication of SERVQUAL scale for measuring service quality in
terms of the differences between the customer expectations and their perceptions regarding the service
consumed. Measuring service quality had always been a challenge for service providers because of the intangible
and most notably the inseparable and heterogeneous nature of service. As such services are more akin to
performances rather than objects. These distinctions enabled Parasuranam, Zeithmal & Berry (1985) to develop
an instrument for measuring Service quality, SERVQUAL, which has subsequently dominated both academic
and practitioner perspectives (Buttle, 1996; Robinson,1999). SERVQUAL measures perceptions of service
quality across five dimensions: tangibles; reliability; responsiveness; assurance and empathy.
SERVQUAL (an acronym derived from the term „Service Quality‟) is a well tested survey method for
measuring service quality which focuses on five service quality dimensions. SERVQUAL surveys usually include 22 service areas distributed throughout the five service quality dimensions. The survey often asks the
customers to provide two different ratings on each attribute- one reflecting the level of service they would
expect from excellent companies in a given sector and the other reflecting their perception of the service
delivered by a specific company within a sector. The difference between the expectation and perception rating
constitutes a qualified measure of service quality.
Service industries cover a wide range of differentiated organizations such as health care, education,
banking, insurance, hotels, transport, restaurant, etc. Such systems involve a very large variety of business
processes and a large scale interaction with variety of customers. SERVQUAL method is more or less suitable
for most of the service sectors. Still, the scope of SERVQUAL survey is limited to some particular sectors. The
use of SERVQUAL seems to be most effective in financial services, health care and education sector. This

An Empirical Study of Servqual as a Tool for Service Quality Measurement
www.iosrjournals.org 10 | Page
paper attempts to demonstrate the methodology of SERVQUAL by a survey conducted on the customers of a
local commercial bank regarding the retailing banking services provided by the bank. The bank has been termed
as Bank X (hypothetical name). The sample size includes only forty customers because of the time and cost
constraints. The questionnaire was made shorter by selecting 16 questions from among the 22 structured
questions. In fact the survey only exhibits the implication and methodology of SERVQUAL in a service
industry.
II. Defining Service and Service Quality Measurement:
Thus, Service quality is a concept that has aroused considerable interest and debate in the research
literature because of the difficulties in both defining it and measuring it with no overall consensus emerging on
either (Wisniewski, 2001). There are a number of different "definitions" as to what is meant by service quality.
One that is commonly used defines service quality as the extent to which a service meets customers‟ needs or expectations (Lewis and Mitchell, 1990; Dotchin and Oakland, 1994a; Asubonteng et al., 1996; Wisniewski and
Donnelly, 1996). Service quality can thus be defined as the difference between customer expectations of
service and perceived service. If expectations are greater than performance, then perceived quality is less than
satisfactory and hence customer dissatisfaction occurs (Parasuraman et al., 1985; Lewis and Mitchell, 1990).
However the study of service quality did not come into its own as an area of marketing importance
until research in the early 1980s established that attitude was a significant part of service quality. The earliest
concern for what has become to be known as service quality appeared in 1976. Anderson, et al (1976)
recognized importance of selection as a priority for obtaining and retaining customers.
Churchill and Suprenant (1982) were among the earliest to hold the view later shared by others that
service quality was an attitude. They were the first researchers to see the significance of attitude as a principal
factor leading to superior service quality. One year after this significant research, Lewis and Booms (1983)
concluded that satisfaction was similar to attitude, and consequently they noted the significance of processes and outcomes in defining service quality.
A number of scholars have conducted services quality researches and opined in different ways about
service quality. Some of those are Holbrook and Corfman, Maynes, Zeithaml, Cronin, Jr. and Taylor,
Dabholkar, Bitner and others.
In an attempt to address the issue of how to measure service quality, a scale based upon the utilization
of ten elements was developed by Parasuraman, et al based upon a series of focus group interviews, which could
be used to measure service quality perceptions. Originally, the ten elements developed for use in measuring
service quality were tangibles, reliability, responsiveness, competence, courtesy, credibility, security, access,
communications, and understanding the customer. Further studies by Parasuraman, et al (1988) brought about a
major modification that changed the dimensions that could be used to measure service quality perceptions.
Three of the original ten elements—tangibles, reliability, and responsiveness—remained unchanged. The other seven original elements were combined into two elements. Those elements known as competence, courtesy,
credibility, and security were combined to form one of the new elements known as assurance, and the elements
of access, communications, and understanding the customer were combined to form the new element known as
empathy.
Now, the five elements that made up what the authors called SERVQUAL were the following five
dimensions of service quality: tangibles, reliability, responsiveness, assurance, and empathy. The factors
covered by the dimensions are given in the following table:
Table 1
Dimensions Factors
Tangibles Physical facilities, equipment and appearance of personnel.
Reliability Ability to perform the promised service dependably and
accurately.
Responsiveness Willingness to help customers and provide prompt service.
Assurance Knowledge and courtesy of employees and their ability to
inspire trust and confidence.
Empathy Caring and individualized attention that the firm provides
to its customers.
Table: 1: Dimensions of Service Quality

An Empirical Study of Servqual as a Tool for Service Quality Measurement
www.iosrjournals.org 11 | Page
•Tangibles: Tangibles would include those attributes pertaining to physical items such as equipment, buildings,
and the appearance of both personnel and the devices utilized to communicate to the consumer. Bitner (1992)
presented her conceptual framework for examining the impact of physical surroundings as it related to both
customers and employees. Berry and Clark (1991) provided validation of the physical appearance on the
consumer‟s assessment of quality. With the research by Bitner (1990), it was noted that physical appearance
might influence the consumer‟s level of satisfaction. Tangible was one of the original dimensions that were not modified by Zeithaml, et al (1988).
•Reliability: Reliability relates to the personnel‟s ability to deliver the service in a dependable and accurate
manner. Numerous researchers, including Garvin (1987) found that reliability tends to always show up in the
evaluation of service. Parasuraman, et al (1988) indicated that reliability normally is the most important attribute
consumers seek in the area of quality service. It was also determined by Parasuraman, et al (1991) that the
conversion of negative wording to positive wording as suggested by Babakus and Boller (1991) and Carman
(1990) increased the accuracy of this dimension. Negative wording in the request for a customer response
caused the customer to misinterpret this particular determinant. Walker (1995) found that if there is an adequate delivery of the basic level of service, then peripheral performance leads consumers to evaluate the service
encounter as satisfactory. Reliability was one of the original dimensions not modified by Zeithaml, et al (1988).
•Responsiveness: The desire and willingness to assist customers and deliver prompt service makes up the
dimension of responsiveness. Parasuraman, et al (1991) include such elements in responsiveness as telling the
customer the exact time frame within which services will be performed, promptness of service, willingness to be
of assistance, and never too busy to respond to customer requests. Bahia and Nantel (2000) disregarded
responsiveness in their research, claiming a lack of reliability even though they recognized SERVQUAL and all of its dimensions as the best known, most universally accepted scale to measure perceived service quality.
Responsiveness was also one of the original dimensions not modified by Zeithaml, et al (1988).
•Assurance: Knowledgeable and courteous employees who inspire confidence and trust from their customers
establish assurance. In banking studies by Anderson, et al (1976), it was determined that a substantial level of
trust in the bank and its abilities was necessary to make the consumer comfortable enough to establish a banking
relationship. Parasuraman, et al (1991) included actions by employees such as always courteous behavior instills
confidence and knowledge as prime elements of assurance. Assurance replaces competence, courtesy,
credibility, and security in the original ten dimensions for evaluating service quality (Zeithaml, et al, 1988).
•Empathy: Empathy is the caring and personalized attention the organization provides its customers. Individual
attention and convenient operating hours were the two primary elements included by Parasuraman, et al (1991)
in their evaluation of empathy. The degree to which the customer feels the empathy will cause the customer to
either accept or reject the service encounter. Empathy replaces access, communication, and understanding the
customer in the original ten dimensions for evaluating service quality (Zeithaml, et al, 1988).
III. Methodology Of SERVQUAL Survey For Measuring The Gap Between Customer
Expectation And Their Perception Regarding The Service Provided By Bank X: A small survey has been conducted on the customers of „Bank X‟, locally serving for more than one
decade to represent the way to conduct SERVQUAL survey. The instrument‟s design causes it to be best suited
for use as a diagnostic methodology utilized for determining large areas of service quality strengths and
weaknesses. To evaluate the five service quality dimensions, sixteen statements were selected from the structured
SERVQUAL questionnaire format and then modified to make it precise and best suitable for banking sector.
The number of questions was squeezed because of the convenience of collecting responses from the customers
who were less willing to answer so many questions.
Two sets of questionnaires were prepared including sixteen identical statements. One set of questions
asks the customers to indicate the extent to which the bank‟s services should possess the features described by
each statement. The other set asks about their views regarding the extent to which they believe Bank X has the features and benefits described by the statement.
The questionnaire representing customer expectation focuses on the word „should‟ to state the level of
expectation regarding each criterion. A seven point Likert scale is used to get the level of expectation and
perception associated with each service quality criterion. After conducting the survey all the questionnaires were
collected for tabulation and analysis.

An Empirical Study of Servqual as a Tool for Service Quality Measurement
www.iosrjournals.org 12 | Page
Target sample: Generally, the customers of Bank X are categorized into two major groups: Corporate
customers and Retail customers. The retail customers have been chosen to conduct the survey as corporate
clients are treated to be the most valued ones and they usually get separate concentration and best services.
Moreover they are difficult to access. Thus, the retails customers are more likely to provide the most accurate
response regarding the service.
Sample size: The research sample consists of 40 customers of different branches of Bank X
Data Analysis: For the analysis of the collected data a primary or rough analysis was conducted to validate the
questionnaire for gathering the adequate information. The filled up questionnaires were scanned to discard
unwanted or insincere responses. The data analysis was conducted using SPSS.
Table: 2 The 16 statements used for collecting responses:

An Empirical Study of Servqual as a Tool for Service Quality Measurement
www.iosrjournals.org 13 | Page
Table 3:
To make the calculation clear let’s consider any one statement from the questionnaire. The following
table represents the calculation of the difference between the scores of Questionnaire 1 and 2. Statement
Table: 4

An Empirical Study of Servqual as a Tool for Service Quality Measurement
www.iosrjournals.org 14 | Page
Table 5: The following table shows the average gap between customer expectation and their perception
regarding various service features of Bank X.
Service Quality
Dimensions
Mean
Difference of
each
statement
Mean difference for each SQ
Dimension
Tangibles
Statement 1 -1.2
- 0.61
Statement 2 0.325
Statement 3 -0.05
Statement 4 -1.525
Reliability
Statement 5 -0.85
-0.775
Statement 6 -0.775
Statement 7 -0.55
Statement 8 -0.925
Responsiveness
Statement 9 -2.125
- 1.61 Statement 10 -1.175
Statement 11 -1.525
Assurance
Statement 12 -1.1
- 0.72 Statement 13 -0.825
Statement 14 -0.225
Empathy
Statement 15 -0,07
- 0.0725 Statement 16 -0.075
Table 5 represents the average gap score between customer expectation and perception. The charts of details
analysis have been attached with the appendices. The average gap score for all the service quality dimensions of
Bank X are showing negative figure where the highest gap scores were for responsiveness. The rest four
dimensions show comparatively smaller gap that represents lesser customer dissatisfaction regarding the
services.
IV. Scope of SERVQUAL survey
The concept of measuring the difference between expectations and perceptions in the form of the SERVQUAL
gap score proved very useful for assessing levels of service quality. Parasuraman argued that, with minor
modification, SERVQUAL can be adapted to any service organization. Information on service quality gaps can
help managers diagnose where performance improvement can best be targeted. The largest negative gap,
combined with assessment of where expectations are highest, facilitates prioritization of performance
improvement. Equally, if gap scores in some aspects of service do turn out to be positive, implying expectations

An Empirical Study of Servqual as a Tool for Service Quality Measurement
www.iosrjournals.org 15 | Page
are actually not just being met but exceeded, then this allows managers to review whether they may be "over-
supplying" this particular feature of the service and whether there is potential for re-deployment of resources
into features which are underperforming.
V. Limitations of SERVQUAL Survey
There have been a number of studies that doubt the validity of the 5 dimensions and of the uniform
applicability of the method for all service sectors. Despite Parasuraman et al.'s (1988) initial claim that
their five service quality dimensions are generic, it is generally agreed that this is not the case, and that the
number and definition of the dimensions varies depending on the context. When measuring the quality of
accounting firms, Freeman and Dart (1993) conclude that service quality is a seven-dimensional construct.
Robinson and Pidd (1998) propose 19 dimensions of service quality in the context of management science
projects. According to Stauss & Weinlich (1997), a closer look, however, reveals some deficits of attribute-
based quality measurement (like SERVQUAL). First, the data collected by these methods cannot
completely reflect the customer's quality perception. Second, the respondents are forced to aggregate their
quality experiences in a problematic way. For example, a customer of a bank asked to evaluate the
friendliness of customer contact employees of a bank is forced to tick a single point on a scale even if
he/she had contacts with three employees whose behavior and friendliness differed considerably.
Teas (1994) noted that SERVQUAL expectations have been variously defined as desires, wants, what
a service provider should possess, normative expectations, ideal standards, desired service, and the level of
service a customer hopes to receive. These multiple definitions and corresponding operationalizations of
“expectations” in the SERVQUAL literature result in a concept that is loosely defined and open to
multiple interpretations (Teas, 1994). Different interpretations of “expectations” include a forecast or
prediction, a measure of attribute importance, classic ideal point, and vector attribute (Teas, 1993; Parasuraman et al., 1994b). These various interpretations can result in potentially serious measurement
validity problems.
VI. Recommendation For Further Studies/ Researches Regarding Measuring Service
Quality:
Use of SERVQUAL scale in GAP Analysis model of measuring Service Quality: From the perspective of specific service sector/ organization
Use of some contemporary models to measure service quality. (Like SERVPERF for Education service)
Development of a conceptual framework to measure the web-based service quality using the SERVQUAL model.
Modification of SERVQUAL scale
References: [1]. Bexley, James B. (1999), Service quality: an empirical study of expectations versus perceptions in the delivery of financial services in
community banks, University of Stirling, December 2005
[2]. Parasuraman, A., Valarie A. Zeithaml , and Leonard L. Berry (1985), “A Conceptual Model of Service Quality in its Implications for
Future Research,” Journal of Marketing, 49 (Fall), 41-50.
[3]. Zeithaml, Valarie A., Mary Jo Bitner (1990), Services Marketing, New York, Irwin McGraw Hill.
[4]. Parasuraman, A., Zeithaml, V.A., and Berry, L.L. (1988): SERVQUAL: A multiple-item scale for measuring consumer perceptions of
service quality. Journal of Retailing, 64, 41-50.
[5]. Peter, J. P., Churchill, G. A., & Brown, T. J. (1993). Caution in the use of difference scores in consumer research. Journal of
Consumer Research, 19(1), 655-662.
[6]. Paul R. Messinger, A Service Quality Audit: An Application of the Gap Analysis Model, (University of Alberta, 1990
[7]. http://www.12manage.com/methods_zeithaml_servqual.html
[8]. http://en.wikipedia.org/wiki/SERVQUAL
[9]. http://findarticles.com/p/articles/mi_qa3713/is_200007/ai_n8893832 [10].
Appendix
Customers’ Questionnaire (Expectation)
Dear Respondents,
Any information you provide will be kept strictly confidential. This survey is completely voluntary. Your full participation would greatly help the cause of the study.
Instruction: Please indicate the extent to which the services provided by Bank X should possess the features described
by each statement.
Please circle one number for each statement

An Empirical Study of Servqual as a Tool for Service Quality Measurement
www.iosrjournals.org 16 | Page
Appendix
Customers’ Questionnaire (Expectation)
Dear Respondents,
Any information you provide will be kept strictly confidential. This survey is completely voluntary. Your full
participation would greatly help the cause of the study.
Instruction: Please indicate the extent to which you believe Bank X has the features and benefits described by the
statements.
Appendix
An Empirical Study of Servqual as a Tool for Service Quality Measurement
www.iosrjournals.org 17 | Page
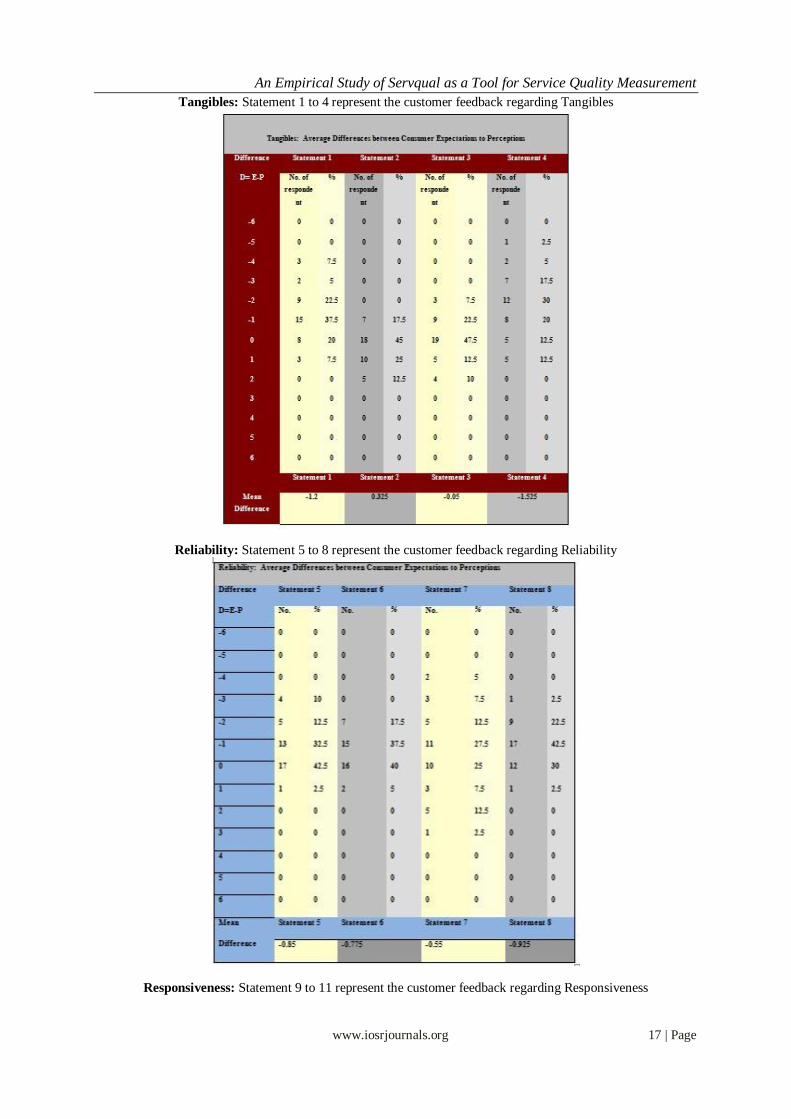
Tangibles: Statement 1 to 4 represent the customer feedback regarding Tangibles
Reliability: Statement 5 to 8 represent the customer feedback regarding Reliability
Responsiveness: Statement 9 to 11 represent the customer feedback regarding Responsiveness

An Empirical Study of Servqual as a Tool for Service Quality Measurement
www.iosrjournals.org 18 | Page
Appendix Assurance: Statement 12 to 14 represent the customer feedback regarding Assurance

An Empirical Study of Servqual as a Tool for Service Quality Measurement
www.iosrjournals.org 19 | Page
Appendix
Empathy: Statement 15 and 16 represent the customer feedback regarding Empathy
Empathy: Average Differences between Consumer Expectations to Perception
Difference
D= E- P
Statement 15 Statement 16
No % No %
-6 0 0 0 0
-5 0 0 0 0
-4 0 0 0 0
-3 2 5 0 0
-2 10 25 5 12.5
-1 9 22.5 8 20
0 13 32.5 16 40
1 5 12.5 8 20
2 1 2.5 2 5
3 0 0 1 2.5
4 0 0 0 0
5 0 0 0 0
6 0 0 0 0
Mean
Difference
Statement 15 Statement 16
-0.07 -0.075

IOSR Journal of Business and Management (IOSRJBM)
ISSN: 2278-487X Volume 1, Issue 5 (July-Aug. 2012), PP 20-27 www.iosrjournals.org
www.iosrjournals.org 20 | Page
Law Enforcement In Malaysian Securities Markets
Asmah Laili Yeon 1, Faridahwati Samsuddin
2
1(Associate Prof. Ph.D, School of Law, College of Law, Government and International Studies,
Universiti Utara Malaysia, Malaysia) 2(Senior Lecturer Ph.D, School of Human Resource, College of Business, Universiti Utara Malaysia, Malaysia)
Abstract : The objective of this paper is to discuss issues of law enforcement in Malaysian Securities Markets.
This survey was conducted among 107 principal and representative licensees registered with the Securities
Commission of Malaysia. They consist of licensed dealers, investment advisers and fund managers. The majority
of the respondents were capital markets and services representative licensees (CMSRL), while only 17 respondents were capital markets and services licensees. On a scale of one to five, respondents were found to be
generally satisfied with the roles and responsibilities of enforcement bodies i.e. Securities Commission and
Bursa Malaysia (mean of satisfaction = 3.660 to 3.952). The study shows that there is a positive relationship
between the views and attitudes of respondents towards the implementation of the legal philosophy by the
enforcement bodies (r= .524, r= .480). As the main enforcement agencies, Securities Commission and Bursa
Malaysia should further enhance efforts to monitor and enforce the law of capital markets. In conclusion, this
paper provides useful information in relation to factors contributing to non compliance of participants of the
capital markets. The enforcement bodies can implement measures on how to curb the unethical behaviour by
carrying out ethics training and introducing new rules and regulations for the industry.
Keywords - enforcement of law, investor protection, non-compliance, securities law, securities commission
I. INTRODUCTION Capital and services markets provide a useful means to mobilize capital and harness economic interests
in an efficient manner to drive innovation and growth. Toward this end, Malaysia has implemented various
measures to make the capital markets more attractive and competitive in the form of Disclosure Based Regulations (DBR) through the Malaysian Capital Markets Master Plan 2000 – 2010. Recently, in 2011, the
Securities Commission of Malaysia launched the second phase of the plan which focuses more on the regulatory
challenges, growth, international standards and governance. In 2010, the Malaysian capital markets generated
substantial income for the country. The equity market generated market RM1,275 billion, the bond market
RM759 billion, the Islamic Capital Markets RM1,050 billion, the investment management RM377 billion, and
the derivatives market RM43 billion (Securities Commission, 2011) [1]. The huge income generated by this
industry is because of the capital and services market in Malaysia is well-regulated and this is recognized by the
International Organization of Securities Commission (IOSCO, 2011) [2]. Further, Malaysia is the signatory to
cross-border enforcement arrangements and known for high standards of regulation internationally. The MMOU
has enhanced the SC's supervision and enforcement capabilities in dealing with cross-border market abuse,
particularly in the area of financial fraud and insider trading, and has raised the level of overall investor
protection in Malaysian market (Neetasha Rauf, 2012) [3]. The main regulator for the industry is the Malaysian Securities Commission which has a legal power under the Securities Commission Act 1993, whereas, the Bursa
Malaysia is the main registered stock exchange in Malaysia and acting as a self regulator body for its members
and recognized and given powers under the Capital Markets and Services Act 2007. They play important roles
to enhance the securities markets and services in Malaysia. The Malaysian securities markets regulation has a
comprehensive legal framework. But looking at the statistic of securities crimes in Malaysia, it shows increasing
numbers in cases of securities crimes (Securities Commission, 2011) [4]. For example between 2004 and 2006,
2006 there were nine cases involving misconduct in securities transactions. The study by Asmah, Nurli, and
Rohana (2002) [5] found that among the categories listed company involved in the non-compliance with the
Listing Requirements of the KLSE (now known as Bursa Malaysia) is the manufacturing industry (24%),
construction (18.7%), and securities market industry (14.7%). Other industries, however, showed a relatively
low percentage of non-compliance. Therefore, it is paramount important to discuss about the findings of the study in relation to law enforcement in Malaysian Securities Markets.
II. LITERATURE REVIEW Malaysia has fully observed one of the 32 benchmarks (on accounting standards) and has largely
observed nearly all of the benchmarks under the six categories of methodology (81% of 32 benchmarks) [6].
Since then, Malaysia continued to close the gaps on the remaining shortcomings, the most significant being amending the Companies Act 1965 (CA) to address gaps in related-party transactions, penalties for

Law Enforcement in Malaysian Securities Markets
www.iosrjournals.org 21 | Page
contravention by directors, private enforcement capacity of investors and disclosure; amending the listing
requirements for stricter disclosures by listed companies; implementing measures to expand the role of the
audit committee in line with international best practices; the Capital Market & Services Act 2007 (CMSA)
enhancing the effectiveness of regulatory oversight of the SC by empowering it to institute civil proceedings;
and transforming GLCs into high-performing entities and upgrading of GLC boards
.
1. Enforcement Bodies: Securities Commission and Bursa Malaysia
The Securities Commission established on 1 March 1993 under the Securities Commission Act 1993.
The Commission is a self-funding statutory body with investigative and enforcement powers. It reports to the
Minister of Finance and its accounts are tabled in Parliament annually. The SC's many regulatory functions
include supervising exchanges, clearing houses and central depositories; registering authority for prospectuses
of corporations other than unlisted recreational clubs; approving authority for corporate bond issues; regulating
all matters relating to securities and futures contracts; regulating the take-over and mergers of companies
;regulating all matters relating to unit trust schemes; licensing and supervising all licensed persons; encouraging
self-regulation; and ensuring proper conduct of market institutions and licensed persons.
Improving transparency and benchmarking against best international practices have been key factor in
transforming the Malaysian capital market as an efficient source for raising longer-term funds to finance
economic activity. Reflecting the importance accorded to meeting international standards, 43 of the 152 recommendations in the Capital Market Master plan that were released in 2002 were related to improving
transparency and promoting higher standards of disclosures. To date, 37 of these 43 recommendations has been
implemented (2010, Securities Commission) [7]. Further, the Securities Commission, as the competent
regulatory authority for oversight of the capital market, has voluntarily undertaken independent assessments
under the various standards set by the IMF/World Bank, and the International Organisation of Securities
Commissions (IOSCO). The SC has also supported the move to comply with international best practices on
accounting-related matters.
In relation to the implementation of Code of Corporate Governance, Malaysia voluntarily agreed to be
assessed under the Corporate Governance Reports on the Observance of Standards and Codes (CG ROSC) by
the World Bank in 2005, based on a methodology that is benchmarked against the internationally accepted
OECD Principles of Corporate Governance. Malaysia has published the CG ROSC that was completed in 2005. Malaysia has fully observed one of the 32 benchmarks (on accounting standards) and has largely
observed nearly all of the benchmarks under the six categories of methodology (81% of 32 benchmarks). Since
then, Malaysia continued to close the gaps on the remaining shortcomings, the most significant being amending
the Companies Act 1965 (CA) [8] to address gaps in related-party transactions, penalties for contravention by
directors, private enforcement capacity of investors and disclosure; amending the listing requirements for
stricter disclosures by listed companies; implementing measures to expand the role of the audit committee in
line with international best practices; the Capital Market & Services Act 2007 (CMSA) enhancing the
effectiveness of regulatory oversight of the SC by empowering it to institute civil proceedings; and
transforming GLCs into high-performing entities and upgrading of GLC boards. In addition, the SC is also
working closely with the respective Malaysian accounting boards to integrate accounting principles, with a
commitment on full convergence with international accounting standards by 2012.
As for Bursa Malaysia, in striving to build a market of quality and integrity, it is guided by regulatory principles to achieve goals in the aspect of (a) investor protection to remain intact, (b) high standards of
business conduct by listed issuers and brokers and (c) efficient and effective (Bursa Malaysia, 2012) [9].
2. Law, Principles, Rules and Policy
The Capital Markets and Services Act 2007 (CMSA 2007) [10] states offences of securities crimes
includes false trading, market rigging, market manipulation, fraudulent and misleading trading, dissemination of
false trading and insider trading. Implementation of dual sanction, criminal and civil actions in combating
securities crimes is seen as an effective strategy. These provisions are stated in the CMSA 2007 in Part V,
Division 1, section 175 to 201.
According to the Bursa Malaysia in managing conflicts of interests with public interest, public interest and in
particular the need for investor protection should prevail and the measures are separation of the regulatory functions from the commercial functions to ensure that these functions operate independently; and that business
units within Bursa Malaysia are not in a position to influence any supervisory or regulatory decisions made by
regulation.(Bursa Malaysia, 2012) [11].
As for Bursa Malaysia in regulating market misconduct, it has the Business Rules of Bursa Malaysia Securities
Berhad (Market Misconduct) [12] where the key trading rules that market surveillance focuses on the following
issues: (a) Rule 401.1(2) where participating Organisations (POs), Heads of Dealing (HD) and Dealer's
Representative (DR) shall refrain themselves from engaging in, or be a party to, any unethical practices that may

Law Enforcement in Malaysian Securities Markets
www.iosrjournals.org 22 | Page
damage the confidence of investors and hamper the sound development of the stock market, (b) Rule
401.1(3)(a) and (b) where POs, HD and DR shall avoid, and shall not participate in any operation by others
which might have the same result, any act or practice which might lead to a false or misleading appearance of
active trading in any securities on the stock market of the Exchange or a false or misleading appearance with
respect to the market for, or the price of, any such securities; or directly or indirectly be tantamount to stock
market manipulations, (c) Rule 404.1(4) where a PO shall not allow any form of irregular and/or unhealthy practice to exist or prevail in its daily and professional business conduct, (d)Rule 404.1(7)(c) where every PO
shall at all times maintain a proper supervisory programme and a system of internal controls which must take
into account among others, the PO's operations and proper conduct of its business and (e) Rule 404.3(1)(a) and
(c) where every PO and every DR shall at all times observe professional standard of integrity and fair dealing
and conduct their business in a manner which contributes to the maintenance of a fair and orderly market.
Further, market surveillance by the Bursa Malaysia is to ensure the market operates in a fair and orderly manner
so as to promote efficient price discovery and investor protection. This is achieved through the conduct of
dynamic and timely regulatory measures, the undertaking of real-time and post-trade monitoring and analysis of
both equities and derivatives trading activities (Bursa Malaysia, 2012) [13]. The surveillance system is able to
detect a wide range of possible market misconduct situations on real-time basis. The Bursa Malaysia Listing
Requirements of Public Listed Companies (PLCs) is also one of legal document which regulates PLC in its
business activities [14].
III. RESEARCH METHODOLOGY To achieve the above objective, a survey was conducted among principal licensees registered with the
Securities Commission of Malaysia. They consist of licensed dealers, investment advisers and fund managers.
According to the official list issued by the Securities Commission, as at December 31, 2007, there were 37
licensed dealers(company), investment advisers (80 companies and 16 individuals), investment advisors
(financial planner), (27 companies,and,14 individuals), and 80 fund managers (companies). For company
licensee dealers, questionnaires were submitted to the Company Secretary and Compliance Officer. But for
other licensees of a company status (e.g. investment advisors), questionnaires were given to the Company
Secretary. License holders of an individual status, the questionnaires were personally handed to them. Based on the distribution of questionnaires to the respondents, a total of 107 respondents had given
their responses. Seventeen of the respondents are the Capital Markets and Services licensee while the remaining
90 respondents are the Capital Markets and Services Representative licensee (CMSRL). The respondents were
asked to indicate their level of satisfaction or dissatisfaction on a five-point Likert scale ranging from 1‟
“Strongly dissatisfied” to 5‟ “Strongly satisfied”, on a number of items on the performance of the
implementation of capital market legal philosophy and the characteristics of public disclosure policy of
Malaysian securities markets. With respect to legal philosophy, respondents were asked to indicate to what
extent they were satisfied or not satisfied that the legal philosophy of capital market is able to respond to any
changes in the financial field at different times and in appropriate ways, to ensure that capital markets continue
to operate fairly and efficiently, and to assist economic development and growth, financial and business interests
in the future, to name a few. On the other hand, with respect to characteristics of public disclosure in Malaysia, respondents were
asked to indicate whether they are satisfied or not satisfied that the public disclosure in Malaysia requires
companies to make a public announcement of material information (e.g. income of the company, the Board of
Directors), requires that the information disclosed in the prospectus the company must be simple and adequate
for public knowledge, and enables and assists the public or potential investors to make the right choice and good
value for their investment. The items of the instrument were assembled based on previous research and relevant
Malaysian statutes, regulations and rules.
IV. RESULTS The discussion on this part will highlight results [15] of the following items; (i) license holders views
on roles and responsibilities of enforcement bodies, (ii) policy and business rules of Bursa Malaysia and (iii) the
relationship between the view and attitude of the respondent on the effective implementation of legal philosophy
Securities Commission and Bursa Malaysia and (iv) discussion on selected cases where the SC had successfully
brought these case to justice.
1. License Holders views on Roles and Responsibilities of Enforcement Bodies
Bursa Malaysia and Securities Commission Malaysia (SC) plays an important roles and in enforcement
of securities law. Table 1 and 2 below shows the effectiveness of both bodies in carrying out their functions and
responsibilities in the securities industry in the country. The findings show that respondents are generally
satisfied with the effectiveness of the functions and responsibilities carried out by the two agencies. Table 1
describe that respondents are satisfied with the role played by the Securities Commission of Malaysia in terms

Law Enforcement in Malaysian Securities Markets
www.iosrjournals.org 23 | Page
of ensuring that the provisions of securities laws are complied with (mean = 3.915), monitoring and supervising
the activities of any exchange, clearing and depository (min = 3.906), and supervising all licensed holders under
securities laws (mean = 3.952).
Table 1: Frequency (%) Mean values for the level and effectiveness of the Securities Commission of
Malaysia (SSM) in the Implementation Roles and Responsibilities
From Table 2 below, the study found that respondents are generally satisfied with Bursa Malaysia's role in
carrying out their duties and responsibilities as a self-regulator. This is in terms of protecting the public interest
by providing protection to investors' needs (mean = 3.869), and take appropriate action as provided in the Rules
No. Item NN SD D M S SS Mean
1. Advise the Minister on all
matters concerning securities and futures
industry.
107 - 6.5 29.0 44.9 19.6 3.775
2. To regulate all matters
relating to securities and
futures contracts.
107 - 5.6 22.4 51.4 20.6 3.869
3. To ensure that the
provisions of securities laws
are complied with.
107 - 7.5 18.7 48.6 25.2 3.915
4. Regulate the acquisition and
amalgamation of
companies.
107 - 6.5 22.4 54.2 16.8 3.813
5. To regulate all matters
relating to unit trust
schemes.
107 - 2.8 33.6 47.7 15.9 3.766
6. Monitor and supervise the
activities of any exchange,
clearing house and central
depository.
107 .9 3.7 19.6 55.1 20.6 3.906
7. Promote and encourage
good behavior among
members of the exchange,
clearing, depository and all
licensed persons.
106 1.9 7.5 31.8 43.0 15.9 3.635
8. Consider and make
recommendations for law
reform in relation to
securities and futures
contracts.
106 2.8 12.1 18.7 42.1 24.3 3.729
9. Encourage and promote the development of securities
markets and futures
contracts in Malaysia,
including research and
training related to it.
106 .9 6.6 33.0 44.3 15.1 3.660
10. Licensing and supervising
all licensed persons under
the securities laws.
10Dictionary
Bottom of Form
106 .9 6.6 17.9 45.3 29.2 3.952
11. Develop and maintain the
integrity of all licensed
persons
106 - 11.3 17.0 53.8 17.9 3.783

Law Enforcement in Malaysian Securities Markets
www.iosrjournals.org 24 | Page
of Bursa Malaysia for the purpose of monitoring or ensuring compliance (mean = 3.841). The respondents also
satisfied with the role of Bursa Malaysia in ensuring if any interest required to be protected by any law relating
to conflict with the interests of the corporation as aforesaid, then the public interest should prevail (mean =
3.719).
Table 2: Frequency (%) Mean values for the level and effectiveness of the Bursa Malaysia (BM) in the
Implementation Roles and Responsibilities as a Self-regulator
No. Item N SD D M S SS Mean
1. Protecting the public interest by
providing protection to investors'
needs.
107 - 4.7 19.6 59.8 15.9 3.869
2. Ensure that if any interest
required to be protected by any
law relating to conflict with the interests of the corporation as
aforesaid, then the public interest
should prevail.
107 .9 7.5 24.3 53.3 14.0 3.719
3. Take appropriate action as
provided in the Rules of Bursa
Malaysia for the purpose of
monitoring or ensuring
compliance.
107 - 7.5 19.6 54.2 18.7 3.841
2. Policy and Business Rules of Bursa Malaysia
Respondents were also asked about the extent to which policies and regulations of Bursa Malaysia
(BM) and comprehensive enough. Table 3 shows the findings of the study. Generally, respondents felt that the
policies and regulations of Bursa Malaysia in terms of public dissemination of the policy (mean = 3.476), immediate disclosure of material information (mean = 3654), and periodic disclosure (mean = 3.3523) is
sufficient and comprehensive.
Table 3: Frequency (%) and Mean Value of Any perception on the How the Policy and Rules of Bursa
Malaysia Adequate and Comprehensive
No. Item N SD D Uncertain A SA Mean
1. Corporate disclosure policies are generally in the
Listing Requirements of
Public Listed Companies is
sufficient and
comprehensive.
107 - 8.4 30.8 54.2 6.5 3.588
2. Immediate disclosure of
policy information is
sufficient and
comprehensive material.
107 - 9.3 23.4 59.8 7.5 3.654
3. Public dissemination of the
policy as a whole is
sufficient and
comprehensive.
107 .9 15.9 22.4 56.1 4.7 3.476
4. Policy information,
confirmation and denial of
rumors or reports are
adequate and
comprehensive.
107 - 18.7 36.4 36.4 8.4 3.345
5. Policy information,
confirmation and denial of
rumors or reports are
adequate and
107 .9 10.3 33.6 48.6 6.5 3.495

Law Enforcement in Malaysian Securities Markets
www.iosrjournals.org 25 | Page
comprehensive.
6. Policy disclosure in
promotional activities to
excess is sufficient and
comprehensive.
107 - 13.1 43.0 36.4 7.5 3.382
7. Policy on insider trading is
sufficient and
comprehensive.
107 1.9 13.1 34.6 44.9 5.6 3.392
8. Regulations on disclosure
are adequate and comprehensive periodic
107 - 9.3 35.5 48.6 6.5 3.523
9. Regulations pertaining to
the early preparation for
the announcement to the
public is sufficient and
comprehensive.
107 - 9.3 27.1 57.0 6.5 3.607
3. The relationship between the view and attitude of the Respondent on the Effective Implementation of
Legal Philosophy Securities Commission and Bursa Malaysia
In addition to descriptive analysis made on data collected, this study also conducted a correlation
analysis of the study variables. The correlation matrix is shown in Table 4 below. Table 4 below shows that
there is a positive relationship between the views and attitudes of respondents in relation to the implementation of the legal philosophy of the effectiveness of the Securities Commission and Bursa Malaysia's performance of
its functions and responsibilities as law enforcement agencies (r = .524, r = 480). In other words, the SC and
Bursa Malaysia is seen to play their role effectively in accordance with the legal philosophy of the capital
market in Malaysia.
Table 4: Correlation Matrix of Variables
Variables 1 2 3 4 5 6 7 8 9
Philosophy (1) - .427** .524** .480** .311** .223* .173 .207* .107
Disclosure (2) - .360** .356** .126 .276* .095 .135 .328**
SSM (3) - .644** .571** .277* .346** .234* .134
BM (4) - .457** .313** .143 .189 .105 BM Policy(5) - .151 .253* .177 .094
Crimes (6) - .423** .387** .346**
Punishment (7) - .091 .290*
Civil Sanction(8) - .220*
Non compliance (9) -
4. Enforcement of law
The success of Securities Commission in criminal prosecution in 2012, can be referred to the case
Ashari Rahmat (Securities Commission, 2012) [16] where Ashari an operating Ashari, an operating officer of
MIH, was charged in 2000 for engaging in an act which operated as a deceit on UPA Corporation Berhad's IPO
exercise by switching successful applications with those not put through the balloting process. His conviction
was confirmed and the fine sentence of RM1 million was ordered to be paid. The High Court also allowed a stay
of the jail sentence pending appeal to the Court of Appeal upon payment of bail in the sum of RM500,000. In 2011, in the case of Chan Kok Suan (Securities Commission, 2011) [17] , the Group Managing
Director of Granasia Corporation Bhd, ("GCB"), was charged for causing to be submitted to SC false
information, namely the revenue and profit after tax of GCB for the year ended 31 Dec 2002. This information
was submitted in connection with GCB's listing proposal on the Main Board of the Exchange. The High Court
Judge maintained the RM500,000.00 fine but increased the default of imprisonment from 10 months to 2 years.
The prosecution has filed an appeal against the sentence to the Court of Appeal. In another case Mok Chin Fan,
Jimmy Tok Soon Guan & Cheong Kok Yai (Directors of Inix Technologies Holding Bhd) were charged with
offences under s.122B(b)(bb) of the Securities Industry Act (SIA) for knowingly authorising the furnishing of
false statements to Bursa in relation to Inix's 4 quarterly reports for FYE 31 July 2006; i.e. 31 Oct 2005, 31 Jan
2006, 30 April 2006 & 31 July 2006. In addition they were charged under s.55(1)(a) of the Securities
Commission Act (SCA) for causing the issuance of INIX Prospectus, which contained information that is false.
Normah bt Sapar (Senior Account Executive of Inix) was charged with abetting Jimmy Tok in committing all the offences set out above. On 29 September 2011, Mok Chin Fan (Mok), Cheong Kok Yai (Cheong) and

Law Enforcement in Malaysian Securities Markets
www.iosrjournals.org 26 | Page
Normah binti Sapar (Normah) pleaded guilty to all the offences they were charged with. Jimmy Tok Soon Guan
pleaded guilty to all the offences he was charged with on 13 October 2011. Mok and Cheong were each fined
RM125,000 (in default 1 year imprisonment) for the offence under s.55 of the SCA and fined RM50,000 (in
default 6 months imprisonment) for each of the four offences under s.122B of the SIA bringing the total fine
imposed on Mok and Cheong to RM325,000. Normah was fined RM150,000 (in default 1 year imprisonment)
for the offence under s.55 of the SCA and fined RM50,000 (in default 6 months imprisonment) for each of the four offences under s.122B of the SIA bringing the total fine imposed on Normah to RM350,000. Jimmy the
CEO and Executive Director of INIX, was fined RM400,000 (in default 2 year imprisonment) for the offence
under s.55 of the SCA. For the 4 offences under s.122B of the SIA, he was fined RM200,000 (in default 18
months imprisonment) for the first and second charges respectively and RM150,000 (in default 12 months
imprisonment) for the third and fourth charge respectively bringing the total fine imposed on Jimmy to RM1.1
million.
In relation to civil actions and regulatory settlements the SC entered into a settlement with Lim Chin
Chin (Securities Commission, 2012) [18] in the sum of RM232,320 when she agreed without admission or
denial of liability to settle a claim that the SC was proposing to institute against her for insider trading in the
shares of Sin Chew Media Corporation Berhad ('Sin Chew') between 29 January 2007 and 30 January 2007,
contrary to Section 89E(3)(a) of the Securities Industry Act 1983. The settlement was reached following a
letter of demand sent by the SC pursuant to its civil enforcement powers under the securities laws, where the sum Lim Chin Chin was required to disgorge was equivalent to three times the gains made by Ong Sew Teng
and Chong Hiong Lim in connection with their trades in Sin Chew shares.
Sanctions were imposed for various breaches of the Bursa Malaysia Listing Requirements against listed issuers
and their directors as shown in the table below. For 2008, the total number of sanctions issued was 160 and
included reprimand and fines amounting to RM1,283,400.
Table 5: Enforcement by Bursa Malaysia
Sanctions Imposed Listed Issuers Directors Total
Public Reprimand and Fine 1 53 54
Public Reprimand 49 17 66
Private Reprimand 21 19 40
Total Sanctions 71 89 160
Total Fines Imposed (RM) 5,000 1,278,400 1,283,400
(Source: Bursa Malaysia, 2012)
Enforcement actions were also instituted against market participants, their dealer representatives and
agents for violation of Bursa Malaysia Rules. In 2008, a total of 127 enforcement actions were initiated and
completed, with priority given to market offences. These actions encompass caution, reprimand, fines and
suspension as presented in the table below and resulted in imposition of fines amounting to RM610,000. In
order to enhance market awareness, the more severe breaches will be imposed public sanctions.
Table 6: Enforcement Actions by Bursa Malaysia
Type of Action
Taken
Participating
Organisations
Authorised
Depository
Agents
Derivatives
Trading
Participants
Derivatives
Clearing
Participants
Registered
Persons Total
Striking off - - - - 1 1
Suspension - - - - 1 1
Reprimand & Fine
5 - 4 - - 9
Fine 24 3 2 - 14 43
Reprimand 20 9 1 5 12 47
Caution 17 3 4 - 2 26

Law Enforcement in Malaysian Securities Markets
www.iosrjournals.org 27 | Page
Total
Sanctions 66 15 11 5 30 127
Total Fines
Imposed (RM)
363,900 2,300 70,000 - 173,800 610,000
(Source: Bursa Malaysia, 2012)
V. CONCLUSION The overall findings of the study shows that respondents generally satisfied with the roles and
responsibilities of enforcement bodies i.e. Securities Commission and Bursa Malaysia (mean of satisfaction =
3.660 to 3.952). Further, the study also shows that there is a positive relationship between the views and
attitudes of respondents towards the implementation of the legal philosophy by the enforcement bodies (r= .524,
r= .480). Even though the result is positive but as the main enforcement agencies, Securities Commission and
Bursa Malaysia should further enhance efforts to monitor and enforce the law of capital markets. It is also
proposed that courts should also play its role in imposing fines on criminals based on the amount of losses suffered by investors, severity and effects of crimes on markets stability. The courts should impose the
maximum penalty rather than a moderate amount which is not justified the harm done to the markets and
investors as a whole. More importantly, ethics training should be imposed to license holders by the Securities
Commission. In conclusion, this paper provides useful information in relation to enforcement of law in
Malaysian capital markets. It helps the enforcement body implemented measures on how to curb the unethical
behaviour.
VI. Acknowledgements This research is financed by Fundamental Research Grant Scheme, Ministry of Higher Education, Malaysia.
REFERENCES [1] Securities Commission, Law Enforcement by Securities Commission, Annual Report, Securities Commission, 2011. Available:
http//www.sc.com.my (June 24, 2012)
[2] Securities Commission, Compliance with IOSCO principles, Securities Commission, 2008. Available: http//www.sc.com.my (June
24, 2012)
[3] International Organization of Securities Commission,The MMoU: Ten years of Enhancing Cross-border Enforcement Cooperation,
Proc., The Annual Conference of the International Organization of Securities Commissions (IOSCO), Beijing, 2012 at pp 3.
[4] Securities Commission, Law Enforcement by Securities Commission, Annual Report, Securities Commission, 2011. Available:
http//www.sc.com.my (June 24, 2012).
[5] Asmah Laili Yeon, Nurli Yaacob and Rohana Abd Rahman, Non compliance of public listed companies in Malaysia, research
report, Universiti Utara Malaysia, Kedah, 2002. The research is financed by Universiti Utara Malaysia.
[6] Securities Commission, Corporate Governance Blueprint 2011, A Blue Print report, Securities Commission, 2011. Available:
http//www.sc.com.my (June 24, 2012).
[7] Securities Commission, Capital Markets Plan 2, A Report, Securities Commission, 2011. Available: http//www.sc.com.my (June
24, 2012).
[8] International Law Books Services, Capital Markets and Services Act 2007 (Kuala Lumpur: ILBS, 2012).
[9] Securities Commission, Law Enforcement by Securities Commission, Annual Report, Securities Commission, 2011. Available:
http//www.sc.com.my (June 24, 2012).
[10] International Law Books Services, Companies Act 1965 (Kuala Lumpur: ILBS, 2012).
[11] Securities Commission, Law Enforcement by Securities Commission, Annual Report, Securities Commission, 2011. Available:
http//www.sc.com.my (June 24, 2012).
[12] Bursa Malaysia, Business Rules of Bursa Malaysia Securities Berhad (Market Misconduct) (Kuala Lumpur, 2011).
[13] Securities Commission, Law Enforcement by Securities Commission, Annual Report, Securities Commission, 2011. Available:
http//www.sc.com.my (June 24, 2012).
[14] Bursa Malaysia, Listing Requirement of Public Listed Companies (Kuala Lumpur: Bursa Malaysia, 2012).
[15] Asmah Laili Yeon & Faridahwati Mohd Shamsuddin, Pelaksanaan Kerangka Perundangan Penzahiran dalam pasaran Industri
Sekuriti di kalangan pemegang-pemegang lesen di Malaysia. Research Report. Universiti Utara Malaysia, Kedah, 2011. The
research is financed by Fundamental Research Grant Scheme, Ministry of Higher Education of Malaysia.
[16] Case Ashari Rahmat (2012). Enforcement of Securities Commission. Available at sc.com.my (June 24, 2012).
[17] Case Chan Kok Suan (2011). Enforcement of Securities Commission. Available at sc.com.my (June 24, 2012).
[18] Case Lim Chin Chin (2011). Enforcement of Securities Commission. Available at sc.com.my (June 24, 2012).

IOSR Journal of Business and Management (IOSRJBM)
ISSN: 2278-487X Volume 1, Issue 5 (July-Aug. 2012), PP 28-30
www.iosrjournals.org
www.iosrjournals.org 28 | Page
Performance Evaluation of Urban Cooperative Banks In India
Dr.K.V.S.N JAWAHAR BABU Principal
KMM Institute of Technology & Science Tirupati
Abstrac: Urban co-operative banks (UCBs) are one of the vital segments of the banking industry of India. They essentially cater to the credit needs of persons of small means. Co-operative Banks are organized and managed
on the principals of co-operation, self-help, and mutual help. These have been playing imperative role in Indian
financial system with broad network in both urban and rural areas. Co-operative sector plays a very important
role in fulfilling the directive principles and the objectives of Five Year Plans. The co-operative sector seeks to
remedy the economic inequality and evils of concentration of income and wealth and thereby prevents the
exploitation of the weaker sections by the stronger. Co-operation is a noble ideology and it aims at establishing
a just civilized society. It lays the road to peace and abundance of wealth, both material and moral for all the
citizens.
I. Introduction There was a decline in the number of UCBs from 1,770 at the end of March 2008 to 1,721 at end the
end of March 2009. This decline was an outcome of the consolidation process. The income tax paid for last
fiscal by 1,780 urban cooperative banks and credit societies, mainly spread across Maharashtra, Andhra
Pradesh, Gujarat, Karnataka and Tamil Nadu, was around Rs 1,000 crore. This shows the might of UCBs and
their contribution to the people on the one side and to the exchequer and the society at large on the other.
The urban cooperative banking system has witnessed phenomenal growth during the last one and a half decades.
Deposits in UCBs have increased by over 1100 percent from Rs. 8600 crore to over Rs.100, 000 crore, while
advances have risen from Rs. 7800 crore to over Rs.65,000 i.e. by 733 percent during 1991-2005. According to
National Association for Cooperative Urban Banks (NAFCUB), the total deposits & lending of Co-operative Banks is much more than Old Private Sector Banks & also the New Private Sector Banks. The joint stock Banks
who had opened in the urban and semi urban areas did not yet cater to these small depositors. This absence of
banking and credit facilities forced these groups to go to unscrupulous money lenders and private mortgagers
who used to charge exorbitant interests or imposed almost non-repayable terms.
Features of UCBs:
Important part of the financial system in India.
democratically controlled,
provide need based quality banking services,
Essentially cater to the middle and lower middle classes and marginalized sections of the society.
Procedural simplicity
Close contact, informal atmosphere and local involvement
Dual control, with a part of the powers vested in the State Government and a part with Reserve Bank.
Heterogeneity among the banks in this sector in terms of size, geographical distribution, performance and
financial strength
Diversity among the urban cooperative banks in the levels of professionalism, standards of corporate
governance and access to advanced technology
Consequent upon the easing of licensing norms in May 1993, more than 800 licenses were issued for setting
up urban cooperative banks. However, close to one-third of these newly licensed UCBs became financially
weak within a short period. Today, there are evidences which clearly point out the weaknesses of UCBs
such as lack of sound corporate governance, unconscionable lending, high levels of loan delinquency,
inability to operate in a liberalized and competitive environment.
Hindrances to the performance of UCBs
Rising Competition: The Urban Co-operative Banks’ (UCBs) segment, which was considered as one of the
robust and fast expanding segments of the banking system till late 1990s, has become one of the weakest
with regular cases of failures. It must be recognized that an UCB’s basic organization is driven by the
philosophy of co-operation and in a increasingly competitive environment an urban bank becomes more
vulnerable on account of factors like size, location and compulsions to lend to a sector and thus, is deprived
of scale economies.

Performance Evaluation of Urban Cooperative Banks in India
www.iosrjournals.org 29 | Page
Scams: Involvement of some of the UCBs in Gujrat and Andhra Pradesh in the share market scam in 2001
greatly lowered the level of public confidence in these banks. Even the existence of the Deposit Insurance
and Credit Guarantee Corporation (DICGC), the upper insurance coverage is only up to Rs 1 lakh.
Low Capital base: Further in spite of their strengths, the Urban Cooperative Banks also have a weakness in
terms of generation of share capital. Thus the UCB sector is presently on a crossroad with these Banks
finding it increasingly difficult to maintain their heterogeneous and unique cooperative character with the requirements of a strict regulatory regime and prudent banking norms as has been insisted upon by the RBI
in the aftermath of the Gujrat and Andhra Pradesh experiences. in case of UCBs, the shareholders can
withdraw their contribution to capital and shrink the capital of the bank and thereby limit its ability to
increase risk weighted assets and expand business
No clear-cut Loan and Investment Policy: In most of the UCBs in the state, there is virtually any
Loan Policy not to speak of a comprehensive well laid out Loan Policy. The most important part of Loan
Policy is the pre-credit appraisal part which is absent in the so called Loan Policy of many banks. The
ultimate result of this type of mismanagement in and non appraisal of the risk in credit is non recovery of
loans and assets and standard assets trickling down to substandard, doubtful and non-recoverable loss.
The fact remains that most of the UCBs has no policy of Investment. They are making investments
based on their experience and on the basis of circulars and guidelines issued by the RBI from time to time but there are instances of violation of directives of RBI by some banks in the past by purchasing securities
from fake brokers and ultimately the officers are entrapped in fraud case and money invested is turned into
loss assets.
Piling- up of NPAs: A high power committee constituted by RBI finds that the NPA levels in UCBs
are disproportionately high, which is a major challenge to be tackled is. Like policy of Loans and Advance
UCBs should have an Investment Policy and be updated in each year and approved in the BODs meeting.
As a result of total mismanagement and frauds, the Non-Performing Assets – which do not yield any
income increased abnormally and the banks became weak/sick.
Dual Control: The multiplicity of regulation and control from central and state bodies hinders the smooth and
efficient functioning of UCBs on the one hand, and the absence of administrative control by the government
authorities leads to arbitrary usage of funds, and putting stakeholders’ interests at stake.
Poor governance: UCBs borrowers have a significant say in the managements of the banks. This has the
potential of influencing the Boards to take decisions that may not always be in the interest of the depositors who
constitute the most important stakeholders of a bank. Uneven geographical dispersal: Uneven geographical dispersal of UCBs in few states such as Maharashtra,
Gujarat, Karnataka, Andhra Pradesh and Tamil Nadu is evident from the fact that those states account for over
80% of urban cooperative banks presence and 75% of their total deposits. The type of reach cooperative banks
has in our country and the type of customized services they can offer at the local level, the potential is
tremendous. But, the question is have we achieved the true potential? The answer to the question to a certain
extent is negative.
THE FAILED BANKS
– NAKED TRUTH
Name of the UCB
No. Of
Deposi
tors
Deposi
ts
Non-
Perfor
ming
Assets
(NPA)
Capital to
Risk
Weighted
Asset Ratio
(CRAR)
Krushi 8,247 Rs.35.69 Cr.
32.22 Cr.
N.A.
Charminar 1,38,0
00
Rs.297
Cr.
63.20
%
(64.52
Cr)
N.A.
Vasavi 1,38,5
11
Rs.143
Cr.
67.20
%
(84.64
Cr.)
0.25%
Prudential Bank 1,86,7
65
Rs.451
.39 Cr.
66.50
%
(300.2
2 Cr.)
-23.6%

Performance Evaluation of Urban Cooperative Banks in India
www.iosrjournals.org 30 | Page
II. Common Irregularities Reported In Some Ill Managed Cooperative Banks: Siphoning of funds by directors
Term loans were converted into overdrafts and loan amounts were enhanced without any formal request
from the borrowers.
Sub-prime mortgage: Huge amounts of loans were sanctioned on the basis of the properties mortgaged with
the bank, which had fake and fabricated sale deeds and therefore had no legal value. There is an instance
wherein a borrower obtained a loan of Rs.50 lakhs by mortgaging a Municipal Park in Hyderabad City. In
yet another sensational instance, a borrower mortgaged the land belonging to Wakf Board and obtained a
loan of Rs.2.5 crores. And there are instances, where crores were sanctioned even on the basis of non-
existing properties.
Most of the properties mortgaged were grossly over valued by the valuators of the banks.
Fictitious entries indicating repayment of huge amount of cash and subsequent withdrawal on the same day
with a view to prevent the said amount from being classified as Non-Performing Assets (NPA).
The application for sanction of big loans were received in the head office directly by Chairman / Managing
Director and the loan amounts of crores of rupees were sanctioned on the same day without obtaining any verification reports from the field officers regarding viability of the project / business, repaying capacity,
credit worthiness etc. of the applicant.
The UCBs offered unviable very high interest rates as well as incentives to the depositors.
The banks continuously defaulted in the maintenance of CRR and SLR.
Ignoring the RBI directive, the Banks sanction huge loans to the prohibited and risky sectors.
Borrowers with no capacity to run business and repay amounts are sanctioned huge loans.
Loan proposals instead of routing through the Branch Managers were directly recommended by the
Directors.
In several instances crores of rupees were sanctioned to the individuals, who were not even income-tax
payers.
Advances were sanctioned for unproductive / consumption / ceremonial purposes.
Excess drawl was allowed in many Over-Draft accounts.
The system of internal audit do not exist in many of the banks.
III. Conclusion Urban Cooperative Banking is a key sector in the Indian Banking scene, which in the recent years has gone
through a lot of turmoil. Though some UCBs have shown credible performance in the recent years, a large
number of banks have shown discernible signs of weakness. The operational efficiency is unsatisfactory and
characterized by low profitability, ever growing non-performing assets (NPA) and relatively low capital base. Also urban cooperative banks have not been able to service the growing credit requirements of clients or the
newer demands for loans in the field of personal finance. In the interest of healthy competition, the urban
cooperative banks should be encouraged to grow. Thus a few bad eggs should not curb the growth of a key
banking entity.
References: [1]. Zulkhibri A Majid and Habibullah S Muzafar (2005): Determinants of 24 Deposit Taking Co-operatives’ Failure in 1986: An
Empirical Evidence, Asian-AfricanJournal of Economics and Econometrics, Vol. 5, No 2, 2005
[2]. Ramesha K (2003): Co-operative Banking and Financial Sector Reforms in IndiaAgenda for Future Research, International
Conference on Mapping Co-operativeStudies in the New Millennium, British Columbia Institute for Co-operative Studies,
[3]. University of Victoria and International Co-operative Alliance, Victoria BC, Canada,May 28-31, 2003
[4]. Ramesha K (2004): Economic Reforms and the Performance of Co-operative Sector in India – Lessons for Future,
International Association for the Economicsof Participation, 12th Biannual Conference, Saint Mary’s University, Halifax,
Canada,July 8-10, 2004
[5]. Ramesha K, Chipalkatti Niranjan and Rishi Meenakshi (2006): Who Failed Whom? An Empirical Assessment of Prudential
Standards and Co-operative Banks inIndia, AEA-ASSA Annual Conference, January 6-8, 2006, Boston MA, USA
[6]. Reserve Bank of India: Report on Trend & Progress of Banking in India (1993-94to 2004-05), RBI, Mumbai
[7]. Government of India (1998): Report of the Committee on Banking SectorReforms, RBI, MumbaiReserve Bank of India (1999):
Report of the High Power Committee on UrbanCooperative Banks, RBI, Mumbai

IOSR Journal of Business and Management (IOSRJBM)
ISSN: 2278-487X Volume 1, Issue 5 (July-Aug. 2012), PP 31-36 www.iosrjournals.org
www.iosrjournals.org 31 | Page
Leveraging Technological Capabilities for Competitive
Advantages: Giving Samsung Way a Glance
Nader Arvand International Business School (IBS), UTM, Malaysia
Abstract: One of the serious problems confronting developing and developed economies is the management
and preservation of energy sources. While modern technologies (systems, tools, and machines) are being
developed, demands for computing and telecommunication systems grow to adapt people with new business
environment. Current electricity users comprise new generation of heavy electricity users such as portable
electronic systems which have been boosted rapidly over span of happening years, whereas their main energy
sources such as batteries have been improved in energy density and capacity at a much slower pace.
Keywords: Battery, Technology, Competitive advantage
I. Introduction Transition from fixed-lined devices to wireless, had provided users with convenience of moving small
computers (laptops) and changing their places before modern mobile handsets invented. They have made
unlimited mobility available for devices equipped by internet applications, business and computer software, and
eye-catching point is that you have all your data, mail boxes, and business in a tiny device fitting your pocket.
Unfortunately, the battery performance has not been improved at a desirable pace [1]. To fully grasp the small-scale mobile device users, companies need to more effectively allocate their
resources and pursue market-driven strategies in terms of technology management and innovation. Convergent
technology developed in smartphones currently comprises computing, navigation, imaging, and media
applications, however; only the computing features have been considered by consumers to be useful and good
quite enough which motivates them to pay [2].
The question raised here is whether the low speed of improvement in the cell phone battery industry is
caused by falling or low demand of customers (user behaviour), or by technological obstacles that make it
difficult for technical experts to achieve creating high-capacity batteries. I study cell phone users' behaviour by
the questionnaire approach with N=426 (small sample size) showing that customers do not consider the battery
life time as their first three priorities when they buy a cell phone.
On the technical side, developing more energy-efficient handsets which work well without wasting energy is the major engineering difficulty [1]. The problem with batteries is posed where more "mAh"(the unit
for battery life time measurement describing the total amount of energy a battery charges up at each recharging)
is better since it gives you higher battery capacity, but likely the battery is heavier and bigger than the others.
Up until this point, overcoming mentioned problem with batteries necessitate producing larger and heavier
batteries simultaneously. The amount of electric energy consumed with a cell phone is being raised where
features, applications, and networks provided by a cell phone are increasing. Therefore, there are more critical
situations in which battery running out of power faces, especially for smartphone users.
The satisfactory solution that electronics engineering experts come with is Dynamic Power
Management (DPM) technology which refers to selective shut-off or slow-down of the idle or underutilized
components [3]. However, this technique works quite effectively when the mobile device does not support
communication capabilities including 3G cellular network and Wi-Fi connection [4].
Burgelman, Christensen, and Wheelwright (2009) [5] found that the larger existence gap between the company's own technological knowledge and those for customers of that particular technology results in higher
prices for a product carries mentioned technology.
The purpose of this article is to recognize and estimate the own knowledge of electronics companies in
terms of improving battery lifetime, then to compare it with customers' knowledge which has been analysed
based on primary data gathered, in order to figure out how the existing gap is large. Then, if it can be proved
that giant electronics companies have already gained the information and technology of manufacturing longer
life-time smartphone batteries, so the logic behind their decision on not bring it to the market and commercialize
it is clarified.

Leveraging Technological Capabilities for Competitive Advantages: Giving Samsung Way a Glance
www.iosrjournals.org 32 | Page
II. Literature review One of the earliest previous studies on mobile phones published by Wright et al. (1998) [6], who
carried out a life-cycle energy research on a pilot mobile phone in Sweden and United Kingdom in 1997. They
arrived at a conclusion that in terms of energy perspective, it would be more environmentally friendly to recycle mobile phones whereas costs might limit. Thus it seems the longer mobile phone life cycle leads to less material
and waste recycling costs while could indirectly ease the pressure exerted by environmental groups on mobile
handset industry.
Meskers and Hageluken (2009) [7] estimated that over 40 elements are parts of mobile phones overall,
including copper (a soft reddish-brown metal that allows electricity and heat to pass through it easily) and tin (a
soft silver-white metal that is used to cover and protect iron and steel), special metal elements including indium
and antimony, and precious metals such as palladium (a soft silver-white metal that is often combined with gold,
and used to cover an object with a very thin layer of metal) and gold. Metals account for around 23% of a cell
phone weight, where plastics form 50% of its weight.
Assessing cell phone market shows cell phones have fairly short product life cycle, without being
affected or influenced by brand names or models. Numerous users see their cell phones as products which are no longer useful within little over a year, because new models are being marketed with short shelf life. Thus,
mobile phones, in terms of mass and volume, are most valuable electronic materials founded in waste streams
[8]. The subject can be donated more attention whilst cash pay-outs are substantial when it comes to setting up
the project of treating used plastics and metals so they can be used again.
While the real problem is being faced in industry and market sides, the solution can be rooted in a
technology advances the cell phone life cycle or rather the long-life battery.
Energy consumption of advanced cell phones is being generated by computing and connectivity
applications, therefore, studies have viewed the energy consumption measurement from different perspectives
including wireless fidelity connections [9], GPS applications [10], VoIP systems [11], video streaming and
media applications and data managing algorithms [12], however; consumer feelings and opinions have not been
mentioned on aforementioned papers. Mobile phone users' attitudes with regard to energy consumption levels
and savings have been examined by Rahmati and Zhong (2008) [13] and probed by Heikkinen and Nurminen (2009) [14].
This paper reports the concerns and expectations users have regarding applications, energy
consumption and whether or not Samsung Electronics has met this demand with current products offered.
III. Methodology The study will specify criteria that customers use to judge portable devices (smartphones) and make
decisions about their purchase. Their opinions (data) were collected by asking them to fill questionnaires.
Respondents are comprised of experts in electronics, business students (MBA students of International Business
School of University Technology Malaysia), and the public, all own and use smartphones. Meanwhile, the study is aimed at exploring the investment development path of Samsung Electronics and how
she adapts herself in terms of customers' preferences -determined by questionnaire- and advanced cell phone
batteries, by collecting and reporting secondary data.
IV. Analysis IV.I Limitations
The limitations have been placed on this analysis by the public where they answered questions posed in
a way showing their commitment to the technological norms, whereas they did not have the know-how to
explain why they think a particular technical feature of their cell phones has the quality of being important to them. Thus, all answers given to open-ended questions represent the opinions of technologically aware segment
of users, but not all respondents.
IV.II Focus
According to the small scale of the sample size, best endeavours have been made to looking for how
respondents think rather than how many users think in a certain way, therefore, the majority of questions left
open for more suggestions. The first three priorities of users when buying a cell phone, User's knowledge and
concerns over battery life time and capacity, and why they own Samsung brand or not are main subjects that need to be discussed and deal with in this analysis.

Leveraging Technological Capabilities for Competitive Advantages: Giving Samsung Way a Glance
www.iosrjournals.org 33 | Page
IV.III Data categorization
Table.1 (Rates of return)
Questionnaires Electronics
Experts
MBAs The Public Total
Distributed 115 66 245 426
Returned 98 66 164 328
Percentage 85.2% 100% 66.9% 77%
Table.2 (Respondent’s profile)
Table.3 (Responses)
Questions Categories of Responses
1 How much battery life do you need?
1.1 More than a day for all respondents: Music fans, Internet heavy-users, Talkative users (+24h/ not on standby position)
2 Do cell phone batteries’ details
make any impression to you?
2.1 Misconceptions. (Students)
2.2 No information. (Students & the public)
2.3 Know-it-all.(Electronic experts)
3 Aside from price, when you buy a
smartphone, which are the features
that you look for the most?
3.1 Look
3.2 Durability
3.3 Brand name
3.4 Battery lifetime
4 Do you use Samsung cell phone?
Why?
4.1 No, I am not a fan. (Students)
4.2 No, it does not satisfy my needs well. (Students)
4.2 No, it does not satisfy my needs well. (Electronic experts)
4.3 Yes, it satisfies my needs except battery lifetime. (Students)
4.4 Yes, it satisfies my needs. (The public)
Profile Frequency
Gender Male 238
Female 188
Total 426
Age Group ≥ 45 67
between 31 - 44 48
< 31, ≥ 25 311
Total 426
Status Employed
Student
Other
51.4%
42.8%
5.8%
A Samsung user yes 48
no 378

Leveraging Technological Capabilities for Competitive Advantages: Giving Samsung Way a Glance
www.iosrjournals.org 34 | Page
IV.IV Patterns and connections
Aforementioned categorizations include people with various educational levels, their desire for a cell
phone's features, and their standpoints of Samsung brand. The technical knowledge about the cell phone battery
varies subtly among respondents and naturally is in harmony with electronics expertise required for responding.
The interesting point observed among 29 0ut of 30 student respondents is the misconception or relative lack of
general information, when it comes to translating battery labels. This is similar to responses drawn from the public. Thus, the users' technology knowledge regarding cell phones' batteries shows no ascending trend moving
from ordinary people to master students.
Customers' highest ranking desires and wants of a cellular phone features differ significantly between
respondents. The formal education level goes up, regardless of the specialization, the way that desirable features'
priorities are arranged differs, so that "Durability" is first, the "Battery life-time" is second, and the "Brand"
ranked thirdly. In reverse and a bit different order, the "Look", "Durability", and "Brand" rank as the first three
main favourable features distinguished of a smartphone by the public.
A Korean company that is best known for making and marketing electronic goods- Samsung is the
popular brand among the public as they are satisfied with its smartphones' looks. Samsung product planning in
terms of features has attracted the public attention by its smartphones' appearance successfully, whereas only 17
out of 181 respondents (66 masters of business accompanied by115 electronic experts who own smartphones)
say they use Samsung smartphone for being satisfied with its durability. To complicate matters for Samsung, no literate Samsung smartphone users voted for satisfying battery life time.
When the question" How much battery life do you need?" was put to respondents, they made a choice
of "longer the better" meaning more than 24 working hours to them, practically, more than what is being
provided by smartphone batteries.
IV.V Interpretation
The relations between users' technical knowledge, their desires regarding smartphone features, and
their battery lifetime need contain apparent contradiction. Where present smartphones batteries' lifetime causes the inconvenience of recharging regularly and all respondents, without being influenced by their technical
knowledge, stress this clear need, the query necessitates to be answered is about why ever they still give low
priority to batteries when buying a smartphone.
Following table shows the top priority among list of features in terms of users' viewpoints.
Table.4 (Users’ priorities)
V. Discussion V.I Battery Life
V.I.I Do smartphone users allow new applications eat battery life?
New computer software with the capability of being run online demands a considerable supply of
electricity and is the main battery life reducible. The Prospect Theory developed by Kahneman and Tversky
(1979) [15] explains the people assessment of changes as they make judgment on new things becoming different compared to a reference point. Based on this hypothesis, especially when it places emphasis on people's non-
linear attitudes with regard to this issue, users do not allow new applications reduce their battery life time.
But, in questionnaire, 87% of respondents rephrased their smartphone usage as the clear preference for internet
access rather than 4 day handset's battery life. Others (13%) highlighted a sharp contrast between appearance of
mobile phones and mobile phones that also works as a personal digital assistant (PDA), as their proof of a
smartphone purchase.

Leveraging Technological Capabilities for Competitive Advantages: Giving Samsung Way a Glance
www.iosrjournals.org 35 | Page
V.I.II Are users aware of power-saving methods?
Largest power consumer items of a smartphone are but not limited to display brightness, automatic
discovery of Wi-Fi, probing for external devices via Bluetooth, Rich Site Summary (RSS: software that tells an
Internet user when a website has new information on it), and status update in social networks. The survey
carried out in China by Rahmati and Zhong (2008) [14] revealed that many users were not realizing or rather
noticing that their smartphones are provided with power-setting options. As the supporting documentation, during this study, 14.3% of respondents who have been classified under electronics experts were aware of the
availability of power-setting options, and more importantly, how to make more energy efficient adjustments.
Student and the public placed the blame on handbooks containing a lot of information or details.
The brief discussion included is whether the low speed of improvement in the cell phone battery industry is
caused by falling or low demand of customers (user behaviour), or by technological obstacles. The preceding
discussion part formed based on users' behaviour. The customers' needs and wants regarding battery lifetime
have been identified as their demand grows faster than technology. If a company does especially well compared
to rival firms in terms of designing and introducing next generation of smartphone batteries with longer lifetime,
they can represent a competitive advantage.
V.II Samsung strategies for gaining a competitive advantage
V.II.I Strategies
A component-based company, Samsung, seized the opportunity in the digital age, when her previous rival in preceding years missed out on digital music and digital television. Sony, a product-based company, who
keeps her focus on technology and innovation, did not promote technological innovation and failed to catch
competitive advantage in digital goods competition. Gaining ownership or increased control over distributors or
retailers and looking for ownership or increased control of suppliers are vertical strategies being followed by
Samsung [16].
V.II.II Technology internalization
The acquisition, alternation, and application of systems and technologies from outside the firm's logistics, can improve technological capabilities. The process is external technology sourcing and provides an
opportunity to design and manufacture a self-designed and exclusive product [17].
Doing an assessment of smartphone battery improvements illustrates here that advanced battery technology is
the high complexity. The Table.4.1 and 2 show the technology matrix and mode of technology internalization
matrix. The technology matrix is the box formed by technological availability at low and high levels as columns,
and technological complexity at high and low levels as rows. The technology internalization matrix is combined
by multi-specialty and acquisition methods of core technology as its dimensions. Acquisition methods are "Buy"
and "Make" as columns and the multi-specialty is at high and low level demonstrated as rows.
Table.4.1 Availability
High Low
Complexity
High
HCHA cell HCLA cell
Low
LCLA cell
LCHA cell
Table.4.2 Acquisition methods of core technology
Buy Make
Multi- specialty
High
Mid-entry strategy mode Full-scale in-house R&D mode
Low
Effective reverse engineering mode Focused in-house R&D mode

Leveraging Technological Capabilities for Competitive Advantages: Giving Samsung Way a Glance
www.iosrjournals.org 36 | Page
VI. Conclusion Unfortunately, the battery performance has not been improved at a desirable pace [4], and the survey
conducted in this study reveals that the mentioned technology is low in availability in markets. When full-scale in-house R&D mode of acquisition methods of core technology is selected by Samsung for technologies in
MLCC (Ranked as Top five in its global market share, core component for Mobile Phone), performance of
technology internalization has been successful. The MLCC is categorized as high-complexity low-availability
within Samsung technology matrix [18], remarkably similar to the battery technology.
The broader gap between customers and companies in terms of product technology knowledge, the higher price
put up for that particular product is acceptable by market [5], thus, high investment in in-house research and
development for battery technology advancement accompanied by pull marketing strategy efforts -that
encourage demands- expect high return on investment within this industry while this modern technology
capability could reduce recycling costs of used plastics and metals as electronic waste streams.
References [1] Mikko, V. H., Jukka, K. N., Timo, S., & Heikki, H. (2012). Energy efficiency of mobile handsets: Measuring user attitudes and
behavior. Telematics and Informatics.
[2] Robinson, S. (2009). Cellphone energy gap: desperately seeking solutions, Strategy Analytics.
[3] Benini, L., Paleologo, G., Bogliolo, A., & De Micheli, G. (1999). Policy optimization for dynamic power management. IEEE Trans.
Computer-Aided Design, 813-833.
[4] Peng, R., & Pedram, M. (2010). A Markovian Decision-based Approach for Extending the Lifetime of a Network of Battery-
Powered Mobile Devices by Remote Processing. Low Power Electronics, 6(2).
[5] Burgelman, R., Christensen, C., & Wheelwright, S., Strategic management of technolog and innovation.(New York: McGRAW-
HILL INTERNATIONAL EDITION, 2009).
[6] Wright, L. M. (1998). Mobile phone takeback and recycling: analysis of the ECTEL project. Oak Brook, Illinois, USA, IEEE, pp. –
59.
[7] Meskers, C. H. (2009). Closed loop WEEE recycling? Challenges and opportunities for a global recycling society. In: Howard, S.M.
(Ed.), EPD-TMS congress 2009. Proceedings of Sessions and Symposia Sponsored by the Extraction & Processing Division (EPD)
of The Minerals, Metals & Materials Society (TMS), (pp. 1049–1054.). San Fransisco, California, USA.
[8] Ongondo, F., & Williams, I. (2011). Greening academia: Use and disposal of mobile phones among university students. Waste
Management, 1617–1634.
[9] Amitabha, G., & Sajal K., D. (2008). Coverage and connectivity issues in wireless sensor networks. Pervasive and Mobile
Computing, 303–334.
[10] Xiuxiao, Y., Jianhong, F., Hongxing, S., & Charles, T. (2009). The application of GPS precise point positioning technology in aerial
triangulation. ISPRS Journal of Photogrammetry and Remote Sensing, 541-550.
[11] Lin-huang, C., Chun-hui, S., Shih-yi, C., & Yen-wen, L. (2010). Design and realization of ad-hoc VoIP with embedded p-SIP
server. The Journal of Systems and Software, 2536–2555.
[12] Sammartino, G., Zarrelli, C., Urciuolo, V., Di Lauro, A., Di Lauro, F., Santarelli, A., et al. (2007). Effectiveness of a new decisional
algorithm in managing mandibular ameloblastomas: A 10-years experience. British Journal of Oral and Maxillofacial Surgery,
306–310.
[13] Rahmati, A., & Zhong, L. (2008). Human–battery interaction on mobile phones. Pervasive and Mobile Computing, 465–477.
[14] Heikkinen, M., & Nurminen, J. (2009). Consumer attitudes towards different aspects of mobile peer-to-peer services. First
International Conference in P2P Systems, (pp. 132–137).
[15] Kahneman, D., & Tversky, A. (1979). Prospect theory: an analysis of decision under risk. Econometrica, 263–291.
[16] Chang, S. (2009). Sony vs. Samsung: The Inside Story of the Electronics Giants’ Battle for Global Supremacy. J. Eng. Technol.
Manage, 26, 215–217.
[17] Lee, J., Bae, Z., & Choi, D. (1988). Technology development process in a developing country: a global perspective model. R&D
Management, 18(3), 235–250.
[18] Gil, Y., Bong, S., & Lee, J. (2003). Integration model of technology internalization modes and learning strategy: globally late starter
Samsung’s successful practices in South Korea. Technovation, 23, 333–347.

IOSR Journal of Business and Management (IOSRJBM)
ISSN: 2278-487X Volume 1, Issue 5 (July-Aug. 2012), PP 37-44 www.iosrjournals.org
www.iosrjournals.org 37 | Page
A Study of Service Quality Management on Health Care Industry
in Bangalore
H. S. Murthy 434, 8thMain, Vijaya Bank Layout, Bangalore560076
I. International and National Scenario USA:: Health care spending in America accounts for a larger share of GDP than in any other country Health
spending in the U.S., at about 17.5% of Gross Domestic Product (GDP) in 2010, is projected to grow to about
20% by 2020. Despite the incredible investment America continues to make in health care, 16.7% of people in
the U.S. (50.7 million people, up from 46.3 million the previous year) lacked health care coverage for the entire
year of 2009. For some, insurance was unavailable or unaffordable. In other cases, a lack of insurance was due
to a personal decision not to pay for it.
II. Other Countries: A comprehensive study published by the OECD (Organization for Economic Cooperation &
Development) in 2010, covering more than 30 nations including the majority of the world‟s most developed
economies (but not Brazil, Russia, India or China), found stark contrasts between health costs in the United
States and those of other nations. In 2008 (the latest complete data available), the average of a list that includes,
for example, the U.K., France, Germany, Mexico, Canada, South Korea, Japan, Australia and the U.S., spent
9.0% of GDP on health care. France at 11.2% and Switzerland at 10.7%. Health expenditures per capita, on a
purchasing power-adjusted basis (PPP), averaged $3,000.
Total health care expenditures around the world are difficult to determine, but $5.5 trillion would be a
fair estimate for 2010. That would place health care at about 8% of global GDP, with expenditures per capita
about $800. This $5.4 trillion breaks down to approximately $2.6 trillion in the U.S., $2.4 trillion in non-U.S. OECD nations, and $0.5 trillion elsewhere around the world. Outside the U.S. and the rest of the OECD, that
would allow roughly $88 per capita per year. Clearly, there is vast disparity in the availability and cost of care
among nations, as there is with personal income and GDP. Health care spending per capita in the U.S. was equal
to about $8,290 in 2010, while spending in the world‟s remotest villages was next to nothing. The trend over the
near future is for the modest amount now spent on health care in emerging nations to rise dramatically, while
OECD nations like America struggle to contain their own mountainous costs. Globally, the total prescription
drug market was in the $630 billion range in 2010.
III. Critical Partners: Employers, Employees And Insurer’s, Healthcare Providers Perspectives:
Many major employers are utilizing unique new programs in efforts to reduce employee illness, and
thereby reduce costs. For example, the use of preventive care programs is growing, as is the use of employee
education aimed at better managing the effects of diseases such as diabetes.
Patients and insurance companies are also dealing with sticker shock over the nation‟s prescription
drug costs. Other factors edging costs upward include expensive new medical technologies and patients‟
demands for greater plan flexibility in choosing doctors and specialists at their will. At the same time, hospitals
and health systems write off massive amounts of revenues to bad debt, which increases costs for bill-paying patients.
In the wake of the tremendous growth of all aspects of the health care industry from the end of World
War II onward, efficiency, competition and productivity were, regretfully, largely overlooked. Much of this
occurred because employers plus federal and state governments paid such a large portion of the health care bill.
Physicians are caught between the desire to provide quality care and the desire for cost control on the
part of payers, including PPOs, Medicare and Medicaid. The cost versus care debate has spawned an energetic
movement to improve the quality of health care in the U.S., much of it centered on patients‟ rights, disease
management, preventive health care and patient education. Nonetheless, wellness programs, preventive
medicine and health education remain woefully inadequate. One of the main differences between the health care
system of India and USA is the greater role of the states in health care provision

A Study of Service Quality Management on Health Care Industry in Bangalore
www.iosrjournals.org 38 | Page
IV. Indian Governmental Efforts & Primary Healthcare:
Healthcare in India features a universal health care system run by the constituent states and territories
of India. The Constitution charges every state with "rising of the level of nutrition and the standard of living of
its people and the improvement of public health as among its primary duties". The National Health Policy was endorsed by the Parliament of India in 1983 and updated in 2002. However, the government sector is
understaffed and underfinanced; poor services at state-run hospitals force many people to visit private medical
practitioners.
Government hospitals, some of which are among the best hospitals in India, provide treatment at
taxpayer expense. Most essential drugs are offered free of charge in these hospitals. Government hospitals
provide treatment either free or at minimal charges. For example, an outpatient card at AIIMS (one of the best
hospitals in India) costs a one time fee of rupees 10 (around 20 cents US) and thereafter outpatient medical
advice is free. In-hospital treatment costs depend on financial condition of the patient and facilities utilized by
him The charges for basic in-hospital treatment and investigations are much less compared to the private sector.
The cost for these subsidies comes from annual allocations from the central and state governments.
Primary health care is provided by city and district hospitals and rural primary health centres (PHCs). These hospitals provide treatment free of cost. Primary care is focused on immunization, prevention of
malnutrition, pregnancy, child birth, postnatal care, and treatment of common illnesses. Patients who receive
specialized care or have complicated illnesses are referred to secondary (often located in district and taluk
headquarters) and tertiary care hospitals (located in district and state headquarters or those that are teaching
hospitals).
Primary health centers are the cornerstone of the rural health care system. These facilities are part of a
tiered health care system that funnels more difficult cases into urban hospitals while attempting to provide
routine medical care to the vast majority in the countryside. Primary health centers and sub centers rely on
trained paramedics to meet most of their needs. The main problems affecting the success of primary health
centers are the predominance of clinical and curative concerns over the intended emphasis on preventive work
and the reluctance of staff to work in rural areas. In addition, the integration of health services with family
planning programs often causes the local population to perceive the primary health centers as hostile to their traditional preference for large families. Therefore, primary health centers often play an adversarial role in local
efforts to implement national health policies.
V. Status Of Indian Healthcare System: T he Indian healthcare industry is seen to be growing at a rapid pace and is expected to become a US$280
billion industry by 2020 The Indian healthcare market was estimated at US$35 billion in 2007 and is expected to
reach over US$70 billion by 2012 and US$145 billion by 2017 [3]. According to the Investment Commission of
India the healthcare sector has experienced phenomenal growth of 12 percent per annum in the last 4 years [4].
Rising income levels and a growing elderly population are all factors that are driving this growth. In addition, changing demographics, disease profiles and the shift from chronic to lifestyle diseases in the country has led to
increased spending on healthcare delivery [5].
Even so, the vast majority of the country suffers from a poor standard of healthcare infrastructure
which has not kept up with the growing economy. Despite having centers of excellence in healthcare delivery,
these facilities are limited and are inadequate in meeting the current healthcare demands. Nearly one million
Indians die every year due to inadequate healthcare facilities and 700 million people have no access to specialist
care and 80% of specialists live in urban areas.[6]
Indian Healthcare: Challenges & Prospects:
On the one hand, the Indian middle class, with its increasing purchasing power, is more willing than
ever before to pay more for quality healthcare. On the other, the supply of healthcare services has grown steadily, as the private sector becomes more involved in owning and running hospitals
Indian healthcare industry is fairly insulated from global recession and slowdown in the Indian
economy and healthy enough to grow at the rate of 15% over the period of next 10 years, reveals a report on
healthcare sector released by Confederation of Indian Industry (CII) and Grant Thornton India.
In order to meet manpower shortages and reach world standards India would require investments of up
to $20 billion over the next 5 years Forty percent of the primary health centers in India are understaffed.
According to WHO statistics there are over 250 medical colleges in the modern system of medicine and over
400 in the Indian system of medicine and homeopathy (ISM&H). India produces over 250,000 doctors annually
in the modern system of medicine and a similar number of ISM&H practitioners, nurses and para professionals
Better policy regulations and the establishment of public private partnerships are possible solutions to the
problem of manpower shortage.

A Study of Service Quality Management on Health Care Industry in Bangalore
www.iosrjournals.org 39 | Page
India faces a huge need gap in terms of availability of number of hospital beds per 1000 population.
With a world average of 3.96 hospital beds per 1000 population India stands just a little over 0.7 hospital beds
per 1000 population.. Moreover, India faces a shortage of doctors, nurses and paramedics that are needed to
propel the growing healthcare industry. India is now looking at establishing academic medical centers (AMCs)
for the delivery of higher quality care with leading examples of The Manipal Group & All India Institute of
Medical Sciences (AIIMS) already in place. As incomes rise and the number of available financing options in terms of health insurance policies
increase, consumers become more and more engaged in making informed decisions about their health and are
well aware of the costs associated with those decisions. In order to remain competitive, healthcare providers are
now not only looking at improving operational efficiency but are also looking at ways of enhancing patient
experience overall.
India has approximately 600,000 allopathic doctors registered to practice medicine. This number
however, is higher than the actual number practicing because it includes doctors who have immigrated to other
countries as well as doctors who have died. India licenses 18,000 new doctors a year.
According to data provided in 1989 by the Ministry of Health and Family Welfare, the total number of civilian
hospitals for all states and union territories combined was 10,157. In 1991 there were a total of 811,000 hospital
and health care facilities beds. The geographical distribution of hospitals varied according to local socio-
economic conditions. In India's most populous state, Uttar Pradesh, with a 1991 population of more than 139 million, there were 735 hospitals as of 1990. In Kerala, with a 1991 population of 29 million occupying an area
only one-seventh the size of Uttar Pradesh, there were 2,053 hospitals.
Medical tourism in India: Future trends
However, at the same time, India's health care system also includes entities that meet or exceed
international quality standards. The medical tourism business in India has been growing in recent years and as
such India is a popular destination for medical tourists who receive effective medical treatment at lower costs
than in developed countries A recent forecast by deloitte Consulting published in August 2008 projected that medical tourism
originating in the US would increase over ten times than what is it currently, in the next decade. An estimated
750,000 Americans outsourced their health care in 2007, and the report estimated around 1.5 million US patients
would be medical tourists who would be getting their surgery done abroad. this outsourcing will be broadly led
by low cost of healthcare in the developing countries, excellent infrastructure in terms of medical and surgical
care, the long waiting time in their local markets coupled with insurers that do not cover certain surgeries.
Responding to Customers’ needs A system for ab initio identification and correction of errors is also important for quality services.
Customers who are recipients of defective service often quickly reconcile themselves to shoddy services out of
sheer despair and do not bother to report them. Keeping nicely printed forms is not sufficient particularly in the
Indian context when there is poor credibility of services! Customers do not just believe that any improvement
will come and hence they merely turn cynical. On the other hand, sincere response to the customers even in
small matters earns a lot of goodwill. For example, a well reputed hotel in Coimbatore is known for immediate
action against their employees who take customer service lightly.
Since there is an enormous gap in the availability of services, customers in developing countries are not
at all demanding. Even normal services are considered a great boon. For instance, a flight arrival at the
scheduled time is considered a great obligation done to the passengers Consistency and predictability are
important aspects in the services sector.
Planning for the growth of quality services is by itself a big task in the developing countries. For example, electric supply to industries or water supply in towns and cities to a burgeoning population is not an
easy task. In a developing society, since the purchasing power of people is low, there is an expectation of
service at a low cost. However, by now, the realization has dawned that a good service organized at a reasonable
cost is definitely worth having. For example, even for a pay and use latrine in a bus stand, more and more
people are willing to pay, as long it is reasonably well maintained. The work of Sulabh International deserves
special mention in this regard.
Peter Drucker, the world famous management guru, predicts that the organization pattern in the
services sector will be such that unlike the traditional pyramidal organization, they will be flatter with more
responsibility at the lower rungs for their respective areas of functioning
Bangalore in the Indian Healthcare Map:
Since the 90s and more recently, the healthcare sector has witnessed corporatization in a big way .Bangalore, as a fastest growing city, has grown huge in the last 15 years, with Bangalore having been
recognized as the silicon city(not valley) of India. With the amalgamation of vast areas from the hither-to Rural

A Study of Service Quality Management on Health Care Industry in Bangalore
www.iosrjournals.org 40 | Page
Bangalore District, there has been an explosion in population, drawing from far off states in India, putting huge
pressure on the general infrastructure and in particular, the healthcare infrastructure. There is a big rise in private
sector hospitals, nursing home and 24-hour-care centres.The private hospitals in Bangalore are competing with
best Government hospitals as also the best private hospitals of the world.
VI. Objective of the Study To measure the quality of healthcare products and service being delivered and to identify factors those
influence the patients‟ and beneficiaries‟ confidence and comfort level. The key hypothesis is: Relationship
management plays a vital role.
VII. Methodology used in the Study
Extensive literature review done by the researcher stresses the usefulness of the Servqual model and
especially the empathy dimension in understanding the crystallization of the concept of service quality.
Repeated encounters help establish brand and customer loyalty, which is crucial if Bangalore is to emerge as a
hub for medical tourism and telemedicine. This study gives us a snapshot picture of the situation as far as service quality in Bangalore Hospitals and can be used improving service quality and thereby brand loyalty in
the future.
We measure service quality using the Servqual model of Parasuraman, on 5 dimensions: Tangibles,
Responsiveness Reliability, and Assurance. Empathy by survey method, on a 5 point Likert scale, of sample
size 500, on Non random (convenience) Snow Ball sampling method and then analysed using SPSS.
According to Parasuraman et al., Haywood-Farmer (1988) and others, there are three well-documented
characteristics of services-intangibility, heterogeneity and inseparability-which must be acknowledged for a full
understanding of service quality.
First, services are intangible, because they are performances rather than objects; most services cannot
be counted, measured, inventoried, tested or verified in advance of delivery to ensure quality. The main
implication of intangibility is that generally one cannot store a service, thus removing the final quality check
commonly found in the manufacturing sector.
Second, services have customers with very heterogeneous needs: Consumers of the same service do not
all have the same priorities. Consider for example, airline passengers. Different passengers may have different
priorities e.g. schedules, schedule reliability, booking arrangements, seat alignments, on-board meals, choice of
film, friendliness of flight attendants etc. An analogy may be drawn in the public sector. Within any class room
in a school, the particular learning needs of individual students will be different – some will be more numerate
or literature than others, and some will have different ambitions for applying the particular knowledge being taught to them. Similarly, in the health sector, some patients crave their own room on hospitalization, whereas
others do not want to be on their own.
Third, services have „inseparability‟ by which is meant that the production and consumption of services
are not separate as they are in manufacturing. As a consequence, in the service industry, quality is not
engineered into the product at the manufacturing plant and then delivered intact to the consumer. Rather, quality
occurs during the delivery of the service, usually during the interaction between the client and the key contact
person from the service provider. In these situations, the consumers‟ input becomes critical to the quality of the
service performance. Indeed, in many service contexts, the customer wishes to participate in creating the

A Study of Service Quality Management on Health Care Industry in Bangalore
www.iosrjournals.org 41 | Page
service. This is certainly true for health, education and social service encounters between professionals and
clients as well as for some aspects of government provision. Regarding government provision, whether at the
local, provincial or central level, the customer or stakeholder is sometimes intimately involved in the process,
for example in planning decisions for housing or industrial development if quality (lack of disagreement) is to
be achieved.
It is for these reasons that writers on service quality have defined service as a „deed‟, a „performance‟ or an „effort‟, thus highlighting the inherent importance of the consumer of service having an active involvement
in the production or completion of the service process itself.
Following from these features of intangibility, heterogeneity and inseparability, the nature of how quality is
evaluated for services is conceived to have a different emphasis from that of manufacturing where quality
judgments are essentially responses to tangibles.
SERVICE QUALITY Service quality in providing medical solutions has become a competitive advantage as service
providers irrespective of government or private. Though the awareness amongst the beneficiaries of medical
services has considerably increased, it has not reached all levels. Even today the trust factor plays a vital role in
the level of confidence patients have and it varies by individual. Though medical service providers have taken
all the factors into consideration, still the concept of “patient is king” as in the case of consumer products where “consumer is king” has not taken root. This is because even today patients are dependent on health care
providers. The dependency makes the beneficiaries ignore gaps in service quality.
VIII. Service Quality Judgments Service quality judgments are considered to be driven by a comparison of consumer expectations with
their perceptions of the actual service quality received. Also, this premise of service quality assumes that the
judgment of the service received will have combined both evaluation of the outcome of the service and the
evaluation of the processes of the service delivery. Hence, for services there is a strong interactive component to the whole aspect of quality, and some have sought to arrive at a general model of the determinants of customers‟
perception of service quality
● Reliability: e.g. performing the service at the designated time.
● Responsiveness: e.g. willingness to provide the service.
● Competence: e.g. possession of the required skills and knowledge to perform the service.
● Access: e.g. approachability and ease of contact with the providing institution etc.
● Courtesy: e.g. keeping customers informed in language they understand; also listening to them; it means
explaining the service; explaining any options or costs; assuring the customer that a problem will be
handled
● Credibility: e.g. belief that they have customers‟ best interests at heart, trustworthiness, honesty, etc.
● Security: e.g. freedom from danger, risk or doubt
● Understanding / knowing the customer: e.g. making the effort to understand the customers‟ needs by
providing individualized attention.
● Appearance / presentation e.g. the physical facilities, the appearance of personnel, tools or equipment used
etc.
The determinants of service quality above (based on Parasuraman et al.1985) demonstrate the weight of
interactive components in judgments of service quality. It is these interactive properties which have led some to
label the nature of quality in the service sector as preferential, so distinguishing it from the objective quality of the manufacturing sector, where quality is in the main associated with the properties of an object which can be
measured and demonstrated in a tangible sense. In contrast, quality in the preferential sense is identical not with
the properties of an object but rather with the capacity of the properties to achieve a goal, this goal being a state
of affairs which is preferred to other states.
Characteristics of excellent customer service (3 R’s)
Excellent customer service should be the aim of all suppliers of products and services. It has the
following characteristics:
Responsive:
Excellent customer service is responsive. A timely response is important. The customer had a requirement when they contacted you and they are likely to have delayed expressing their need. If you delay
responding they will solve their problem in some other way. You will have missed an opportunity to serve that
customer and the next person they call will probably be one of your competitors.

A Study of Service Quality Management on Health Care Industry in Bangalore
www.iosrjournals.org 42 | Page
Reliable:
Excellent customer service is consistently responsive, with continuously high levels of customer
service. The only surprises that customers find welcome and positive are those that improve the service they
receive and exceed their expectations. Customers want excellent customer service and they want it every time.
Reliability is heavenly Quality is about consistent reliability. I want good service and I want it every time. Quality requires
both consistency and reliability. A good friend is a reliable and a consistent friend.
It is costly for employers to deal with queries, recalls, complaints and so on and the same is true for the
consumer who is inconvenienced and frustrated by unreliability. Unreliability is not good for either party- buyer
or seller- yet it persists in abundance.
On the other hand, companies that can deliver consistent reliability every time at all the time, such as
Coca-Cola, will thrive well into the future, because they are just so rare. Reliability is heavenly.
Respectful: Informed, attentive, cheerful, polite and helpful customer service representatives should treat
customers with respect.
Excellent customer service is therefore reliable, respectful and responsive.
Why customer service problems exist (3 I‟s)
Unreliable customer service persists because of the existence of a lack of incentives, a lack of information and a
lack of independence.
Research Design A total of 540 persons were surveyed with regards to their attitudes towards the service provided by
private hospitals in Bangalore. As this is a descriptive study, a random sample was employed to further
understand the ratings provided regarding service quality. It must be borne in mind that this is a snapshot in
historical time and is likely to change in the fullness of time. At the time of writing, there is a clamour for
mechanisms of accountability such as citizen‟s charter and this is likely to affect the health care sector as well.
Analysis The data was analyzed with the help of SPSS statistical package. Though the data consisted mainly of
ordinal data, the use of the Likert scale and the moderately large sample size, justified the use of parametric
statistics such as correlation and regression. The main dependent variable was Rate Your Hospital, a measure of
overall satisfaction with the hospital and the independent variables were the various dimensions of the Servqual
scale i.e. Tangibles, Reliability, Assurance, Empathy, and Responsiveness..
Findings
“Did the Nurse come”, a measure of empathy came out as the most important, “Hospital Equipped”
(Tangibles), and “Rate your Doctor”. (Reliability) as the 2nd and 3rd factors.
Did the Nurse Come This is a measure of whether the nurse was easily accessible. In a large, impersonal setting like a
hospital, the nurse forms the interface between the hospital and the patient and is consequently crucial in
determining rating of service quality. This finding is also echoed in the results of correlation and regression,
which shows the importance of nurses in the healing process. In foreign hospitals, nurses are often accorded the
status of doctors. In India, this trend has yet to take root. Nurses are often poorly paid and over worked and the
profession has yet to find its place in the medical care scenario.
The one factor in which private hospitals outscore public hospitals is empathy.
India‟s new found wealthy, customers expect to be treated like royalty and are treated accordingly only in private hospitals. The nurse also acts as an interface between customer and hospital and thus is very
important from the point of view of customer satisfaction. In fact the physician writer Lewis Thomas is so
convinced of the centrality of nurses that he is willing to give them the moon if needs be.
Rate Registration The registration desk is the first point where the consumer encounters the hospital and is therefore
highly likely to shape customer attitudes. Indians coming out of a long history of socialism, where one had to
wait in long queues to register, are likely to pleasantly surprise to encounter a more streamlined registration
process. The variable is a measure of ease of registration from very easy to difficult to register. Not surprising,
most respondents rated the private hospitals well in terms of registration rate. However, most thought people at

A Study of Service Quality Management on Health Care Industry in Bangalore
www.iosrjournals.org 43 | Page
the registration counter were „alright‟ as opposed to nice. There is thus room for improvement, when it comes to
staff manning the registration desk
Hospital Well Equipped The private sector scores over the public sector in having access to the most modern equipment and
technology. They have imported X-ray machines, MRIs, CAT scan machines telemedicine etc. This is because
the private hospitals are victims of the import substitution policy that was practiced in the heyday of socialism.
The private hospitals are seen are superior in this regard
Suggestions & Conclusion
Empirical survey showed that the three dimensions of Empathy (Did the nurse come), Tangibles (Is the
Hospital Well Equipped) and Reliability (Rate your doctor) are key factors.
The main recommendation is to take care in the recruitment and training of nurses, on basis of their affection
towards people. Nurses, who are highly skilled, should be upgraded as Nurse Practioners and treated and paid
on par with doctors. This study shows how macro and micro factors affect the health care situation and identifies Empathy as a key
factor on which private hospitals score over public hospitals. Thus, the main hypothesis of the study, which is
that relationship management plays a vital role in the health care system, is validated.
IX. Detailed Recommendations 1. Since the study underlies the importance of the empathy factor, importance should be given to the
recruitment and training of nurses. Nurses are an essential part of the health care process and it is sad to
note that they have not got their due in the health care scenario in India. While they enjoy a high status
abroad, where as nurse practioners, their status rivals that of doctors, the situation is not the same in India.
Here, for many nursing is seen as a low paid, low status job and this needs to change.
2. More attention needs to be paid to the recruitment of nurses. Care should be taken to choose those with a
genuine affection for people and not just those who are in it for the money. Since nursing is a caring and
demanding profession, it requires professionals of the highest caliber.
3. The salaries paid to those belonging to the nursing profession, should become more comparable to that of
doctors. Presently nurses are paid peanuts and this attracts the lowest common denominator to the
profession.
4. Continuing education programme should be made available to the nurses. This will improve the quality and care; allow them to take decisions in times of medical emergency, and motivate them further.
5. The hospitals should continue to be equipped with modern equipment, since it is part of the draw of private
hospitals. Public hospitals should also equip themselves if they want to continue to attract customers.
6. Public private partnerships should be encouraged. Citizen charters should be set up to establish
accountability. Conflicts of interest (such as private doctors participating in the public sector) must be
discouraged. This will reduce corruption in this sector.
7. The reliability dimension should be addressed by hiring doctors who not only possess technical skills but
abundant affection for people. Doctors may be overworked because of paucity of medical staff in rural
areas and primary care. These issues need to be addressed by the government. This is addition to proper
consumer redressal mechanisms.
8. Since this is an exploratory study, more studies need to be conducted to further elucidate the concept of service quality. In particular, longitudinal studies that measure the stability of the concept over time as well
as the impact of various factors such as gender, education and age need to be taken up.
9. Last but not least, the results show the importance of ayahs and sweepers. These workers may be far down
the hierarchy but they play a crucial role in the functioning of the hospital. They not only do their duties but
run essential errands for the patients and keep the patients‟ company. They are an integral part of the
hospital‟s functioning.

A Study of Service Quality Management on Health Care Industry in Bangalore
www.iosrjournals.org 44 | Page
References:
Books: [1]. Kandampully, J. (1998), Service Quality to Service Loyalty: A Relationship Which Goes Beyond Customer Services, Total Quality
Management, Vol. 9, No. 6, pp. 431-443
[2]. Kurtz, D.L. and Clow, K.E. (1998), Service Marketing, John Wiley & Sons.
[3]. Malhotra, N.K. (2004), Marketing Research: An Applied Orientation, Pearson Prentice Hall.
[4]. Sekaran, U. (2003), Research Methods for Business: A Skill Building Approach, John Wiley &
Sons.www.ibef.org/industry/healthcare.aspx
Journals: [5]. Andaleep, S.S. (1998), Determinants of Customer Satisfaction with Hospitals: a Managerial Model, International Journal of Health
Care Quality Assurance, Vol. 11, No. 6, pp. 181-187.
[6]. Anderson, E.W., Fornell, C., and Lehmann, D.R. (1994), Customer Satisfaction, Market Share,and Profitability: Findings from
Sweden, Journal of Marketing, Vol. 58, pp. 53-66.
[7]. Bloemer, J., Ruyter, K., and Wetzels, M. (1999), Linking Perceived Service Quality and Service Loyalty: a Multi -dimensional
Perspective, European Journal of Marketing, Vol. 3 No. 11/12, pp. 1082-1106.
[8]. Caha H: Service Quality in Private Hospitals in Turkey. Journal of Economic and Social Research 2007, 9(1):55-69
[9]. Choi, K.S., Lee, H., Kim, C., and Lee, S. (2005), Service Quality Dimensions and Patient Satisfaction Relationships in South
Korean: Comparisons Across Gender, Age, and Types of Service, Journal of Services Marketing, Vol. 19, No. 3, pp. 140-149.
[10]. Dariul J. Messine, Denims J Scotti, Rodney Ganey & Genevieve Pinto, Joumal of health can Mangaement, May June 2009. The
relationship between patient satisfaction and inpatient admissions
[11]. Fornell, C. (1992), A National Customer Satisfaction Barometer: the Swedish Experience, Journal of Marketing, Vol. 56, p. 6-12.
[12]. GrÖnroos, C. (1984), A Service Quality Model and its Marketing Implications, European Journal of Marketing, Vol. 18, No.4, pp.
36-44.
[13]. GrÖnroos, C. (1990), Service Management and Marketing, Lexington Books, Lexington, MA Hasin, M.A.A., Seeluangsawat, R.,
and Shareef, M.A. (2001), Statistical Measures of Customer Satisfaction for Health Care Quality Assurance, International Journal
of Health Care Quality Assurance, Vol.14, No. 1, pp. 6-13.
[14]. Parasuraman, A, Berry, L.L., and Zeithaml, V.A. (1990), An Empirical Test of the Extended Gaps Model of Service Quality,
working Paper, No. 90-122, Marketing Science Institute, Cambridge, MA.
Websites [15]. www.ibef.org/industry/healthcare.aspx
[16]. healthcare in india. Boston analytics
[17]. www. Indian healthcare. In
[18]. www. irda india.org
[19]. www.technopak.com

IOSR Journal of Business and Management (IOSRJBM)
ISSN: 2278-487X Volume 1, Issue 5 (July-Aug. 2012), PP 45-48 www.iosrjournals.org
www.iosrjournals.org 45 | Page
Commercial Banks Financing Priority Sector: An Impetus to
Economy (A Study of Problems and Prospects)
Dr Kewal Kumar1 and Atul Gambhir
2
Principal1and Assistant Professor2,Institute of Management and Technology Kashipur, Uttarakhand, India.
Abstract: Priority sector lending is a scheme guided by govt. and RBI to commercial banks about obligatory
deployment of credit to preferred and desired sectors and sections of the economy. Preferred sectors and
sections are agriculture, small scale industries, small businessman, education, housing finance etc. and sections
of the society are below income persons. The object behind PSL (Priority Sector Lending) is equitable and
sustainable economic development at desired direction. To attain the said objectives, banks were nationalized in
India in1969. Since in this scheme banks were entrusted to fulfill some targets and sub-targets of deployment of
credit such as 40 per cent for domestic banks and 32 per cent for foreign banks was fixed for priority sector lending of their total advances. Though public sector banks have progressed remarkably and achieved their
targets, private sector banks are lagging behind in this respect.Now on invent of some new schemes like PSL
banks in India are shaping the economy and are providing an impetus to the economy. Despite various qualities
and goodness, the scheme is not free from problems. Author has made an attempt through this treatise to
highlight these problems and suggested some ideas for effective formation of the scheme. The over all future of
this scheme in India is bright but needs a regular review process.
Keywords: Credit deployment, Micro credit, Nationalization, Non-performing assets, vital sectors of the
economy, Weaker sections.
I. Introduction Priority means to give preference and privilege. The concept of priority sector lending (PSL) is mainly
intended to ensure that assistance from the banking system flows in an increasing manner to those persons and
sectors of the economy which, through accounting for a significant proportion of the national product, have not
received adequate support of the institutional finance in the past .Under the new banking policy, stress is laid on
the weaker and under privilege groups and vital sector as priority sectors.
1.1 Vital sectors of the economy getting priority under the scheme of PSL
Agriculture –both direct and indirect finance.
Small scale industries.
Small road and water transport operators.
Professional and self-employed persons.
Setting up of industrial estates.
Education.
Indirect finance to other priority sectors-loans on scheduled castes and scheduled tribes, corporations,
organizations.
Housing loans to scheduled castes and scheduled tribes (SC/ST) and weaker sections.
Consumption loans.
To boast the country export, export sector is treated as a quasi priority sector.
1.2 Weaker sections under PSL The concept of weaker sections refer to all persons who became suppressed, depressed, and oppressed
because of socio-political, socio-economic or socio-religious reasons. Weaker section include:
Small and marginal farmers with land holding of 5 acres and less.
Landless labourers.
Tenant farmers and share croppers.
Artisans, village and small industries.
Beneficiaries of the integrated rural development program(IRDP).
Scheduled castes and scheduled tribes.
Beneficiaries different rates of interest schemes.

Commercial Banks Financing Priority Sector: An Impetus To Economy (A Study Of Problems And
Prospects)
www.iosrjournals.org 46 | Page
1.3 Directives issued by RBI The RBI issued certain directives to the banks regarding priority sector lending.
Priority sector lending should constitute 40% aggregate bank credit.
Out of the priority sector advances, at least 40% should be provided to agriculture.
Direct advances to the weaker sections in agriculture and allied activities in rural sector should form at least 50% of the total direct lending to agriculture.
The advances to rural artisans, village craftsmen and cottage industries should be at least 12.5 % of the total
advances to the small scale industries.
II. Objectives Of The Study Our treatise is based on the following objectives
To present an overview on priority sector lending in India.
To review the present policy framework of priority sector lending.
To present a conceptual study of various programs and schemes under PSL.
To know the various problems and provide some suggestions to strengthen this system of lending and future
prospects of priority sector lending in India.
To provide an awareness to general public about priority sector lending and its benefits to the weaker
section.
III. Methodology And Research Design The nature of our study is perspective and analytical. The universe of this study is Indian banking
sector. To fulfill the above mention objectives, secondary data is used which is taken from the various reports
published by Reserve bank of India (RBI) , National bank for agricultural and rural development (NABARD),
Central statistical organization
, Economic survey of India and lead bank report. Data are classified and tabulated in such manner so that
analysis and interpretation can easily be attained.
IV. Various Credit Schemes Under Priority Sector
4.1 Differential Rates Of Interest Scheme (DRI)
This scheme was launched in India in 1972 for public sector banks to extend bank credit to the weaker
section at concessional rate of interest at 4% p.a. according to new guidelines issued by BBI, banks have to
deploy 1% of their total advances to the weaker section of society and further to set aside 40% of their advances
meant under DRI scheme for beneficiaries belong in to the scheduled castes and scheduled tribes. The eligibility
foe assistance under this scheme is now Rs.6400 annual family income in rural areas and Rs.7200 per annum
per family in urban areas. The private sector banks can also participate in this scheme on a voluntary basis.
Under the DRI scheme, the banks are directed by the Reserve bank to finance:
Scheduled castes and scheduled tribes and other engaged on the modest scale in agriculture and allied
activities.
The physically-handicapped people on the modest scale by offering loans for cottage and rural industries
and vocations like sewing garments, making reasonably cheap edibles, running way side tea stalls, basket-
making etc.
People engaged in elementary processing of forest products.
Village artisans in the decentralized sector.
4.2 Education Loans
Student loans in India (popularly known as Education loans) have become a popular method of funding
higher education in India with the cost of educational degrees going higher. The spread of self-financing
institutions (which has less to no funding from the government) for higher education in fields of engineering,
medical and management which has higher fees than their government aided counterparts have encouraged the
trend in India. Most large public sector and private sector banks offer educational loans.Under section 80(e) of
the Indian income tax act, a person can exempt the amount paid against the interest of the education loan - either
for self or for his/her spouse or children - for eight years from the year (s)he starts to repay the loan or for the
duration the loan is in effect, whichever is lesser. Education loan is becoming popular day by day because of
rising fee structure of higher education. It came into existence in 1995 started by SBI Bank and after that many
banks started offering student loans. At present, the model education loan scheme allows loan up to Rs 10 lakh
for students in India and up to Rs 20 lakh for the students studying abroad. For a loan up to Rs 4 lakh, co-obligation of parents is required and for loans above Rs 4 lakh and up to Rs 7.5 lakh, co-obligation of parents
together with collateral security in the form of suitable third party guarantee is required. In case of loans above
Rs 7.5 lakh, co-obligation of parents together with tangible collateral security of suitable value, along with the

Commercial Banks Financing Priority Sector: An Impetus To Economy (A Study Of Problems And
Prospects)
www.iosrjournals.org 47 | Page
assignment of future income of the student for payment of installments is necessary. The rate of interest for
loans up to Rs 4 lakh is BPLR and for loans above Rs 4 lakh, one per cent more than BPLR is charged by the
banks.
4.3 Housing Loans
Loans up to Rs. 15 lakh for construction of houses by individuals,(excluding loans granted by banks to
their own employees) and loans given for repairs to the damaged houses of individuals up to Rs.1 lakh in rural
and semi-urban areas and up to Rs.2 lakh in urban areas. Assistance up to Rs. 1.25 lakh per housing unit given
to any governmental agency/ nongovernmental agency (approved by the NHB for the purpose of refinance) for
construction/ reconstruction of houses or for slum clearance and rehabilitation of slum dwellers.
4.4 Micro Credit Provision of credit and other financial services and products of very small amounts not exceeding Rs. 50,000 per
borrower to the poor in rural, semi-urban and urban areas, either directly or through a group mechanism, for
enabling them to improve their living standards, will constitute micro credit.
4.5 Agriculture (Direct and Indirect Finance)
Direct finance to agriculture shall include short, medium and long term loans given for agriculture and
allied activities directly to individual farmers, Self-Help Groups (SHGs) or Joint Liability Groups (JLGs) of
individual farmers without limit and to others (such as corporate, partnership firms and institutions) up to Rs.20
lakh, for taking up agriculture/allied activities. Indirect finance to agriculture shall include loans given for
agriculture and allied activities.
4.6 Small Scale Industries (Direct and Indirect Finance)
Direct finance to small scale industries (SSI) shall include all loans given to SSI units which are
engaged in manufacture, processing or preservation of goods and whose investment in plant and machinery
(original cost) excluding land and building does not exceed the amounts specified in Section I, appended.
Indirect finance to SSI shall include finance to any person providing inputs to or marketing the output of
artisans, village and cottage industries, handlooms and to cooperatives of producers in this sector.
4.7 Small Business / Service Enterprises
shall include small business, retail trade, professional & self employed persons, small road & water transport
operators and other service enterprises as per the definition given in Section I and other enterprises that are
engaged in providing or rendering of services, and whose investment in equipment does not exceed the amount
specified in Section I, appended.
V. Targets/Sub-Targets Set By Rbi The targets and sub-targets set under priority sector lending for domestic and foreign banks operating
in India are furnished below
Source: Based on RBI’s report on trend and progress of banking in India.
ANBC: Adjusted net bank credit.
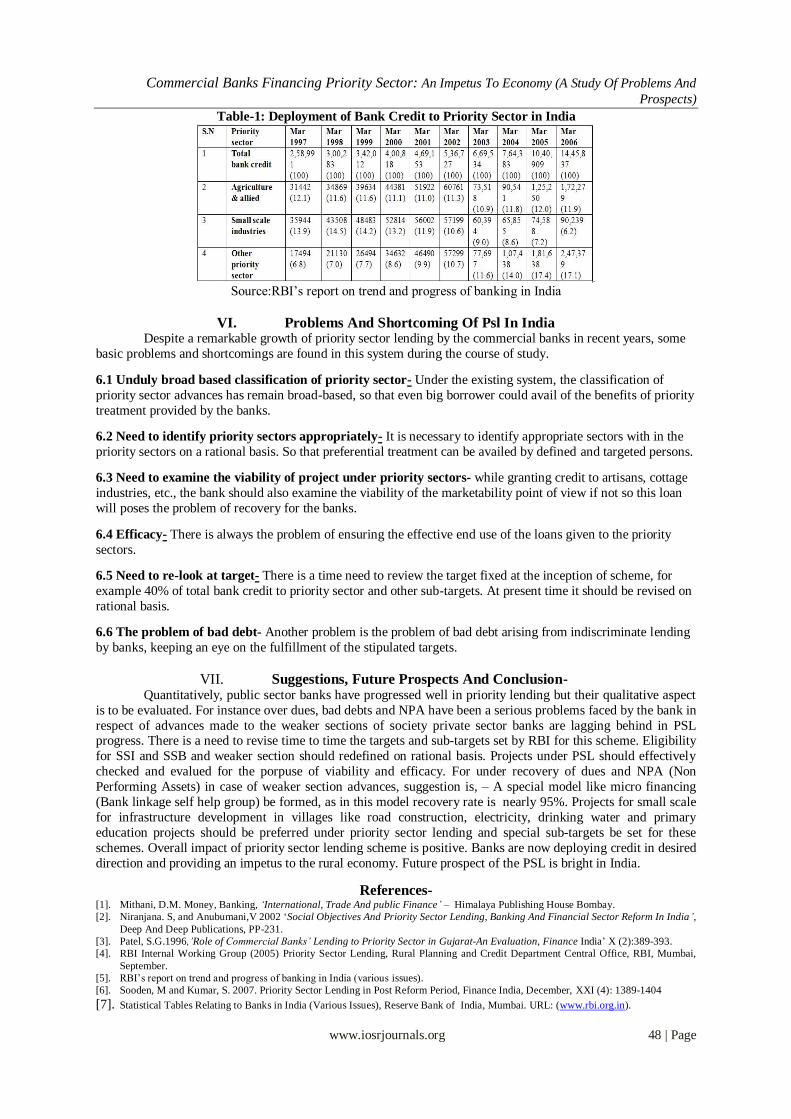
Commercial Banks Financing Priority Sector: An Impetus To Economy (A Study Of Problems And
Prospects)
www.iosrjournals.org 48 | Page
Table-1: Deployment of Bank Credit to Priority Sector in India
Source:RBI’s report on trend and progress of banking in India
VI. Problems And Shortcoming Of Psl In India Despite a remarkable growth of priority sector lending by the commercial banks in recent years, some
basic problems and shortcomings are found in this system during the course of study.
6.1 Unduly broad based classification of priority sector- Under the existing system, the classification of
priority sector advances has remain broad-based, so that even big borrower could avail of the benefits of priority
treatment provided by the banks.
6.2 Need to identify priority sectors appropriately- It is necessary to identify appropriate sectors with in the
priority sectors on a rational basis. So that preferential treatment can be availed by defined and targeted persons.
6.3 Need to examine the viability of project under priority sectors- while granting credit to artisans, cottage
industries, etc., the bank should also examine the viability of the marketability point of view if not so this loan
will poses the problem of recovery for the banks.
6.4 Efficacy- There is always the problem of ensuring the effective end use of the loans given to the priority
sectors.
6.5 Need to re-look at target- There is a time need to review the target fixed at the inception of scheme, for
example 40% of total bank credit to priority sector and other sub-targets. At present time it should be revised on
rational basis.
6.6 The problem of bad debt- Another problem is the problem of bad debt arising from indiscriminate lending
by banks, keeping an eye on the fulfillment of the stipulated targets.
VII. Suggestions, Future Prospects And Conclusion- Quantitatively, public sector banks have progressed well in priority lending but their qualitative aspect
is to be evaluated. For instance over dues, bad debts and NPA have been a serious problems faced by the bank in
respect of advances made to the weaker sections of society private sector banks are lagging behind in PSL progress. There is a need to revise time to time the targets and sub-targets set by RBI for this scheme. Eligibility
for SSI and SSB and weaker section should redefined on rational basis. Projects under PSL should effectively
checked and evalued for the porpuse of viability and efficacy. For under recovery of dues and NPA (Non
Performing Assets) in case of weaker section advances, suggestion is, – A special model like micro financing
(Bank linkage self help group) be formed, as in this model recovery rate is nearly 95%. Projects for small scale
for infrastructure development in villages like road construction, electricity, drinking water and primary
education projects should be preferred under priority sector lending and special sub-targets be set for these
schemes. Overall impact of priority sector lending scheme is positive. Banks are now deploying credit in desired
direction and providing an impetus to the rural economy. Future prospect of the PSL is bright in India.
References- [1]. Mithani, D.M. Money, Banking, ‘International, Trade And public Finance’ – Himalaya Publishing House Bombay.
[2]. Niranjana. S, and Anubumani,V 2002 ‘Social Objectives And Priority Sector Lending, Banking And Financial Sector Reform In India’,
Deep And Deep Publications, PP-231.
[3]. Patel, S.G.1996,’Role of Commercial Banks’ Lending to Priority Sector in Gujarat-An Evaluation, Finance India’ X (2):389-393.
[4]. RBI Internal Working Group (2005) Priority Sector Lending, Rural Planning and Credit Department Central Office, RBI, Mumbai,
September.
[5]. RBI’s report on trend and progress of banking in India (various issues).
[6]. Sooden, M and Kumar, S. 2007. Priority Sector Lending in Post Reform Period, Finance India, December, XXI (4): 1389-1404
[7]. Statistical Tables Relating to Banks in India (Various Issues), Reserve Bank of India, Mumbai. URL: (www.rbi.org.in).

IOSR Journal of Business and Management (IOSRJBM)
ISSN: 2278-487X Volume 1, Issue 5 (July-Aug. 2012), PP 49-53 www.iosrjournals.org
www.iosrjournals.org 49 | Page
Service Quality in Super Markets: A Study of Consumers Satisfaction
in Apparel Retailing
1Arun Kumar .G,
2Dr.S.J.Manjunath
3Anitha Thimmaiah
1Research scholar, BIMS, University of Mysore, Manasagangothri, Mysore-570006 India 2Associate professor, BIMS, University of Mysore,, Manasagangothri, Mysore-570006, India
3Associate Professor, Vidyavarthaka college, Mysore, India
Abstract: The purpose of the study is to determine the consumer satisfaction of service quality offered at supermarket in Mysore city. The data was collected from 200 respondents through structures questionnaire by
using five point likert scale and was analyzed using one sample t test and multiple regression. The five
dimensions such as tangibles, customer knowledge, responsiveness, convenience (dependent dimension) and
competence. The finding showed that the dimensions of service quality such as tangibles, customer knowledge,
convenience Competence were positively related to customer satisfaction. The management should focus on
competence dimensions to be ahead of the competitor
Keywords: service quality, customer satisfaction, apparel retailing, Mysore city
I. Introduction Customer satisfaction has received considerable attention in recent years. Apparel retailing in Mysore
is poised to reach its height with recent opening of supermarkets. Indian apparel retailing is the country‟s largest
opportunity for the organized retailing after food retailing. Branded apparel accounts for only 20 percent of the
total apparel market. Fashion consumers today are better informed, more sophisticated than they expect service
quality apart from the quality of merchandise purchased. The concept of customer satisfaction has relevance to
both single, discrete encounters and to relationship. A service quality can be the cornerstone to retailing success
retailers need to constantly evaluate their service quality through the use of a reliable scale. Retailing in India is gradually inching its way toward becoming the next boom industry. The whole concept of shopping has altered
in terms of format and consumer buying behavior, ushering in a revolution in shopping in India
II. Review of literature In service literature, service quality is usually defined based on consumers‟ assessment. Parasuraman et
al. (1985, p. 42) defined service quality as “a measure of how well the service level delivered matches customer
expectations; delivering quality service means confirming to customer expectations on a consistent basis”.
Parasuraman et al. (1988, p. 16) defined perceived service quality as “a global judgment, or attitude, relating to
the superiority of the service”. Zeithaml (1988, p. 3) defined service quality as “the consumer‟s judgment about a product‟s overall excellence or superiority”. It is clear that defining service quality is an important step toward
the development of a solid foundation for this study. Kotler and Armstrong (1996, p. G9) defined service quality
as "the totality of features and characteristics of a product or service that bear on its ability to satisfy stated or
implied needs". Therefore, being in line with the service literature, this study looks into service quality as the
standard of excellence toward fulfilling customers‟ requirements, which contributes toward achieving
customers‟ ultimate satisfaction. This, in turn, entails organisations and firms to investigate, explore, and
identify customers‟ requirements and to try to meet them in order to provide a high standard of service quality.
Service quality is an elusive concept and there is considerable debate in the literature about how best to
conceptualize this phenomenon. An all-embracing definition of service quality is notoriously difficult to
produce. Parasuraman. described it as: the ability of the organization to meet or exceed customer expectations.
Customer expectations may be defined as the “desires and wants of consumers” i.e. what they feel a service provider should offer rather than would offer. Bernardo Balboni (2011) in their article demonstrates the crucial
role of retail service quality as a key activator in the formation of customer loyalty to the store; the latter is
understood in a conative and action sense.. The results prove that customers consider retail service quality as a
second-order dimension and recognize the main contribution of physical aspects and reliability first-order
dimensions. The present study is the first to apply a specific RSQS scale to the Italian national context.
Moreover, it provides useful information on the relationship between service quality and loyalty in retailing.
Daniella Ryding(2011) suggested the relative importance of service quality across two grocery store formats.
Research to date, indicates that within the grocery sector, customers expect value for money in terms of product
quality, nutritional value and service quality. If these attributes are met in relation to the customers‟ perceived
risk, it is more likely that customer satisfaction and retention will occur. In difficult competitive, social and

Service Quality In Super Markets: A Study Of Consumers Satisfaction In Apparel Retailing
www.iosrjournals.org 50 | Page
economic circumstances, some sources indicate that there will be a trading down in customer shopping habits,
with more customers expecting higher levels of service provision across a wider range of store formats,
including the discounters. This study examines the relative importance of service quality for a quality-led
retailer, compared to a discounter.. Research findings demonstrate that despite the fact that consumer
expectations are rising in relation to the overall shopping experience, distinctions in relation to customers‟
expectations between the levels of service provided across quality-led stores, compared to discounters, is still evident.
Formal Models of Service Quality - There are a number of conceptual models that have been developed
by various researchers and scholars world-wide to investigate the service quality concept. At the same time,
these models have been aimed to be adopted by service organisations as a tool to assist in quality improvement
programs. In a literature review study, Seth et al. (2005) presented a list of key service quality models
including, for example, Technical-Functional Quality Model (Gronroos, 1984), Gap Model and SERVQUAL
Model (Parasuraman et al., 1985, 1988). These conceptual models along with other models have contributed to
the development of various schools of thought of service quality. Generally, in the current service marketing
literature there are three key schools of service quality modeling, namely the Nordic School, the Holistic School,
and the North American School (Gap Analysis School). Customer satisfaction is proposed to be the key
objective of both defensive and offensive marketing strategies aimed at retaining existing customers and gaining
new customers. Customer satisfaction has been described as one of the priorities of managers of service or product related organizations. Service oriented firms tend to focus on consumer satisfaction as a way to
differentiate themselves from their competitors with the delivery of high quality service. It has a positive impact
on consumers' attitudes toward products, services, firms, future choice behaviours, and other post-purchase
activities that are beneficial to the firm. Satisfaction results from specific exchange and consumption
transactions, and evolves into a more global evaluation across multiple transactions (Anderson eta).
III. Objective of the study The objective of the study is to determine whether the dimensions of service quality significantly affect
customer satisfaction in apparel retailing.
IV. Methodology The relevant data for the study has been collected from both primary and secondary sources. Research
methodologies used in the study are descriptive methods. Simple random sampling is used to collect the
information regression analysis was used in this research the data was collected through structured questionnaire
by using five point likert scale. A sample of 200 respondents was selected for the study.
V. Hypothesis 1) Ho-The tangibles have significant positive impact on customer satisfaction
2) Ho-The customer knowledge have significant positive relationship on customer satisfaction
3) Ho-The responsiveness have significant positive impact on customer satisfaction
4) Ho-The convenience have significant positive relationship on customer satisfaction
5) Ho-The competence have significant positive impact on customer satisfaction
VI. Data collection and analysis Independent variables
Tangibles – shop position, decoration, transaction method, product price
Customer knowledge- mutual understanding, product knowledge of employee, performing the right service at
the first time.
Competence- self confidence of employees, accurate delivery service, willing to help
Responsiveness- speed in solving problem, operating hours, speed in handling complaint, individual attention, courteous
Dependent variable– Convenience - Advertisement, Communication system, Employee behavior, product
availability, after sales service
1) Demographic
Analysis of demographic information revealed that 40 percent customers were young and aged between
19 years to 25 years and 46 percent of the respondents were males. Around 44percent of the sample respondents
had graduation and 62 percent were employed; out of the total sample 36 percent of the respondent‟s annual
income was in between 20000 to 25000;

Service Quality In Super Markets: A Study Of Consumers Satisfaction In Apparel Retailing
www.iosrjournals.org 51 | Page
2) One sample t –test Analysis
One-Sample Statistics
N Mean
Std.
Deviation Std. Error Mean
TANGIBLE 200 12.3850 1.47569 .10435
One-Sample Test
Test Value = 3
T df
Sig. (2-
tailed)
Mean
Differe
nce
95% Confidence Interval of the
Difference
Lower Upper
TANGIB
LE 89.940 199 .000
9.3850
0 9.1792 9.5908
Based on the results of the One sample t-test analysis at 95% confidence level, the Hypothesis H0 -
There are no significant effects of tangible on customer satisfaction at supermarket in Mysore is rejected, and
Ha - There are significant effects of tangible on customer satisfaction at supermarket in Mysore is not rejected
since one sample t-test successfully revealed a statistically significant values for policy factors. Mean values
fall in positive side of rating (less than 3), tcal value > ttab value and p-value < α = 0.05 for all the select policy
factors under study
One-Sample Statistics
N Mean Std. Deviation Std. Error Mean
CUSTOMER
KNOWLEDGE 200 10.8200 1.53930 .10885
Based on the results of the One sample t-test analysis at 95% confidence level, the Hypothesis H0 -
ere are no significant effects of customer knowledge on customer satisfaction at supermarket in Mysore is
rejected, and Ha - There are significant effects of customer knowledge on customer satisfaction at
supermarket in Mysore is not rejected since one sample t-test successfully revealed a statistically significant
values for policy factors. Mean values fall in positive side of rating (less than 3), tcal value > ttab value and p-
value < α = 0.05 for all the select policy factors under study
One-Sample Statistics
N Mean Std. Deviation Std. Error Mean
COMPETEN
CE 200 8.4050 1.48052 .10469
One-Sample Test
Test Value = 0
t Df
Sig. (2-
tailed)
Mean
Differenc
e
95% Confidence Interval of
the Difference
Lower Upper
COMPETEN
CE 80.286 199 .000 8.40500 8.1986 8.6114

Service Quality In Super Markets: A Study Of Consumers Satisfaction In Apparel Retailing
www.iosrjournals.org 52 | Page
Based on the results of the One sample t-test analysis at 95% confidence level, the Hypothesis H0 -
There is no significant influence of competence on customer satisfaction at supermarket in Mysore is rejected,
and Ha - There is a significant influence of competence on customer satisfaction at supermarket in Mysore is
not rejected since one sample t-test successfully revealed a statistically significant values for physical aspects.
Mean values fall in positive side of rating (less than 3), tcal value > ttab value and p-value < α = 0.05 for all the
select physical aspects under study
One-Sample Statistics
N Mean Std. Deviation Std. Error Mean
RESPONSI
VENESS 200
14.96
00 1.79570 .12697
Based on the results of the One sample t-test analysis at 95% confidence level, the Hypothesis H0 -
There is no significant influence of responsiveness on customer satisfaction at supermarket in Mysore is
rejected, and Ha - There is a significant influence of responsiveness on customer satisfaction at supermarket in
Mysore is not rejected since one sample t-test successfully revealed a statistically significant values for
physical aspects. Mean values fall in positive side of RSQS rating (less than 3), tcal value > ttab value and p-
value < α = 0.05 for all the select physical aspects under study
One-Sample Statistics
N Mean Std. Deviation Std. Error Mean
CONVENIENCE
(DEPENDENT) 200 14.9950 2.21120 .15636
Based on the results of the One sample t-test analysis at 95% confidence level, the Hypothesis H0 -
There is no significant influence of convenience on customer satisfaction at supermarket in Mysore is rejected,
and Ha - There is a significant influence of convenience on customer satisfaction at supermarket in Mysore is
not rejected since one sample t-test successfully revealed a statistically significant values for physical aspects.
Mean values fall in positive side of RSQS rating (less than 3), tcal value > ttab value and p-value < α = 0.05 for
all the select physical aspects under study
VII. Regression Analysis

Service Quality In Super Markets: A Study Of Consumers Satisfaction In Apparel Retailing
www.iosrjournals.org 53 | Page
The above results indicate that p value is .000 hence the regression model was fit. The R square is .221
it implies that there is 22% variance by service quality factor on customer satisfaction. The adjusted R square
shows the amount of variance explained by independent variable on dependent variable. From the coefficient
table it was revealed that tangible of supermarket is (β-.164 and significance p-.013).Hence there is a
significance difference between tangible and customer satisfaction. In terms of customer knowledge the β value
is .195 and the p value is .004 it shows that customer knowledge also positively influence overall satisfaction of
supermarket. The next dimension was competence the β value was .307 and the p value was .000 it shows that
the competence aspect also have positive influence and overall satisfaction of retail stores. Tangible, customer
knowledge, competence have a significant impact on overall satisfaction of supermarket therefore we reject null hypothesis of all the three dimensions. Responsiveness does not have significant relationship with the overall
satisfaction of retail store.
VIII. Conclusions The measurement of service quality has become a significant marketing tool for retail stores that wish
to develop a competitive advantage by learning about their customers„consumption experiences validating the implementation of the ‚retail service quality and by providing empirical evidence of how retail service quality
dimensions leads to customer satisfaction in this setting. The result showed that all the four dimensions have the
significance effect on the customer satisfaction and the alternative hypothesis was not rejected. The study was
designed to know that the dimensions of service quality that have significant effect on customer satisfaction.
The study revealed that the management needs to improve service quality in areas of responsiveness.
Improvement in customer satisfaction would mean that it is gaining competitive advantage.
Bibliography [1]. Boulding, W., Kalra, A., Staelin, R. & Zeithaml, V.A. (1993). A Dynamic Process Model of Service Quality: From Expectations to
Behavioural Intentions. Journal of Marketing Research, Vol. 30, 7-27.
[2]. Berry, L.L. (1986). Retail Business are Service Businesses. Journal of Retailing, 62 (Spring), 3-6.
[3]. Bloemer, J., Ruyter, Ko de & Wetzels, M. (1999). Linking Perceived Service Quality and Service Loyalty: A Multi -Dimensional
Perspective. European Journal of Marketing, 33(11/12), 1082-1106.
[4]. Cottrell, J. (1973). An Environmental Model of Performance Measurement in a Chain of Supermarkets. Journal of Retailing, 49(3),
51-63.
[5]. Cronin, J.J. & Taylor, S.A. (1992). Measuring Service Quality: A Reexamination and Extension. Journal of Marketing, 56(July),
55-68
[6]. Finn, D.W. & Lamb, C.W. (1991). An Evaluation of the SERVQUAL Scales in a Retail Setting. In R.H. Holman & M.R. Solomon
(Eds.), Advances in Consumer Research (Vol. 18). Provo: Association for Consumer Research.
[7]. Gummesson, E. (1991). Service Quality: A Holistic View. In S.W. Brown, E. Gummesson, B. Edvardsson & B. Gustavsson (Eds.),
Service Quality: Multidisciplinary and Multinational Perspectives (pp. 3-22).
[8]. Kawaharha, Y. & Speece, M. (1994). Strategies of Japanese Supermarkets in Hong Kong. International Journal of Retail and
Distribution Management, 22(8), 3-12.
[9]. Lewis, P. M. & Thomas, H. (1990). The Linkage Between Strategy, Strategic Groups, and Performance in the U.K. Retail Grocery
Industry. Strategic Management Journal, 11, 385-397
[10]. Parasuraman, A., Zeithaml, V. & Berry, L.L. (1985). A Conceptual Model of Service Quality and Its Implications for Future
Research. Journal of Marketing, 49 (Autumn), 41-50.
[11]. Parasuraman, A., Zeithaml, V.A. & Berry, L. (1988). SERVQUAL: A Multiple Scale for Measuring Consumer Perceptions of
Service Quality, Journal of Retailing, 64 (Spring), 12-40.