Embed Size (px)
Citation preview

Bank of Ireland A strengthened platform for sustainable growth
May 2010
2008 2009 2010 2011
SUPPORT STABILITY STRENGTH

2
Important notice
Information contained herein has not been independently verified and no representation or warranty is made as to the fairness, accuracy or correctness of such information or the opinions expressed herein. This document does not constitute or form part of an offer to sell or issue, or the solicitation to purchase or subscribe for, securities of Bank of Ireland (“Securities”) in the United States (“U.S.”) or any other jurisdiction or an inducement to enter into investment activity. No part of this document should form the basis of any commitment or investment decision whatsoever. The presentation contains certain “forward-looking statements” regarding the belief or current expectations of Bank of Ireland, its directors and other members of its senior management about, among other things, the Bank’s financial condition, results, operations and business. Such forward-looking statements are not guarantees of future performance. No Securities have been, nor will be, registered under the U.S. Securities Act of 1933 ("Securities Act"). Securities may not be offered or sold in the U.S. absent registration or an applicable exemption from the registration requirements of the Securities Act. There will be no public offer of the Securities in the U.S.

Contents
1. Bank of Ireland overview
2. Strengthened platform for sustainable growthi. Core loan portfolio defined
ii. Sustainable funding strategy
iii. Robust capital position
3. Conclusion
4. Appendicesi. Group financial highlights – Dec 2009
ii. Group loan book and asset quality
iii. Group funding position

Bank of Ireland Group overviewA diversified financial services group established in 1783
Strategic bias towards Ireland and our international businesses where we have clear competitive strengths and capabilities
Bank of Ireland – a systemically important bank playing a critical role in the operation of the Irish economy
– Leading position in Ireland – no. 1 or no. 2 in all our principal product and market segments*
“Bank of Ireland is the first of our financial institutions to emerge from the banking crisis”
Brian Lenihan, Irish Minister for Finance, 26 April 2010
*Note: latest data available

5
NAMA • Expected loss on disposal of total assets to NAMA within existing guidance• Tranche 1 transferred
Non-NAMA loan impairment
Re-affirmed September 2009 guidance of €4.7bn for non-NAMA loans for the 3 years to 31 March 2011
Financial Regulator
Completion of Financial Regulator’s Prudential Capital Assessment Review (PCAR) of Bank of Ireland’s capital requirement
Pension Scheme
Completed pension scheme review – solution in progress to eliminate IAS 19 pension deficit
EU Visibility on EU Restructuring Plan
Economy Signs of economic stabilisation
Strategy Business, funding and liquidity strategies in place
Delivering Group stability Key issues clarified

Capital raise announcement A market-based solution to Bank of Ireland’s capital needs
6
Capital Raise* €2.8bn
Warrantbuy-back** €0.49bn
Capitalraising costs c.€0.13bn
Total: €3.4bn
Proposals to raise €3.4bn equity capital – Firm Placing to Private Investors of €0.5bn
– Firm Placing to State of €1bn
– Rights Issue of up to €1.9bn fully underwritten• Potentially reduced through equity generation and profit
impact of Debt for Equity swap
Government ownership of up to 36%, facilitated by warrant buy-back
Proposals
– Generate pro-forma equity tier 1 ratio 8% at 31 Dec 2009
– Ensure expected minimum 7% equity tier 1 ratio at cyclical low post asset transfers to NAMA
– Meets severe Financial Regulator stress test
– Create a better quality capital structure
– Provide a strong capital foundation to support the Group’s future growth
– Progress prudent disengagement from State Guarantees
*Note: Includes €2.7bn required by Financial Regulator ; **Note: Based on a pre announcement closing share price of €1.80 on 23 April 2010.

Trading update
72008 2009 2010 2011
SUPPORT STABILITY STRENGTH
Some signs of stabilisation – albeit trading conditions remain challenging
As anticipated some downward pressure on net interest margin
Ongoing strong cost discipline continues to deliver cost savings
Loan impairment as expected – re-affirm previous guidance on non NAMA loans
– Loan impairment charges expected to remain within guidance of €4.7bn in 3 years to 31 Mar 2011
– Loan impairment charges expected to have peaked in 2009; expect to progressively reduce in each of 2010, 2011 and 2012
Customer loans broadly unchanged; Customer deposits marginally lower Mar 2010 over Dec 2009
Raised €4.5bn of wholesale funding in 3 months to 31 Mar 2010 – continue to extend maturity in support of strategy to disengage prudently from Government Guarantees
– At 31 Mar 2010, 37% of wholesale funding with maturity of one year or greater (32% Dec 2009)
Contents
1. Bank of Ireland overview
2. Strengthened platform for sustainable growthi. Core loan portfolio defined
ii. Sustainable funding strategy
iii. Robust capital position
3. Conclusion
4. Appendicesi. Group financial highlights – Dec 2009
ii. Group loan book and asset quality
iii. Group funding position

Financial targets – 2013
9
Measure 31 Dec 2009 2013 Target
Net interest margin 1.59%annualised
In excess of 1.75%
Cost / income ratio 56% < 50%
Impairment charge* €4,055m Normalised****
Equity Tier 1 capital 5.8%** > 7%
Group loan / deposit ratio 152% <125%
Return on equity*** Negative Low teens to mid teens %
*Note: Impairment charge on loans and advances to customers **Note: Pro forma at 31 Dec 2009 reflecting debt for debt exchange in Feb 2010***Note: ROE excluding 2009 Preference Stock****Note: Expected that impairment charges on non-NAMA loans peaked in 2009 and to reduce progressively in 2010, 2011 and 2012

Define and focus on core portfolio Core loan portfolio defined
Group loan portfolio
10
45% / €61bn Residential mortgages
25% / €34bn Non property corporate and
SME
27% / €36bn Property and construction
Group loans €135bn 31 Dec 2009
Core loan portfolio
Run-off / for sale portfolio**
€82bn at 31 Dec 2009
Expected to grow at c. 6%* p.a. to end 2013
Substantially funded by customer deposits
€48bn to €53bn at 31 Dec 2009
Run-off for value to continue into medium term
Largely funded by wholesale funding
29% / €24bn Residential mortgages
37% / €30bn Non property corporate and
SME
29% / €24bn Property and construction
€30bn UK broker
distributed Residential mortgages
€4bn Intl. Corporate Banking Assets
Run-off€34bn loans
€12bn NAMA Loans
€2bn – €7bn Irish broker mortgage
loans (ICS)
For sale€14bn – €19bn loans
3% / €4bn Consumer
5% / €4bn Consumer
*Note: Compound annual growth rate; **Note: Reflects measures announced with regard to the implementation of the EU Restructuring Plan
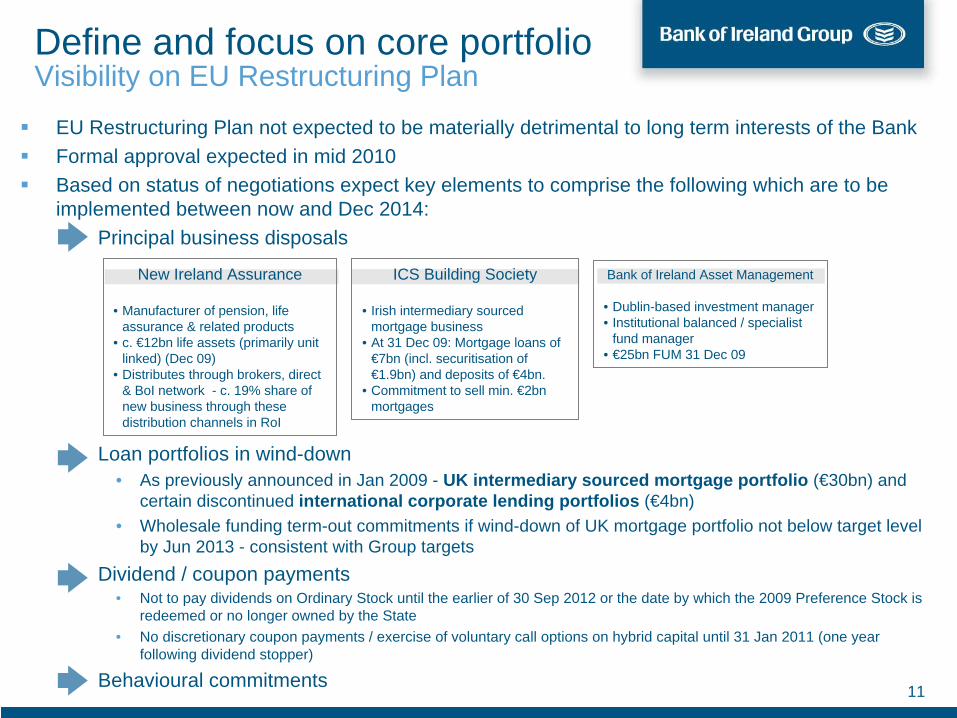
EU Restructuring Plan not expected to be materially detrimental to long term interests of the BankFormal approval expected in mid 2010Based on status of negotiations expect key elements to comprise the following which are to be implemented between now and Dec 2014:
– Principal business disposals
– Loan portfolios in wind-down• As previously announced in Jan 2009 - UK intermediary sourced mortgage portfolio (€30bn) and
certain discontinued international corporate lending portfolios (€4bn)• Wholesale funding term-out commitments if wind-down of UK mortgage portfolio not below target level
by Jun 2013 - consistent with Group targets– Dividend / coupon payments
• Not to pay dividends on Ordinary Stock until the earlier of 30 Sep 2012 or the date by which the 2009 Preference Stock is redeemed or no longer owned by the State
• No discretionary coupon payments / exercise of voluntary call options on hybrid capital until 31 Jan 2011 (one year following dividend stopper)
– Behavioural commitments
New Ireland Assurance
• Manufacturer of pension, life assurance & related products
• c. €12bn life assets (primarily unit linked) (Dec 09)
• Distributes through brokers, direct & BoI network - c. 19% share of new business through these distribution channels in RoI
Bank of Ireland Asset Management
• Dublin-based investment manager• Institutional balanced / specialist
fund manager• €25bn FUM 31 Dec 09
ICS Building Society
• Irish intermediary sourced mortgage business
• At 31 Dec 09: Mortgage loans of €7bn (incl. securitisation of €1.9bn) and deposits of €4bn.
• Commitment to sell min. €2bn mortgages
Define and focus on core portfolio Visibility on EU Restructuring Plan
11

UK Financial Services (Retail UK)
Maximise opportunity in retail and commercial banking activities through branch network in Northern Ireland
Continue to develop consumer banking franchise – partnership with UK Post Office
Further develop our Business Banking activities across 8 sales hubs in Great Britain
CapitalMarkets
(Ireland, UK and International)
Corporate banking and customer driven treasury management activities in Ireland, the UK and in selected niche segments internationally
Securities Services (fund administration) and Corporate Finance
Define and focus on core portfolio Business strategy
Focus capital and resources to core businesses where we have
– competitive strengths and capabilities
– strong positions
– in markets with attractive growth opportunities
Funding of core portfolios largely by customer deposits
Future growth largely supported by ability to attract customer deposits
12
RetailIreland
#1 retail bank
Leading market positions – #1 or 2 across principal product segments
Extensive distribution capability
Committed to continued improvement of customer service

Improve margin Margin expansion key management priority
Target Group net interest margin in excess of 1.75% in 2013Re-align asset and liability pricing
– Re-pricing new business reflecting changing environment
– Improved market liquidity to enable deposit re-pricing
– Back-book re-pricing of consumer, mortgage, business and corporate banking loans
– Interest rate increases will impact positively
Short term negative due to term-out of wholesale funding in preparation for prudent disengagement from Government GuaranteesMaximise asset re-pricing in run-off portfolio
Drivers of net interest margin movement
2010 - 2013
Higher new lending and deposit margins
Higher new business volumes
Back-book re-pricing
Higher official interest rates
Higher funding costs Short term
13

Manage credit risk effectively
Extensive internal review of impairment charge estimates undertaken in Jan / Feb 2010
Outcome validated by Oliver Wyman through independent review andchallenge
Re-affirmed guidance - impairment charges of €4.7bn for the 3 year period to 31 Mar 2011 for the non-NAMA element of the loan book – of which €2.7bn taken to 31 Dec 2009
Impairment charge on non-NAMA loans expected to have peaked in 2009 – progressive reductions expected in 2010, 2011 and 2012
142008 2009 2010 2011
SUPPORT STABILITY STRENGTH

National Asset Management AgencyEligible Bank Assets classified as “loans held for sale to NAMA” of c.€12.2bn (gross)
– Phased transfer in 2010– Performing and non-performing loans– 70% land and development, 30% associated loans– €2.8bn impairment provisions at 31 Dec 2009
€1.9bn first tranche transferred in early Apr 2010– €0.9bn land and development and €1.0bn associated loans– Consideration €1.2bn
Loss on disposal on first tranche may not be representative of impact of total disposals to NAMA
– Though applying similar level of discount would result in gross loss of €4.4bn - within previous guidance
Loss on sale of assets to NAMA function of quantum, mix and discount applied - actual loss only known after transfer of final loansRetained Property and construction loans by the Group (post NAMA):
– €2.8bn land and development loans– €20.8bn investment loans
15
Delivering Group Stability Continuing progress on key priorities
Profile of loans held for sale to NAMA31 Dec 2009
RoI€bn
UK€bn
RoW€bn
Total€bn
Land 3.1 1.0 - 4.1
Development 2.3 2.0 0.1 4.4
Associated(mainly investment property)
2.3 1.2 0.2 3.7
Total 7.7 4.2 0.3 12.2

Pursue sustainable funding strategy Funding strategy
Revert to traditional banking model – Fund core portfolios substantially through
deposits– Asset growth largely supported by ability
to attract deposits‘Run-off’ portfolios largely funded through wholesale funding Disengage from Government Guarantee in prudent and safe manner
– Drive deposit growth – Extend maturity profile of wholesale
funding – Maintain significant pool of contingent
liquidity collateralTarget:
– Group loan to deposit ratio of <125% in 2013
Conservative funding profile
16
Core Portfolio
‘Run-off’ Portfolio
Core portfolio – €82bn Substantially funded by customer deposits
‘Run-off ‘portfolio of €53bnLargely funded by wholesale funding
31 Dec 2009

Pursue sustainable funding strategy Funding position
Growing deposits
Reducing wholesale funding
Issued €14bn term funding Jan 2009 to Mar 2010
Robust, efficient and flexible buffer of contingent liquid assets
– €42bn of liquidity potential at Dec 2009
– Net Monetary Authority drawings €8bn Dec 2009 (€17bn Mar 2009)
Funding metrics Mar2009
Dec2009
Customer deposits €83bn €85bn
Group Loans (incl. NAMA Assets) / deposits ratio
161% 152%
Group Loans (excl. NAMA Assets) / deposits ratio
- 141%
Core portfolio loans / deposits ratio * - 101%
Wholesale funding €74bn €61bn
Term funding (wholesale funding with a maturity of 1 year or greater)
€20bn €20bn
Term funding as a % of overall wholesale funding
27% 32%
17* Core loan portfolio excludes loan portfolios placed in run-off of €34bn and loans for sale of up to €19bn
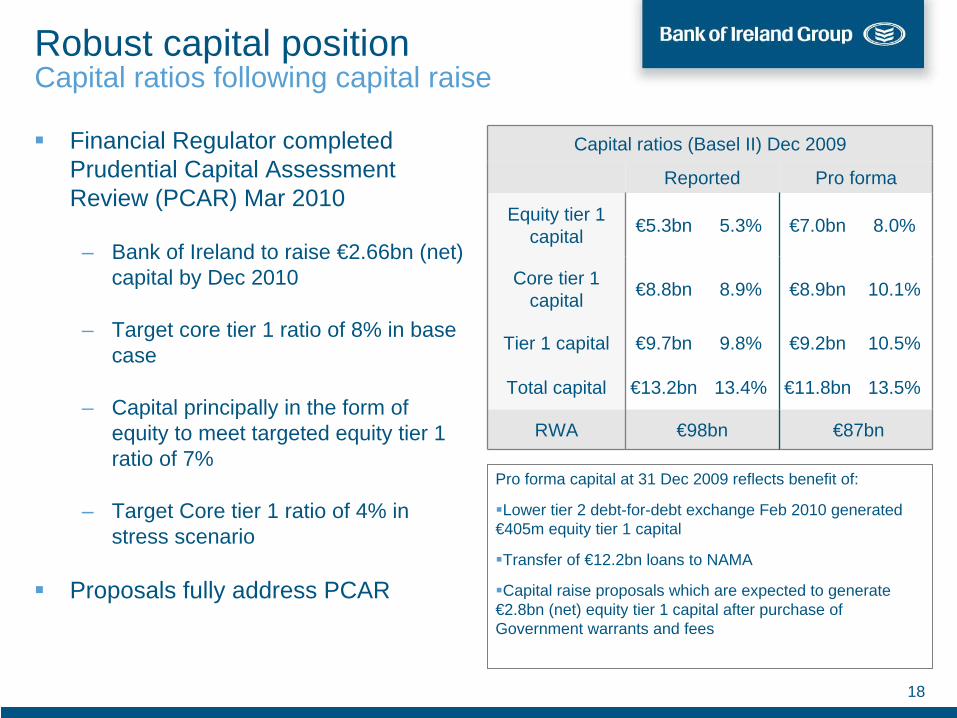
Robust capital position Capital ratios following capital raise
Financial Regulator completed Prudential Capital Assessment Review (PCAR) Mar 2010
– Bank of Ireland to raise €2.66bn (net) capital by Dec 2010
– Target core tier 1 ratio of 8% in base case
– Capital principally in the form of equity to meet targeted equity tier 1 ratio of 7%
– Target Core tier 1 ratio of 4% in stress scenario
Proposals fully address PCAR
Pro forma capital at 31 Dec 2009 reflects benefit of:
Lower tier 2 debt-for-debt exchange Feb 2010 generated €405m equity tier 1 capital
Transfer of €12.2bn loans to NAMA
Capital raise proposals which are expected to generate €2.8bn (net) equity tier 1 capital after purchase of Government warrants and fees
18
Capital ratios (Basel II) Dec 2009
Reported Pro forma
Equity tier 1 capital €5.3bn 5.3% €7.0bn 8.0%
Core tier 1 capital €8.8bn 8.9% €8.9bn 10.1%
Tier 1 capital €9.7bn 9.8% €9.2bn 10.5%
Total capital €13.2bn 13.4% €11.8bn 13.5%
RWA €98bn €87bn

Contents
1. Bank of Ireland overview
2. Strengthened platform for sustainable growthi. Core loan portfolio defined
ii. Sustainable funding strategy
iii. Robust capital position
3. Conclusion
4. Appendicesi. Group financial highlights – Dec 2009
ii. Group loan book and asset quality
iii. Group funding position

Conclusion
Irish economy – path to recovery identified
Bank of Ireland – a systemically important bank with a strengthened platform for sustainable growth
– Progress and clarity on key issues
– Core portfolios / businesses identified
– Progressive reduction in non-NAMA impairment charges 2010-2012
– Sustainable funding strategy
• Cornerstone of funding strategy to disengage from Government Guarantees in a prudent manner
– Robust capital position to support future growth

Contents
1. Bank of Ireland overview
2. Strengthened platform for sustainable growthi. Core loan portfolio defined
ii. Sustainable funding strategy
iii. Robust capital position
3. Conclusion
4. Appendicesi. Group financial highlights – Dec 2009
ii. Group loan book and asset quality
iii. Group funding position

22
Financial highlights – Dec 2009
9 Months to Dec 2008 Dec 2009
Profit / (loss) before tax €372m (€1,813m)
Underlying*PBT/(LBT) €595m (€2,972m)
EPS 32.7c (168.6c)
Underlying EPS 20.0c (268.7c)
9 Months to Dec 2008 Dec 2009Total income €2,998m €2,437mOperating expenses (€1,545m) (€1,381m)Net interest margin annualised 1.73% 1.59%
Operating Profit before impairment on financial assets
€1,453m €1,050m
Impairment charge on financial assets
€823m €4,057m
Mar 09 Sep 09 Dec 09**
RWAs (€bn) 105 101 98
Equity tier ratio 1 6.2% 6.6% 5.3%
Core tier ratio 1 9.5% 10.1% 8.9%
Tier 1 ratio 12.0% 11.0% 9.8%
Total capital ratio 15.2% 14.5% 13.4%
Mar 09 Sep 09 Dec 09
Loans (incl NAMA assets) / deposits 161% 152% 152%
Loans (excl NAMA assets) / deposits - - 141%
Term Funding (funding with a maturity of 1 year or greater) as a % of total wholesale funding
27% 33% 32%
* Note: Underlying excluding non-core items; ** Note: Slide 18 shows pro forma capital ratios reflecting the impact of Feb 2010 debt for debt exchange, transfer of €12.2bn loans to NAMA and capital raise proposals
Capital
Income Statement* highlights
Funding
Group Profitability

Profile of total loans* - €135bn at Dec 2009
Group loan book*Group loan book €135bn at 31 Dec 2009
Significant Residential mortgage book -€29bn in RoI and €32bn in the UK
€24bn or 18% of Group loan book in retained Property and construction loans - €9bn in RoI, €13bn in the UK with €2bn RoW
c.€12.2bn loans held for sale to NAMA
Loans to Non-property corporate and SME sectors is 25% of the loan portfolio - €15.3bn in RoI, €9.8bn in the UK with €9.2bn in RoW
3% of loan book is Consumer loans which includes credit cards, personal loans and motors loans - €2.9bn is in RoI and €1.4bn in the UK
23
Residential mortgages 45% / €61bn
Property and construction 18% / €24bn
Non propertycorporate and SME
25% / €34bn
RoI - 2%UK - 1%
RoI - 21%UK - 24%
RoI - 11%UK - 7%
RoW - 7%
RoI - 7%UK - 10%RoW - 1%
Consumer3% / €4bn
* Note: Before balance sheet impairment provisions of €5.8bn at 31 Dec 2009
% of Group Loan Book
Loans held for sale to NAMA c.9% /
c.€12bn
RoI - 6%UK / RoW - 3%

Impairment charge by portfolio
Total LoansImpairment charge on loans and advances
to customers by portfolio
At Dec 09 9 mths to Dec 08 12 mths to Mar 09 9 mths to Dec 09
€bn €m bps(annualised) €m bps
(annualised) €m bps(annualised)
Residential mortgages
- Republic of Ireland- UK
€61bn
€29bn€32bn
€60m
€24m€36m
13bps
12bps14bps
€127m
€60m€67m
20bps
23bps20bps
€237m
€165m€72m
52bps
79bps30bps
Non property corporate and SME €34bn €108m 41bps €344m 94bps €659m 250bps
Property and construction
- Investment-Land and development
€36bn
€25bn€11bn
€449m
€70m€379m
165bps
40bps394bps
€766m
€143m€623m
211bps
61bps493bps
€2,993m
€437m€2,556m
1,125bps
249bps2,831bps
Consumer €4bn €130m 244bps €198m 308bps €166m 421bps
Total €135bn* €747m** 72bps €1,435m** 102bps €4,055m** 396bps
*Note: Before balance sheet impairment provisions of €5.8bn at Dec 09**Note: Excludes impairment charge on other financial assets of €2m in 9 months to Dec 09 (€76m in 9 months to Dec 08; €78m in 12 months to Mar 2009) 24
Of the €4,055 million impairment charge in the 9 months to Dec 09• €2.2 billion relates to loans held for sale to NAMA
• €1.8 billion relates to Bank of Ireland retained portfolio

UK Residential mortgages - £29bn / €32bn Dec 2009
UK mortgages 53% of total Group mortgages (24% of Group loans and advances to customers)Bank of Ireland has c.262,000 residential mortgages in the UK
Modest decline in book:– end Sept 09 to Dec 09: (0.9)%– end Jun 09 to Sept 09: (0.4)% – end Mar 09 to Jun 09: 0.0%– end Dec 08 to Mar 09: 0.0%– end Mar 08 to Dec 08: 7.3%
Strategic decision to de-leverage Group balance sheet - withdrawal from UK intermediary sourced mortgage business (Jan 09) House prices up 5.9% in 12 mths to Dec 2009; down 12.9% from peak in Oct 2007 to Dec 2009 (Nationwide)Asset quality:
– Impairment charge • Annualised 9 mth impairment charge to 31 Dec 09 – 30bps• Annualised 9 mth impairment charge to 31Dec 08 – 14bps
– Negative equity• 30k (11.6%) mortgages in negative equity (Mar 09: 56k or 21%,
Sept 09: 37k or 14%) – quantum of net negative equity £260m (Mar 09: £685m, Sept 09: £344m)
– Possessions
• 305 properties in possession or 0.12% of mortgages at 31 Dec 09 336 properties or 0.13% of mortgages in possession at 30 Sep 09 388 or 0.15% of mortgages in possession at 31 Mar 09
• 570 new possessions in 9 mths to 31 Dec 09 163 in 3 mths to 31 Dec 09222 in 3 mths to 30 Sept 09185 in 3 mths to 30 Jun 09
25
Book - segment split
Arrears – greater than 3 mths in arrears*Dec 08 Mar 09 Sept 09 Dec 09
Book - BoI 118bps 148bps 161bps 171bpsCML 188bps 241bps 240bps 238bpsBuy to let - BoI 140bps 173bps 177bps 185bpsCML 231bps 306bps 219bps 200bpsSelf Cert - BoI 263bps 366bps 410bps 454bpsStandard- BoI 66bps 80bps 93bps 97bps
*Note: Cases > 3 months excluding possessions
Asset quality - arrears
Standard47%
BTL37%
Self-cert16%

Irish Residential mortgages - €29bn Dec 2009
Irish mortgages 47% of total Group mortgages (21% of total Group loans and advances to customers)Bank of Ireland has c.199,000 residential mortgage accounts in IrelandBook growth:
– end Sept 09 to Dec 09:0.4%– end Jun 09 to Sept 09: 0.7% – end Mar 09 to Jun 09: 0.3%– end Dec 08 to Mar 09: 0.3%
New business product split:– 9 mths to 31 Dec 09:
• FTB 36%; BTL 8%; Trade up/down 26%; Equity release/switch 30%– 9 mths to 31 Dec 08:
• FTB 24%; BTL 25%; Trade up/down 24%; Equity release/switch 27%House prices fell 18.5% in 12 mths to Dec 2009; down 31.5% from peak in February 2007 to Dec 2009 (PTSB) - official statistics trailing actual marketAsset quality
– Arrears – 3 months or more past due*• Book 346bps Dec 2009 (297bps Sept 09; 192bps Mar 09)
– Impairment charge • Annualised 9 mth impairment charge to 31 Dec 09 - 79bps• Annualised 9 mth impairment charge to 31 Dec 08 – 12bps
– Negative equity• 43k (21.5%) of mortgages in negative equity (Mar 09: 12k or 6% ,Sept 09: 21k
or 10%) – quantum of net negative equity €1.4bn (Sept 09 €731m; Mar 09 €355m)
– Possessions:• 28 properties in possession at 31 Dec 09 (14 at 30 Sep 2009; 6 at 31 Mar 09)• 27 new possessions in 9 mths to 31 Dec 09 (16 in 3 mths to 31 Dec 09; 9 in 3
mths to 30 Sept 09; 2 in 3 mths to 30 Jun 09)
26
Equity releaseand switchers
FTB
Trading up/down
BTL
28%
28%
23%
21%
Book - segment split
* Based on value of mortgages in arrears

Property and construction loans - €35.5bn Dec 2009*
Geographic and sector profile - €bn
27
Total Loans held for sale to NAMA Retained Book – Post NAMA
Investment Land and development Total Investment Land and
development Total Investment Land and development Total
Ireland
Land - 3.7 3.7 - 3.1 3.1 - 0.6 0.6
Development - 2.8 2.8 - 2.3 2.3 - 0.5 0.5
Investment 9.7 9.7 2.1 - 2.1 7.6 - 7.6
Total Ireland 9.7 6.5 16.2 2.1 5.4 7.5 7.6 1.1 8.7
UK (GB/NI)
Land - 1.7 1.7 - 1.0 1.0 - 0.7 0.7
Development - 2.8 2.8 - 2.0 2.0 - 0.8 0.8
Investment 12.8 - 12.8 1.1 1.1 11.7 - 11.7
Total UK (GB/NI) 12.8 4.5 17.3 1.1 3.0 4.1 11.7 1.5 13.2
Total Other 1.7 0.3 2.0 0.2 0.1 0.3 1.5 0.2 1.7
Total 24.2 11.3 35.5 3.4 8.5 11.9 20.8 2.8 23.6
* Note: Before balance sheet impairment provisions of €3.9bn of which €2.7bn relates to loans held for sale to NAMA; Loans and advances expected to transfer to NAMA total €12.2bn and include €0.3bn relating to Non property and construction loans

Retained Property and construction loans - €23.6bn Dec 2009
Investment Loans€20.8bn
Investment loans €20.8bn – 88% of retained Property & construction loans
Book weighted to UK - Geographic profile- 56% in the UK, 37% in Ireland and 7%
US/Europe
Key risk is tenant default mitigated by:– Portfolio well diversified – lack of tenant
concentrations– Sector profile; c.51% Retail, 24% Office, 9%
Industry, 16% mixed use
Impairment provision in the retained investment portfolio of €0.4bn at 31 Dec 09, against impaired loans of €1.4bn
Land and Development Loans€2.8bn
Land and development loans €2.8bn – 12% of retained Property & construction loans
- Land – €1.3bn (RoI €0.6bn and UK €0.7bn)
- Development – €1.5bn (RoI €0.5bn / UK €0.8bn / RoW €0.2bn)
Profile of land and development portfolio
- 39% in Ireland, 54% in the UK and 7% US/Europe
- 46% in land and 54% in development
Impairment provision in retained land and development portfolio of €0.8bn at 31 Dec 09, against impaired loans of €1.9bn
28

Loans held for sale to NAMA – c €12.2bn
Profile of loans transferring to NAMA at 31 Dec 2009Total loans and
advances to customers
Impaired loans Impaired loans as % of advances
Impairment provisions
Impairment provisions as % of
impaired loans
€m €m % €m %Property and construction 11,956 6,452 54 2,760 43Other 279 112 40 18 16Total 12,235 6,564 54 2,778 42
Portfolio of circa €12.2bn expected to transfer to NAMA70% land and development and 30% associated loans
54% or €6.6bn of loans held for sale to NAMA classified as impaired at 31 Dec 09
Stock of Balance Sheet Provisions of €2.8bn on €12.2bn portfolio at 31 Dec 09 of which:– €2.5bn relates to land and development
– €0.3bn relates to associated loans
€1.9bn first tranche to transfer in early April 2010€0.9bn land and development loans (47%) and €1.0bn associated loans (53%)
Consideration of €1.2bn
29

Asset quality – Dec 2009 Non-property corporate and SME loans & Consumer loans
Non-property corporate and SME loans - €34bn
Corporate and SME loan portfolio of €34bn -portfolio diversified across a range of sectors and geographies
– c.45% Ireland, 28% UK and 27% RoW
9 months impairment charge of €659m or 250bps (annualised) (9 months to Dec 08 €108m or 41bps)
Increased impairment charge reflecting
– Impact of the slowdown in economic activity
– Poor consumer sentiment
– Higher level of business insolvencies
Consumer loans - €4bn
Consumer loan portfolio of €4bn at 31 Dec 09 (€6bn Mar 09)
– 67% Ireland and 33% UK
Includes personal loans, overdrafts, motor loans and credit cards
Enhanced management of arrears
9 months impairment charge of €166m or 421bps (annualised) (9 months to Dec 08 €130m or 244bps)
Impairment charge remains elevated due to
– Higher unemployment
– Higher level of personal indebtedness
– Lower disposable income
30

Visibility on non-NAMA impairments
Extensive Group loan loss forecast re-fresh exercise undertaken in Jan/Feb 2010
– Assessment grounded in consensus base-case macro economic forecasts
– Combination of modelled and granular bottom-up analysis
Previous market guidance re-affirmed for impairment charges of €4.7bn for the 3 year period to 31 Mar 2011 for the non-NAMA element of the loan book
Outcome validated by Oliver Wyman through an independent review and challenge of the Group’s loan loss forecast
Impairment charge expected to have peaked in 2009
Impairment charge on non-NAMA loans and advances to customers expected to have peaked in 2009 – with progressive reductions expected in each of 2010, 2011 and 2012
31
Economic assumptions underpinning expected
impairment charge
IrelandHouse price falls peak to trough – 45%
Unemployment 2010 14% 2011 13%
GDP – growth not expected before 2011
United KingdomHouse price falls peak to trough – 20%
Unemployment 2010 9%2011 9%
GDP – low growth expected in 2010

Balance Sheet funding strategy
Balance Sheet funding strategyCustomer Deposits
– Drive growth through strength of franchise and scale of distribution
Wholesale Funding– Continue to extend maturities in term markets
– As funding markets continue to normalise extend maturity profile of short term programmes
Contingent Liquidity
– Maintain a robust, efficient and flexible buffer of contingent liquid assets - €42bn of liquidity potential at 31 Dec 09
– Ensuring access to BOE, ECB & Federal Reserve
Government Guarantee
– Disengage from the Government Guarantee in a prudent and safe manner
32
Customer deposits
45% / €83bn
Wholesale funding
40% / €74bn
Total capital 8% / €15bn
Other 7% / €12bn
* Note: Excludes Life funds held on behalf of policyholders: Mar 09 €9.7bn, Sept 09 €11.4bn, Dec 09 €11.7bn
Mar 2009Total
liabilities€184bn*
Customer deposits
50% / €87bn
Wholesale funding
35% / €61bn
Total capital 8% / €14bn
Other 7% / €11bn
Sept 2009Total
liabilities€173bn*
Customer deposits
50% / €85bn
Wholesale funding
36% / €61bn
Total capital 8% / €12bn
Other 6% / €11bn
Dec 2009Total
liabilities€169bn*

Group deposits
Divisional profile of deposits Competitive marketDeposits increased by 2% Dec 09 vs Mar 09 despite intense competition and pressure on international deposits
Distribution, strength of brand and stable franchise driving deposit growth
Joint number one share of total resources in Ireland - extensive distribution capability with leading and trusted franchise
Retail Ireland – customer deposits up 4% (Dec 09 vs Mar 09)
– Deposits increased 4%
– Current account credit balances up 6%
UKFS customer deposits down 2% (Dec 09 vs Mar 09)
– POFS source of quality deposits
Capital Markets – customer deposits down 1% (Dec 09 vs Mar 09)
33
Mar 09 Sept 09 Dec 09
% growth Dec 09
Vs Mar 09
Group Total €83bn €87bn €85bn 2%
Retail Ireland €33bn €34bn €35bn 4%
- Deposits €23bn €24bn €24bn 4%
- Current accountscreditbalances
€10bn €10bn €11bn 6%
UK Financial Services (UKFS)
€21bn£19bn
€21bn£18bn
€21bn£19bn (2%)
- BBUK £11bn £10bn £10bn (9%)
- POFS £8bn £8bn £9bn 9%
Capital Markets €29bn €32bn €29bn (1%)

Wholesale Funding
Wholesale funding profile
Quantum of wholesale funding at Dec 2009 reduced to €61bn from €74bn at Mar 2009
– Increase in customer deposits– Reduction in liquid assets of €7bn as wholesale
funding is termed out
€9bn of term funding issued during 9 months to Dec 2009 (€8.4bn in the 12 months to Mar 09)
– Average maturity of 2.4yrs with an average spread of 3 month Euribor +180bps
Maturity profile of wholesale funding lengthened with term funding (funding with a maturity of 1 year and longer) increased from 27% of wholesale funding at Mar 2009 to 32% at Dec 2009
Net Monetary Authority drawings have decreased to €8bn at Dec 2009 from €17bn at Mar 2009
Jan 2010 BoI accepted as a participating institution in Eligible Liabilities Guarantee Scheme (ELG)
34
Securitisation
ACS/Senior debt
CP/CDs
Deposits byBanks
9%
34%
18%
39%
Improvement in funding conditionsImproved investor sentiment towards Ireland reflected in narrowing of CDS spreads *
– Sovereign CDS c.128bps at 26 Mar 2010, down from peak of c.400bps in Feb 2009
– Bank of Ireland CDS c.204bps at 26 Mar 2010, down from peak of c.670bps in Mar 2009
Dec 2009 €61bn
Mar 2009€74bn
Sept 2009 €61bn
10%
41%
15%
34%
10%
44%
16%
30%
* Note: ‘CDS’ credit default swaps