Embed Size (px)
Citation preview

Bank of America SecuritiesBank of America SecuritiesEnergy ConferenceEnergy Conference
November 14, 2008
Presenter:Denny SmithDirector, Corporate Development

Page 2
Forward Looking StatementWe often discuss expectations regarding our markets, demand for our products and services, and our future performance in our annual and quarterly reports, press releases, and other written and oral statements. Such statements, including statements in this document incorporated by reference that relate to matters that are not historical facts are “forward-looking statements” within the meaning of the safe harbor provisions of Section 27A of the Securities Act of 1933 and Section 21E of the Securities Exchange Act of 1934. These “forward-looking statements” are based on our analysis of currently available competitive, financial and economic data and our operating plans. They are inherently uncertain and investors must recognize that events and actual results could turn out to be significantly different from our expectations.
You should consider the following key factors when evaluating these forward-looking statements:
• fluctuations in worldwide prices and demand for natural gas and oil;• fluctuations in levels of natural gas and crude oil exploration and development activities;• fluctuations in the demand for our services;• the existence of competitors, technological changes and developments in the oilfield services industry;• the existence of operating risks inherent in the oilfield services industry;• the existence of regulatory and legislative uncertainties;• the possibility of changes in tax laws;• the possibility of political instability, war or acts of terrorism in any of the countries in which we do business and;• general economic conditions.
Our businesses depend, to a large degree, on the level of spending by oil and gas companies for exploration, development and production activities. Therefore, a sustained increase or decrease in the price of natural gas or oil, which could have a material impact on exploration and production activities, could also materially affect our financial position, results of operations and cash flows.
The above description of risks and uncertainties is by no means all inclusive, but is designed to highlight what we believe are important factors to consider.
Page 3
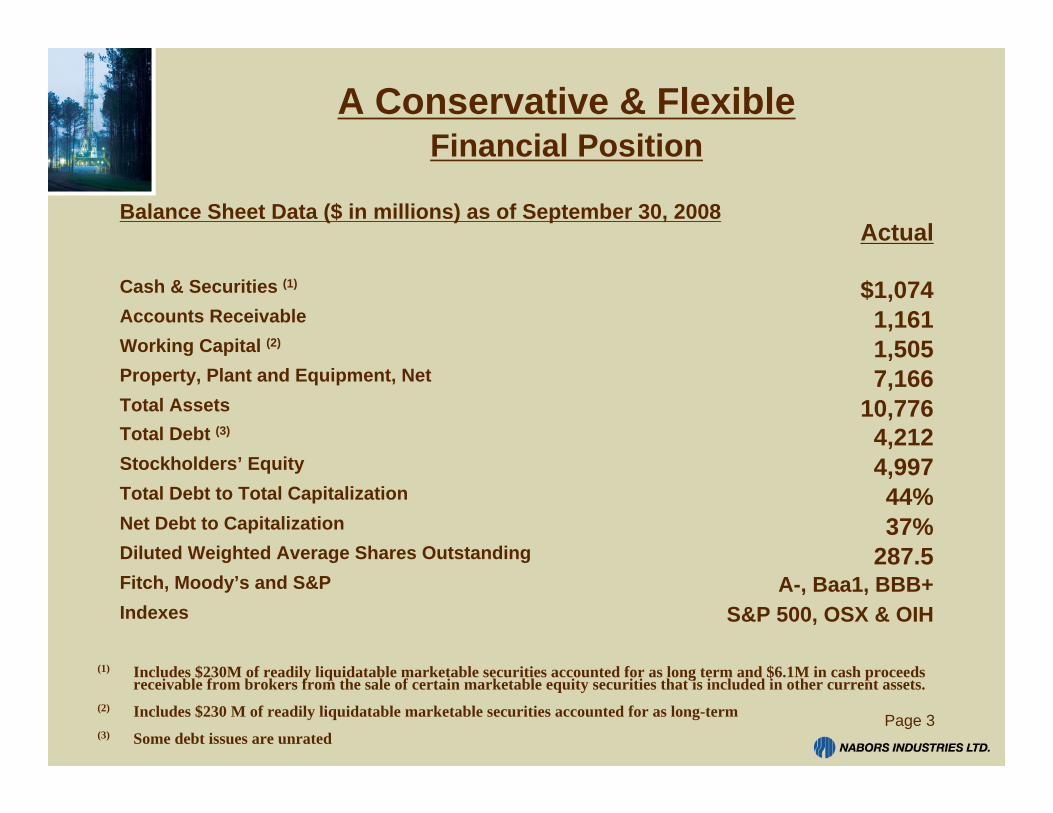
A Conservative & Flexible Financial Position
Balance Sheet Data ($ in millions) as of September 30, 2008
287.537%44%
4,9974,212
10,7767,1661,5051,161
$1,074
Actual
S&P 500, OSX & OIHA-, Baa1, BBB+
Stockholders’ Equity
IndexesFitch, Moody’s and S&PDiluted Weighted Average Shares OutstandingNet Debt to CapitalizationTotal Debt to Total Capitalization
Total Debt (3)
Total AssetsProperty, Plant and Equipment, NetWorking Capital (2)
Accounts ReceivableCash & Securities (1)
(1) Includes $230M of readily liquidatable marketable securities accounted for as long term and $6.1M in cash proceeds receivable from brokers from the sale of certain marketable equity securities that is included in other current assets.
(2) Includes $230 M of readily liquidatable marketable securities accounted for as long-term(3) Some debt issues are unrated

Page 4
Globally Positioned Portfolio of High-End Assets
13 JACK-UPS> 8 Drilling> 5 Workover
3 BARGE RIGS 37 PLATFORM RIGS> 23 Workover/Re-Drilling> 14 Drilling
700 LAND WORKOVER RIGS 525 LAND DRILLING RIGS
Actively Marketed Rigs OnlyAs of September 30, 2008
DRILLINGINSTRUMENTATION
TOP DRIVEMANUFACTURING
OILFIELDSERVICES

Page 5
Global Working Rig Fleet Status
566142424
394.521.561
53162367
2005Avg.
53987452
45823104
311827212
Current
443753Canada
535505581Total W.O./Well Servicing90114147Canada445391434US Lower 48
W.O./Well Servicing
466407431Total Drilling232120Int’l Offshore (1)1039579Int’l Land (1)
International
181616GOM Offshore267229255US 48 Drilling1198Alaska
North America
4Q08Expected
2007Actual
2006Avg.Drilling
As of November 7, 2008

Page 6
Current Environment
> North America Drilling (U.S. Lower 48)• Rig count still near all-time high of 273 but expected to fall off December through April.• 81 new rigs currently operating and setting performance records.• 32 new rig commitments scheduled to deploy 3Q08 - 3Q09 at margins 2x current average
for legacy rigs.• Expect much higher resiliency than 2006 - 2007 market.
> North America Drilling (Canada)• Secured 2 new build commitments.• 4-6 more probable.• Slower Alberta activity substantially offset by Saskatchewan (Bakken) and British Colombia
Shales (Horn River & Montney).• Market softening overall – Nabors expects year over year to be flat to down slightly.
> International• Rig count and margins still improving.• Expanding operations into two new areas (Romania & Kuwait).• Bid prospects still strong – some areas slowing.• 2009 EBIT expected to be +$100 million over 2008.

Page 7
Current Environment
> U.S. Offshore:• 3Q08 Strong pricing & activity: margins over $20k per rig day and four
additional rigs working since 2Q08.• Two new MODS platform rigs in process for term commitments.• Barge 100 damaged in Hurricane Gustav.• Market still strong but vulnerable to slowing in jack-ups and barges.
> Alaska:• Increasing demand driven by accelerated recovery effort in existing fields, new
field development & strong exploration.• 2 new rigs deployed plus 1 under construction.• 3 existing rigs undergoing upgrades for long-term contracts.• Some deferral of projects possible.
> Other Segments:• Increasing financial significance with strong growth in Canrig, EPOCH and
Ryan, potential increase of 60% 2007 over 2008.• Increasing, but seasonal/volatile, activity and pricing in Alaska JVs.

Page 8
Upside Drivers/Downside Mitigators
> Higher overall resiliency to market down turns
> New rig additions:•190 new rigs globally by mid 2010
•Increased weighting to higher margin rigs
– U.S. Lower 48 land, International, Alaska and US Offshore
> International growth
> Alaska growth
> Oil & Gas growth
> Other segments growth

Page 9
Largest Global New Rig Additions New Build Commitments (2005-2009)
Significant Further Potential
190121213162Total
1697Canada
312Alaska
431**1140International
13112US Offshore
1152*113US Lower 48
TotalPlatformJack-UpBargeRigs
Coil TubingDrilling
OffshoreLand
Includes new build commitments still to be deployed
*Note: Includes one rig working for Nabors Well Services
**Note: Platform-type rig mounted inside drillship

Page 10
Nabors USA Initiatives Critical to Record Rig Count
> Continue to Design Custom Rig Solutions for Today’s Drilling Challenges
> 2005 New Build Program• PACE M Series• PACE F Series• Canadian PACE• SuperSundowner
> 2008 New Build Program• Updated PACE M Series for the Haynesville and Woodford Shales,
Piceance Basin and California• New PACE 1500 Design for the Haynesville Shale and Oklahoma• New Box-on-Box PACE 1500 Design for the Bakken

Page 11
Nabors USA Rig Fleet TransitionNew Technology Financed Term - Contracts
33%34%33%August 2010
0%53%47%August 2005
ACSCRMechanical
67% of Fleet

Page 12
PACE Rig Fleet GrowthPrimarily Driven by Unconventional Plays
Bakken – 6
Barnett – 14
Piceance/Pinedale – 25
Woodford/Fayetteville – 16
Haynesville/Bossier - 45
106 out of 113 PACE rigs working in Shale developments
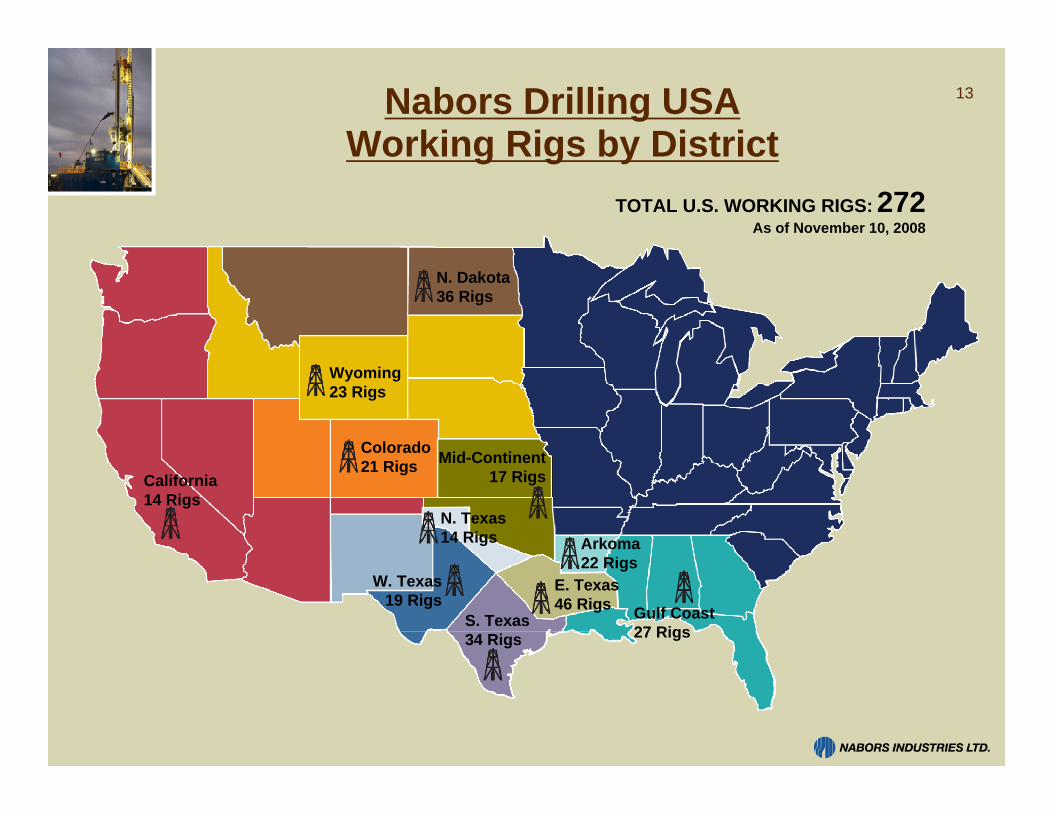
13Nabors Drilling USAWorking Rigs by District
California14 Rigs
Wyoming23 Rigs
S. Texas34 Rigs
N. Texas14 Rigs
W. Texas19 Rigs
E. Texas46 Rigs
N. Dakota36 Rigs
Colorado21 Rigs
Gulf Coast27 Rigs
Mid-Continent17 Rigs
Arkoma22 Rigs
TOTAL U.S. WORKING RIGS: 272As of November 10, 2008

Page 14
Record Breaking Well - Anadarko Carthage, TX

Page 15
Piceance Basin Nabors SSD 573 vs. ‘06 Conventional Rig Average

Page 16
NBR PACE 101 – 1,000 HPRecord Breaking Well – Wamsutter June 08
> Nabors Rig 101eclipsed both the previous directional & vertical records for all operators in the field
> Previous best well stood since March 2005
-87%2.10%16.30%Well Non Productive Time %
-61%6.416.35Well Cycle Time (days)-59%4.410.73Days to 10k feet
Change
Nabors PACERig 101
Record Well2007 Field
Average

Page 17
Increasing Rig Demand and SophisticationLimited Production Response with Higher Decline Rates

Page 18
US Lower 48 Land MarginsVolatile But Steadily Increasing
As of October 2008

Page 19
U.S. Lower 48 Land DrillingTerm Contracts in Force at September 30, 2008 (1)
EBIT - $Millions $320$360$540
FY2010FY20094Q08
Annualized
# of rigs subject to term contracts 637996120155173
4Q093Q092Q091Q094Q083Q08
(1) Represents the minimum number of contracts in force with no incremental contract awards in the future.

Page 20
International Margins & Rig CountThree-fold Increase in Seven Years & Inflecting Upwards

21
International Market Share Growth
20
40
60
80
100
120
140
1Q04
2Q04
3Q04
4Q04
1Q05
2Q05
3Q05
4Q05
1Q06
2Q06
3Q06
4Q06
1Q07
2Q07
3Q07
4Q07
1Q08
2Q08
3Q08
0%
2%
4%
6%
8%
10%
12%
14%
NDIL Rig YearsNabors Market Share

Page 22
Nabors Drilling International Elements of Upside Potential
+/- $100 Million+/- $90 Million$123 MillionY/Y increase in EBIT
-15%-37%-12%Cost & Utilization % Changes
31%65%44%Contract Renewals
56%23%24%Prior Year Start-Ups
28%49%44%New Rig Start-ups
Consensus Implied
2008 – 2009 Consensus Implied
2007 – 2008 Actual
2006 – 2007
Sources of year-over-year incremental % change in EBIT

Page 23
Strong International Bid FlowRecent and Prospective Rig Inquiries
107 +/-15Africa & Far East10North Africa6Mexico27Middle East27Russia & FSU22South America
As of September 2008 - Number of
RigsRegion
Note: Bids pending, working & expected including renewals, extensions and incremental requirements

Page 24
*Subsidiary operating income from continuing operations before corporate expenses & inter-company consolidation
High Growth Visibility –Internationally and Alaska
Actual and Implied Operating Income Distribution

25High Growth Visibility2001–2009 Operating Income
Subsidiary operating income from continuing operations before corporate expenses and inter-company consolidation (000’s)
$3.10 $2.70

Page 26
AUXILIARYINFORMATION

Page 27
Margins and Activities
(1)Margin = gross margin per rig per day for the period. Gross margin is computed by subtracting direct costs from operating revenues for the period.
37.08,27816.97,27835.87,644Canada
Rig HrsRev/HrRig HrsRev/HrRig HrsRev/HrWell Servicing
Rig YrsMargin (1)Rig YrsMargin (1)Rig YrsMargin (1)
72,593$70240,257$70367,141$675Canada
274,084$460272,101$455290,680$473US Lower 48
117.912,860121.514,757121.315,989International
8.413,52810.421,55211.017,787Alaska
14.415,72817.120,18519.218,124US Offshore
221.6$8,852242.3$8,891263.3$10,065US Lower 48
3Q 072Q 083Q 08

Page 28
Quarterly Adjusted IncomeDerived from Operating Activities
42,29131,46842,433Nabors Well Services
16,920(14,326)13,396Canada
88,574101,752111,048International
4,21413,46610,159Alaska
9,24517,98318,456US Offshore
$130,761$134,322$176,819US Lower 48
3Q 072Q 083Q 08($000’s)

Page 29
Non-GAAP Financial Information
Within the preceding slides in this presentation, we present, both historically and on a forward-looking basis, our adjusted income (loss) derived from operating activities, which is a “non-GAAP” financial measure under Regulation G. The components of adjusted income derived from operating activities are computed using amounts which are determined in accordance with accounting principles generally accepted in the United States of America (GAAP). Adjusted income derived from operating activities is computed by: subtracting direct costs, general and administrative expenses, and depreciation and amortization, and depletion expense from Operating revenues and then adding Earnings from unconsolidated affiliates. Such amounts should not be used as a substitute to those amounts reported under GAAP. However, management evaluates the performance of our business units and the consolidated company based on several criteria, including adjusted income (loss) derived from operating activities, because it believes that this financial measure is an accurate reflection of the ongoing profitability of our company. We have provided within the table presented below a reconciliation for the applicable historical and forward-looking periods of adjusted income derived from operating activities to income before income taxes, which is its nearest comparable GAAP financial measure.

Page 30
Non-GAAP Financial Information (continued)
The following table provides a reconciliation of adjusted income derived from continuing operating activities for our reportable segments to income before income taxes for the three months ended September 30, 2008, June 30, 2008 and September 30, 2007, using historical information determined in accordance with GAAP:
(1) Represents the elimination of inter-segment transactions and unallocated corporate expenses.
$215,893$266,132$306,702Income from continuing operations before income taxes
(30,524)(3,158)(10,875)(Losses) gains on sales of long-lived assets, impairment charges and other (expenses) income, net
(27,466)25,057(22,235)Investment income(13,450)(21,676)(25,506)Interest expense287,333265,909365,318Total(32,837)(36,117)(42,945)Other Reconciling items (1)
10,29719,00618,375Other Operating Segments17,868(1,645)17,577Oil & Gas
292,005284,665372,311Subtotal Contract Drilling88,574101,752111,048International16,920(14,326)13,396Canada
4,21413,46610,159Alaska9,24517,98318,456US Offshore
42,29131,46842,433US Land Well-Servicing$130,761$134,322$176,819US Lower 48 Land Drilling
Contract Drilling:Adjusted income derived from continuing operating activities:
September 30, 2007June 30, 2008September 30, 2008(in thousands)
Three Months Ended