Embed Size (px)
Citation preview

No 146- March 2012
Bank Financing to Small and Medium Enterprises in East Africa: Findings of a Survey in Kenya, Tanzania, Uganda
and Zambia
Pietro Calice Victor M. Chando Sofiane Sekioua

Correct citation: Calice, Pietro; Chando, Victor. M.; and Sekioua, Sofiane (2012), Bank Financing to Small and Medium Enterprises In East Africa: Findings of A Survey in Kenya, Tanzania, Uganda and Zambia, Working Paper Series N° 146, African Development Bank, Tunis, Tunisia.
Steve Kayizzi-Mugerwa (Chair) Anyanwu, John C. Verdier-Chouchane, Audrey Ngaruko, Floribert Faye, Issa Shimeles, Abebe Salami, Adeleke
Coordinator
Working Papers are available online at
http:/www.afdb.org/
Copyright © 2012
African Development Bank
Angle des l’avenue du Ghana et des rues
Pierre de Coubertin et Hédi Nouira
BP 323 -1002 TUNIS Belvédère (Tunisia)
Tel: +216 71 333 511
Fax: +216 71 351 933
E-mail: [email protected]
Salami, Adeleke
Editorial Committee Rights and Permissions
All rights reserved.
The text and data in this publication may be
reproduced as long as the source is cited.
Reproduction for commercial purposes is
forbidden.
The Working Paper Series (WPS) is produced
by the Development Research Department
of the African Development Bank. The WPS
disseminates the findings of work in progress,
preliminary research results, and development
experience and lessons, to encourage the
exchange of ideas and innovative thinking
among researchers, development
practitioners, policy makers, and donors. The
findings, interpretations, and conclusions
expressed in the Bank’s WPS are entirely
those of the author(s) and do not necessarily
represent the view of the African Development
Bank, its Board of Directors, or the countries
they represent.

Bank Financing to Small and Medium Enterprises in East Africa: Findings of a Survey In Kenya, Tanzania, Uganda
and Zambia
Pietro Calice, Victor M. Chando and Sofiane Sekioua1
1 Pietro Calice and Sofiane Sekioua are Principal Investment Officer and Senior Investment Officer, respectively, at
the African Development Bank. Victor M. Chando is Managing Director at VFS Wealth Managers. The authors
would like to thank the Indian government for its financial support to this paper. The authors are also grateful to the
banks in Kenya, Tanzania, Uganda and Zambia for their generosity in sharing information and for participating in
the survey. Finally, the authors are indebted to Prajesh Bhakta, Penina Kariuki and Ewan Wheeler for their role in
facilitating the interviews with the banks. The views expressed in this paper are solely those of the authors and do
not necessarily represent those of the African Development Bank or of its Board of Directors.
AFRICAN DEVELOPMENT BANK GROUP
Working Paper No. 146 March 2012
Office of the Chief Economist

4
Abstract
This paper describes the main findings
of a survey of SME financing in four
East African countries, namely Kenya,
Tanzania, Uganda and Zambia. We find
that the SME segment is a strategic
priority for the banks in the region.
SMEs are considered a profitable
business prospect and provide an
important opportunity for cross-selling.
Banks consider that the SME lending
market is large, not saturated and with a
very positive outlook. A number of
obstacles are, however, constraining
banks’ further engagement with the
SME segment, including SME-related
factors, macroeconomic factors,
business regulation, the legal and
contractual environment, the lack of a
more proactive government attitude
towards the segment, some areas of
prudential regulation and some bank-
specific factors. Nonetheless, banks have
adapted to their environment and
developed mechanisms to cope with it
through innovation and differentiation.
We conclude that this trend should be
supported and encouraged through
reforms to soften the negative impact of
those obstacles which are hindering the
further involvement of banks with
SMEs.
Keywords: Small and Medium Enterprises; Access to finance; Bank finance
JEL Codes: G21; G28; G29; O12; O16; L25

5
1. Introduction
Small and medium enterprises (SMEs) play a major role in economic development in every
country, including in African countries. Studies indicate that in both advanced economies and
developing countries SMEs contribute on average 60 percent of total formal employment in the
manufacturing sector (Ayyagari et al, 2007). For African economies, the contribution of the SME
sector to job opportunities is even more important. Taking into account the contribution of the
informal sector, SMEs account for about three-quarters of total employment in manufacturing
(Ayyagari et al, 2007).
A crucial element in the development of the SME sector is access to finance, particularly to bank
financing, given the relative importance of the banking sector in serving this segment. Firm-level
data collected by the World Bank show that access to finance is perceived as one of the main
obstacles to doing business (World Bank, various years). A number of studies have shown that
financing is a greater obstacle for SMEs than it is for large firms, particularly in the developing
world, and that access to finance adversely affect the growth of the SME sector more than that of
large companies (Schiffer and Weder, 2001; Beck et al, 2005; Beck et al, 2006). It is, therefore,
unsurprising that the international development community has listed SME access to finance as
an important policy priority.2
In spite of the importance of the topic, relatively little research exists on whether, why and how
banks finance SMEs around the world. This is compounded by the fact that comprehensive data
on SME finance is still to be more consistently collected and monitored over time.3 Nonetheless,
existing studies show that, contrary to the conventional perception that financial institutions are
not interested in dealing with SMEs, banks consider the SME segment strategically important.
Yet institutional constraints remain and the market is far from saturated.
Beck et al (2008; 2010) provide the first attempt to understand SME financing from the supply
side. Based on a survey of 91 banks in 45 countries, the authors provide a characterization of
bank financing to SMEs and find that banks perceive the SME segment to be highly profitable
and serve it through a number of lending technologies and organizational setups. The authors
observe few differences in the extent SMEs are reached out by banks based on their ownership
structure (i.e. public, private or foreign-owned). However, they find significant differences
across banks based in developed and developing economies, and conclude that the enabling
environment is more important than the size of the firm or bank ownership in shaping bank
financing to SMEs.
De la Torre et al (2010) investigate banks’ approaches to SMEs in terms of business models and
risk management systems. Based on surveys for 48 banks and one leasing company in 12
countries, the authors find that all banks in the sample are interested in serving the SME
segment. To do so, almost all have separate organizational units and offer a wide range of
products, applying different transactional technologies such as credit scoring or risk-rating
2 For example, in 2009 G-20 countries committed to identifying lessons learned on innovative approaches to
providing financial services to SMEs and to promoting successful regulatory and policy approaches (Pittsburgh G-
20 Summit, 2009). 3 Efforts to improve measurement of SME financing and collect systematic data on SME finance are being scaled up
within the G-20 framework. See CGAP (2010).

6
systems. The authors conclude that the conventional wisdom according to which large banks are
not attracted by SMEs and that this business is dominated by small banks and based on
relationship lending does not hold in practice.
In a similar study, Rocha et al (2011) investigate the status of bank financing to SMEs in the
Middle East and North Africa (MENA) based on a survey of 139 banks in 16 countries. The
authors find that in spite of a positive perception of the attractiveness of the segment, the SME
sector in the region remains largely underserved. Direct government interventions through public
banks, credit guarantee schemes and other forms of subsidized financing play a major role in
SME lending, partly compensating for the low level of private sector involvement, which in turn
reflects the MENA’s weak financial infrastructure.
Finally, Stephanou and Rodriguez (2008) analyze both trend and structure of the SME financing
market in Colombia. They find that banks in the country regard the SME segment as an attractive
business opportunity though their level of sophistication in terms of business models and risk
management tools remains modest. The authors conclude that the market is characterized by a
number of institutional and policy constraints, which inhibits further growth of SME lending.
Ongoing efforts to study SME financing from a supply-side perspective are particularly relevant
for Sub-Saharan Africa. According to enterprise-level data collected by the World Bank (various
years), SMEs in Sub-Saharan Africa are more financially constrained than in any other
developing region. Only 20 percent of SMEs in Sub-Saharan Africa have a line of credit from a
financial institution compared, for example, with 44 percent in Latin America and Caribbean,
and only 9 percent of their investments are funded by banks versus 23 percent in Eastern Europe
and Central Asia. These findings alone provide the rationale for investigating the structure of the
SME lending market in the region, with the aim to understand the main drivers and obstacles to
SME financing as well as banks’ operational approaches.
This paper contributes to the growing literature on SME finance. Its purpose is to shed light on
current trends and practices in bank financing of SMEs in four East African countries, i.e.
Kenya, Tanzania, Uganda and Zambia.4 The comparison among these countries is interesting
because they are neighbours, they are all growing, emerging economies and they have
implemented a number of financial reforms in recent years, with their banking systems becoming
increasingly integrated. In particular, this paper forms part of a broader African Development
Bank regional project on this topic, whose objective is to identify best practices in SME lending
as well as constraints that impede growth in the SME finance market so as to draw relevant
policy implications.
The approach used for the study was based on a tabulated questionnaire followed by on-site
interviews with banks’ senior management. The format and the questions of the questionnaire
were drawn from previous surveys developed for analysis in different markets (see Beck et al,
2008 and 2010; De la Torre et al, 2010) and slightly adapted to cover topics not included in the
previous surveys but which may have an impact on SME bank financing in East Africa such as
micro-prudential regulation. The interviews and data processing are confidential. This was meant
4 East Africa is variably defined by geography and geopolitics. In this paper, we adopt the United Nations
geoscheme classification of Eastern Africa, which includes 19 countries (http://millenniumindicators.un.org).

7
to provide comfort to the banks in sharing their information, with the understanding that data
would be presented in aggregate way, without disclosing each bank’s position or strategy. The
questionnaire included 90 questions divided in three broad analytical areas, which are described
in detail in this paper. The first area deals with banks’ involvement in SME lending. The second
area focuses on the determinants of banks’ involvement with SMEs such as corporate strategy,
market structure, government policy and regulation. The third area attempts to understand how
banks engage in lending to SMEs, with a special emphasis on the nature of their business models
and risk management systems.
To conduct the study, the questionnaire was submitted to 16 banks, four banks in each country.
On-site interviews were conducted by the authors between August and September 2011. The
banks interviewed were selected based on the anecdotal consideration that they are among the
most active in SME credit markets in their respective countries. In Kenya, we interviewed three
foreign banks and one domestic private, accounting for 23 percent of total banking assets as at
December 31, 2010. In Tanzania, we interviewed one public bank, two domestic private and one
microfinance institution, representing 52 percent of the banking system at end-2010. In Uganda,
we interviewed three domestic private banks and one foreign, accounting for 36 percent of total
banking assets in 2010. In Zambia, we interviewed two foreign and two domestic private banks,
accounting for 57 percent of the banking system at the end of 2010. Overall, the interviewed
banks represented 37 percent of the regional banking system in terms of total assets at the end of
2010. While the relatively small size of the sample might introduce some bias in our conclusion,
we believe this is partly mitigated by the fact that the banks selected are representative of bank
financing to SMEs in the region.
All the banks interviewed completed the questionnaire provided, though in several cases not all
questions were answered. Overall, this hampers our ability to reach definite conclusions
regarding the evolution and the present situation of bank lending to SMEs in the region. The
percentages referred to in this paper were calculated based on the sample of total banks
interviewed and rounded to the nearest whole number. By definition, each bank accounted for
6.25 percent of the total sample.5 The percentages are usually calculated for the aggregate sample
of Kenya, Tanzania, Uganda and Zambia, and when relevant, these percentages are presented by
country. In this case, the percentages are calculated based on the number of banks in each
country (four).
We find that the SME segment is a strategic priority for the banks in the region. SMEs are
considered a profitable business prospect and provide an important opportunity for cross-selling.
Banks consider that the SME lending market is large, not saturated and with a very positive
outlook. A number of obstacles are, however, constraining further banks’ engagement with the
SME segment, including SME-related factors such as the lack of adequate information and
collateral as well as their largely family-owned structures. Macroeconomic factors, business
regulation, the legal and contractual environment, the lack of a more proactive government
attitude towards the segment, some areas of prudential regulation and some bank-specific factors
are also perceived to negatively affect the SME lending market in the sample countries.
Nonetheless, banks have adapted to their environment and developed mechanisms to cope with it
5 For example, if twelve out of the sixteen banks responded positively to a question, the quoted percentage would be
75 percent.

8
through innovation and differentiation. Most banks have dedicated units serving SMEs, to which
they offer largely standardized products though the degree of personalization is growing. And
albeit advanced transaction technologies based on scoring and risk-rating systems remain
relatively underdeveloped, banks are gradually automating their risk management frameworks to
achieve efficiency gains. On the whole, our findings are broadly akin to those of similar studies
in other geographical contexts (see De la Torre et al, 2010), suggesting that the strategic interest
of East African banks in the SME segment can make an important contribution to closing the
“SME financing gap” in the region compared to other developing countries. We conclude that
this trend should be supported and encouraged through reforms to soften the negative impact of
those obstacles which are hindering the further involvement of banks with SMEs.
The rest of the paper is organized as follows. Section 2 presents some stylized facts on bank
involvement with SMEs in the four countries surveyed. It explains the criteria used to define
SMEs and the extent of SME lending. Section 3 focuses on what is behind these stylized facts. It
provides a description of the main drivers and obstacles of SME lending, features of the market
environment, the role of government and prudential regulation. Section 4 addresses how banks in
the region engage with the SME segment, describing their business models and risk management
tools. The sub-section on business models focuses in particular on the general organizational
structure and the products offered to SME clients. The one on risk management provides details
on the credit risk analytical framework, the monitoring of exposures and the management of
nonperforming loans. Section 5 concludes and offers some policy implications.
2. Some stylized facts on banks’ involvement with SMEs
In this section we present some stylized facts on SME lending in the region. First, we examine
the criteria banks use in classifying SME clients and exposures. Second, we provide an overview
of the extent of banks’ involvement with the SME segment in Kenya, Tanzania, Uganda and
Zambia. In this respect, we also assess the relative contribution of SMEs in terms of banks’
income.
2.1.Definition of SME
The definition of SME differed amongst the banks interviewed. As a general note, some of the
banks interviewed especially the smaller banks and those which had a strong microfinance
background, tended to have very low thresholds for a business to qualify as an SME. The bigger
and more established traditional commercial banks tended to have much higher thresholds. Fifty-
six percent of the banks used more than one criterion to define an SME; 38 percent used at least
two criteria, whilst 13 percent used four criteria to define an SME.
The most widely used criteria were loan size and company turnover, both of which were
employed by 69 percent of the banks. Staff size was an additional SME definition used by two
banks in Kenya and one in Tanzania (or 19 percent of the banks in the sample). No bank in
Uganda and Zambia used this criterion, i.e., staff size, to define an SME. Capital employed was
used by one bank in Kenya and one bank in Tanzania, whilst aggregate income to bank was used
by one bank in Uganda (see Figure 1).
Most banks which used the turnover as a classification criterion reported very wide variances in
the qualifying amounts, with the minimum turnover between zero (two banks in Tanzania and on
in Zambia) US$1 million (one bank in Kenya). The banks which reported a very low minimum

9
turnover threshold also reported a relatively low maximum turnover threshold of US$1.8 million
(see Table 1). Interestingly, the maximum turnover threshold for the lower reporting banks was
not anywhere close to the minimum turnover threshold of the banks with the higher thresholds.
In addition to the influences exerted on a bank by its historic background, one of the reasons
noted for this wide variance was the actual ‘location’ of the SME department within a particular
bank. Banks which housed their SME departments within the “corporate banking unit” tended to
report very high turnover thresholds, whilst those which housed their SME departments within
the “retail banking unit” tended to report very low thresholds.
The same trend was also noticeable with banks which use loan size as an SME defining criterion.
The lowest loan size is between zero and US$5,000 which was reported by a bank in Tanzania,
whilst the maximum SME loan amount is US$10 million (reported by a Zambian bank). The
banks with the lowest loan size criteria largely have a microfinance background. Commercial
banks, especially international banks, use much higher loan thresholds.
The lack of a single definition of SME makes comparison between bank lending practices
somewhat inconsistent. However, it would be very difficult to construct a single definition for
the purpose of this study. Therefore, in line with the approach followed in similar studies (Beck
et al, 2008 and 2010; De la Torre, et al, 2010) we ignore the heterogeneity of ranges observed in
the definition of SMEs and use whatever classification is used by the banks surveyed.
2.2.Banks’ involvement with SMEs
All the banks interviewed reported of having SMEs as clients, signifying an important realization
amongst the banks of the importance of SME sector (see Figure 2). In this respect, the banks
appear to be slightly ahead of their respective governments as not all governments in the region
had created supportive SME enabling environments, as at the time of the interviews (see section
3.4). The banks’ interest towards dealing with SMEs is therefore not driven by a general desire
by the banks to take advantage of specific positive government and regulatory programs, but
rather appear to be largely motivated by the business objective of profit pursuit. The type of
involvement is rooted in basic banking products as almost all the banks disclosed that they had
both loan and deposit relationships with SMEs, whilst two banks extended the relationship to
include SME training in order to enhance the quality of their SME loan books.
On further interrogation, in most of the cases, the deposit relationship usually preceded the loan
relationship. This is consistent with the fact that most banks mentioned that they had long
standing relationships with most of their SME clients. Some of the banks stated that they were
indifferent to specific product sequencing in their dealings with SME clients, although the
majority of the banks stated that they preferred a “deposit first” relationship with SMEs before
engaging in lending. Some banks stated that they desired most of their SME clients to have been
clients for periods varying from 18 months to three years before they could grant them any
lending product.
Not all interviewed banks had gone as far as to set up separate SME departments at the time of
the study. Seventy-five percent of the banks reported of having separate SME departments, with
most of the remaining 25 percent with no SME units claiming that a decision to establish a
separate SME department had already been made, or at the very least was being seriously

10
considered (see Figure 2). All the banks in Kenya and Zambia had separate units managing
SMEs, whilst 75 percent of the banks in Tanzania reported having dedicated SME units. Uganda
had the lowest number of banks (25 percent) with separate units managing SMEs.
One important point to note is the fact that in almost all instances, the SME unit was not at par
with the other core traditional banking division such as retail/consumer banking and
commercial/business banking units. In the majority of the banks, the SME unit was indeed a sub-
unit of either the retail banking unit or the business/commercial banking unit. Only in four
instances (25 percent) was the head of the SME department reporting directly to the bank’s CEO.
2.3.Extent of SME operations and contribution to banks’ net income
All the banks interviewed have considerable exposure to the SME market, according to each
bank’s definition. Of the 16 banks interviewed, only twelve were able to provide the percentage
volumes of SME loans when compared to the total loan book, whilst ten were also able to
provide figures related to deposits. The reasons for the lack of a 100 percent disclosure on the
part of the interviewed banks were varied. One prominent reason was that some of the banks
presented system limitations as their IT systems were not configured to identify an SME
transaction (in particular deposits) from any other transaction. Moreover, almost all the central
banks in the region do not specifically require banks to report on SME transactions.
The average aggregate exposure to SMEs measured by the ratio of SME loans to total lending to
the private sector was 37 percent. Kenyan banks had the highest average loan exposure to SMEs
(50 percent), followed by Uganda (42 percent), Tanzania (37 percent) and Zambia (18 percent).
The highest reported loan exposure to SMEs was 87 percent (one Ugandan bank), whilst the
minimum exposure was about 8 percent (one Zambian bank). The average deposit ratio from
SMEs for the sample countries was 36 percent. Once again, Kenyan banks displayed the highest
deposit ratio from SMEs at 49 percent with Zambia at the lowest end with 14 percent (see Figure
3).
Banks had a much more difficult time quantifying the income contribution of SMEs. Only 44
percent of the banks were able to approximate the contribution of interest income on SME loans
to total income. The same share of banks was able to quantify the contribution of total income
from SMEs to total income. Only 25 percent of banks were able to quantify the contribution of
fee income from SMEs to total income. The reasons for this were largely due to IT system
limitations.
Overall, interest income on SME loans averaged 47 percent of total interest income in the
aggregate sample of responding banks. Two banks reported each in Kenya, Tanzania and
Uganda on interest income contribution of SMEs with Uganda reporting the highest contribution
(62 percent), followed by Kenya (42 percent) and Tanzania (30 percent). In Zambia only one
bank disclosed the figure, which was relatively high (60 percent) in view of the fact that the bank
has its roots in the microfinance industry. Two banks in Kenya only reported on the fee income
contribution of SMEs, which averaged 33 percent. The banks in other countries were not able to
report on this variable. Three banks in Zambia and two in Kenya reported on the total
contribution of SMEs to total income, with Zambia averaging 41 percent, largely because of the
effect of the SME roots of the largest contributing bank. In Kenya two banks reported an average

11
of 30 percent as the contribution of SME income to total income. However, given the difficulties
most banks faced in quantifying these variables, the income contribution ratios can at best be
considered as estimates.
3. Explaining the stylized figures
This section illustrates the factors driving banks’ involvement with SMEs in East Africa. First,
we present the main drivers behind banks’ involvement and, second, the obstacles to SME
lending as perceived by the banks. Then, we analyse the SME lending market in terms of
structure and trends, and, finally, we present the banks’ assessment of the role of government and
prudential regulation in fostering SMEs’ access to bank lending.
3.1.Drivers of bank involvement with SMEs
When the interviewed banks were asked to indicate the main drivers behind their participation in
the SME market, the results were varied, although the perceived profitability of the segment was
consistently listed as the major driver. Sixty-three percent of the banks interviewed expect high
profits from working with SMEs, which would more than compensate the relatively high costs
associated with dealing with this segment. Intense competition for the corporate business was
mentioned by 33 percent of the banks whilst “reverse factoring” was mentioned by 20 percent of
the banks (see Figure 4).
Fifty percent of Kenyan banks reported that they were motivated to participate in the SME
market in view of its profitability. They also reported that the need to seek out SME relationships
from existing large corporate clients (reverse factoring) was also an important factor (50 percent
of banks). This is probably because of the existence of a well-developed corporate sector in
Kenya based on value chains, when compared to the other countries in the region. A quarter of
Kenyan banks also reported that intense competition for retail clients drove them to the SME
sector.
In Tanzania, the perceived profitability within the SME sector and the need to avoid intense
competition from other banks within the corporate banking market were both reported by 75
percent of the banks as the two main motives to participate in the SME market, whilst the need to
reduce exposure to the corporate sector was mentioned by 25 percent of the banks.
Three Ugandan banks mentioned that profitability was the main driver for them to participate in
the SME market. “Other” reasons included (i) generally positive perception of the long term
opportunities within the SME market; (ii) follow the lead of other banks and (iii) involvement
with SMEs because it was a specific area of specialization for certain banks. Only one Ugandan
bank mentioned the need to pursue SME relationships through links with existing corporate
clients as a significant driver.
In Zambia, 75 percent of banks also reported that the profitability of the sector was the main
driver to participate in the SME market. Intense competition for the corporate market was
mentioned by 50 percent of the banks, with the need to reduce exposure to both corporate and the
retail markets featuring for 25 percent for the banks.

12
3.2.Obstacles to bank involvement with SMEs
Obstacles to SME lending are perceived differently across the countries and perceptions are also
influenced by the nature and ownership structure of the bank concerned. SME-specific factors
are the most serious obstacle to the development of SME lending. In particular, a large majority
of banks in the region (88 percent) consider the lack of adequate information the most important
deterrent to their involvement with the SME segment. Amongst Kenyan banks, the lack of
quality information was the biggest SME-specific hindrance and obstacle to SME lending, cited
by 100 percent of the banks. Such is the perceived extent of the problem that some of the banks
mentioned that they have allocated internal budgetary resources to assist SMEs through the
extension of training services. Family management was also mentioned (50 percent) as a
hindrance in Kenya as most SMEs are family-owned. Inability to standardize scoring models
also came up from 50 percent of the banks, especially amongst those which have automated their
SME lending systems (see Figure 5).
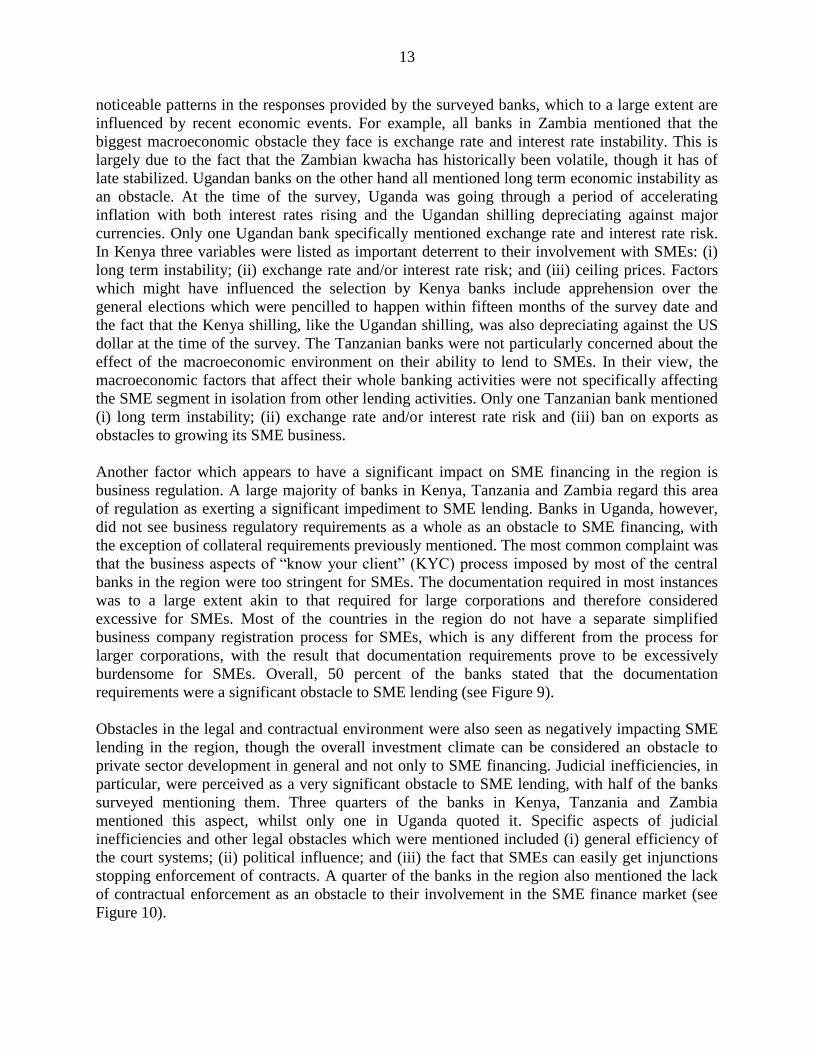
Banks in Uganda appear to be facing similar challenges, with the lack of reliable information
listed by all banks as the main hindrance to SME lending. However, the issue of collateral is a
significant aspect in Uganda with 50 percent of the banks mentioning the lack of adequate
guarantees as an obstacle to SME lending. The Bank of Uganda stipulates that all loans above a
certain minimum must be adequately secured, with first-class guarantees or a bond over property
as the preferred security type. However, this makes it difficult for Ugandan banks to lend to
SMEs in view of the various challenges that this sector faces in terms of coming up with such
acceptable security.6 The fact that SMEs are largely family-owned does not appear to be a
significant obstacle in Uganda. Scoring shortcomings, informality and high costs to improve
information were mentioned by at least one bank in Uganda as perceived obstacles (see Figure
6).
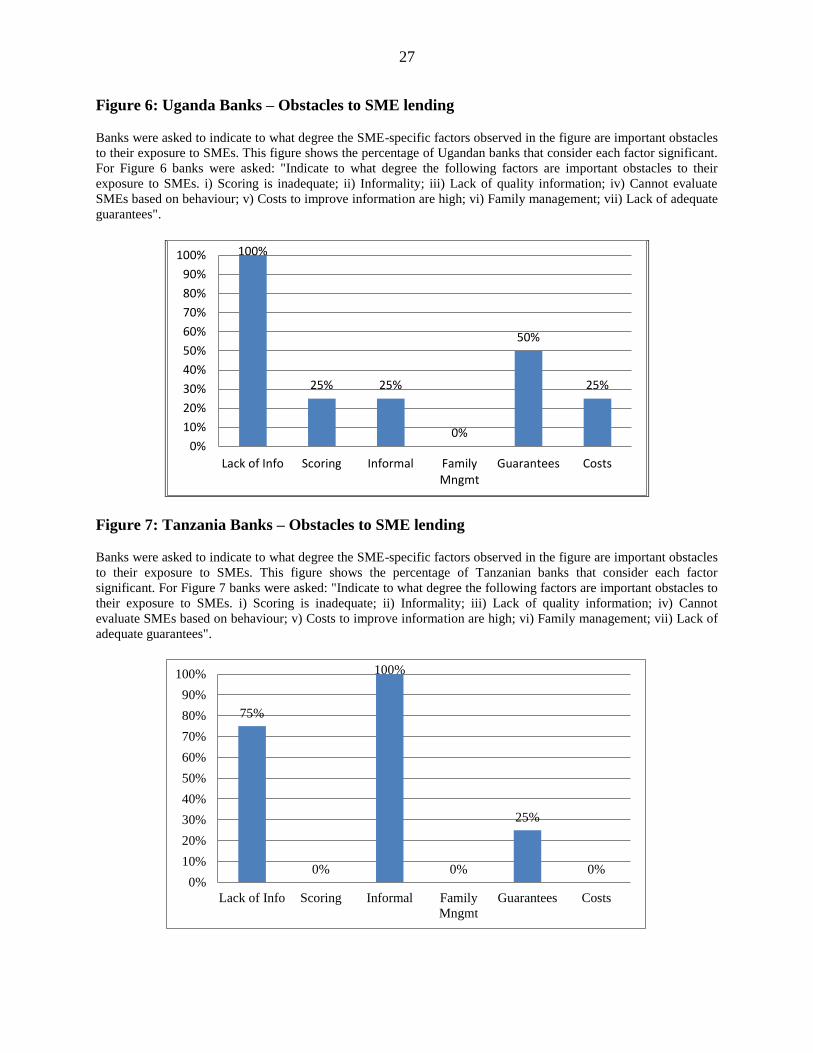
All the Tanzania banks also cited the lack of information as the biggest hindrance to SME
lending. This, according to most Tanzanian banks, affected the quality of information provided
by SMEs, amongst other things, with 75 percent of Tanzanian banks mentioning this aspect as a
significant obstacle to their dealings with SMEs. One Tanzanian bank mentioned that they had
allocated significant resources to training their SME clients in order to improve both their
business skills and quality of information submitted. The issue of the lack of third-party
guarantees to address collateral issues was mentioned by one of the banks in Tanzania as a
hindrance to doing business with SMEs (see Figure 7).
For Zambian banks, only two of the obstacles were relevant: lack of quality information and
limitations on the scoring systems were each mentioned by 75 percent of the banks as the main
obstacles to SME lending (see Figure 8).
Macroeconomic factors were identified as the second most worrisome impediment to the
development of the SME financing market, with 75 percent quoting this element. The relative
degree of importance of this factor, however, differs from country to country. There are
6 The majority of the Ugandan banks mentioned that although the majority of SMEs own property, such property
cannot be lodged with the bank as acceptable security as in most instances it has not been surveyed and does not
have any title deed attached. They mentioned that this was particularly the case for both urban and rural property,
although the problem was more common with rural-based SMEs.
13
noticeable patterns in the responses provided by the surveyed banks, which to a large extent are
influenced by recent economic events. For example, all banks in Zambia mentioned that the
biggest macroeconomic obstacle they face is exchange rate and interest rate instability. This is
largely due to the fact that the Zambian kwacha has historically been volatile, though it has of
late stabilized. Ugandan banks on the other hand all mentioned long term economic instability as
an obstacle. At the time of the survey, Uganda was going through a period of accelerating
inflation with both interest rates rising and the Ugandan shilling depreciating against major
currencies. Only one Ugandan bank specifically mentioned exchange rate and interest rate risk.
In Kenya three variables were listed as important deterrent to their involvement with SMEs: (i)
long term instability; (ii) exchange rate and/or interest rate risk; and (iii) ceiling prices. Factors
which might have influenced the selection by Kenya banks include apprehension over the
general elections which were pencilled to happen within fifteen months of the survey date and
the fact that the Kenya shilling, like the Ugandan shilling, was also depreciating against the US
dollar at the time of the survey. The Tanzanian banks were not particularly concerned about the
effect of the macroeconomic environment on their ability to lend to SMEs. In their view, the
macroeconomic factors that affect their whole banking activities were not specifically affecting
the SME segment in isolation from other lending activities. Only one Tanzanian bank mentioned
(i) long term instability; (ii) exchange rate and/or interest rate risk and (iii) ban on exports as
obstacles to growing its SME business.
Another factor which appears to have a significant impact on SME financing in the region is
business regulation. A large majority of banks in Kenya, Tanzania and Zambia regard this area
of regulation as exerting a significant impediment to SME lending. Banks in Uganda, however,
did not see business regulatory requirements as a whole as an obstacle to SME financing, with
the exception of collateral requirements previously mentioned. The most common complaint was
that the business aspects of “know your client” (KYC) process imposed by most of the central
banks in the region were too stringent for SMEs. The documentation required in most instances
was to a large extent akin to that required for large corporations and therefore considered
excessive for SMEs. Most of the countries in the region do not have a separate simplified
business company registration process for SMEs, which is any different from the process for
larger corporations, with the result that documentation requirements prove to be excessively
burdensome for SMEs. Overall, 50 percent of the banks stated that the documentation
requirements were a significant obstacle to SME lending (see Figure 9).
Obstacles in the legal and contractual environment were also seen as negatively impacting SME
lending in the region, though the overall investment climate can be considered an obstacle to
private sector development in general and not only to SME financing. Judicial inefficiencies, in
particular, were perceived as a very significant obstacle to SME lending, with half of the banks
surveyed mentioning them. Three quarters of the banks in Kenya, Tanzania and Zambia
mentioned this aspect, whilst only one in Uganda quoted it. Specific aspects of judicial
inefficiencies and other legal obstacles which were mentioned included (i) general efficiency of
the court systems; (ii) political influence; and (iii) the fact that SMEs can easily get injunctions
stopping enforcement of contracts. A quarter of the banks in the region also mentioned the lack
of contractual enforcement as an obstacle to their involvement in the SME finance market (see
Figure 10).

14
The nature of SME lending was reported as another significant obstacle. In particular, 50 percent
of the banks were of the opinion that the difficulty in standardising the risk assessment made the
SME lending process problematic. This was particularly noticeable with banks which have to a
certain extent automated their internal credit systems. To make them work, 44 percent of the
banks mentioned that they would need to adapt their commercial operational models in order to
accommodate the peculiar needs of SMEs. Another internal obstacle was the fact that some
banks (38 percent of the total) were finding it difficult to lend to SMEs the same products as
those extended to corporate and retail clients (see Figure 11).
The obstacles given the lowest importance were bank-specific factors. These varied from bank to
bank, irrespective of the country of operations. Less than half of the interviewed banks (44
percent) mentioned that the lack of appropriate technology and skilled staff represented an
important obstacle in their efforts to serve more SMEs. General staff and operational inefficiency
also featured among one-third of the banks. Two Kenyan banks mentioned that they were still
new to the segment, and they were finding this to be a significant challenge. One bank in Kenya
had resorted to recruiting SME teams from other banks in order to boost its own staff skills base.
A bank in Uganda mentioned that it had to restructure their credit appraisal processes by
centralizing it in view of an acute shortage of staff skills at branch level (see Figure 12).
3.3.SME lending market environment
The SME market in the sample countries is considered large and with very good prospects. This
indicates that all banks in the region are very bullish about the outlook for the regional SME
market. In particular, almost all banks (93 percent) agreed that the regional SME market was
competitive, but not yet saturated. In view of this, it is not surprising that most of the banks
mentioned that they were aggressively seeking out new SME clients despite the strong demand.
Eighty-one percent of the banks mentioned that they are actively involved in some marketing
activities to reach out to SMEs.
Almost all the banks in the region (88 percent) said they considered that there have been
significant shifts in the bank SME financing market in recent years. This seems to be
corroborated by the fact that most of the banks which had SME departments in place had
established them during the past five years. The region has over the past ten years liberalised its
financial markets leading to extensive structural changes. In all the four countries, several
institutions which used to specialize in microfinance applied and obtained a banking licence,
leading to a proliferation of new banks with very strong microfinance traditions. This created
competition for the “traditional” banks, which seemed to focus largely on the corporate and
personal/consumer banking business, as the new banks sought to move into the relatively
unexploited “middle sector”.
The motivation for the interviewed banks to get involved in SME financing was to a large extent
not driven by the moves of competitors. Almost all banks (81 percent) reported that they did not
become involved in SME financing because of the need to follow other banks. Finally, 63
percent of the banks were of the opinion that it is important to be one of the first movers in
financing the sector (see Figure 13).

15
The structure of the SME lending market differs amongst countries, and there is no full
agreement within countries. Amongst Kenyan banks, 50 percent were of the opinion that the
market was segmented, with certain specific SME market sectors being served by specific
financial institutions. One (25 percent) Kenyan bank was of the opinion that the market was
dominated by a small number of banks, whilst the other one was of the opinion that the market
was atomized. In Uganda, the majority of banks perceived the market as dominated by a small
number of banks. Three-quarters of Tanzanian and Zambian banks were of the opinion that their
respective SME lending markets were segmented. On the whole, 56 percent of the regional banks
interviewed were of the opinion that the regional SME loan market was segmented (see Figure
14). The main players in the region are large private banks, according to a large majority of the
interviewed banks (69 percent). They are followed in importance by niche banks and other
financial intermediaries (see Figure 15).
3.4.Role of the government
The need for the government to play an active role in the development of a vibrant SME loan
market in the region differed from country to country. Kenyan banks reported that the lack of
adequate government support was hindering the further development of the SME sector and that
they would need their government to assist in creating an enabling environment, including the
provision of financial support. At the time of the survey, the Kenyan government had a draft bill
for the support of the SME sector awaiting enactment.7 One of the Kenyan banks was making
extensive use of government-supported facilities, whilst the other banks appeared not to consider
accessing government sponsored funding instruments as helpful and depended largely on their
own internal loan processes.8 The merits of the credit reference bureau were agreed to by all the
banks interviewed although all of them mentioned that it was still new and still needed to
accumulate a decent database and was therefore not currently influencing their lending decisions
in a significant manner.
In Tanzania the government approved a regulatory framework to support SMEs in 2002. Despite
this, most banks interviewed in the country were of the opinion that government intervention was
largely required in building up the credit reference bureau as well as improving the judicial
process and subsidising the banks in order for them to be able to make affordable loans to SMEs.
This might imply that either the SME bill had not adequately covered areas that were of concern
to banks regarding their dealings with SMEs, or that other supportive interventions were required
in addition to existing legislation. The only support scheme that was mentioned by the Tanzanian
banks as available was an agricultural support facility sponsored by the Alliance for a Green
Revolution in Africa (AGRA).
The majority of the Ugandan banks mentioned that it was necessary for the Ugandan government
to come up with a comprehensive SME policy as there is currently no institutional framework to
support small businesses in the country. The means through which establishing such a policy
7 MSME Draft Bill of 2009.
8 Facilities mentioned include: The SME Fund from Business Partners International; the AGRA Fund; The Women
Fund and the Youth Enterprise Fund. Most Kenyan banks mentioned that the usefulness of such government
sponsored guarantees was doubtful as claims processing was very difficult.

16
framework are still under debate.9 Judicial inefficiencies were also mentioned, especially
regarding the enforcement of lender rights in cases where security lodged need to be liquidated.
Banks in Uganda were, however, very aware of government support facilities, especially those
intermediated through the Ugandan Development Bank and the Uganda Enterprise Fund.
The Zambian banks interviewed were of the opinion that the government was not as supportive
as it should be and therefore it would need to improve the regulatory framework. Guarantees
were mentioned as an important incentive provided by the government. The credit reference
bureau is also still in its infancy in Zambia and does not appear to influence bank decisions in
their dealings with SMEs.
3.5.Prudential regulation
Most of the banks interviewed (56 percent) were in agreement that, on the whole, prudential
regulatory requirements, especially capital adequacy and liquidity rules as detailed in their
respective countries’ prudential guidelines, had a generally positive impact on SME lending. On
the other hand, a quarter of the interviewed banks reported that the perceived impact of
prudential regulation on the SME loan market was neutral (see Figure 16). In particular, while
banks in Kenya, Tanzania and Uganda were of the opinion that the effects of the prudential
guidelines positively affected their dealings with SMEs, in Zambia the majority of banks
regarded the effect of regulation as neutral. Ugandan banks, however, brought up the issue of
“sectoral exposures” as having a negative impact on SME lending.
The positive or neutral perception of regulation might reflect the fact that most prudential
guidelines from central banks in the region attribute a low risk-weight on government-guaranteed
facilities and on facilities granted by development finance institution. Moreover, the relatively
small amounts of SME loans might help banks in managing single exposure requirements. The
general short-term nature of SME lending might also help banks in complying with their
liquidity requirements. Asked about the expected effect of the Basel capital framework on SME
lending, 44 percent of the banks reported that they do not know while 31 percent expected a
positive impact from the implementation of the capital accord. Only one bank in Kenya, or 6
percent of the total sample, was of the opinion that the Basel rules would have a negative impact
on both the cost and the volumes of SME financing.
A related area of prudential regulation perceived by the banks as having a negative impact on
SME lending is the definition of collateral, or what is accepted by regulators as a security. Banks
in the region complained about the relative inflexibility of the regulatory authorities in this area.
Half of the banks interviewed reported that the regulatory definition of collateral was
problematic. In Uganda, Tanzania and Zambia, the interviewed banks claimed that the only
security that was acceptable and available to SMEs under the prudential guidelines was to a large
extent property. The problem seems to be exacerbated by the fact that the majority of the banks
(56 percent) mentioned that, in addition to the seemingly narrow definition of acceptable security
under the prudential guidelines, the actual process of collateral registration was tedious and
cumbersome in some of the counties (see Figure 17).
9 The Ministry of Trade and Investment is spearheading the debate. The level and depth of consultation with the
private sector, specifically banks, was unknown at the time of the survey.

17
4. Banks’s practices in SME lending
This section describes how banks in the region actually deal with SMEs. In particular, we first
explore in detail the business models that banks have employed, with a particular emphasis on
organizational setups, client targeting mechanisms and product range. We then examine banks’
risk management practices by describing their risk analysis frameworks, the monitoring of
exposures and the management of nonperforming loans (NPLs).
4.1.Business models
4.1.1. Structure
The surveyed banks present two main organizational structures to serve the SME segment. The
first, typical of the smaller banks with a limited branch network, combines the work of sales
people with credit risk teams at the headquarters. The second, adopted by the larger and more
innovative banks, involves the establishment of a regional SME hub which acts as an
intermediary between the headquarters and the branch. The majority of the banks, however, did
mention that regardless of the model adopted most branches had a relationship manager to attend
to the basic needs of SME clients. This would in most instances involve interviewing potential
SME clients and collecting relevant data and documents which then would be forwarded either to
the headquarters or to the regional hub for further processing. This seems to imply a certain
degree of decentralization in the management of the commercial aspects of the relationship with
SME clients.
East African banks use branches to identify new clients. Branches are to a large extent
responsible for the sales function to SMEs. Eighty-eight percent of the banks stated that branches
normally use their depositing clients’ database as a source for scouting for new SME clients. The
actual implementation of the client scouting system differed from bank to bank, however. The
headquarters-based SME unit of some banks had a heavy oversight over the process, whilst some
banks gave their respective branch managers and/or branch SME business representatives a lot of
room in client identification and sourcing.
Three main types of activities remain centralized throughout the banks in the region. A total of
94 percent of the banks in the sample conducted all SME loan approvals from the headquarters.
In most cases, however, branches would collect documentation for onward transmission for
analysis and conduct some initial analysis to be then forwarded to headquarters for consideration.
The majority of risk management functions, including loan recovery, were also centralized to a
considerable degree, with 88 percent of the banks stating that the risk analysis was largely done
at the headquarters. Finally, 69 percent of the banks specifically mentioned that the NPL
recovery function was also centralized, although in this area the branches tend to complement the
headquarters (see Figure 18).
Most banks (63 percent) indicated that they do not specifically target a specific SME sector but
rather deal with all sectors of the economy. An even larger share of banks (88 percent) also
indicated that they do not have a particular geographic focus when targeting SMEs (see Figure
19). However, a geographic focus based on branch location was mentioned by 81 percent of the

18
banks. The actual client targeting is usually preceded by the SME being a client of the bank.
Some banks stated that the SME must have been a client for as long as three years before it can
be considered for loan products. Most banks (69 percent) stated that the client must have been
accessing deposit and cash management products, building a track record within the bank before
applying for a loan (see Figure 20).
In terms of criteria used by the banks to determine SME clients, the majority stated that the
financial viability of both the client and the transaction to be funded were critical in client
selection. Other factors considered important in customer selection were product needs and
exposure size, mentioned by 50 percent of the banks. This is confirmed by the fact that most
banks are increasingly structured their products to suit SME needs (see next section). Exposure
size is also important as most banks mentioned that they mainly use loan size and turnover as
criteria to determine SME clients (see Figure 21).
4.1.2. Products
The type of products offered to SMEs are generally standardized products, with 50 percent of the
banks confirming that they offer their SME clients largely standardized products and 38 percent
of the responding banks stating that they offer an equal proportion of standardized and tailored
products. Only two banks or 13 percent of the total sample offer products which are specifically
targeted at SMEs. Kenyan banks largely offer a mixture of standardized and tailored products
(50 percent), with one bank offering mostly tailored products. Indeed the majority of Kenyan
banks mentioned that their most popular SME products were non-traditional banking products
such as specific order and invoice financing. Only one Kenyan bank offered standardized
products to its SMEs. The majority of Tanzanian banks (75 percent) offer an equal amount of
standardized and tailored products, with one bank offering standardized products. In Uganda and
Zambia, the majority of the banks (75 percent) offer standardized products with one bank in
Uganda offering an equal amount of standardized and tailored products and one bank in Zambia
specifically offering its SMEs tailored products.
Overall, it seems to emerge a tendency to innovate in the SME lending market of the region.
Consistently with the general view that the SME segment is strategically important for East
African banks and that the market is increasingly competitive yet not saturated, banks are
prepared to invest in product development as they seek to pursue a strategy based on
differentiation (see Figure 22).
4.2.Risk Management
4.2.1. Risk analysis
Amongst the banks included in the survey, risk management systems are generally separate from
the sales function (81 percent of the banks) and, like the loan approval function, done at the
headquarters and overseen by a credit analyst (88 percent). However, risk management is
increasingly automated (see Figure 23). Half of the Kenyan, Ugandan and Zambian banks had
automated their risk assessment processes, with the remainder expressing their intention to do so
in the near future. Only Tanzanian banks had not automated their risk management processes at
all.

19
Scoring and rating models do not appear to be widely used within the region, with 69 percent of
the banks in the sample stating that they do not use these transaction technologies in any form. In
particular, none of the Kenyan and Tanzanian banks in the sample use scoring tools. On the other
hand, scoring models tend to be more widely used in Uganda and Zambia, with 75 percent and
50 percent of the banks, respectively, reporting the use of these systems or its current
implementation. It is worth noting that, with the exception of one bank, those using or
implementing SME scoring models are foreign banks. The weights given to scoring models in
the decision-making process differ from bank to bank, varying from 50 percent to 100 percent.
The input variables used for the scoring models are usually obtained from various sources
including internal sources, external sources and client submissions, with the main variables being
SME client credit track records, SME net worth and profitability.
4.2.2. Collateral requirements for SMEs
Ninety-four percent of the banks in the sample demand collateral from their SME borrowers.
Collateral requirements for SME loans are higher than for consumer loans, because SMEs’ credit
risk is usually more difficult to evaluate according to 63 percent of the banks. SMEs are also
considered riskier than other segments for half of the banks surveyed. Moreover, regulatory
collateral requirements, which are usually a function of the size of the loan, contribute to explain
why SMEs have to post more collateral relative to retail clients, according to one third of the
banks (see Figure 24).
The informality of SMEs came out as the main reason why banks in the region require SMEs to
lodge security relative to corporate clients, according to 56 percent of the sampled banks. Half of
the banks also mentioned that SMEs tend be more vulnerable to economic and political shocks
relative to corporate clients, and this would justify an extra layer of security from an SME
borrower. About half of the banks finally mentioned that the fact that SME-related information
was usually harder to evaluate (and sometimes unreliable) made them more likely to seek
collateral (see Figure 25).
4.2.3. Monitoring and credit risk exposure analysis
The vast majority of the banks in the sample (81 percent) used preventive triggers to monitor
loans granted to SMEs. Half of the banks reported that they also relied on the due diligence
recommendations from the relationship manager to determine which aspects to monitor and
when to monitor SME borrowers. Automatic triggers were not relied on for monitoring purposes
(see Figure 26).
In terms of observed variables, debts outstanding and repayments frequency were part and parcel
of the risk management process to monitor the performance of their SME clients for 81 percent
of the banks interviewed. Reports submitted by bank staff from regular visits and reports
submitted by clients themselves as per their loan reporting arrangements were also used as
preventive monitoring triggers for most banks (see Figure 27).
The majority of the banks interviewed stated that the responsibility of changing SME clients’
credit limits is vested in the structures at headquarters, which included the management credit
committee, the board credit committee, the chief risk officer, and credit managers in the credit
department. Only two banks stated that the original approving authority is the one with the

20
responsibility of changing a clients’ credit limit, depending on the internal delegation authority
structure. All the banks stated that they had the relevant IT systems in place to monitor changes
in clients’ exposures through management reports and comprehensive reviews done at various
intervals (monthly, quarterly, etc.). However, excesses can occur, especially in instances where
bank fees and interest charges are debited to the clients account. Otherwise, almost all the banks
concurred that excesses are strictly monitored, and if they do occur, the clients facility is
immediately reviewed and, if need be, measures immediately taken to ensure that clients operate
within their approved credit limits.
Eighty-one percent of the banks stated that they perform stress tests on their SME exposures in
one form or another. Currency risk and interest rate risk were the most common variables used in
the stress tests, although it appeared as if the pattern differed from country to country, depending
on recent experiences and possible sectoral specialization of the bank.
4.2.4. Management of nonperforming loans
The majority of the banks (56 percent) allow past SME losses to affect the pricing of future
loans, specifically interest rates. The effect can be felt at the level of the single SME or at the
level of the total SME loan portfolio. The rationale for impacting specific SME clients, according
to most banks, was that past losses on a specific SME would negatively affect the risk rating of
that particular client, and therefore increase the risk premium required from the client. If the
overall loan performance experience on the SME portfolio was poor, the whole portfolio would
then be affected, and the pricing would change to reflect the new risk/return trade-off. However,
the effect of past losses on capital requirements was not exactly similar to the effect of past
losses on pricing, with half of the banks claiming that past losses do not feed into their capital
requirements (see Figure 28).
The banks provided widely different practices on the number of days for a non-serviced loan to
be considered overdue. Some banks (19 percent of the sample) stated that one day was enough
for a loan to be considered overdue, whereas the majority (50 percent) reported that a loan is
considered overdue after 30 days being non-serviced, with the remainder considering between 60
and 90 days of non-servicing. There was also wide variance on the number of days taken for a
bank to suspend interest on a non-serviced loan, although the general consensus (75 percent of
the sampled banks) was 90 days. The banks in the region also advised that it took an average of
1.2 years to recover most SME loans, with the minimum period being 6 months and the
maximum two years. Most banks did not seem to be keeping track of the costs to recovering
SME loans, with one Kenyan bank quantifying it at about 5 percent of the outstanding loan
value, whilst another providing an estimate of USD 3,000 to recover a SME loan (see Table 2).
All the banks advised that they do keep track of losses on their SME portfolio, although the
actual recording and aggregation might not specifically be for the SME portfolio only. Also, 75
percent of the banks advised that they keep track of amounts recovered, even after a debt had
been written off. Forty-four percent of the banks reported that they keep track of the time taken
to recover a NPL and of the aggregate, i.e. at the portfolio level, recovery costs (see Figure 29).
The tendency in the recovery process of NPLs is to outsource the bulk of the activities to third
parties, with 81 percent of the banks reporting this practice (see Figure 30).

21
The NPL recovery process differs from bank to bank. When an SME is declared bankrupt, the
first action the bank takes in all instances is to call the clients. The call can either be just to
appraise the difficulties the SME client might be facing, or to actually try and obtain an
agreement for a repayment plan. Most banks (44 percent) leave the actual negotiations to a
second stage, whilst some (31 percent) at this stage send out letters of demand. The third action
generally requires that the debt be sent to the loan recovery unit (75 percent of the banks), with a
quarter of the banks interviewed commencing the legal process at this stage (see Figure 31).
5. Conclusions and policy recommendations
This paper presents the findings of a survey of SME lending with 16 banks in Kenya, Tanzania,
Uganda and Zambia. Although the banks interviewed were sometimes selective in the answers
and information they divulged, we believe the general findings of this paper offer a reliable
overview of the banks’ attitudes and perceptions towards SME financing in the four East African
countries.
Contrary to the general view that financial institutions are averse to SME finance, banks in the
sample countries are on the whole very keen to have SMEs as clients and are adapting their
internal systems to better serve this market segment. The results of the survey indicate that banks
consider the SME segment strategically important and are actively pursuing SMEs. The average
SME loan portfolio in the sample countries amounts to 37 percent of total loans to the private
sector.
Most banks in the region are aware of the importance of SMEs in their respective economies and
see the SME segment as an important pillar of their growth strategy in view of its profitability
and the cross-selling opportunities it offers. SMEs are pursued because of their perceived
attractiveness as a business proposition. The SME market is considered large, very competitive
and yet not saturated, with a positive outlook for further growth. Several constraints are,
however, holding back the further involvement of banks with SMEs in the region: inherent SME
characteristics (availability and reliability of information, informality, family-owned structures,
inability to post adequate collateral); recent interest rate and exchange rate instability; the
business regulatory framework, especially the KYC requirements; the legal and contractual
environment, particularly judicial inefficiencies; a rather inorganic government approach towards
this crucial segment of the economy; prudential regulation, in particular the requirements in the
area of collateral; and some bank-specific factors.
Banks in the region have developed coping mechanisms to overcome the obstacles which
discourage them from entering the SME segment. Most banks have established separate units to
be more responsive to the needs of their SME clients, in recognition of the inherent differences
between SMEs and consumer and corporate clients. Some of them are allocating resources to
provide training to their SME clients to improve their management skills and financial reporting.
Though loan products remain largely standardized, there is an observable trend towards
increasing tailoring, and banks are pursuing innovation and differentiation as a part of their SME
strategy. Lending remains overall based on collateral. Risk management is increasingly
automated though banks, with the exception of foreign-owned institutions, have not yet
embraced on a large scale the use of scoring and risk-rating technologies.

22
All this suggests that banks in the region seem to have embraced the SME segment
enthusiastically and are making substantial investments to develop their relationship with SME
clients. This holds good promise to contributing to close the “SME financing gap” which
characterizes Sub-Saharan Africa, including East Africa, compared to other developing regions.
It is, therefore, important that this trend is supported and encouraged by removing those
institutional and policy obstacles that constrain SME lending.
A necessary condition for the sustainable growth of the SME lending market in the region is the
presence of a stable macroeconomic environment and a predictable policy regime. The findings
of the paper suggest that banks in the region are pursuing the SME segment because of its
attractiveness, despite important constraints. In order to ensure that this trend continues
uninterrupted, strong macroeconomic performance and a stable and consistent fiscal and
monetary framework have been identified as important considerations. It is also important that
countries in the region continue their efforts to modernize their financial systems, including the
prudential regulatory framework, enhancing competition and innovation so as to give rise to
alternative financing providers and financial solutions to better serve the SME segment.
Reforming the legal and regulatory environment might contribute to increase banks’ involvement
with SMEs. A first area of intervention might be the legal framework for creditor rights and for
secured lending. Efficiency of the courts and issues surrounding the definition of collateral have
been listed as important constraints to the development of the SME lending market. Targeted
interventions on the relevant legislation might contribute to speed up enforcement procedures
and improve the efficiency of the judiciary. For SMEs, what constitutes acceptable collateral is
also an important issue. Reforming the legal framework for secured lending and reviewing the
regulatory treatment of collateral would facilitate SMEs to pledge a wider share of their assets as
a guarantee for their borrowings. Finally, governments might explore the possibility of
introducing a simplified company registration process, which takes into consideration the
peculiarities of SMEs compared to larger companies.
There is also room for optimizing the role of the governments in the region. Current government
programs in the SME space are perceived as generally insufficient in supporting the growth of
the market. This might be due to the lack of consistency. Governments might therefore consider
introducing a dedicated and organic SME policy to boost this segment. A first start should be the
adoption of a uniform definition of SME. Most of the banks in the sample countries use loan size
and turnover as criteria to define SMEs. The adoption of such criteria and their formalization into
relevant legislation might ease the attainment of policy objectives in this area. A second area of
intervention might include the optimization of current financing support mechanisms, including
national and regional development finance institutions, by focusing on additionality and on
developing new instruments. In this respect, an assessment of their mandate and their
development effectiveness would help fine tune a policy review in this area.
Finally, a better understanding of the SME segment and the implementation of measures aimed
at addressing some of their intrinsic weaknesses should be a further policy priority. Given the
crucial importance attributed by banks to SME-specific constraints, priority might be given for
example to the collection of statistics and data on their characteristics in order to better
understand the demand-side perspective, which is equally important in the development of the

23
SME lending market. Measures in this domain might include the scaling up of capacity building
programs and the introduction of incentives for SMEs to formalize.
References
Ayyagari, M., T. Beck, and A. Demirgüç-Kunt, 2007. “Small and Medium Enterprises across the
Globe”, Small Business Economics 29, 415–434
Beck, T., A. Demirgüç-Kunt, and M.S. Martinez Peria, 2010. “Bank Financing for SMEs:
Evidence Across Countries and Bank Ownership Types”, Journal of Financial Services Research
39, 35-54
Beck, T., A. Demirgüç-Kunt, and V. Maksimovic, 2005. “Financial and Legal Constraints to
Firm Growth: Does Firm Size Matter?” Journal of Finance 60, 137–177
Beck, T., A. Demirgüç-Kunt, L. Laeven, and V. Maksimovic, 2006. “The Determinants of
Financing Obstacles”, Journal of International Money and Finance 25, 932–952
Beck, T., Demirguc-Kunt, A., and Martinez Peria, M., 2008. “Bank Financing for SMEs around
the World: Drivers, Obstacles, Business Models, and Lending Practices”, World Bank Policy
Research Working Paper 4785. The World Bank, Washington DC
Consultative Group to Assist the Poor, 2010. “Financial Access 2010. The State of Financial
Inclusion through the Crisis”. The World Bank, Washington DC
De la Torre, A., M. S. Martinez Peria, and S. Schmukler, 2010. “Bank Involvement with SMEs:
Beyond Relationship Lending”, Journal of Banking and Finance 34, 2280–2293
Pittsburgh G-20 Summit, 2009. “Leaders’ Statement.” http://www.pittsburghsummit.gov
Rocha, Roberto, Farazi, Subika, Khouri, Rania and Pearce, Douglas, 2011. “The Status of Bank
Lending to SMEs in the Middle East and North Africa Region: The Results of a Joint Survey of
the Union of Arab Bank and the World Bank”, World Bank Policy Research Working Paper
5607. The World Bank, Washington DC
Schiffer, M. and B. Weder, 2001. “Firm Size and the Business Environment: Worldwide Survey
Results”. IFC Discussion Paper, 43. The World Bank, Washington DC
Stephanou, C. and Rodriguez, C., 2008. “Bank Financing to Small- and Medium-Sized
Enterprises (SMEs) in Colombia”, World Bank Policy Research Working Paper 4481. The
World Bank, Washington DC
World Bank, various years. “Enterprise Analysis Surveys”. The World Bank, Washington DC.
http://www.enterprisesurveys.org/

24
ANNEXES
Table 1: Definition of SME used by banks
Turnover Loan Amount
(USD) Minimum Maximum Minimum Maximum
Kenya 300,000 25,000,000 5,000 1,500,000
Tanzania - 1,750,000 600 8,800,000
Uganda 53,500 20,000,000 - 18,000
Zambian 1,000,000 25,000,000 - 10,000,000
Table 2: NPL practices and experiences % Share of
loans recovered Days a non-serviced loan considered overdue
Days a non-serviced loan is reclassified as non-accrual
Years to recover an NPL
Costs to recover
Average 60 31.2 days 116 days 1.15 years US$3,000
Maximum 85 90 days 365 days 6 months 5% of loan value
Minimum 15 1 day 90 days 2 years
Responding banks
2 banks 15 banks 14 banks 10 banks 2 banks
Figure 1: Criteria used to define SMEs
This figure shows the criteria that surveyed banks in Kenya, Tanzania, Uganda and Zambia use to determine their
SME clients. Banks were asked: “Specifically provide your bank’s definition for Small and Medium Enterprises”.
69% 69%
19%
13%
6%
0%
10%
20%
30%
40%
50%
60%
70%
80%
Loan size Turnover Staff Size Capital Income to bank

25
Figure 2: Banks’ involvement with SMEs
This figure shows that all the banks in the sample have SMEs among their clients and that the relationship
established with them is managed through a dedicated unit. Banks were asked: "Does the bank currently have SMEs
among its clients?" and “Does the bank currently have a separate unit managing the banking relation with SMEs?”
Figure 3: Average SME loans and deposits by country
The information shown in this figure is derived from the data we collected from banks. Banks provided information
regarding both the amount of loans offered to SMEs and the amount of deposits collects from SMEs. Banks were
asked to provide the average percentage share of SME loans and deposits relative to total loans to and deposits from
the private sector.
100%
0%
75%
25%
0%
10%
20%
30%
40%
50%
60%
70%
80%
90%
100%
Yes No Yes No
SMEs as Clients Separate unit Managing SMEs
50%
37%
42%
18%
49%
28% 32%
14%
0%
10%
20%
30%
40%
50%
60%
Kenya Tanzania Uganda Zambia
Loans
Deposits

26
Figure 4: Drivers of banks’ involvement with SMEs
For Figure 4 banks were asked: “To what degree is your involvement with SMEs driven by the following?: i)
Perceived profitability in the SME segment, ii) Intense competition for large corporations, iii) Intense competition
for retail customers, iv) Excessive exposure to large corporations, v) Excessive exposure to retail customer service,
vi) Possibility to seek out SMEs through existing relations with large clients (e.g. reverse factoring), and vii) Other”.
The figure shows the percentage of banks that consider these factors important.
Figure 5: Kenya Banks – Obstacles to SME lending
Banks were asked to indicate to what degree the SME-specific factors observed in the figure are important obstacles
to their exposure to SMEs. This figure shows the percentage of Kenyan banks that consider each factor significant.
For Figure 5 banks were asked: "Indicate to what degree the following factors are important obstacles to their
exposure to SMEs. i) Scoring is inadequate; ii) Informality; iii) Lack of quality information; iv) Cannot evaluate
SMEs based on behaviour; v) Costs to improve information are high; vi) Family management; vii) Lack of adequate
guarantees".
0%
10%
20%
30%
40%
50%
60%
70%
80%
Kenya
Tanzania
Uganda
Zambia
All Banks
100%
50%
25%
75%
25% 25%
0%
10%
20%
30%
40%
50%
60%
70%
80%
90%
100%
Lack of Info Scoring Informal Family
Mngmt
Evaluation Costs
27
Figure 6: Uganda Banks – Obstacles to SME lending
Banks were asked to indicate to what degree the SME-specific factors observed in the figure are important obstacles
to their exposure to SMEs. This figure shows the percentage of Ugandan banks that consider each factor significant.
For Figure 6 banks were asked: "Indicate to what degree the following factors are important obstacles to their
exposure to SMEs. i) Scoring is inadequate; ii) Informality; iii) Lack of quality information; iv) Cannot evaluate
SMEs based on behaviour; v) Costs to improve information are high; vi) Family management; vii) Lack of adequate
guarantees".
Figure 7: Tanzania Banks – Obstacles to SME lending
Banks were asked to indicate to what degree the SME-specific factors observed in the figure are important obstacles
to their exposure to SMEs. This figure shows the percentage of Tanzanian banks that consider each factor
significant. For Figure 7 banks were asked: "Indicate to what degree the following factors are important obstacles to
their exposure to SMEs. i) Scoring is inadequate; ii) Informality; iii) Lack of quality information; iv) Cannot
evaluate SMEs based on behaviour; v) Costs to improve information are high; vi) Family management; vii) Lack of
adequate guarantees".
100%
25% 25%
0%
50%
25%
0%
10%
20%
30%
40%
50%
60%
70%
80%
90%
100%
Lack of Info Scoring Informal FamilyMngmt
Guarantees Costs
75%
0%
100%
0%
25%
0% 0%
10%
20%
30%
40%
50%
60%
70%
80%
90%
100%
Lack of Info Scoring Informal Family
Mngmt
Guarantees Costs

28
Figure 8: Zambia Banks – Obstacles to SME lending
Banks were asked to indicate to what degree the SME-specific factors observed in the figure are important obstacles
to their exposure to SMEs. This figure shows the percentage of Zambian banks that consider each factor significant.
For Figure 8 banks were asked: "Indicate to what degree the following factors are important obstacles to their
exposure to SMEs. i) Scoring is inadequate; ii) Informality; iii) Lack of quality information; iv) Cannot evaluate
SMEs based on behaviour; v) Costs to improve information are high; vi) Family management; vii) Lack of adequate
guarantees".
Figure 9: Business regulatory obstacles to SME lending
Banks were asked to indicate to what degree the business regulatory factors observed in the figure are important
obstacles to their exposure to SMEs. This figure shows the percentage of banks in the sample that consider each
factor significant. For Figure 9 banks were asked: "Indicate to what degree the following factors are important
obstacles to their exposure to SMEs. i) Too much documentation required; ii) Ceiling rates; iii) Inflexibility; iv)
Financial transaction taxes / Stamp tax; v) Obstacles in foreign exchange transactions; vi) Regulation forces banks to
act as tax authorities".
75% 75%
0% 0% 0% 0% 0%
10%
20%
30%
40%
50%
60%
70%
80%
Lack of Info Scoring Informal Family
Mngmt
Evaluation Costs
50%
6%
44%
6%
13%
0%
10%
20%
30%
40%
50%
60%
Too much
docs
Ceiling
rates
Inflexibility Fin Taxes Tax Issues

29
Figure 10: Obstacles: legal and contractual environment
Banks were asked to indicate to what degree the factors related to the legal and contractual environment observed in
the figure are important obstacles to their exposure to SMEs. This figure shows the percentage of banks in the
sample that consider each factor significant. For Figure 10 banks were asked: "Indicate to what degree the following
factors are important obstacles to their exposure to SMEs. i) Judicial inefficiency; ii) Judicial insecurity / dependent
on politics; iii) Bankruptcy process very costly; iv) Lack of contract enforcement".
Figure 11: Obstacles: nature of SME lending
Banks were asked to indicate to what degree SME-related factors are important obstacles to their exposure to SMEs.
This figure shows the percentage of banks in the sample that consider each factor significant. For Figure 11 banks
were asked: "Indicate to what degree the following factors are important obstacles to their exposure to SMEs. i)
Costly technology; ii) Difficult to standardize risk management (scoring and rating); iii) Need to adapt commercial
model; iv) Difficult to standardize products and procedures; v) High entry costs".
50%
19%
13%
25%
0%
10%
20%
30%
40%
50%
60%
Judicial
Inefficency
Judicial Insecurity Bankruptcy Costs Lack of Contract
Enforcement
13%
50%
44%
38%
13%
0%
10%
20%
30%
40%
50%
60%
Costly
Technology
Can not
standardize risk
model
Must adapt
commercial
model
Can not
standardize
products &
prcedures
High entry
costs

30
Figure 12: Obstacles: bank-specific factors
Banks were asked to indicate to what degree the bank-specific factors observed in the figure are important obstacles
to their exposure to SMEs. This figure shows the percentage of banks in the sample that consider each factor
significant. For Figure 12 banks were asked: "Indicate to what degree the following factors are important obstacles
to their exposure to SMEs. i) Some banks are new to the segment; ii) Inefficiency; iii) Lack of technology and
qualified personnel; iv) Lack of expert analyst in commercial and risk sectors; v) Limited geographic presence".
Figure 13: Some of the factors affecting bank involvement with SMEs
The figure shows the percentage of banks in the sample that considers the factors observed important in driving their
involvement with SMEs. Banks were asked about their perceptions of the SME lending market environment.
Specifically, banks were asked the following questions: “Have there been significant changes over time in bank
SME lending in terms of competition?”; “Do you lend to SMEs after seeing other banks do so?”; “Is there a first
movers’ advantage?”
13%
31%
44%
19% 19%
0%
5%
10%
15%
20%
25%
30%
35%
40%
45%
50%
Bank new to
segment
Inefficiency No technology
& skilled staff
No risk
analysts
Limited
presence
88%
13%
63%
6%
81%
31%
0%
10%
20%
30%
40%
50%
60%
70%
80%
90%
100%
Changes in
competition
Following others First Mover advantage
Yes
No

31
Figure 14: Market structure
This figure analyzes the SME lending market structure and the main players in the market as perceived by banks.
For Figure 14 banks were asked: "What is the market structure of the SME loan market?”
Figure 15: Main players in the SME lending market
This figure analyzes the SME lending market structure and the main players in the market as perceived by banks.
For Figure 15 banks were asked: "Who are the main players in the SME loan market?”
25%
56%
6%
0%
10%
20%
30%
40%
50%
60%
Small No Segmented Atomized
19%
69%
31%
25%
6%
31%
0%
10%
20%
30%
40%
50%
60%
70%
80%
Small Banks Large Banks Niche Banks Public
Banks
Foreign
Banks
Others

32
Figure 16: Impact of prudential guidelines
This figure shows the perception of the impact of prudential regulation on banks’ dealing with SMEs. For Figure 16
banks were asked: "How does prudential regulation affect your involvement with SMEs?”
Figure 17: Issues regarding collateral
This figure analyzes a particular aspect of the impact of the prudential regulatory framework, i.e. collateral
requirements, as perceived by banks. For Figure 17 banks were asked: "Does the regulatory definition of secured
loans (in terms of collateral) inhibit SME lending?” and “Are there regulatory issues in registering collateral that
inhibit SME secured lending?”
56%
0%
25%
0%
10%
20%
30%
40%
50%
60%
Positive Negative Neutral
50%
31%
56%
25%
0%
10%
20%
30%
40%
50%
60%
Yes No Yes No
Collateral Definition Collateral Registration

33
Figure 18: Business model: centralized aspects
This figure presents the percentage of banks that have specific aspects of SME lending centralized. The activity is
considered to be centralized when it is done only or primarily at headquarters. Some banks conduct these activities
both at headquarters or branches, but these results are not presented. The percentages shown are from the aggregated
sample. For Figure 18 banks were asked: "What aspects of the SME banking business are centralized?"
Figure 19: Business model: area of focus
This figure indicates that most banks interviewed do not have either a sector-specific or a geographic focus in their
relation with SMEs. For Figure 19 banks were asked: "Does the bank have a sector-specific focus in dealing with
SMEs?" and "Does the bank have a specific geographic focus in dealing with SMEs?"
6%
94% 88%
69%
6%
0%
10%
20%
30%
40%
50%
60%
70%
80%
90%
100%
Loan pre-
screening
Loan approval Risk
Management
NPL recovery Sale of other
products
38%
63%
13%
88%
0%
10%
20%
30%
40%
50%
60%
70%
80%
90%
100%
Yes No Yes No
Any specific SME sector? Any specific Geographic area?

34
Figure 20: Business model: methods used to identify new SME Clients
This figure illustrates the mechanisms and the criteria that banks use to determine their potential SME clients. Figure
20 shows the percentage of banks that use each source to identify potential SME clients. For Figure 20 banks were
asked: "How do you identify potential SME clients?"
Figure 21: Business model: criteria to determine SME clients
This figure illustrates the mechanisms and the criteria that banks use to determine their SME target market Figure 21
shows the percentage of banks that use each criterion to target SMEs. For Figure 21 banks were asked: "Which
particular criteria does the bank use to determine the SMEs it will target?"
38%
75%
13%
81%
44%
0% 0%
10%
20%
30%
40%
50%
60%
70%
80%
90%
Clients of
existing big
clients
Existing
Deposit
clients
Clients in
need of
credit
Located near
branches
Databases Attached to
staff
31%
56%
25%
50%
25%
6%
50%
0%
10%
20%
30%
40%
50%
60%

35
Figure 22: Business model: products offered
Banks were asked to indicate whether they offer their SME clients standardized or tailored products. This figure
shows the percentage of banks that select each of the options presented. In particular, for Figure 22 banks were
asked: “Are SMEs offered standardized or tailored products? i) Mostly standardized products; ii) Similar proportion
of standardized and tailored products; iii) Mostly tailored products”.
Figure 23: Risk management systems
Banks were asked to describe the organization of credit risk management. This figure shows the percentage of banks
that answer affirmatively or negatively to different options available regarding the structure of their risk
management for the SME segment. For Figure 23 banks were asked: “How is the credit risk management function
organized in your bank? i) Is it largely automated?; ii) Is it done by a credit risk analyst?; iii) Is it separate from
sales?; iv) Is it done primarily at headquarters?”.
50%
38%
13%
0%
10%
20%
30%
40%
50%
60%
Standardized Standardized/Tailored Tailored
38%
56%
88%
6%
81%
13%
88%
13%
0%
10%
20%
30%
40%
50%
60%
70%
80%
90%
100%
Yes No Yes No Yes No Yes No
Automated? Done by Analyst? Seprate from
sales?
Done at Head
Office?

36
Figure 24: Risk management: collateral (1)
This figure analyzes collateral requirements for SMEs. For Figure 24 banks are asked: “To the extent that collateral
requirements are higher for SMEs than for consumers, indicate which of the reasons below apply: i) Default
probability harder to evaluate; ii) Larger loans; iii) Risk more difficult to diversify; iv) Collateral more difficult to
seize v) More risky”.
Figure 25: Risk management: collateral (2)
This figure analyzes collateral requirements for SMEs.For Figure 25 banks were asked: “To the extent that collateral
requirements are higher for SMEs than for large corporations indicate which of the reasons below apply: i) More
unstable; ii) Harder to evaluate; iii) Worse management; iv) More informal; v) Harder to prosecute; vi) Collateral
harder to seize”.
63%
31%
13%
6%
50%
0%
10%
20%
30%
40%
50%
60%
70%
Default harder
to evaluate
Larger loans Risk difficult
to diversify
Collateral
dufficult to
seize
More Risky
50%
44%
6%
56%
6%
0% 0%
10%
20%
30%
40%
50%
60%
More
unstable
Harder to
evaluate
Worse
Management
More
informal
Harder to
prosecute
Collateral
harder to
sieze

37
Figure 26: Monitoring methods
This figure describes how banks monitor credit risk outlook and the main items on which they rely. For Figure 26
banks were asked: “Which of the following items are monitored by the bank? i) Preventive triggers monitored; ii)
Triggers automatically generated; iii) Depends on the diligence of Relationship Manager or credit analyst”.
Figure 27: Variables monitored
This figure describes how banks monitor credit risk outlook and the main items on which they rely. For Figure 26
banks were asked: “Which of the following items are monitored by the bank? i) Total debt outstanding; ii)
Repayment frequency; iii) Evergreens in overdraft lines; iv) Deterioration of cash flow; v) Regular visits to SME;
vi) Regular reporting from SME; vii) Switching practices; viii) Outstanding exposure”.
81%
0%
50%
0%
10%
20%
30%
40%
50%
60%
70%
80%
90%
Preventive triggers Automatic Triggers DD of RM
81% 81%
19%
31%
44%
19% 25%
31%
0%
10%
20%
30%
40%
50%
60%
70%
80%
90%

38
Figure 28: Management of NPLs: the effect of past losses on interest rates and capital
This figure illustrates the fact that banks have yet to develop uniform mechanisms to incorporate information
regarding SME losses in estimates of SME lending. For Figure 28 banks are asked: "Do past losses feed into some
model/estimate of minimum interest rate spread to cover expected losses?" and "Do past losses feed into some
estimate of capital requirements?"
Figure 29: NPLs: aspects tracked
Banks were asked how they manage impaired loans. The figure shows the percentage of banks responding to the
following Yes/No questions. For Figure 29 banks were asked: “Do you keep track of the loss given default on
SMEs?” “Do you systematically keep track of the amounts recovered vs. amounts under default?” “Do you keep
track of the length of time it takes to recover a non-performing loan?” and “Do you keep track of the costs to recover
a non-performing loan?”
56%
38% 38%
50%
0%
10%
20%
30%
40%
50%
60%
Yes No Yes No
Interest Rates? Capital Requirements?
75%
0%
75%
6%
44%
31%
44%
38%
0%
10%
20%
30%
40%
50%
60%
70%
80%
Yes No Yes No Yes No Yes No
Track losses Track amounts
recovered
Time to recover an
NPL
Track Costs

39
Figure 30: NPLs: administrative structure
Banks were asked to describe the organization of their NPL recovery function. For Figure 30 banks were asked: “Do
you have a dedicated SME loan recovery unit?” and “Do you outsource the SME loan recovery operations?”
Figure 31: NPL recovery process
Banks were asked to describe the main phases of the recovery process. For Figure 31 banks were asked: “What are
the top three actions typically taken once an SME debtor is declared bankrupt?”
31%
63%
81%
6%
0%
10%
20%
30%
40%
50%
60%
70%
80%
90%
Yes No Yes No
Separate Unit? Outsource?
38% 38%
13%
44%
6%
31%
25%
75%
0%
10%
20%
30%
40%
50%
60%
70%
80%
Cal
l
Ob
tain
Ag
reem
ent
Ass
ess
Neg
oti
ate
Rec
ov
ery U
nit
Sen
d L
ette
r
Com
men
ce L
egal
Rec
ov
ery u
nit
First Action Second Action Third Action

40
Recent Publications in the Series
nº Year Author(s) Title
145 2012 Jeremy D. Foltz and Ousman Gajigo Assessing the Returns to Education in the Gambia
144 2012 Gabriel Mougani
An Analysis of the Impact of Financial Integration on
Economic Activity and Macroeconomic Volatility in Africa
within the Financial Globalization Context
143 2011 Thouraya Triki and Olfa Maalaoui Chun Does Good Governance Create Value for International
Acquirers in Africa: evidence from US acquisitions
142 2011 Thouraya Triki and Issa Faye Africa’s Quest for Development: Can Sovereign Wealth
Funds help?
141 2011 Guy Blaise Nkamleu, Ignacio Tourino and
James Edwin
Always Late: Measures and Determinants of Disbursement
Delays at the African Development Bank
140 2011
Adeleke Salami, Marco Stampini, Abdul
Kamara, Caroline Sullivan and Regassa
Namara
Development Aid and Access to Water and Sanitation in
sub-Saharan Africa
139 2011 Giovanni Caggiano and Pietro Calice The Macroeconomic Impact Of Higher Capital Ratios On
African Economies
138 2011 Cédric Achille Mbeng Mezui
Politique Economique Et Facteurs Institutionnels Dans Le
Développement Des Marchés Obligataires Domestiques De
La Zone CFA
137 2011 Thierry Kangoye Does Aid Unpredictability Weaken Governance?
New Evidence from Developing Countries

41