Embed Size (px)
Citation preview
1
Final Report
AN EVALUATION OF BSCIC INDUSTRIAL ESTATES
Study Team
Monzur Hossain (Team Leader) Harunur Rashid Bhuyan
Iqbal Hossain Marjan Hossain
Submitted to
Bangladesh Small and Cottage Industries Corporation (BSCIC)
June 14, 2018
Prepared by
Bangladesh Institute of Development Studies (BIDS)

i
Table of Contents
Acknowledgement ...................................................................................................................... v
Abbreviations and Acronyms ..................................................................................................... vi
Executive Summary .................................................................................................................. 7
Chapter 1: Introduction .............................................................................................................. 1
1.1 Introduction ...................................................................................................................................... 1
1.2 Objectives of the study .................................................................................................................. 1
1.3 Design of the Study: ....................................................................................................................... 2
1.3.1 The Data ................................................................................................................................... 2
1.3.2 Qualitative Survey ................................................................................................................... 6
1.4 Methods of Analysis .................................................................................................................. 8
1.5 Field Work, Data Management and Quality Control ................................................................ 8
1.6 Organization of the Report ............................................................................................................ 9
Chapter 2: About BSCIC ..........................................................................................................10
2.1 Human Resource structure of BSCIC ....................................................................................... 10
2.2 Activities of BSCIC ....................................................................................................................... 11
2.2.1 Managing Industrial Estates ................................................................................................ 11
2.2.3 BSCIC’s Target Based Activities ......................................................................................... 12
2.3 BSCIC’s Industrial Estate Program ............................................................................................ 14
2.4 Estate Management structure .................................................................................................... 14
Chapter 3: An Overview of BSCIC Industrial Estates ...............................................................17
3.1 Industrial Estates and its objectives ........................................................................................... 17
3.2 Overview of industrial estate ....................................................................................................... 18
3.3. Profile of the industrial estates: Survey Findings ................................................................... 25
3.3.1 Sector-profile of the industrial units/enterprises ............................................................... 25
3.3.2 Size distribution of the industrial units/enterprises ........................................................... 26
3.3.3 Size distribution of the industrial units/enterprises ........................................................... 27
3.4 Performance of Estates ............................................................................................................... 27
3.4.1 Employment in BSCIC Estates ........................................................................................... 27
3.4.2 Investment .............................................................................................................................. 28
3.4.3 Land Utilization of the Estates ............................................................................................. 29
3.4.4 Ownership Transfer of the Enterprises .............................................................................. 30
3.5 Revenues and Expenditure of the Industrial Estates .............................................................. 31
3.6 Output-labor ratio in the estates ................................................................................................. 33
3.7 Summary of the findings .............................................................................................................. 36

ii
Chapter 4: Plot allotment, Infrastructural Facilities and Related Problems in BSCIC Industrial Estates ..................................................................................................................................... 37
4.1 Determination of location of estates .......................................................................................... 37
4.2 Infrastructure facilities .................................................................................................................. 38
4.3 Plot Allocation, and Entrepreneur Selection ............................................................................. 40
4.4 Emerging Demand for Plots ........................................................................................................ 42
4.5 Environmental Aspects ................................................................................................................ 44
4.6 Gender Issues ............................................................................................................................... 46
4.7 Business Related Problems and support from the Associations .......................................... 47
4.8 Sick industries ............................................................................................................................... 48
4.9 Summary of the findings: ............................................................................................................. 51
Chapter 5: Performance of Industrial Units within Estates ........................................................52
5.1 Basic characteristics of the firms: Ownership status ............................................................... 52
5.2 Education and business experience of owners: ...................................................................... 52
5.3 Age of firms and months of operation ....................................................................................... 53
5.4 Sector-wise distribution ................................................................................................................ 54
5.5 Establishments’ sub-contracting status ..................................................................................... 54
5.6 Employment and Wage ............................................................................................................... 55
5.7 Investment ..................................................................................................................................... 58
5.8 Production, Sales and Profit of Units ......................................................................................... 60
5.9 Efficiency indicators: .................................................................................................................... 63
5.10 Production capacity and Capacity utilization .......................................................................... 67
5.11 Access to Finance ...................................................................................................................... 67
5.12 Raw Materials procurement ...................................................................................................... 71
5.13 Marketing and Exports ............................................................................................................... 71
5.14 Major constraints faced by the firms ........................................................................................ 72
5.15 Training facilities ......................................................................................................................... 74
5.16 BSCIC services and Evaluation: .............................................................................................. 76
5.17 A comparative Analysis of the Performances of Estates ..................................................... 78
5.18 Summary of findings .................................................................................................................. 78
Chapter 6: Contribution of BSCIC Industrial Estates on National economy and Local Tertiary economy ..................................................................................................................................80
6.1 Contribution to national economy ............................................................................................... 80
6.2 Impact on Tertiary Economy ....................................................................................................... 81
Chapter 7: Summary and Conclusions .....................................................................................90
Appendix: ............................................................................................................................... 101
iii
List of Tables
Table 1. 1: The distribution of selected BSCIC estates for questionnaire survey ........................ 4 Table 1. 2: The size distribution of samples according to division and establishment period ...... 5 Table 1. 3: List of FGDS, PRA and KIIs by district and industrial estates ................................... 7 Table 3. 1: Industrial estates at a glance based on MIS-BSCIC Data ........................................19 Table 3. 2: Establishment status by implementation of BSCIC industrial estate ........................22 Table 3. 3: Establishment status by divisions ............................................................................23 Table 3. 4: Growth of industrial units and export oriented units by sectors ................................25 Table 3. 5: Sector wise % of firms in estates by division ...........................................................26 Table 3. 6: Size distribution of industrial units (enterprise) ........................................................27 Table 3. 7: Number of owned and rented units ..........................................................................27 Table 3. 8: Average BSCIC manpower of the industrial estate offices .......................................28 Table 3. 9: Proportion of vacant posts against the sanctioned by division and category ............28 Table 3. 10: Investment, production and return on investment (RoI), 1990-2017 .......................29 Table 3. 11: Land utilization by division .....................................................................................30 Table 3. 12: Ownership changes: Number and time required ....................................................31 Table 3. 13: Revenue items of the industrial estates of BSCIC .................................................32 Table 3. 14: Expenditure items of the industrial estates of BSCIC .............................................33 Table 3. 15: Revenue and expenditure items of the industrial estates of BSCIC .......................33 Table 4. 1: Location of industrial estate .....................................................................................37 Table 4. 2: Selection Criteria of the Place for the Current Estate ...............................................38 Table 4. 3: Infrastructure and Utilities ........................................................................................39 Table 4. 4: Problems of Infrastructure inside the Estate ............................................................39 Table 4.5: Reasons of Poor Maintenance of the Estate .............................................................40 Table 4. 6: Reasons for Allocating Plot to non-Entrepreneur .....................................................41 Table 4. 8: Reasons of Plots remaining unutilized .....................................................................42 Table 4. 9: New demand for the industrial unit ..........................................................................43 Table 4. 10: Demand for More Plots among Association Members ...........................................43 Table 4. 11: Type of Industries has Demand for More Plots ......................................................44 Table 4. 12: Solid and liquid Waste Production .........................................................................45 Table 4. 13: Solid and liquid Waste Disposal ............................................................................45 Table 4. 14: Air Pollution ...........................................................................................................46 Table 4. 15: Effluent Treatment Plant (ETP) and Central Effluent Treatment Plant (CETP) .......46 Table 4. 16: Dual Taxation Problem ..........................................................................................47 Table 4. 17: Problem of the Entrepreneurs ................................................................................48 Table 4. 18: Steps Taken from the Association to Solve the Problem of the Entrepreneur ........48 Table 4. 19: Top 12 industrial estate having higher rate of sick industrial units, 2017 ................49 Table 4. 20: Major reasons for becoming sick or shutdown of production..................................50 Table 5.1: Distribution of Establishments by Ownership Status(In percent): ..............................52
Table 5.2: Level of education and experiences of the owners ...................................................53 Table 5.3: Age of Establishments and Number of Days in Operations ......................................53 Table 5.4: Establishment distribution by size (In percent) ..........................................................54 Table 5.5: Establishments’ Sub-contracting status ....................................................................54 Table 5.6: Sub-contracted Establishment type (%) ....................................................................55 Table 5.7: Sources of machineries (%) .....................................................................................55 Table 5.8: Average Number of Employees by industry size.......................................................56 Table 5.9: Total persons engaged in all industries ....................................................................56 Table 5.10: Categorization by industry ......................................................................................57 Table 5. 11: Average working hours of employed workers ........................................................58

iv
Table 5. 12: Average salaries (taka) and experience of workers (years) ...................................58 Table 5. 13: Amount of Fixed Assets .........................................................................................59 Table 5. 14: Amount of current asset (million BDT) ...................................................................59 Table 5. 15: Asset-turnover ratio (firm and establishment wise) ................................................60 Table 5. 16: Average production (output) amount during the last 5 years (in million Tk.) ...........61 Table 5. 17: Average sales amount during last 5 years (in million Tk) .......................................62 Table 5. 18: Average profit rate (self-reporting) (last 5 years) (%) .............................................62 Table 5. 19: Efficiency indicators of firms ..................................................................................64 Table 5. 20: Input-output ratios by industry size, establishment period and sector ....................65 Table 5. 21: Gross Value Addition (GVA) by industry size, establishment period and sector .....66 Table 5. 22: Capacity Utilization ................................................................................................67 Table 5. 23: Sources of working capital/loan and last year investment (in million) .....................68 Table 5. 24: Loan information for firms (last year) .....................................................................68 Table 5. 25: Reasons for firms not to have applied for loans from formal institutions (%) ..........69 Table 5. 26: Access to financial services (needs to be redone for columns to be 100) ..............69 Table 5. 27: Sources of loan received in last year (%)...............................................................70 Table 5. 28: Types of collateral (%) ...........................................................................................70 Table 5. 29: Utilization of loan (%).............................................................................................70 Table 5. 30: Sources of raw materials (%) .................................................................................71 Table 5. 31: Share of products sold in local and export markets (%) .........................................72 Table 5. 32: Major constraints facing by the establishments (%) ..............................................72 Table 5. 33: Load shedding faced by establishments ................................................................73 Table 5. 34: Share of establishments facing difficulties during labor recruitment .......................73 Table 5. 35: Average number of days lost last year due the following unfavourable situations ..74 Table 5. 36: Existing training facilities and types (by establishment size) ..................................74 Table 5. 37: Ratio of workers receiving on the job training ........................................................75 Table 5. 38: Received training from BSCIC and their evaluation ...............................................75 Table 5. 39: Suggestions to improve the training provided by BSCIC (needs to be re-estimated) .................................................................................................................................................75 Table 5. 40: Average amount of service charge provided to BSCIC (Annual) ............................76 Table 5. 41: Evaluation of the service provided by BSCIC/Industrial State ................................76 Table 5. 42: Opinion about BSCIC facilities (% of establishment of response) ..........................77 Table 6.1: Production, export and employment of the BSCIC industrial estates, 2010-2017 .....81 Table 6.2: Shops within 1 Kilometer of BSCIC ..........................................................................84 Table 6.8: Backward Linkage Industries within 1 Kilometer of BSCIC .......................................87 Table 6.9: Forward Linkage Industries within 1 Kilometer of BSCIC ..........................................87 Table 6.10: Health Services within 1 Kilometer of BSCIC ..........................................................88 Table 6.11: Education Institutions within 1 Kilometer of BSCIC .................................................89
List of Figures
Figure 4.1: Plot Allocation Based on Influence .............................................................. 41
Figure 4. 2: Division wise number and percentages of sick/shutdown industrial units .. 49

v
Acknowledgement
I would like to thank BSCIC for giving BIDS the responsibility to conduct an evaluation of the BSCIC industrial estates. I express my sincere thanks and gratitude to Mr. Mustak Hassan Md. Iftekhar, Chairman, BSCIC for taking special interest in the study and for helping us in almost every stages of the work. I also thank all the Directors, especially Mr. Jiban Kumar Chowdhury, Director (Promotion & Extension) for their valuable inputs to the survey instruments and draft report. My sincere gratitude to Mr. Aminuzzaman, General Manager (Planning), and Ms.Shahina Shirin, Assistant General Manager (Planning), BSCIC for providing all the administrative support that we required. I also acknowledge that Md. Siraj Haque, Deputy Manager (Research), Mr. Md Jahagir Alam, Deputy Manager (Research), all ISC Chiefs and Industrial Estate officers provided us with the necessary information and support in administering the survey questionnaires. I am also grateful to all members of the research team who took special interest in this work. I thank Mr. Shajjad Hossain for his research assistance, particularly in data editing and analysis. Finally, especial thanks to all the Field Officers who worked incessantly to finish data collection in a very short period of time. Dr. Monzur Hossain Senior Research Fellow and Study Director Bangladesh Institute of Development Studies (BIDS)

vi
Abbreviations and Acronyms
BBS : Bangladesh Bureau of Statistics
BGB : Border Guards Bangladesh
BIDS : Bangladesh Institute of Development Studies
BSCIC : Bangladesh Small and Cottage Industries Corporation
CAGR : Compound Annual Growth Rate
CETP : Central Effluent Treatment Plant
CRM : Community Resource Mapping
DC : Deputy Commissioners
EPSCIC : East Pakistan Small and Cottage Industries Corporation
ETP : Effluent Treatment Plant
FGDs : Focus Group Discussions
GDP : Gross Domestic Product
GVA : Gross Value Added
HQ : Headquarter
ISC : Industrial Service Centres
ISCs : Industrial Service Centers
KIIs : Key Informant Interviews
MIS : Management information system
MoI : Ministry of Industries
NASCIB : National Association of Small and Cottage Industries of Bangladesh
PRA : Participatory Rural Appraisal
RIS : Rural Industries Service
ROI : Return on Investment
SCITI : Small and Cottage Industries Training Institute
SDC : Skill Development Centers
SDTC : Skill Development and Training Centers
SME : Small and Medium-sized Enterprises
SMI : Survey of Manufacturing Industry
TPE : Total Person Engaged
UN : United Nations
UNIDO : United Nations Industrial Development Organization
UNO : Upazila Nirbahi Officer
7
Executive Summary
BSCIC has made a long journey since 1957 with its mandated activities to expand the industrial
base through promoting small and cottage industries. Though BSCIC has been engaged in
various activities towards industrial development, no independent evaluation of BSCIC estates
has been done yet. With the instruction of the Prime Minister dated 24/8/2014, BSCIC has
requested Bangladesh Institute of Development Studies (BIDS) to make an evaluation of the
activities of BSCIC estates in order to identify the problems they face and a future way forward,
to strengthen its capacities and accomplish the mandated activities. In response to BSCIC’s
request, BIDS conducts an evaluation during September 2017 to March 2018. The specific
objectives of the evaluation are to: (i) Assess the infrastructure facilities of Industrial Estates,
capacity needs, policy relevance and constraints; (ii) Identify the constraints for better utilization
of the existing industrial estates and also the constraints for distribution and use of unutilized
plots in the industrial estates; (iii) Estimate economic and social impacts of industrial estates,
such as investment impact, employment impact, gross value added, technological innovations
and transfers, spillover impact, sustainability of the BSCIC industrial estate model etc.; (iv)
Assess whether the current industrial estate model of BSCIC is sustainable and it has
accomplished the mandated activities in line with the previous Industrial Policies; and (v) Future
policy directions for BSCIC industrial estates and alternative sustainability approaches.
Survey Instruments and Sample Size: The study applied both quantitative (structured
questionnaires) and qualitative (checklist) methods and approaches. We conducted an enterprise
survey of 500 firms from 25 randomly selected industrial estates and a census of 72 industrial
estates. In addition, we conducted 10 FGDs with industry owners/managers/officers/employees
and local community people. The study also conducted 139 Key Informant Interviews (KIIs) with
the selected president and members of respective district chamber associations, NASCIB
leaders, BSCIC district level officers, BSCIC Estate officials, local knowledgeable people and
Deputy Commissioners (DC) of the selected districts. The qualititative assessment was done to
understand land acquisition, resettlement and plot allotment processes among entrepreneurs,
institutional and management challenges, and other related social issues such as urbanization,
migration, gender issues and cultural resources. For land use, plot allotment and utilization, we
relied on BSCIC’s MIS Reports.
Manpower for estate management: BSCIC currently has a total of 4 regional offices, 64 district
offices, 74 industrial estates in 59 districts , 15 Skill Development and Training Centers (SDTC),
and 32 productions-cum-exhibition centers in 22 upazilas of 3 hill districts (Khagrachari,
Bandarban and Rangamati). The current number of approved BSCIC manpower is 2410 which
includes 947 officers and 1463 employees. About 35% of the posts in estate offices remained
vacant for a long time, and therefore it is necessary to rethink on how to improve estate
management affairs.
BSCIC Industrial Estates: A total of 76 industrial estates has been established so far, with 2
estates yet to be in operation. The estates were being established in six phases starting from
1960 and the latest phase being completed in 2010. A total of 1969 acres of land was utilized for
8
establishing 74 estates—of which 3.6% land was used for administrative and other purposes
(Mosques/bank/ Green space etc.) and 19% was used for roads and drainage system.
Plot allocation and utilization: A total of 10389 plots was developed in 74 estates, 96.8% of
which were being allotted to entrepreneurs. The average land size per plot is 0.19 acres and the
existing industrial units each acquired on an average, 1.7 plots. The estimated fixed asset
turnover ratios for some estates are very low indicating the inefficiencies from the part of
entrepreneurs in utilizing the fixed assets including allotted plots properly. During our personal
visit, in many cases, we observed that the allotted plots were not fully utilized in terms of the
production capacity of the firms. Therefore, it may be an important concern while allocating plots
in terms of the business plan of the entrepreneurs.
The latest MIS report of BSCIC suggests that among the allotted plots, about 22% of the allotted
plots remained unutilized (the rate is 27% including the un-allotted plots). Plot utilization rate is
the lowest in Barisal division (50%) and highest in Rajshahi division (95%). This huge amount of
unutilized plots is a big concern for BSCIC though in most cases the reasons for un-utilization is
beyond BSCIC’s control. In general, the low utilization is a culmination of several factors, including
weaknesses in enforceability of rules and regulations, problems in the selection process of
entrepreneurs while allocating plots, infrastructure bottlenecks (gas/electricity connection) etc.
As a substantial number of plots remained unutilized, it is important to identify the reasons behind
such non-utilization. Definitely, a faulty plot allotment process is one of the main reasons. Though
the majority of plots are being allotted fairly (as per about 66% KIIs), about 34% argued that plots
in the estates were allocated based on political and other interferences. From KIIs it is revealed
that, due to political interference (68.29%), a weak selection process (36.58%) and bribery
(34.15%), plots were being allotted to persons those who are not true entrepreneurs or to those
who did not have the intention to utilize the plots for industry. This has resulted in various problems
such as the plots being un-utilized and as a consequence, becoming sick. They also argued that
the initial screening for plot allocation needs to be strengthened by ensuring more participation of
local business communities and experts in the committee, in addition to BSCIC officials.
Sick industry: The annual compound growth rate of sick units has been estimated at about 4.4%.
The main reason cited for sickness is financial constraints, which is also a cause of concern, and
indirectly related to the entrepreneur selection problem.
Ownership change: About 300 firms change ownership every year and about 160 firms change
trade every year mainly from business viability concerns. However, the process takes about six
months due to BSCIC’s centralized decision making approach, which causes a loss to
entrepreneurs. The process thus needs to be revisited so that such changes can be approved in
a short-period of time, such as a maximum time period of 1-2 months.
Employment: The existing estates provide about 0.56 million employments with negligible growth
over time. Despite stagnant employment, production has been growing at a rate of 10% annually,
indicating increased productivity of the firms. About 21% of the firms are engaged in exporting,
and their export growth is about 5% annually. Among the enterprises in BSCIC estates, about
35% and 28% of the units are in the textile and agro-food processing sectors respectively. The
estimated Return on Investment (RoI) for BSCIC estates over time is found to be more than 1
indicating that the estates generate positive return on investment.
9
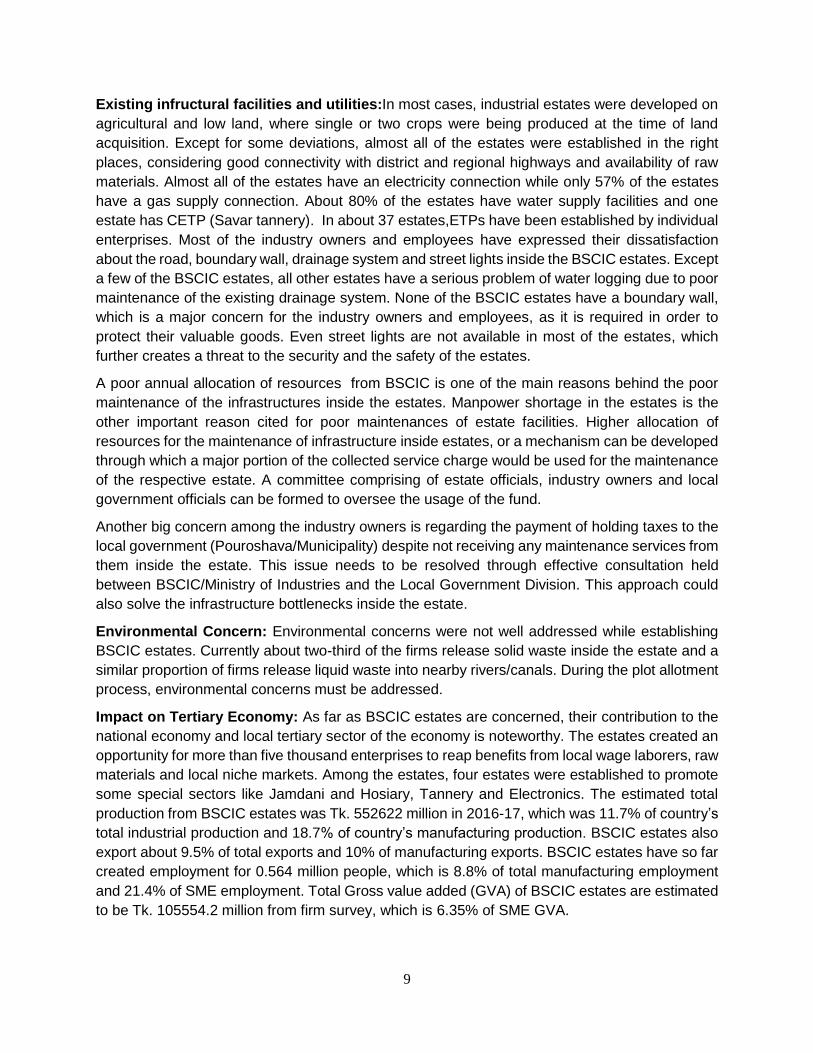
Existing infructural facilities and utilities:In most cases, industrial estates were developed on
agricultural and low land, where single or two crops were being produced at the time of land
acquisition. Except for some deviations, almost all of the estates were established in the right
places, considering good connectivity with district and regional highways and availability of raw
materials. Almost all of the estates have an electricity connection while only 57% of the estates
have a gas supply connection. About 80% of the estates have water supply facilities and one
estate has CETP (Savar tannery). In about 37 estates,ETPs have been established by individual
enterprises. Most of the industry owners and employees have expressed their dissatisfaction
about the road, boundary wall, drainage system and street lights inside the BSCIC estates. Except
a few of the BSCIC estates, all other estates have a serious problem of water logging due to poor
maintenance of the existing drainage system. None of the BSCIC estates have a boundary wall,
which is a major concern for the industry owners and employees, as it is required in order to
protect their valuable goods. Even street lights are not available in most of the estates, which
further creates a threat to the security and the safety of the estates.
A poor annual allocation of resources from BSCIC is one of the main reasons behind the poor
maintenance of the infrastructures inside the estates. Manpower shortage in the estates is the
other important reason cited for poor maintenances of estate facilities. Higher allocation of
resources for the maintenance of infrastructure inside estates, or a mechanism can be developed
through which a major portion of the collected service charge would be used for the maintenance
of the respective estate. A committee comprising of estate officials, industry owners and local
government officials can be formed to oversee the usage of the fund.
Another big concern among the industry owners is regarding the payment of holding taxes to the
local government (Pouroshava/Municipality) despite not receiving any maintenance services from
them inside the estate. This issue needs to be resolved through effective consultation held
between BSCIC/Ministry of Industries and the Local Government Division. This approach could
also solve the infrastructure bottlenecks inside the estate.
Environmental Concern: Environmental concerns were not well addressed while establishing
BSCIC estates. Currently about two-third of the firms release solid waste inside the estate and a
similar proportion of firms release liquid waste into nearby rivers/canals. During the plot allotment
process, environmental concerns must be addressed.
Impact on Tertiary Economy: As far as BSCIC estates are concerned, their contribution to the
national economy and local tertiary sector of the economy is noteworthy. The estates created an
opportunity for more than five thousand enterprises to reap benefits from local wage laborers, raw
materials and local niche markets. Among the estates, four estates were established to promote
some special sectors like Jamdani and Hosiary, Tannery and Electronics. The estimated total
production from BSCIC estates was Tk. 552622 million in 2016-17, which was 11.7% of country’s
total industrial production and 18.7% of country’s manufacturing production. BSCIC estates also
export about 9.5% of total exports and 10% of manufacturing exports. BSCIC estates have so far
created employment for 0.564 million people, which is 8.8% of total manufacturing employment
and 21.4% of SME employment. Total Gross value added (GVA) of BSCIC estates are estimated
to be Tk. 105554.2 million from firm survey, which is 6.35% of SME GVA.

10
BSCIC estates have important spill-over impacts on the local tertiary sector of the economy. We
find that various backward and forward linkage industries, markets and growth centers, shops,
educational institutions, health clinics and drug stores etc. were developed after the establishment
of the estate. A significant increase in housing and land prices is observed as a result of estate
development. Overall, BSCIC estate development created a positive spill-over effect on the local
economy.
Analyzing the performances of firms operating under the estates, we find that their performances
are comparable to the performances of SMEs at a national level and in some cases, BSCIC estate
firms’ performances are better than those that are located outside the estates. The better
performance of BSCIC estates can be attributed to the agglomeration of businesses, which
created various opportunities to share risks and returns.
From the above discussion, we may identify several problems or difficulties that the BSCIC
estates are now facing which need to be resolved on an urgent basis for the sake of better
industrialization. First, there is an overwhelming proportion of plots (over 22%) that are unutilized
(the rate is 27% including un-allotted plots). Second, poor maintenance of infrastructure inside
the estates is another problem which is related to fiscal constraints of BSCIC, and partly due to
the centralized system of decision making process. Third, the absence of a dedicated gas and
electricity supply and dynamism in the decision making process also hampers proper functioning
of the industrial units. Some recommendations are made below to resolve the problems.
Recommendations:
A. How to resolve current constraints:
The BSCIC needs to review all the constratints behind non-utilization of plots carefully and may take the following actions to enhance the existing plot utilization rate:
• Ensure adequate gas supply to each industrial unit before starting operation with permission from appropriate government authority;
• Establish a dedicated electricity supply line to every BSCIC estate so that uninterrupted electricity supply can be ensured;
• Need to build a boundary wall of each industrial estates and increase the number of street lights to improve the security situation of the estates;
• Need to increase the maintenance fund for improving the existing road and drainages to prevent waterlogging during rainy seasons. A certain portion of service charges received from an estate may be spent locally. We propose that a provision of 60% of total service charges received from an estate may be spent in that estate for its maintanence.
• Expedite administrative support services to entrepreneurs so that they can get permission on relevant issues timely.
• BSCIC may increase their credit facilities for the potential industrial units to ease their credit constraints. In that case, BSCIC may introduce a concessional credit line like the Credit Wholesale program (CWS) of SMEF through banks. BSCIC may request the government to allocate sufficient fund to extend CWS like credit line for easing credit constratints of SMEs;

11
• Need to provide assistance to the entrepreneurs to get quick environmental certificate and a bank loan;
• Fill out the vacant posts in the relevant estates to enhance the service delivery and efficient management of BSCIC estates.
B. A Sustainable Approach for Proper Maintenance of Estates
The current allocation for the maintenance of infrastructures like roads, drainage etc. in estates is quite inadequate and has led to widespread dissatisfaction among the entrepreneurs. For making estate management a sustainable and viable process, the following recommendations are made.
1. There is no denying that BSCIC estates have been suffering from inadequate maintainence of infrastructures, such as roads, drainage, boundary walls, street lights etc. Our findings suggest that the service charges that estates receive is quite insufficient to repair or reconstruct the above-mentioned infrastructure facilities. It is therefore important for the government to allocate one-time fund to improve infrastructures of all the estates. Along with, there should have a provision of yearly allocation of adequate O&M (operations and maintainence) fund for the estates. As already mentoned, 60% locally collected service charge may be allowed to spend locally for the purpose of O&M.
2. Once an estate is developed, we don’t see any necessity to have a BSCIC estate office inside an estate. Therefore, all estate offices can be merged with ISC and vacant estate office plots can be opened up for industrial plots. In this way, around 3.6% of total estate land can be made available for industrial plot allocation. This action will also reduce BSCIC’s operating costs for the estate office management.
3. For infrastructure maintenance of the estate, a registered estate association consisting of 5-10 industry owners with one observer from BSCIC, may be formed (by election) to oversee estate infrastructure and undertake actions to improve estate infrastructure and other related issues. BSCIC may prepare a guideline, which has to be followed by the Committee.
4. Once Estate maintenance is delegated to industry Owner’s association, the provision of annual service charge may be waived or reduced.
5. District offices will collect all other necessary fees, data and documents periodically from the estate. All administrative services (ownership transfer/trade change/cancellation etc.) may be rendered from the District BSCIC office (ISC).
C. Recovery of un-utilized Plots:
Considering the scare resource of land in a country like Bangladesh, it is un-expected that a substantial amount of serviced land remained unutilized. This un-utilization rate also poses a question to government’s initiatives towards promoting small and cottage industries. Therefore, to improve the plot utilization rate some time-bound measures can be undertaken.
Short-term measures (within one year):
1. An immediate assessment of the unutilized but allotted plots can be made in terms of three categories, such as (a) plots that are immediately recoverable, (b) plots that are in legal process but can be recovered in a year and (c) plots that are difficult to be recovered. Immediate measures should be taken to address the problems based on each category. On the other hand, the plots that could not be allotted yet needs further assessment. For example, estates in hilly districts have higher un-utilized (un-allotted) plots for which special incentives for entrepreneurs need to be designed so that they could come up to

12
establish industrial units. For hilly estates or other remote estates where plot allotment rate is low, incentives could be offered to the established and bigger industries who are in need of business expansion (For example, BRB cables) so that they could utilize those plots.
Medium-term measures (1-2 years):
2. A committee comprising of industrial association representatives, experts and academics can be formed to review BSCIC’s overall estate management and plot utilization issues. The proposed Committee will review the existing rules and regulations and propose to amend them in order to rectify the loopholes that the entrepreneurs use to keep the plots unutilized. Measures should be taken to improve the enforceability of rules and regulations.
3. Decentralization/delegation of power to local/regional BSCIC offices is also needed to expedite decision making process.
4. The initial screening of application is usually done by the BSCIC estate officer and the district officer after which the screened applications are placed for approval in the Allotment Committee headed by the Deputy Commissioner. It is therefore important to revise the application criteria as well as strengthen the initial screening committee of BSCIC. We recommend that at least three more persons including local business association representatives and experts may be added in the screening committee.
Longer-term measures (2-3 years period):
5. A one-stop service center at BSCIC office is a long standing demand of the MSMEs. Thus, a one-stop facility center needs to be established within next 2-3 years to support MSMEs of all BSCIC estates. We propose to establish one-stop service facility center in all the regional BSCIC offices gradually. Initially, a one-stop center may be started in Dhaka.
6. Start-up Incubators for new entrepreneurs: A start-up incubator may be established in each estate for the new entrepreneurs. The costs of establishing start-up incubator may be shared by both BSCIC and new entrepreneurs. Before allowing new entrepreneurs to start their production/business independently, a provision or rule may be made to ask them to start their business in the incubator first and continue for two years. Upon satisfactory performance, they may be allowed to start their business independently in their own plots. About 10-20% of the plots may be used for establishing incubators with admissible facilities so that new entrepreneurs can get exposure to be graduated from the incubator.
7. Further expansion of BSCIC estates should be made based on the demand for industrial plots. As we have observed, the demand for plots is very high in some places but the demand is rather weak in many other places. We think that it is not a good idea to implement “one estate in one district” as this policy has not been proved to be effective in industrialization. Construction of indutrial estate must be based on the size of local market, better communications, availability of raw materials, availability of cheap labours etc. For the estates established in hilly districts in which most of the plots remain vacant need further attention. We feel that some incentive mechanism may be developed for the usage of these plots.
8. An alternative approach would be to allocate vacant plots to some bigger industries for immediate utilization of those plots.

13
D. Data and Reporting
BSCIC maintains an MIS of estate information based on the periodic reporting of estate offices. A comparison between our survey data and MIS data identified a substantial gap with underestimated figures reported in the MIS report (Table A8 in Appendix). Our survey reveals that estate offices do not collect information from enterprises, rather they collect data in an unprofessional ad-hoc way. So it is important to develop a sustainable approach of better data collection and reporting for a better representation of BSCIC estates performance and their contribution to the National Economy. A prescribed form may be developed for individual firms for the reporting of their performances to BSCIC district offices on a half yearly basis. The proposed Industry Owner’s Association could be made responsible to provide accurate information about firms’ performance and other related issues.
A. Dynamism in the industrial estate management
Finally, BSCIC should give utmost importance to recover unutilized plots and ensure their proper utilization. In many of the estates, gas and electricity connections are not dedicated and therefore, the estates do not generate adequate leverage to entrepreneurs. A big investment may be needed to ensure uninterrupted electricity and gas supply in BSCIC estates. Otherwise, the benefits of industrial estates would not be adequately tapped. If necessary, BSCIC may consider organizational restructuring to bring dynamism in the industrial estate management.
Furthermore, we recommend that BSCIC may think of carrying out a rigorous cost-benefit analysis of BSCIC industrial estates in order to grasp future sustainability of the estates.

1
Chapter 1: Introduction
1.1 Introduction
Bangladesh Small and Cottage Industries Corporation (BSCIC), is a statutory body operating
under the Ministry of Industries (MoI). It was created in 1957 in order to support small and cottage
industries in the country. BSCIC, then called East Pakistan Small and Cottage Industries
Corporation (EPSCIC), was established by an Act of the Parliament in 1957.BSCIC was
established with a view to accelerating industrial growth through promoting the development of
small and cottage industries in the country (BSCIC Act, 1957). One of the core areas of BSCIC
activities is the establishment and maintenance of Industrial estates, which were established in
different times at different locations in the country. The entrepreneurs in BSCIC estates get
various benefits including plot allocations with subsidized rates, initial tax exemption,
infrastructure facilities and various other related supports.
The government undertakes policy to establish BSCIC industrial estates in all administrative
districts and accordingly 74 estates have been established so far in 58 districts except six
(Bandarban, Barguna, Chuadanga, Jhalokati, Magura and Narail)1. Some new estates are now
underway. The estates so far created have been contributing to employment generation and
consequently poverty alleviation at rural areas. To provide services to the entrepreneurs of small
and cottages industries, BSCIC has one head office in Dhaka, 4 Regional offices, 64 District
offices (Industries Service Centre), 742 industrial estate offices and 15 Skill Development Centers
at different places of the country.
1.2 Objectives of the study
BSCIC has made a long journey with its mandated activities to expand the industrial base since
1957 through promoting small and cottage industries. Though BSCIC has been engaged in
various activities towards industrial development, there is no independent evaluation of BSCIC
estates has been mandated yet. With the instruction of the Prime Minister dated 24/8/2014,
BSCIC has requested the Bangladesh Institute of Development Studies (BIDS) to make an
1Source: BSCIC-MIS Report, 2017. 2 According to BSCIC-MIS Report 2018 (February), BSCIC established 2 new industrial estates in Pabna (Pabna-2) in 2016 and Chittagong (Mirsharai) in 2017. In Pabna-2 industrial estate, BSCIC allotted 81 plots out of 100 industrial plots among them construction of building started in 23 plots but none of them started production yet. On the other hand, BSCIC did not make any industrial plot allot in Mirsharai industrial estate.

2
evaluation of activities of BSCIC estates to identify the problems they face and future way forward
to strengthen its capacities to accomplish the mandated activities.
The study has the following objectives.
a. Assess the infrastructure facilities of Industrial Estates, capacity needs, policy relevance
and constraints;
b. Identify the constraints for better utilization of the existing industrial estates and also the
constraints for distribution and use of the unutilized plots in the industrial estates;
c. Estimate economic and Social Impacts of industrial estates, such as investment impact,
employment impact, gross value added, technological innovations and transfers, spillover
impact, sustainability of BSCIC industrial estate model etc.;
d. Assess whether the current industrial estate model of BSCIC is sustainable and it has
accomplished the mandated activities in line with the previous Industrial Policies; and
e. Future policy directions for BSCIC industrial estates and alternative sustainability
approaches.
1.3 Design of the Study:
Given the nature and scope of the BSCIC Industrial Estates (BIEs), a proper and rigorous
methodology is warranted to assess its impact, relevance, efficacy, and effectiveness. The
present study has several sub-components that require survey data in order to estimate the
parameters and draw conclusions regarding the economic impact of industrial estates.
1.3.1 The Data
To evaluate the industrial estates of BSCIC the following methods and approaches have been
applied. Both qualitative and quantitative techniques have been applied and then the results are
triangulated to make a comprehensive assessment of industrial estates. The following
approaches have been adopted in collecting data:
- A sample survey of industrial units (enterprises)3 from randomly selected 25 estates
- A census of 72 estates on estate-related information
- Qualitative techniques, such as PRA, FGDs and KIIs.
- Consultation with key stakeholders.
3 Industrial units refer to enterprise or firms, which is a company organized for commercial purposes; business firm
within the industrial estates.

3
Survey of Firms
A survey of enterprises within the estates was conducted to assess the impact of estates on firms’
performance. In the survey, representativeness of all types of firms (small/micro/medium), sectors
(agro processing, textile, engineering, food, chemicals, pharmaceuticals, etc.) and estates
(according to geographical concentration, phases of establishments and size distribution) have
been ensured.
Sample size determination: Proposed Sample Size
In determining the sample size of the enterprise survey, we have used the methodology widely
used by the World Bank. The objective of using this method is to generate large enough samples
of enterprises that would produce statistically robust estimates. The sampling method considered
for determining the required minimum sample sizes from industrial estates is as follows:
𝑛 = [1
𝑁+
(𝑁 − 1)
𝑁×
1
𝑃𝑄× (
𝐾
𝑍1−𝛼/2)
2
]
−1
where N = population
P = Proportion of small or micro/cottage firms
Q = 1 – P
K = level of desired precision
Z = Standard Normal variate at 95% confidence interval
We considered the levels of precision at 2.5% (k=0.025) with 95% confidence intervals (Z = 1.96)
to obtain a representative sample of enterprises. Here the population is the number of
manufacturing enterprises, which is about 8,68,000 according to the Economic Census 2013 (BBS,
2013). The proportion of smaller firms (TPE<24)4 is about 90% (P=0.90) according to the same
census. Thus, assuming these parameters, the estimated sample size using the above formula is
614. However, if we consider the level of precision at 5%, the estimated sample size would be
around 150. Therefore, surveying about 500 firms is enough to fulfil the necessary conditions for
obtaining representative estimates of parameters.
Assuming k=.025, Z = 1.96, p=0.90, we get n= 600500
B. Estate Selection
4 If total persons engaged (TPE) in a firm is less than or equal to 24, it is considered as a small firm.

4
The BSCIC industrial estates vary according to geographical concentration, phases of
establishments and size distribution (number of industrial plots). The estates are geographically
concentrated in four old divisions, implemented in different phases of the time period, with
variations in size5 and number of industrial plots. We randomly selected 25 industrial estates,
covering about one-third of the total BSCIC industrial estate. The estates were selected according
to the geographic location, phases of implementation and their sizes. The 74 industrial estates
have been developed in six phases of establishments (A: 1960-1980; B: 1981-1991; C: 1993-
1999; D: 1985-1998; E: 1989-2007; F: 2003-2007)6. Since there are some over lapping periods,
we have reorganized the 6 phases of established estates into 4 establishment periods (A: 1960-
80; B: 1981-92; C: 1993-99; and D: 2000-07). The selection criteria of estates have been shown
diagrammatically below. (Table 2.1)
Table 1.1: The distribution of selected BSCIC estates for questionnaire survey
Division Phase/implementation period
Total 1960-80 1981-92 1993-99 2000-07
Barisal 1 1 0 0 2
Chittagong 3 1 0 1 5
Dhaka 1 4 2 1 8
Khulna 1 1 0 0 2
Rajshahi 0 1 1 1 3
Rangpur 1 0 2 0 3
Sylhet 0 0 1 1 2
Total 7 8 6 4 25
C. Sample (industrial unit/enterprise) selection: Stratified Random Sampling Method
5We categorize the industrial estates into three groups, according to the number of industrial plots; Small- having less than 100 industrial plots, Medium- having between 100-199 industrial plots and large- those with more than 200 industrial plots. 6According to the Planning and Development Division of BSCIC, a report titled “Industrial Estate and Industrialization: Proponents, Constraints and impact Mapping” was prepared in 2014.
Division (1)Phase/Implemention
period (2)Estate size (3)
5
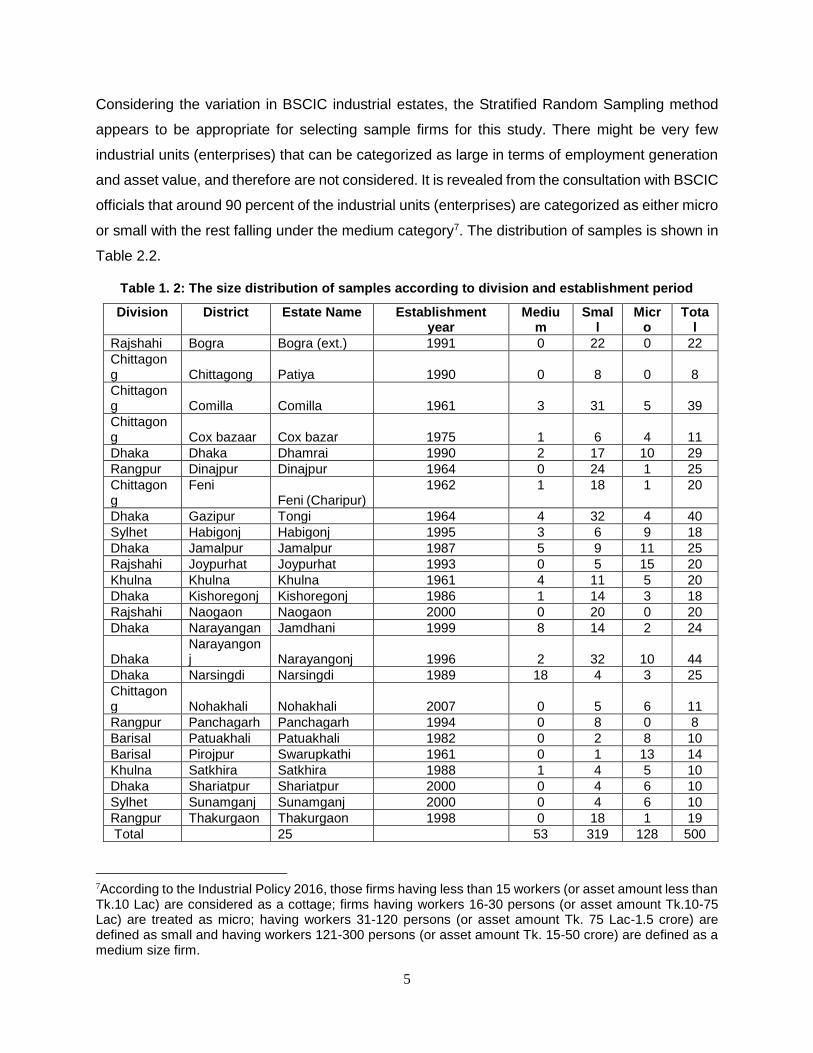
Considering the variation in BSCIC industrial estates, the Stratified Random Sampling method
appears to be appropriate for selecting sample firms for this study. There might be very few
industrial units (enterprises) that can be categorized as large in terms of employment generation
and asset value, and therefore are not considered. It is revealed from the consultation with BSCIC
officials that around 90 percent of the industrial units (enterprises) are categorized as either micro
or small with the rest falling under the medium category7. The distribution of samples is shown in
Table 2.2.
Table 1. 2: The size distribution of samples according to division and establishment period
Division District Estate Name Establishment year
Medium
Small
Micro
Total
Rajshahi Bogra Bogra (ext.) 1991 0 22 0 22
Chittagong Chittagong Patiya 1990 0 8 0 8
Chittagong Comilla Comilla 1961 3 31 5 39
Chittagong Cox bazaar Cox bazar 1975 1 6 4 11
Dhaka Dhaka Dhamrai 1990 2 17 10 29
Rangpur Dinajpur Dinajpur 1964 0 24 1 25
Chittagong
Feni Feni (Charipur)
1962 1 18 1 20
Dhaka Gazipur Tongi 1964 4 32 4 40
Sylhet Habigonj Habigonj 1995 3 6 9 18
Dhaka Jamalpur Jamalpur 1987 5 9 11 25
Rajshahi Joypurhat Joypurhat 1993 0 5 15 20
Khulna Khulna Khulna 1961 4 11 5 20
Dhaka Kishoregonj Kishoregonj 1986 1 14 3 18
Rajshahi Naogaon Naogaon 2000 0 20 0 20
Dhaka Narayangan Jamdhani 1999 8 14 2 24
Dhaka Narayangonj Narayangonj 1996 2 32 10 44
Dhaka Narsingdi Narsingdi 1989 18 4 3 25
Chittagong Nohakhali Nohakhali 2007 0 5 6 11
Rangpur Panchagarh Panchagarh 1994 0 8 0 8
Barisal Patuakhali Patuakhali 1982 0 2 8 10
Barisal Pirojpur Swarupkathi 1961 0 1 13 14
Khulna Satkhira Satkhira 1988 1 4 5 10
Dhaka Shariatpur Shariatpur 2000 0 4 6 10
Sylhet Sunamganj Sunamganj 2000 0 4 6 10
Rangpur Thakurgaon Thakurgaon 1998 0 18 1 19
Total 25 53 319 128 500
7According to the Industrial Policy 2016, those firms having less than 15 workers (or asset amount less than Tk.10 Lac) are considered as a cottage; firms having workers 16-30 persons (or asset amount Tk.10-75 Lac) are treated as micro; having workers 31-120 persons (or asset amount Tk. 75 Lac-1.5 crore) are defined as small and having workers 121-300 persons (or asset amount Tk. 15-50 crore) are defined as a medium size firm.

6
1.3.2 Qualitative Survey
Several qualitative data collection techniques have been employed. The techniques are
discussed below.
Participatory Rural Appraisal (PRA)
PRA is one of the widely accepted qualitative techniques for collecting information through broad-
based participation and communication of the stakeholders.PRA involves a quick appraisal of
various resources available in the estates, various important timelines and contribution to tertiary
economy, particularly within one kilometer radius of an estate. As a tool of PRA, we have applied
Community Resource Mapping (CRM) method in 25 selected estates. The main focus of the CRM
was to figure out the impact of the BSCIC estate on tertiary economy as much as possible.At the
beginning of CRM, two data enumerators made a transect walk within one kilometers surrounding
area of the estate to count the resources available in the vicinity of the estate. They count the
number of education institutions, shops, hat/bazars, katcha/pacca roads etc. as well as they
discuss with the local business leaders, industrialists, school/madrasa teachers, market
committee members, medicine shop keepers and other resource persons to draw almost an
accurate picture of the resources. CRM has covered employment, backward linkage industries,
business creation, market and growth centers around the estates, health, education, energy and
security issues.
FGDs and KIIs
Qualitative data generated through focus group discussions (FGDs) approach covers the aspect
of the local geographical conditions of the estates (before and after establishment of the estate),
industry and employment scenario, infrastructure, impact on tertiary economy, gender and
environmental aspects. A total of 10 FGDs have been conducted in five estates (two from each
estate), namely in Narsindi, Panchagarh, Comilla, Patukhali and JamdaniEstate, Narayaganj.
One FGD was done with about 7-10 industry owners/managers/officers/employees and another
FGD was done with 7-10 local community people.The participants in FGDs expressed their views
on social and other issues related to BSCIC industrial estates (Table 2.3). These FGDs
emphasized on open discussions with respondents to make them more participatory and allowed
stakeholders to provide inputs regarding the industrial estate performance, problems and exit
solutions on a consensus basis.
In addition to FGDs, we conducted139 key informant interviews (KIIs) with a semi-structured
questionnaire (Table 2.3), to understand the progress and constraints of the industrial estates
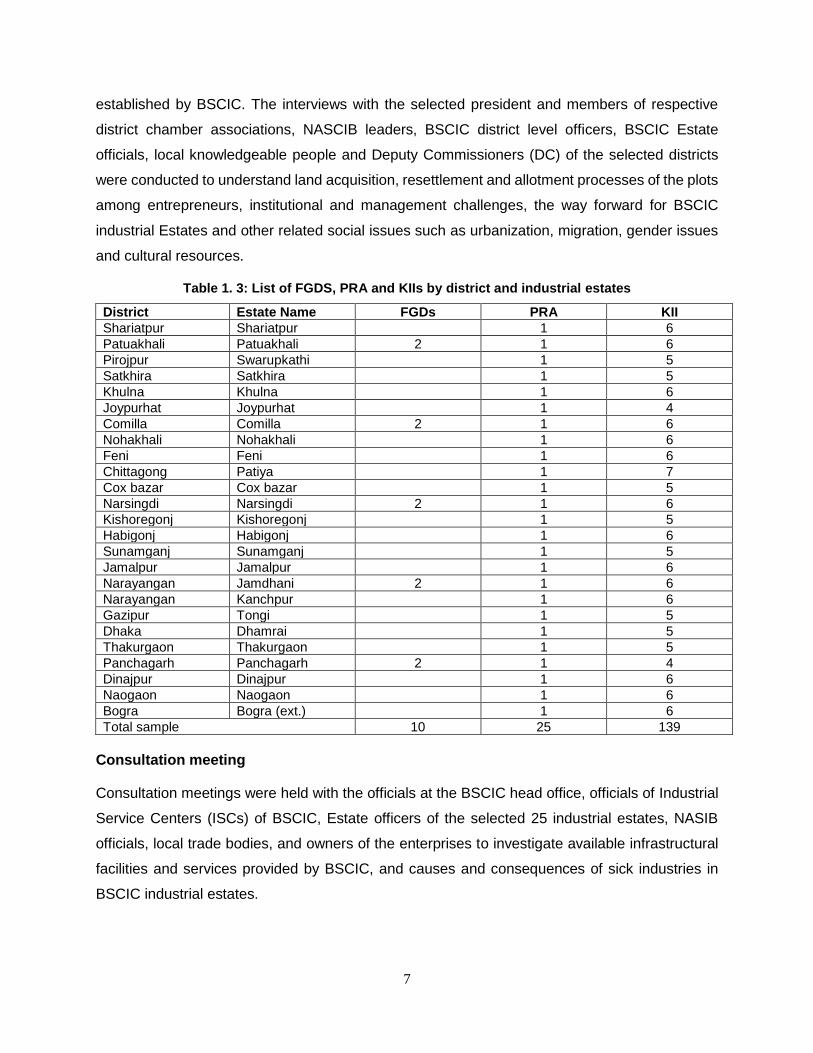
7
established by BSCIC. The interviews with the selected president and members of respective
district chamber associations, NASCIB leaders, BSCIC district level officers, BSCIC Estate
officials, local knowledgeable people and Deputy Commissioners (DC) of the selected districts
were conducted to understand land acquisition, resettlement and allotment processes of the plots
among entrepreneurs, institutional and management challenges, the way forward for BSCIC
industrial Estates and other related social issues such as urbanization, migration, gender issues
and cultural resources.
Table 1. 3: List of FGDS, PRA and KIIs by district and industrial estates
District Estate Name FGDs PRA KII
Shariatpur Shariatpur 1 6
Patuakhali Patuakhali 2 1 6
Pirojpur Swarupkathi 1 5
Satkhira Satkhira
1 5
Khulna Khulna 1 6
Joypurhat Joypurhat 1 4
Comilla Comilla 2 1 6
Nohakhali Nohakhali 1 6
Feni Feni 1 6
Chittagong Patiya 1 7
Cox bazar Cox bazar 1 5
Narsingdi Narsingdi 2 1 6
Kishoregonj Kishoregonj 1 5
Habigonj Habigonj 1 6
Sunamganj Sunamganj 1 5
Jamalpur Jamalpur 1 6
Narayangan Jamdhani 2 1 6
Narayangan Kanchpur 1 6
Gazipur Tongi 1 5
Dhaka Dhamrai 1 5
Thakurgaon Thakurgaon 1 5
Panchagarh Panchagarh 2 1 4
Dinajpur Dinajpur 1 6
Naogaon Naogaon 1 6
Bogra Bogra (ext.) 1 6
Total sample 10 25 139
Consultation meeting
Consultation meetings were held with the officials at the BSCIC head office, officials of Industrial
Service Centers (ISCs) of BSCIC, Estate officers of the selected 25 industrial estates, NASIB
officials, local trade bodies, and owners of the enterprises to investigate available infrastructural
facilities and services provided by BSCIC, and causes and consequences of sick industries in
BSCIC industrial estates.
8
1.4 Methods of Analysis
For evaluation purposes, this study applied a mix of both quantitative and qualitative methods.
i. Desk Review: A comprehensive desk review of documents and secondary data (MIS
report of various years) has been made to understand the history of BSCIC and overview
of BSCIC activities, existing knowledge in literature regarding the performance, challenges
and the prospects of industrial estates in other similar countries.
ii. Quantitative Analysis: The quantitative analysis involves estimates of descriptive
summary statistics, compound annual growth rates, return on investment, asset turnover
ratio etc. to assess the performances of the estates as well as the firms. In particular, we
have analyzed the following aspects: (i) Characteristics of BSCIC Industrial Estates; (ii)
Characteristics of firms; (iii) Investment effect; (iv) Composition of investment; (v)
Employment Effect; and (vi) Wage and non-wage benefits of employees.
iii. The efficiency and the economic viability of the industrial enterprises are measured by
certain indicators. The efficiency of industrial units (enterprises) is measured by input-
output ratio and the rate of return on fixed capital investment.
1.5 Field Work, Data Management and Quality Control
A team of 10 enumerators were hired to complete the survey in 45 days. They were grouped into
5 teams consisting of 2 members in each group and placed in 23 districts of 8 divisions for the
designated survey work. Each group was led by an experienced supervisor. The visit by the
enumerators and supervisors were carefully planned. They were positioned in study sites in a
way so that the research team can monitor and supervise their activities in a convenient way.
Before finalizing the draft questionnaires and checklists (Bangla version), a formal field pretesting
was carried out to assess suitability in terms of language and placement of questions; verify if the
contents and codes are consistent with reality and, estimate the time required for filling the
questionnaires etc. The study team incorporated the necessary modification in the final
questionnaires based on the field pre-testing results. Lastly, in consultation with the BSCIC
headquarter officials, the questionnaires were finalized. The final questionnaires and checklists
(Bangla version) are appended in the Annex.
Data collection was done in two phases. First, the request letters were sent to the estate officers
to provide their enterprise list by sectors as well as size to prepare an inventory of enterprises.
That inventory or list helps the study team to select the required number of enterprises. Second,
the study team also sent a request letter and a estate survey questionnaire to all the industrial
estate offices to fill out the questionnaire on the respective industrial estate.

9
Training and Quality Control Measures
Two-day extensive training programs were organized for the selected enumerators on the use of
the questionnaire and the survey methodology. They were also given adequate knowledge about
BSCIC estates, BSCIC offices at district level, as well as selection of respondents for both
qualitative and quantitative analyses. After the in-house training, they were sent to the field for
acquiring practical knowledge on the survey and questionnaire. The selected enumerators were
sent to three locations, namely Joydevpur and Tongi BSCIC estates for pre-testing purposes on
a one-day assignment.
Supervisors were given the key responsibility of monitoring the survey activities very closely.
Researchers of the project also made extensive visits to survey sites in order to monitor the data
collection process as well as to get an impression on various aspects of the survey. The data
collection procedures were constantly supervised and monitored by the researchers.
The members of the research team monitored the interviews as well as provided specific feedback
to the enumerators regarding the interview as and when required (e.g., rapport establishment,
questioning style, use of probing questions and approach to the respondents). The supervisors
checked all completed interview schedules on a daily basis to identify the missing information,
ambiguous answers, numerical errors, and provided feedback to the enumerators.
Data Management
The data management activities included registration of the interview schedules, editing of
interview schedules, data entry, cleaning, processing and analysis. Some cleaning of data has
been done after completion of the surveys. Data management has been done at the BIDS. The
data entry format has been designed by an experienced programmer and data entry has been
done by entry operators working at BIDS using widely used statistical software SPSS and STATA.
The whole process has been supervised by the team leader, statistician and other team members.
1.6 Organization of the Report
This report is organized as follows; Chapter 2 provides a brief description about the BSCIC.
Chapter 3 focuses on BSCICs Industrial Estate program and related activities. Chapter 4
highlights the infrastructural facilities and related problems in BSCIC Industrial Estates. Chapter
5 describes the size, structure and performance of industrial units. Chapter 6 assesses the
economic contribution of the estates. Finally, Chapter 7 concludes the report.

10
Chapter 2: About BSCIC
At the initial stages, BSCIC was engaged mainly with commercial activities like import of plant
and machinery, raw materials and also providing small loans to the small entrepreneurs. BSCIC
also assists entrepreneurs in the preparation of project profiles and proposals, adoption of
appropriate technologies as well as provided technical and consultancy services for the quality
enhancement of SMCI products and marketing of SMCI products etc.
A number of institutes like a Small and Cottage Industries Training Institute (SCITI), 15 Skill
Development Centers (SDC) and one Design Center for human resource development are now
being operated under BSCIC. Design Centre is an important department of BSCIC, which was
started in 1960 for offering training services to the unemployed artisans, craftsmen, new
entrepreneurs, particularly the women and the people involved in various clusters of cottage
industries . The training courses on skill development programs are designed in order to help
create/improve income-generating capacities of unemployed people. It conducts countrywide
training programs on13areas, such as batik, block printing, screen printing, cane, bamboo and
wood products, pottery and ceramics, metal crafts, leather crafts, weaving and tapestry,
packaging (leaves and straw), jute handicrafts, doll making, fashion designing and design concept
and development. SCITI started functioning from 1985 to provide support to the entrepreneurs of
SME sector and their employees for the development of their entrepreneurial and management
skills. It also provides training on SME related issues to the promotion and extension officials of
both public and private sector agencies. BSCIC has introduced Skill Development training
program in 1992 to create skilled manpower and improve the existing skills of the artisan with a
view to creating employment opportunity for drop-out school/college students as well as un-
employed youths. It provides skill development training on 15 trades with the duration ranging
between 1 month and 6 months in different districts of Bangladesh.
BSCIC has so far established 74 industrial estates since 1960 and currently some industrial
estates are in the process of expansions and some new states are under construction.
2.1 Human Resource structure of BSCIC
In 2001, by the recommendation of the Enam committee, a restructuring of human resources has
been done. BSCIC currently has a total of 4 regional offices, 64 district offices, 74 industrial
estates in 59 districts , 15 Skill Development and Training Centers (SDTC), and 32productions-
cum-exhibition centers in 22upazilas of 3 hill districts (Khagrachari, Bandarban and Rangamati).

11
The current number of approved BSCIC manpower is 2410 which includes 947 officers and 1463
employees. Out of 2410 BSCIC officers and employees, 554 posts are allocated for head office
and 1856 are for field-level offices. Including the board of directors, the total number of employees
approved under the revenue budget is 2410 (BSCIC, Annual Report, 2015).
The older estates are managed by an Estate Officer with support from a Technical Officer, an
Accountant, a Computer Operator-cum-Clerk, a Pump Driver, two Guards and a Peon. However,
the manpower in recently established estates has been reduced to 5, where the position of a
technical officer, guard and a pump driver has been dropped. The responsibility of an Estate
Officer is to manage the overall industrial estate while the Technical Officer is responsible for the
construction design of the building as well as the supervision of the development activities. The
computer operator-cum-clerk is responsible for all forms of data entry and electronic
documentation and the accountant is responsible for managing accounts that include rent, service
charge, owner transfer fees, and estate expenditures. The pump driver was in charge of providing
water supply to all estates (switching the pump on/off as well as maintenance).
BSCIC is headed by a Chairman appointed by the government at the rank of additional secretary.
There are six Directors who led six divisions such as Finance; Planning and Development;
Promotion and Extension (P&E); Project; Marketing & Design; and Technology. BSCIC is run by
a Board consisting of directors of six divisions headed by the chairperson.
2.2 Activities of BSCIC
In addition to managing and maintaining industrial estates, BSCIC is also engaged in training and
lending activities.
2.2.1 Managing Industrial Estates
BSCIC has so far established 74 industrial estates all over Bangladesh during 1960 and 2007
(BSCIC-MIS, July 2016-June 2017). According to the MIS Report 2016-17,the total area allocated
to the74 industrial estates is about 1969 acres.There is a total of 10,389 industrial plots in the 74
industrial estates with an allotment rate of 96.8%. A total number of 5822 units have been
established in the allotted plots, out of which 78.1% are in production. About 936 industrial units
are under construction and 339 industrial units are sick/shutdown. Majority of industrial estates
were established with an area between 15 and 50 acres. Currently, a total of 5.64 lakh people are
working at BSCIC’s estates and industrial units together, which contributes about 15.13% of total
SME employment (micro and cottage industries have a total labor force34.55 lakh). The total
amount of entrepreneur’s investment in these established industrial estates was Tk. 20,178 crore.

12
About Tk. 45880 crore worth of products is annually produced with Tk. 24931 crore worth of
products being exported which is about 9.3% of the country’s total exports.Four special estates,
such as Jamdani Palli and Hosiery in Narayanganj, Tannery in Savar and Electronic in Mirpur,
Dhaka to support these specialized sectors.
2.2.3 BSCIC’s Target Based Activities
Regarding the promotion and extension services, BSCIC assists entrepreneurs through 23
activities which are divided into 2 categories: pre-investment and post- investment activity. The
pre-investment activities include identification of potential interested entrepreneurs, training
programs on management development and skill development, preparation of project profile and
proposal, credit arrangement/assistance, registration of industrial units etc. Post investment
activities include design &development, collection and distribution of technical information, buyer-
sellers meet, enlisting of sub-contracting units, establishment of sub-contracting linkage, and
arrangement of exhibition/fair for Small and Cottage Industries (SCI) products. Some of the pre
and post investment activities are elaborated below.
I. Training activities
BSCIC has various service support activities aimed towards the development of micro and cottage
industries, out of which the most important activity was the identification and training of
entrepreneurs, also known as ‘Entrepreneurship development’. As a part of this entrepreneurship
training program, BSCIC has countrywide training institutions including SCITI at Uttara, BSCIC’s
Design Centre at Motijheel, 15 Skill Development and Training Centers (SDTC) in 15 districts, 32
production-cum-exhibition centres situated in 22upazilas of 3 hill districts, 6 production-cum-
exhibition centres working under the bee keeping program and 6 production-cum-exhibition
centres working under the Salt industry development program at Cox’s Bazaar. Apart from that,
BSCIC’s district office, the Industrial Support Centers (ISC) holds an all-year round brief training
courses regarding entrepreneurship development. Moreover, BSCIC holds on-demand training
programs all over the country, according to entrepreneur needs. Also, BSCIC conducts training
jointly with other technical and training organizations. During the year 2014-15, a total of 6,624
entrepreneurs received training from both SCITI and ISC (BSCIC, Annual Report, 2015).
II. Registration of Industrial Units
Though the registration of small and cottage industrial units is not an obligation, it is, however, a
necessary requirement to get registered with BSCIC before applying for any form of government
assistance. Registration of proposed and existing units is done on the payment of a fee based on

13
the level of investment made by the units. During 2014-15, a total of 604 smalland 1363 cottage
industrial units have been registered with BSCIC(BSCIC, Annual Report, 2015).
III. Preparation of project profile, proposal and evaluation
BSCIC prepares project profiles in a booklet form which provides information on a specific
industrial unit. The booklet contains information regarding the total investment of a particular
project (land, factory building, machinery and equipment, working capital etc.), production
capacity, technical, financial and marketing analysis, and profitability trends. A total of 422
industrial project profiles have been prepared and distributed during 2014-15. BSCIC also
prepares project proposals and appraisal reports. During 2015, BSCIC has prepared and
appraised 2,073 small and 5,526 cottage industrial project proposals (BSCIC, Annual Report,
2015).
IV. Lending activities/credit arrangement
BSCIC has been engaged in lending activities from the beginning of its establishment. BSCIC has
a lot of experience in running the lending program and have established their first Rural Industries
Service (RIS) in 1961. BSCIC either provides loans from its own credit program or recommends
other financial institutions to provide loans under a set of terms and conditions. In the year 2014-
15, 1983 small and 5140 cottage firms have received credit through direct/indirect assistance
from BSCIC (BSCIC, Annual Report, 2015)..
V. Development and Distribution of Product Design
Design & development involves the modification of a product or its packaging to enhance
customer attractiveness. This service is mainly dispensed from the Design center situated at
BSCIC Headquarters. A total of 508 designs and 2,409 prototypes have been developed and
distributed to entrepreneurs in 2014-15(BSCIC, Annual Report, 2015).
VI. Technology collection and distribution, enlisting and establishment of sub-contracting
units
This involves the collection of information on new technology/machineries and modern production
process and it is then disseminated to interested entrepreneurs. During 2014-15, 60 technical
information booklets have been collected and 983 technical information booklets have been
distributed among the entrepreneurs.
Enlisting of sub-contracting units involves identifying and enlisting small-scale industrial units.
During 2014-15, 49 small industrial units have been enlisted under the sub-contracting program.

14
Establishing a sub-contracting linkage allows small industrial units (enterprises) to be linked to
larger units (enterprises). During 2014-15, 60 sub-contracting linkages have been established.
VII. Arrangement of exhibition fair for SCI products
BSCIC assists in the market promotion for the Small and Cottage Industrial (SCI) products
through the arrangement of exhibition fairs. A total number of 11 fairs/ exhibitions have been
arranged during 2014-15(BSCIC, Annual Report, 2015).
2.3 BSCIC’s Industrial Estate Program
In the mid-1960s, along with their lending activities, BSCIC had begun establishing their industrial
estates. BSCIC originally began establishing an industrial estate in each district. As a result, a
total of 18 estates were being established by the end of 1970. BSCIC’s estate expansion process
began after 1971. The establishment of estates was done in six phases, but with overlaps. In the
first phase (1960-1980), 20 industrial estates consisting of 3532 industrial plots were built in
different districts, out of which 3404 plots (96.4%) had already been allotted. In the second phase
(1981-1991), 9 industrial estates having 1405 industrial plots were established in different parts
of the country. In the third (1993-1999) and fourth phases (1985-1998), there were 3 and 21
industrial estates consisting of 459 and 2707 industrial plots respectively. Lastly, in the fifth (1989-
2007) and sixth (1993-2007) phases, 18 and 3 industrial estates consisting of 1871 and 415
industrial plots were established respectively.
Four specialized estates were established in addition to the general estates. Those are Jamdani
Palli and Hosiery in Narayanganj, Leather in Savar and Electronic in Mirpur, Dhaka. Dhaka and
Chittagong division has a higher concentration of estates (24 & 17) which is followed by Rajshahi
(9), Rangpur (8), Khulna (7), Sylhet (5) and Barisal (4).
2.4 Estate Management structure
The BSCIC industrial estates are managed by different tiers of BSCIC offices. The policy making
process involves several steps, which are described briefly below.
Estate Office:
There are 74 industrial estates in all over the country and each estate has an office headed by an
Estate officer for managing various affairs of the estate. The industrial estate office is the lowest
tier of the estate management of BSCIC. The main activities of the estate office are as follows:

15
• Preliminary selection for the plot allocation application
• Overall maintenance of all infrastructural facilities, such as power, transport, water and
lighting at the estate premises
• Collection of revenues such as land instalment, service charges, land development tax,
rent etc.from industrial units
• Process the industrial trade change and ownership transfer application and forward it to
HQ through ISC and regional office.
• Periodic reporting of production, investment, employment and export etc.to the HQ
through ISC and regional office.
Industrial Service Centre (ISC)
The second lowest tier of the BSCIC estate management office is the Industries Service Centres
(ISC) also known as Shilpo Shahayak Kendra (Shishke), which are located at all district Head
Quarters. There are 64 ISCs at district level. ISC plays an important role in the plot allocation and
plot cancellation process, District ISC officer is the member secretary of the district plot selection
committee headed by the Deputy Commissioner (DC). The major task of the ISC includes:
• Identify industrial entrepreneurs (cottage, micro & medium)
• Impart entrepreneurship development training
• Project profile development and facilitate applications for bank loans
• Provide registration of industrial units
• Prepare a list of the product for tax exemption
• Implementation and monitoring of projects that receive credit facilitation.
• Support in terms of design, prototype development and distribution
• Support in marketing information and organization of product fairs
Regional Office
There are four divisional offices in the old four Divisions-Dhaka, Chittagong, Rajshahi and Khulna.
The BSCIC Head Quarter (HQ) administers all official orders through divisional offices. They
monitor the activities of the industrial estates through Industrial Service Centres (ISC). The
ownership transfer process requires the permission from the BSCIC HQ, thus, the estate officer

16
sends the application with the required documents to the divisional office through ISC. The
divisional office, then scrutinizes the application, addressing the legal issues and then forwards it
to the HQ.
Head Quarter
BSCIC headquarter facilitates the above mentioned process through different wings such as
Finance, Planning & Development, Promotion & Extension, Marketing & Design, Technology and
Project Development. It also monitors the activities of 4 regional offices, 64 industrial service
centre offices and 74 industrial estate offices.
The current policy making process of BSCIC is highly centralized and therefore all decisions are
made by the HQ. It has the key authority to take decisions on the ownership of the industrial
estate, types of ownership, change the name and trade of the business, allocation of maintenance
costs etc. The centralized system of BSCIC involves lengthy process and therefore takes
relatively longer time to make decisions that affect the enterprises to some extent.

17
Chapter 3: An Overview of BSCIC Industrial Estates
3.1 Industrial Estates and its objectives
The United Nations Industrial Development Organization (UNIDO) defines an industrial estate as
a “planned cluster of industrial enterprises offering standard factory buildings erected in advance
of demand and a variety of services and facilities to the occupants” (UNIDO, 1967). Industrial
estates has been defined as an area or a site utilized for the development of a planned cluster of
industrial enterprises which are provided utility services and technical facilities, with the objective
to strengthen and develop these industries as a part of a broad program of industrialization and
social development (Bredo, 1960; UN, 1961; Alexander, 1963).
Various definitions and arguments on industrial estates characterize its nature as follows:
i. Planned clustering of industrial enterprises;
ii. Construction of industrial establishments before entrepreneurial demand;
iii. Standardization in the construction of industrial buildings; and
iv. Provision of a variety of services and facilities to the occupants.
Considering the above criteria of an industrial estate, BSCIC started building industrial estates to
harness small and cottage industry potentials in the country with a broader objective of facilitating
industrialization.
In general, the BSCIC industrial estates were established with a view to achieving the following
objectives:
1. Promoting small and cottage industries by providing land facilities, service assistance and
guidance;
2. Decentralization of industries from big cities to districts and semi-urban areas;
3. Use of local resources and local raw materials to expand localized business opportunities;
4. Development of industries in backward regions in order to achieve regional balance in
employment and poverty alleviation;

18
5. Ensuring all types of required facilities in one place for the smooth functioning of industries,
and
6. Rapid industrialization of the country through the development of small and cottage
industries.
3.2 Overview of industrial estate
There are 76 industrial estates that have been created so far. Information on 74 estates is readily
available from the MIS report (2016-2017) of BSCIC, as two new estates are yet to be functioning.
Based on MIS Reports of BSCIC, a comparative scenario of BSCIC estates has been drawn here
to see the changes that have taken place over the years of 2012-2017. The total land area
occupied by the 74 industrial estates is 1969.2 acres, which remained stable, as no new industrial
estates have been created since 2007. The number of allotted plots had increased slightly due to
some of the plots during the 2007-phase estates being developed after 2012. Over the years of
2012-2017, the number of established units in the allotted plots increased from 5745 to 5822 with
about 0.3% yearly growth. Among the established plots, the percentage of units in production has
increased from 73% in 2012-13 to 78% in 2016-17 with an annual increase at 1.6%. The
percentage of export oriented enterprises remained almost the same at about 21% over the years.
Employment per estate has increased from 6805 in 2012-13 to 7626 in 2016-17 with an annual
increase at about 3%. However, employment per enterprise has increased slightly over the five
years, from 120 to 124. Total production value and export value however have increased annually
by 11% and 5% respectively during the period indicating higher productivity of enterprises. The
MIS data shows that about 4.4% units become sick annually, which is alarming to some extent
(Table 3.1).

19
Table 3. 1: Industrial estates at a glance based on MIS-BSCIC Data
Items 2012-13 2016-17 CAGR (%)
Total land area (in acres) 1969.2 1969.2 -
No of Industrial plots 10339 10389 0.1
No of allotted industrial plots 9837 10053 0.5
No of established industrial units in the allotted plots 5745 5822 0.3
Average number of plots in per industrial unit 1.71 1.73 -
No of industrial units in production 4205 4547 2.0
% of units in production among established units 73.2 78.1 1.6
No. of industrial units are in under construction/ready for construction
1255 936 -7.1
No of sick/closed industrial units 285 339 4.4
No of industrial units are ready for allotment 502 336 -9.5
No. of export oriented industrial units 865 946 2.3
% of export units among total units in production 20.6 20.8 -
Number of employed persons in the industrial estates 503551 564319 2.9
Employment per estate 6805 7626 2.9
Employment per firm 120 124 0.9
Total production value (crore Tk.) 36097.4 55262.3 11.2
Total export value (crore Tk.) 20889.9 25528.5 5.1
Government revenue (crore Tk.) 2312 2950.1 6.3
Number of industrial estates 74 74 -
Source: MIS-BSCIC, various years, 2012-2013 & 2016-2017.
BSCIC industrial estates were established in different phases, but with overlaps, such as 1960-
1980 (1st phase), 1981-1991 (2nd phase), 1993-1999 (3rd phase), 1985-1998 (4th phase), 1989-
2007 (5th phase) and 1993-2007 (6th phase). The highest number of estates were established
during the first (20), fourth (21), and fifth phases (18). The number of industrial plots was relatively
higher in those phases (Table 3.2). Over the phases, almost all of the industrial plots were allotted
(96.8%) ranging from a maximum of 99.9 % in the second phase to a minimum of 90.4% in the
fifth phase. The number of units in construction is relatively more in the fifth and sixth phases (375
vs. 204) than in the earlier phases.
On average, the occupancy rate8 is 96.8%, which is much higher compared to Thailand (89%)9
and Vietnam (73%)10. The occupancy rate varies significantly by division, all divisions having an
occupancy rate more than 90% except Barisal (82.2%). On the other hand, Dhaka and Rajshahi
divisions having occupancy rate more than 99% (Table 3.3).
8Occupancy rate is defined as the ratio of number of plots allotted over total number of industrial plots. 9Kongcheep, S. 2017. Thailand Industrial Estate Market; http://www.colliers.com/-/media/files/apac/thailand/market-reports/thailand-industrial-estate-1h2017-en.pdf 10 https://www.talkvietnam.com/2017/08/industrial-park-occupancy-rate-reaches-73/
20
Although the occupancy rate is very high in the BSCIC estates compared to the industrial estates
from some middle income countries, the plot utilization rate11 is somewhat lower compared to the
occupancy rate, on an average 78.1% (Table 3.2). Estates established in the fourth phase are
high performing, having a utilization rate more than 87.5%, while the industrial estates established
in the fifth and sixth phases are less performing, having a utilization rate around 58% and 27%
(or 70% excluding tannery estate) respectively (Table 3.2). Plot utilization rate varies significantly
across divisions from 50% in Barisal to 95% in Rajshahi. Even though the occupancy rate is
around 82% in Barisal, plot utilization rate is much lower, around 38% (Table 3.3). According to
the BSCIC industrial estate plot allotment policy, the owners get around 2 years to start
commercial production from the approval date of the layout plan, after which the authority can
cancel the allotment if not utilized. The low utilization rate is a culmination of several problems
including weaknesses in enforceability of existing rules and regulations, problems in selecting
proper entrepreneurs and infrastructure bottlenecks (gas and electricity). The reasons of non-
utilization of plots are discussed in detail in Chapter 4. It is now an important challenge for BSCIC
to lay out a proper strategy to increase the plot utilization rate in the context of scarcity of serviced
land in the country.
Although the overall occupancy rate is 96.8%,the rate is only about 50% in Khagrachari and
Panchagar industrial estates. More than one-fourth of the industrial plots remained un-allotted in
Sharupkhati,Rangamati, Sunamganj and Bhola (Table A2). The low occupancy rate is perhaps
due to shortage of potential entrepreneurs in these geographically disadvantaged locations.
BSCIC authorities may organize awareness campaign and provide assistance for financial
support to attract entrepreneurs in these estates. Khagrachari, Rangamati and Bhola are not only
expericing low occupancy rate but also having experiences of very low utilization rate of the
allotted plots (Table A2). Therefore, the existing entrepreneurs also needs special training on how
to improve their products and organize fairs to search their potential markets.
Despite having a very low utilization rate of allotted industrial plots in Rangamati, Khagrachhari
and Bhola (less than 10% as listed in Table A3.), BSCIC plot cancellation committee has failed to
cancel the allocation of those unutilized plots.
Industrial sickness acts as a constraint of economic development (Roy &Basu, 2015). This is not
a new phenomenon for developing countries; even developed countries also face varying degrees
of industrial sickness. An industrial unit may face a number of hostile situations during the
11 Utilization rate is defined as the ratio of the number of plots in production over total number of allotted plots.
21
implementation and operation stage due to internal and external causes. If the problems
perpetuate and the unit cannot pull on its normal activities, then the unit is treated as a sick unit.
The sick industrial unit is forced to shut down, if this sickness persists for a few years. Industrial
sickness adversely affects employees, investors, entrepreneurs and shareholders, government
and also the society in general (Hoque & Biswas, 2013). Overall, there are 5.9% of the established
industrial units which are in sick/shutdown condition. The percentage of sick units out of total was
relatively the highest among the estates established in the third phase (12.7%). The estimates in
Table 3.3 are based on data acquired from BSCIC’s MIS report of 74 estates, which suggested
that the highest percentage of sick industrial units, which is about 9% in Barisal Division.
BSCIC Industrial estates were established in order to encourage the expansion of a prudent
private sector, promote small enterprises and increase export-oriented activities. Though BSCIC
has made a noteworthy contribution towards promoting smaller industries and creating
employment, the contribution of BSCIC would be more prominent if it could enhance plot
utilization rate and help reduce sickness of industries. Therefore, better implementation of the plot
allotment policy and enforcement of existing rules/regulations against non-utilization of plots might
improve the situation.

22
Table 3. 2: Establishment status by implementation of BSCIC industrial estate
Phases & periods
No of indust
rial estate
No of industrial plots
No of allotted plots
No of industrial
units established
in the allotted
plots
No of industrial units are
in productio
n
No of industrial units are
either under
construction or not
started yet
No of industria
l units are
shutdown
No of un-
allotted
industrial
plots
Average
number of plots for per industrial units
Allotment rate or
Occupancy rate (%)
Utilization rate of allotted
plots (%)
Utilization rate of allotted
plots excluding Tannery
(%)
Utilization rate of available plots (%)
Sick unit (% of total units)
Un-
utilization rate (%)
1 2 3 4 5 6 7 8 9 10=(4/5) 11=
(4/3)
12=
(6/5)
13=
(6/5)
14=
(5+9/6)
15=
8/(7+10)
16=100-14
First phase (1960-1980)
20 3532 3404 1669 1427 124 118 128 2.0 96.4 85.5 85.5 79.4 7.1 20.6
Second phase (1981-1991)
9 1405 1404 709 605 49 55 1 2.0 99.9 85.3 85.3 85.2 7.8 14.8
Third phase (1993-1999)
3 459 457 479 377 41 61 2 1.0 99.6 78.7 78.7 78.4 12.7 21.6
Fourth phase (1985-1998)
21 2707 2683 1699 1486 143 70 24 1.6 99.1 87.5 87.5 86.2 4.1 13.8
Fifth phase (1989-2007)
18 1871 1691 980 572 375 33 180 1.7 90.4 58.4 58.4 49.3 3.4 50.7
Sixth phase (1993-2007)
3 415 414 286 78 204 4 1 1.4 99.8 27.3 69.6 27.2 1.4 72.8
Total 74 10389 10053 5822 4545 936 341 336 1.7 96.8 78.1 80.5 73.8 5.9 26.2
Source: BSCIC, MIS Report 2016- 2017; Authors’ calculation.

23
Table 3. 3: Establishment status by divisions
Phases & periods
No of indust
rial estate
No of industr
ial plots
No of allotted plots
No of industrial
units established in the allotted
plots
No of industrial
units are in production
No of industria
l units are
either under
construction or
not started
yet
No of industr
ial units are
shutdown
No of un-
allotted
industrial
plots
Average number of plots for per
industrial units
Allotment rate or Occupancy rate
(%)
Utilization rate of allotted
plots (%)
Utilization rate of allotted
plots excludin
g Tannery
(%)
Utilization rate of
available plots (%)
Sick unit (% of total
units)
Un- utilizatio
n rate (%)
1 2 3 4 5 6 7 8 9 10=(4/5) 11= (4/3)
12= (6/5)
13= (6/5)
14= (5+9/6)
15= 8/(7+10)
16=100-14
Barisal 4 809 665 338 169 139 30 144 2.0 82.2 50.0 50.0 35.1 8.9 64.9
Chittagong 17 1898 1834 992 763 162 67 64 1.8 96.6 76.9 76.9 72.3 6.8 27.7
Dhaka 24 3751 3740 2826 2194 463 169 11 1.3 99.7 77.6 82.7 77.3 6.0 22.7
Khulna 7 1007 984 370 299 49 22 23 2.7 97.7 80.8 80.8 76.1 5.9 23.9
Rajshahi 9 1489 1486 661 627 16 18 3 2.2 99.8 94.9 94.9 94.4 2.7 5.6
Rangpur 8 895 841 320 256 50 14 54 2.6 94.0 80.0 80.0 68.4 4.4 31.6
Sylhet 5 540 503 315 237 57 21 37 1.6 93.1 75.2 75.2 67.3 6.7 32.7
Total 74 10389 10053 5822 4545 936 341 336 1.7 96.8 78.1 80.5 73.8 5.9 26.2
Source: BSCIC, MIS Report 2016- 2017; Authors’ calculation

24
Box1: BSCIC Plot Allocation Process
For plot allotment in newly established BSCIC industrial estates, District Industries Service Centre (ISC)
of BSCIC makes advertisements in national and local daily newspapers. On the other hand, for the
allotment of vacant plots in existing estates, BSCIC’s Head Office advertises twice per year in national
dailies and BSCIC’s local office advertises three times per year in local dailies. Interested entrepreneurs
have to apply within 45 days of advertisement at BSCIC’sShilpoSohayakKendro (ISC) or at the BSCIC
head office. The scrutiny committee of BSCIC examines the application within 15 days, and then the plot
allocation committee sits together within 30 days, to sort out the appropriate entrepreneurs. After that
meeting, BSCIC sends an allocation letter within the next 30 days. Entrepreneurs have to submit the
following documents with the application:
(a) Application form with money receipt;
(b) Two copies passport picture;
(c) Nationality certificate and NID;
(d) Trade license;
(e) Income tax certificate;
(f) Project proposal;
(g) Building layout;
(h) Environment clearance;
(i) Bank solvency etc.
After receiving the application, the local ShilpoSohayakKendro (ISC) chief will chair the reviewing.The
sorting committee consists of one expert member and local estate officer. They will then send the
selected application to the district level plot allocation committee headed by Deputy Commissioner of the
district. Other members of the Committee are as follows:
(a) Local UNO- member;
(b) Representative of local Mayor/Pouroshova/ Union Parishad Chairman-member;
(c) President or secretary of local NASCIB-member;
(d) President of local chamber-member;
(e) BSCIC estate officer-member;
(f) Female entrepreneur (nominated from local chamber)-member;
(g) District environment officer (if available)-member;
(h) Chief of local ShilpoSohayakKendro (ISC)-member secretary.
This committee may co-opt two additional members according to their need. This committee works for
61 districts except for three hill tract districts (Rangamati, Kagrachari, Bandarban) in Bangladesh. In
these three districts the committee is headed by the related District Council Chairman and Deputy
Commissioner of that district who acts as the vice-president of the committee. All other members and
member secretary are the same as other committees. The district level plot allocation committee can
allocate and cancel plots up to 33.33 decimals, BSCIC head office can allocate up to 1 acre land for each
industry and Ministry of Industry can allocate more than 1 acre plots.
Source: Bangladesh Gazette, Ministry of Industry, no. 36.065.012.00.00.022.2010-205, June 13, 2010

25
3.3. Profile of the industrial estates: Survey Findings
3.3.1 Sector-profile of the industrial units/enterprises
According to the BIDS survey 2017, textile and agro food processing industries occupy a relatively
higher number of industrial units compared to others in both 2010 (37.6% vs. 27.7%) and 2016
(34.6% vs. 28.1%) (Table 3.4). Export oriented units are the highest in the textile sector (91.94%
vs. 88.63%). Although the number of industrial units/enterprises in the ICT sector is very low,
during the period of 2010-16, units in this sector were estimated to annually grow the most
(28.97%) followed by chemical/pharmaceuticals and paper board/printing industries (11.43% vs.
9.24%). Export oriented units grew the most annually for chemical/pharmaceutical and agro food
sectors (46.80% vs. 36.8%) during 2010-16, followed by engineering (31.45%) and jute and jute
related products (27%). However, during this period, there was an annual decline in the export
oriented units of other sectors (-15.3%).
Table 3. 4: Growth of industrial units and export oriented units by sectors
Sector 2016 2010
Compound yearly growth rate (%)
2010-2016
No. of Unit Export
Oriented Unit
No. of Unit Export
Oriented Unit
No. of Unit
Export Oriented
Unit
Agro food processing
1209 (28.12%)
39(3.79%) 702
(27.69%) 4
(2.91%) 8.08 36.81
Textile 1489
(34.64%) 922(88.63%)
953 (37.60%)
139 (91.94%)
6.58 31.05
Forestry 79(1.85%) 0
(0.00%) 57
(2.26%) 0
(0.00%) 4.78
Jute and jute related products
36(0.84%) 9
(0.83%) 24
(0.96%) 2
(1.06%) 5.73 27.22
Paper board, printing & packaging
154(3.58%) 5
(0.47%) 83
(3.27%) 0
(0.26%) 9.23
Tannery, leather & rubber
59(1.38%) 4
(0.36%) 36
(1.43%) 0
(0.26%) 7.30
Chemical & pharmaceutical
611 (14.22%)
47(4.50%) 287
(11.31%) 3
(2.11%) 11.42 46.80
Engineering 552
(12.84%) 14(1.30%)
325 (12.82%)
2 (1.32%)
7.86 31.45
ICT 8
(0.18%) 0
(0.00%) 1
(0.05%) 0
(0.00%) 28.97
Others 102(2.37%) 1
(0.12%) 66
(2.62%) 4
(0.13%) 6.32 -15.33
Total 4299 1040 2535 151 7.84 31.74
N 72 59
*Percentage shares in brackets;
Source: BIDS Survey data, 2017

26
The concentration of different types of industries varied across regions (Table 3.5). The possible
reasons may be due to the availability of the raw materials, availability of gas, local demand,
labour cost and connectivity to the destinations as well. Rajshahi, Rangpur and Sylhet have a
larger concentration of agro food processing industries (48% vs. 55.8% vs. 45.9%) relative to
other divisions. About three fifths of the textile firms are located in Dhaka. More than a fifth of the
chemical and pharmaceutical industries are concentrated in Chittagong, Rajshahi and Rangpur.
About a fifth of the engineering industries are located in Sylhet, Khulna and Chittagong.
Table 3. 5: Sector wise % of firms in estates by division
Industry Barisal Chittagong Dhaka Khulna Rajshahi Rangpur Sylhet Total
Agro food processing
29.9 30.4 15.7 39.2 48.0 55.8 45.9 28.1
Textile 12.2 15.8 60.6 4.3 12.5 2.8 5.3 34.6
Forestry 8.9 1.2 0.5 9.1 0.6 1.6 2.5 1.8
Jute and jute related
4.4 0.1 0.3 2.6 0.8 2.8 0.0 0.8
Paper board, printing & packaging
4.1 6.6 3.3 3.1 1.2 0.3 4.2 3.6
Tannery, leather & rubber
1.1 2.2 1.5 1.1 0.4 0.3 1.8 1.4
Chemical & pharmaceutical
16.2 23.4 7.9 16.5 21.0 20.2 15.2 14.2
Engineering 13.7 18.5 8.6 19.3 14.8 12.9 18.7 12.8
ICT 1.1 0.1 0.2 0.0 0.0 0.0 0.0 0.2
Others 8.5 1.7 1.4 4.8 0.8 3.2 6.4 2.4
Total 100.0 100.0 100.0 100.0 100.0 100.0 100.0 100.0
No of units 295 1009 2687 383 564 345 308 5590
Source: BIDS Survey data, 2017
3.3.2 Size distribution of the industrial units/enterprises
The size distribution of enterprises follows the definitions given in the industrial policy. It was
evident from the survey that the total number of industrial units (enterprise) in the estates was
3784 (reported by 59 industrial estates) and 5590 (reported by 72 industrial estates) in 2010 and
2016 respectively. Majority of the industrial units (enterprise) in both 2010 and 2016 were
micro/cottage (81.9% vs. 70.6%) followed by small (15.3% vs. 18.7%) and medium size enterprise
(2.7% vs. 10.7%). From 2010-16 medium industrial units (enterprises) had the highest annual
growth rate (28.72%) relative to small and micro/cottage category (8.81% vs. 3 %) (Table 3.6).

27
Table 3. 6: Size distribution of industrial units (enterprise)
Size 2010 2016
N % N %
Micro/cottage 3099 81.9 3947 70.6
Small 579 15.3 1045 18.7
Medium 102 2.7 598 10.7
Large 4 0.1 6 0.1
Total 3784 100.0 5590 100.0
Source: BIDS Survey data, 2017
3.3.3 Size distribution of the industrial units/enterprises
On the basis of production status, the industrial units can be defined either as “own production”,
“rented” or “sub-contracting”. The industrial units that are being used by the proprietors for
industrial production purpose, are treated as “own production units”; if the proprietor rents their
unused portion (up to 50 percent of the plot as per BSCIC rule), it is called as “rented”; and if the
units are used for others’ production are called as “sub-contracting” enterprises. Our survey
reveals that majority of the enterprises are engaged in own production (98%), and only a small
proportion (1.7%) of the units are operating as rented. Also some enterprises are engaged in sub-
contracting purposes. Over the period of time, the proportion of rented enterprises grew by 10%
whereas the proportion of sub-contracting firms declined by 11.29% (Table 3.7).
Table 3. 7: Number of owned and rented units
Production type 2016 2010 CAGR
(%) Number Percentage Number Percentage
Own production 5487 98.15 3720 98.30 5.71
Sub-contracting 7 0.12 16 0.41 -11.29
Rented (up to 50% of the plot)
95 1.70 48 1.28 10.11
Others 2 0.03 0 0.00
Total 5590 100 3784 100 5.73
Source: BIDS Survey data, 2017
3.4 Performance of Estates
3.4.1 Employment in BSCIC Estates
At the estate level, estate officers and other staff members have to perform a lot of jobs and thus,
they are overburdened. Their jobs include providing administrative support to the industrial unit
owners, monitoring the water supply, maintaining the internal infrastructure, collecting enterprise

28
level information (production, employment, investment, export value etc.), providing monthly
information to the head quarter etc. The sanctioned manpower appears to be inadequate
considering the need of estates. In some estates, there are no assigned estate officers. We found
that 60 officers and 264 staff are working in the 72 industrial estates against the sanctioned
position of 101 officers and 372 staff. The percentage of vacant positions against sanctioned
positions was higher for officers relative to staff (35% vs. 28.4%). Overall, 41 officers and 149
staff positions are vacant which needs to be filled out on an urgent basis. (Table 3.8).
Table 3. 8: Average BSCIC manpower of the industrial estate offices
Category Sanctioned (number)
Existing
(number)
Number of vacant position against
sanctioned position
Officer 101 60 41 (35.0 %)
Staff 372 264 108 (28.4 %)
Total 473 324 149 (31.7 %)
Source: BIDS Survey data, 2017
Compared to other divisions, the proportion of vacant officer posts against those sanctioned is
relatively higher in Rangpur and Rajshahi (56.3% vs. 50%). Regarding vacant staff posts, Sylhet
and Chittagong have a higher proportion (45% vs. 33.5%) relative to other divisions(Table 3.9).
Table 3. 9: Proportion of vacant posts against the sanctioned by division and category
Division Officer
sanctioned (number)
Officers existing (number)
Officer vacancy
Staff sanctioned (number)
Staff existing (number)
Staff vacancy
Barisal 6 4 2 (25.0%) 22 18 4 (18.3%)
Chittagong 23 13 10 (37.5%) 83 53 30 (33.5%)
Dhaka 31 21 10 (25.0%) 118 81 37 (31.1%)
Khulna 11 6 5 (42.9%) 38 29 9 (25.7%)
Rajshahi 13 6 7 (50.0%) 44 37 7 (14.0%)
Rangpur 11 5 6 (56.3%) 41 32 9 (21.7%)
Sylhet 6 5 1 (10.0%) 26 14 12 (45.3%)
Total 101 60 41 (35.0%) 372 264 108 (28.4%)
Source: BIDS Survey data, 2017
3.4.2 Investment
The rate of investment is an important indicator that sketches the efficiency level of firm’s
investments. We asked the estate officers to provide the information regarding investment,
production, revenue etc. Investments for estate development and industrial units in the current
year (2016) are reported to be Tk. 60114.1 and Tk. 971019.8 million taka respectively. During
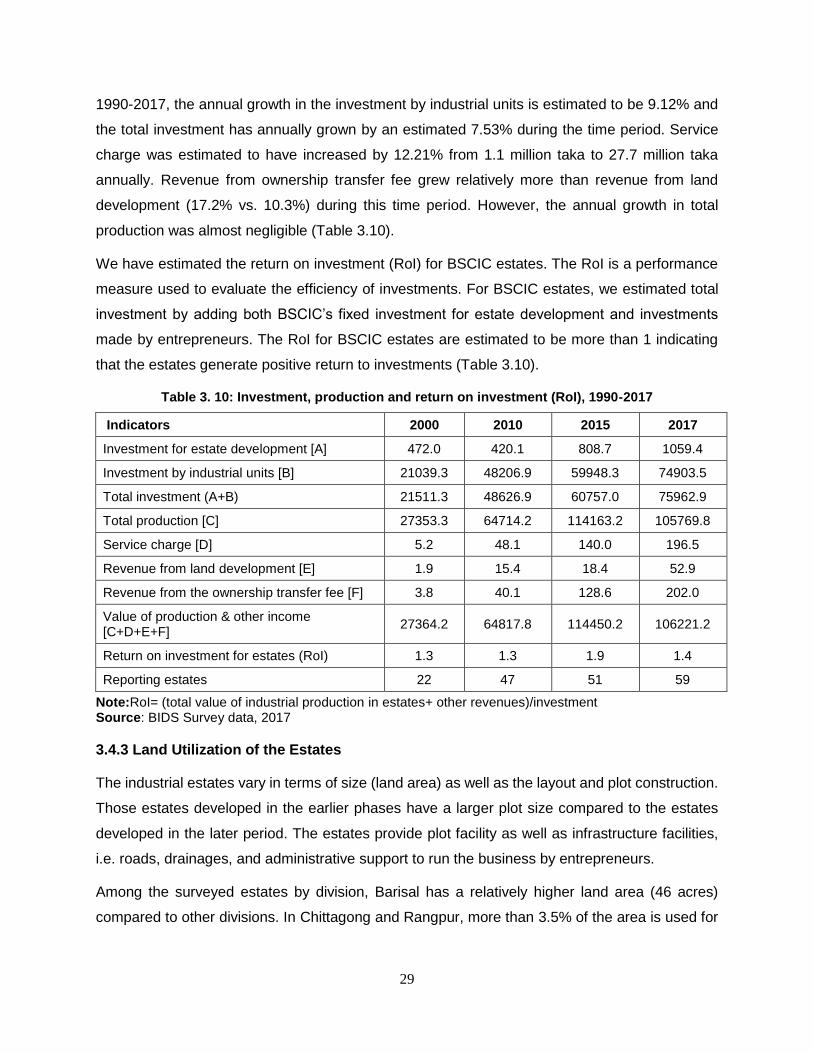
29
1990-2017, the annual growth in the investment by industrial units is estimated to be 9.12% and
the total investment has annually grown by an estimated 7.53% during the time period. Service
charge was estimated to have increased by 12.21% from 1.1 million taka to 27.7 million taka
annually. Revenue from ownership transfer fee grew relatively more than revenue from land
development (17.2% vs. 10.3%) during this time period. However, the annual growth in total
production was almost negligible (Table 3.10).
We have estimated the return on investment (RoI) for BSCIC estates. The RoI is a performance
measure used to evaluate the efficiency of investments. For BSCIC estates, we estimated total
investment by adding both BSCIC’s fixed investment for estate development and investments
made by entrepreneurs. The RoI for BSCIC estates are estimated to be more than 1 indicating
that the estates generate positive return to investments (Table 3.10).
Table 3. 10: Investment, production and return on investment (RoI), 1990-2017
Indicators 2000 2010 2015 2017
Investment for estate development [A] 472.0 420.1 808.7 1059.4
Investment by industrial units [B] 21039.3 48206.9 59948.3 74903.5
Total investment (A+B) 21511.3 48626.9 60757.0 75962.9
Total production [C] 27353.3 64714.2 114163.2 105769.8
Service charge [D] 5.2 48.1 140.0 196.5
Revenue from land development [E] 1.9 15.4 18.4 52.9
Revenue from the ownership transfer fee [F] 3.8 40.1 128.6 202.0
Value of production & other income [C+D+E+F]
27364.2 64817.8 114450.2 106221.2
Return on investment for estates (RoI) 1.3 1.3 1.9 1.4
Reporting estates 22 47 51 59
Note:RoI= (total value of industrial production in estates+ other revenues)/investment Source: BIDS Survey data, 2017
3.4.3 Land Utilization of the Estates
The industrial estates vary in terms of size (land area) as well as the layout and plot construction.
Those estates developed in the earlier phases have a larger plot size compared to the estates
developed in the later period. The estates provide plot facility as well as infrastructure facilities,
i.e. roads, drainages, and administrative support to run the business by entrepreneurs.
Among the surveyed estates by division, Barisal has a relatively higher land area (46 acres)
compared to other divisions. In Chittagong and Rangpur, more than 3.5% of the area is used for

30
administrative purposes and other purposes, such as for green space, mosques etc. The
percentage of area used for roads and drains ranges from 17-20% within all divisions (Table 3.11).
Table 3. 11: Land utilization by division
Division Land area (in acres) % of area for administrative
purposes and others including green spaces, ponds etc.
% of area for road and drainages systems
Barisal 46.3 5.1 17.9
Chittagong 20.0 3.6 19.2
Dhaka 23.5 3.3 18.5
Khulna 24.8 4.2 17.4
Rajshahi 24.8 2.9 19.9
Rangpur 18.4 4.0 18.8
Sylhet 19.7 2.9 19.1
Average 23.4 3.6 18.8
Source: BIDS Survey 2017.
3.4.4 Ownership Transfer of the Enterprises
As per BSCIC regulation, the bad performing enterprises can transfer their ownership with the
prior permission from the BSCIC headquarter. In 2016, a total of 263 enterprises transferred the
ownership and most of them were in micro/cottage category. The total number of micro/cottage
and small units that have transferred ownership was relatively more in 2016 than 2010 (223 vs.
174). The ownership transfer process currently takes about six months (Table 3.12).
Due to the market demand, availability of raw materials and transfer of ownership, with the
permission from BSCIC and a proper reason, an enterprise can change their sector or trade. The
total number of micro/cottage units that has changed sector/trade was more in 2010 compared to
2016 (168 vs. 96). Mainly micro/cottage industrial units changed industry type more frequently,
relative to small, medium and large units (Table 3.12).

31
Table 3. 12: Ownership changes: Number and time required
2010 2016
Micro/ cottage
Small Mediu
m Total
Micro/ cottag
e
Small
Medium
Total
Total number of industrial units (enterprise) changed ownership
174 39 0 213 223 40 0 263
Average number of industrial units (enterprise) changed ownership (valid cases)
3.1 4.3 0.0 - 4.0 4.0 0.0
Number of times (on average) ownership changed
1.7 1.2 0.0 - 1.0 1.3 0.0
Average amount of time required to complete the ownership changed (in weeks)
17.8 3.8 2.0 - 21.7 3.9 0.0
Enterprise Type Changed
Total number of industrial units (enterprise) changed type of Industry sector
168 12 0 180 96 12 0 108
Average number of industrial units (enterprise) type of Industry changed
5.3 3.0 0.0 - 3.0 2.0 0.0 -
Number of times (on average) type of Industry changed
0.6 1.5 0.0 - 0.9 1.2 0.0 -
Source: BIDS Survey data, 2017
3.5 Revenues and Expenditure of the Industrial Estates
To establish an industrial estate, the major cost involves land purchase and development,
infrastructural development and utilities supply. After the development of an estate, staff salaries
and benefits emerge as one of the vital costs followed by the repairing and maintenance costs of
the estates. Simultaneously, BSCIC receives revenues from allotted plot owners as land
premiums, service charges and others. Table 3.13 presents the amount and proportion of money
received as revenues by BSCIC industrial estates in the years 2010-11 and 2015-16. Overall, the
revenue increases more than 12 percent each year, during this period. The majority (55%) of the
revenue came from land premium in 2010, which reduces to 30.3% in 2016. This is however,
expected, as the latest estates were developed in 2007. Once the plot is allotted, industrial estates
collect service charge from each of the plot owners which is one of the major revenue contributors
followed by the revenues collected from ownership transfer fees. In 2015-16, the revenue from
ownership transfer was the second most revenue contributor after the land premium. Revenues
collected from land development tax (7.8%), rental income (2.0%) and charges for water supply

32
(2.0%) also contributed to a significant amount of revenues in 2015-16. In terms of annual growth
over 2010-2016, major growth is seen in the case of ownership transfer fees (68.9%), followed
by fees for road cutting and structural change (34%), service charge (19.6%), land development
tax (19.1%) and bank interest (10.5%).
Table 3. 13: Revenue items of the industrial estates of BSCIC
Revenue items
2010-11 2015-16 CAGR
(%) Amount (Tk.)
% of total
Amount (Tk.)
% of total
Land premium including interest income 42934000 55.8 37303000 30.3 -3.5
Service charge 15527500 20.2 31759100 25.8 19.6
Land development tax 4792700 6.2 9627960 7.8 19.1
Agricultural development tax 0.0 482000 0.4
Plan approval/design & layout fees 652000 0.8 778000 0.6 4.5
Bank interest 1356000 1.8 2022000 1.6 10.5
Rental income from house, industrial units, rest house, market and storage
2459500 3.2 2465200 2.0 0.1
Ownership transfer fees 4109500 5.3 33414000 27.1 68.9
Charges for water (including interest income) and water line connection
3283300 4.3 2523200 2.0 -6.4
Fees for road cutting, organizational structure changes
183500 0.2 591000 0.5 34.0
Income through publication and form sales 195000 0.3 159500 0.1 -4.9
Income from land and pond leased 1423000 1.8 1970000 1.6 8.5
Miscellaneous/other income 45000 0.1 57800 0.0 6.5
Total revenues 76961000 100.0 123152760 100.0 12.5
Source: Budget documents, BSCIC
The major expenditure items are listed in the Table 3.14, which illustrates the amount and
percentage of spending on four different major spending items i.e. staff and assistants’ salaries,
allowances & retirement benefits, supply and services and spending for repairing and
maintenances cost. Overall expenditure grew by about 20% each year. Most of the spending went
for the salaries and allowances (43.1%) followed by the spending on repairing and maintenances
(42%) and supply and services (13%)12. Expenditure on repairing and maintenance became one
12 Though we wanted to report expenditures and revenues of estates from the audited reports, we could not do it as the audited reports are available up to 2012-13. Further, though some discrepencies do exist between audited and unaudited reports, the overall trends show the same direction and therefore we feel that reporting figures from unaudited report may not be a big problem. The another problem that prohibited us to use the audited report is that the report does not included estate-wise revenues and expenditures.
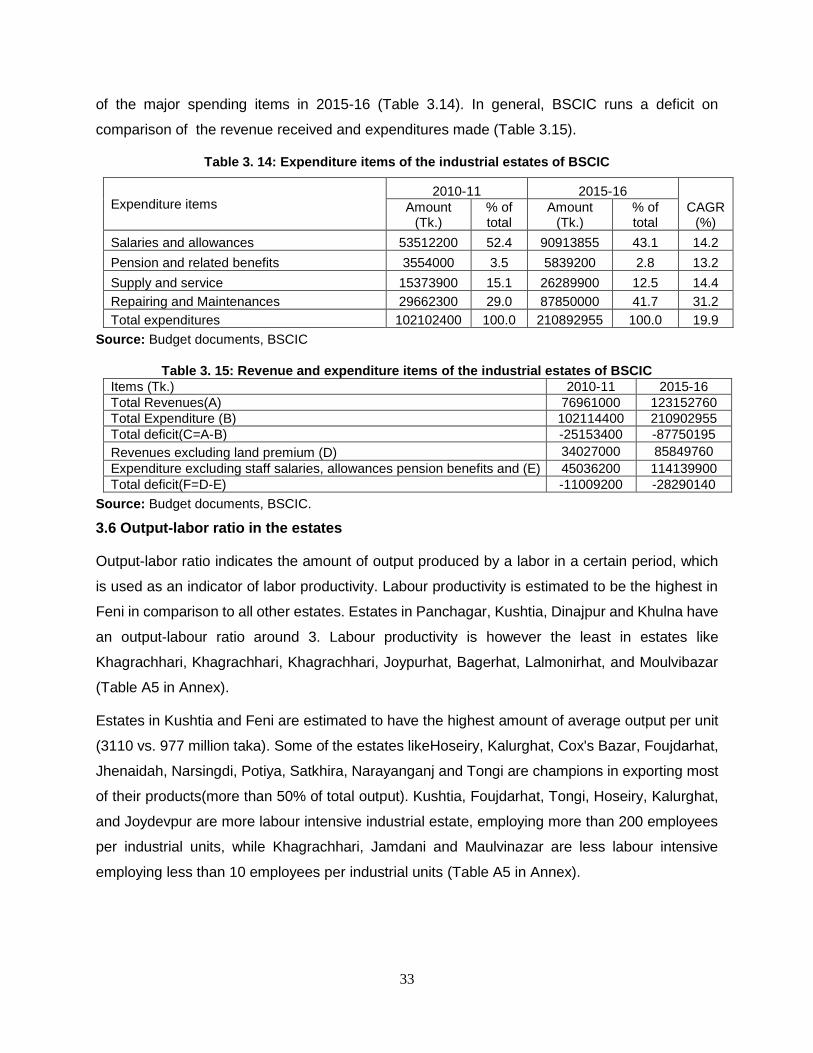
33
of the major spending items in 2015-16 (Table 3.14). In general, BSCIC runs a deficit on
comparison of the revenue received and expenditures made (Table 3.15).
Table 3. 14: Expenditure items of the industrial estates of BSCIC
Expenditure items 2010-11 2015-16
CAGR (%)
Amount (Tk.)
% of total
Amount (Tk.)
% of total
Salaries and allowances 53512200 52.4 90913855 43.1 14.2
Pension and related benefits 3554000 3.5 5839200 2.8 13.2
Supply and service 15373900 15.1 26289900 12.5 14.4
Repairing and Maintenances 29662300 29.0 87850000 41.7 31.2
Total expenditures 102102400 100.0 210892955 100.0 19.9
Source: Budget documents, BSCIC
Table 3. 15: Revenue and expenditure items of the industrial estates of BSCIC
Items (Tk.) 2010-11 2015-16
Total Revenues(A) 76961000 123152760
Total Expenditure (B) 102114400 210902955
Total deficit(C=A-B) -25153400 -87750195
Revenues excluding land premium (D) 34027000 85849760
Expenditure excluding staff salaries, allowances pension benefits and (E) 45036200 114139900
Total deficit(F=D-E) -11009200 -28290140
Source: Budget documents, BSCIC.
3.6 Output-labor ratio in the estates
Output-labor ratio indicates the amount of output produced by a labor in a certain period, which
is used as an indicator of labor productivity. Labour productivity is estimated to be the highest in
Feni in comparison to all other estates. Estates in Panchagar, Kushtia, Dinajpur and Khulna have
an output-labour ratio around 3. Labour productivity is however the least in estates like
Khagrachhari, Khagrachhari, Khagrachhari, Joypurhat, Bagerhat, Lalmonirhat, and Moulvibazar
(Table A5 in Annex).
Estates in Kushtia and Feni are estimated to have the highest amount of average output per unit
(3110 vs. 977 million taka). Some of the estates likeHoseiry, Kalurghat, Cox's Bazar, Foujdarhat,
Jhenaidah, Narsingdi, Potiya, Satkhira, Narayanganj and Tongi are champions in exporting most
of their products(more than 50% of total output). Kushtia, Foujdarhat, Tongi, Hoseiry, Kalurghat,
and Joydevpur are more labour intensive industrial estate, employing more than 200 employees
per industrial units, while Khagrachhari, Jamdani and Maulvinazar are less labour intensive
employing less than 10 employees per industrial units (Table A5 in Annex).

34
3.12 A Case Study on JamdaniPolli (Specialized Estate)
This industrial estate was established during 1993-99 in the district of Narayanganj. The estate was
established on 20 acres of land and has 407 industrial plots in categories A (352 plots consisting of 1500
sq. ft.) and S (55 plotsconsisting of 1200 sq. ft.). Among them, currently 310 plots are being used by
enterprises, 25 enterprises are ready for production, 16 plots are under construction and the rest of the
56 plots are sick units.
Historically,Jamdani craftsmen were available in this locality,which is why this location was chosen by
the government to establish this specialized estate. In addition, there were several other factors such as
the close proximity to the national highway, availability of raw materials and clean water which made this
particular location more appealing for the Jamdani Estate.
Employment generation: Around 2500-2600 workers are now working in the running
Jamdanienterprises. About 30% of the workers are from the surrounding local area while the rest of the
70% come from other places. Excluding food and shelter,the head craftsmen receives around 1200-1800
TK per week while the junior craftsmen or trainees receive around 800-1000 TK per week.Due to low
wages, Jamdani craftsmen are currently losing their interest of working in this sector and rather prefer
working in the textile sector at a higher wage rate.Weavers are dwelling inside the plots.
Special features of a weaver:Each handloom requires two weavers. The Master weaver usually sits on
the right side while the trainee/junior craftsman sits on the left. The weaving of Jamdanisari’s requires
attention and skill which can only be honed from years of experience and thus, creates a demand for
children to be hired as trainees. Children, who are good at learning, are hired and trained as weavers at
a young age by the master weaver. Since, the child is usually not of a working age, the owner pays an
amount of 50-60,000 taka in advance to the child’s family, in order to get the child involved in this line of
work. However, this leads to a lot of problems. Children often leave without notice and usually the owners
end up losing the advance payment they had made earlier. Apart from that, child labour laws have also
led some of the owners to be prosecuted. Despite, all of these issues, the owners insist on using child
labour and have requested BSCIC’s assistance in training the new weavers.
Impact on tertiary economy:On 30th November 2007, ahaat (local wholesale bazar) was established,
inside the BSCIC estate. This hutsells local products and operates only on Fridays from 6:00 am to 8:00
am. Around 60 to 65 lac Tk worth ofJamdani clothes/saris have been sold in each haat. About 35% of
these clothes are from local BSCIC industries while the rest are from outside BSCIC industries. About 8-
10 shops that sell knitting yarn and other related materials, have been established inside and are located
within a one kilometre distancefrom BSCIC. . In addition, almost 20-30 showrooms have been
established to sell products from BSCIC’sJamdani industries.All the workers reside in their industry
premise. Though the price of land increased several times in surrounding areas, but it is difficult to
distinguish the impact of BSCIC and other textile industries.
Infrastructure:The roads and the drainage system inside BSCIC are very poor. Waterlogging is a regular
phenomenon of this estate. There are no toilet facilities for the sellers and buyers on the haat day.

35
Waste management: None of the Jamdani enterprises have solid waste to throw outside while the liquid
wastes passes through the local drainage system to the river. Drainage system needs to be improved.
Sick industries:Some of the firms became sick for the following reasons:
1. Industry owners are facing problems regarding the hiring of trained craftsmen to run the
handlooms.
2. Financial crisis faced by the owners.
3. Lower price of the product.
A SWOT analysis has been done below to highlight the strengths, weaknesses, opportunities and threats
of this sector
Strength:
1. BSCIC Jamdaniestate is a good place for investment as the investor can have access to
developed plots, electricity connection, and a good business environment in comparison to plots
acquired outside BSCIC
2. Availability of craftsmen in the locality.
3. It has haat inside the estate for selling the product and creates an opportunity to build a network
for sellers.
Weakness:
1. Estate office has insufficient staff
2. Unavailability of craftsman and other skilled workers
Opportunities:
1. The estate provides an opportunity to create a linkage with the market.
2. As the estate has been built in a place where Jamdani has been historically crafted, the estate
creates an opportunity for greater employment and production of Jamdani products.
Threats:
1. Facing problems of lower priced products coming from outside BSCIC industries and outside of
the country.
3. Raw materials price is increasing faster than the prices ofJamdanisharee.
4. Difficulties of getting trained craftsmen to run the handlooms.
5. Low wages as well as return on investment

36
3.7 Summary of the findings
A total of 76 industrial estates has so far been established with 2 estates are yet to be in operation.
The estates were being established in six phases starting from 1960 and the latest phase was
completed in 2010. A total of 1969 acre of land was utilized for establishing 74 estates—of which
3.6% land was used for administrative and other (Mosques/bank etc.) and 19% was used for
roads and drainage system. A total of 10389 plots were developed in 74 estates, 96.8% of which
were being allotted to entrepreneurs. The latest MIS report of BSCIC suggests that among of the
allotted plots, about 22% of the plots remained unutilized. This huge amount of unutilized plots is
a big concern for BSCIC though in most cases the reasons for un-utilization remain beyond the
control of BSCIC. In general, the low utilization is a culmination of several factors including
weaknesses in enforceability of rules and regulations, problems in selection process of
entrepreneurs while allocating plots, in some cases infrastructure bottlenecks (gas/electricity
connection) etc. Plot utilization rate is the lowest in Barisal division (50%) and highest in Rajshahi
(95%). About 4% units become sick every year mainly due to financial constraints, which is also
a cause of concern, and indirectly related to entrepreneur selection problem. About 35% of the
posts in estate offices remained vacant for long time, which adversely affects the estate
management affairs. About 300 firms change their ownership every year and about 160 firms
change trade every year. However, the process takes about six months due to centralized
approach of BSCIC, which causes a loss to entrepreneurs. The process thus needs to be revisited
so that such changes can be approved in a short-period of time, say maximum 1-2 months.
The existing estates provide about 0.56 million employments with negligible growth over time.
Despite stagnant employment, production has been growing at a rate 10% annually indicating
increased productivity of the firms. About 21% of the firms are engaged in exporting and their
export growth is about 5% annually. Among the enterprises in BSCIC estates, textile and agro-
food processing units dominate having 35% and 28% of their share respectively.The estimated
Return on investment (RoI) for BSCIC estates over time is found to be more than 1 indicating that
the estates generate positive return on investment.

37
Chapter 4: Plot allotment, Infrastructural Facilities and Related Problems in BSCIC Industrial Estates
4.1 Determination of location of estates
The factors that determine the location of estates are assessed through focus group discussion
and key informant interviews with local stakeholders. In most cases, industrial estates were
developed on agricultural and low land, where single or two crops were being produced at the
time of land acquisition for establishment of BSCIC industrial estates. FGD data reveals that
estates were established in such places where road communications were better from district or
national highway. However, in some cases local political leaders had influence behind the
selection of the estate sites. The other factors that determine the location of sites include
availability of raw materials and labors, such as the Jamadani Estate in Naraynganj. The FGD
findings confirm that products are being produced in local BSCIC industries usually targeting the
local markets (Table 4.1).
Table 4. 1: Location of industrial estate
Category Average distance
(k.m.)
Std. Deviation
Min. Max.
From district BSCIC office 12.2 12.9 0 50
From upazilasadar 9.7 33.9 0.25 270
From Dhaka 226.2 122.4 4 500
From nearest land port 72.2 67.1 0.4 320
From nearest river port 58.9 93.3 1 450
From nearest sea port 189.1 172.1 0.5 750
From local market 5.9 25.2 0.25 200
From nearest rail station 24.8 51.7 0.1 250
From nearest bus station 5.3 12.9 0.5 100
From nearest bank branch 6.8 22.6 0.1 150
From nearest intercity highways 3.1 4.7 0 20
Source: BIDS Survey 2017
In regard to site selection, Key Informant Interviews (KIIs) also support the FGD findings. Among
the key determinants of site selection, the main reason being the good connectivity (86.23%
responses) followed by availability of land (60%), labor (45%) and raw materials (39.13%). Almost
all (97%) respondents of the KIIs said that the estates were established in the right places(Table
4.2).

38
Table 4. 2: Selection Criteria of the Place for the Current Estate
Selection criteria Frequency % of responses
Beside a highway/good connectivity 119 86.23
Land was easy to avail/Government Khas land 80 57.97
Away from residential area 5 3.62
A little distant away from a city/ Near to a city 44 31.88
Developed area 3 2.17
Relatively land price was low 1 0.72
Accessibility of electricity 15 10.87
Good drainage system 1 0.72
Advantageous to marketing of goods 28 20.29
Availability of labor/skilled labor 62 44.93
Ease transportation via river ways 2 1.45
Availability of raw materials 54 39.13
Nearby river port 1 0.72
Political consideration 15 10.87
No agricultural land/fallow land 8 5.8
Agricultural land 4 2.9
Creation of employment opportunities 4 2.9
Readymade infrastructure 7 5.07
Availability of gas 1 0.72
Total 139 Source: BIDS Survey 2017
4.2 Infrastructure facilities
Almost all estates have electricity connection while only 57% estates have gas supply connection.
About 80% estates have water supply facilities and 37 estates have ETP established by individual
enterprises. Only one third estates have broadband internet connection and 78% estate offices
have a computer for office use.
While 97.5% enterprises have electricity connection, only 43% have gas supply connection. About
75% industrial units have water supply facilities, 43% industrial units have ETP (established by
individual entrepreneur), 38% have broadband internet connection and 66.6% units’ office have
a computer for office use (Table 4.3)

39
Table 4. 3: Infrastructure and Utilities
Infrastructure and Utilities % of industrial estate
having electricity connection
% of industrial unit access to these
utilities
Electricity connection and supply 100.0 97.5
Gas supply 56.9 42.9
Water supply 80.4 74.9
ETP 37.0 43.3
Broadband internet connection 33.3 37.9
Computer for office use 78.3 66.6
Source: BIDS Survey 2017
Most of the respondents including local community people, industry owners and employees,
expressed their dissatisfaction about the road, boundary wall, drainage system and street light
inside the BSCIC estates (Table 4.4). Industry owners have to rent extra small vehicle to load and
unload their raw materials and finished products because of poor road situation inside the estate.
Industry owners want strong road inside the estates to load and unload their raw materials and
products from factories using heavy trucks. Except a few BSCIC estates, all others have serious
problem of waterlogging due to poor maintenance of the existing drainage system. None of the
BSCIC estates have boundary wall which is a major concern of the industry owners and
employees to protect their valuable goods. Even street lights are not available in most of the
estates which creates a threat to the security and the safety of the estates. About 81%
respondents are worried at the problem of roads and drainage system inside the estates. Second
most responses (9.23%) identified boundary wall as the major problem. Estate officials argued
that they have to send the service charges they receive from industries to the central office.
Annually, they receive only ten thousand taka for cleaning of the estates’ drainage system, which
is not adequate.
Table 4. 4: Problems of Infrastructure inside the Estate
Problems inside BSCIC the estate Frequency % of cases
No security gate 1 0.77
No boundary walls 12 9.23
Problem of roads and drainage system 105 80.77
There are no moats/jeti 1 0.77
No gas supply 7 5.38
Office infrastructure is old 1 0.77
No water supply 7 5.38
No CETP 4 3.08
Low gas pressure 1 0.77
Total 139 Source: BIDS Survey 2017
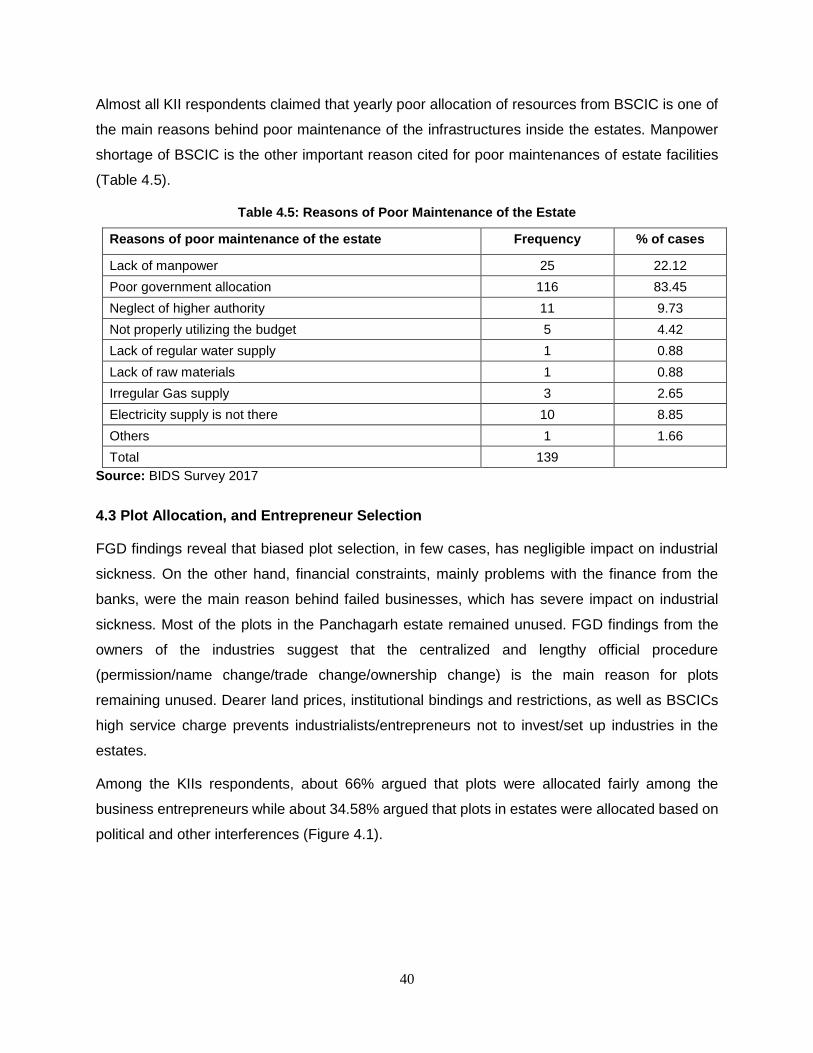
40
Almost all KII respondents claimed that yearly poor allocation of resources from BSCIC is one of
the main reasons behind poor maintenance of the infrastructures inside the estates. Manpower
shortage of BSCIC is the other important reason cited for poor maintenances of estate facilities
(Table 4.5).
Table 4.5: Reasons of Poor Maintenance of the Estate
Reasons of poor maintenance of the estate Frequency % of cases
Lack of manpower 25 22.12
Poor government allocation 116 83.45
Neglect of higher authority 11 9.73
Not properly utilizing the budget 5 4.42
Lack of regular water supply 1 0.88
Lack of raw materials 1 0.88
Irregular Gas supply 3 2.65
Electricity supply is not there 10 8.85
Others 1 1.66
Total 139 Source: BIDS Survey 2017
4.3 Plot Allocation, and Entrepreneur Selection
FGD findings reveal that biased plot selection, in few cases, has negligible impact on industrial
sickness. On the other hand, financial constraints, mainly problems with the finance from the
banks, were the main reason behind failed businesses, which has severe impact on industrial
sickness. Most of the plots in the Panchagarh estate remained unused. FGD findings from the
owners of the industries suggest that the centralized and lengthy official procedure
(permission/name change/trade change/ownership change) is the main reason for plots
remaining unused. Dearer land prices, institutional bindings and restrictions, as well as BSCICs
high service charge prevents industrialists/entrepreneurs not to invest/set up industries in the
estates.
Among the KIIs respondents, about 66% argued that plots were allocated fairly among the
business entrepreneurs while about 34.58% argued that plots in estates were allocated based on
political and other interferences (Figure 4.1).
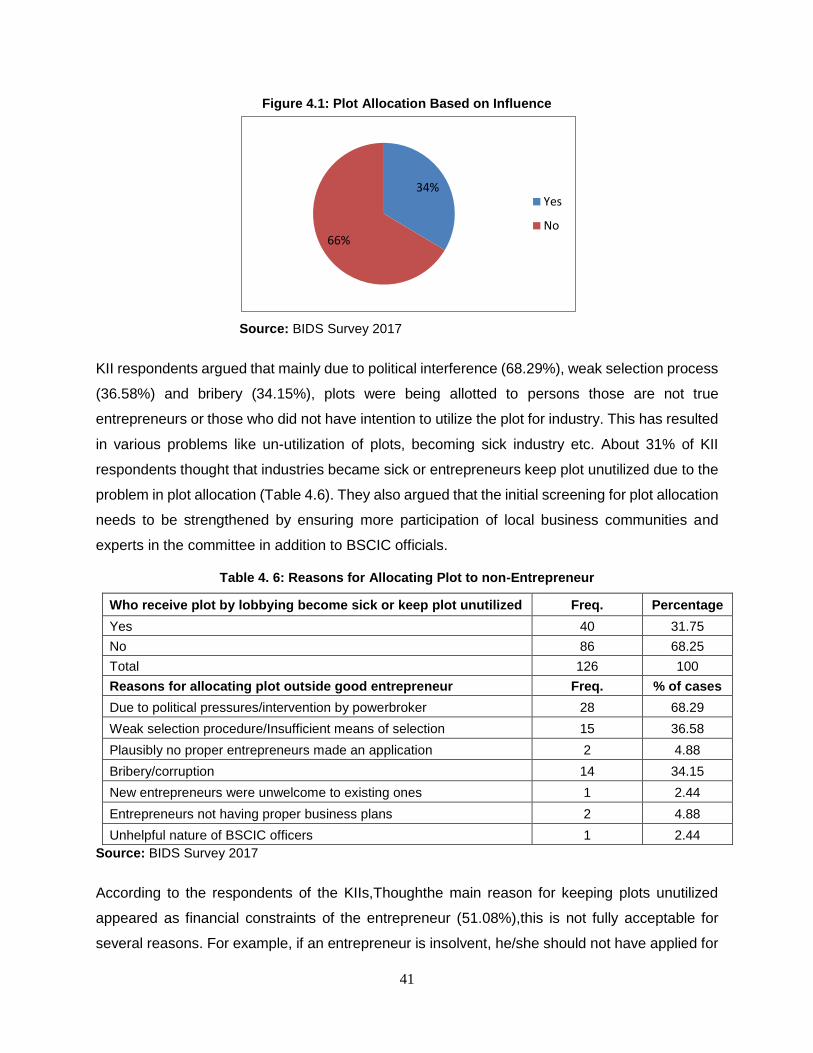
41
Figure 4.1: Plot Allocation Based on Influence
Source: BIDS Survey 2017
KII respondents argued that mainly due to political interference (68.29%), weak selection process
(36.58%) and bribery (34.15%), plots were being allotted to persons those are not true
entrepreneurs or those who did not have intention to utilize the plot for industry. This has resulted
in various problems like un-utilization of plots, becoming sick industry etc. About 31% of KII
respondents thought that industries became sick or entrepreneurs keep plot unutilized due to the
problem in plot allocation (Table 4.6). They also argued that the initial screening for plot allocation
needs to be strengthened by ensuring more participation of local business communities and
experts in the committee in addition to BSCIC officials.
Table 4. 6: Reasons for Allocating Plot to non-Entrepreneur
Who receive plot by lobbying become sick or keep plot unutilized Freq. Percentage
Yes 40 31.75
No 86 68.25
Total 126 100
Reasons for allocating plot outside good entrepreneur Freq. % of cases
Due to political pressures/intervention by powerbroker 28 68.29
Weak selection procedure/Insufficient means of selection 15 36.58
Plausibly no proper entrepreneurs made an application 2 4.88
Bribery/corruption 14 34.15
New entrepreneurs were unwelcome to existing ones 1 2.44
Entrepreneurs not having proper business plans 2 4.88
Unhelpful nature of BSCIC officers 1 2.44
Source: BIDS Survey 2017
According to the respondents of the KIIs,Thoughthe main reason for keeping plots unutilized
appeared as financial constraints of the entrepreneur (51.08%),this is not fully acceptable for
several reasons. For example, if an entrepreneur is insolvent, he/she should not have applied for
34%
66%
Yes
No

42
plot allotment. On the other hand, if it is true, then they took the plot by manipulating financial
information so that they could sell the plot in the future with high profit. So plot allotment process
to some extent is responsible for bad entrepreneur selection.The second highest cited reasons is
lack of proper utility services, such as gas and electricity (21.58%) and the third one is the lack of
experience (19.42%) (Table 4.7).
Table 4. 7: Reasons of Plots remaining unutilized
Reasons of vacancy Frequency % of
responses
Lack of skilled manpower 19 13.67
Problems in the marketing of products 19 13.67
Harassment for service charge and VAT 3 2.16
Complexity in implementing governmental policies 6 4.32
Financial problems (Lack of Bank Loan/ lack of working capital) 71 51.08
Road communication problem 6 4.32
Lack of regional industrial entrepreneurs 3 2.16
Difficulty in acquiring/availability of raw materials 16 11.51
Lack of advertising 2 1.44
Lack of experience 27 19.42
Plots being allocated only to influential people/non-businessmen 14 10.07
Not assisting new entrepreneurs from BSCIC 2 1.44
Utility problem (Gas/Electricity) 30 21.58
Due to having a court case on them 14 10.07
Salty water/too much iron in water 2 1.44
Using for residential purposes 1 0.72
Roads, drain, boundary not being there 3 2.16
Lack of modern technical equipment 1 0.72
Production cost is too much 12 8.63
N 139 --
Note: Multiple responses and therefore total will not make up 100%.Source: BIDS Survey 2017
4.4 Emerging Demand for Plots
Respondents opined that in the next 5 to 10 years, industries like mineral water, jute, food
processing, kitchen utensils and wood industries will have a higher demand relative to others
(above 80%). The demand for light engineering/machinery, plastic, and printing/packaging
industries will likely decrease in the next 5 to 10 years.

43
Table 4. 8: New demand for the industrial unit
Industry code Next 5 years Next 10 years
Mineral water 95.1 92.2
Jute products 74.1 70.8
Glass industry 62.8 56.8
Cattle/Poultry/Fish feed 55.6 51.2
Jute products 95.0 92.3
Dairy products 62.0 56.5
Food processing (flour, oil, juice, frozen food, salt etc.) 91.2 87.5
Readymade garments/batik/attire 66.7 63.4
Chemical 56.8 54.8
Printing and packaging 48.8 45.0
Medicine industry 78.0 73.9
Plastic 37.5 33.3
Handicrafts 52.4 43.6
Light engineering/machinery 17.7 14.7
Net industry 84.9 79.1
Polythene bag 79.3 73.3
Leather 75.0 70.6
Kitchen utensils-aluminum 88.5 84.8
Wood products 85.7 81.6
Steel/ISPAT 80.0 78.8
Source: BIDS Survey 2017
Demand for new plots is another important indicator of the opportunities for establishing new
estates. We asked only the chamber leaders, NASCIB leaders,and local industry association
leaders to understand the future demand for more plots inside the estates. Results in Table 4.9
show that 88.14% respondents think that their association members want new plot from BSCIC.
This result gives us a signal about the future demand of BSCIC estates.
Table 4. 9: Demand for More Plots among Association Members
Demand for more plots Freq. Percentage Cum.
Yes 52 88.14 88.14
No 7 11.86 100
Total 59 100 Source: BIDS Survey 2017

44
We also asked about what type of industries will have more demand for new plots in BSCIC
estates. In Table 4.10, all of the KIIs respondents have the opportunity to answer or to choose
more than one industry. Almost all of the respondents agreed that food processing industries will
have the highest demand for more plots in BSCIC industries. Second highest (51.73%) response
came for cattle/fish/poultry feed industries.
Table 4. 10: Type of Industries has Demand for More Plots
Types of Industry Frequency % of responses % of cases
Mineral water 6 3.73 10.34
Jute products 11 6.83 18.97
Glass industry 2 1.24 3.45
Cattle/Poultry/Fish feed 30 18.64 51.73
Jute products 5 3.11 8.62
Dairy products 3 1.86 5.17
Food processing (flour, oil, juice, frozen food, salt etc.) 56 34.77 96.55
Readymade garments/batik/attire 11 6.83 18.97
Chemical 2 1.24 3.45
Printing and packaging 3 1.86 5.17
Medicine industry 5 3.11 8.62
Plastic 8 4.97 13.79
Handicrafts 2 1.24 3.45
Light engineering/machinery 6 3.73 10.34
Net industry 3 1.86 5.17
Polythene bag 1 0.62 1.72
Leather 2 1.24 3.45
Kitchen utensils-aluminum 3 1.86 5.17
Wood products 1 0.62 1.72
Steel/ISPAT 1 0.62 1.72
Total 161 100 277.59
Source: BIDS Survey 2017
4.5 Environmental Aspects
We try to assess the environmental impact of BSCIC estates through FGDs. In Jamdani Estate
(Naryanganj) enterprises do not have any solid waste, and in Narshindi most of the industries
produce towel and their solid waste is used by comforter producing craftsmen. Most of the
industries in Patuakhali and Panchagarh are involved in food processing. Their residues are used
by fish or poultry feed firms. In Comilla BSCIC, almost 200 tonnesof solid waste are produced
annually, which is deposited inside the estate. The waste creates hazards for the environment.
On the other hand 15,000,000 liters of liquid waste generated from Comilla BSCIC, directly goes
to local canals and rivers through the drainage system. Liquid waste from all other four BSCIC
estates also goes to local canals and rivers through the drainage system which creates problems
for the environment.

45
Central Effluent Treatment Plant (CETP) is a new and necessary concept for industrial estates.
Only the tannery estate has a CETP. Only two factories in Comilla BSCIC have established ETP
that have a capacity of managing (8000+8000) = 16,000 liters. But local community people said
that these ETPs are not used at all. Even our field enumerators also found deactivated ETP (check
bulb was open) on those estates.
Table 4.11 shows that on an average, 1003 Tons of solid waste and 5144646 liters of liquid waste
are produced in each estate every year.
Table 4. 11: Solid and liquid Waste Production
Type Ton/liter
Yearly average solid waste produced by all the industries in the estate 1003
Yearly average liquid waste produced by all the industries in the estate 5144846
Source: BIDS Survey 2017
About 56% of the key informant respondents said that solid wastes are thrown everywhere—
inside and outside of the estates. About 15% said that in few cases, it is collected by the
municipality/city corporation. Almost 60% of the respondents agreed that liquid waste of the
industries directly goes to the river or canals through the drainage system of the estates (Table
4.12).
Table 4. 12: Solid and liquid Waste Disposal
Solid waste disposal type/place Percentage
Used for agricultural purposes 1.61
Livestock feed/used in betel leaf fields 4.84
Used in cooking 6.45
Jute cotton factory/quilt/mattress/ pillow is used 6.45
Waste is thrown everywhere (roads, canals, open space) 56.45
Waste is picked up from the municipality/waste is thrown 14.52
Fish feed 6.45
Fuel 3.23
Total 100.0
Liquid waste disposal type/place
The highway road passes by the BSCIC drain 27.5
Inside holes 3.9
Into rivers 25.5
Into canals 31.4
Goes into agricultural land and causes problems in cropping 9.8
Into ponds 2.0
Total 100
Source: BIDS Survey 2017

46
Regarding air pollution, we did not get any clear idea about air pollution of the industries of the
BSCIC estates from our FGD finding, but KIIs result gives us a specific idea about that kind of
pollution. About half of the respondents think that air pollution is very high and 40% think that it is
low in the industries inside BSCIC industrial estates (Table 4.13).
Table 4. 13: Air Pollution
Type of air pollution Percentage
Very high 50
High 10
Low 40
Source: BIDS Survey 2017
FGD findings show that few of the industries have their own ETP. However, KIIs reveal that on
an average 3.6 firms in each estate have ETP (Table 4.14). About 80% respondents think that
CETP is needed.
Table 4. 14: Effluent Treatment Plant (ETP) and Central Effluent Treatment Plant (CETP)
ETP Number/ Ton/Liter
Average number of ETP (Industry base) in each estate 3.6 Average total capacity of those ETPs in each estate 8933.3 CETP Yes No
Is there any CETP 0% 100%
Yes No
If there is no CETP, do you think it is needed? 80.49% 19.51%
Source: BIDS Survey 2017
4.6 Gender Issues
All the BSCIC estates covered by FGDs have female labour force mainly in production sector
except Panchagarh BSCIC. About 10% of female workers are working in the Jamdani Estate,
Naraynganj, 40% in Comilla BSCIC, 60% in Narsindi and 70% in Patuakhali. Inmost of the cases,
industries have separate female toilets, but none of the BSCIC industries have child care centers
for the female labour. So, they (female workers) have to arrange it themselves. In the production
sector, female workers received on an average 10% to 20% less wages than their male
counterparts. Female workers try to live within 1 to 2 kilometers of the industrial estate to ensure
their safety and security. FGD participants in Comilla expressed that female workers faced
problem both inside and outside theindustries. Sometimes, they faced eve teasing by their fellow
workers and local mastans. Female workers need a safe working environment inside the factory.
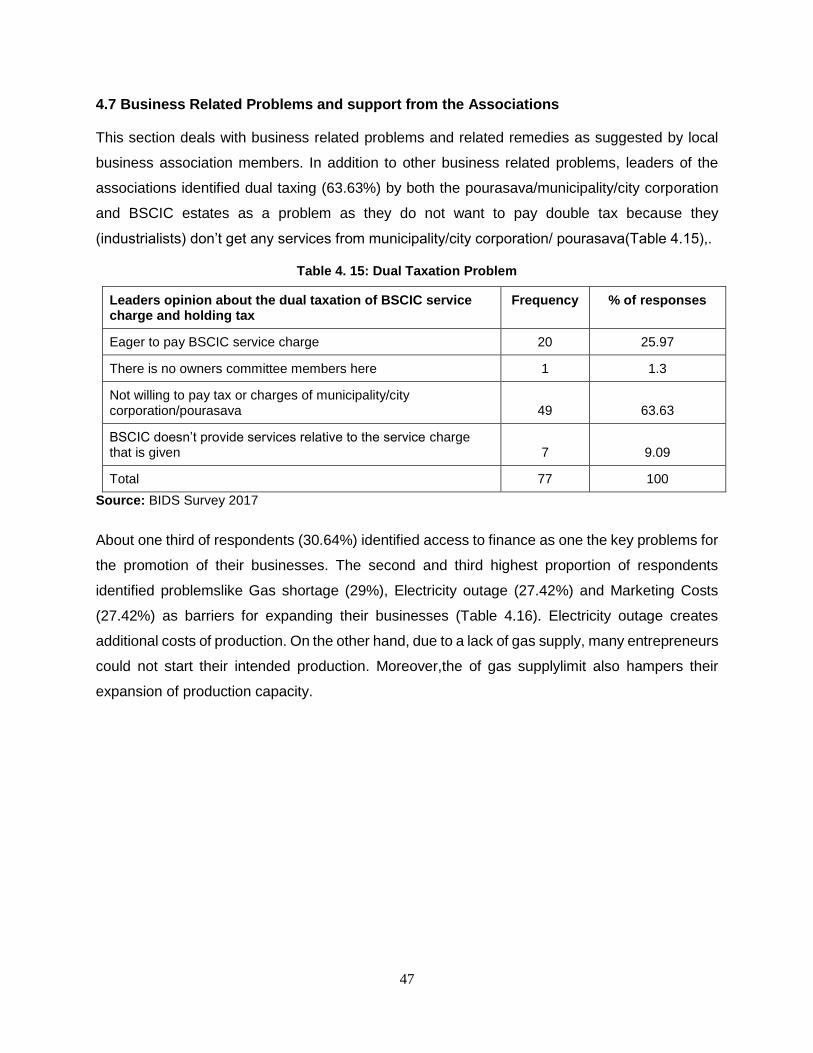
47
4.7 Business Related Problems and support from the Associations
This section deals with business related problems and related remedies as suggested by local
business association members. In addition to other business related problems, leaders of the
associations identified dual taxing (63.63%) by both the pourasava/municipality/city corporation
and BSCIC estates as a problem as they do not want to pay double tax because they
(industrialists) don’t get any services from municipality/city corporation/ pourasava(Table 4.15),.
Table 4. 15: Dual Taxation Problem
Leaders opinion about the dual taxation of BSCIC service charge and holding tax
Frequency % of responses
Eager to pay BSCIC service charge 20 25.97
There is no owners committee members here 1 1.3
Not willing to pay tax or charges of municipality/city corporation/pourasava 49 63.63
BSCIC doesn’t provide services relative to the service charge that is given 7 9.09
Total 77 100
Source: BIDS Survey 2017
About one third of respondents (30.64%) identified access to finance as one the key problems for
the promotion of their businesses. The second and third highest proportion of respondents
identified problemslike Gas shortage (29%), Electricity outage (27.42%) and Marketing Costs
(27.42%) as barriers for expanding their businesses (Table 4.16). Electricity outage creates
additional costs of production. On the other hand, due to a lack of gas supply, many entrepreneurs
could not start their intended production. Moreover,the of gas supplylimit also hampers their
expansion of production capacity.

48
Table 4. 16: Problem of the Entrepreneurs
Problem Frequency % of cases
Financial problem including loan related 19 30.64
Lack of skilled worker 8 12.9
Marketing costs are too high 17 27.42
No gas supply 18 29.03
No boundary/security 10 16.13
Load shedding of electricity 17 27.42
Machinery parts 2 3.23
Raw materials crisis 11 17.75
Lack of water supply 4 6.45
Extortion/ crime is there 1 1.61
Price of raw materials is too high 9 14.52
Land price is too high 2 3.23
Infrastructural problems (roads and drainage etc.) 9 14.52
Environmental certification is 1 1.61
No CETP 2 3.23
VAT harassment 2 3.23
No medical centers available 1 1.61
Lighting 1 1.61
No GSP benefits 1 1.61
N 136 Source: BIDS Survey 2017
Data of Table 4.17 shows that the association helps the entrepreneur to maintain the relation with
the higher authority (37.21%). They also help the entrepreneurs solve problems related to workers
(20.93%).
Table 4. 17: Steps Taken from the Association to Solve the Problem of the Entrepreneur
Steps taken from the association to solve the problem of the entrepreneur
Frequency % of cases
If there are any problems with the workers in BSCIC 9 20.93
If there is any official problem 11 25.58
If mobile court arrives 7 16.28
Environmental certification 8 18.6
For bank loans 8 18.6
For infrastructure development 13 30.23
Regular meetings held 11 25.58
Letting the higher authority know of any existing issues 16 37.21
N 83
Source: BIDS Survey 2017
4.8 Sick industries
An industrial unit may face a number of hostile situations during the implementation and operation
stage due to internal and external causes. If the problems perpetuate and the unit cannot run its
normal activities, then the unit becomes sick. There are 339 industrial units which are now in sick
condition; across 58 industrial estates, which is around 5.8 percent of the total industrial units.

49
Industrial sickness adversely affects employees, investors, entrepreneurs and shareholders,
government as well as the society in general.
Figure 4. 2: Division wise number and percentages of sick/shutdown industrial units
Source: Authors calculation based on MIS report-June 2017, BSCIC
The incidence of industrial sickness becomes more visualized at industrial estate level. Cox’s
bazaar and Patiya industrial estates haveone-third (34 percent) of its industrial units in sick/shut
down condition. Similarly, Gopalgonj and Jamalpur industrial estates have around one-fourth of
their industrial units in sick/shut down condition (Table 4.19).
Table 4. 18: Top 12 industrial estate having higher rate of sick industrial units, 2017
Industrial estate
Number of industrial
plots
Number of allotted plots
Number of industrial
units established
in the allotted plots
Number of industrial units are shutdown
Utilization rate of allotted
plots (%)
Utilization rate of
available plots (%)
Sick unit (% of total
units)
Cox's Bazar 89 85 38 13 47.4 42.9 34.2
Potiya 77 77 24 8 62.5 62.5 33.3
Gopalganj 70 70 60 15 71.7 71.7 25.0
Jamalpur 197 196 75 17 77.3 76.3 22.7
Manikganj 69 69 25 5 80.0 80.0 20.0
Kushtia 85 85 11 2 81.8 81.8 18.2
Serajganj 76 76 17 3 82.4 82.4 17.6
Rajbari 77 77 52 9 80.8 80.8 17.3
Khulna 240 240 88 15 70.5 70.5 17.0
Maulvibazar 101 98 63 10 63.5 60.6 15.9
Narsingdi 95 95 51 8 84.3 84.3 15.7
Mymensingh 55 55 40 6 85.0 85.0 15.0
Source: Authors calculation based on MIS report-June 2017, BSCIC
30
67
169
22 18 1221
8.9
6.86.0 5.9
2.7 3.8
6.7
0
1
2
3
4
5
6
7
8
9
10
0
20
40
60
80
100
120
140
160
180
Barisal Chittagong Dhaka Khulna Rajshahi Rangpur Sylhet
% o
f si
ck/c
lose
d u
nit
s
No
of
sick
/clo
sed
unit
s

50
Thus, it is necessary to identify the causes of industrial sickness in the industrial estate of BSCIC,
and work out remedial measures that can be undertaken to revive the sick/shut down industrial
units as well as prevent future chances of industrial units becoming sick.
An industrial unit might face various problems, both in the early stages of its establishment and
also sometimes the problems persist as the industry moves forward. Some factors might be
related to the internal management related and others are beyond the unit’s control. The causes
can be classified into two broad categories: internal and external. We conducted 34 interviews
with the sick/shutdown enterprise owners to understand the causes of sickness. It was evident
from the survey that 57% of the responses support external factors i.e. shortage of working capital,
high bank interest rate, non-availability and high input cost, gas problem, shortage of skilled
workers etc. for the sickness. On the other hand, 43% of the responses support the internal factors
for sickness, i.e. death/sickness of the owner, bank default, management inefficiency, marketing
problem etc (Table 4.20).
Table 4. 19: Major reasons for becoming sick or shutdown of production
Major reasons % of response
External factors 57.3
Shortage of working capital 11.8
Higher interest rate on bank loan 10.3
Non-availability & higher input cost 7.4
Gas problem (no connection) 7.4
Shortage of skilled workers 5.9
Lower product price 4.4
Government restriction/threat for environment 3
Frequent power disruption 2.9
Poor road condition 1.5
Poor sanitation/sewerage system 1.5
Lack of modern machineries 1.5
Internal factors 42.7
Death/sickness of owner 13.2
Default to pay bank loan 11.8
Management inefficiency 5.9
Marketing problem 4.4
Inadequate quality control 2.9
Poor financial management policies 1.5
Lack of experiences 1.5
Low production 1.5
Total 100
Source: BIDS primary survey, 2017

51
4.9 Summary of the findings:
In most cases, industrial estates were developed on agricultural and low land, where single or
two crops were being produced at the time of land acquisition. Except some deviations, almost
all estates were established in right places considering good connectivity with district and regional
highways and availability of raw materials. Almost all estates have electricity connection while
only 57% estates have a gas supply connection. About 80% estates have water supply facilities
and one estate has CETP (Savar tannery) and in another 37 estates have ETPs established by
individual enterprises. Most of the industry owners and employees expressed their dissatisfaction
about the road, boundary wall, drainage system and street light inside the BSCIC estates. Except
a few BSCIC estates, all others have serious problems of waterlogging due to poor maintenance
of the existing drainage system. None of the BSCIC estates have boundary wall which is a major
concern of the industry owners and employees to protect their valuable goods. Even street lights
are not available in most of the estates which creates a threat to the security and the safety of the
estates.Yearly poor allocation of resources from BSCIC is one of the main reasons behind the
poor maintenance of the infrastructures inside the estates. Manpower shortage of BSCIC is the
other important reason cited for poor maintenances of estate facilities. Higher allocation for the
maintenance of infrastructure inside estates, or a mechanism can be developed through which a
major portion ofcollecting service charges be used for the maintenance of the respective estate.
A committee comprising of estate officials, industry owners and local government officials can be
formed to oversee the usage of the fund. Another big concern is seen among the industry owners
about the payment of holding tax to local government (Pouroshava/Municipality) though they do
not receive any maintenance service from the local government inside the estate. This issue
needs to be resolved through effective consultation between BSCIC/Ministry of Industries and
Local Government Division. This approach could also solve the infrastructure bottlenecks inside
the estate.
Environmental concerns were not well addressed while establishing BSCIC estates. Currently
about two-third firms release solid waste inside the estate and a similar proportion of firms release
liquid waste into nearby rivers/canals. In the plot allotment process, environmental concerns must
be addressed.
As a substantial number of plots remained unutilized, it is important to identify the reasons behind
such non-utilization. Definitely, a faulty plot allotment process is somewhat responsible. Though
the majority of plots are being allotted fairly(as per about 66% KIIs), about 34% argued that plots
in the estates were allocated based on political and other interferences. From KIIs it is revealed
due to political interference (68.29%), weak selection process (36.58%) and bribery (34.15%),
plots were being allotted to persons those are not true entrepreneurs or those who did not have
intention to utilize the plot for industry. This has resulted in various problems like un-utilization of
plots, becoming sick industry, etc. They also argued that the initial screening for plot allocation
needs to be strengthened by ensuring more participation of local business communities and
experts in the committee in addition to BSCIC officials.

52
Chapter 5: Performance of Industrial Units within Estates
This chapter assesses the performance of the enterprises located within various BSCIC estates.
Though we have not compared performance of firms inside and outside estate, the variations in
performance across states are captured by comparing various performance indicators such as
investment, output, profitability, output-labor ratio, return on investment, capital-labor ratio and
gross-value added in terms of establishment period of estates. Further, performances of firms are
also compared across industry types and size structure of firms. The analysis will give a glimpse
of sense on how the firms are performing inside the estates.
5.1 Basic characteristics of the firms: Ownership status
Among the surveyed firms, the proportion of small firms was higher (64%), followed by
micro/cottage (25%) and medium firms (11%)13. This size distribution is representative across
estates. Regarding ownership pattern, majority of the firms have sole proprietorship (69.2%),
followed by partnership (13.6%) and private limited company (16.4%). Micro and cottage firms
are mostly sole proprietor firms and about two-third of the small and medium enterprises belong
to that group (Table 5.1).
Table 5.1: Distribution of Establishments by Ownership Status(In percent):
Percentage distribution
Ownership pattern
Sole Proprietorship
Partnership Private Limited
Company
Others
Micro/cottage 25.6 80.47 9.38 10.16
Small 63.8 65.83 15.99 16.93 1.25
Medium 10.6 62.26 9.43 28.30
Average 69.20 13.60 16.40 0.80
N 500 346 68 82 4
Source: BIDS Survey 2017
5.2 Education and business experience of owners:
The average years of schooling completed by industry owners are reportedly 12 years (Table
5.2). The average years of experience is the highest among medium firm owners (14.5 years)
which is followed by micro and small firm owners (10.3 years vs. 8.89 years). Owners of medium
13 The size of firms is defined following the latest Industrial Policy 2016.

53
sized enterprises, on average, have relatively more business experience (14.5 years) than owners
of micro and small enterprises (10.3 years vs. 8.9 years).
Almost all of the small and medium firms (92.5-94%) are reported to have affiliations with business
associations and 77% of micro/cottage firms have such affiliations.
Table 5.2: Level of education and experiences of the owners
Type of industry
Average years of schooling completed
Average years of experience before this
business
% of establishments having affiliations with/members of
business associations
Micro/cottage 11.59 10.30 77.34
Small 12.23 8.89 92.48
Medium 11.96 14.54 94.34
Avg. 12.04 9.85 88.80
N 500 500 444
Source: BIDS Survey 2017.
5.3 Age of firms and months of operation
Medium firms on average have the longest number of years in operations (18.5 years) relative to
small and micro/cottage firms (16.5 years vs. 11.9 years)(Table 5.3). The average total number
of months in production for all firms was about 11.5 months. More than half of the medium sized
units changed ownership which was comparatively less among the small and micro/cottage units
(44% vs. 30.5%). Thus, the pattern of ownership change is more common among relatively larger
firms. Earlier established estates have a higher incidence of changes ownership (1960-92) than
recently established estates.
Table 5.3: Age of Establishments and Number of Days in Operations
Average number of Years
in Operations
Number of months in
in Production
% of units changed ownership
Firm-Wise Min Average Max
Micro/Cottage 11.91 6 11.59 12 30.5
Small 16.47 5 11.37 12 44.2
Medium 18.49 9 11.68 12 58.5
By Period of Establishment
1960-1980 24.6 5 11.3 12 57.4
1981-1992 16.7 6 11.6 12 40.4
1993-1999 9.6 6 11.5 12 39.1
2000-2007 7.4 6 11.45 12 21.3
Source: BIDS Survey 2017

54
5.4 Sector-wise distribution
Among the surveyed firms, more than 60% of the firms in the forest industry/wood/furniture sector
are micro/cottage firms, while a similar proportion of the firms under the food, textile, Jute,
leather/rubber, engineering, and chemicals/pharmaceutical industries are small. More than one
fifth of the textile sector has medium sized firms (Table 5.4).
Table 5.4: Establishment distribution by size (In percent)
Type of industry Micro/cottage
(%) Small (%) Medium (%) N
Food industry 25.0 71.3 3.7 136
Textile industry 17.1 60.4 22.5 111
Forest industry/Wood/furniture 63.2 31.6 5.3 19
Jute and jute related industry 26.3 63.2 10.5 19
Paperboard/printing & packaging 37.5 50.0 12.5 24
Leather/Rubber/Plastic industry 22.9 68.6 8.6 35
Chemical & pharmaceutical industry 22.2 63.9 13.9 36
Engineering industry 15.5 74.1 10.3 58
Metal workshop/Servicing 40.9 59.1 0.0 22
Agro food 40.0 51.4 8.6 35
Others (Mosquito coil production) 20.0 80.0 0.0 5
N 128 319 53 500
Source: BIDS Survey 2017
5.5 Establishments’ sub-contracting status
About 20% of the firms undertook sub-contracting order, while only about 5% of the firms provide
sub-contracting to outside firms. Especially small firms are engaged more in sub-contracting
activities. Occasional sub-contracting is evident among 54% of the firms (Table 5.5).
Table 5.5: Establishments’ Sub-contracting status
Size
% of establishments
undertaking sub-contracting
% of establishments
providing sub-contracts
Frequency of providing sub-contracts (%)
Whole year
Very frequently
Seldom Occasionally
Micro/cottage 23.53 16.67 25.00 75.00
Small 57.84 50.00 25.00 8.33 16.67 50.00
Medium 18.63 33.33 25.00 25.00 50.00
Average 20.40 4.80 20.83 8.33 16.67 54.17
Source: BIDS Survey 2017
The enterprises provide sub-contracts to either homogenous establishments or enterprises of a
smaller size (Table 5.6). Among the firms that were engaged in sub-contracting, small and
medium (75% vs. 87.5%) enterprises sub-contracted out to establishments that were of a similar
size, whereas micro/cottage industries distributed the sub-contracts equally among homogenous
and smaller establishments (50%).
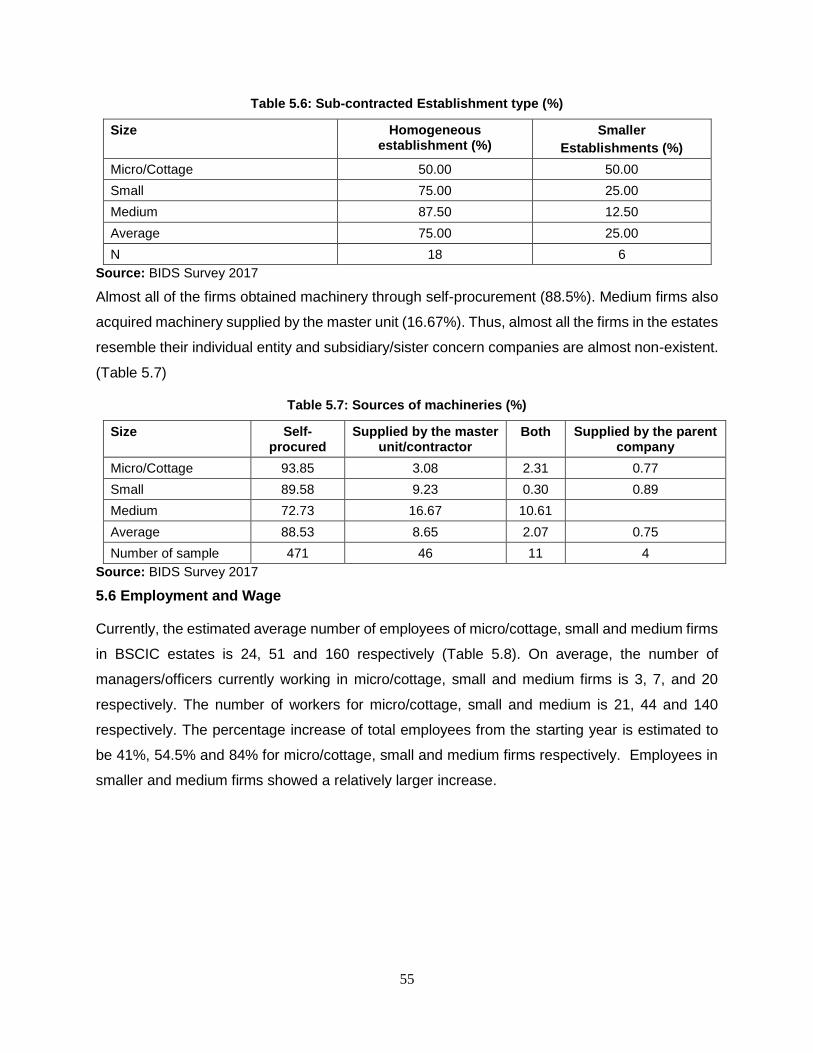
55
Table 5.6: Sub-contracted Establishment type (%)
Size Homogeneous establishment (%)
Smaller
Establishments (%)
Micro/Cottage 50.00 50.00
Small 75.00 25.00
Medium 87.50 12.50
Average 75.00 25.00
N 18 6
Source: BIDS Survey 2017
Almost all of the firms obtained machinery through self-procurement (88.5%). Medium firms also
acquired machinery supplied by the master unit (16.67%). Thus, almost all the firms in the estates
resemble their individual entity and subsidiary/sister concern companies are almost non-existent.
(Table 5.7)
Table 5.7: Sources of machineries (%)
Size Self-procured
Supplied by the master unit/contractor
Both Supplied by the parent company
Micro/Cottage 93.85 3.08 2.31 0.77
Small 89.58 9.23 0.30 0.89
Medium 72.73 16.67 10.61
Average 88.53 8.65 2.07 0.75
Number of sample 471 46 11 4
Source: BIDS Survey 2017
5.6 Employment and Wage
Currently, the estimated average number of employees of micro/cottage, small and medium firms
in BSCIC estates is 24, 51 and 160 respectively (Table 5.8). On average, the number of
managers/officers currently working in micro/cottage, small and medium firms is 3, 7, and 20
respectively. The number of workers for micro/cottage, small and medium is 21, 44 and 140
respectively. The percentage increase of total employees from the starting year is estimated to
be 41%, 54.5% and 84% for micro/cottage, small and medium firms respectively. Employees in
smaller and medium firms showed a relatively larger increase.
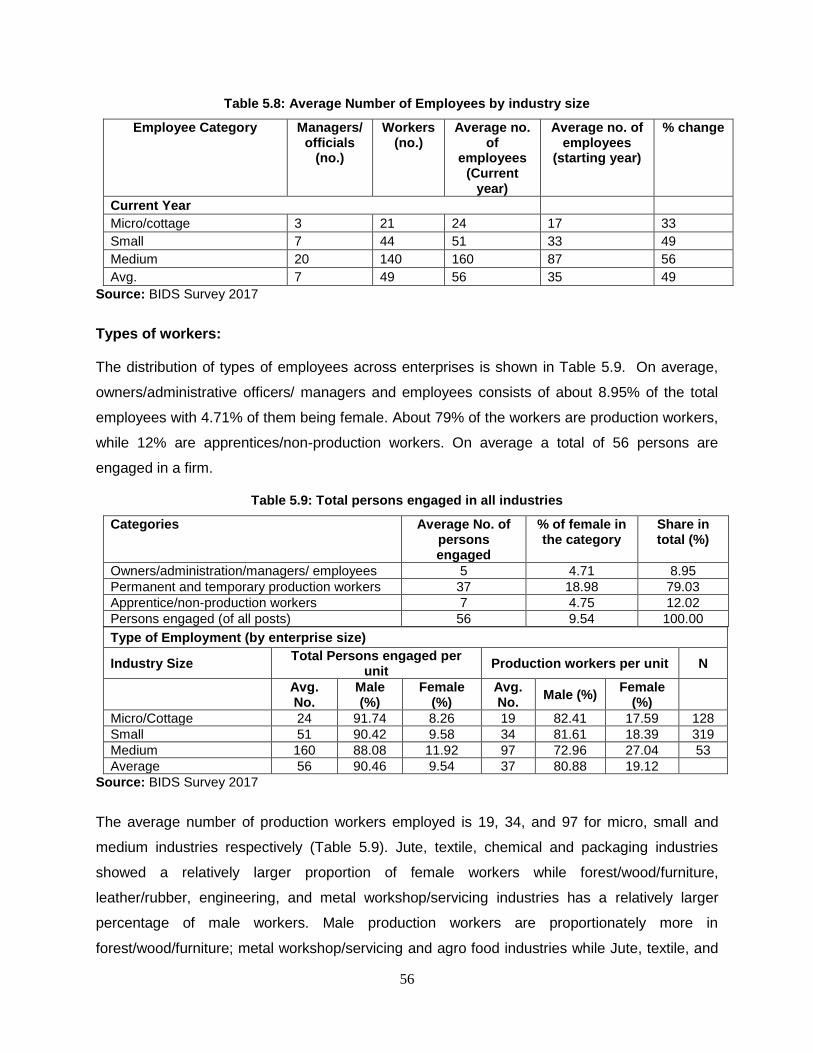
56
Table 5.8: Average Number of Employees by industry size
Employee Category Managers/officials
(no.)
Workers (no.)
Average no. of
employees (Current
year)
Average no. of employees
(starting year)
% change
Current Year
Micro/cottage 3 21 24 17 33
Small 7 44 51 33 49
Medium 20 140 160 87 56
Avg. 7 49 56 35 49
Source: BIDS Survey 2017
Types of workers:
The distribution of types of employees across enterprises is shown in Table 5.9. On average,
owners/administrative officers/ managers and employees consists of about 8.95% of the total
employees with 4.71% of them being female. About 79% of the workers are production workers,
while 12% are apprentices/non-production workers. On average a total of 56 persons are
engaged in a firm.
Table 5.9: Total persons engaged in all industries
Categories Average No. of persons engaged
% of female in the category
Share in total (%)
Owners/administration/managers/ employees 5 4.71 8.95
Permanent and temporary production workers 37 18.98 79.03
Apprentice/non-production workers 7 4.75 12.02
Persons engaged (of all posts) 56 9.54 100.00
Type of Employment (by enterprise size)
Industry Size Total Persons engaged per
unit Production workers per unit N
Avg. No.
Male (%)
Female (%)
Avg. No.
Male (%) Female
(%)
Micro/Cottage 24 91.74 8.26 19 82.41 17.59 128
Small 51 90.42 9.58 34 81.61 18.39 319
Medium 160 88.08 11.92 97 72.96 27.04 53
Average 56 90.46 9.54 37 80.88 19.12
Source: BIDS Survey 2017
The average number of production workers employed is 19, 34, and 97 for micro, small and
medium industries respectively (Table 5.9). Jute, textile, chemical and packaging industries
showed a relatively larger proportion of female workers while forest/wood/furniture,
leather/rubber, engineering, and metal workshop/servicing industries has a relatively larger
percentage of male workers. Male production workers are proportionately more in
forest/wood/furniture; metal workshop/servicing and agro food industries while Jute, textile, and

57
chemical industries showed a relatively larger proportion of female production workers
(Appendix).
Type of employee skills:
The average number of skilled, semi-skilled and un-skilled workers employed per firm/enterprise
was reported to be about 26, 15 and 5 respectively. About 60% of the workers in BSCIC estates
are reportedly skilled. The proportion of skilled workers in small firms is somewhat lower than
medium and micro/cottage firms (65% vs. 66%) (Table 5.10).Skilled and semi-skilled workers
dominate the labour force within all types of firms and estates. We don’t see any significant
differences in the skill-level of workers in terms of establishment period of estates. The proportion
of skilled workers in the newly established estates (2000-2007) and the oldest estates (1960-80)
are somewhat lower than other estates (about 51%). Sector-wise analysis of the labor force
shows that about one-third is semi-skilled while almost two-thirds are reportedly skilled. The
proportion of skilled workers is higher in sectors like wood/furniture, metal works, jute, textile etc.
Table 5.10: Categorization by industry
Size Apprentice (%)
Unskilled (%)
Semi-skilled (%)
Skilled (%)
Micro/Cottage 0.97 7.39 25.03 66.61
Small 1.08 8.71 36.66 53.55
Medium 1.51 6.28 27.15 65.06
Average 1.09 8.12 32.67 58.11
Average number of workers 0.376 4.94 15.16 25.47
Establishment Period
1960-1980 0.39 11.95 35.68 51.99
1981-1992 2.67 5.47 25.63 66.23
1993-1999 0.59 5.23 32.58 61.61
2000-2007 1.18 9.93 37.08 51.83
Average 1.09 8.12 32.67 58.11
Sectors
Food industry 1.26 7.19 34.60 56.96
Textile industry 0.55 6.61 32.33 60.50
Forest industry/Wood/furniture 0.68 3.32 22.42 73.58
Jute and jute related industry 0.32 9.32 27.68 62.68
Paper board/printing & packaging 2.25 10.71 31.79 55.25
Leather/Rubber/Plastic industry 2.71 18.17 35.69 43.43
Chemical & pharmaceutical industry
0.94 11.22 26.42 61.42
Engineering industry 1.47 6.95 40.09 51.50
Metal workshop/Servicing 1.27 5.95 26.68 66.09
Agro food 0.00 6.57 29.46 63.97
Others 0.00 9.20 37.00 53.80
Average 1.09 8.12 32.67 58.11
Source: BIDS Survey 2017
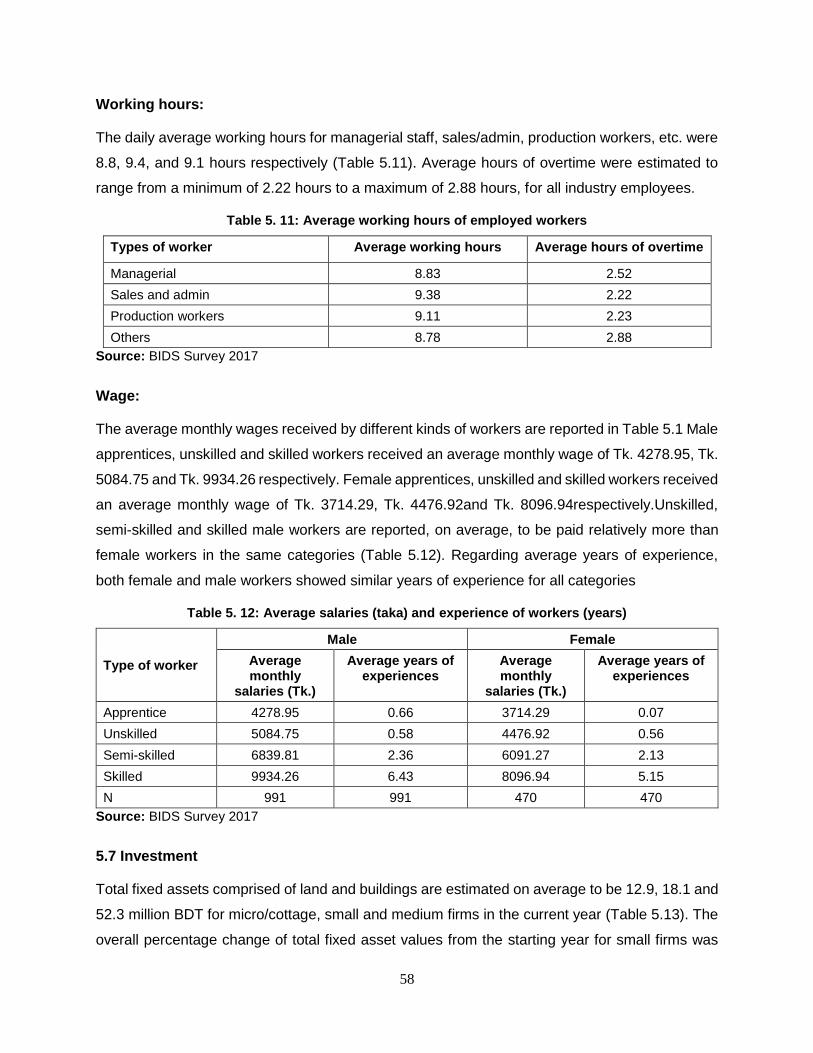
58
Working hours:
The daily average working hours for managerial staff, sales/admin, production workers, etc. were
8.8, 9.4, and 9.1 hours respectively (Table 5.11). Average hours of overtime were estimated to
range from a minimum of 2.22 hours to a maximum of 2.88 hours, for all industry employees.
Table 5. 11: Average working hours of employed workers
Types of worker Average working hours Average hours of overtime
Managerial 8.83 2.52
Sales and admin 9.38 2.22
Production workers 9.11 2.23
Others 8.78 2.88
Source: BIDS Survey 2017
Wage:
The average monthly wages received by different kinds of workers are reported in Table 5.1 Male
apprentices, unskilled and skilled workers received an average monthly wage of Tk. 4278.95, Tk.
5084.75 and Tk. 9934.26 respectively. Female apprentices, unskilled and skilled workers received
an average monthly wage of Tk. 3714.29, Tk. 4476.92and Tk. 8096.94respectively.Unskilled,
semi-skilled and skilled male workers are reported, on average, to be paid relatively more than
female workers in the same categories (Table 5.12). Regarding average years of experience,
both female and male workers showed similar years of experience for all categories
Table 5. 12: Average salaries (taka) and experience of workers (years)
Type of worker
Male Female
Average monthly
salaries (Tk.)
Average years of experiences
Average monthly
salaries (Tk.)
Average years of experiences
Apprentice 4278.95 0.66 3714.29 0.07
Unskilled 5084.75 0.58 4476.92 0.56
Semi-skilled 6839.81 2.36 6091.27 2.13
Skilled 9934.26 6.43 8096.94 5.15
N 991 991 470 470
Source: BIDS Survey 2017
5.7 Investment
Total fixed assets comprised of land and buildings are estimated on average to be 12.9, 18.1 and
52.3 million BDT for micro/cottage, small and medium firms in the current year (Table 5.13). The
overall percentage change of total fixed asset values from the starting year for small firms was

59
higher (310.6%) relative to micro and medium firms (211% vs. 297.9%). The total capital invested
for micro, small and medium firms was estimated to be 9.54, 17.17 and 44.27 million taka
respectively (Table 5.14).
Table 5. 13: Amount of Fixed Assets
Industry size
Starting year Current year % change
(overall)
N
Land (million
BDT)
Building (million
BDT)
Total fixed
asset(mill BDT)
Land (million
BDT)
Building (million
BDT)
Total fixed
asset(mill BDT)
Micro/cottage 1.89 4.2 6.09 6.95 5.9 12.85 211 128
Small 1.78 4.05 5.83 9.89 8.22 18.11 310.6 319
Medium 4.33 13.23 17.56 32.6 19.71 52.31 297.9 53
Avg. 2.08 5.06 7.14 11.54 8.84 20.38 285.4 500
Source: BIDS Survey 2017
Table 5. 14: Amount of current asset (million BDT)
Industry size
Current Asset Value (in million Tk.) N
Machinery and
equipment
Vehicles Furniture and other
fixed assets
Computers, printers and
related accessories
Other Total capital (mill bdt)
Micro/cottage
8.29 1.05 0.1 0.08 0.01 9.54 128
Small 15.56 1.2 0.2 0.17 0.04 17.17 319
Medium 37.79 5.73 0.55 0.13 0.07 44.27 53
Avg. 16.05 1.64 0.21 0.14 0.03 18.09 500
The fixed asset-turnover ratio for micro/cottage, small and medium firms is estimated to be 2.4,
3.2 and 4.1 respectively. Firms in the estates established before 2000 (1960-1999) have
estimated ratios ranging from 2.7-3.7 while the highest turnover ratio (4.16) was observed among
the firms in the estates established recently (2000-07). The ratios indicate that comparatively,
medium sized firms and estates established during 2000-07 are effectively utilizing their fixed
assets. (Table 5.15).
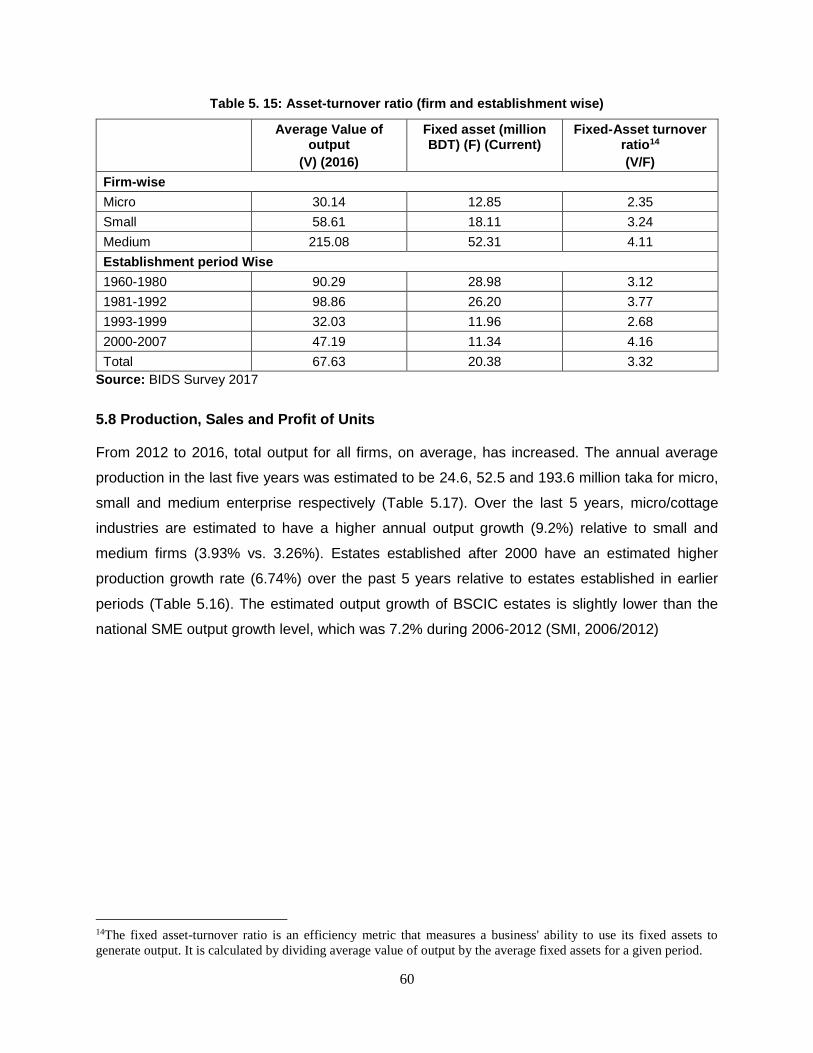
60
Table 5. 15: Asset-turnover ratio (firm and establishment wise)
Average Value of output
(V) (2016)
Fixed asset (million BDT) (F) (Current)
Fixed-Asset turnover ratio14
(V/F)
Firm-wise
Micro 30.14 12.85 2.35
Small 58.61 18.11 3.24
Medium 215.08 52.31 4.11
Establishment period Wise
1960-1980 90.29 28.98 3.12
1981-1992 98.86 26.20 3.77
1993-1999 32.03 11.96 2.68
2000-2007 47.19 11.34 4.16
Total 67.63 20.38 3.32
Source: BIDS Survey 2017
5.8 Production, Sales and Profit of Units
From 2012 to 2016, total output for all firms, on average, has increased. The annual average
production in the last five years was estimated to be 24.6, 52.5 and 193.6 million taka for micro,
small and medium enterprise respectively (Table 5.17). Over the last 5 years, micro/cottage
industries are estimated to have a higher annual output growth (9.2%) relative to small and
medium firms (3.93% vs. 3.26%). Estates established after 2000 have an estimated higher
production growth rate (6.74%) over the past 5 years relative to estates established in earlier
periods (Table 5.16). The estimated output growth of BSCIC estates is slightly lower than the
national SME output growth level, which was 7.2% during 2006-2012 (SMI, 2006/2012)
14The fixed asset-turnover ratio is an efficiency metric that measures a business' ability to use its fixed assets to
generate output. It is calculated by dividing average value of output by the average fixed assets for a given period.
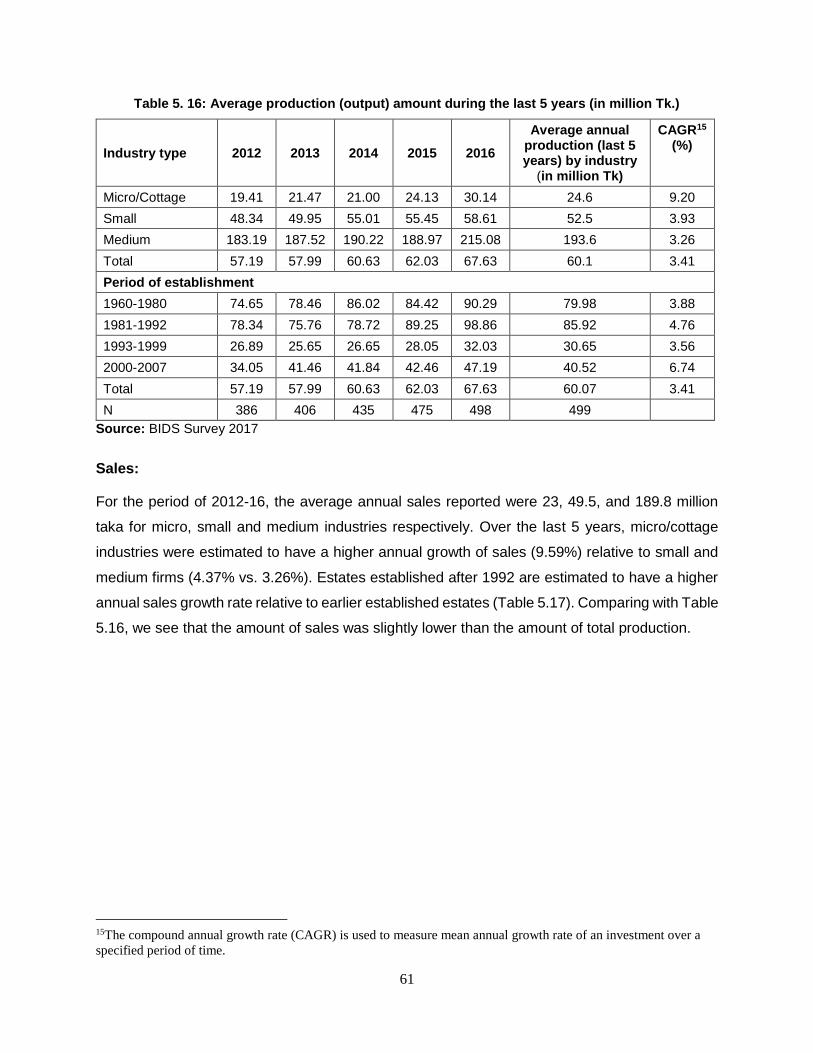
61
Table 5. 16: Average production (output) amount during the last 5 years (in million Tk.)
Industry type 2012 2013 2014 2015 2016
Average annual production (last 5 years) by industry
(in million Tk)
CAGR15 (%)
Micro/Cottage 19.41 21.47 21.00 24.13 30.14 24.6 9.20
Small 48.34 49.95 55.01 55.45 58.61 52.5 3.93
Medium 183.19 187.52 190.22 188.97 215.08 193.6 3.26
Total 57.19 57.99 60.63 62.03 67.63 60.1 3.41
Period of establishment
1960-1980 74.65 78.46 86.02 84.42 90.29 79.98 3.88
1981-1992 78.34 75.76 78.72 89.25 98.86 85.92 4.76
1993-1999 26.89 25.65 26.65 28.05 32.03 30.65 3.56
2000-2007 34.05 41.46 41.84 42.46 47.19 40.52 6.74
Total 57.19 57.99 60.63 62.03 67.63 60.07 3.41
N 386 406 435 475 498 499
Source: BIDS Survey 2017
Sales:
For the period of 2012-16, the average annual sales reported were 23, 49.5, and 189.8 million
taka for micro, small and medium industries respectively. Over the last 5 years, micro/cottage
industries were estimated to have a higher annual growth of sales (9.59%) relative to small and
medium firms (4.37% vs. 3.26%). Estates established after 1992 are estimated to have a higher
annual sales growth rate relative to earlier established estates (Table 5.17). Comparing with Table
5.16, we see that the amount of sales was slightly lower than the amount of total production.
15The compound annual growth rate (CAGR) is used to measure mean annual growth rate of an investment over a
specified period of time.
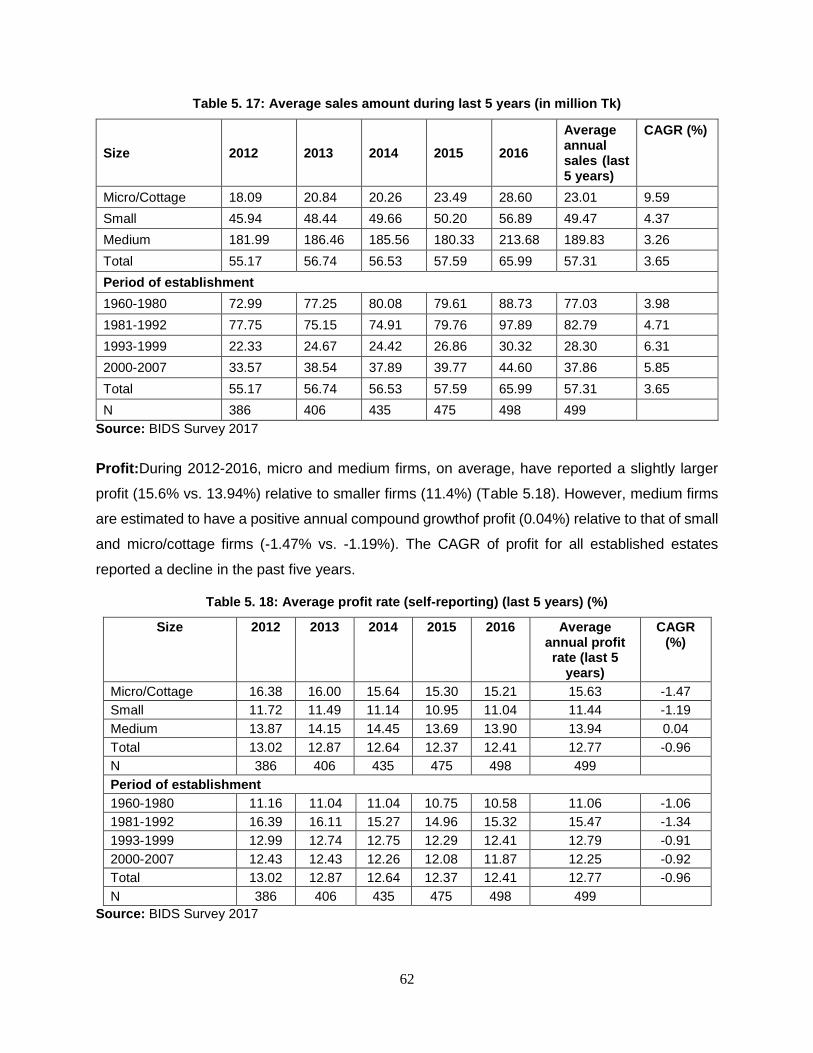
62
Table 5. 17: Average sales amount during last 5 years (in million Tk)
Size 2012 2013 2014 2015 2016
Average annual sales (last 5 years)
CAGR (%)
Micro/Cottage 18.09 20.84 20.26 23.49 28.60 23.01 9.59
Small 45.94 48.44 49.66 50.20 56.89 49.47 4.37
Medium 181.99 186.46 185.56 180.33 213.68 189.83 3.26
Total 55.17 56.74 56.53 57.59 65.99 57.31 3.65
Period of establishment
1960-1980 72.99 77.25 80.08 79.61 88.73 77.03 3.98
1981-1992 77.75 75.15 74.91 79.76 97.89 82.79 4.71
1993-1999 22.33 24.67 24.42 26.86 30.32 28.30 6.31
2000-2007 33.57 38.54 37.89 39.77 44.60 37.86 5.85
Total 55.17 56.74 56.53 57.59 65.99 57.31 3.65
N 386 406 435 475 498 499
Source: BIDS Survey 2017
Profit:During 2012-2016, micro and medium firms, on average, have reported a slightly larger
profit (15.6% vs. 13.94%) relative to smaller firms (11.4%) (Table 5.18). However, medium firms
are estimated to have a positive annual compound growthof profit (0.04%) relative to that of small
and micro/cottage firms (-1.47% vs. -1.19%). The CAGR of profit for all established estates
reported a decline in the past five years.
Table 5. 18: Average profit rate (self-reporting) (last 5 years) (%)
Size 2012 2013 2014 2015 2016 Average annual profit rate (last 5
years)
CAGR (%)
Micro/Cottage 16.38 16.00 15.64 15.30 15.21 15.63 -1.47
Small 11.72 11.49 11.14 10.95 11.04 11.44 -1.19
Medium 13.87 14.15 14.45 13.69 13.90 13.94 0.04
Total 13.02 12.87 12.64 12.37 12.41 12.77 -0.96
N 386 406 435 475 498 499
Period of establishment
1960-1980 11.16 11.04 11.04 10.75 10.58 11.06 -1.06
1981-1992 16.39 16.11 15.27 14.96 15.32 15.47 -1.34
1993-1999 12.99 12.74 12.75 12.29 12.41 12.79 -0.91
2000-2007 12.43 12.43 12.26 12.08 11.87 12.25 -0.92
Total 13.02 12.87 12.64 12.37 12.41 12.77 -0.96
N 386 406 435 475 498 499
Source: BIDS Survey 2017
63
5.9 Efficiency indicators:
Output-labour, ROI and Capital-labour ratios:
Labor productivity measures the output per worker in a period of time. A higher output-labour ratio
is an indicator of higher labour productivity i.e. more efficient use of labour, while the opposite
indicates otherwise. During 2016, output produced per unit labour for micro/cottage and medium
firms are estimated to be relatively higher (1.57 million vs. 1.86 million) than the average output-
labor ratio of all firms (1.52 million).Estates established during 1981-92 and 2000-07 are
estimated to have higher labor productivity (2.03 vs. 1.97) relative to all other established estates.
Labor productivity was estimated to be the highest for agro food (4.03), followed by
packaging/printing (2.95), and food industry (2.25). The Return on Investment (ROI) is used as a
profitability measure that evaluates the performance or potential return from a business or
investment. Medium firms are estimated to have a relatively higher return on their investments
(5.03) than small (2.55) and micro/cottage (2.65) firms. Capital to labour ratio is used to measure
the capital intensity of a firm. During 2016, capital per unit of labor is estimated to be slightly higher
for micro/cottage firms (0.5) than small and medium firms (0.4). The capital-labor ratio was
comparatively high among the firms located in recently established estates (2000-07). Food,
chemical, printing/packaging industries have a somewhat higher capital-labor ratio amid all other
sectors. Despite there being no specific inference that can be drawn, capital-labour ratios may
differ due to differences in production processes and prices of capital.(Table 5.19).

64
Table 5. 19: Efficiency indicators of firms
Capital (plant and
machineries) (million BDT)
Investment (last year)
(in million
Tk.)
Total Output (Million
BDT) (2016)
Profit
(million BDT)
Employee
(labor)
Return on
Investment
(RoI)16
Output-labor ratio17
Capital-labor ratio18
Industry Size
Micro/cottage 9.54 1.64 30.14 4.35 19.14 2.65 1.57 0.50
Small 17.17 2.46 58.61 6.28 42.87 2.55 1.37 0.40
Medium 44.27 5.90 215.08 29.70 115.62 5.03 1.86 0.38
Average 18.1 2.61 67.63 8.19 44.51 3.14 1.52 0.41
Period of Establishment
1960-1980 25.5 2.81 90.29 9.39 65.3 3.34 1.38 0.39
1981-1992 19.1 2.39 98.86 15.00 48.58 6.27 2.03 0.39
1993-1999 9.10 0.48 32.03 3.76 30.94 7.84 1.04 0.29
2000-2007 19.0 6.57 47.19 5.29 24 0.81 1.97 0.79
Average 18.1 2.61 67.63 8.19 44.51 3.14 1.52 0.41
Sector
Food industry 28.1 4.83 81.2 7.59 36.05 1.57 2.25 0.78
Textile industry 16.5 1.47 63.9 8.35 71.77 5.68 0.89 0.23
Forest industry/Wood furniture
2.0 0.08 11.2 2.46 11.47 30.74 0.98 0.18
Jute and jute related industry
23.6 0.65 39.3 6.22 72.53 9.57 0.54 0.33
Paper board/printing & packaging
20.6 0.67 107 12.46 36.33 18.60 2.95 0.57
Leather/Rubber/Plastic industry
5.4 0.36 19.8 2.14 29.49 5.96 0.67 0.18
Chemical & pharmaceutical industry
22.0 4.38 55.7 7.06 32.06 1.61 1.74 0.69
Engineering industry
13.5 4.06 60.1 7.01 47.84 1.73 1.26 0.28
Metal workshop/Servicing
4.8 0.33 39.5 5.40 31.27 16.35 1.26 0.15
Agro food 15.0 1.14 138 15.87 31.97 13.92 4.32 0.47
Others 3.1 0.65 22.5 2.92 29.6 4.50 0.76 0.10
Total 18.1 2.61 67.4 8.12 44.51 3.11 1.51 0.41
Source: BIDS Survey 2017
16 ROI is calculated from the benefit received from an investment, or its gain (profit), divided by the investment's
original cost. 17Measured by dividing the total amount of output by the amount of labour. 18Capital mainly refers to plant and machineries/technology that is used for production. It is measured by dividing
the amount of capital (million taka) by the number of employees

65
Input-Output ratio:
Input-output ratio provides an indicator of efficiency of a production firm. A higher input-output
ratio is an indicator of a lower efficiency, while the opposite indicates better efficiency.
Micro/cottage firms are estimated to have a somewhat higher input-output ratio (0.94) than small
and medium firms (0.79 vs. 0.66) (Table 5.20). Estates established during 1960-80 and 2000-07
have the somewhat higher input-output ratios (0.82 vs. 0.83) amid all established estates.
Printing/packaging, leather/rubber/plastic, metal workshops, and agro food industries have a
higher input-output ratio amid all other sectors. On the other hand, jute industry (0.57) and
chemical & pharmaceutical industries (0.5) have input-output ratios indicating their efficiency in
utilizing inputs.
Table 5. 20: Input-output ratios by industry size, establishment period and sector
Total Input Cost (million taka) (2016)
Total Output (mill Tk)
input-output ratio
Size of industry
Micro/cottage 28.24 30.14 0.94
Small 46.58 58.61 0.79
Medium 141.68 215.08 0.66
Total 51.96 67.63 0.77
Period of Establishment
1960-1980 73.99 90.29 0.82
1981-1992 67.25 98.86 0.68
1993-1999 24.62 32.03 0.77
2000-2007 39.11 47.19 0.83
Total 51.96 67.63 0.77
Sectors
Food industry 59.95 81.2 0.74
Textile industry 49.37 63.9 0.77
Forest industry/Wood furniture
8.48 11.2 0.76
Jute and jute related industry 22.54 39.3 0.57
Paper board/printing & packaging
98.61 107 0.92
Leather/Rubber/Plastic industry
16.30 19.8 0.82
Chemical & pharmaceutical industry
28.08 55.7 0.50
Engineering industry 47.42 60.1 0.79
Metal workshop/Servicing 34.48 39.5 0.87
Agro food 119.15 138 0.86
Others 26.35 22.5 0.17
Total 51.96 67.4 0.77
Source: BIDS Survey 2017

66
Gross Value Added:
Gross value added (GVA)is an indicator that can measure the contribution to the economy of a
specified investment in economic activity. GVA per unit was estimated to be the highest for
medium firms (95.33 million BDT) relative to small and micro/cottage firms (16.71 vs. 2.96 million
BDT) during 2016. Estates established during 1981-92 have the highest GVA (38.05 million BDT)
amid all other establishments. Sectors such as the food, textile, jute, chemical and agro food
industries have a relatively higher GVA than others (Table 5.21). The estimated GVA for small
and medium firms is comparable with the national estimate of GVA for SMEs (SMI, 2006/2012).
Table 5. 21: Gross Value Addition (GVA) by industry size, establishment period and sector
Sales (mill taka) (2016)
Total input cost (mill Tk) (2016)
GVA19 per unit (mill taka) (2016)
Micro/cottage 28.6 25.64 2.96
Small 56.89 40.18 16.71
Medium 213.68 118.35 95.33
Total 65.99 44.79 21.2
Period of Establishment
1960-1980 88.73 62.33 26.4
1981-1992 97.89 59.84 38.05
1993-1999 30.32 20.34 9.98
2000-2007 44.6 35.65 8.95
Total 65.99 44.79 21.2
Sectors
Food industry 79.3 52.29 27.01
Textile industry 63.4 38.2 25.2
Forest industry/Wood furniture
11.1 6.78 4.32
Jute and jute related industry
37.9 11.57 26.33
Paper board/printing & packaging
106 89.47 16.53
Leather/Rubber/Plastic industry
19.2 12.9 6.3
Chemical & pharmaceutical industry
49.7 23.09 26.61
Engineering industry 58.2 42.6 15.6
Metal workshop/Servicing 36.1 30.46 5.64
Agro food 138 113.95 24.05
Others 21.5 20.63 0.87
Total 65.7 44.79 20.91
Source: BIDS Survey 2017
19GVA = Turnover (or sales) minus cost of bought in goods & services (excl. employee costs)

67
5.10 Production capacity and Capacity utilization
In the current year, the targeted average annual production amounts for micro/cottage, small and
medium firms was 36.81, 69.03, and 199.97 million taka respectively (Table 5.22). The realised
production capacity in the current year for all firms didn’t vary much (73.5-79.8%). The percentage
change in the average annual targeted output reported by medium firms was estimated to be
relatively less (71.4%) than micro and small firms (137.6% vs. 110.2%). However, the percentage
change in realized production capacity for medium firms was the highest (13.08%) relative to
small and cottage firms (2.73% vs. 2.88%).
Table 5. 22: Capacity Utilization
Targeted average yearly production (million BDT)
% change
Realized production Capacity (%)
% change
N
Starting year Current year Starting year Current year
Micro/cottage
15.49 36.81 137.6
71.51 73.46 2.73
128
Small 32.84 69.03 110.2 75.3 77.47 2.88 319
Medium 116.67 199.97 71.4 70.58 79.81 13.08 53
Average 37.28 74.66 100.3 73.83 76.69 3.87 500
Source: BIDS Survey 2017
5.11 Access to Finance
Currently, average outstanding loans for micro/cottage, small and medium firms is 15.65, 24,
109.3 million taka respectively. Bank loans and owner/entrepreneur savings are reported to be
the main sources of working capital among all of the surveyed firms. As expected, medium firms
have invested more (20.5 million taka) relative to small and micro/cottage firms (1.4 vs. 7.2 million
BDT). Overall, more than two thirds of last year’s investment was made from bank loans and the
rest coming from their own savings (28%)(Table 5.23).

68
Table 5. 23: Sources of working capital/loan and last year investment (in million)
Source Self Loan from Bank
Loan from leasing companies
Non-institutional loan
Loan from NGO/other institution
Others Total
Current value (in million Tk.)
Micro/ 7.52 (48.1%)
7.99
(51.1%)
0.08
(0.51%)
0.03
(0.2%)
0.04
(0.26%)
15.65
(100%)
Small 10.39
(43.29%)
13.38
(55.75%)
0.01
(0.042%)
0.11
(0.46%)
0.1
(0.42%)
0.003
(0.013%)
24
(100%)
Medium 60.04
(54.9%)
49.18
(45.0%)
0.05
(0.05%)
0.02
(0.02%)
109.3
(100%)
Overall 14.92
(48.28%)
15.8
(51.13%)
0.03
(0.10%)
0.08
(0.26%)
0.08
(0.26%)
0.002
(0.01%)
30.9
(100%)
Last year investment (in million Tk.)
Micro/ 0.6
(42.9%)
0.8
(57.1%)
0.001
(0.07%)
0.002
(0.14%)
0.004
(0.29%)
1.4
(100%)
Small 1.37
(19.03%)
5.77
(80.14%)
0.002
(0.03%)
0.04
(0.6%)
0.01
(0.14%)
7.2
(100%)
Medium 9.25
(45.14%)
11.24
(54.86%)
0.002
(0.01%)
0.005
(0.02%)
20.49
(100%)
Overall 2.01
(28.23%)
5.08
(71.35%)
0.001
(0.01%)
0.03
(0.42%)
0.01
(0.14%)
7.12
(100%)
Source: BIDS Survey 2017 *Note: percentage share denoted in parentheses
On average, about 38% of the firms have applied for bank loansduring the last year, and almost
all have received loans. However, majority of the small firms (73%) rely on bank loans relative to
other sized firms. The interest rate for bank loans is reported to be around 12%. The average
processing time for bank loans is about 2 to 3 months while the loans from BSCIC are processed
relatively faster (Table 5.24).
Table 5. 24: Loan information for firms (last year)
Size Percentage of
establishments applied for
loans
Percentage of establishment
s received loan
Current average
amount of outstanding loan (Tk. in million)
Average bank interest
rate
Average processing time to receive
loan from BSCIC
(month)
Average processing time to receive
loan from Bank
(month)
Micro/Cottage 17.99 18.95 8.59 12.25 1.33 2.45
Small 73.02 72.63 12.94 11.91 0.17 2.63
Medium 8.99 8.42 37.25 12.35 2.13
Average 38 38.00 14.40 12.04 1.04 2.54
Source: BIDS Survey 2017
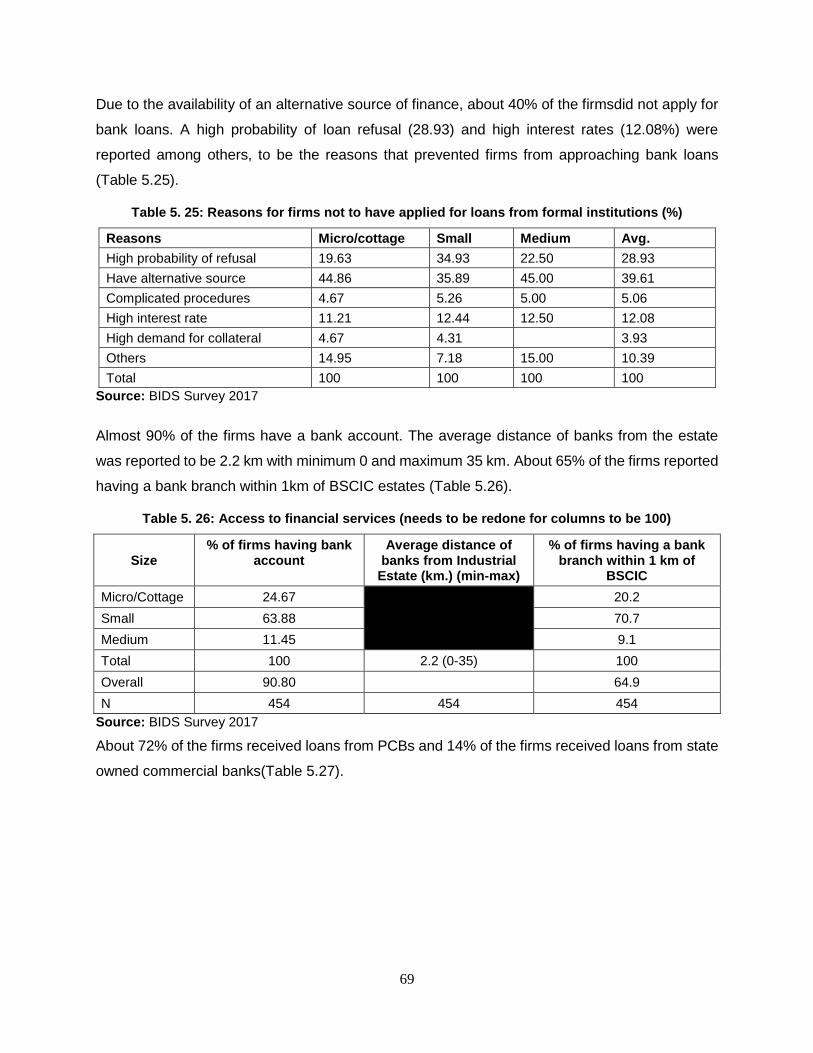
69
Due to the availability of an alternative source of finance, about 40% of the firmsdid not apply for
bank loans. A high probability of loan refusal (28.93) and high interest rates (12.08%) were
reported among others, to be the reasons that prevented firms from approaching bank loans
(Table 5.25).
Table 5. 25: Reasons for firms not to have applied for loans from formal institutions (%)
Reasons Micro/cottage Small Medium Avg.
High probability of refusal 19.63 34.93 22.50 28.93
Have alternative source 44.86 35.89 45.00 39.61
Complicated procedures 4.67 5.26 5.00 5.06
High interest rate 11.21 12.44 12.50 12.08
High demand for collateral 4.67 4.31 3.93
Others 14.95 7.18 15.00 10.39
Total 100 100 100 100
Source: BIDS Survey 2017
Almost 90% of the firms have a bank account. The average distance of banks from the estate
was reported to be 2.2 km with minimum 0 and maximum 35 km. About 65% of the firms reported
having a bank branch within 1km of BSCIC estates (Table 5.26).
Table 5. 26: Access to financial services (needs to be redone for columns to be 100)
Size % of firms having bank
account Average distance of
banks from Industrial Estate (km.) (min-max)
% of firms having a bank branch within 1 km of
BSCIC
Micro/Cottage 24.67
20.2
Small 63.88 70.7
Medium 11.45 9.1
Total 100 2.2 (0-35) 100
Overall 90.80 64.9
N 454 454 454
Source: BIDS Survey 2017
About 72% of the firms received loans from PCBs and 14% of the firms received loans from state
owned commercial banks(Table 5.27).

70
Table 5. 27: Sources of loan received in last year (%)
Source Micro/cottage Small Medium Average
State Owned Commercial Bank (SoCB) 13.16 16.44 14.43
Private commercial bank (PCB) 57.89 74.66 76.47 71.64
Leasing companies
NGO/MFI 13.16 2.74 11.76 5.47
Local money lender 2.63 1.37 5.88 1.99
BSCIC 5.26 1.00
Others 7.89 4.79 5.88 5.47
Total 100 100 100 100
Source: BIDS Survey 2017
Land and buildings remain the main source of collateral. Almost half of the surveyed firms kept
land/building as collateral, followed by machineries (30%) as well as private property (18%) (Table
5.28).
Table 5. 28: Types of collateral (%)
Types of collateral Micro/cottage Small Medium Avg.
Land/building 42.74 48.86 42.37 46.77
Machineries 23.93 31.71 25.42 29.28
Private property (house/land) 27.35 15.14 18.64 18.25
Others 5.98 4.29 13.56 5.70
Total 100 100 100 100
Source: BIDS Survey 2017
Almost 57% of all the firms spend their loan amount for maintaining their working capital. About a
quarter of micro/cottage and small firms and a fifth of medium firms purchased machineries with
the loans taken. About 10% of all firms spend their loan amounts on land and building
development purposes (Table5.29).
Table 5. 29: Utilization of loan (%)
Source Micro/co
ttage Small Medium Avg.
Working capital 55.74 58.12 57.14 57.47
Land dev./building 9.02 11.40 10.71 10.78
Training for workers 0.28 0.19
Product promotion 0.57 0.38
Household expenses 3.28 2.56 2.46
Machineries purchase 25.41 24.22 19.64 24.01
Others 6.56 2.85 12.50 4.73
Total 100 100 100 100
Source: BIDS Survey 2017
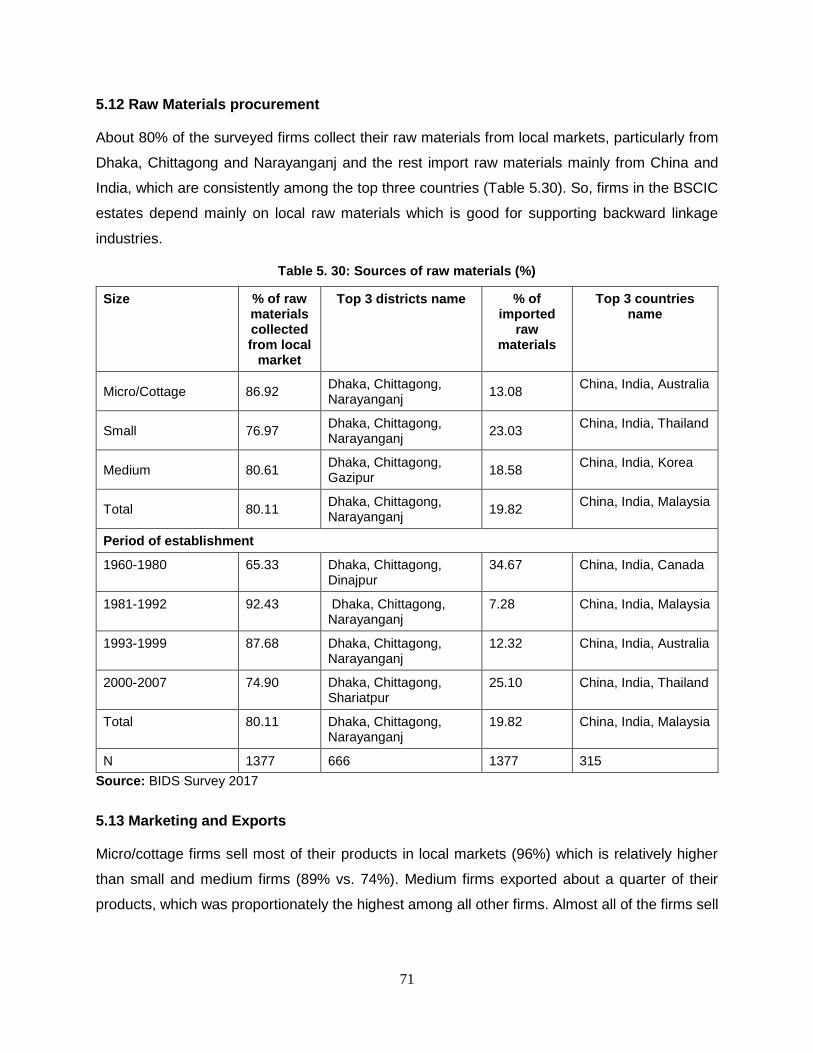
71
5.12 Raw Materials procurement
About 80% of the surveyed firms collect their raw materials from local markets, particularly from
Dhaka, Chittagong and Narayanganj and the rest import raw materials mainly from China and
India, which are consistently among the top three countries (Table 5.30). So, firms in the BSCIC
estates depend mainly on local raw materials which is good for supporting backward linkage
industries.
Table 5. 30: Sources of raw materials (%)
Size % of raw materials collected from local
market
Top 3 districts name % of imported
raw materials
Top 3 countries name
Micro/Cottage 86.92 Dhaka, Chittagong, Narayanganj
13.08 China, India, Australia
Small 76.97 Dhaka, Chittagong, Narayanganj
23.03 China, India, Thailand
Medium 80.61 Dhaka, Chittagong, Gazipur
18.58 China, India, Korea
Total 80.11 Dhaka, Chittagong, Narayanganj
19.82 China, India, Malaysia
Period of establishment
1960-1980 65.33 Dhaka, Chittagong, Dinajpur
34.67 China, India, Canada
1981-1992 92.43 Dhaka, Chittagong, Narayanganj
7.28 China, India, Malaysia
1993-1999 87.68 Dhaka, Chittagong, Narayanganj
12.32 China, India, Australia
2000-2007 74.90 Dhaka, Chittagong, Shariatpur
25.10 China, India, Thailand
Total 80.11 Dhaka, Chittagong, Narayanganj
19.82 China, India, Malaysia
N 1377 666 1377 315
Source: BIDS Survey 2017
5.13 Marketing and Exports
Micro/cottage firms sell most of their products in local markets (96%) which is relatively higher
than small and medium firms (89% vs. 74%). Medium firms exported about a quarter of their
products, which was proportionately the highest among all other firms. Almost all of the firms sell

72
their products in the local market with firms in earlier established estates (1960-80) exporting a
relatively higher proportion of their products compared to other estates (Table 5.31).
Table 5. 31: Share of products sold in local and export markets (%)
Size % of product sold in local
markets % of product sold in export
market
Micro/Cottage 96.02 3.98
Small 89.39 10.61
Medium 73.55 26.45
(Average) 89.78 10.22
Period of establishment % of product sold in local
market % of product sold in export
market
1960-1980 86.89 13.11
1981-1992 90.35 9.65
1993-1999 89.40 10.60
2000-2007 95.06 4.94
Average 89.78 10.22
Source: BIDS Survey 2017
5.14 Major constraints faced by the firms
Among the major constraints, financial crisis and market expansion was mentioned by25% of the
firms. Shortage of skilled workers and shortage of raw materials were reported by about 15% of
the firms. (Table 5.32).
Table 5. 32: Major constraints facing by the establishments (%)
Constraints Micro/cottage Small Medium Average
Financial crisis 31.58 22.62 22.86 24.81
Shortage of raw materials 12.28 17.54 10.48 15.48
Product quality improvement 2.19 2.62 0.95 2.33
Shortage of skilled workers 12.28 12.79 20.95 13.57
Market expansion/access 21.05 28.36 22.86 25.98
Others 20.61 16.07 21.90 17.82
Total 100 100 100 100
Source: BIDS Survey 2017
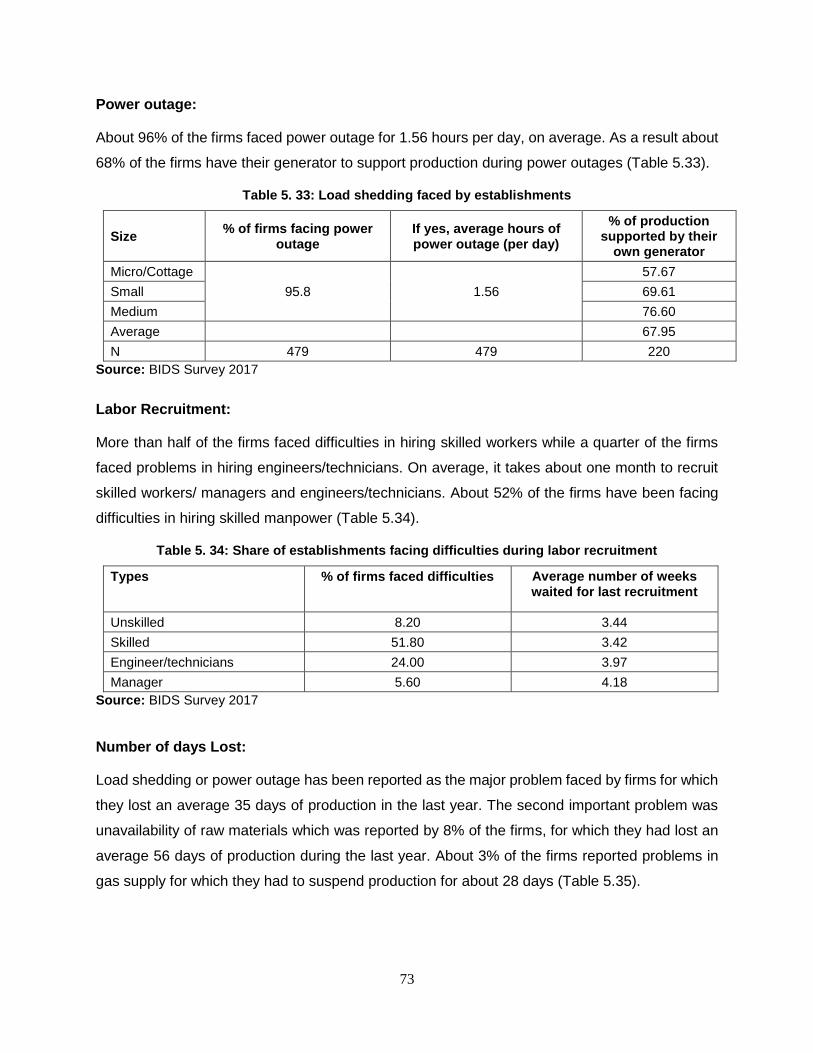
73
Power outage:
About 96% of the firms faced power outage for 1.56 hours per day, on average. As a result about
68% of the firms have their generator to support production during power outages (Table 5.33).
Table 5. 33: Load shedding faced by establishments
Size % of firms facing power
outage If yes, average hours of power outage (per day)
% of production supported by their
own generator
Micro/Cottage
95.8 1.56
57.67
Small 69.61
Medium 76.60
Average 67.95
N 479 479 220
Source: BIDS Survey 2017
Labor Recruitment:
More than half of the firms faced difficulties in hiring skilled workers while a quarter of the firms
faced problems in hiring engineers/technicians. On average, it takes about one month to recruit
skilled workers/ managers and engineers/technicians. About 52% of the firms have been facing
difficulties in hiring skilled manpower (Table 5.34).
Table 5. 34: Share of establishments facing difficulties during labor recruitment
Types % of firms faced difficulties Average number of weeks waited for last recruitment
Unskilled 8.20 3.44
Skilled 51.80 3.42
Engineer/technicians 24.00 3.97
Manager 5.60 4.18
Source: BIDS Survey 2017
Number of days Lost:
Load shedding or power outage has been reported as the major problem faced by firms for which
they lost an average 35 days of production in the last year. The second important problem was
unavailability of raw materials which was reported by 8% of the firms, for which they had lost an
average 56 days of production during the last year. About 3% of the firms reported problems in
gas supply for which they had to suspend production for about 28 days (Table 5.35).

74
Table 5. 35: Average number of days lost last year due the following unfavourable situations
Reasons/situation % of firms reported/have experiences
Average days of production lost (during last year)
Days N
Labor strike 0.39 19 2
Load shedding 82.66 35.47 429
No/low gas connection 3.28 27.53 17
Unavailability of raw materials 8.48 55.98 44
Due to water logging 1.54 14.63 8
Due to lack of product demand 1.73 58.78 9
Machinery problem/Servicing 0.77 22 4
For Ramadan 0.96 31 5
Others 0.19 8 1
Source: BIDS Survey 2017
5.15 Training facilities
About 43%of the firms provide training to their employees. About 40.6% of the firms provide on
the job training to their employees while only a meager proportion of the firms provide off the job
training. Overall, firms in earlier established estates are seen to provide more training to their
employees than firms in recently established estates (Table 5.36).
Table 5. 36: Existing training facilities and types (by establishment size)
Size % of firms providing
training to their employees
% of firms providing on the
job training
% of firms providing off the
job training
% of firms providing both on & off the job
training
Micro/Cottage 25.00 25.62 20.00
Small 58.33 58.62 33.33 60.00
Medium 16.67 15.76 66.67 20.00
Total 100 100 100 100
Overall share 43.20 40.6 0.6 2
N 500 203 3 10
Period of Establishment
1960-1980 31.94 33.50 10.00
1981-1992 17.13 16.26 66.67 20.00
1993-1999 31.48 32.02 33.33 20.00
2000-2007 19.44 18.23 50.00
Total 100 100 100 100
Overall share 43.20 40.6 0.6 2
N 500 203 3 10
Source: BIDS Survey 2017

75
On the job-training was received mainly by production workers of all firms. The proportion of
production workers that received on the job training is comparatively higher for micro/cottage firms
(90%) than small and medium firms (75.6% vs. 85.4%) (Table 5.37)
Table 5. 37: Ratio of workers receiving on the job training
Size % of production workers % of other workers Total
Micro/Cottage 90.00 10.00 100
Small 75.62 24.38 100
Medium 85.36 14.64 100
(Avg.) 80.86 19.14 100
N 215 215 215
Source: BIDS Survey 2017
Among the surveyed 500 firms, only 29 firms reported that their employees received some sort of
training from BSCIC (Table 5.39). The average duration of training is reported to be 4-5 days.
Regarding the evaluation of BSCIC training, firms rated it poor with an average score 2.
Table 5. 38: Received training from BSCIC and their evaluation
Size % of firms reported yes Average duration (days) Average score (Out of 5)
Micro/Cottage 25.93 4.00 2.00
Small 55.56 3.88 2.31
Medium 18.52 4.60 1.60
Overall 5.40 4.03 2.10
N 500 29 29
Source: BIDS Survey 2017
Regarding the improvement of BSCIC training, about one third of the respondents suggested to
provide training according to business type as well as made to increase technical proficiency
(Table 5.39). Training on operating boiler machines and chemical handling (15.7%) was also
suggested by the firms.
Table 5. 39: Suggestions to improve the training provided by BSCIC (needs to be re-estimated)
Suggestions No. of enterprises % of response
Increasing the duration of training 4 1.65
Training should be given according to business trade 67 27.69
Training on increasing technical proficiency should be given 75 30.99
Training on operating boiler machines, chemical handling, and increasing technical skills should be given
38 15.70
Regular training should be provided 17 7.02
Training quality is good 7 2.89
Training on worker awareness should be provided 13 5.37
Training on market management should be given 4 1.65
Training on increasing productivity should be given 2 0.83
Fire safety training should be given 1 0.41
Visiting the fields right after training 3 1.24
Dialogue between owners and workers (to improve professional relationship)
3 1.24
Various forms of training should be given 8 3.31
Total
100
Source: BIDS Survey 2017
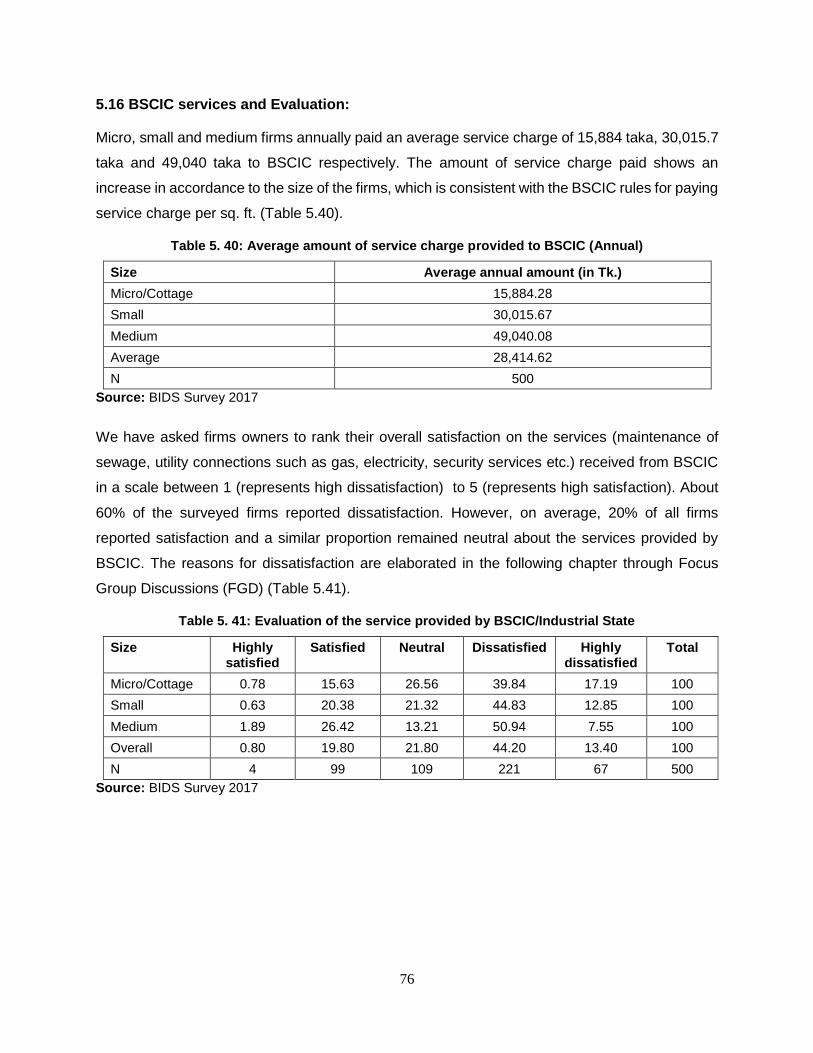
76
5.16 BSCIC services and Evaluation:
Micro, small and medium firms annually paid an average service charge of 15,884 taka, 30,015.7
taka and 49,040 taka to BSCIC respectively. The amount of service charge paid shows an
increase in accordance to the size of the firms, which is consistent with the BSCIC rules for paying
service charge per sq. ft. (Table 5.40).
Table 5. 40: Average amount of service charge provided to BSCIC (Annual)
Size Average annual amount (in Tk.)
Micro/Cottage 15,884.28
Small 30,015.67
Medium 49,040.08
Average 28,414.62
N 500
Source: BIDS Survey 2017
We have asked firms owners to rank their overall satisfaction on the services (maintenance of
sewage, utility connections such as gas, electricity, security services etc.) received from BSCIC
in a scale between 1 (represents high dissatisfaction) to 5 (represents high satisfaction). About
60% of the surveyed firms reported dissatisfaction. However, on average, 20% of all firms
reported satisfaction and a similar proportion remained neutral about the services provided by
BSCIC. The reasons for dissatisfaction are elaborated in the following chapter through Focus
Group Discussions (FGD) (Table 5.41).
Table 5. 41: Evaluation of the service provided by BSCIC/Industrial State
Size Highly satisfied
Satisfied Neutral Dissatisfied Highly dissatisfied
Total
Micro/Cottage 0.78 15.63 26.56 39.84 17.19 100
Small 0.63 20.38 21.32 44.83 12.85 100
Medium 1.89 26.42 13.21 50.94 7.55 100
Overall 0.80 19.80 21.80 44.20 13.40 100
N 4 99 109 221 67 500
Source: BIDS Survey 2017

77
Table 5. 42: Opinion about BSCIC facilities (% of establishment of response)
Highly satisfied
Satisfied Neutral Dissatisfied Highly dissatisfied
N
Plot allotment 0.81 45.73 33.54 14.23 5.69 492
Official service from BSCIC 0.6 41.6 31.2 19.4 7.2 500
Gas/electricity connection 0.2 40.4 23 20 16.4 500
Internal roads of BSCIC 0.6 12.2 3.6 43.2 40.4 500
Security and safety 0.8 16 15.4 29.6 38.2 500
Sanitation/sewerage
3.2 2.2 41 53.6 500
ETP/CETP
0.83
11.57 87.6 121
Ownership transfer charge/fee
13.66 8.61 45.38 32.35 476
Service charge 0.4 17.34 7.66 40.93 33.67 496
Allocation of land and property
2.46 38.17 26.34 20.31 12.72 448
Accounting 1.1 37.53 32.67 27.37 1.32 453
Government laws and regulations
29.35 33.7 32.83 4.13 460
Financing 0.47 16.86 20.37 41.92 20.37 427
Human resource management
10.28 21.66 48.36 19.69 457
Market management 1.13 13.77 20.09 40.86 24.15 443
Export promotion 0.24 7.6 24.7 38.95 28.5 421
Production process and technology
1.61 16.13 28.11 38.94 15.21 434
Application for subsidy 0.24 15.11 31.18 36.69 16.79 417
Business plan 2.52 25.23 24.08 36.24 11.93 436
Time duration related plot allotment, cancellation, ownership changed
18.85 29.1 33.2 18.85 488
Other financial management and budget formulation
0.52 18.44 35.32 32.73 12.99 385
Source: BIDS Survey 2017
Regarding BSCIC facilities, about 40-45% of the respondents are satisfied with gas/electricity
connection, official services from BSCIC and plot allotment and about 23-33% of the respondents
were neutral on these points. A greater proportion of firms showed their dissatisfaction on the
conditions of the estates’ internal roads (83.6%), ownership transfer charge (77.7%), service
charge (74%) and safety and security conditions (67.8%)20. On sanitation/sewerage and
ETP/CETP, more than 90% of the firms reported their dissatisfaction.
20 We have lumped both dissatisfied and highly dissatisfied figures together to show figures on dissatisfaction.

78
5.17 A comparative Analysis of the Performances of Estates
Most of the estates have plot utilization rate more than 75%. We find that 14 estates out of total
74 estates have plot utilization rates below 50%. Among them 9 estates have utilization rates
below 40% (Table A3, Annex). Only three estates have less than 10% utilization rate, which are
Rangamati (2.9%), Khagrachari (5.9%) and Bhola (8.1%). Low utilization rate of these three
estates have affected the overall utilization rate. Rangamati and Khagrachari are two hilly districts
while Bhola estate was surrounded by sea. Locational factor in terms of low demand for
industrialization, less availability of raw materials and labour, and low demand for products in the
local markets are some of the reasons behind the low utilization of these estates. In ten estates
we found more than 15% of sick industries. The prevalence of sick industries are relatively higher
in Cox’s Bazar (34.2%), Potya (33.3%), Gopalganj (25%), Jamalpur (22.7%) and Manikganj
(20%).
In terms of employment, the average number of employee per unit is 83.5. The percentage of
female employee is 32.1%. There are 14 estates that have more than 100 employee on average
per unit. The highest employment was created in Kushtia (782), followed by Fojdarhat (502),
Tongi (394), Hosiery (322) and Joydevpur (203). However, in terms of output per labor is the
highest Feni (9.58 million Taka), followed by Panchagarh (4.37 mill. Tk.), Kushtia (3.98 mill.),
Jamalpur (2.73 mill.). It appears that output-labor ratio is not the true reflection of better
utilization/industrialization in estates.
In term sof total output production, Feni performs the best (977 mil. Tk. Per unit), followed by
Tongi (405.9 mil.), Joydevpur (297.6 mil.), Hosiery (247.7 mil.), Jamalpur (214.4 mil.). Among the
4549 industrial estates, only 956 estates units have been involved in exporting products. The
highest number of exporting units belong to Hosiery estate (661), followed by Tongi (68), Jamdani
(50), Kalurghat (35).
Fixed asset-turnover ratio is an indicator of efficieny in production. Though in most of the estates,
fixed asset turnover ratio is over 1, the highest ratios are observed in Kushtia (720.2), Hosiery
(99.2), Jamalpur (58.3), Feni (44.2), Narsingdi (33.3) and others having around or below 20.
5.18 Summary of findings
It has been observed that most of the firms collect raw materials from local market and they target
local market to sell their products, which is encouraging for local industrialization. Firms annual
compound output growth is estimated at 9.2% for micro firms and about 3% for small and medium
firms. Profit growth is negative for micro and small firms while it is positive for medium firms during

79
2010-2016. The estimated gross value added is better for the BSCIC firms, which is nationally
comparable. Asset turnover ratio is better relatively among the larger firms.
Pattern of ownership change is more evident among small and medium firms. Power outage has
been reported as one of the major problem of production for which a firm has to forego production
for about 35 days in a year. Lack of gas connection is also reported by a major portion of firms as
a big threat for their production.
Some of the estates, such as Hosiery, Feni, Kushtia, Tongi, Fojdarhat, Kalurghat etc. have been
performing very high, while some of the estates, such as Khagrachari, Rangamati, Bhola etc.
have been performing low due to locational disadvantages and other problems. It is therefore
important to identify the key problems of the low performing estates and take necessary remedies.
80
Chapter 6: Contribution of BSCIC Industrial Estates on National economy and Local Tertiary economy
This chapter attempts to assess the contribution of BSCIC estates on the national economy in
terms of manufacturing output, employment, export and gross value added. Apart from that
industrial estate has an important spill-over impact on local (tertiary) economy in terms of the
development of road infrastructures, educational institutions, market and growth centers,
backward and forward linkage industries as well as on housing and land prices. This study also
tries to capture the impact of estates on the tertiary economy.
6.1 Contribution to national economy
Currently, there are 76 industrial estates located in various districts in Bangladesh, with two being
recently completed. Among the estates, four estates were established to promote some special
sectors like Jamdani and Hosiary, Tannery and Electronics. The 74 estates consist of 10389
industrial plots. Our analysis is based on the MIS database and some descriptive results which
are reported in Table 6.1. The estimated total production from BSCIC estates was Tk. 552622
million in 2016-17, which was 11.7% of country’s total industrial production and 18.7% of country’s
manufacturing production. BSCIC estates also export about 9.5% of total exports and 10% of
manufacturing exports. BSCIC estates have so far created employment of 0.564 million people,
which is 8.8% of total manufacturing employment and 21.4% of SME employment. Total Gross
value added (GVA) of BSCIC estates are estimated to be Tk. 105554.2 million from firm survey,
which is 6.35% of SME GVA.
One could argue that estates would perform much better if all the allotted plots are used for
production. As about 22% (1613 industrial plots) of the industrial plots are not utilized, this has a
significant negative implication on potential employment generation, output and government
revenue gains. A substantial rise in performance indicators would be expected if the utilization
rate increases to 100%.

81
Table 6.1: Production, export and employment of the BSCIC industrial estates, 2010-2017
Indicator 2010 2015-16 2016-17
Total national industrial GDP (Tk. In millions) 2293721 4,067,108 4,738,710
Total national manufacturing production (Tk. In millions) 1285730 2,544,831 2,951,110
Total national export (Tk. In millions) 1121140 2424147 2681080
Total national industrial export (Tk. In millions) 1059980 2325811 2578945
Total production from BSCIC estates (Tk. In millions) 273605 458797.4 552622.6
Total employment by manufacturing sector (in millions) 4.41 6.01 6.39
Total employment by SME sector (in millions) 1.4 2.47 2.63
Total employment by BSCIC estates (in millions) 0.445 0.563 0.564
% of BSCIC employment of the total manufacturing employment 10.1 9.4 8.8
% of BSCIC employment of the total SME employment 31.8 22.8 21.4
Total export from BSCIC (Tk. in millions) 152036 249309.2 255284.6
% of total industrial production 11.9 11.3 11.7
% of total manufacturing production 21.3 18.0 18.7
% of total export 13.6 10.3 9.5
% of total manufacturing export 14.3 10.7 9.9
SME Manufacturing gross value added (GVA) million Tk. 825712 1393360 1659657
BSCIC manufacturing gross value added (GVA) million Tk. 105554.2
BSCIC GVA as % of SME GVA 6.35%
BSCIC GVA per worker
Sources: Authors calculation using various issues of Statistical Yearbook, BBS (industrial GDP, manufacturing production); Bangladesh Bank (export statistics); Census of Manufacturing Industries (CMI) & Survey of Manufacturing Industries (SMI) for SME sector GVA and employment; MIS-BSCIC for production, export and employment statistics. Gross Value Added (GVA) in 2010, 2015-16& 2016-17 were calculated using the growth rate of GVA during 1995-96 & 2012. BSCIC GVA was estimated from firm survey.
6.2 Impact on Tertiary Economy
We tried to understand the impact of estates on tertiary economy21 through local people’s
perception. More precise calculation has been done using a Participatory Rural Appraisal (PRA)
tool called Community Resource Mapping (CRM). In FGD sessions, our main objectives were to
assess whether (1) any backward or forward linkage industries were established within one
kilometer of BSCIC estates, (2) business centers supply raw materials or buy products from
BSCIC industries, (3) new market or shops were established to support the employees of BSCIC
industries, (4) schools, colleges, madrasas were established, (5) health centers, pharmacies etc.
were established, and (6) impact on rental or land prices. FGD findings show that in most cases,
21The tertiary economy refers to the economic activities, mainly service sector outside the estate that is influenced by the estate activities. Tertiary sector includes transport, distribution, wholesaling, retailing, entertainment, restaurant etc.)
82
business, shops, and health centers were established and in some cases backward and forward
linkage industries and businesses were established. Estates also have a positive impact on land
price and house rent.
Market and growth centers
A few examples are notable. A hut (local wholesale bazar) was established on 30th November
2007 inside BSCIC Jamdani Estate in Naryanganj to sell the local product. This hut operates only
on Friday from 6:00 am to 8:00 am. Around 60 to 65 lac Taka worth Jamdani clothes have been
sold in each hut. About 35% of this cloth is from local BSCIC industries and the rest is from outside
BSCIC industries. Around8-10 shops have been established inside and within one kilometer of
BSCIC to sell knitting yarn and other raw materials for Jamdani handlooms. In addition to this,
almost 20-30 showrooms have been established to sell the products of BSCIC Jamdani
industries. All the workers reside within industry premise..
About 25-30 light engineering workshops have been established within one kilometer of Narsindi
BSCIC estate to support local BSCIC industries and two poly packaging industries have been
established after establishment of the estate. All these backward linkage industries employed
almost 300 workers. One of the BSCIC industry owners also established a fish feed mill just
opposite of the BSCIC estate which employed about 100 workers. However, BSCIC authorities
were unable to allocate additional plots to the mill owners due to plot shortage. A large market
known as Amtali Bazar has been established after the establishment of BSCIC estate. There are
around 50 shops in this market including fish, vegetable, restaurant, pharmacy, barber etc. shops.
Almost 50% of BSCIC workers buy their daily necessities from this market, about 25% go to
district level Velanagar Bazar (within 2 kilometers of the estate) and the rest 25% use local shops
(around 25-30 shops were established based on this demand) to buy their daily necessities.
Industries in Patuakhali BSCIC estate have a limited impact on the tertiary economy. Both industry
related people and local community people agreed that no backward or forward linkage industries
have been set up within one kilometer of BSCIC area. Only 10 grocery and tea shops have been
established after the establishment of BSCIC. No new educational institutions were established
yet. However, there is a significant impact on house rent. Industry and local community groups
responded similarly stating that there was no tradition of renting houses in this area at the time of
BSCIC’s estate establishment, and now it has begun as a result of the demand from BSCIC estate
industrial employees. At present, a standard singleroom is rented at around TK 1200 to TK 1500.
83
After the establishment of BSCIC industrial estate in Comilla, one local market has been
established within one kilometer of the estate. About 5 workshops are running in this market as
backward linkage industries, to support BSCIC industries. Almost 245 grocery shops, 150 tea
stalls, 31 restaurants, 10 butcher shops, 90 fish shops, 120 vegetable shops, 15 cloth stores, 61
pharmacies, 72 mobile accessories shops and 4 electronic shops are there, which have direct
and indirect significant impacts on tertiary economy. Market committee members informed that
the annual estimated transaction of this market is almost TK. 1,600 million. Around 2 primary
schools, 2 high schools, 2 technical colleges, 7 madrasas, 5 clinics and one doctor’s chamber
have been established after the establishment of BSCIC estate.
Panchagarh Sugar Mills, Border Guards Bangladesh (BGB) district headquartersand a local truck
stand have been established in this area before the establishment of BSCIC estate. Panchagarh
Sugar Mills was established in 1965-69 and the local truck stand was established almost three
years before BSCIC.These establishments are located within half a kilometer of the estate. These
three establishments have more influence on the local economy than BSCIC industries as almost
three industries inside the BSCIC estate are sick and the rest of the industries have a limited
capacity of employment generation. None of the backward and forward linkage industries were
established based on BSCIC industries. According to the villagers, BSCIC has a very limited
impact on house rent in the nearest villages, but there is a significant impact on land price because
of land and infrastructure development by BSCIC. No new markets, schools (both primary and
secondary), and colleges were established yet after the establishment of BSCIC estate.
House Rents:
FGD findings reveal that BSCIC industries have a significant impact on local house rents as
around 10 to 80% of the industry employees have to rely on rented houses for their housing. In
addition, local land price has significantly increased because of BSCIC’s land development and
industries’ employment.

84
Table 6.2: Shops within 1 Kilometer of BSCIC
Types of shops
1960-1980 1981-1992 1993-1999 2000-2007
Now Before BSCIC
Diff. (P.val)
Now Before BSCIC
Diff. (P.val)
Now Before BSCIC
Diff. (P.val)
Now Before BSCIC
Diff. (P.val)
Raw materials supplying for industry
40 10 30 12 8 4 1 0 1
Electronics 3.5 0 3.5 (0.26)
8 0 8 (0.16) 7 3.33 3.67 (0.05)
Workshops
5 1.33 3.67 (0.09)
4 0 4 (0.16) 11.5 1 10.5 (0.31)
4.33 0 4.33 (0.02)
Restaurant 71.75 6.75 65 (0.31) 3.33 .33 3 (0.12) 23.17 4 19.17 (0.02)
8 2.5 5.5 (0.17)
Grocery Shop
164.83 14.17 150.67 (0.09)
67.71 26.28571 41.43 (0.04)
128.14
14.43 113.71 (0.11)
31 4.4 26.6 (0.09)
Confectionary
25 2 23 18 5 13 (0.31)
6 0 6
Fish shop 40.67 7.33 33.33 (0.09)
Tea stall/shop
247.2 22.2 225 (0.26)
23.43 4 19.43 (0.03)
53.17 10.67 42.5 (0.11)
20.25 5.25 15 (0.01)
Salon 156.5 11.5 145 (0.48)
23.5 8 15.5 (0.48)
Others 30 5 25 3 0 3
Source: BIDS Survey 2017
Banks and Financial Institutions:
Banksare the major financial institutions for industrial investment and transactions. CRM data
shows that in all four phases (1960-1980, 1981-1992, 1993-1999 and 2000-2007), new banks
were established within one kilometer of BSCIC industrial estates. Insurance companies
established their offices in those BSCIC estates areas which were established in the last three
phases. Highest number of cooperative associations (5) was established in the old BSCIC areas
(Table 6.3).
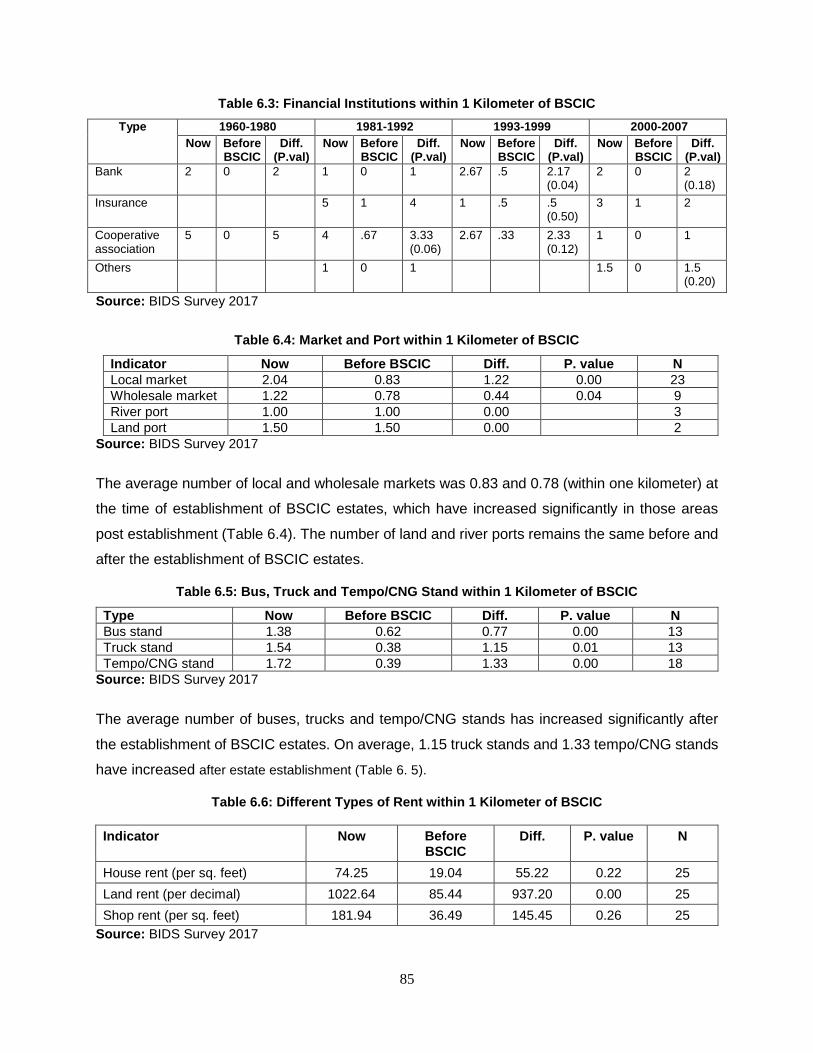
85
Table 6.3: Financial Institutions within 1 Kilometer of BSCIC
Type 1960-1980 1981-1992 1993-1999 2000-2007
Now Before BSCIC
Diff. (P.val)
Now Before BSCIC
Diff. (P.val)
Now Before BSCIC
Diff. (P.val)
Now Before BSCIC
Diff. (P.val)
Bank 2 0 2 1 0 1 2.67 .5 2.17 (0.04)
2 0 2 (0.18)
Insurance 5 1 4 1 .5 .5 (0.50)
3 1 2
Cooperative association
5 0 5 4 .67 3.33 (0.06)
2.67 .33 2.33 (0.12)
1 0 1
Others 1 0 1 1.5 0 1.5 (0.20)
Source: BIDS Survey 2017
Table 6.4: Market and Port within 1 Kilometer of BSCIC
Indicator Now Before BSCIC Diff. P. value N
Local market 2.04 0.83 1.22 0.00 23
Wholesale market 1.22 0.78 0.44 0.04 9
River port 1.00 1.00 0.00 3
Land port 1.50 1.50 0.00 2
Source: BIDS Survey 2017
The average number of local and wholesale markets was 0.83 and 0.78 (within one kilometer) at
the time of establishment of BSCIC estates, which have increased significantly in those areas
post establishment (Table 6.4). The number of land and river ports remains the same before and
after the establishment of BSCIC estates.
Table 6.5: Bus, Truck and Tempo/CNG Stand within 1 Kilometer of BSCIC
Type Now Before BSCIC Diff. P. value N
Bus stand 1.38 0.62 0.77 0.00 13
Truck stand 1.54 0.38 1.15 0.01 13
Tempo/CNG stand 1.72 0.39 1.33 0.00 18
Source: BIDS Survey 2017
The average number of buses, trucks and tempo/CNG stands has increased significantly after
the establishment of BSCIC estates. On average, 1.15 truck stands and 1.33 tempo/CNG stands
have increased after estate establishment (Table 6. 5).
Table 6.6: Different Types of Rent within 1 Kilometer of BSCIC
Indicator Now Before BSCIC
Diff. P. value N
House rent (per sq. feet) 74.25 19.04 55.22 0.22 25
Land rent (per decimal) 1022.64 85.44 937.20 0.00 25
Shop rent (per sq. feet) 181.94 36.49 145.45 0.26 25
Source: BIDS Survey 2017

86
Land value:
Another major impact is on the land value of the local area. BSCIC first acquired the land and
then developed for the industrial estates. Naturally it has an impact on adjacent land of the locality.
Therefore, we try to assess here how much the value has increased just for BSCIC estate in
addition to local normal price hike. We have collected the government official mouja price of 16
industrial estates from the respective sub-register offices, and current value within one kilometer
has been collected from the local people at the time of community resource mapping. After
adjustment of land price with Mauja prices (1.5 times higher than reported Mauja price), we see
thaton an average land price within one kilometer of BSCIC estates is almost 41% higher than
the mouja price of those areas. This data clearly indicates that BSCIC estates have positive
impact on local land price.
Table 6.7: Per Decimal Land Value within 1 Kilometer of BSCIC (in Tk.)
Estate Current value
within 1 km
Govt. Mouja Value
Calculated Market Price of Mouja*
Difference (Current value – calculated
market price)
Percentage of higher price
within 1 km of BSCIC
Bogra-Ext. 400000 312757 390946.25 9053.75 2.32
Comilla 700000 292573 365716.25 334283.75 91.41
Dhamrai 250000 196774 245967.5 4032.5 1.64
Feni-Charipur 650000 487825 609781.25 40218.75 6.60
Habiganj 100000 59640 74550 25450 34.14
Jamdani 300000 234000 292500 7500 2.56
Joypurhat 50000 29163 36453.75 13546.25 37.16
Kishoreganj 90000 37886 47357.5 42642.5 90.04
Narayanganj (Kanchpur)
500000 244253 305316.25 194683.75 63.76
Noakhali 50000 21350 26687.5 23312.5 87.35
Panchgarh 10000 4601 5751.25 4248.75 73.88
Patuakhali 100000 48710 60887.5 39112.5 64.24
Potiya 450000 319066 398832.5 51167.5 12.83
Satkhira 60000 46671 58338.75 1661.25 2.85
Thakurgaon 150000 68773 85966.25 64033.75 74.49
Tongi 500000 353357 441696.25 58303.75 13.20
Average
41.15
* Market price was calculated from govt. official mouja price of the nul land using the method followed in BIDS study on “Land Market Survey for Determining the Current Market Price of Additional Lands in the Area Affected by Padma Multipurpose Bridge Project” in 2017.
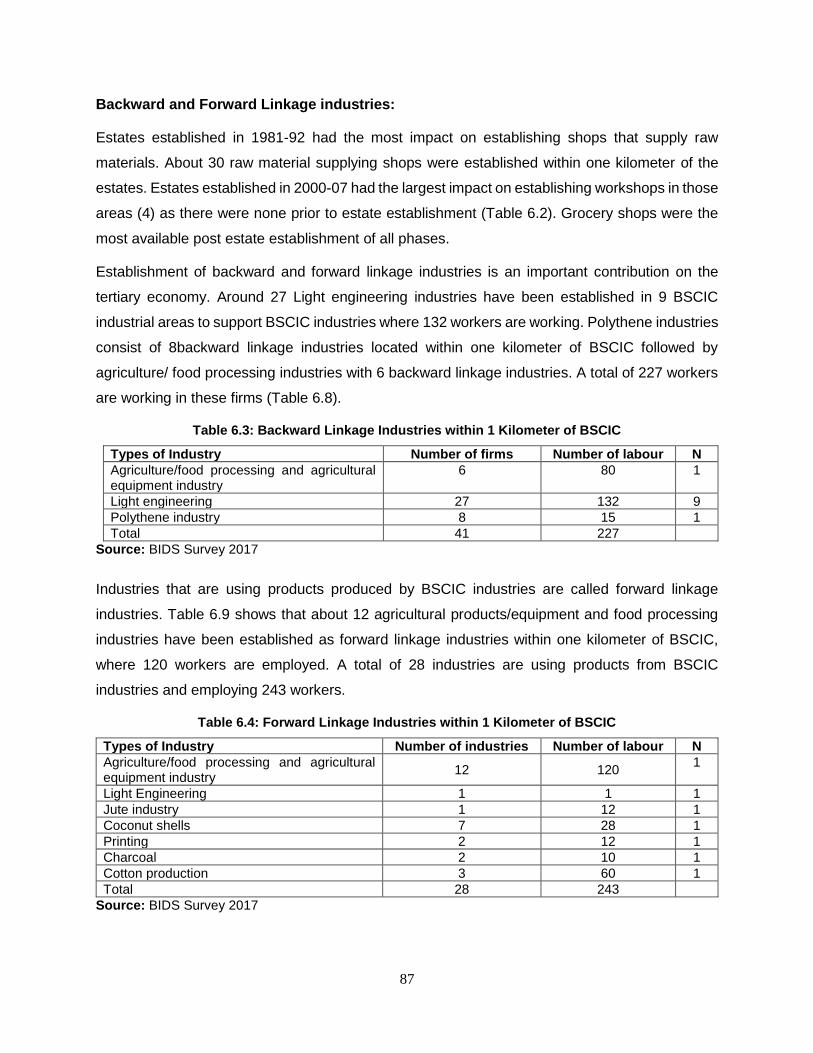
87
Backward and Forward Linkage industries:
Estates established in 1981-92 had the most impact on establishing shops that supply raw
materials. About 30 raw material supplying shops were established within one kilometer of the
estates. Estates established in 2000-07 had the largest impact on establishing workshops in those
areas (4) as there were none prior to estate establishment (Table 6.2). Grocery shops were the
most available post estate establishment of all phases.
Establishment of backward and forward linkage industries is an important contribution on the
tertiary economy. Around 27 Light engineering industries have been established in 9 BSCIC
industrial areas to support BSCIC industries where 132 workers are working. Polythene industries
consist of 8backward linkage industries located within one kilometer of BSCIC followed by
agriculture/ food processing industries with 6 backward linkage industries. A total of 227 workers
are working in these firms (Table 6.8).
Table 6.3: Backward Linkage Industries within 1 Kilometer of BSCIC
Types of Industry Number of firms Number of labour N
Agriculture/food processing and agricultural equipment industry
6 80 1
Light engineering 27 132 9
Polythene industry 8 15 1
Total 41 227
Source: BIDS Survey 2017
Industries that are using products produced by BSCIC industries are called forward linkage
industries. Table 6.9 shows that about 12 agricultural products/equipment and food processing
industries have been established as forward linkage industries within one kilometer of BSCIC,
where 120 workers are employed. A total of 28 industries are using products from BSCIC
industries and employing 243 workers.
Table 6.4: Forward Linkage Industries within 1 Kilometer of BSCIC
Types of Industry Number of industries Number of labour N
Agriculture/food processing and agricultural equipment industry
12 120 1
Light Engineering 1 1 1
Jute industry 1 12 1
Coconut shells 7 28 1
Printing 2 12 1
Charcoal 2 10 1
Cotton production 3 60 1
Total 28 243
Source: BIDS Survey 2017

88
Hospitals/clinics/Drug stores:
The average number of doctors’ chambers and private clinics has increased significantly within
one kilometer of those BSCIC estates which have been established in the second, third and fourth
phases. The highest number of average health facilities (16) has increased in old BSCIC estates
(Table 6.10).
Table 6.5: Health Services within 1 Kilometer of BSCIC
Types 1960-1980 1981-1992 1993-1999 2000-2007
Now Before BSCIC
Diff. (P.val)
Now Before BSCIC
Diff. (P.val)
Now Before BSCIC
Diff. (P.val)
Now Before BSCIC
Diff. (P.val)
Doctor’s chamber
35.5 2.5 33 (0.49)
11 1 10 (0.47)
10 1.71 8.29 (0.01)
4.67 2 2.67 (0.16)
Clinic 8 0 8 (0.16) 1.75 0 1.75 (0.21)
3.2 .2 3 (0.01) 1.5 0 1.5 (0.20)
Private hospital
3.5 .5 3 (0.09) 1 0 1 3 0 3
Government health center
1 .67 .33 (0.42)
Government hospital
1 1 0 1 0 1
Others 4 2 2 (0.30) 14.33 .67 13.67 (0.31)
1 0 1 3 0 3
Total 18.33 2 16.33 (0.26)
15.8 1.8 14 (0.28)
13.29 2.29 11 (0.00) 5.75 1.5 4.25 (0.11)
Source: BIDS Survey 2017
Educational Institutions:
In terms of number, more madrasas have been set up within one kilometer surrounding areas
than the other educational institutions after the establishment of BSCIC industrial estates followed
by high schools. Though it is difficult to establish any direct causal relationship from the CRM
data, but definitely there has been a relationship between the number of educational institutions
and industrialization. Asmore workers are employed in the industrial estates,more educational
institutions are needed to accommodate their children (Table 6.11).
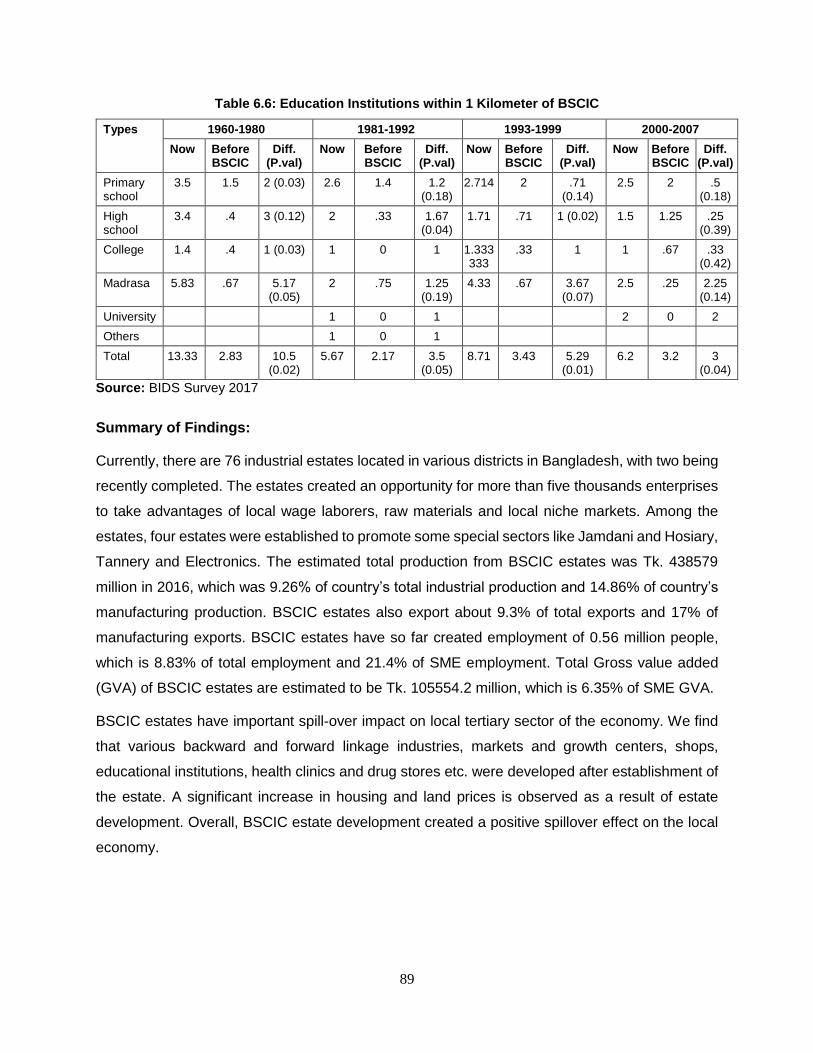
89
Table 6.6: Education Institutions within 1 Kilometer of BSCIC
Types 1960-1980 1981-1992 1993-1999 2000-2007
Now Before BSCIC
Diff. (P.val)
Now Before BSCIC
Diff. (P.val)
Now Before BSCIC
Diff. (P.val)
Now Before BSCIC
Diff. (P.val)
Primary school
3.5 1.5 2 (0.03) 2.6 1.4 1.2 (0.18)
2.714 2 .71 (0.14)
2.5 2 .5 (0.18)
High school
3.4 .4 3 (0.12) 2 .33 1.67 (0.04)
1.71 .71 1 (0.02) 1.5 1.25 .25 (0.39)
College 1.4 .4 1 (0.03) 1 0 1 1.333333
.33 1 1 .67 .33 (0.42)
Madrasa 5.83 .67 5.17 (0.05)
2 .75 1.25 (0.19)
4.33 .67 3.67 (0.07)
2.5 .25 2.25 (0.14)
University 1 0 1 2 0 2
Others 1 0 1
Total 13.33 2.83 10.5 (0.02)
5.67 2.17 3.5 (0.05)
8.71 3.43 5.29 (0.01)
6.2 3.2 3 (0.04)
Source: BIDS Survey 2017
Summary of Findings:
Currently, there are 76 industrial estates located in various districts in Bangladesh, with two being
recently completed. The estates created an opportunity for more than five thousands enterprises
to take advantages of local wage laborers, raw materials and local niche markets. Among the
estates, four estates were established to promote some special sectors like Jamdani and Hosiary,
Tannery and Electronics. The estimated total production from BSCIC estates was Tk. 438579
million in 2016, which was 9.26% of country’s total industrial production and 14.86% of country’s
manufacturing production. BSCIC estates also export about 9.3% of total exports and 17% of
manufacturing exports. BSCIC estates have so far created employment of 0.56 million people,
which is 8.83% of total employment and 21.4% of SME employment. Total Gross value added
(GVA) of BSCIC estates are estimated to be Tk. 105554.2 million, which is 6.35% of SME GVA.
BSCIC estates have important spill-over impact on local tertiary sector of the economy. We find
that various backward and forward linkage industries, markets and growth centers, shops,
educational institutions, health clinics and drug stores etc. were developed after establishment of
the estate. A significant increase in housing and land prices is observed as a result of estate
development. Overall, BSCIC estate development created a positive spillover effect on the local
economy.
90
Chapter 7: Summary and Conclusions
The evaluation of BSCIC estates covers various aspects of an estate that needs to be considered,
such as plot allocation and utilization, occupancy rate, estate turnover ratio, estate management,
estate revenue generation, firm performance etc. These aspects are briefly summarized below
and accordingly, some recommendations are made to move forward.
A total of 76 industrial estates has been established so far with 2 estates yet to be in operation.
The estates were being established in six phases starting from 1960 and the latest phase being
completed in 2017. A total of 1969 acres of land was utilized for establishing 74 estates, of which
3.6% land was used for administrative and other purposes(Mosques/bank/ Green space etc.) and
19% was used for roads and drainage system. A total of 10389 plots were developed in 74
estates, 96.8% of which were being allotted to entrepreneurs. The latest MIS report of BSCIC
suggests that among the allotted plots, about 22% of the allotted plots remained unutilized (the
rate is 27% if un-allotted plots are included). This huge amount of unutilized plots is a big concern
for BSCIC though in most cases, the reasons for plot un-utilization is beyond BSCIC’s control. In
general, the low plot utilization is a culmination of several factors including weaknesses in
enforceability of rules and regulations, problems in the selection process of entrepreneurs during
plot allocation, infrastructure bottlenecks (gas/electricity connection) etc. Plot utilization rate is the
lowest in Barisal division (50%) and highest in Rajshahi division (95%). The annual compound
growth rate of sick units has been estimated at about 4.4% mainly due to financial constraints,
which is also a cause of concern, and indirectly related to entrepreneur selection problem. We
also see that almost two plots are allotted to each of the enterprizes. The estimated fixed asset
turnover ratio for some estates are very low indicating the inefficiencies from the part of
entrepreneurs in utilizing the fixed assets including allotted plots properly. Therefore, while
analysing the application for plot, it is important to carefully examine the necessity of the amount
of land in terms of the business plan of the applicant.
We find that a substantial number of firms change ownership and existing industrial sector every
year for various reasons. In 2016 a total of 263 firms have changed ownership and 108 firms have
changed industry sector. However, the process takes about six months due to BSCIC’s
centralized decision-making approach, which causes a loss to entrepreneurs. The process thus
needs to be revisited so that such changes can be approved in a short-period of time, such as
within a maximum time period of 1-2 months. About 35% of the posts in estate offices remained

91
vacant for long time, and therefore it is also necessary to rethink how to improve estate
management affairs.
The existing estates created an employment opportunity for about 0.56 million people, however,
the growth of employment is negligible over the years. Despite stagnant employment, production
has been growing at a rate of 10% annually indicating increased productivity of the firms. About
21% of the firms are engaged in exporting and their export growth is about 5% annually. Among
the enterprises in BSCIC estates, textile and agro-food processing sectors dominate having 35%
and 28% of their share respectively. The estimated Return on Investment (RoI) for BSCIC estates
over time is found to be more than 1 indicating that the estates generate positive return to
investment.
In most cases, industrial estates were developed on agricultural and low land, where single or
two crops were being produced at the time of land acquisition. Except for some deviations, almost
all of the estates were established in the right places, considering good connectivity with district
and regional highways and availability of raw materials. Almost all of the estates have an electricity
connection while only 57% of the estates have gas supply connection. About 80% of the estates
have water supply facilities and one estate has CETP (Savar tannery). In about 37 estates ETPs
have been established by individual enterprises. Some of the key problems identified are:
• Most of the industry owners and employees have expressed their dissatisfaction about the
road, boundary wall, drainage system and street lights inside the BSCIC estates.
• Except a few of the BSCIC estates, all estates have a serious problem of water logging
due to poor maintenance of the existing drainage system.
• None of the BSCIC estates have a boundary wall which is a major concern for the industry
owners and employees, as it is required in order to protect their valuable goods.
• Even street lights are not available in most of the estates which further creates a threat to
the security and the safety of the estates.
• A poor annual allocation of resources from BSCIC is one of the main reasons behind poor
maintenance of the infrastructures inside the estates.

92
• Manpower shortage in the estates is the other important reason cited for poor
maintenances of estate facilities. Higher allocation of resources for the maintenance of
infrastructure inside estates, or a mechanism can be developed through which a major
portion of the collected service charges would be used for the maintenance of the
respective estate.
• A committee comprising of estate officials, industry owners and local government officials
can be formed to oversee the usage of the fund.
• Another big concern among the industry owners is regarding the payment of holding taxes
to the local government (Pouroshava/Municipality) despite not receiving any maintenance
services from them inside the estate. This issue needs to be resolved through effective
consultation between BSCIC/Ministry of Industries and the Local Government Division.
This approach could also solve the infrastructure bottlenecks inside the estate.
• Environmental concerns were not well addressed while establishing BSCIC estates.
Currently about two-third of the firms release solid waste inside the estate and similar
proportion of firms release liquid waste to nearby rivers/canals. During the plot allotment
process, environmental concerns must be addressed.
As a substantial number of plots remained unutilized, it is important to identify the reasons behind
such non-utilization. We find that there are various reasons behind non-utilization of plots. The
reasons include:
• resale motive of the plot owners
• inappropriate location
• lack of electricity and gas connection and supply
• extortion and insecure local environment (hilly districts)
• bias in selecting plot owners
• lack of access to credit due to poor project profile
• problems of marketing or low local demand
• long distance from major ports
• shortage of skilled manpower
• shortage of raw materials in the surrounding areas

93
• court case or stay order from court
• poor communication through roads and lack of good regional entrepreneurs
• corrupt practices of some BSCIC estate officails, etc.
Although BSCIC has clear and time bound cancellation policy and have mechanism to take
actions for those who do not follow the timeline, but they could not do it properly due the lack of
expertise and high legal costs. It was argued by the local stakeholders that the initial screening
for plot allocation needs to be strengthened by ensuring more participation of local business
communities and experts in the committee in addition to BSCIC officials.
We also observe that the existing entrepreneurs cannot utilize their capacity at its full potential
because of various problems they face, such as lack of gas connection, frequent load shedding
of electricity, poor infrastructural facilities (i.e. road and drainages, street light, water supply),
inadequate security (i.e. no boundary walls), financial problems (i.e. inadequate loan), lack of
ETPs etc. Moreover, lack of skilled workers, unavailability of raw materials etc. are also big
constraints for non-utilization of their full capacity. So, improvement of these constraints could
lead to better utilization of the existing industrial estates and unutilized plots.
Overall, 5.9 percent of the allotted industrial units (341 in number) are currently sick or in shutdown
state. Both internal and external factors are responsible behind the sickness of the industrial units.
The major internal factors includes death/sickness of owner, default to repay bank loan,
management inefficiency. Major external factors include the shortage of working capital, higher
interest rate on bank loan, non-availability and/or higher input cost etc. Some of the sick
entrepreneurs are bank loan defaulter and their assets are less than their liabilities, and some of
them are facing court certificate case which have created obstacle to rerun those units. However,
one possible solution could be to find a potential new or existing entrepreneurs who can takeover
sick or shutdown units.
As far as BSCIC estates are concerned, their contribution to the national economy and local
tertiary sector of the economy is noteworthy. The estates created an opportunity for more than
five thousand enterprises to reap benefits from local wage laborers, raw materials and local niche
markets. Among the estates, four estates were established to promote some special sectors like
Jamdani and Hosiary, Tannery and Electronics. The estimated total production from BSCIC
estates was Tk. 552622 million in 2016-17, which was 11.7% of country’s total industrial
production and 18.7% of country’s manufacturing production. BSCIC estates also export about
9.5% of total exports and 10% of manufacturing exports. BSCIC estates have so far created

94
employment for 0.564 million people, which is 8.8% of total manufacturing employment and 21.4%
of SME employment. Total Gross value added (GVA) of BSCIC estates are estimated to be Tk.
105554.2 million from firm survey, which is 6.35% of SME GVA.
BSCIC estates have important spill-over impacts on local tertiary sector of the economy. We find
that various backward and forward linkage industries, markets and growth centers, shops,
educational institutions, health clinics and drug stores etc. were developed after establishment of
the estate. A significant increase in housing and land prices is observed as a result of estate
development. Overall, BSCIC estate development created a positive spillover effect on the local
economy.
Analyzing the performances of firms operating under the estates, we find that their performances
are comparable to the performances of SMEs at a national level and in some cases BSCIC estate
firms’ performances are better than those that are located outside the estates. The better
performance of BSCIC estates can be attributed to the agglomeration of businesses, which
created various opportunities to share risks and returns.
From the above discussion, we may identify several problems or difficulties that the BSCIC
estates are now facing which need to be resolved on an urgent basis for the sake of better
industrialization.
First, there is an overwhelming proportion of plots (over 22%) that are unutilized (the rate is 27%
including un-allotted plots).
Second, poor maintenance of infrastructure inside the estates is another problem which is related
to financial constraints of BSCIC, and partly due to the centralized system of decision-making
process, and
Third, the absence of a dedicated gas and electricity supply and dynamism in the decision-making
process also hampers proper functioning of the industrial units.
Some recommendations are made below to resolve the problems.
Recommendations:
E. How to resolve current constraints:
The BSCIC needs to review all the constratints behind non-utilization of plots carefully and may
take the following actions to enhance the existing plot utilization rate:

95
• Ensure adequate gas supply to each industrial unit before starting operation with
permission from appropriate government authority;
• Establish a dedicated electricity supply line to every BSCIC estate so that uninterrupted
electricity supply can be ensured;
• Need to build a boundary wall of each industrial estates and increase the number of street
lights to improve the security situation of the estates;
• Need to increase the maintenance fund for improving the existing road and drainages to
prevent waterlogging during rainy seasons. A certain portion of service charges received
from an estate may be spent locally. We propose that a provision of 60% of total service
charges received from an estate may be spent in that estate for its maintanence.
• Expedite administrative support services to entrepreneurs so that they can get
permission on relevant issues timely.
• BSCIC may increase their credit facilities for the potential industrial units to ease their
credit constraints. In that case, BSCIC may introduce a concessional credit line like the
Credit Wholesale program (CWS) of SMEF through banks. BSCIC may request the
government to allocate sufficient fund to extend CWS like credit line for easing credit
constratints of SMEs;
• Need to provide assistance to the entrepreneurs to get quick environmental certificate
and a bank loan;
• Fill out the vacant posts in the relevant estates to enhance the service delivery and
efficient management of BSCIC estates.
F. A Sustainable Approach for Proper Maintenance of Estates
The current allocation for the maintenance of infrastructures like roads, drainage etc. in estates
is quite inadequate and has led to widespread dissatisfaction among the entrepreneurs. For
making estate management a sustainable and viable process, the following recommendations
are made.
6. There is no denying that BSCIC estates have been suffering from inadequate
maintainence of infrastructures, such as roads, drainage, boundary walls, street lights
etc. Our findings suggest that the service charges that estates receive is quite insufficient
to repair or reconstruct the above-mentioned infrastructure facilities. It is therefore
important for the government to allocate one-time fund to improve infrastructures of all

96
the estates. Along with, there should have a provision of yearly allocation of adequate
O&M (operations and maintainence) fund for the estates. As already mentoned, 60%
locally collected service charge may be allowed to spend locally for the purpose of O&M.
7. Once an estate is developed, we don’t see any necessity to have a BSCIC estate office
inside an estate. Therefore, all estate offices can be merged with ISC and vacant estate
office plots can be opened up for industrial plots. In this way, around 3.6% of total estate
land can be made available for industrial plot allocation. This action will also reduce
BSCIC’s operating costs for the estate office management.
8. For infrastructure maintenance of the estate, a registered estate association consisting
of 5-10 industry owners with one observer from BSCIC, may be formed (by election) to
oversee estate infrastructure and undertake actions to improve estate infrastructure and
other related issues. BSCIC may prepare a guideline, which has to be followed by the
Committee.
9. Once Estate maintenance is delegated to industry Owner’s association, the provision of
annual service charge may be waived or reduced.
10. District offices will collect all other necessary fees, data and documents periodically from
the estate. All administrative services (ownership transfer/trade change/cancellation etc.)
may be rendered from the District BSCIC office (ISC).
G. Recovery of un-utilized Plots:
Considering the scare resource of land in a country like Bangladesh, it is un-expected that a
substantial amount of serviced land remained unutilized. This un-utilization rate also poses a
question to government’s initiatives towards promoting small and cottage industries. Therefore,
to improve the plot utilization rate some time-bound measures can be undertaken.
Short-term measures (within one year):
9. An immediate assessment of the unutilized but allotted plots can be made in terms of three
categories, such as (a) plots that are immediately recoverable, (b) plots that are in legal
process but can be recovered in a year and (c) plots that are difficult to be recovered.
Immediate measures should be taken to address the problems based on each category.
On the other hand, the plots that could not be allotted yet needs further assessment. For
example, estates in hilly districts have higher un-utilized (un-allotted) plots for which
special incentives for entrepreneurs need to be designed so that they could come up to

97
establish industrial units. For hilly estates or other remote estates where plot allotment
rate is low, incentives could be offered to the established and bigger industries who are in
need of business expansion (For example, BRB cables) so that they could utilize those
plots.
Medium-term measures (1-2 years):
10. A committee comprising of industrial association representatives, experts and academics
can be formed to review BSCIC’s overall estate management and plot utilization issues.
The proposed Committee will review the existing rules and regulations and propose to
amend them in order to rectify the loopholes that the entrepreneurs use to keep the plots
unutilized. Measures should be taken to improve the enforceability of rules and
regulations.
11. Decentralization/delegation of power to local/regional BSCIC offices is also needed to
expedite decision making process.
12. The initial screening of application is usually done by the BSCIC estate officer and the
district officer after which the screened applications are placed for approval in the
Allotment Committee headed by the Deputy Commissioner. It is therefore important to
revise the application criteria as well as strengthen the initial screening committee of
BSCIC. We recommend that at least three more persons including local business
association representatives and experts may be added in the screening committee.
Longer-term measures (2-3 years period):
13. A one-stop service center at BSCIC office is a long standing demand of the MSMEs. Thus,
a one-stop facility center needs to be established within next 2-3 years to support MSMEs
of all BSCIC estates. We propose to establish one-stop service facility center in all the
regional BSCIC offices gradually. Initially, a one-stop center may be started in Dhaka.
14. Start-up Incubators for new entrepreneurs: A start-up incubator may be established in
each estate for the new entrepreneurs. The costs of establishing start-up incubator may
be shared by both BSCIC and new entrepreneurs. Before allowing new entrepreneurs to
start their production/business independently, a provision or rule may be made to ask them
to start their business in the incubator first and continue for two years. Upon satisfactory
performance, they may be allowed to start their business independently in their own plots.
About 10-20% of the plots may be used for establishing incubators with admissible
facilities so that new entrepreneurs can get exposure to be graduated from the incubator.

98
15. Further expansion of BSCIC estates should be made based on the demand for industrial
plots. As we have observed, the demand for plots is very high in some places but the
demand is rather weak in many other places. We think that it is not a good idea to
implement “one estate in one district” as this policy has not been proved to be effective in
industrialization. Construction of indutrial estate must be based on the size of local market,
better communications, availability of raw materials, availability of cheap labours etc. For
the estates established in hilly districts in which most of the plots remain vacant need
further attention. We feel that some incentive mechanism may be developed for the usage
of these plots.
16. An alternative approach would be to allocate vacant plots to some bigger industries for
immediate utilization of those plots.
H. Data and Reporting
BSCIC maintains an MIS of estate information based on the periodic reporting of estate offices.
A comparison between our survey data and MIS data identified a substantial gap with
underestimated figures reported in the MIS report (Table A8 in Appendix). Our survey reveals that
estate offices do not collect information from enterprises, rather they collect data in an
unprofessional ad-hoc way. So it is important to develop a sustainable approach of better data
collection and reporting for a better representation of BSCIC estates performance and their
contribution to the National Economy. A prescribed form may be developed for individual firms for
the reporting of their performances to BSCIC district offices on a half yearly basis. The proposed
Industry Owner’s Association could be made responsible to provide accurate information about
firms’ performance and other related issues.
D. Dynamism in the industrial estate management
Finally, BSCIC should give utmost importance to recover unutilized plots and ensure their proper
utilization. In many of the estates, gas and electricity connections are not dedicated and therefore,
the estates do not generate adequate leverage to entrepreneurs. A big investment may be needed
to ensure uninterrupted electricity and gas supply in BSCIC estates. Otherwise, the benefits of
industrial estates would not be adequately tapped. If necessary, BSCIC may consider
organizational restructuring to bring dynamism in the industrial estate management.
Furthermore, we recommend that BSCIC may think of carrying out a rigorous cost-benefit
analysis of BSCIC industrial estates in order to grasp future sustainability of the estates.

99
Bibliography
Alexander, P.C. 1963. Industrial Estates in India, Asia Publishing House, 1963, pp.56-61.
BBS. 2013. Survey of Manufacturing Industries, 2012, Bangladesh Bureau of Statistics, Dhaka.
BBS. 2006. Census of Manufacturing Industries, 2016, Bangladesh Bureau of Statistics, Dhaka.
BBS. 2016. Statistical Yearbook, various issues, Bangladesh Bureau of Statistics, Dhaka.
Bangladesh Bank. 2016. Export Statistics, various issues, Bangladesh Bank, Dhaka.
Bredo, William, 1960. Industrial Estates: Tools for industrialization, International Development Centre,
Stanford Research Institute, California, 1960, pp.38-40.
BSCIC. 2016. Budget documents, Accounts and Finance Department, Bangladesh Small and Cottage
Industries Corporation, 2011 and 2016.
BSCIC. 2018. MIS Report, various monthly issues 2010-2018, Bangladesh Small and Cottage Industries
Corporation, June 2018.
2018. MIS Report, Bangladesh Small and Cottage Industries Corporation, June 2018.
_____MIS Report, Bangladesh Small and Cottage Industries Corporation, May 2017.
_____ MIS Report, Bangladesh Small and Cottage Industries Corporation, May 2015.
_____ MIS Report, Bangladesh Small and Cottage Industries Corporation, May 2010.
BSCIC. 2017. MIS Report July 2016-June 2017, Bangladesh Small and Cottage Industries Corporation,
2017.
________MIS Report July 2012-June 2013, Bangladesh Small and Cottage Industries Corporation, 2013.
BSCIC. 2015. Annual Report, Bangladesh Small and Cottage Industries Corporation, 2015.
BSCIC Act. 1957. The Bangladesh Small and Cottage Industries Corporation Act, 1957, East Pakistan Act
No. XVII, 1957.
Hoque, S. & Biswas, S. K. 2013. Problems of Sick Industries-Bangladesh Perspective, Journal of
Nechanical Engineering, Vol, ME 43, No. 2, December 2013.
Kongcheep, S. 2017. Thailand Industrial Estate, Market; http://www.colliers.com/-
/media/files/apac/thailand/market-reports/thailand-industrial-estate-1h2017-en.pdf
Meera Bai, M. 1987. An Economic Evaluation of industrial estates in Kerala, Masters Thesis, Department
of Applied Economics, Cochin University of Science and Technology, 1987.

100
Mondal, A. H., Bhuyan, H. R, and Murshid, K.A.S. 2017. “Land Market Survey for Determining the Current
Market Price of Additional Lands in the Area Affected by Padma Multipurpose Bridge Project”,
mimeo, Bangladesh Institute of Development Studies, May 2017.
MoI. 2016. National Industrial Policy 2016, Ministry of Industry, People Republic of Bangladesh, 2016.
MoI. 2010. Bangladesh Gazette, Ministry of Industry, no. 36.065.012.00.00.022.2010-205, June 13, 2010.
Roy, S. & Basu, R. 2015. Industrial Sickness and Its Impact on the Economy: A Case Study of Haora
District, West Bengal, Economic Affairs, Paper No. 190., February 2015.
Yunus, M. and Mondal, A. H. 2016. Economic and Social Impacts of Export Processing Zones on the
Economy of Bangladesh, mimeo, Bangladesh Institute of Development Studies, May 2017.

101
Appendix:
Box 2: BSCIC Plot Cancellation Policy
The District Plot Allotment Committee is the authority to cancel the plot allotment if the plot owner failed to
fulfill the following activity/activities within the mentioned time:
Activity 1: Made two installments of land premium within 60 days (including extension period) after the
plot allotment letter issued by BSCIC;
Activity 2: Take over the charge of the allotted industrial plot from BSCIC within 60 days (including the
extension period) from the initial two installments of land premium made;
Activity 3: Layout plan submission to the BSCIC Industrial Estate Officer within 60 days from the date of
take over the charge of the allotted plot;
Activity 4: Approval of the layout plan by BSCIC authority as the committee’s recommendation: there are
two committees, one for industrial units building within 6 stored, consisting 3 members headed by the
Regional Director, BSCIC, and the second committee for industrial units 7-10 stored consisting 5
members headed by the Chief Engineer;
Activity 5: Layout plan has to be approved within 15 days as of the submission date;
Activity 6: Start construction of industrial units within 30 days from layout approval and complete the
construction work within 18 months;
Activity 7: Installation of the machineries within 3 months as construction work completed;
Activity 8: Start (on test) production within 1 month as from the installation of machineries;
Activity 9: Start commercial production within 2 months from the on test production date.
Plot allotment will be canceled automatically without any prior notice if the plot owner missed any time
deadlines listed activity 1 to 3. If the plot owner cannot maintain the time deadline listed activity/conditions
4-9 then to take any action committee must discuss with BSCIC Chairmen before taking any intervention.
Source: Bangladesh Gazette, Ministry of Industry, no. 36.065.012.00.00.022.2010-205, June 13, 2010.

102
Table A1: List of 74 industrial estates of BSCIC
Industrial estate
Number of
industrial plots
Number of
allotted plots
Number of industrial
units established
in the allotted
plots
Number of industrial
units are in production
Number of industrial units are
either under construction
or not started yet
Number of
industrial units are shutdown
Number of un-
allotted industrial
plots
Average number of plots
per industrial
unit
Allotment rate or
Occupancy rate (%)
Utilization rate of allotted
plots (%)
Utilization rate of
available plots (%)
Sick unit (% of total units)
1 3 4 5 6 7 8 9 10=(4/5) 11=
100*(4/3) 12=
100*(6/5) 13=
100*(6/5) 14=
10/(7+10)
Tongi 214 214 165 153 5 7 0 1.3 100.0 92.7 92.7 4.2
Mymensingh 55 55 40 34 0 6 0 1.4 100.0 85.0 85.0 15.0
Rajbari 77 77 52 42 1 9 0 1.5 100.0 80.8 80.8 17.3
Joydevpur 273 273 163 143 8 12 0 1.7 100.0 87.7 87.7 7.4
Madaripur 126 126 93 79 9 5 0 1.4 100.0 84.9 84.9 5.4
Jamalpur 197 196 75 58 0 17 1 2.6 99.5 77.3 76.3 22.7
Mymensingh (ext.) 50 50 51 47 0 4 0
1.0 100.0 92.2 92.2 7.8
Electronics 0 0 21 20 0 1 0 0.0 -- 95.2 95.2 4.8
Jamdani 409 407 407 310 41 56 2 1.0 99.5 76.2 75.8 13.8
Faridpur 106 106 42 38 4 0 0 2.5 100.0 90.5 90.5 0.0
Gopalganj 70 70 60 43 2 15 0 1.2 100.0 71.7 71.7 25.0
Tangail 132 132 65 52 9 4 0 2.0 100.0 80.0 80.0 6.2
Narsingdi 95 95 51 43 0 8 0 1.9 100.0 84.3 84.3 15.7
Manikganj 69 69 25 20 0 5 0 2.8 100.0 80.0 80.0 20.0
Hoseiry 729 728 728 711 17 0 1 1.0 99.9 97.7 97.5 0.0
Narayanganj 136 136 136 125 6 5 0 1.0 100.0 91.9 91.9 3.7
Kishoreganj 150 145 70 23 40 7 5 2.1 96.7 32.9 30.7 10.0
Munshiganj 82 82 65 60 5 0 0 1.3 100.0 92.3 92.3 0.0
Sherpur 108 107 41 34 7 0 1 2.6 99.1 82.9 81.0 0.0
Shariatpur 96 96 59 18 40 1 0 1.6 100.0 30.5 30.5 1.7
Netrokona 103 103 68 10 58 0 0 1.5 100.0 14.7 14.7 0.0
Dhaka 166 165 125 74 44 7 1 1.3 99.4 59.2 58.7 5.6
Tannary 205 205 154 0 154 0 0 1.3 100.0 0.0 0.0 0.0
Dhamrai 103 103 70 57 13 0 0 1.5 100.0 81.4 81.4 0.0
Kalurghat 71 71 32 29 0 3 0 2.2 100.0 90.6 90.6 9.4
Foijdarhat 157 157 65 62 0 3 0 2.4 100.0 95.4 95.4 4.6
Sholosahor 66 66 51 42 4 5 0 1.3 100.0 82.4 82.4 9.8
Cox's Bazar 89 85 38 18 7 13 4 2.2 95.5 47.4 42.9 34.2
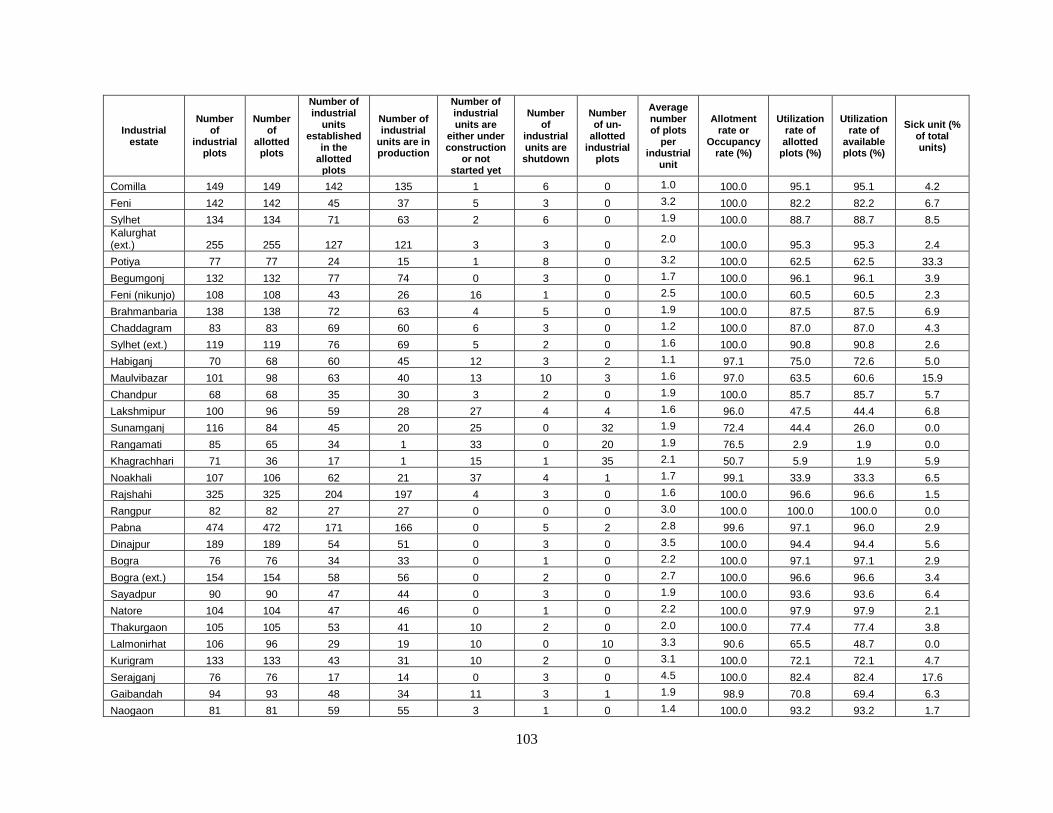
103
Industrial estate
Number of
industrial plots
Number of
allotted plots
Number of industrial
units established
in the allotted
plots
Number of industrial
units are in production
Number of industrial units are
either under construction
or not started yet
Number of
industrial units are shutdown
Number of un-
allotted industrial
plots
Average number of plots
per industrial
unit
Allotment rate or
Occupancy rate (%)
Utilization rate of allotted
plots (%)
Utilization rate of
available plots (%)
Sick unit (% of total units)
Comilla 149 149 142 135 1 6 0 1.0 100.0 95.1 95.1 4.2
Feni 142 142 45 37 5 3 0 3.2 100.0 82.2 82.2 6.7
Sylhet 134 134 71 63 2 6 0 1.9 100.0 88.7 88.7 8.5
Kalurghat (ext.) 255 255 127 121 3 3 0
2.0 100.0 95.3 95.3 2.4
Potiya 77 77 24 15 1 8 0 3.2 100.0 62.5 62.5 33.3
Begumgonj 132 132 77 74 0 3 0 1.7 100.0 96.1 96.1 3.9
Feni (nikunjo) 108 108 43 26 16 1 0 2.5 100.0 60.5 60.5 2.3
Brahmanbaria 138 138 72 63 4 5 0 1.9 100.0 87.5 87.5 6.9
Chaddagram 83 83 69 60 6 3 0 1.2 100.0 87.0 87.0 4.3
Sylhet (ext.) 119 119 76 69 5 2 0 1.6 100.0 90.8 90.8 2.6
Habiganj 70 68 60 45 12 3 2 1.1 97.1 75.0 72.6 5.0
Maulvibazar 101 98 63 40 13 10 3 1.6 97.0 63.5 60.6 15.9
Chandpur 68 68 35 30 3 2 0 1.9 100.0 85.7 85.7 5.7
Lakshmipur 100 96 59 28 27 4 4 1.6 96.0 47.5 44.4 6.8
Sunamganj 116 84 45 20 25 0 32 1.9 72.4 44.4 26.0 0.0
Rangamati 85 65 34 1 33 0 20 1.9 76.5 2.9 1.9 0.0
Khagrachhari 71 36 17 1 15 1 35 2.1 50.7 5.9 1.9 5.9
Noakhali 107 106 62 21 37 4 1 1.7 99.1 33.9 33.3 6.5
Rajshahi 325 325 204 197 4 3 0 1.6 100.0 96.6 96.6 1.5
Rangpur 82 82 27 27 0 0 0 3.0 100.0 100.0 100.0 0.0
Pabna 474 472 171 166 0 5 2 2.8 99.6 97.1 96.0 2.9
Dinajpur 189 189 54 51 0 3 0 3.5 100.0 94.4 94.4 5.6
Bogra 76 76 34 33 0 1 0 2.2 100.0 97.1 97.1 2.9
Bogra (ext.) 154 154 58 56 0 2 0 2.7 100.0 96.6 96.6 3.4
Sayadpur 90 90 47 44 0 3 0 1.9 100.0 93.6 93.6 6.4
Natore 104 104 47 46 0 1 0 2.2 100.0 97.9 97.9 2.1
Thakurgaon 105 105 53 41 10 2 0 2.0 100.0 77.4 77.4 3.8
Lalmonirhat 106 96 29 19 10 0 10 3.3 90.6 65.5 48.7 0.0
Kurigram 133 133 43 31 10 2 0 3.1 100.0 72.1 72.1 4.7
Serajganj 76 76 17 14 0 3 0 4.5 100.0 82.4 82.4 17.6
Gaibandah 94 93 48 34 11 3 1 1.9 98.9 70.8 69.4 6.3
Naogaon 81 81 59 55 3 1 0 1.4 100.0 93.2 93.2 1.7
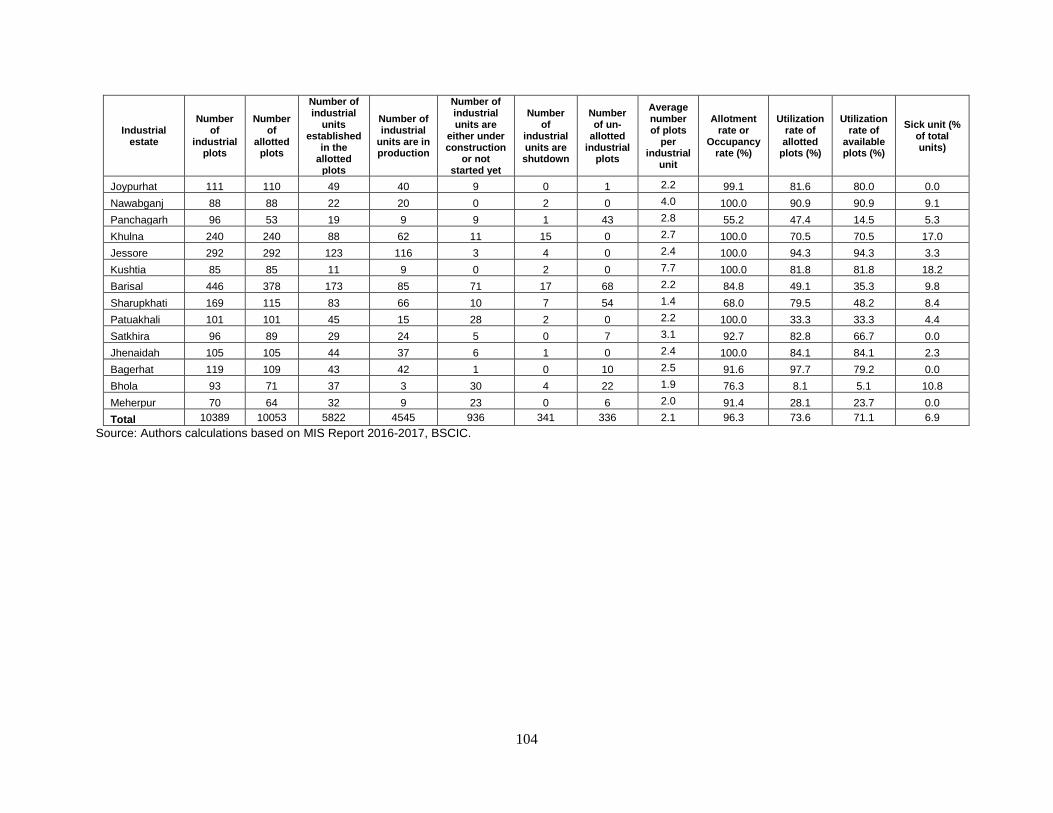
104
Industrial estate
Number of
industrial plots
Number of
allotted plots
Number of industrial
units established
in the allotted
plots
Number of industrial
units are in production
Number of industrial units are
either under construction
or not started yet
Number of
industrial units are shutdown
Number of un-
allotted industrial
plots
Average number of plots
per industrial
unit
Allotment rate or
Occupancy rate (%)
Utilization rate of allotted
plots (%)
Utilization rate of
available plots (%)
Sick unit (% of total units)
Joypurhat 111 110 49 40 9 0 1 2.2 99.1 81.6 80.0 0.0
Nawabganj 88 88 22 20 0 2 0 4.0 100.0 90.9 90.9 9.1
Panchagarh 96 53 19 9 9 1 43 2.8 55.2 47.4 14.5 5.3
Khulna 240 240 88 62 11 15 0 2.7 100.0 70.5 70.5 17.0
Jessore 292 292 123 116 3 4 0 2.4 100.0 94.3 94.3 3.3
Kushtia 85 85 11 9 0 2 0 7.7 100.0 81.8 81.8 18.2
Barisal 446 378 173 85 71 17 68 2.2 84.8 49.1 35.3 9.8
Sharupkhati 169 115 83 66 10 7 54 1.4 68.0 79.5 48.2 8.4
Patuakhali 101 101 45 15 28 2 0 2.2 100.0 33.3 33.3 4.4
Satkhira 96 89 29 24 5 0 7 3.1 92.7 82.8 66.7 0.0
Jhenaidah 105 105 44 37 6 1 0 2.4 100.0 84.1 84.1 2.3
Bagerhat 119 109 43 42 1 0 10 2.5 91.6 97.7 79.2 0.0
Bhola 93 71 37 3 30 4 22 1.9 76.3 8.1 5.1 10.8
Meherpur 70 64 32 9 23 0 6 2.0 91.4 28.1 23.7 0.0
Total 10389 10053 5822 4545 936 341 336 2.1 96.3 73.6 71.1 6.9
Source: Authors calculations based on MIS Report 2016-2017, BSCIC.
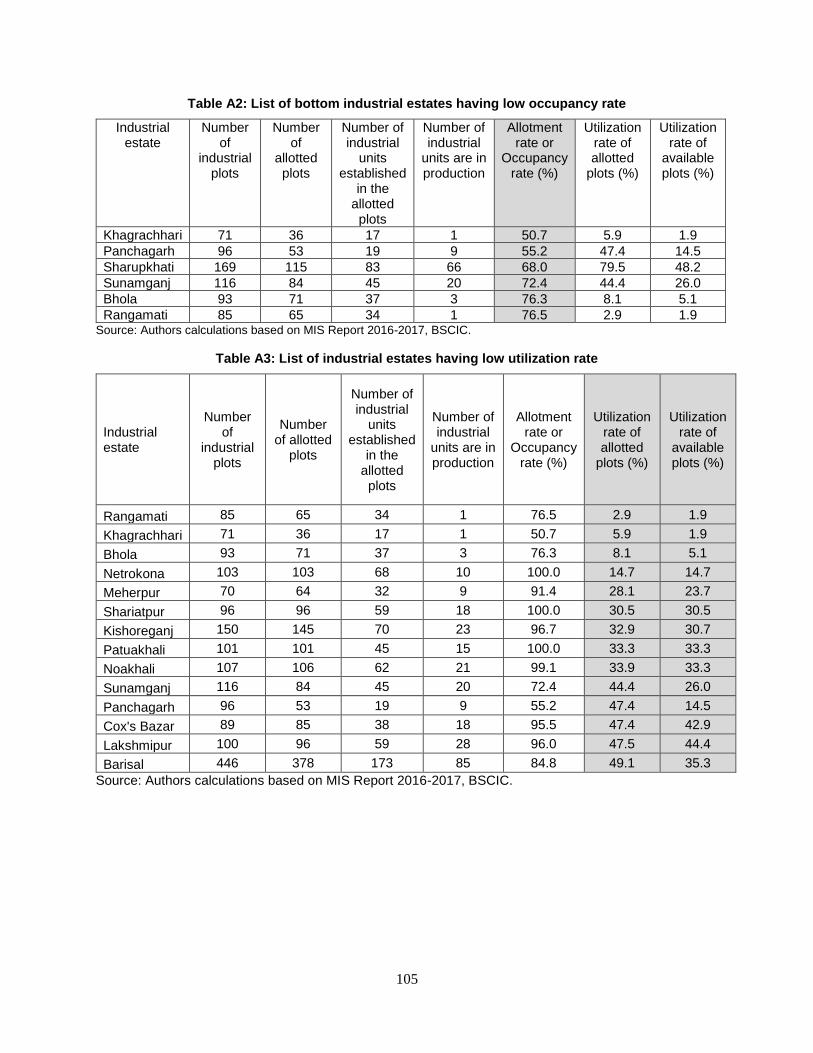
105
Table A2: List of bottom industrial estates having low occupancy rate
Industrial estate
Number of
industrial plots
Number of
allotted plots
Number of industrial
units established
in the allotted plots
Number of industrial
units are in production
Allotment rate or
Occupancy rate (%)
Utilization rate of allotted
plots (%)
Utilization rate of
available plots (%)
Khagrachhari 71 36 17 1 50.7 5.9 1.9
Panchagarh 96 53 19 9 55.2 47.4 14.5
Sharupkhati 169 115 83 66 68.0 79.5 48.2
Sunamganj 116 84 45 20 72.4 44.4 26.0
Bhola 93 71 37 3 76.3 8.1 5.1
Rangamati 85 65 34 1 76.5 2.9 1.9 Source: Authors calculations based on MIS Report 2016-2017, BSCIC.
Table A3: List of industrial estates having low utilization rate
Industrial estate
Number of
industrial plots
Number of allotted
plots
Number of industrial
units established
in the allotted plots
Number of industrial
units are in production
Allotment rate or
Occupancy rate (%)
Utilization rate of allotted
plots (%)
Utilization rate of
available plots (%)
Rangamati 85 65 34 1 76.5 2.9 1.9
Khagrachhari 71 36 17 1 50.7 5.9 1.9
Bhola 93 71 37 3 76.3 8.1 5.1
Netrokona 103 103 68 10 100.0 14.7 14.7
Meherpur 70 64 32 9 91.4 28.1 23.7
Shariatpur 96 96 59 18 100.0 30.5 30.5
Kishoreganj 150 145 70 23 96.7 32.9 30.7
Patuakhali 101 101 45 15 100.0 33.3 33.3
Noakhali 107 106 62 21 99.1 33.9 33.3
Sunamganj 116 84 45 20 72.4 44.4 26.0
Panchagarh 96 53 19 9 55.2 47.4 14.5
Cox's Bazar 89 85 38 18 95.5 47.4 42.9
Lakshmipur 100 96 59 28 96.0 47.5 44.4
Barisal 446 378 173 85 84.8 49.1 35.3
Source: Authors calculations based on MIS Report 2016-2017, BSCIC.
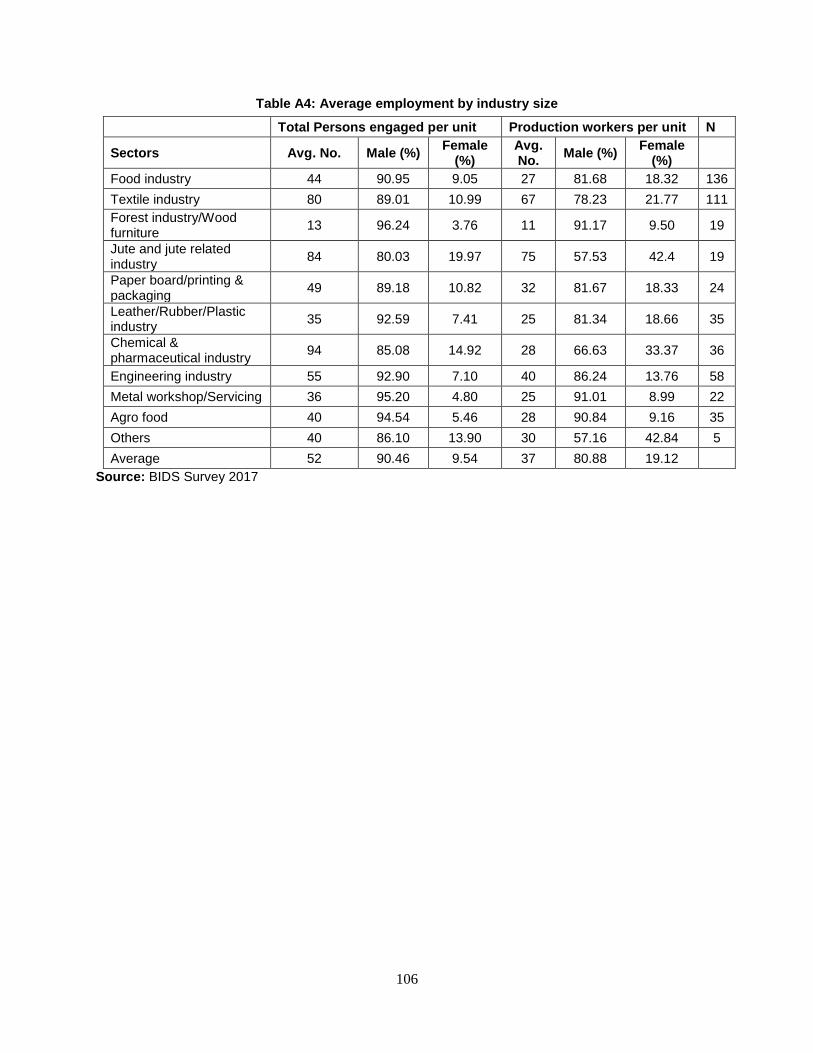
106
Table A4: Average employment by industry size
Total Persons engaged per unit Production workers per unit N
Sectors Avg. No. Male (%) Female
(%) Avg. No.
Male (%) Female
(%)
Food industry 44 90.95 9.05 27 81.68 18.32 136
Textile industry 80 89.01 10.99 67 78.23 21.77 111
Forest industry/Wood furniture
13 96.24 3.76 11 91.17 9.50 19
Jute and jute related industry
84 80.03 19.97 75 57.53 42.4 19
Paper board/printing & packaging
49 89.18 10.82 32 81.67 18.33 24
Leather/Rubber/Plastic industry
35 92.59 7.41 25 81.34 18.66 35
Chemical & pharmaceutical industry
94 85.08 14.92 28 66.63 33.37 36
Engineering industry 55 92.90 7.10 40 86.24 13.76 58
Metal workshop/Servicing 36 95.20 4.80 25 91.01 8.99 22
Agro food 40 94.54 5.46 28 90.84 9.16 35
Others 40 86.10 13.90 30 57.16 42.84 5
Average 52 90.46 9.54 37 80.88 19.12
Source: BIDS Survey 2017

107
Table A5: Average output, employment and output-labor ratio by industrial estate
Division Industrial estate Number of
units in production
Export oriented industrial
units
Output (in million
Tk.)
Per unit output (in
million Tk.)
% of output sold in export market
Employment % of
female employees
Average number of employee per unit
Output-labor ratio22
(million Tk. per labour)
Dhaka Tongi 154 68 62510 405.9 52.0 60700 43.5 394 1.03
Dhaka Joydevpur 143 38 42550 297.6 27.6 29065 61.4 203 1.46
Dhaka Hoseiry 711 661 176104 247.7 92.6 229000 50.7 322 0.77
Dhaka Narayanganj 125 19 12580 100.6 53.5 18000 41.1 144 0.70
Dhaka Jamdani 310 50 39 0.1 45.5 2080 29.3 7 0.02
Dhaka Narsingdi 43 8 6259 145.6 61.6 4750 57.9 110 1.32
Dhaka Munshiganj 60 1 2462 41.0 2.4 7500 60.0 125 0.33
Dhaka Manikganj 20 0 1220 61.0 0.0 1800 27.8 90 0.68
Dhaka Electronics 18 0 501 27.8 5.6 1350 54.1 75 0.37
Dhaka Mymensingh 81 0 953 11.8 0.0 5550 45.0 69 0.17
Dhaka Kishoreganj 23 1 383 16.7 29.0 1290 41.9 56 0.30
Dhaka Tangail 59 0 2352 39.9 0.0 3698 31.7 63 0.64
Dhaka Jamalpur 58 2 12434 214.4 3.6 4550 47.5 78 2.73
Dhaka Sherpur 37 2 2500 67.6 20.0 2370 40.1 64 1.05
Dhaka Faridpur 38 0 2007 52.8 0.0 1290 30.2 34 1.56
Dhaka Madaripur 83 0 801 9.6 0.0 1799 18.7 22 0.45
Dhaka Gopalganj 45 0 245 5.4 0.0 1128 6.6 25 0.22
Dhaka Shariatpur 15 0 127 8.5 0.0 300 32.3 20 0.42
Dhaka Rajbari 36 0 687 19.1 0.0 1321 26.9 37 0.52
Dhaka Dhaka 74 1 805 10.9 5.8 3904 8.6 53 0.21
Dhaka Dhamrai 52 0 2775 53.4 24.1 1884 39.3 36 1.47
Dhaka Netrokona 10 0 60 6.0 0.0 255 29.4 26 0.24
Chittagong Kalurghat 29 8 2210 76.2 83.9 6780 73.7 234 0.33
22 Measured by dividing the total amount of output by the amount of labour
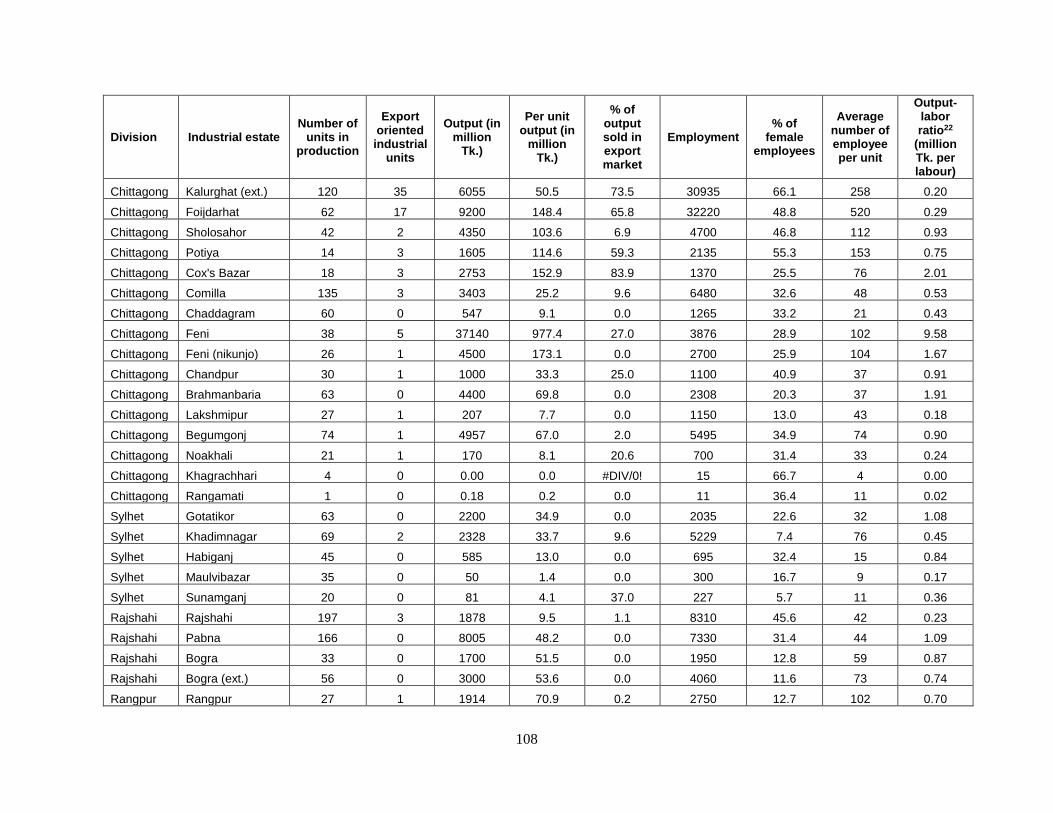
108
Division Industrial estate Number of
units in production
Export oriented industrial
units
Output (in million
Tk.)
Per unit output (in
million Tk.)
% of output sold in export market
Employment % of
female employees
Average number of employee per unit
Output-labor ratio22
(million Tk. per labour)
Chittagong Kalurghat (ext.) 120 35 6055 50.5 73.5 30935 66.1 258 0.20
Chittagong Foijdarhat 62 17 9200 148.4 65.8 32220 48.8 520 0.29
Chittagong Sholosahor 42 2 4350 103.6 6.9 4700 46.8 112 0.93
Chittagong Potiya 14 3 1605 114.6 59.3 2135 55.3 153 0.75
Chittagong Cox's Bazar 18 3 2753 152.9 83.9 1370 25.5 76 2.01
Chittagong Comilla 135 3 3403 25.2 9.6 6480 32.6 48 0.53
Chittagong Chaddagram 60 0 547 9.1 0.0 1265 33.2 21 0.43
Chittagong Feni 38 5 37140 977.4 27.0 3876 28.9 102 9.58
Chittagong Feni (nikunjo) 26 1 4500 173.1 0.0 2700 25.9 104 1.67
Chittagong Chandpur 30 1 1000 33.3 25.0 1100 40.9 37 0.91
Chittagong Brahmanbaria 63 0 4400 69.8 0.0 2308 20.3 37 1.91
Chittagong Lakshmipur 27 1 207 7.7 0.0 1150 13.0 43 0.18
Chittagong Begumgonj 74 1 4957 67.0 2.0 5495 34.9 74 0.90
Chittagong Noakhali 21 1 170 8.1 20.6 700 31.4 33 0.24
Chittagong Khagrachhari 4 0 0.00 0.0 #DIV/0! 15 66.7 4 0.00
Chittagong Rangamati 1 0 0.18 0.2 0.0 11 36.4 11 0.02
Sylhet Gotatikor 63 0 2200 34.9 0.0 2035 22.6 32 1.08
Sylhet Khadimnagar 69 2 2328 33.7 9.6 5229 7.4 76 0.45
Sylhet Habiganj 45 0 585 13.0 0.0 695 32.4 15 0.84
Sylhet Maulvibazar 35 0 50 1.4 0.0 300 16.7 9 0.17
Sylhet Sunamganj 20 0 81 4.1 37.0 227 5.7 11 0.36
Rajshahi Rajshahi 197 3 1878 9.5 1.1 8310 45.6 42 0.23
Rajshahi Pabna 166 0 8005 48.2 0.0 7330 31.4 44 1.09
Rajshahi Bogra 33 0 1700 51.5 0.0 1950 12.8 59 0.87
Rajshahi Bogra (ext.) 56 0 3000 53.6 0.0 4060 11.6 73 0.74
Rangpur Rangpur 27 1 1914 70.9 0.2 2750 12.7 102 0.70

109
Division Industrial estate Number of
units in production
Export oriented industrial
units
Output (in million
Tk.)
Per unit output (in
million Tk.)
% of output sold in export market
Employment % of
female employees
Average number of employee per unit
Output-labor ratio22
(million Tk. per labour)
Rangpur Dinajpur 51 0 3171 62.2 0.0 878 9.1 17 3.61
Rajshahi Nawabganj 21 0 210 10.0 0.0 590 33.9 28 0.36
Rajshahi Serajganj 14 0 1700 121.4 0.0 1600 46.9 114 1.06
Rangpur Gaibandah 34 0 163 4.8 0.0 960 41.7 28 0.17
Rajshahi Natore 46 0 461 10.0 0.0 1700 35.3 37 0.27
Rajshahi Naogaon 55 0 1396 25.4 0.0 1660 18.1 30 0.84
Rajshahi Joypurhat 40 2 150 3.7 21.4 1845 24.4 46 0.08
Rangpur Kurigram 31 2 410 13.2 4.9 645.09 0.6 21 0.64
Rangpur Lalmonirhat 24 0 128 5.3 0.0 865 24.3 36 0.15
Rangpur Sayadpur (Nilphamari) 44 0 1140 25.9 0.0 1850 19.5 42 0.62
Rangpur Thakurgaon 41 0 247 6.0 0.0 1425 29.8 35 0.17
Rangpur Panchagarh 9 0 748 83.1 0.0 171 0.0 19 4.37
Khulna Khulna 62 2 3604 58.1 13.7 1219.7 72.9 20 2.96
Khulna Jessore 116 2 5620 48.5 38.9 5977 42.4 52 0.94
Khulna Kushtia 9 3 27994 3110.5 14.3 7035 5.0 782 3.98
Barisal Barisal 85 3 4129 48.6 27.6 4920 39.5 58 0.84
Barisal Sharupkhati 66 0 400 6.1 0.0 1208 16.5 18 0.33
Barisal Patuakhali 15 0 255 17.0 0.0 345 21.7 23 0.74
Khulna Bagerhat 43 1 404 9.4 16.4 3460 54.5 80 0.12
Khulna Satkhira 24 2 345 14.4 56.4 1176 12.0 49 0.29
Khulna Jhenaidah 37 1 643 17.4 65.4 1400 22.9 38 0.46
Barisal Bhola 2 0 20 10.0 0.0 70 17.1 35 0.29
Khulna Meherpur 10 0 78 7.8 0.0 216 18.5 22 0.36
Total 4549 956 488004 110 16.7 7790.6 32.1 83.5 0.9
Source: MIS Report 2016-2017, BSCIC, Authors Calculations.

110
Table A6: Land utilization by estate
Division Estate Total land area
(in acres)
Land used for office purposes
(in acres)
Land used for road and drainage
constructions (in acres)
% of land area occupied for estate office
% of land used for road & drainage
constructions constructions
Chittagong Kalurghat 12.0 0.8 2.4 6.7 20.0
Dhaka Narsingdi 15.4 0.6 2.7 4.2 17.7
Dhaka Munshiganj 12.4 0.5 2.9 4.1 23.4
Barisal Barisal 130.6 11.0 21.6 8.4 16.6
Chittagong Feni 25.0 1.4 4.5 5.6 18.0
Khulna Jhenaidah 15.7 1.2 2.7 7.6 17.1
Rangpur Thakurgaon 15.0 0.8 3.1 5.0 20.7
Chittagong Chaddagram 11.0 0.8 2.3 6.9 21.1
Barisal Patuakhali 15.4 1.0 2.3 6.6 15.1
Khulna Bagerhat 19.3 1.3 3.5 6.5 18.1
Khulna Meherpur 10.0 0.6 2.3 6.2 22.8
Dhaka Madaripur 16.3 1.0 3.1 6.2 19.2
Chittagong Khagrachhari 10.0 0.6 1.9 5.8 19.4
Dhaka Jamdani 20.0 1.1 4.5 5.7 22.3
Dhaka Mymensingh 20.4 1.1 4.3 5.4 20.9
Sylhet Sylhet 24.9 1.3 4.7 5.4 18.7
Rangpur Gaibandah 15.0 0.8 3.3 5.1 22.3
Chittagong Chandpur 10.0 0.5 1.9 5.1 19.0
Rangpur Lalmonirhat 15.6 0.8 2.7 5.0 17.3
Rangpur Kurigram 20.0 1.0 4.2 5.0 21.0
Rangpur Dinajpur 35.1 1.7 4.7 4.9 13.3
Rajshahi Joypurhat 15.0 0.7 3.3 4.6 21.7
Dhaka Jamalpur 26.3 1.2 4.6 4.5 17.6
Sylhet Maulvibazar 14.6 0.6 2.3 4.4 15.5
Chittagong Cox's Bazar 21.4 0.9 3.7 4.3 17.3

111
Division Estate Total land area
(in acres)
Land used for office purposes
(in acres)
Land used for road and drainage
constructions (in acres)
% of land area occupied for estate office
% of land used for road & drainage
constructions constructions
Dhaka Sherpur 15.0 0.7 2.9 4.3 19.1
Rajshahi Natore 15.6 0.7 3.0 4.3 19.3
Dhaka Faridpur 15.6 0.7 3.1 4.2 19.9
Chittagong Brahmanbaria 22.0 0.9 3.7 4.0 16.7
Dhaka Manikganj 10.4 0.4 1.7 3.9 16.0
Chittagong Potiya 10.5 0.4 2.3 3.9 21.8
Khulna Satkhira 15.8 0.6 3.1 3.9 19.7
Chittagong Begumgonj 25.0 0.9 4.3 3.7 17.3
Rajshahi Serajganj 11.8 0.4 1.8 3.7 15.6
Khulna Jessore 50.5 1.7 8.5 3.4 16.8
Dhaka Gopalganj 10.5 0.4 1.8 3.3 16.9
Chittagong Lakshmipur 16.1 0.5 3.2 3.2 19.9
Rajshahi Naogaon 15.1 0.5 3.1 3.2 20.3
Rangpur Panchagarh 15.0 0.5 2.3 3.1 15.4
Barisal Sharupkhati 24.7 0.8 4.5 3.1 18.2
Rangpur Rangpur 20.7 0.6 4.5 3.0 21.7
Dhaka Kishoreganj 20.6 0.6 4.3 2.9 20.9
Dhaka Tangail 23.5 0.7 3.8 2.9 16.3
Dhaka Netrokona 15.0 0.4 3.0 2.7 20.0
Chittagong Rangamati 12.5 0.3 2.5 2.6 20.0
Rajshahi Nawabganj 11.1 0.3 2.5 2.6 22.5
Sylhet Sunamganj 16.2 0.4 3.5 2.5 21.7
Chittagong Sholosahor 14.0 0.4 3.0 2.5 21.3
Dhaka Shariatpur 13.7 0.3 2.2 2.3 16.0
Chittagong Noakhali 15.0 0.4 3.2 2.3 21.0
Rajshahi Rajshahi 96.6 2.2 19.8 2.3 20.5
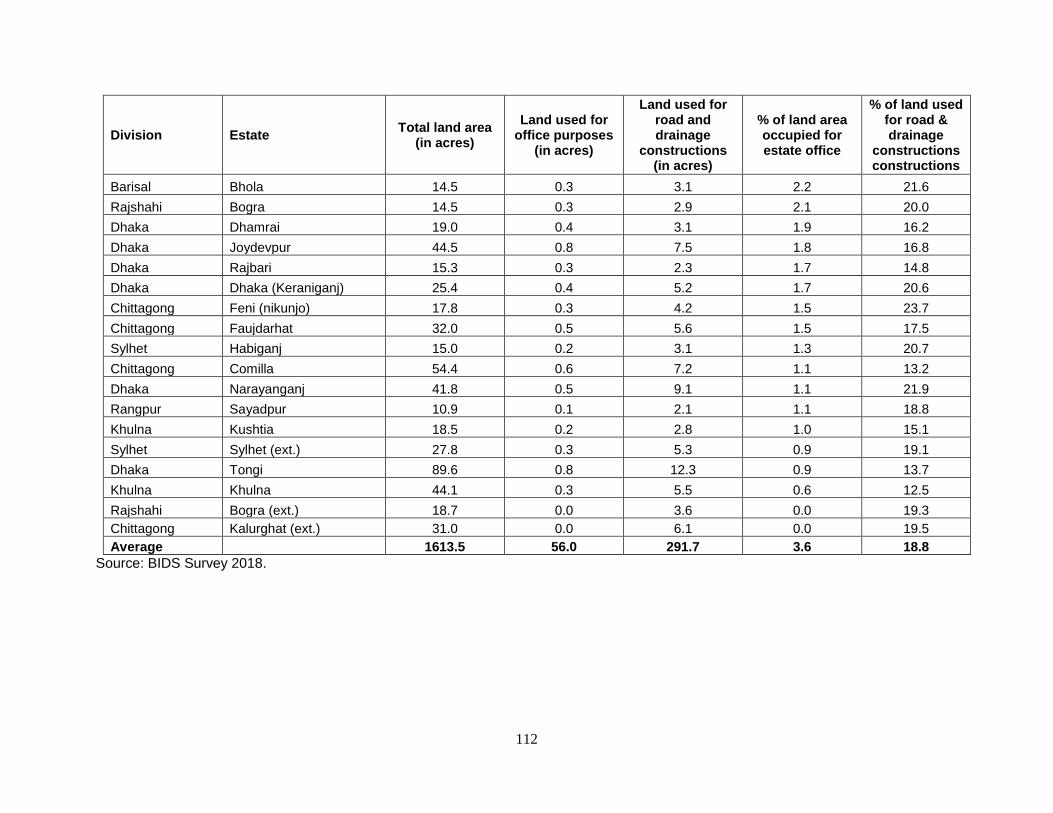
112
Division Estate Total land area
(in acres)
Land used for office purposes
(in acres)
Land used for road and drainage
constructions (in acres)
% of land area occupied for estate office
% of land used for road & drainage
constructions constructions
Barisal Bhola 14.5 0.3 3.1 2.2 21.6
Rajshahi Bogra 14.5 0.3 2.9 2.1 20.0
Dhaka Dhamrai 19.0 0.4 3.1 1.9 16.2
Dhaka Joydevpur 44.5 0.8 7.5 1.8 16.8
Dhaka Rajbari 15.3 0.3 2.3 1.7 14.8
Dhaka Dhaka (Keraniganj) 25.4 0.4 5.2 1.7 20.6
Chittagong Feni (nikunjo) 17.8 0.3 4.2 1.5 23.7
Chittagong Faujdarhat 32.0 0.5 5.6 1.5 17.5
Sylhet Habiganj 15.0 0.2 3.1 1.3 20.7
Chittagong Comilla 54.4 0.6 7.2 1.1 13.2
Dhaka Narayanganj 41.8 0.5 9.1 1.1 21.9
Rangpur Sayadpur 10.9 0.1 2.1 1.1 18.8
Khulna Kushtia 18.5 0.2 2.8 1.0 15.1
Sylhet Sylhet (ext.) 27.8 0.3 5.3 0.9 19.1
Dhaka Tongi 89.6 0.8 12.3 0.9 13.7
Khulna Khulna 44.1 0.3 5.5 0.6 12.5
Rajshahi Bogra (ext.) 18.7 0.0 3.6 0.0 19.3
Chittagong Kalurghat (ext.) 31.0 0.0 6.1 0.0 19.5
Average 1613.5 56.0 291.7 3.6 18.8
Source: BIDS Survey 2018.

113
Table A8: Asset turnover ratio by industrial estate
Division Estate Est. year No of
industrial plot
Land area
(acres)
Project cost
(Tk/lac)
Adjusted land price
(acre/in million
Tk.), May 2013
Adjusted land
price (in million
Tk.)
Other fixed cost
(bldg, furniture etc.)(in million
Tk.)
Total fixed
asset (in million
Tk.)
Output (in
million Tk.)
Fixed Asset
turnover ratio
Khulna Bagerhat 1995 119 19.3 268.0 7.0 135.9 20.4 156.3 404 2.6
Barisal Barisal 1960 446 130.6 131.7 2.9 379.3 20.4 399.7 4129 10.3
Chittagong Begumgonj 1990 132 25.0 271.5 10.7 266.7 20.4 287.1 4957 17.3
Barishal Bhola 1992 93 14.5 283.9 6.8 98.6 20.4 119.0 20 0.2
Rajshahi Bogra 1964 76 14.5 30.9 15.2 221.1 20.4 241.4 1700 7.0
Rajshahi Bogra (ext.) 1991 154 18.7 140.2 15.2 284.6 20.4 305.0 3000 9.8
Chittagong Brahmanbaria 1995 138 22.0 325.0 11.1 244.0 20.4 264.4 4400 16.6
Chittagong Chaddagram 1995 83 11.0 209.0 11.1 122.4 20.4 142.8 547 3.8
Chittagong Chandpur 1995 68 10.0 222.9 12.7 127.3 20.4 147.7 1000 6.8
Chittagong Comilla 1961 149 54.4 84.2 28.6 1552.0 20.4 1572.4 3403 2.2
Chittagong Cox's Bazar 1975 89 21.7 22.7 9.7 210.0 20.4 230.3 2753 12.0
Dhaka Dhaka-Karaniganj
2007 166 25.0 1256.5 30.0 750.0 20.4 770.4 805 1.0
Dhaka Dhamrai 2007 103 19.0 705.0 34.0 646.3 20.4 666.7 2775 4.2
Rangpur Dinajpur 1964 189 35.1 45.5 7.0 246.0 20.4 266.4 3171 11.9
Dhaka Electronics 1993 0 0.3 1513.0 0.0 0.0 20.4 20.4 501 24.6
Dhaka Faridpur 1990 106 15.6 212.0 16.8 261.4 20.4 281.8 2007 7.1
Chittagong Feni 1962 142 25.0 50.8 32.8 820.1 20.4 840.4 37140 44.2
Chittagong Feni(nikunjo) 1990 108 17.8 167.8 11.1 197.0 20.4 217.4 4500 20.7
Chittagong Foijdarhat 1970 157 36.1 62.4 75.9 2737.8 20.4 2758.2 9200 3.3
Rangpur Gaibandah 1998 94 15.0 135.0 7.6 114.3 20.4 134.6 163 1.2
Dhaka Gopalganj 1995 70 10.5 172.8 5.1 53.7 20.4 74.1 245 3.3
Sylhet Habiganj 1995 70 15.0 228.9 5.1 76.2 20.4 96.6 585 6.1
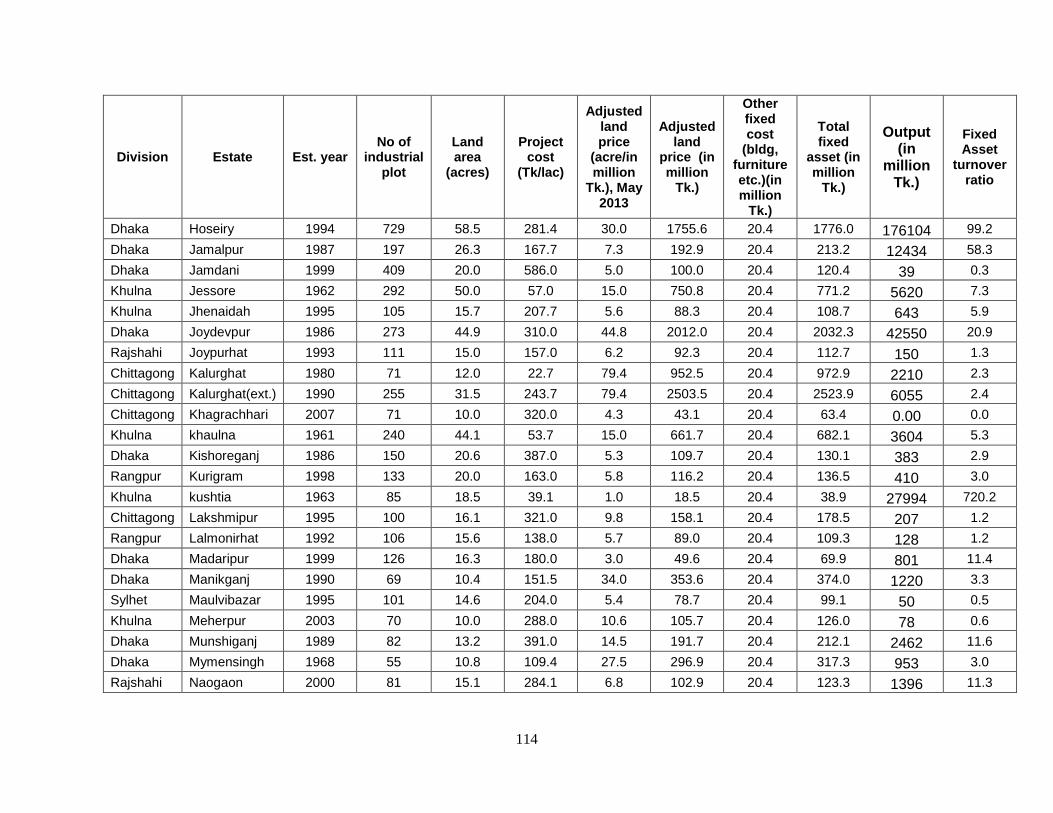
114
Division Estate Est. year No of
industrial plot
Land area
(acres)
Project cost
(Tk/lac)
Adjusted land price
(acre/in million
Tk.), May 2013
Adjusted land
price (in million
Tk.)
Other fixed cost
(bldg, furniture etc.)(in million
Tk.)
Total fixed
asset (in million
Tk.)
Output (in
million Tk.)
Fixed Asset
turnover ratio
Dhaka Hoseiry 1994 729 58.5 281.4 30.0 1755.6 20.4 1776.0 176104 99.2
Dhaka Jamalpur 1987 197 26.3 167.7 7.3 192.9 20.4 213.2 12434 58.3
Dhaka Jamdani 1999 409 20.0 586.0 5.0 100.0 20.4 120.4 39 0.3
Khulna Jessore 1962 292 50.0 57.0 15.0 750.8 20.4 771.2 5620 7.3
Khulna Jhenaidah 1995 105 15.7 207.7 5.6 88.3 20.4 108.7 643 5.9
Dhaka Joydevpur 1986 273 44.9 310.0 44.8 2012.0 20.4 2032.3 42550 20.9
Rajshahi Joypurhat 1993 111 15.0 157.0 6.2 92.3 20.4 112.7 150 1.3
Chittagong Kalurghat 1980 71 12.0 22.7 79.4 952.5 20.4 972.9 2210 2.3
Chittagong Kalurghat(ext.) 1990 255 31.5 243.7 79.4 2503.5 20.4 2523.9 6055 2.4
Chittagong Khagrachhari 2007 71 10.0 320.0 4.3 43.1 20.4 63.4 0.00 0.0
Khulna khaulna 1961 240 44.1 53.7 15.0 661.7 20.4 682.1 3604 5.3
Dhaka Kishoreganj 1986 150 20.6 387.0 5.3 109.7 20.4 130.1 383 2.9
Rangpur Kurigram 1998 133 20.0 163.0 5.8 116.2 20.4 136.5 410 3.0
Khulna kushtia 1963 85 18.5 39.1 1.0 18.5 20.4 38.9 27994 720.2
Chittagong Lakshmipur 1995 100 16.1 321.0 9.8 158.1 20.4 178.5 207 1.2
Rangpur Lalmonirhat 1992 106 15.6 138.0 5.7 89.0 20.4 109.3 128 1.2
Dhaka Madaripur 1999 126 16.3 180.0 3.0 49.6 20.4 69.9 801 11.4
Dhaka Manikganj 1990 69 10.4 151.5 34.0 353.6 20.4 374.0 1220 3.3
Sylhet Maulvibazar 1995 101 14.6 204.0 5.4 78.7 20.4 99.1 50 0.5
Khulna Meherpur 2003 70 10.0 288.0 10.6 105.7 20.4 126.0 78 0.6
Dhaka Munshiganj 1989 82 13.2 391.0 14.5 191.7 20.4 212.1 2462 11.6
Dhaka Mymensingh 1968 55 10.8 109.4 27.5 296.9 20.4 317.3 953 3.0
Rajshahi Naogaon 2000 81 15.1 284.1 6.8 102.9 20.4 123.3 1396 11.3
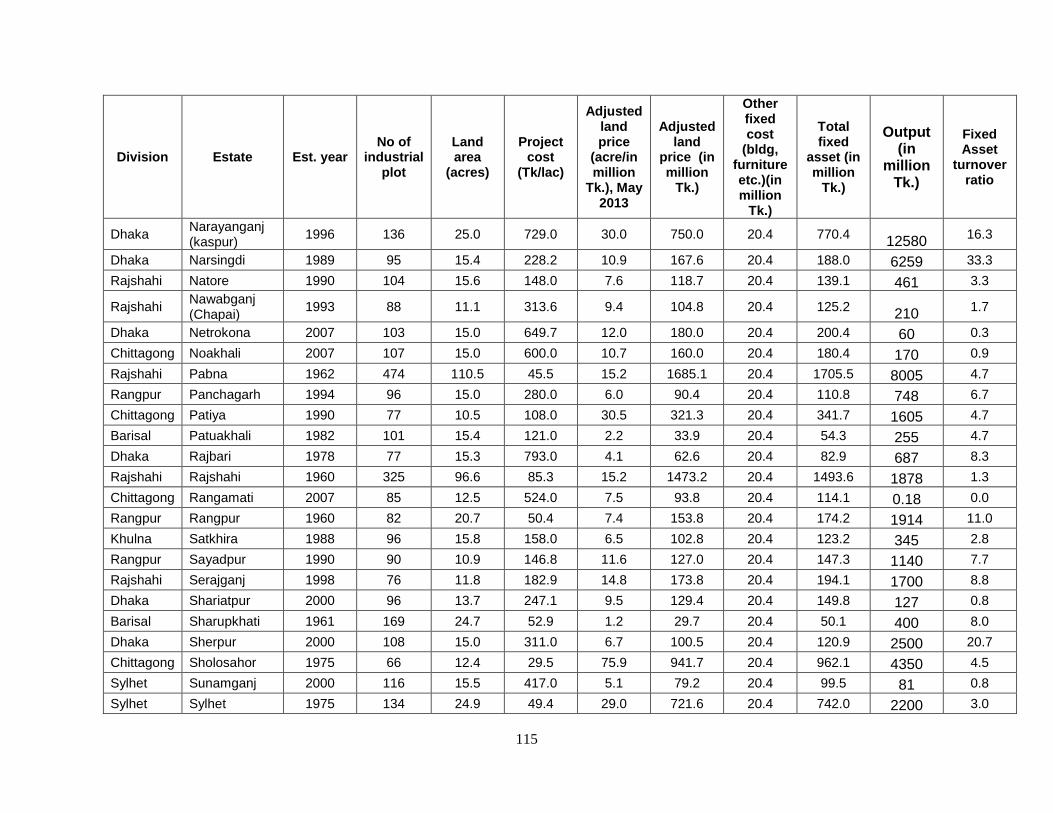
115
Division Estate Est. year No of
industrial plot
Land area
(acres)
Project cost
(Tk/lac)
Adjusted land price
(acre/in million
Tk.), May 2013
Adjusted land
price (in million
Tk.)
Other fixed cost
(bldg, furniture etc.)(in million
Tk.)
Total fixed
asset (in million
Tk.)
Output (in
million Tk.)
Fixed Asset
turnover ratio
Dhaka Narayanganj (kaspur)
1996 136 25.0 729.0 30.0 750.0 20.4 770.4 12580 16.3
Dhaka Narsingdi 1989 95 15.4 228.2 10.9 167.6 20.4 188.0 6259 33.3
Rajshahi Natore 1990 104 15.6 148.0 7.6 118.7 20.4 139.1 461 3.3
Rajshahi Nawabganj (Chapai)
1993 88 11.1 313.6 9.4 104.8 20.4 125.2 210 1.7
Dhaka Netrokona 2007 103 15.0 649.7 12.0 180.0 20.4 200.4 60 0.3
Chittagong Noakhali 2007 107 15.0 600.0 10.7 160.0 20.4 180.4 170 0.9
Rajshahi Pabna 1962 474 110.5 45.5 15.2 1685.1 20.4 1705.5 8005 4.7
Rangpur Panchagarh 1994 96 15.0 280.0 6.0 90.4 20.4 110.8 748 6.7
Chittagong Patiya 1990 77 10.5 108.0 30.5 321.3 20.4 341.7 1605 4.7
Barisal Patuakhali 1982 101 15.4 121.0 2.2 33.9 20.4 54.3 255 4.7
Dhaka Rajbari 1978 77 15.3 793.0 4.1 62.6 20.4 82.9 687 8.3
Rajshahi Rajshahi 1960 325 96.6 85.3 15.2 1473.2 20.4 1493.6 1878 1.3
Chittagong Rangamati 2007 85 12.5 524.0 7.5 93.8 20.4 114.1 0.18 0.0
Rangpur Rangpur 1960 82 20.7 50.4 7.4 153.8 20.4 174.2 1914 11.0
Khulna Satkhira 1988 96 15.8 158.0 6.5 102.8 20.4 123.2 345 2.8
Rangpur Sayadpur 1990 90 10.9 146.8 11.6 127.0 20.4 147.3 1140 7.7
Rajshahi Serajganj 1998 76 11.8 182.9 14.8 173.8 20.4 194.1 1700 8.8
Dhaka Shariatpur 2000 96 13.7 247.1 9.5 129.4 20.4 149.8 127 0.8
Barisal Sharupkhati 1961 169 24.7 52.9 1.2 29.7 20.4 50.1 400 8.0
Dhaka Sherpur 2000 108 15.0 311.0 6.7 100.5 20.4 120.9 2500 20.7
Chittagong Sholosahor 1975 66 12.4 29.5 75.9 941.7 20.4 962.1 4350 4.5
Sylhet Sunamganj 2000 116 15.5 417.0 5.1 79.2 20.4 99.5 81 0.8
Sylhet Sylhet 1975 134 24.9 49.4 29.0 721.6 20.4 742.0 2200 3.0
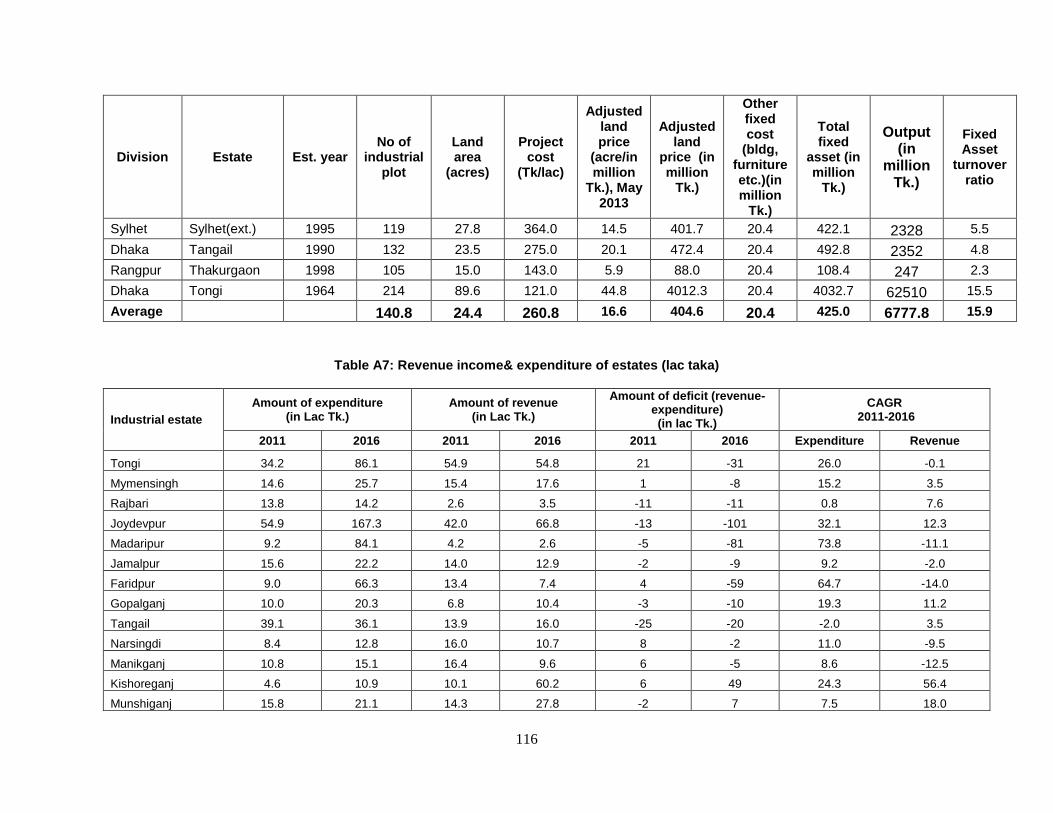
116
Division Estate Est. year No of
industrial plot
Land area
(acres)
Project cost
(Tk/lac)
Adjusted land price
(acre/in million
Tk.), May 2013
Adjusted land
price (in million
Tk.)
Other fixed cost
(bldg, furniture etc.)(in million
Tk.)
Total fixed
asset (in million
Tk.)
Output (in
million Tk.)
Fixed Asset
turnover ratio
Sylhet Sylhet(ext.) 1995 119 27.8 364.0 14.5 401.7 20.4 422.1 2328 5.5
Dhaka Tangail 1990 132 23.5 275.0 20.1 472.4 20.4 492.8 2352 4.8
Rangpur Thakurgaon 1998 105 15.0 143.0 5.9 88.0 20.4 108.4 247 2.3
Dhaka Tongi 1964 214 89.6 121.0 44.8 4012.3 20.4 4032.7 62510 15.5
Average 140.8 24.4 260.8 16.6 404.6 20.4 425.0 6777.8 15.9
Table A7: Revenue income& expenditure of estates (lac taka)
Industrial estate
Amount of expenditure (in Lac Tk.)
Amount of revenue (in Lac Tk.)
Amount of deficit (revenue-expenditure) (in lac Tk.)
CAGR 2011-2016
2011 2016 2011 2016 2011 2016 Expenditure Revenue
Tongi 34.2 86.1 54.9 54.8 21 -31 26.0 -0.1
Mymensingh 14.6 25.7 15.4 17.6 1 -8 15.2 3.5
Rajbari 13.8 14.2 2.6 3.5 -11 -11 0.8 7.6
Joydevpur 54.9 167.3 42.0 66.8 -13 -101 32.1 12.3
Madaripur 9.2 84.1 4.2 2.6 -5 -81 73.8 -11.1
Jamalpur 15.6 22.2 14.0 12.9 -2 -9 9.2 -2.0
Faridpur 9.0 66.3 13.4 7.4 4 -59 64.7 -14.0
Gopalganj 10.0 20.3 6.8 10.4 -3 -10 19.3 11.2
Tangail 39.1 36.1 13.9 16.0 -25 -20 -2.0 3.5
Narsingdi 8.4 12.8 16.0 10.7 8 -2 11.0 -9.5
Manikganj 10.8 15.1 16.4 9.6 6 -5 8.6 -12.5
Kishoreganj 4.6 10.9 10.1 60.2 6 49 24.3 56.4
Munshiganj 15.8 21.1 14.3 27.8 -2 7 7.5 18.0
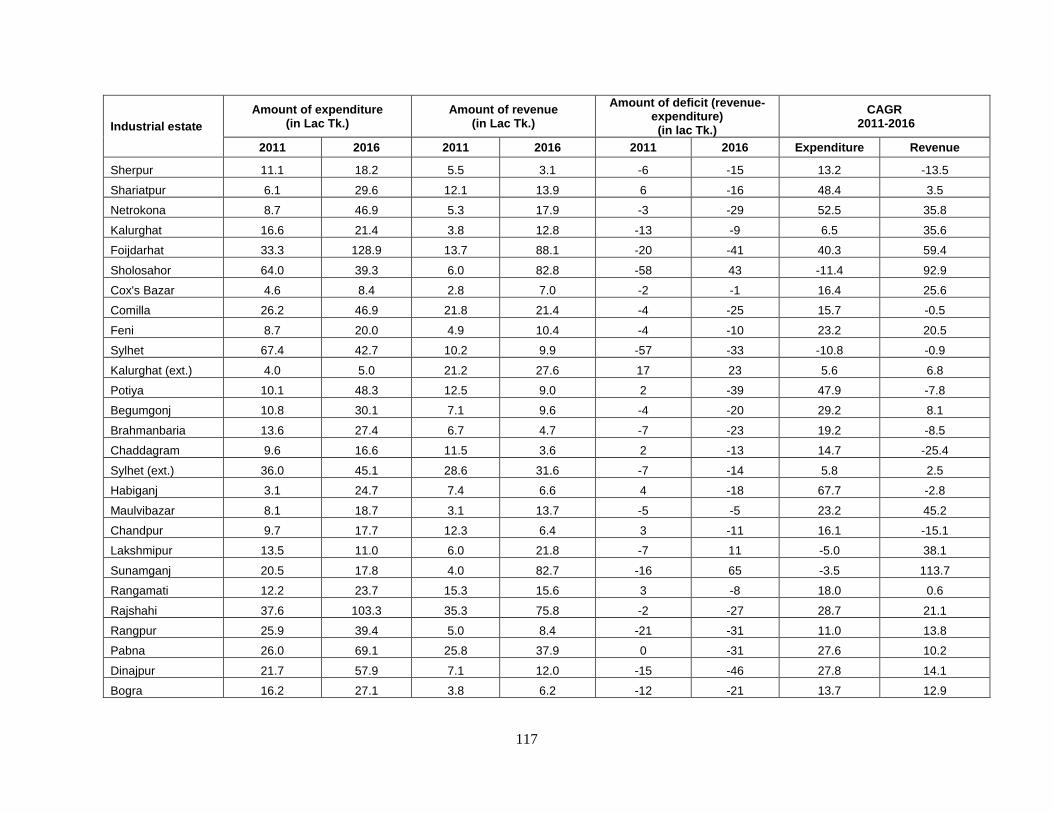
117
Industrial estate
Amount of expenditure (in Lac Tk.)
Amount of revenue (in Lac Tk.)
Amount of deficit (revenue-expenditure) (in lac Tk.)
CAGR 2011-2016
2011 2016 2011 2016 2011 2016 Expenditure Revenue
Sherpur 11.1 18.2 5.5 3.1 -6 -15 13.2 -13.5
Shariatpur 6.1 29.6 12.1 13.9 6 -16 48.4 3.5
Netrokona 8.7 46.9 5.3 17.9 -3 -29 52.5 35.8
Kalurghat 16.6 21.4 3.8 12.8 -13 -9 6.5 35.6
Foijdarhat 33.3 128.9 13.7 88.1 -20 -41 40.3 59.4
Sholosahor 64.0 39.3 6.0 82.8 -58 43 -11.4 92.9
Cox's Bazar 4.6 8.4 2.8 7.0 -2 -1 16.4 25.6
Comilla 26.2 46.9 21.8 21.4 -4 -25 15.7 -0.5
Feni 8.7 20.0 4.9 10.4 -4 -10 23.2 20.5
Sylhet 67.4 42.7 10.2 9.9 -57 -33 -10.8 -0.9
Kalurghat (ext.) 4.0 5.0 21.2 27.6 17 23 5.6 6.8
Potiya 10.1 48.3 12.5 9.0 2 -39 47.9 -7.8
Begumgonj 10.8 30.1 7.1 9.6 -4 -20 29.2 8.1
Brahmanbaria 13.6 27.4 6.7 4.7 -7 -23 19.2 -8.5
Chaddagram 9.6 16.6 11.5 3.6 2 -13 14.7 -25.4
Sylhet (ext.) 36.0 45.1 28.6 31.6 -7 -14 5.8 2.5
Habiganj 3.1 24.7 7.4 6.6 4 -18 67.7 -2.8
Maulvibazar 8.1 18.7 3.1 13.7 -5 -5 23.2 45.2
Chandpur 9.7 17.7 12.3 6.4 3 -11 16.1 -15.1
Lakshmipur 13.5 11.0 6.0 21.8 -7 11 -5.0 38.1
Sunamganj 20.5 17.8 4.0 82.7 -16 65 -3.5 113.7
Rangamati 12.2 23.7 15.3 15.6 3 -8 18.0 0.6
Rajshahi 37.6 103.3 35.3 75.8 -2 -27 28.7 21.1
Rangpur 25.9 39.4 5.0 8.4 -21 -31 11.0 13.8
Pabna 26.0 69.1 25.8 37.9 0 -31 27.6 10.2
Dinajpur 21.7 57.9 7.1 12.0 -15 -46 27.8 14.1
Bogra 16.2 27.1 3.8 6.2 -12 -21 13.7 12.9

118
Industrial estate
Amount of expenditure (in Lac Tk.)
Amount of revenue (in Lac Tk.)
Amount of deficit (revenue-expenditure) (in lac Tk.)
CAGR 2011-2016
2011 2016 2011 2016 2011 2016 Expenditure Revenue
Bogra (ext.) 4.6 17.3 6.1 8.1 2 -9 39.6 7.4
Sayadpur 36.8 24.8 4.5 4.5 -32 -20 -9.4 -0.1
Natore 10.3 20.3 10.3 4.3 0 -16 18.7 -19.6
Thakurgaon 10.8 16.8 9.4 6.9 -1 -10 11.8 -7.5
Lalmonirhat 5.2 12.6 5.8 3.5 1 -9 24.5 -12.2
Kurigram 8.0 16.1 8.7 5.4 1 -11 19.0 -11.5
Serajganj 7.7 14.6 10.4 11.2 3 -3 17.2 2.0
Gaibandah 5.3 23.3 11.1 4.3 6 -19 44.9 -21.2
Naogaon 9.7 10.2 29.9 7.5 20 -3 1.3 -29.2
Joypurhat 7.2 57.3 19.8 7.6 13 -50 68.1 -21.3
Nawabganj 6.6 6.7 22.2 5.1 16 -2 0.7 -30.8
Panchagarh 9.0 8.1 10.4 14.6 1 7 -2.6 8.9
Khulna 18.5 52.3 9.0 62.4 -10 10 29.7 62.4
Jessore 13.8 44.9 19.1 27.3 5 -18 34.4 9.3
Kushtia 12.1 12.8 4.1 17.0 -8 4 1.3 42.7
Barisal 25.5 45.4 21.3 51.3 -4 6 15.5 24.6
Sharupkhati 13.5 24.6 4.6 5.9 -9 -19 16.2 6.5
Patuakhali 13.6 36.9 6.0 9.9 -8 -27 28.3 13.4
Satkhira 3.2 8.3 3.5 4.4 0 -4 27.0 6.0
Jhenaidah 8.1 23.7 6.4 12.7 -2 -11 30.9 18.7
Bagerhat 10.9 38.8 9.4 6.3 -1 -33 37.5 -9.6
Bhola 8.5 8.6 6.2 2.5 -2 -6 0.1 -20.4
Meherpur 6.4 15.7 9.1 3.0 3 -13 25.2 -24.4
Source: Budget Documents, 2011 and 2016, BSCIC.

119
Table A8: Data Mismatch between MIS-BSCIC and BIDS Survey of the Selected 25 Industrial Esates
Estates Total no. of
units in production
Total Prod (2016)
(million taka) (BIDS Survey)2324
Total prod (2016)
(million taka) (MIS,
BSCIC)
Employment (2016) (BIDS
Survey)
Employment (MIS
data)(2016-17)
Total investment
amount25(2016) (million taka) (BIDS Survey)
Total investment (2016-17) (million
taka) (MIS, BSCIC)
Shariatpur 15 485.1 127.3 282 300 97.2 80.2
Patuakhali 15 1601.28 255 314 345 76.0 125
Swarupkathi 66 165.1 400 602 1208 100.6 640
Satkhira 24 4394.2 345.3 1565 1176 1397.2 380
Khulna 62 8519.7 3604.4 4737 1219.7 4069.4 2346.6
Joypurhat 40 1880.3 149.5 827 1845 520.3 469.5
Comilla 135 6929.1 3403.15 5438 6480 3596.1 3015.88
Nohakhali 21 516.5 170 821 700 261.8 328.5
Feni 38 2166 37140 3229 3876 2618.3 2880
Patiya 14 2083.2 1605 1407 2135 522.8 2518
Cox bazar 18 5107.4 2752.8 1103 1370 673.4 1100.5
Narsingdi 43 5823.2 6259.25 6446 4750 2482.6 3425.5
Kishoregonj 23 1050.9 383 958 1290 335.1 341.7
Habigonj 45 1074.8 585 1191 695 428.4 440
Sunamganj 20 270 81 348 227 174.6 35.417
Jamalpur 58 2096.5 12434 2845 4550 1906.8 6000
Jamdhani 310 1914.5 38.5 3447 2080 3298.0 100
Dhamrai 52 1832.2 2774.6 2262 1884 2251.8 1338.2
Narayangonj 125 5558.2 12580 9373 18000 3862.0 4380
Tongi 154 16302.9 62510 18346 60700 4733.1 11200
Thakurgaon 41 1165.653 247.2 707 1425 275.2 567.9
Dinajpur 51 1961.4 3170.7 2923 878 3038.4 244.2
Naogaon 55 5582.5 1395.7 1232 1660 1957.5 926
Bogra (ext.) 56 6277.6 3000 3545 4060 1373.2 300
Panchagarh 9 61.2 747.5 196 171 41.9 11.52
Source:BIDS Survey 2017, authors calculations; and MIS Report July 2016-June 2017, BSCIC.
23Total production= ( Total output produced by surveyed units (2016)+ estimated total output produced by units that haven’t been surveyed) 24 Estimated total output for non-surveyed units= Average output of firms (from survey findings)* Number of non-surveyed units 25 Investment= Investments in fixed capital (land & building)+ capital (excluding land and building)+ investment made in the last year on capital (excluding land & building)