Embed Size (px)
Citation preview

1 Banco Products (India) Ltd.
Auto Ancillary Banco Products (India) Ltd Buy
CMP Rs 113 Target Price Rs 145
Key Data
Face Value 2.00 Market Cap (Rs in mn) 8080.0 Total O/s Shares in (in mn) 71.5 Free Float 32.9% 52 Week High / Low 139/43 Avg. Monthly Volume (BSE) 53238 Avg. Monthly Volume (NSE) 85847 BSE Code 500039 NSE Code BANCOINDIA Bloomberg Code BNCO IN Beta 1.22 Date of Incorporation Mar 1961 Last Dividend Declared 100% Six month return 11.78% Indices BSE S FCCB’s outstanding N.A. Warrants outstanding N.A.
One Year Price Chart
020406080
100120140160
Oct-09 Nov-09 Jan-10 Feb-10 Apr-10 May-10 Jun-10 Aug-10 Sep-1002000004000006000008000001000000120000014000001600000
Closing Price Volumes
Source: Capitaline
Share Holding Pattern 30-6-2010
Banks/MF's/Institutions/Ins
0.5%
Public & Others17.9%
FII's11.8%
Non Promoters (Body
Corporate)2.7%
Promoters 67.1%
Source: Company, KJMC Research
Shefali Doshi Research Analyst Phone-022 4094 5500 Ext. 202 Email [email protected]
Banco Products (India) Ltd ie BPL offers a complete line of radiators, intercoolers, oil‐coolers and all types of engine gaskets that are made to design for applications in automobiles, oil engines, compressors and locomotives. On standalone basis net sales, EBITDA and PAT have grown at a CAGR of 24.4%, 47.9% and 57.5% during FY06‐FY10 at Rs 4,130.50 mn, Rs 1,055.79 mn and Rs 781.77 mn. We expect the net sales, EBITDA & PAT to grow at a CAGR of 32.5%, 39.3% and 34.5% during FY10‐12E respectively.
At the CMP of Rs 113 the stock is trading at 8.5x & 5.7x its FY11E & FY12E earnings of Rs 13.3 & Rs 19.9 respectively. We recommend a “buy” on the stock with a target price of Rs 145 which is 7x its FY12E of Rs 19.9. The target price translates into a potential return of 28%.
Key Highlights De- risking the business model by diversifying the user industry The automobile sector, a major user industry has remained the major drive for the company’s growth in the past. However the company is looking at other industries where its products can find applications and thus de‐risk its business model by diversifying across the various segments rather then focusing on one segment. It has reduced the contribution of automobile industry from 65% to 50%. Robust demand in the auto segment to drive growth in future The Investments in the Auto component Industry has grown at a CAGR of 15.6% during 2004‐10 whereas the production of the auto component industry has grown at a CAGR of 19.18% during the same period. Under Automotive Mission Plan 2016 the Indian Automobile Industry is expected to increase the contribution to 10% to the country’s GDP from the current contribution of 5%. Acquisition of NRF to provide entry into the shipbuilding and marine business Banco recently acquired Nederlandse Radiateuren Fabriek B.V. which will help Banco to increase its presence in the European markets and also provide an entry into the ship – building and marine industry in India as well as South East Asia. NRF has sales of 64 mn euro with EBITDA of 4.3 mn euro and PAT of 1.9 mn euro for the year ended 30th November, 2009.
Consolidated Financial Snapshot Rs in mn
Particulars FY08 FY09 FY10 FY11E FY12E
Net Sales 2,988.5 2,879.1 4,611.8 5,995.3 8,093.7
EBITDA 553.3 525.0 1,017.3 1,375.9 1,974.9
EBITDA % 18.5% 18.2% 22.1% 23.0% 24.4%
PAT 432.5 414.7 785.8 949.9 1,422.5
PAT% 14.49% 14.40% 17.04% 15.84% 17.58%
EPS 6.1 5.8 11.0 13.3 19.9
P/E(x) 18.4 19.3 10.2 8.5 5.7
ROE% 37.9% 27.2% 32.8% 27.2% 31.4%
Source: Company, KJMC Research
7th Oct 2010 Initiating Coverage

2 Banco Products (India) Ltd.
Disclaimer / Important disclosures KJMC CAPITAL MARKET SERVIES LIMITED is a full service, stock broking company, and is a member of BSE (Bombay Stock Exchange Ltd., and NSE (National Stock Exchange of India Ltd., KJMC group and its officers, directors, and employees, including the analyst(s), and others involved in the preparation or issuance of this material and their dependants, may on the date of this report or from, time to time have “long” or “short” positions in, act as principal in , and buy or sell the securities or derivatives thereof of companies mentioned herein. Or sales people, dealers, traders and other professionals may provide oral or written market commentary or trading strategies to our clients that reflect opinions that are contrary to the opinion expressed herein. KJMC group may have earlier issued or may issue in future reports on the companies covered herein with recommendations/information inconsistent or different from those made in this report. In reviewing this document, you should be aware that any or all of the foregoing, among other things, might give rise to potential conflicts of interest. KJMC group may rely on information barriers, such as “Chinese Walls” to control the flow of information contained in one or more areas with in KJMC group into other areas, units, groups or affiliates of KJMC Group.KJMC group and its associates may in past, present or future have investment banking/advisory relationship with companie(s) mentioned herein. The projections and forecasts described in this report were based upon a number of estimates and assumptions and are inherently subject to significant uncertainties and contingencies. Projections and forecasts are necessarily speculative in nature, and it can be expected that one or more of the estimates on which the projections and forecasts were based will not materialize or will vary significantly from actual results, and such variances will likely increase over time. All projections and forecasts described in this report have been prepared solely by the analyst of this report independently of the KJMC Group. These projections and forecasts were not prepared with a view toward compliance with published guidelines or GAAP. You should not regard the inclusion of the projections and forecasts described herein as a representation or warranty by or on behalf of the KJMC Group, or specifically KJMC CAPITAL MARKET SERVICES LIMITED, or the analysts or any other person that these projections or forecasts or their underlying assumptions will be achieved. For these reasons, you should only consider the projections and forecasts described in this report after carefully evaluation all the information in this report, including the assumptions underlying such projections and forecasts. This report is for information purposes only and this document/material should not be construed as an offer to sell or the solicitation of an offer to buy, purchase or subscribe to any securities, and neither this document nor anything contained herein shall form the basis of or be relied upon in connection with any contract or commitment whatsoever. The price and value of the investments referred to in this document/material and the income from them may go down as well as up, and investors may realize losses on any investments. Past performance is not a guide for future performance. Future returns are not guaranteed and a loss of original capital may occur. Actual results may differ materially from those set forth in projections. Forward‐looking statements are not predictions and may be subject to change without notice. KJMC Group and its affiliates accept no liabilities for any loss or damage of any kind arising out of the use of this report. This report/document has been prepared by the KJMC Group based upon information available to the public and sources, ( including company sources) believed to be reliable. Though utmost care has been taken to ensure its accuracy, no representation or warranty, express or implied is made that it is accurate or complete. KJMC Group or specifically KJMC Capital Market Services Ltd., has reviewed the report and, in so far as it includes current or historical information, it is believed to be reliable, although its accuracy and completeness cannot be guaranteed. This information herein was obtained from various sources; we do not guarantee its accuracy or completeness. This document does not have regard to the specific investment objectives, financial situation and the particular needs of any specific persons who may receive this document and should understand that statements regarding future prospects many not be realized. Investors should note that income form such securities, if any, may fluctuate (both downside or upside), and that each security’s price or value may rise or fall. Accordingly, investors may receive back less than originally invested. Past performance is not necessarily a guide to future performance.
Analyst Certification I hereby certify that the views expressed in this document reflect my personal views. I also certify that no part of my respective compensation was, is, or will be, directly or indirectly, related to the views expressed in this document. I do not own any amount of stock in the company recommended/covered in this report.
General data sources Company, Capitaline, Public domain, Bloomberg.

3 Banco Products (India) Ltd.
Contents
Investment Rationale ............................................................................... 4
Risk & Concern.......................................................................................... 8
Company Background ............................................................................. 8
Industry ...................................................................................................... 9
Business Outlook .................................................................................... 10
Valuation.................................................................................................. 11
Quarterly performance........................................................................... 12
Financial Summary................................................................................. 13

4 Banco Products (India) Ltd.
Investment Rationale
De- risking the business model by diversifying the user industry Banco has remained a major player in manufacturing and supplying radiators and gaskets. The radiators manufactured by Banco are used in various industries viz:
Commercial vehicles
Off – the road vehicles (OTR)
Passenger vehicles in the exports market.
Almost 80‐85% of the total sales in the domestic markets comprises of OEM sales with the rest 15‐20% sales coming in from the after market sales
Industry wise break up in Current Industry wise break up in Past
20%
30%
50%
Automotiveearthmoving & constructionIndustrial engine
65%
15%
20%
Automotiveearthmoving & constructionIndustrial engine
Source: Company, KJMC Research
In the automobile sector Tata Motors, M& M and Ashok Leyland have remained amongst the prestigious clients of the company with Tata Motors and M & M having contributed around 11% each to the total revenues.
The automobile sector, a major user industry has remained the major drive for the company’s growth in the past. However the company is looking at other industries where its products can find applications and thus de‐risk its business model by diversifying across the various segments rather then focusing on one segment. It has reduced the contribution of automobile industry from 65% to 50%.
Banco sees more growth coming in from other user industries like Railways, and power on account of huge spending in both the user industries. Railways contributed around 10% to the revenues for FY10.
In the Industrial engine segment Banco has been supplying radiators for captive power plants upto 1 to 2 MVA capacity.
In the earth moving & construction segment BEML, JCB, L&T, John Deere are some of the companies to whom the Banco has been supplying radiators on a regular basis.

5 Banco Products (India) Ltd.
Geographical diversification
62%66% 63% 63%
67%
38%34% 37%
33%37%
0%
10%
20%
30%
40%
50%
60%
70%
80%
2005-06 2006-07 2007-08 2008-09 2009-10
Domestic Exports
Source: Company, KJMC Research
Banco has been exporting its products mainly to European countries and almost 36‐37% of the total sales has been contributed through exports. It is also trying to enter the US markets and specifically the markets of North America which is likely to happen in FY11.
Automotive Mission Plan 2016 to drive demand in the auto segment An “ Automotive Mission Plan 2016 “ has been laid out by the Government of India in order to give a road map to the Indian Automobile Industry. Under the plan the Indian Automobile Industry is expected to increase the contribution to 10% to the country’s GDP from the current contribution of 5% by way of:‐
I. Increasing the turnover to $145 bn by 2016 from $ 35 bn
II. Increasing the exports revenue to $ 35 bn by 2016 from 4.1$ bn
III. Creation of additional job opportunities for 25 mn people by 2016.
Since the growth in Auto component Industry is directly linked to the growth in the Automobile Industry , the Auto component Industry too is poised for a big leap by 2016 by achieving a
I. $ 20 bn sales in the domestic markets
II. $ 20 bn in export sales
III. Creation of 1 mn additional jobs.
Factors to drive investments in future Investments in Auto component Industry Production of Auto component Industry
3.13.8
4.45.4
7.2 7.3 7.4
012345678
2003-04
2004-05
2005-06
2006-07
2007-08
2008-09
2009-10
US$
bn
6.78.7
12.0 15.018.0
18.4 19.2
0
5
10
15
20
25
2003-04
2004-05
2005-06
2006-07
2007-08
2008-09
2009-10
US$
bn
Source: ACMA

6 Banco Products (India) Ltd.
The Investments in the Auto component Industry has grown at a CAGR of 15.6% during 2004‐10 whereas the production of the auto component industry has grown at a CAGR of 19.18% during the same period. Going ahead, the factors which will drive growth and investments in the auto –component industry are:
Low penetration rate of cars at 8/1000
Middle class likely to grow from 50 mn to 550 mn by 2025.
Consistent improvement in the quality resulting in the increased exports of Automobiles and auto components
Competitive skilled power available at lower cost.
Acquisition of NRF to provide entry into the shipbuilding and marine business Banco recently acquired 100% stake in Nederlandse Radiateuren Fabriek B.V. The products of NRF are different in terms of reach and technology as compared to the Banco’s gaskets and radiators. The acquisition will help Banco to increase its presence in the European markets and also provide an entry into the ship –building and marine industry in India as well as South East Asia For the year ended November 2009 .NRF had a Sales of 64 mn euro with EBITDA of 4.3 mn euro and PAT of 1.9 mn euro which are unaudited and provisional.
Distribution & Manufacturing facilities of NRF
Manufacturing facilities
Main manufacturing
facility
Other manufacturing
facility
Netherland France England Spain
Distribution facilities
Belgium Germany Austria Italy Poland Switzerland

7 Banco Products (India) Ltd.
NRF – Product profile
Copper, Brass, aluminium radiators
Marine heat exchangers
Oil – coolers
Air coolers
Automotive air conditioning products
Industry wise break up of revenues – NRF
50%
25%25%
Marine Automotive Others
Source: Company, KJMC Research
Comparative performance of NRF for last 2 years (Figures in Euro mn) Particulars FY09* FY08 growth %
Net Sales 64 70 -8.6% EBITDA 4.3 5.1 -16% EBITDA margins % 6.7% 7.3% - 60 bps PAT 1.9 2.2 -13.6% PAT margins% 3.0% 3.1% - 20 bps
Source: Company, Concall Transcript Acquired NRF at a very attractive price which is below the book value
NRF has been the client of Banco for last 15 yrs and Banco Products have acquired NRF at below the book value and a very attractive price of Euro 17.7 mn as against the net current assets of Euro 24.8 mn. Synergies aimed through acquisitions
Banco aims to leverage on their marketing strengths and gain more access in the European markets. It is looking at increasing the market for marine air cooler application s in India & South east Asia. In turn NRF will be getting the advantage of becoming more cost effective through this acquisition.

8 Banco Products (India) Ltd.
Key Risk & Concerns
Banco Products Ltd is considering investing $ 12.3 mn in Lake Cements Ltd, a company incorporated under the laws of Tanzania. Lake cements is planning to set up a Greenfield project for manufacturing cement with an installed capacity of 0.5mn tonnes annually. We think that the management has the necessary skill & expertise in the auto aniclliary segment and hence diversifying into cement business might prove to be riskier for the growth prospects of the company in future. The project is to start commercial production from 1.1.2013 and hence the revenues from the cement business have not been considered by us in our projections.
Auto component industry is largely occupied by unorganized players who provides immense competition through lower margins and profits
Raw material prices like aluminum, copper, rubber, steel are highly volatile thus increasing the volatility of raw material prices.
Any slow down in the auto segment will negatively impact the prospects of the players in the auto component industry.
Immense competition faced from the global players.
Banco has invested $3.5 mn in Kilimanjaro Biochem Limited, a company incorporated in Tanzania. The company is into the business of manufacturing potable alcohol and is likely to commence operations in FY11. We foresee this as a riskier venture as it is totally unrelated to the core business of the company.
Company Background
Banco Products India Ltd is a supplier of high quality engine cooling components and engine sealing gaskets to the automotive industry for over four decades. The company offers a complete line of radiators, intercoolers, oil‐coolers and all types of engine gaskets. BANCO supplies radiators; intercoolers and engine gaskets that are designed to meet or even exceed original equipment (OE) engineering specifications.
The company offers over 12,000 varieties of gaskets in multi‐layered steel, graphite, fiber steel and copper designs for automotive, agricultural vehicles, and diesel commercial vehicles; radiators for cars and pickups, industrial radiators, air‐to‐air intercoolers, custom‐designed intercoolers, intercoolers cores for various commercial vehicles and off‐road industrial applications; and compressed jointing sheets using non asbestos raw materials which are environmentally friendly.
The company is an original equipment supplier to Indian automobile majors including Telco, Ashok Leyland, Mahindra & Mahindra, Premier Auto, Hindustan Motors and Maruti Udyog. It exports its products to Australia, Germany, Singapore and the UK.

9 Banco Products (India) Ltd.
Industry
According to the reports, the turnover of the Indian auto component industry has grown by an estimated 27.2% at over USD 18 billion in 2007‐08 since 2002. Going ahead it is expected to grow between USD 33 bn ‐40 bn by 2016 from USD 19 billion in 2008‐09. Hence Indiaʹs share in the global auto component market will be increased from 1 percent to 3 percent by 2015‐16.
Exports of auto components from the country grew at the rate of 35 percent during 2002‐07 and touched USD 3.6 billion in 2007‐08. It is estimated to reach around USD 20 billion‐USD 22 billion by 2015‐16.
Size & Product range of Auto component Industry
31%
7%9%
10%
12%
12%
19%
Engine parts Transmission & Steering partsBody & Chassis Suspension & braking partsEquipments Electrical partsOthers
Source: ACMA
The Indian Auto component Industry has witnessed tremendous growth momentum on account of various factors like:
De‐licensing of Industries
Increasing exports of automobiles from India
Cost Advantage
local availability of raw materials like steel, rubber, aluminium
100% FDI allowed in the sector, etc.
Many global auto manufacturers are not only sourcing components from local players for their local as well as overseas manufacturing operations.
Going ahead rising sales of automobiles in the country will continue to sustain higher levels of auto component demand, which is poised to grow at 13.8% CAGR during 2010‐11 – 2103‐14. On the export front, India is gradually positioning itself as a trusted name in global auto component industry.
In the recent years, auto component manufacturers are gradually moving up in the value chain and their share of supply to OEMs in total exports is increasing and supply to the aftermarket is decreasing.
Attributes like improving component quality, cost effectiveness even at lower level of production levels are differentiating Indian component suppliers from their foreign counterparts. The trend is expected to prevail in future also, which will strengthen the industry outlook in the country.

10 Banco Products (India) Ltd.
Business Outlook On stand alone basis net sales, EBITDA and PAT have grown at a CAGR of 25% 48% & 58% at Rs 4,130mn 1055.79mn and Rs 781.7 mn respectively during FY06‐10. Banco is trying to make its presence in the American markets which is likely to happen in FY11. Capacity expansion through capex and the acquisition to drive growth in future Every year Banco does a capex of around Rs 150‐200 mn of which 60‐70% is for the capacity expansion plans. Capacity utilization for the company remains at around 80% and the same is at 65% for NRF.
With acquisition of NRF and the increased capacity coming in from the capex and expanded user industry base we expect the company’s revenues to grow at a CAGR of 32.5% during FY10‐FY12E. EBITDA and PAT during the same period are likely to grow at 39.3% and 34.5% repectively.
Sales & Sales Growth % EBITDA & PAT
0
2000
4000
6000
8000
10000
FY06 FY07 FY08 FY09 FY10 FY11E FY12E
Rs
in m
n
-10.0%0.0%
10.0%20.0%30.0%
40.0%50.0%
60.0%70.0%
Sales % growth
0
500
1000
1500
2000
2500
FY06 FY07 FY08 FY09 FY10 FY11E FY12E
Rs
in m
n
EBITDA PAT
Source: Company, KJMC Research
Improving EBITDA & PAT margins On standalone basis EBITDA & PAT margins have remained on an increasing trend during FY06‐FY10E. EBITDA margins improved by 740 bps during FY10 at 25.6% whereas PAT margins improved by 450 bps during the same period at 18.9%. The improvement in EBITDA margins was on account of introduction of new products, improvement in scrap ratios, efficient manufacturing process,etc. Going forward we expect this healthy trend to continue with EBITDA likely to remain in the range of 23% ‐24% and & PAT margins to remain above 16%.
Consolidated EBITDA Margins Consolidated PAT Margin
13.1%12.8%18.5% 18.2%
22.1%23.0% 24.4%
0.0%
5.0%
10.0%
15.0%
20.0%
25.0%
30.0%
FY06 FY07 FY08 FY09 FY10 FY11E FY12E
EBITDA%
7.4%9.7%
14.5% 14.4%17.0% 15.8% 17.6%
0.0%
5.0%
10.0%
15.0%
20.0%
25.0%
FY06 FY07 FY08 FY09 FY10 FY11E FY12E
PAT%
Source: Company, KJMC Research
11 Banco Products (India) Ltd.
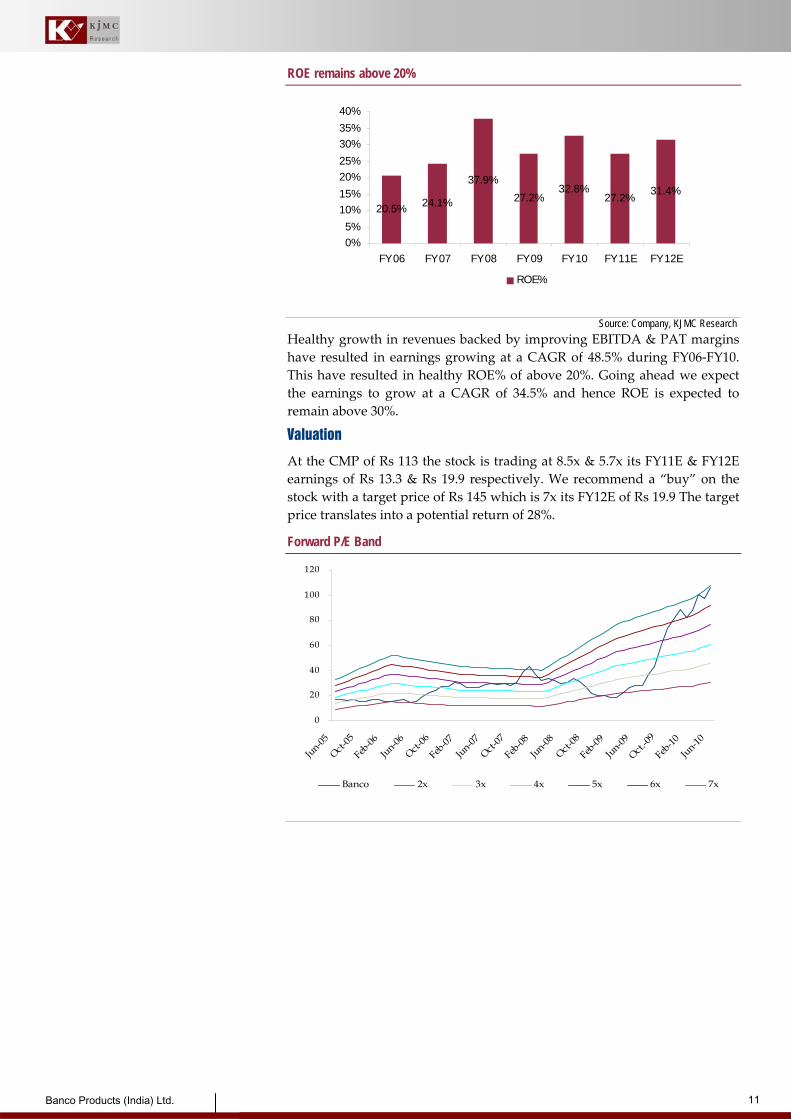
ROE remains above 20%
20.5% 24.1%
37.9%27.2%
32.8%27.2% 31.4%
0%5%
10%15%20%25%30%35%40%
FY06 FY07 FY08 FY09 FY10 FY11E FY12E
ROE%
Source: Company, KJMC Research
Healthy growth in revenues backed by improving EBITDA & PAT margins have resulted in earnings growing at a CAGR of 48.5% during FY06‐FY10. This have resulted in healthy ROE% of above 20%. Going ahead we expect the earnings to grow at a CAGR of 34.5% and hence ROE is expected to remain above 30%.
Valuation
At the CMP of Rs 113 the stock is trading at 8.5x & 5.7x its FY11E & FY12E earnings of Rs 13.3 & Rs 19.9 respectively. We recommend a “buy” on the stock with a target price of Rs 145 which is 7x its FY12E of Rs 19.9 The target price translates into a potential return of 28%.
Forward P/E Band
0
20
40
60
80
100
120
Jun-05
Oct-05
Feb-06
Jun-06
Oct-06
Feb-07
Jun-07
Oct-07
Feb-08
Jun-08
Oct-08
Feb-09
Jun-09
Oct.-09
Feb-10
Jun-10
Banco 2x 3x 4x 5x 6x 7x

12 Banco Products (India) Ltd.
Analysis of Quarterly performance
0 50 100 150
Q3FY09
Q4FY09
Q1FY10
Q2FY10
Q3FY10
Q4FY10
Q1FY11
Sales EBITDA PAT
Source: Company, KJMC Research
Q1FY11 Result update - Standalone Particulars Q1FY11 Q1FY10 % y-o-y
Net Sales 1100.6 858.5 28.2% Other Operating income 32.9 13.2 149.2% Total Income 1133.5 871.7 30.0% Raw materials 570.2 450.7 26.5% Employee exps 50.6 43.9 15.3% Other expenditure 224.1 157.6 42.2% Total Expenditure 844.9 652.2 29.5%
EBITDA 288.6 219.5 31.5%
EBITDA margins(%) 25.46% 25.18% 30 bps
Interest 17 2.7 529.6% PBDT 271.6 216.8 25.3% Depreciation 31.5 23.5 34.0% PBT 240.1 193.3 24.2% Other Income 2.3 4.2 -45.2% PBT 242.4 197.5 22.7%
Tax 50.1 35.3 41.9%
PAT 192.3 162.2 18.6%
PAT margins(%) 17.0% 18.6% - 160 bps Equity Capital 143 143 Face Value 2 2
Source: Company, KJMC Research
Q1FY11 – Performance analysis
Net sales during the quarter registered a 28% growth at Rs 1100.60 mn which was mainly driven by volumes. EBITDA was up by 31.5% at Rs 288.60 mn with 30 bps improvement in margins on account of decline in the employee cost and raw material as a % of sales.
PAT for Q1 FY11 was up by 18.6% at Rs 192.3 mn though with a reduction of 160 bps in the PAT margins at 17.0%. The reduction in the PAT margins was on account of increase of 120 bps in the interest cost at Rs 17 mn up by a huge 529.6% and a decline of 45% in other income at Rs 2.3 mn. Depreciation increased by 34% at Rs 31.5 mn.
13 Banco Products (India) Ltd.
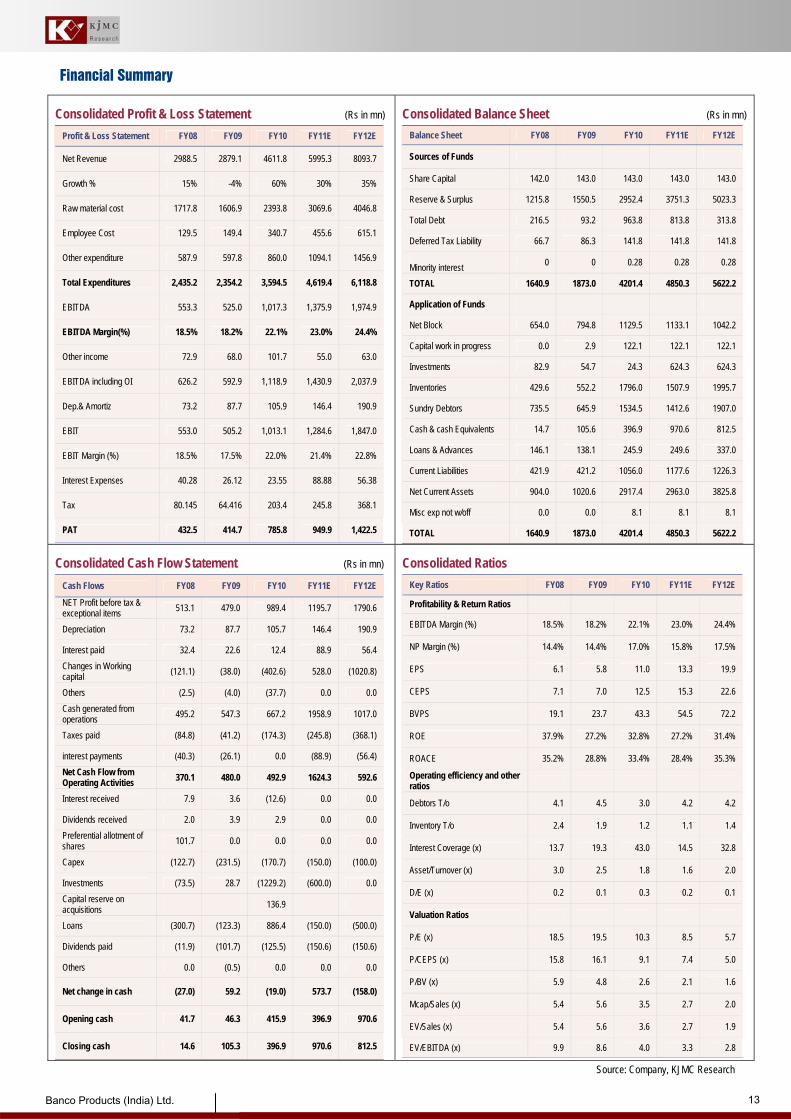
Financial Summary
Consolidated Profit & Loss Statement (Rs in mn) Profit & Loss Statement FY08 FY09 FY10 FY11E FY12E
Net Revenue 2988.5 2879.1 4611.8 5995.3 8093.7
Growth % 15% -4% 60% 30% 35%
Raw material cost 1717.8 1606.9 2393.8 3069.6 4046.8
Employee Cost 129.5 149.4 340.7 455.6 615.1
Other expenditure 587.9 597.8 860.0 1094.1 1456.9
Total Expenditures 2,435.2 2,354.2 3,594.5 4,619.4 6,118.8
EBITDA 553.3 525.0 1,017.3 1,375.9 1,974.9
EBITDA Margin(%) 18.5% 18.2% 22.1% 23.0% 24.4%
Other income 72.9 68.0 101.7 55.0 63.0
EBITDA including OI 626.2 592.9 1,118.9 1,430.9 2,037.9
Dep.& Amortiz 73.2 87.7 105.9 146.4 190.9
EBIT 553.0 505.2 1,013.1 1,284.6 1,847.0
EBIT Margin (%) 18.5% 17.5% 22.0% 21.4% 22.8%
Interest Expenses 40.28 26.12 23.55 88.88 56.38
Tax 80.145 64.416 203.4 245.8 368.1
PAT 432.5 414.7 785.8 949.9 1,422.5
Consolidated Balance Sheet (Rs in mn) Balance Sheet FY08 FY09 FY10 FY11E FY12E
Sources of Funds
Share Capital 142.0 143.0 143.0 143.0 143.0
Reserve & Surplus 1215.8 1550.5 2952.4 3751.3 5023.3
Total Debt 216.5 93.2 963.8 813.8 313.8
Deferred Tax Liability 66.7 86.3 141.8 141.8 141.8 Minority interest 0 0 0.28 0.28 0.28
TOTAL 1640.9 1873.0 4201.4 4850.3 5622.2
Application of Funds
Net Block 654.0 794.8 1129.5 1133.1 1042.2
Capital work in progress 0.0 2.9 122.1 122.1 122.1
Investments 82.9 54.7 24.3 624.3 624.3
Inventories 429.6 552.2 1796.0 1507.9 1995.7
Sundry Debtors 735.5 645.9 1534.5 1412.6 1907.0
Cash & cash Equivalents 14.7 105.6 396.9 970.6 812.5
Loans & Advances 146.1 138.1 245.9 249.6 337.0
Current Liabilities 421.9 421.2 1056.0 1177.6 1226.3
Net Current Assets 904.0 1020.6 2917.4 2963.0 3825.8
Misc exp not w/off 0.0 0.0 8.1 8.1 8.1
TOTAL 1640.9 1873.0 4201.4 4850.3 5622.2 Consolidated Cash Flow Statement (Rs in mn)
Cash Flows FY08 FY09 FY10 FY11E FY12E
NET Profit before tax & exceptional items 513.1 479.0 989.4 1195.7 1790.6
Depreciation 73.2 87.7 105.7 146.4 190.9
Interest paid 32.4 22.6 12.4 88.9 56.4 Changes in Working capital (121.1) (38.0) (402.6) 528.0 (1020.8)
Others (2.5) (4.0) (37.7) 0.0 0.0 Cash generated from operations 495.2 547.3 667.2 1958.9 1017.0
Taxes paid (84.8) (41.2) (174.3) (245.8) (368.1)
interest payments (40.3) (26.1) 0.0 (88.9) (56.4) Net Cash Flow from Operating Activities 370.1 480.0 492.9 1624.3 592.6
Interest received 7.9 3.6 (12.6) 0.0 0.0
Dividends received 2.0 3.9 2.9 0.0 0.0 Preferential allotment of shares 101.7 0.0 0.0 0.0 0.0
Capex (122.7) (231.5) (170.7) (150.0) (100.0)
Investments (73.5) 28.7 (1229.2) (600.0) 0.0 Capital reserve on acquisitions 136.9
Loans (300.7) (123.3) 886.4 (150.0) (500.0)
Dividends paid (11.9) (101.7) (125.5) (150.6) (150.6)
Others 0.0 (0.5) 0.0 0.0 0.0
Net change in cash (27.0) 59.2 (19.0) 573.7 (158.0)
Opening cash 41.7 46.3 415.9 396.9 970.6
Closing cash 14.6 105.3 396.9 970.6 812.5
Consolidated Ratios Key Ratios FY08 FY09 FY10 FY11E FY12E
Profitability & Return Ratios
EBITDA Margin (%) 18.5% 18.2% 22.1% 23.0% 24.4%
NP Margin (%) 14.4% 14.4% 17.0% 15.8% 17.5%
EPS 6.1 5.8 11.0 13.3 19.9
CEPS 7.1 7.0 12.5 15.3 22.6
BVPS 19.1 23.7 43.3 54.5 72.2
ROE 37.9% 27.2% 32.8% 27.2% 31.4%
ROACE 35.2% 28.8% 33.4% 28.4% 35.3%
Operating efficiency and other ratios
Debtors T/o 4.1 4.5 3.0 4.2 4.2
Inventory T/o 2.4 1.9 1.2 1.1 1.4
Interest Coverage (x) 13.7 19.3 43.0 14.5 32.8
Asset/Turnover (x) 3.0 2.5 1.8 1.6 2.0
D/E (x) 0.2 0.1 0.3 0.2 0.1
Valuation Ratios
P/E (x) 18.5 19.5 10.3 8.5 5.7
P/CEPS (x) 15.8 16.1 9.1 7.4 5.0
P/BV (x) 5.9 4.8 2.6 2.1 1.6
Mcap/Sales (x) 5.4 5.6 3.5 2.7 2.0
EV/Sales (x) 5.4 5.6 3.6 2.7 1.9
EV/EBITDA (x) 9.9 8.6 4.0 3.3 2.8 Source: Company, KJMC Research

14 Banco Products (India) Ltd.
Mr. Girish Jain Executive Director [email protected] 2288 5201 (B)
Mr. Suresh Parmar A.V.P. ‐ Institutional Equities [email protected] 4094 5551 (D)
Mr. Vipul Sharma A.V.P. ‐ Institutional Sales [email protected] 4094 5556 (D)
Recommendation Parameters
Expected returns in absolute terms over a one‐year period Buy ‐ appreciate more than 20% over a 12‐ month period Accumulate ‐ appreciate 10% to 20% over a 12‐ month period Hold / Neutral ‐ appreciate up to 10% over a 12‐ month period Reduce ‐ depreciate up to 10% over a 12‐ month period Sell ‐ depreciate more than 10% over a 12‐ month period
Disclaimer : This publication has been prepared from information available on public domain and doses not constitute a solicitation to any person to buy or sell a security. The informationcontained therein has been obtained from source believed to be reliable to the best of our knowledge. KJMC Capital Market Services Ltd. dose not bear any responsibility for theauthentication of the information contained in the reports and consequently, is not liable for any decisions taken based on the same. Further KJMC only provides informationupdates and analysis. All option for buying and selling are available to investors when they are registered clients of KJMC Capital Market Services Ltd. As per SEBIrequirements it is stated that, KJMC Capital Market Services Ltd. , and/or individuals thereof may have positions in securities referred herein and may make purchases or salethereof while this report is in circulation
The National Stock Exchange (EQ, WDM)The National Stock Exchange (Derivatives )The Stock Exchange, Mumbai
: SEBI Regn. No. INB 230719932: SEBI Regn. No. INF 230719932: SEBI Regn. No. INB 010719939
MCX-SX CurrencyMCX-Commodity*Mutual Fund’s AMFI No.
: INE260719932: MCX/TM/CORP/1772: ARN - 2386
Member
* Under KJMC Commodities Market India Ltd
For further details : visit our website - www.kjmc.com KJMC Research is also available on Bloomberg (KJMC <Go>)