Embed Size (px)
Citation preview

Scientific Proceedings of the 12
th International Conference on
Engineering Graphics BALTGRAF 2013
Editor M. Dobelis
RIGA TECHNICAL UNIVERSITY
2013
The responsibility for the accuracy of all statements in each paper rests solely with
the author(s). Statements are not necessarily opinion of or endorsed by the publisher.
Permission is granted to photocopy portions of the publication for personal use and
for the use of students, providing the credit is given to the conference, publication and
author. Permission does not extend to any part of this book for incorporation it into
commercial advertising, nor for any other profit-making purpose, performed in any
form or by any means, electronic or mechanical, including recording, or any
information storage or retrieval system, without permission in writing from the
publisher.
All the trademarks are the property of their respective holders.
Support for publishing provided by the European Regional Development Fund
project “Development of international cooperation projects and capacity in science
and technology Riga Technical University”.
Contract No. 2010/0190/2DP/2.1.1.2.0/10/APIA/VIAA/003
ISBN 978-9934-507-30-4
Scientific papers were peer reviewed
English (U.K.) was used for the spellchecking of all submissions
iThenticate®
was used as plagiarism checker for content originality
BALTGRAF 2013 acknowledges EasyChair conference management system
Editor Modris Dobelis
© 2013 Riga Technical University
BALTGRAF 2013 – The 12th International Conference on Engineering Graphics 3/300
CONFERENCE ORGANIZATION
Under auspices of
International Association BALTGRAF
Organizing Committee:
Modris Dobelis – Conference Chairman, Riga Technical University, Latvia
Juris Smirnovs – Conference Co-Chair, Riga Technical University, Latvia
Zoja Veide – Program Committee Chair, Riga Technical University, Latvia
Marika Ubagovska – Conference Secretary, Riga Technical University, Latvia
International Program Committee:
Harri Annuka Tallinn University of Technology Estonia
Jānis Auzukalns Riga Technical University Latvia
Aleksandr Brailov Odessa State Construction and Architecture
Academy
Ukraine
Anna Błach Silesian University of Technology Poland
Theodore Branoff North Carolina State University USA
Modris Dobelis Riga Technical University Latvia
Jolanta Dźwierzyńska Rzeszow University of Technology Poland
Cornelie Leopold University of Kaiserslautern Germany
Harri Lille Estonian University of Life Sciences Estonia
Daiva Makutėnienė Vilnius Gediminas Technical University Lithuania
Rein Mägi Tallinn University of Technology Estonia
Vidmantas Nenorta Kaunas University of Technology Lithuania
Imants Nulle Latvian University of Agriculture Latvia
Lidija Pletenac University of Rijeka Croatia
Monika Sroka-Bizoń Silesian University of Technology Poland
Hirotaka Suzuki Kobe University Japan
Jolanta Tofil Silesian University of Technology Poland
Antanas Vansevičius Aleksandras Stulginskis University Lithuania
Daniela Velichova Slovak University of Technology in Bratislava Slovakia
Olafs Vronskis Latvia University of Agriculture Latvia
Gunter Weiß Dresden Technical University Germany
Local Organizing Team:
Jānis Auzukalns
Ieva Jurāne
Ella Leja
Veronika Stroževa
Gaļina Veide
4/300 The 12th International Conference on Engineering Graphics – BALTGRAF 2013
Papers were peer reviewed by
PROGRAM COMMITTEE – THE BOARD OF REVIEWERS
Aleksandar Čučaković University of Belgrade Serbia
Modris Dobelis Riga Technical University Latvia
Renata Górska Cracow University of Technology Poland
Tatjana Grigorjeva Vilnius Gediminas Technical University Lithuania
Olga Ilyasova Siberian State Automobile and Road
Construction Academy
Russian
Federation
Biljana Jović University of Belgrade Serbia
Birutė Juodagavienė Vilnius Gediminas Technical University Lithuania
Natalya Kaygorodseva Siberian State Automobile and Road
Construction Academy
Russian
Federation
Harri Lille Estonian University of Life Sciences Estonia
Daiva Makutėnienė Vilnius Gediminas Technical University Lithuania
Rein Mägi Tallinn University of Technology Estonia
Vidmantas Nenorta Kaunas University of Technology Lithuania
Miodrag Nesterović University of Belgrade Serbia
Nomeda Puodziuniene Vilnius Gediminas Technical University Lithuania
Ants Soon Tartu College of TUT Estonia
Nataša Teofilović University of Belgrade Serbia
Jolanta Tofil Silesian University of Technology Poland
Zoja Veide Riga Technical University Latvia
Vladimir Volkov Siberian State Automobile and Road
Construction Academy
Russian
Federation
Olafs Vronskis Latvia University of Agriculture Latvia
Rytė Žiūrienė Vilnius Gediminas Technical University Lithuania
Scientific Proceedings of the 12th
International Conference on
Engineering Graphics BALTGRAF 2013
June 5-7, 2013, Rīga, Latvia. -300 pp.
BALTGRAF 2013 – The 12th International Conference on Engineering Graphics 5/300
ACKNOWLEDGMENT
Support for publishing provided by the European Regional Development Fund
project “Development of international cooperation projects and capacity in science
and technology Riga Technical University”.
Contract No. 2010/0190/2DP/2.1.1.2.0/10/APIA/VIAA/003

6/300 The 12th International Conference on Engineering Graphics – BALTGRAF 2013
Cover design Jānis Auzukalns
Lay-out Modris Dobelis
Copyright 2013 Riga Technical University

BALTGRAF 2013 – The 12th International Conference on Engineering Graphics 7/300
HOST OF THE CONFERENCE
BALTGRAF 2013 is dedicated
to the 150th
Anniversary
of Riga Technical University
which was celebrated on
October 14, 2012
Riga Technical University
is the oldest technical university
in the Baltic States
The Conference is Organized
by the Department of
Computer Aided Engineering Graphics
8/300 The 12th International Conference on Engineering Graphics – BALTGRAF 2013
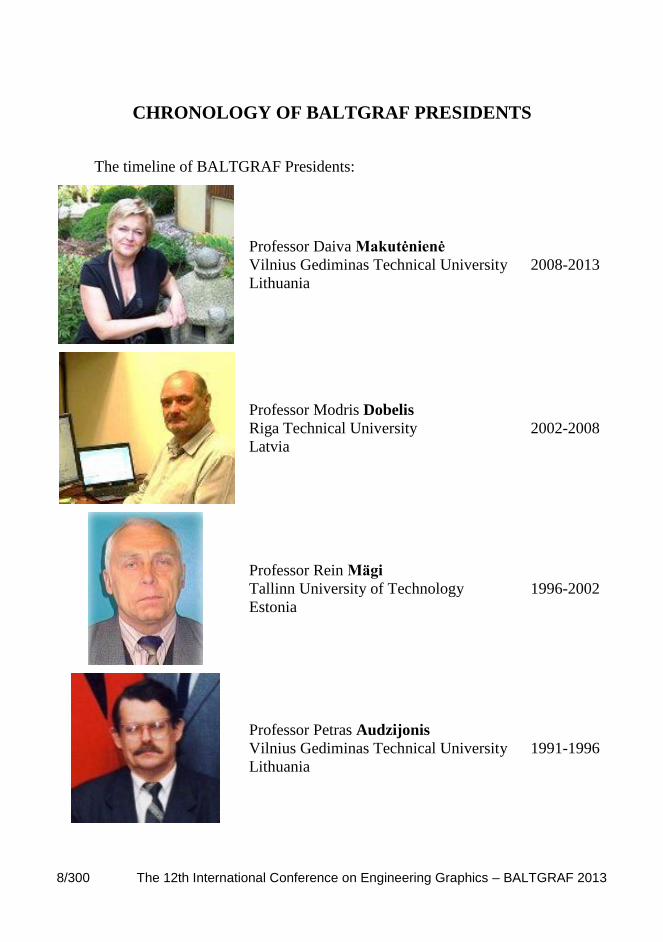
CHRONOLOGY OF BALTGRAF PRESIDENTS
The timeline of BALTGRAF Presidents:
Professor Daiva Makutėnienė
Vilnius Gediminas Technical University
Lithuania
2008-2013
Professor Modris Dobelis
Riga Technical University
Latvia
2002-2008
Professor Rein Mägi
Tallinn University of Technology
Estonia
1996-2002
Professor Petras Audzijonis
Vilnius Gediminas Technical University
Lithuania
1991-1996

BALTGRAF 2013 – The 12th International Conference on Engineering Graphics 9/300
PREFACE
Both the content and the forms of teaching in the engineering education are changing drastically due to the rapid advances in the contemporary Information Technology (IT). Computers and Computer Aided Design has become a media for engineering rather than just a simple tool. The fundamental knowledge required for the successive management of modern BIM (Building Information Modelling) and PLM (Product Lifecycle Management) concepts still is the same as before – engineering graphics and descriptive geometry. This refers not only to the mechanical, civil engineering and architecture, but almost to the all spheres of life which is very hard to accept by some of the academic officials.
The submitted papers showed continual increase of the research in the areas of CAD/CAM technologies, using BIM and PLM concepts, as well as the use of ELS (Electronic Learning System), and development of multimedia study aids and applications. The challenges of Augmented Reality (AR) in graphic subjects have been noticed in several studies. Many of these ideas have been introduced into engineering curricula and the educators share the experience of their use. The number of first time contributors to the BALTGRAF has increased – we are pleased to warmly welcome the research papers from Russian Federation, Serbia, and Ukraine.
This year we have a very special topic on geometry in arts of Latvian immigrant to Canada after WWII Zanis Waldheims (1909-1993). His artworks you can enjoy at the exhibition which is brought back to Zanis’ home country by Yves Jeanson, a freelancer from Canada which I meat last year in Montreal at our bigger brother’s ICGG 2012 Conference (International Conference on Geometry and Graphics). Yves is a privileged witness of an interesting story about a Latvian survivor that did not back off from any difficulty to realize his quest for meaning and orientation.
On behalf of organizers, I am pleased to thank all the authors for the contributing papers. We express our appreciation to the Board of the Reviewers for their time and efforts devoted to the review process. For some of the authors and reviewers the use of EasyChair conference management system was a great challenge to extend their IT knowledge into a completely new area. Likewise we all – the graphic educators – are establishing the bridge between the fundamental engineering practices and the modern IT technologies nowadays used almost in all spheres of life.
Finally, on behalf of Organizing Committee, I would like to thank all participants who came to the conference at the present very challenging economic situation in the world and wish you a prosperous conference, fruitful discussions, great ideas and further cooperation in teaching contemporary graphic communication.
Welcome to Riga and BALTGRAF 2013!
Modris Dobelis, BALTGRAF 2013 Chairman
10/300 The 12th International Conference on Engineering Graphics – BALTGRAF 2013
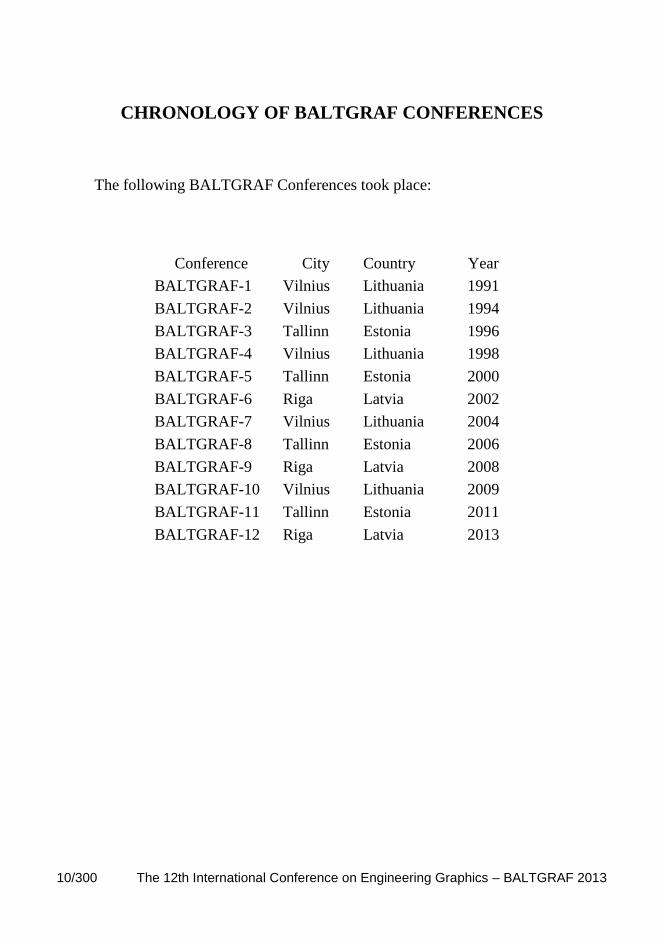
CHRONOLOGY OF BALTGRAF CONFERENCES
The following BALTGRAF Conferences took place:
Conference City Country Year
BALTGRAF-1 Vilnius Lithuania 1991
BALTGRAF-2 Vilnius Lithuania 1994
BALTGRAF-3 Tallinn Estonia 1996
BALTGRAF-4 Vilnius Lithuania 1998
BALTGRAF-5 Tallinn Estonia 2000
BALTGRAF-6 Riga Latvia 2002
BALTGRAF-7 Vilnius Lithuania 2004
BALTGRAF-8 Tallinn Estonia 2006
BALTGRAF-9 Riga Latvia 2008
BALTGRAF-10 Vilnius Lithuania 2009
BALTGRAF-11 Tallinn Estonia 2011
BALTGRAF-12 Riga Latvia 2013
BALTGRAF 2013 – The 12th International Conference on Engineering Graphics 11/300
HISTORY
It was back in 1991 on November 5th at the Vilnius Technical University when
following the initiative of the professor Petras Audzijonis the representatives of seven
Departments of Engineering Graphics from six universities of the Baltic States came
together. Assuming the lately changed political situation in Eastern Europe in general
and in the Baltic region in particular at this meeting an International Baltic
Association BALTGRAF was founded. The Declaration of the Association was
accepted and Council elected, the main goal determined and the tasks set. The
principal purpose of the BALTGRAF was to establish a new scientific journal for
publications, organize the scientific conferences, coordinate the efforts and exchange
the ideas in the field of engineering background education dealing with wide range of
Engineering Graphics matters. Special attention was paid to the emerging computer
graphics technologies, how to integrate them both into syllabus in particular and into
engineering curricula in general.
The conference is occurring every two years at the technical universities of
three Baltic countries according the rotating schedule. The conference language is
English.
Find out more about BALTGRAF on website http://www.baltgraf.org

12/300 The 12th International Conference on Engineering Graphics – BALTGRAF 2013
VENUE
The conference sessions will take place at the University Campus in ground
floor of the building of Faculty of Civil Engineering at Āzenes Street 16/20.
Two suggested hotels are in a walking distance from the conference site and
offer an accommodation for a reasonable price.
Map of the conference site:
BALTGRAF 2013 – The 12th International Conference on Engineering Graphics 13/300
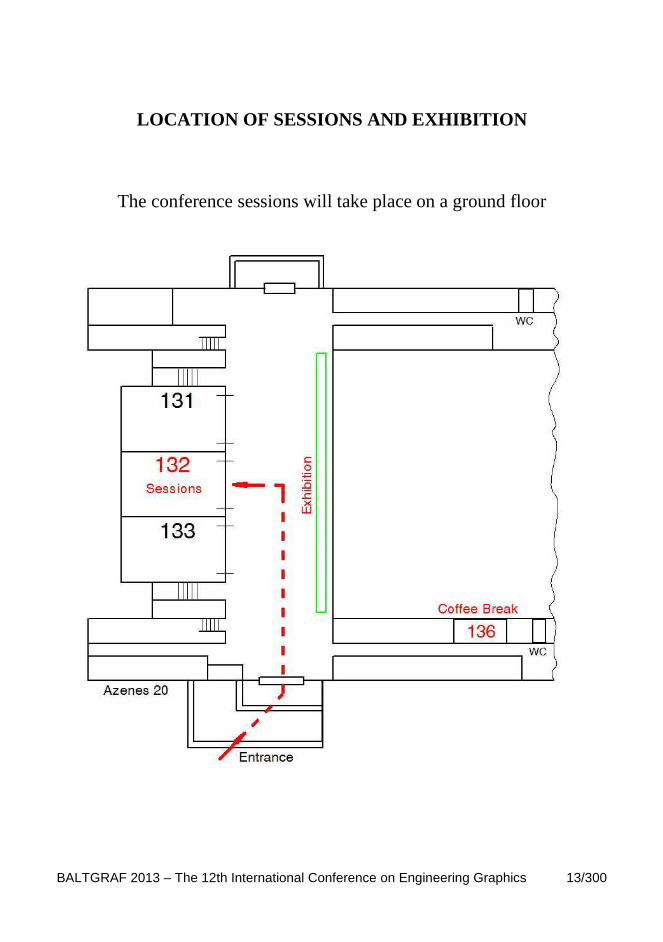
LOCATION OF SESSIONS AND EXHIBITION
The conference sessions will take place on a ground floor

14/300 The 12th International Conference on Engineering Graphics – BALTGRAF 2013
EXIBITION
During the conference an exhibition will be open:
“ZANIS WALDHEIMS’ GEOMETRICAL ABSTRACTION”
“ŽAŅA VALDHEIMA ĢEOMETRISKĀ ABSTRAKCIJA”
The Supplement A of Scientific Proceedings
introduces with the main milestones of the life of
Latvian born artist Zanis Waldheims

BALTGRAF 2013 – The 12th International Conference on Engineering Graphics 15/300
PRELIMINARY CONFERENCE PROGRAM
The 12th
International Conference on
Engineering Graphics BALTGRAF 2013
June 5-7, 2013, Rīga, Latvia
Wednesday, June 5, 2013
Early Bird Reception and Registration
Exhibition
“Zanis Waldheims’ Geometrical Abstraction”
“Žaņa Valdheima ģeometriskā abstrakcija”
17:00
-
19:00
RTU, Faculty of Civil Engineering
Azenes St 16/20 Room 136
16/300 The 12th International Conference on Engineering Graphics – BALTGRAF 2013
Preliminary Program
International Conference on Engineering Graphics BALTGRAF 2013
Thursday, June 6, 2013
Faculty of Civil Engineering, Azenes St 16/20, Room 132
Registration at the Reception Desk, Room 132 8:00
Opening Ceremony
BALTGRAF 2013 Chairman Modris DOBELIS
Welcome Speeches by:
Dean of the Faculty of Civil Engineering Juris SMIRNOVS
BALTGRAF President Daiva MAKUTĖNIENĖ
9:00
Plenary Session, Room 132
Session Chairman Modris DOBELIS
Zanis Waldheims' Geometrical Art Yves JEANSON
9:40
Geometrical Aspects of Restitution and Revitalization of the Wooden
Architectural Structures Renata Anna GÓRSKA
10:00
The Automated System for Learning of Innovative Course in
Descriptive Geometry Vladimir VOLKOV, Olga ILYASOVA, Natalya KAYGORODSEVA
10:20
Digital Product Definition Data Practices Tilmutė PILKAITĖ, Vidmantas NENORTA
10:40
Conic Sections in Logo Forming Irina KUZNETSOVA, Anna BURAVSKA
11:00
Conference Photo Session
Coffee Break
Room 136
11:00
-
- 12:00
BALTGRAF 2013 – The 12th International Conference on Engineering Graphics 17/300
Thursday, June 6, 2013,
Faculty of Civil Engineering, Azenes St 16/20, Room 132
Plenary Session
Session Chairman Renata Anna GORSKA 12:00
BIM Technology Application Efficiency in Architectural Engineering
Studies at Vilnius Gediminas Technical University Tatjana GRIGORJEVA, Birutė JUODAGALVIENĖ,
Eglė TAUTVYDAITĖ
12:00
From Learning Outcomes to the Team of Advisers Ants SOON, Aime RUUS
12:20
Effect of Augmented Reality Technology on Spatial Skills of Students Zoja VEIDE, Veronika STROZEVA
12:40
Architectural Form and Building Material of Suspension and Cable-
Stayed Bridges – Visualization of Geometrical Structure Jolanta TOFIL, Anita PAWLAK-JAKUBOWSKA
13:00
Interactive 3D Mechanical Design Software Nomeda PUODZIUNIENE, Vidmantas NENORTA
13:40
Lunch
Room 136
13:40
-
14:40

18/300 The 12th International Conference on Engineering Graphics – BALTGRAF 2013
Thursday, June 6, 2013,
Faculty of Civil Engineering, Azenes St 16/20, Room 132
Plenary Session
Session Chairman Vidmantas NENORTA 14:40
Assessment of the Engineering Graphic Literacy Skills Modris DOBELIS, Theodore BRANOFF, Imants NULLE
15:30
Combinatorial Methods Forming Objects of Design Iryna KUZNETSOVA, Oktyabrina CHEMAKINA,
Tatyana SHIMANSKAYA
15:45
Perspective View Possibilities Rein MÄGI
Geometrical Education by Using Multimedia Presentation Miodrag NESTOROVIĆ, Aleksandar ČUČAKOVIĆ,
Nataša TEOFILOVIĆ, Biljana JOVIĆ
16:00
Symbols Used to Define a Projection Method and a Cartesian
Coordinate System for a Three-Dimensional Space Antanas VANSEVICIUS
16:20
Coffee Break
Room 136
16:20
-
17:00

BALTGRAF 2013 – The 12th International Conference on Engineering Graphics 19/300
Thursday, June 6, 2013,
Faculty of Civil Engineering, Azenes St 16/20, Room 132
Plenary Session
Session Chairman Olga ILYASOVA 17:00
The Optimization of Geometric Parameters for Mansard Design Jānis AUZUKALNS, Ieva JURĀNE
To Create or to Explode? Rein MÄGI, Heino MÖLDRE 17:30
Optimization of Teaching of Engineering Graphics Subjects in Riga
Technical University Veronika STROZEVA, Zoja VEIDE
17:45
Improvement Concept of Engineering Graphics Course Violeta VILKEVIČ 18:00
Graphical Competence in Engineering Sciences Olaf VRONSKY
18:20
Conference Dinner
(Optional)
Hotel Islande
19:00
-
21:00

20/300 The 12th International Conference on Engineering Graphics – BALTGRAF 2013
Friday, June 7, 2013,
Faculty of Civil Engineering, Azenes St 16/20, Room 132
Plenary Session
Session Chairman Jolanta DZWIERZYNSKA 9:00
Modelling of Shortest Route in the Drawing Algirdas SOKAS
Reconstruction of the Ancient Town of Emder by the Means of a
Computer Model Natalia BUBLOVA, Vasilij KONOVALOV
Engineering Graphics Education as the Foundation of Intercultural
Engineering Communication Harri LILLE, Aime RUUS
9:15
Problems of Motivation of Students to Study Compulsory Subject
“Engineering Graphics” Zoja VEIDE, Veronika STROZHEVA, Modris DOBELIS 9:30
Some Reflections on Teaching Geometry and Engineering Graphics Jolanta DZWIERZYNSKA
10:40
Coffee Break
Room 136
10:40
-
11:40
BALTGRAF 2013 – The 12th International Conference on Engineering Graphics 21/300
Friday, June 7, 2013,
Faculty of Civil Engineering, Azenes St 16/20, Room 132
Plenary Session
Session Chairman Zoja VEIDE 11:40
Automatic Projections in a Few Seconds Konstantinas Stanislovas DANAITIS, Juozapas GRABYS 10:15
Drawbacks of BIM Concept Adoption Modris DOBELIS
Engineering Graphics and Humor Rein MÄGI 11:15
Graphic Investigation of Second Level Surface Intersection Lines Konstantinas Stanislovas DANAITIS, Juozapas GRABYS 11:30
Programmatical Detection Method of Flat Graphical Objects Formed
from Lines Algirdas SOKAS
11:45
Usage of Computer Aided Design Systems in Study Process Birutė JUODAGALVIENĖ, Tatjana GRIGORJEVA
Closing Ceremony 12:30
Lunch
Room 136
12:30
-
13:30

22/300 The 12th International Conference on Engineering Graphics – BALTGRAF 2013
CONTENTS
Conference Organization ...............................................................................................3
Program Committee – the Board of Reviewers .............................................................4
Acknowledgment ......................................................... Error! Bookmark not defined.
Host of the Conference ..................................................................................................7
Chronology of BALTGRAF Presidents ........................................................................8
Preface ...........................................................................................................................9
Chronology of BALTGRAF Conferences ...................................................................10
History .........................................................................................................................11
Venue ...........................................................................................................................12
Location of Sessions and Exhibition ...........................................................................13
Exibition ......................................................................................................................14
Preliminary Conference Program ................................................................................15
Contents .......................................................................................................................22
Author Listing ..............................................................................................................26
The Optimization of Geometric Parameters For Mansard Design .............................27
Jānis AUZUKALNS, Ieva JURĀNE
Reconstruction of the Ancient Town of Emder by the Means
of a Computer Model ...................................................................................................39
Natalia BUBLOVA, Vasilij KONOVALOV
Automatic Projections in a Few Seconds ....................................................................45
Konstantinas Stanislovas DANAITIS, Juozapas GRABYS
Graphic Investigation of Second Level Surface Intersection Lines ............................51
Konstantinas Stanislovas DANAITIS, Juozapas GRABYS
Drawbacks of BIM Concept Adoption ........................................................................57
Modris DOBELIS
BALTGRAF 2013 – The 12th International Conference on Engineering Graphics 23/300
Assessment of the Engineering Graphic Literacy Skills .............................................69
Modris DOBELIS, Theodore BRANOFF, Imants NULLE
Some Reflections on Teaching Geometry and Engineering Graphics ........................81
Jolanta DZWIERZYNSKA
BIM Technology Application Efficiency in Architectural Engineering Studies
at Vilnius Gediminas Technical University .................................................................85
Tatjana GRIGORJEVA, Birutė JUODAGALVIENĖ,
Eglė TAUTVYDAITĖ
Geometrical Aspects of Restitution and Revitalization of the Wooden
Architectural Structures ...............................................................................................95
Renata Anna GÓRSKA
Zanis Waldheims' Geometrical Art ...........................................................................105
Yves JEANSON
Usage of Computer Aided Design Systems in Study Process ..................................113
Birutė JUODAGALVIENĖ, Tatjana GRIGORJEVA
Conic Sections in Logo Forming ...............................................................................121
Irina KUZNETSOVA, Anna BURAVSKA
Combinatorial Methods Forming Objects Of Design ...............................................127
Iryna KUZNETSOVA, Oktyabrina CHEMAKINA,
Tatyana SHIMANSKAYA
Engineering Graphics Education as the Foundation of Intercultural
Engineering Communication .....................................................................................135
Harri LILLE, Aime RUUS
Engineering Graphics and Humor .............................................................................141
Rein MÄGI
Perspective View Possibilities ...................................................................................149
Rein MÄGI
24/300 The 12th International Conference on Engineering Graphics – BALTGRAF 2013
To Create or to Explode? ...........................................................................................157
Rein MÄGI, Heino MÖLDRE
Geometrical Education by Using Multimedia Presentation ......................................163
Miodrag NESTOROVIĆ, Aleksandar ČUČAKOVIĆ,
Nataša TEOFILOVIĆ, Biljana JOVIĆ
Digital Product Definition Data Practices .................................................................171
Tilmutė PILKAITĖ, Vidmantas NENORTA
Interactive 3D Mechanical Design Software .............................................................177
Nomeda PUODZIUNIENE, Vidmantas NENORTA
Modelling of Shortest Route in the Drawing .............................................................185
Algirdas SOKAS
Programmatical Detection Method of Flat Graphical Objects Formed
from Lines ..................................................................................................................193
Algirdas SOKAS
From Learning Outcomes to the Team of Advisers ..................................................199
Ants SOON, Aime RUUS
Optimization of Teaching of Engineering Graphics Subjects
in Riga Technical University .....................................................................................209
Veronika STROZEVA, Zoja VEIDE
Architectural Form and Building Material of Suspension and
Cable-Stayed Bridges – Visualization of Geometrical Structure .............................215
Jolanta TOFIL, Anita PAWLAK-JAKUBOWSKA
Symbols Used to Define a Projection Method and a Cartesian Coordinate
System for a Three-Dimensional Space ...................................................................223
Antanas VANSEVICIUS
Effect of Augmented Reality Technology on Spatial Skills of Students ..................229
Zoja VEIDE, Veronika STROZEVA

BALTGRAF 2013 – The 12th International Conference on Engineering Graphics 25/300
Problems of Motivation of Students to Study Compulsory Subject
“Engineering Graphics” .............................................................................................237
Zoja VEIDE, Veronika STROZHEVA, Modris DOBELIS
Improvement Concept of Engineering Graphics Course ..........................................243
Violeta VILKEVIČ
The Automated System for Learning of Innovative Course
in Descriptive Geometry ............................................................................................249
Vladimir VOLKOV, Olga ILYASOVA, Natalya KAYGORODSEVA
Graphical Competence in Engineering Sciences .......................................................257
Olaf VRONSKY
Supplement A ............................................................................................................265
Zanis Waldheims: Giving Meaning to Abstract Art – a Non Conformist
Approach or the Pathway to Self-Reliance ...............................................................267
Yves JEANSON
Summary Biography of Zanis Waldheims (1909-1993) ..........................................271
Yves JEANSON
Zanis Waldheims Artworks .......................................................................................285
Yves JEANSON
Supplement B .............................................................................................................291
SolidWorks 3D CAD for Students and Education for Rewarding Careers ..............293
26/300 The 12th International Conference on Engineering Graphics – BALTGRAF 2013
AUTHOR LISTING
Auzukalns J., 27
Branoff T., 69
Bublova N., 39
Buravska A., 121
Chemakina O., 127
Čučaković A., 163
Danaitis K. S., 45, 51
Dobelis M., 9, 57, 69, 237
Dzwierzynska J., 81
Górska R. A., 95
Grabys J., 45, 51
Grigorjeva T., 85, 113
Ilyasova O., 249
Jeanson Y., 105, 267, 271, 285
Jović B., 163
Juodagalvienė B., 85, 113
Jurāne I., 27
Kaygorodseva N., 249
Konovalov V., 39
Kuznetsova I., 121, 127
Lille H., 135
Mägi R., 141, 149, 157
Möldre H., 157
Nenorta V., 171, 177
Nestorović M., 163
Nulle I., 69
Pawlak-Jakubowska A., 215
Pilkaitė T., 171
PLM Group, 293
Puodziuniene N., 177
Ruus A., 135, 199
Shimanskaya T., 127
Sokas A., 185, 193
Soon A., 199
Strozeva V., 209, 229, 237
Tautvydaitė E., 85
Teofilović N., 163
Tofil J., 215
Vansevicius A., 223
Veide Z., 209, 229, 237
Vilkevič V., 243
Volkov V., 249
Vronsky O., 257
The 12 th International Conference on Engineering Graphics
BALTGRAF 2013 June 5-7, 2013, Riga, Latvia
27/300
THE OPTIMIZATION OF GEOMETRIC PARAMETERS
FOR MANSARD DESIGN
Jānis AUZUKALNS1, Ieva JURĀNE
2
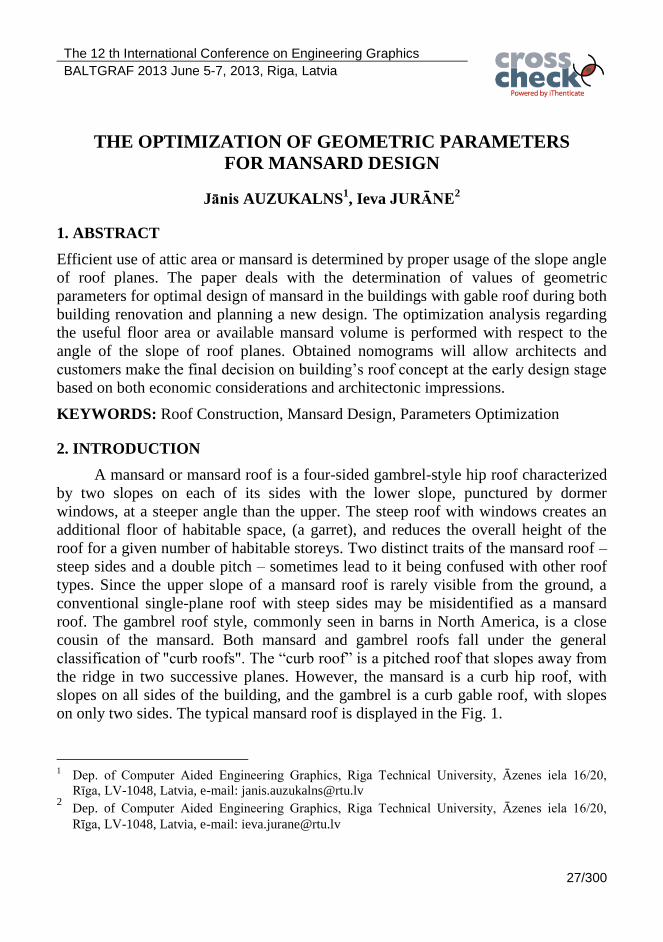
1. ABSTRACT
Efficient use of attic area or mansard is determined by proper usage of the slope angle
of roof planes. The paper deals with the determination of values of geometric
parameters for optimal design of mansard in the buildings with gable roof during both
building renovation and planning a new design. The optimization analysis regarding
the useful floor area or available mansard volume is performed with respect to the
angle of the slope of roof planes. Obtained nomograms will allow architects and
customers make the final decision on building’s roof concept at the early design stage
based on both economic considerations and architectonic impressions.
KEYWORDS: Roof Construction, Mansard Design, Parameters Optimization
2. INTRODUCTION
A mansard or mansard roof is a four-sided gambrel-style hip roof characterized
by two slopes on each of its sides with the lower slope, punctured by dormer
windows, at a steeper angle than the upper. The steep roof with windows creates an
additional floor of habitable space, (a garret), and reduces the overall height of the
roof for a given number of habitable storeys. Two distinct traits of the mansard roof –
steep sides and a double pitch – sometimes lead to it being confused with other roof
types. Since the upper slope of a mansard roof is rarely visible from the ground, a
conventional single-plane roof with steep sides may be misidentified as a mansard
roof. The gambrel roof style, commonly seen in barns in North America, is a close
cousin of the mansard. Both mansard and gambrel roofs fall under the general
classification of "curb roofs". The “curb roof” is a pitched roof that slopes away from
the ridge in two successive planes. However, the mansard is a curb hip roof, with
slopes on all sides of the building, and the gambrel is a curb gable roof, with slopes
on only two sides. The typical mansard roof is displayed in the Fig. 1.
1 Dep. of Computer Aided Engineering Graphics, Riga Technical University, Āzenes iela 16/20,
Rīga, LV-1048, Latvia, e-mail: [email protected] 2 Dep. of Computer Aided Engineering Graphics, Riga Technical University, Āzenes iela 16/20,
Rīga, LV-1048, Latvia, e-mail: [email protected]

28/300 The 12th International Conference on Engineering Graphics – BALTGRAF 2013
Fig. 1. The typical mansard roof
The curb is a horizontal heavy timber directly under the intersection of the two
roof surfaces. A significant difference between the two, for snow loading and water
drainage, is that, when seen from above, Gambrel roofs culminate in a long, sharp
point at the main roof beam, whereas Mansard roof always form a flat roof. Mansard
in Europe also means the attic (garret) space itself, not just the roof shape and is often
used in Europe and in Latvia to mean a gambrel roof.
Article 1.19 of the Latvian construction regulation LBN 211-98 “High-rise
residential apartment buildings” defines a “mansard floor” – a floor (a finished space)
built between the separating constructions of the roof, outer walls and the ceiling of
the upper floor (in the attic), which is to fulfil a certain practical purpose.
The Mansard style makes maximum use of the interior space of the attic and
offers a simple way to add one or more storeys to an existing (or new) building
without necessarily requiring any masonry (Fig. 2). Often the decorative potential of
the Mansard is exploited through the use of convex or concave curvature and with
elaborate dormer window surrounds.
The earliest known example of a Mansard roof is credited to Pierre Lescot on
part of the Louvre built around 1550. The style was popularized in France by
architect François Mansart (1598-1666). Although he was not the inventor of the
style, his extensive and prominent use of it in his designs gave rise to the term
"mansard roof", an adulteration of his name. The mansard roof became popular once
again during Haussmann's renovation of Paris beginning in the 1850s, in an
architectural movement known as "Second Empire style".

BALTGRAF 2013 – The 12th International Conference on Engineering Graphics 29/300
Fig. 2. Four storeys in the attic Fig. 3. Art Nouveau building in Riga, 1909
The height of a city building up to its eaves was usually standardized; therefore,
a mansard-type roof allowed obtaining extra space without violating the construction
regulations. In Latvia mansard roofs were popular among estate buildings and
residential buildings, and were even used for constructing cowsheds. Various kinds of
mansard roofs were often applied in Art Nouveau buildings (Fig. 3). One may
observe mansard roof types based on a range of parameters, including different slope
angles and proportions. Not only do roof parameters differ among several buildings,
but also the proportions of roof parts of a single roof vary. Even the breaking point of
the roof is individual for every building (Fig. 4). The breaking point may be selected
according to the specific use of each building; however, it is also possible to establish
the most efficient parameters for a mansard roof, which will be further discussed in
the paper. While constructing a low-rise building, the type and geometric parameters
of its roof are selected according to the characteristics of the tiling, local climate,
purpose of the spaces located beneath the roof and the architectonic demands of the
building [1-4].
The most efficient selection of geometric parameters for a two-slope roof is
discussed in the publication [6].

30/300 The 12th International Conference on Engineering Graphics – BALTGRAF 2013
Fig. 4. The slopes of roof parts of a single roof vary
3. CHOOSING THE ENCLOSING OUTLINE OF THE CURB (MANSARD)
ROOF
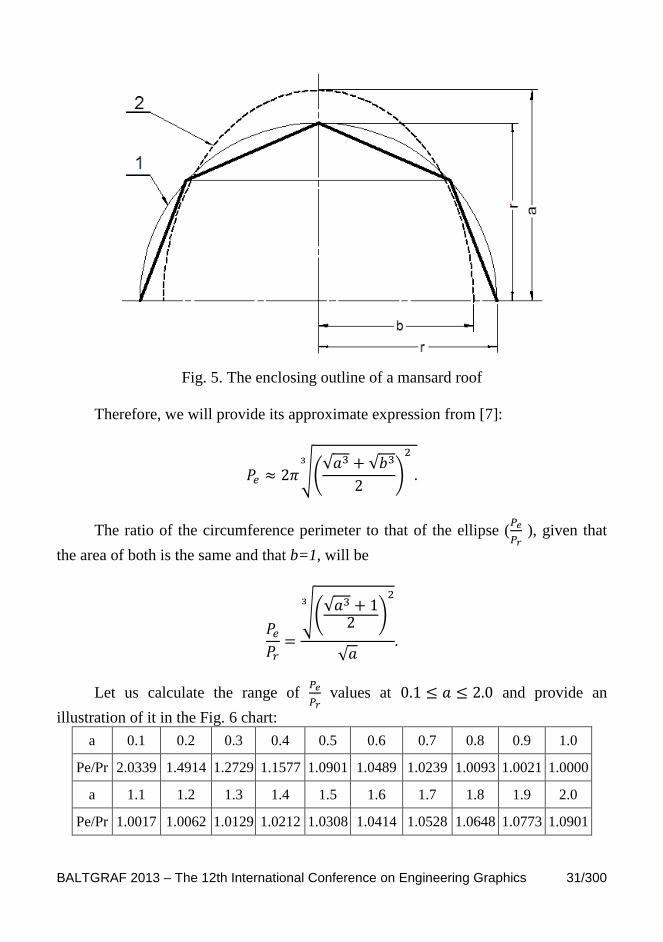
To determine the enclosing outline of a mansard roof (Fig. 5), let us consider a
circumference (1), comparing its perimeter with that of an ellipse (2), given that the
area of both is the same ( ), where
the area of the circumference is
and the area of the ellipse is
Thus, the perimeter of the circumference will be
√ (1)
As the parametric equation of an ellipse is
,
,
the perimeter of the ellipse will be
∫ √
.
As it may be observed, the perimeter of the ellipse is expressed in terms of
elliptic integrals which, in turn, cannot be expressed in terms of elementary functions.
BALTGRAF 2013 – The 12th International Conference on Engineering Graphics 31/300
Fig. 5. The enclosing outline of a mansard roof
Therefore, we will provide its approximate expression from [7]:
√(√ √
)
The ratio of the circumference perimeter to that of the ellipse (
), given that
the area of both is the same and that b=1, will be
√(√
)
√
Let us calculate the range of
values at and provide an
illustration of it in the Fig. 6 chart:
a 0.1 0.2 0.3 0.4 0.5 0.6 0.7 0.8 0.9 1.0
Pe/Pr 2.0339 1.4914 1.2729 1.1577 1.0901 1.0489 1.0239 1.0093 1.0021 1.0000
a 1.1 1.2 1.3 1.4 1.5 1.6 1.7 1.8 1.9 2.0
Pe/Pr 1.0017 1.0062 1.0129 1.0212 1.0308 1.0414 1.0528 1.0648 1.0773 1.0901

32/300 The 12th International Conference on Engineering Graphics – BALTGRAF 2013
Fig. 6. The dependency of the
ratio on the dilation of the ellipse
As it may be seen from the chart, the minimum of the
function is at a=b=1.
Thus, in accordance with the above calculations, the optimum enclosing outline for a
mansard roof is a circumference.
4. OPTIMIZATION OF ROOF DESIGN
To rationally construct a mansard, it is essential to choose the right place for the
break of the roof, as well as the right slope length and angle. In order to do so, we
shall first determine the main geometric parameters of a mansard as illustrated in
Fig. 7.
As is may be gathered from the mansard calculation scheme:
and
Keeping this in mind, the values of the roof slopes may be obtained as follows:
√
√
BALTGRAF 2013 – The 12th International Conference on Engineering Graphics 33/300
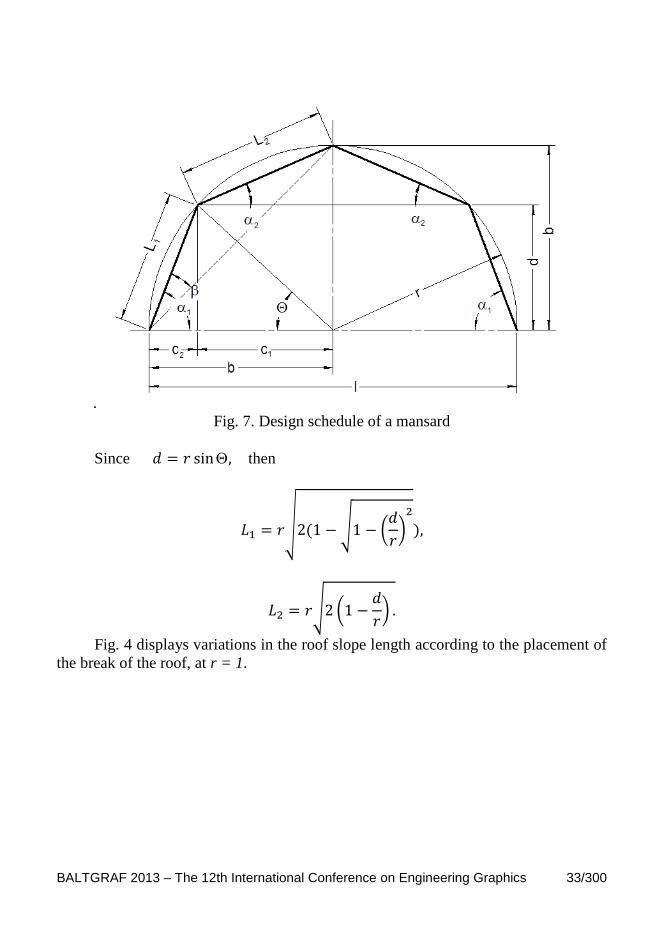
.
Fig. 7. Design schedule of a mansard
Since then
√ √ (
)
√ (
)
Fig. 4 displays variations in the roof slope length according to the placement of
the break of the roof, at r = 1.

34/300 The 12th International Conference on Engineering Graphics – BALTGRAF 2013
Fig. 8. Lengths of the mansard roof slopes
Fig. 9 displays variations in the roof slope angles according to the placement
of the break of the roof, at r = 1.
Fig. 9. Angles of the mansard roof slopes
BALTGRAF 2013 – The 12th International Conference on Engineering Graphics 35/300
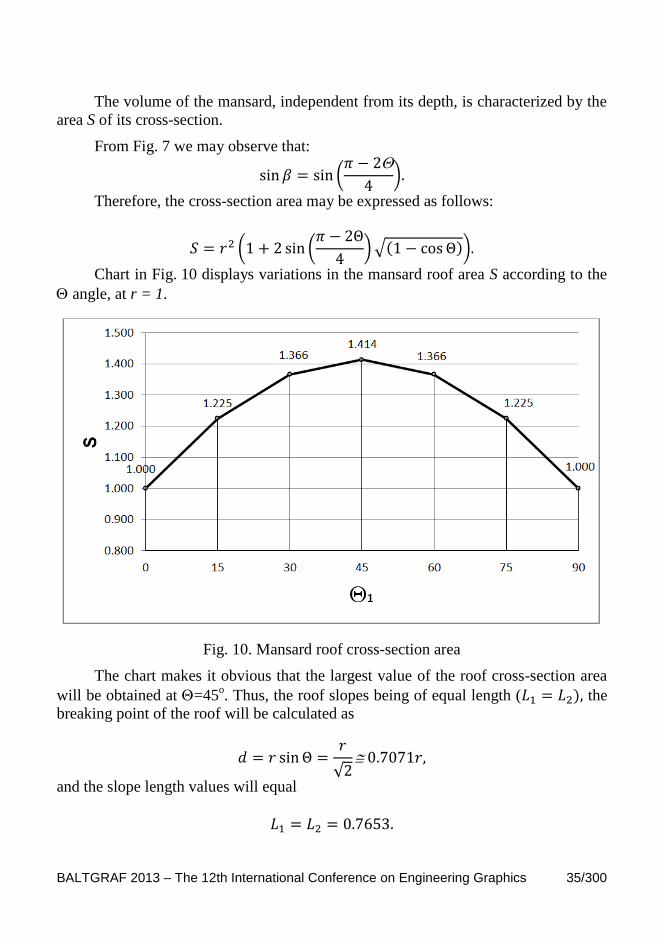
The volume of the mansard, independent from its depth, is characterized by the
area S of its cross-section.
From Fig. 7 we may observe that:
(
)
Therefore, the cross-section area may be expressed as follows:
( (
)√ )
Chart in Fig. 10 displays variations in the mansard roof area S according to the
angle, at r = 1.
Fig. 10. Mansard roof cross-section area
The chart makes it obvious that the largest value of the roof cross-section area
will be obtained at =45o. Thus, the roof slopes being of equal length ( the
breaking point of the roof will be calculated as
√
and the slope length values will equal
36/300 The 12th International Conference on Engineering Graphics – BALTGRAF 2013
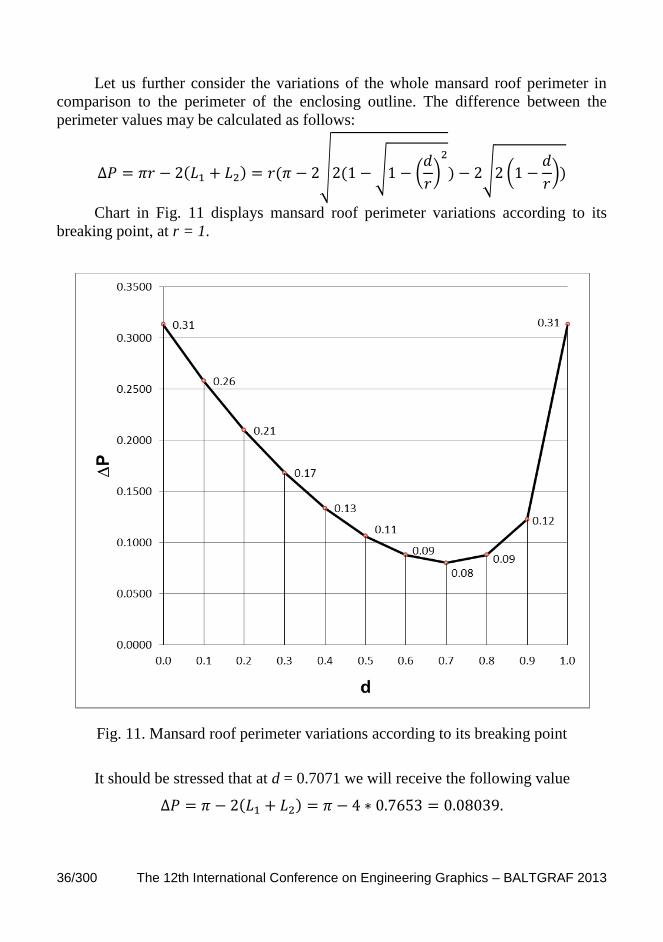
Let us further consider the variations of the whole mansard roof perimeter in
comparison to the perimeter of the enclosing outline. The difference between the
perimeter values may be calculated as follows:
√ √ (
)
√ (
)
Chart in Fig. 11 displays mansard roof perimeter variations according to its
breaking point, at r = 1.
Fig. 11. Mansard roof perimeter variations according to its breaking point
It should be stressed that at d = 0.7071 we will receive the following value

BALTGRAF 2013 – The 12th International Conference on Engineering Graphics 37/300
To conclude, it must be said that an optimized mansard, be it with or without a
breaking point, may be installed even when renovating an already constructed
building [7-9].
5. CONCLUSIONS
1. It has been established that the most efficient enclosing outline of the mansard
roof is a circumference.
2. The most efficient breaking point of the roof is located at 0.7071 of the roof
height.
3. With the breaking point in its most efficient location, the roof slopes are of
equal length.
4. The greatest value of the roof cross-section area will be obtained at the
breaking point orientation angle constituting 45 degrees.
5. The designed method provides an opportunity to determine the length and
angle of roof slopes according to the chosen geometric parameters of the
mansard while designing its roof.
6. REFERENCES
1. Arhitekturnie konstrukcii. Ed. Kazbek-Kaziev Z.A. 1989. Moscow: Visshaja
shkola. -342 pp. (in Russian).
2. Biršs J., Vanags, L. Ēkas jumts un tā konstrukcijas elementi. Available from
Internet: http://www.ideju fabrika.lv/padomi/1/jumti_ekas_jumt_konstr.pdf.
2009. (in Latvian). [access Apr 21, 2009]. (in Latvian).
3. Valtere J. 2009. Mansarda izbūve un iekārtošana. [access Apr 21, 2009].
Available from Internet. (in Latvian).
http: //www.maja.lv.lv/index.php?n=506&a=782. (in Latvian).
4. Michael Roberts & Associates, Building Terms: "Mansard".
5. Mansard roof. Available from Internet: http://en.wikipedia.org/wiki/Mansard.
[access Apr 21, 2009].
6. Auzukalns J., Dobelis M. The Optimization of Geometric parameters for
Mansard design. Engineering Graphics Baltgraf-10. Proceedings of the Tenth
International Conference, Vilnius, Lithuania, June 4-5, 2009, p. 1-6.
7. Elipse. Available from Internet: http://lv.wikipedia.org/wiki/Elipse.
8. Dictionary of Architecture & Construction, C. M. Harris.
9. Noviks J. Jumti (Pirtis). 2009. [access Apr 21, 2009]. Available from Internet:
http://saimnieks.lv/Nekustamais_ipasums/Buvnieciba/1229. (in Latvian).
10. Auzukalns, J. V. K voprosu o vibore optimalnoi paschetnoi shemi mansardi,
Projektirovanie i optimizacija konstrukcij inzhenernih sooruzhenij. Riga: Riga
Tehnical University, 1990. (in Russian).

38/300 The 12th International Conference on Engineering Graphics – BALTGRAF 2013
11. Noteikumi par Latvijas būvnormatīvu LBN 211-98 "Daudzstāvu
daudzdzīvokļu dzīvojamie nami" Rīgā. 1998. gada 20. oktobrī. prot. Nr. 57, 1.
(in Latvian).
12. Auzukalns J. 2009. Cīņa pret stereotipiem. [access Apr 21, 2009].
Available from Internet:
http://www.building.lv/readnews_print.php?news_id=101915. (in Latvian).
13. http://www.jugendstils.riga.lv/index.php?lang=lat&p=3&pp=0&id=9. (in
Latvian).
14. The Carpentry Way. http://thecarpentryway.blogspot.com/2010/03/french-
connection-9.html.
The 12 th International Conference on Engineering Graphics
BALTGRAF 2013 June 5-7, 2013, Riga, Latvia
39/300
RECONSTRUCTION OF THE ANCIENT TOWN OF EMDER
BY THE MEANS OF A COMPUTER MODEL
Natalia BUBLOVA1, Vasilij KONOVALOV
2
1. ABSTRACT
Usage of computer technology – the modern and adequate tool for visualisation of
partially lost historical objects and reconstruction of ancient monuments. Digital
methods can be applied multimedia presentations, including animated video of
architectural monuments. So there is a need of different approaches, which is
especially important for the study and restoring of cultural monuments.
KEYWORDS: Reconstruction, Computer Model, Town of Emder
2. INTRODUCTION
One of the goals of the given article is to attract attention of computer graphics
and information technologies experts to the virtual resources creation of cultural
heritage which will be accessible in the sphere of education by the means of the
Internet network.
Usage of computer technology – the modern and adequate tool for visualisation
of partially lost historical objects and reconstruction of ancient monuments. Digital
methods can be applied by multimedia presentations, including animated video of
architectural monuments. Therefore, there is a need of different approaches, which is
especially important for the study and restoring of cultural monuments.
The reconstructed virtual three-dimensional models give an opportunity to see
not only architectural constructions, but household items of historical and cultural
heritage as well, that were reconstructed on archaeological excavations fragments.
Thus, it is possible to popularize and study objects, which are limited in access in
order to avoid their damage or destruction.
3. BASIC INFORMATION
Once upon a time there was a beautiful town of Emder on the banks of the river
Emder. The ancient town of Emder is a historical monument of federal value of the
dying out nation Khanty and Mansi. The history and culture of the Khanty-Mansiysk
Autonomous Okrug is closely connected with history and culture of Obskie Ugry,
1 St. Petersburg State University of Film and Television, Russian Federation, 13, Pravda Street,
St. Petersburg, 191119, e-mail: [email protected] 2 St. Petersburg State University of Film and Television, Russian Federation, 13, Pravda Street,
St. Petersburg, 191119, e-mail: [email protected]
40/300 The 12th International Conference on Engineering Graphics – BALTGRAF 2013
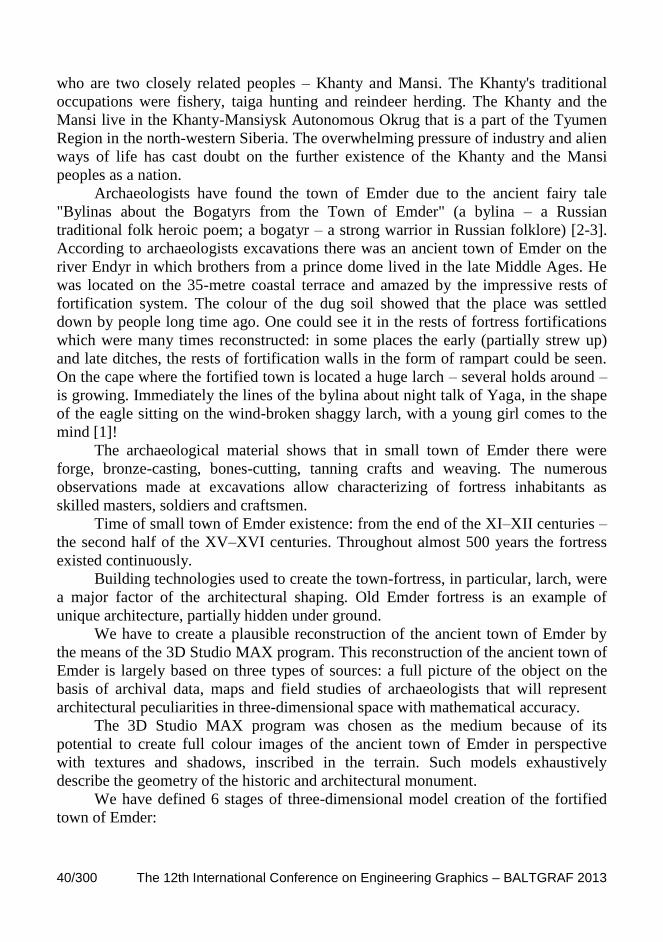
who are two closely related peoples – Khanty and Mansi. The Khanty's traditional
occupations were fishery, taiga hunting and reindeer herding. The Khanty and the
Mansi live in the Khanty-Mansiysk Autonomous Okrug that is a part of the Tyumen
Region in the north-western Siberia. The overwhelming pressure of industry and alien
ways of life has cast doubt on the further existence of the Khanty and the Mansi
peoples as a nation.
Archaeologists have found the town of Emder due to the ancient fairy tale
"Bylinas about the Bogatyrs from the Town of Emder" (a bylina – a Russian
traditional folk heroic poem; a bogatyr – a strong warrior in Russian folklore) [2-3].
According to archaeologists excavations there was an ancient town of Emder on the
river Endyr in which brothers from a prince dome lived in the late Middle Ages. He
was located on the 35-metre coastal terrace and amazed by the impressive rests of
fortification system. The colour of the dug soil showed that the place was settled
down by people long time ago. One could see it in the rests of fortress fortifications
which were many times reconstructed: in some places the early (partially strew up)
and late ditches, the rests of fortification walls in the form of rampart could be seen.
On the cape where the fortified town is located a huge larch – several holds around –
is growing. Immediately the lines of the bylina about night talk of Yaga, in the shape
of the eagle sitting on the wind-broken shaggy larch, with a young girl comes to the
mind [1]!
The archaeological material shows that in small town of Emder there were
forge, bronze-casting, bones-cutting, tanning crafts and weaving. The numerous
observations made at excavations allow characterizing of fortress inhabitants as
skilled masters, soldiers and craftsmen.
Time of small town of Emder existence: from the end of the XI–XII centuries –
the second half of the XV–XVI centuries. Throughout almost 500 years the fortress
existed continuously.
Building technologies used to create the town-fortress, in particular, larch, were
a major factor of the architectural shaping. Old Emder fortress is an example of
unique architecture, partially hidden under ground.
We have to create a plausible reconstruction of the ancient town of Emder by
the means of the 3D Studio MAX program. This reconstruction of the ancient town of
Emder is largely based on three types of sources: a full picture of the object on the
basis of archival data, maps and field studies of archaeologists that will represent
architectural peculiarities in three-dimensional space with mathematical accuracy.
The 3D Studio MAX program was chosen as the medium because of its
potential to create full colour images of the ancient town of Emder in perspective
with textures and shadows, inscribed in the terrain. Such models exhaustively
describe the geometry of the historic and architectural monument.
We have defined 6 stages of three-dimensional model creation of the fortified
town of Emder:

BALTGRAF 2013 – The 12th International Conference on Engineering Graphics 41/300
1. Gathering and processing of the information necessary for creation of initial
drawings and 3D – objects modelling.
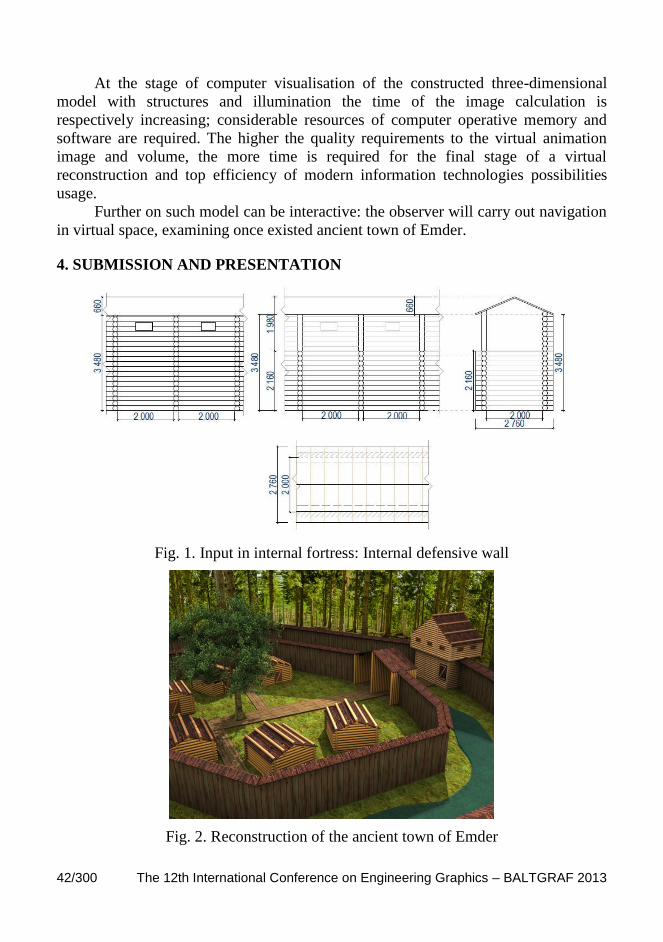
2. Creation of 2D-graphics of separate elements of small town, scheme of
structures arrangement, ditches and fortress towers in the AutoCAD program
(Fig. 1).
3. Construction of three-dimensional model of the object and adjoining
territories by the means of three-dimensional graphics.
4. Selection of materials and texturing of simulated 3D – objects.
5. Illumination and visualisation of 3D – objects and landscape (Fig. 2).
6. The digital rendering of separate images and animation video series.
At the initial stage of reconstruction of the town of Emder we had collected as
much as possible information and analysed it using different kinds of information
databases: considerable quantity of the text and cartographical information, the
description of archaeological excavations, photos, scientific historical researches,
museum exhibits and even oral folklore. There are about 30 ethnographic and local
lore museums in our Okrug. To our opinion out-door museums are one of the
interesting forms of the museum business. The necessary material can be obtained
from web pages of ethnography museums as well.
At the following preparatory stage, connected with designing of 3D-model of
the town of Emder, 2D-drawings on the basis of the given archaeological excavations
were created in the AutoCAD program. The AutoCAD Program has been chosen not
occasionally, since it allows importing of drawings to the 3D Studio MAX three-
dimensional modelling add-on. At the given stage the main goal was to define and
preserve proportions of objects in the fortress-town and follow its basic style features
of constructions. On the basis of the program drawings of Emdera town map, taking
into account all features of its difficult lay-out (ditches, rampart, banks, vales,
buildings etc.), are created. The first necessary thing is to analyse research job, and to
define the area of studied object. Thus the foreground of our project is the plan of the
town territory in the form of the radiuses shown as a contour line. The main
complexity of the work was impossibility to define precisely the height of
constructions from the documents we had in our disposal. The height was defined
under the anthropological description of the Khanty people which are 1.5 m high in
average. Presence in the town of horses’ remains and harnesses has indicated that the
entrance into the main tower should correspond to the horseman height.
Structures, landscape, objects, trees, firmament, sources of illumination and
animation create a real atmosphere around the recreated historical object and give
possibility of its viewing from different positions. The objects of heritage presented in
the 3d-graphics, allow almost touch an exhibit, and for few seconds to "be
transferred" from one century to another. The 3D-reconstruction and animation
replace stage of physical prototyping of an object and virtually represent a simulated
object with composite-visual and landscape analysis of a territory.
42/300 The 12th International Conference on Engineering Graphics – BALTGRAF 2013
At the stage of computer visualisation of the constructed three-dimensional
model with structures and illumination the time of the image calculation is
respectively increasing; considerable resources of computer operative memory and
software are required. The higher the quality requirements to the virtual animation
image and volume, the more time is required for the final stage of a virtual
reconstruction and top efficiency of modern information technologies possibilities
usage.
Further on such model can be interactive: the observer will carry out navigation
in virtual space, examining once existed ancient town of Emder.
4. SUBMISSION AND PRESENTATION
Fig. 1. Input in internal fortress: Internal defensive wall
Fig. 2. Reconstruction of the ancient town of Emder
BALTGRAF 2013 – The 12th International Conference on Engineering Graphics 43/300
5. CONCLUSIONS
Computer 3D-modelling and animation of virtual reality promotes cultural
heritage popularisation, and brings together archaeology with education and
entertainment businesses. The considered method is a modern source of scientific
research and creation of three-dimensional models base of historical and cultural
heritage objects of the Khanty and Mansy peoples in the West Siberia.
Thus, the virtual reconstruction of architectural monuments should be based on
optimum combination of new information technologies possibilities, creative and art
thinking and understanding. Traditional graphic methods without use of computer do
not provide the same results. The results of the study could be used to develop
practical recommendations for the conservation and reconstruction of the most
interesting historical and architectural monuments.
6. REFERENCES
1. Bylinas about the Bogatyrs from the Town of Emder. Moscow: Interbook
Business, 2005. -64 pp. (bilingual in Russian and English).
2. Encyclopedia Uralic mythologies. T. 3. Khanty mythology. Tomsk Univ.
University Press, 2000. (Contributors: V. M. Kulemzin, Timothy Moldanov,
Tatiana Moldanova). -305 pp.
3. Lukin N. V. Khanty from Vasyugan'e to Pole. Sources on ethnography.
Vol. 2. Average Ob. Wah. Book 1. Tomsk Univ. University Press,
2005. -352 pp., Book 2. Tomsk, Yekaterinburg: Univ. University Press,
Publishing House “Basco”. 2006. -256 pp.

44/300 The 12th International Conference on Engineering Graphics – BALTGRAF 2013
The 12 th International Conference on Engineering Graphics
BALTGRAF 2013 June 5-7, 2013, Riga, Latvia
45/300
AUTOMATIC PROJECTIONS IN A FEW SECONDS
Konstantinas Stanislovas DANAITIS1, Juozapas GRABYS
2
ABSTRACT
The article compares AutoCAD commands Viewbase and Solview, intended for
creating automatic projections. Both commands allow presenting a complex drawing
of the same model. It can be concluded that when solving an adequate task, Viewbase
allows completing it in ten times less actions than Solview. The possibilities of the
command Viewbase are analysed.
KEYWORDS: Viewbase, Solview, Automatic Projections, Complex Drawing,
Possibilities
INTRODUCTION
The main practical tool of our computer graphics teachers is AutoCAD.
Therefore, knowledge and practical use of the application provides not only the
comfort of freedom in an auditorium of students, but also the possibility to render the
original ideas graphically, just like acrobatic manoeuvres by the pilots. Apparently,
doing the manoeuvres is determined not as much by practical knowledge as by the
software instruments and the algorithms of their use created by the user. The users are
sometimes irritated by the versions of AutoCAD changing every year. One grows
accustomed to the tools and a year later they are radically changed. An example could
be the visualisation tool Render of recent versions of AutoCAD. It is not a reproach
to the programme. It is just the policy of Autodesk: every year presenting a new and
improved commercial programme, which is sometimes successful and sometimes not.
It forces the user to improve.
One should remember the appearance of paper sheets Layout in AutoCAD
2000 version. It was like a small revolution in presenting a drawing or an advertising
task for printing. It may be compared to the appearance of sliced bread and teabags.
When observing the new versions of AutoCAD, new and modified tools are
constantly appearing, which could be considered revolutionary. Therefore, we would
like to draw the attention of the colleagues in the conference to the new command
Viewbase in AutoCAD.
1 Vilnius Gediminas Technical University, [email protected]
2 Vilnius Gediminas Technical University, [email protected]

46/300 The 12th International Conference on Engineering Graphics – BALTGRAF 2013
COMMANDS VIEWBASE AND SOLVIEW
If we take a look at the study programme modules of Computer Graphics, a
large part of them is occupied by creating automatic projections, cross-sections and
intersections of the models. In some modules it is done manually, just a computer
with AutoCAD is used instead of a pencil. Most often automatic projections are
created using the commands Solprof, Solview, and Soldraw.
Let us compare the creation of a complex drawing in terms of the complexity of
use and time taken using the commands Viewbase and Solview. To make it objective,
let us take a look at the protocols of creating a complex drawing by the commands
Viewbase and Solview below (Fig. 1 and 2).
Complex drawing protocol created using the command Viewbase Type = Base and Projected Style = Wireframe with hidden edges Scale = 1:1
Specify location of base view or
[Type/Representation/Orientation/STyle/SCale/Visibility] <Type>: Select option [Representation/Orientation/STyle/SCale/Visibility/Move/eXit] <eXit>:
Specify location of projected view or <eXit>:
Specify location of projected view or [Undo/eXit] <eXit>: Specify location of projected view or [Undo/eXit] <eXit>:
Specify location of projected view or [Undo/eXit] <eXit>:
Base and 3 projected view(s) created successfully.
Fig. 1. Complex drawing created using the command Viewbase
In order to create a complex drawing using the command Viewbase, the user
must perform the following actions:
- indicate the location of the basic projection – Enter;
- indicate the locations of other three projections – Enter.
Complex drawing protocol created using the command Solview.

BALTGRAF 2013 – The 12th International Conference on Engineering Graphics 47/300
Command: SOLVIEW
Enter an option [Ucs/Ortho/Auxiliary/Section]: u
Enter an option [Named/World/?/Current] <Current>: Enter view scale <1>:
Specify view center:
Specify view center <specify viewport>: Specify first corner of viewport:
Specify opposite corner of viewport:
Enter view name: H
Enter an option [Ucs/Ortho/Auxiliary/Section]: o
Specify side of viewport to project:
Specify view center: Specify view center <specify viewport>:
Specify first corner of viewport:
Specify opposite corner of viewport:
Enter view name: F
Enter an option [Ucs/Ortho/Auxiliary/Section]: o
Specify side of viewport to project: Specify view center:
Specify view center <specify viewport>:
Specify first corner of viewport: Specify opposite corner of viewport:
Enter view name: P
Enter an option [Ucs/Ortho/Auxiliary/Section]: Command: SOLDRAW
Select viewports to draw..
Select objects: 1 found Select objects: 1 found, 2 total
Select objects: 1 found, 3 total
Select objects: One solid selected.
Command: *Cancel*
Command: <Switching to: Model> Regenerating model – caching viewports.
Command: _ucs
Current ucs name: *WORLD* Specify origin of UCS or [Face/NAmed/OBject/Previous/View/World/X/Y/Z/ZAxis]
<World>: _v
Command: *Cancel* Command: <Switching to: Layout1>
Restoring cached viewports – Regenerating layout.
Command: SOLVIEW Enter an option [Ucs/Ortho/Auxiliary/Section]: u
Enter an option [Named/World/?/Current] <Current>:
Enter view scale <1>: Specify view center:
Specify view center <specify viewport>:
Specify first corner of viewport: Specify opposite corner of viewport:
Enter view name: W
Enter an option [Ucs/Ortho/Auxiliary/Section]: Command: SOLDRAW
Select viewports to draw.. Select objects: 1 found
Select objects:
One solid selected. Command:
** STRETCH **
Specify stretch point or [Base point/Copy/Undo/eXit]: Command:
** STRETCH **
Specify stretch point or [Base point/Copy/Undo/eXit]: Command: *Cancel*

48/300 The 12th International Conference on Engineering Graphics – BALTGRAF 2013
Command: Specify opposite corner or [Fence/WPolygon/CPolygon]: *Cancel*
Command: _.MSPACE
Command: '_zoom Specify corner of window, enter a scale factor (nX or nXP), or
[All/Center/Dynamic/Extents/Previous/Scale/Window/Object] <real time>: _all
Regenerating model. Command: _CANNOSCALE
Enter new value for CANNOSCALE, or . for none <"1:1">: 1:1
Command: _.PSPACE Command: '_Layer
Command: '_LayerClose
Command: '_Layer Command: '_LayerClose
Command: '_Layer
Fig. 2. Complex drawing created using the command Solview
In order to create a complex drawing using the command Solview the user must
perform the following actions:
- perform the actions of Ucs dialogue (image from above);
- perform the actions of Ortho dialogue (image from the front);
- perform the actions of Ortho dialogue (image from the left) – Enter;
- change the coordinates to the plane of the screen in the space of the model;
- perform the actions of Ortho dialogue (isometric) – Enter;
- perform the actions of Soldraw dialogue – Enter;
- widen the lines in Vis layers;
- insert the dotted line in Hid layers;
- deactivate the Viewports layer.
As seen above, to obtain the result by the command Viewbase we must make
four mouse clicks and press Enter twice (Fig. 1) and automatic projections are
BALTGRAF 2013 – The 12th International Conference on Engineering Graphics 49/300
created in a few seconds. Meanwhile to obtain the same result using the command
Solview (Fig. 2), one must perform around 60 conscious actions. Therefore, when
solving an adequate task, Viewbase allows completing it in ten times less actions
than Solview. Isn’t it a revolution?
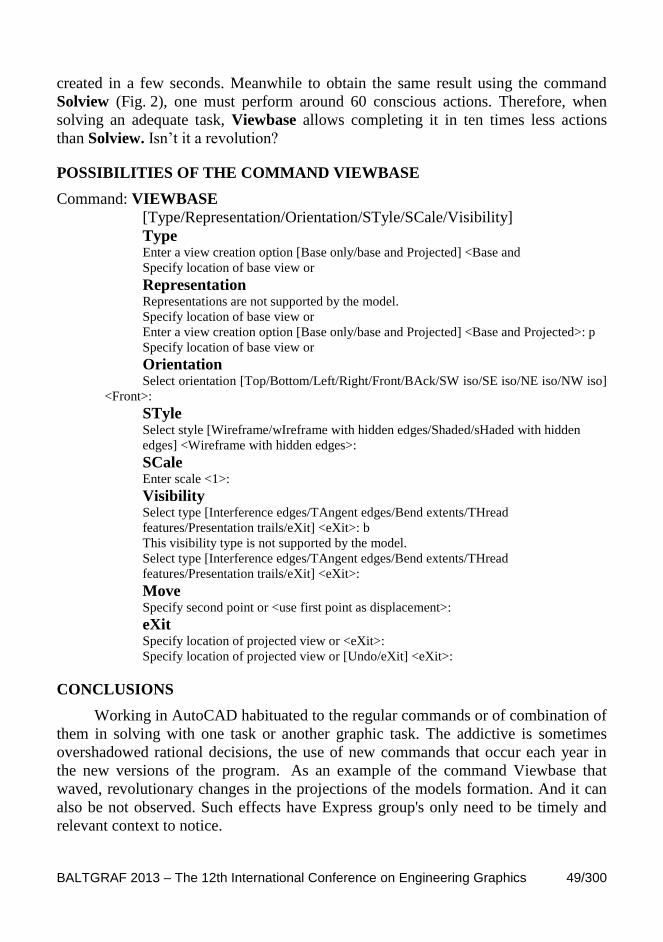
POSSIBILITIES OF THE COMMAND VIEWBASE
Command: VIEWBASE
[Type/Representation/Orientation/STyle/SCale/Visibility]
Type Enter a view creation option [Base only/base and Projected] <Base and
Specify location of base view or
Representation Representations are not supported by the model.
Specify location of base view or
Enter a view creation option [Base only/base and Projected] <Base and Projected>: p
Specify location of base view or
Orientation Select orientation [Top/Bottom/Left/Right/Front/BAck/SW iso/SE iso/NE iso/NW iso]
<Front>:
STyle Select style [Wireframe/wIreframe with hidden edges/Shaded/sHaded with hidden
edges] <Wireframe with hidden edges>:
SCale Enter scale <1>:
Visibility Select type [Interference edges/TAngent edges/Bend extents/THread
features/Presentation trails/eXit] <eXit>: b
This visibility type is not supported by the model.
Select type [Interference edges/TAngent edges/Bend extents/THread
features/Presentation trails/eXit] <eXit>:
Move Specify second point or <use first point as displacement>:
eXit Specify location of projected view or <eXit>:
Specify location of projected view or [Undo/eXit] <eXit>:
CONCLUSIONS
Working in AutoCAD habituated to the regular commands or of combination of
them in solving with one task or another graphic task. The addictive is sometimes
overshadowed rational decisions, the use of new commands that occur each year in
the new versions of the program. As an example of the command Viewbase that
waved, revolutionary changes in the projections of the models formation. And it can
also be not observed. Such effects have Express group's only need to be timely and
relevant context to notice.

50/300 The 12th International Conference on Engineering Graphics – BALTGRAF 2013
REFERENCES
1. V. Sinkevičius AutoCAD 2009-2010 pradmenys [Basics of AutoCAD 2009–
2010], Smaltija, Kaunas 2010. (in Lithuanian).
2. http://www.we-r-here.com./cad/videos/viewbase/viewbase.htm.
3. http://usa.autodesk.com.
The 12 th International Conference on Engineering Graphics
BALTGRAF 2013 June 5-7, 2013, Riga, Latvia
51/300
GRAPHIC INVESTIGATION OF SECOND LEVEL SURFACE
INTERSECTION LINES
Konstantinas Stanislovas DANAITIS1, Juozapas GRABYS
2
1. ABSTRACT
The article deals with the surfaces of AutoCAD second level solid objects and a
graphic investigation of their intersection lines is carried out. A graphical form of
surface intersection line is presented, which is recommended as a control task for
homework. It was concluded that the preparation and implementation of such tasks
develops the practical skills of a student in using 2D and 3D computer projection
technologies an d also stimulates the learning of the basics of drawing geometry.
KEYWORDS: Surface Intersection Lines, 2D and 3D Computer Programming
Technology, Projections, Tasks
2. INTRODUCTION
The widely used 3D design technology allows solving drawing positional tasks
of geometry. The basis is the creation of a geometrical model and afterwards,
geometrical modelling operations are performed using a computer: finding
intersection lines, cross-sections and intersections, projections, etc.
Complicated tasks solved during the course of drawing geometry are often
intended for mastering the detailed method of drawing geometry and do not have
much practical significance. Therefore, these tasks are simply solved using 2D and
3D methods of computer technology. This reflects a well-known methodological
problem characteristic to the use of computer technology: the use of computer
technology is rational due to fast and precise obtaining of results, but at the same time
the user must fine secret, beautiful and interesting solution algorithms.
3. CONTENTS OF GRAPHIC INVESTIGATION
We have chosen the surfaces of a cone and cylinder as an example for second
level surface intersection lines graphic investigation. First, the models of both objects
are created using the Modelling tools. In order to obtain the intersection lines of the
surfaces of two objects, Union logical operation is performed. Then the problem is
presenting the image of intersection of two objects visually. There are several
1 Vilnius Gediminas Technical University, e:mail: [email protected]
2 Vilnius Gediminas Technical University, e:mail: [email protected]
52/300 The 12th International Conference on Engineering Graphics – BALTGRAF 2013
options. First, carcass orthogonal images of the objects are rendered in different
windows, where the maximum visuality is obtained by changing the types and
colours of invisible lines. In order to retain the projection relation of the images, the
command Mvsetup is used. Obtaining the projections using the commands Solprof
or Solview would be a little more complicated. Using this method, the visuality of the
projections is easier obtained by changing the colour and type of lines on different
levels.
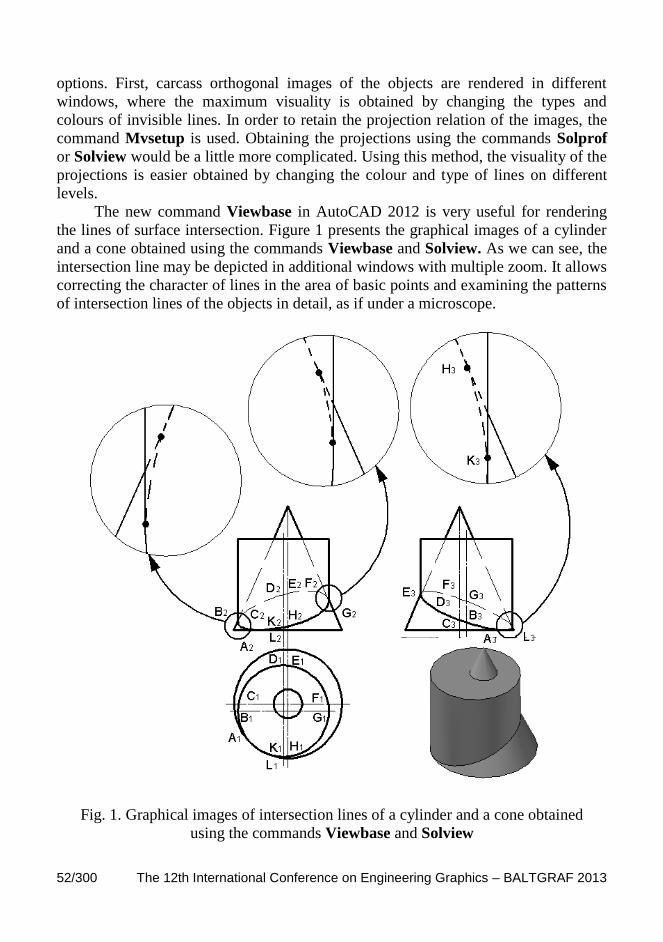
The new command Viewbase in AutoCAD 2012 is very useful for rendering
the lines of surface intersection. Figure 1 presents the graphical images of a cylinder
and a cone obtained using the commands Viewbase and Solview. As we can see, the
intersection line may be depicted in additional windows with multiple zoom. It allows
correcting the character of lines in the area of basic points and examining the patterns
of intersection lines of the objects in detail, as if under a microscope.
Fig. 1. Graphical images of intersection lines of a cylinder and a cone obtained
using the commands Viewbase and Solview

BALTGRAF 2013 – The 12th International Conference on Engineering Graphics 53/300
Solving such tasks as second level intersection lines of the surfaces and their
graphical depiction demands practical knowledge in using AutoCAD and develops
the orientation in projection relations. We believe that such tasks would be beneficial
in developing the practical skills of students in using 2D and 3D design technologies
and mastering the theoretical fundamentals of drawing geometry. When
implementing individual tasks, a student would have to indicate the basic points of
intersection lines of second level surfaces and characterize the intersection curves
(Fig. 2).
Fig. 2. Characterizing second level surface intersection lines
without marking the basic points of line intersection
4. SELECTING THE TASKS
The tasks with graphic investigation of second level surface intersection lines
may be assigned as independent homework of the students. The task indicates two
surfaces of objects; the patterns of their surface intersection lines have to be
examined. AutoCAD allows modelling the following solid objects with second level
surfaces: cylinder, cone, sphere, and their elliptical versions. The amount of task
versions is easily selected to meet the required number (Fig. 3).
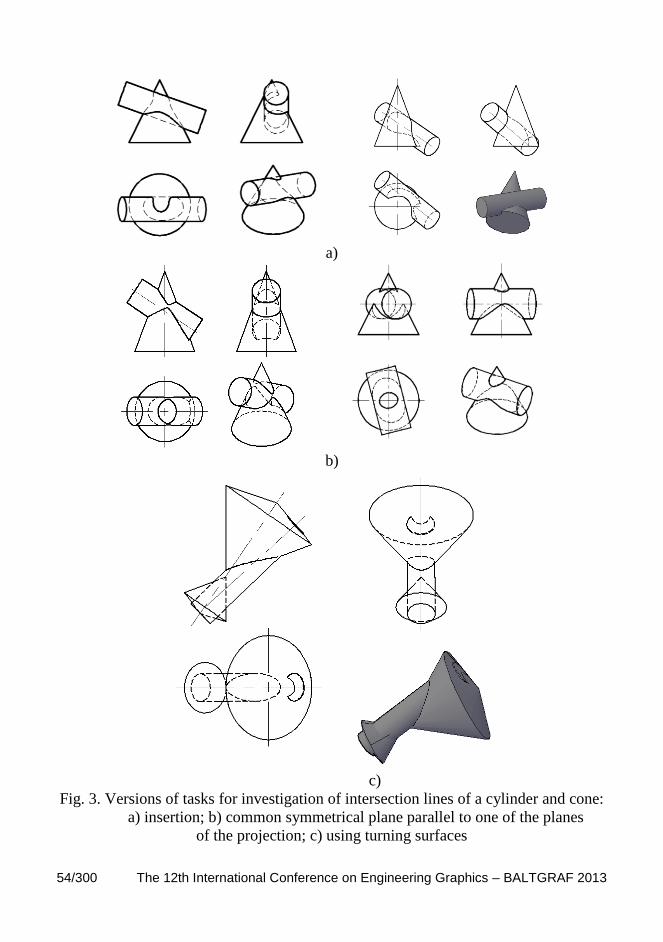
54/300 The 12th International Conference on Engineering Graphics – BALTGRAF 2013
a)
b)
c)
Fig. 3. Versions of tasks for investigation of intersection lines of a cylinder and cone:
a) insertion; b) common symmetrical plane parallel to one of the planes
of the projection; c) using turning surfaces

BALTGRAF 2013 – The 12th International Conference on Engineering Graphics 55/300
When creating the tasks, not only the above mentioned standard solid objects
may be used, but also an unlimited number of turning surfaces (Fig. 3c). It completely
satisfies the number of different tasks for a regular group. Quantitative parameters of
the tasks may be selected by the students themselves taking into account the visuality
conditions of obtained solutions.
The participation of the students in creating the tasks demands independent
thinking and creative initiative. This allows achieving the educational aim: gaining
knowledge through thinking bases on imagination.
5. CONCLUSIONS
1. 3D geometrical modelling technology allows fast and efficient presentation of
the results of second level surface intersection lines graphical investigation.
2. Preparation of the tasks of graphical investigation of second level surface
intersection lines engaging the students develops their interest, initiative, and
creativity.
3. Independent implementation of the tasks of graphical investigation of second
level surface intersection lines develops practical skills of the students in
using 2D and 3D computer design technologies and stimulates mastering the
theoretical basics of drawing geometry.
6. REFERENCES
1. V. Sinkevičius. AutoCAD 2009-2010 pradmenys [Basics of AutoCAD 2009–
2010], Smaltija, Kaunas, 2010. (in Lithuanian).
2. K. S. Danaitis, A. Usovaitė. Grafikos valdymas AutoCAD aplinkoje
[elektroninis išteklius] [Management of Graphics in AutoCAD Evironment
(electronic resource)], Vilnius: Technika, 2011. (in Lithuanian).
3. http://www.we-r-here.com./cad/videos/viewbase/viewbase.htm.

56/300 The 12th International Conference on Engineering Graphics – BALTGRAF 2013

The 12 th International Conference on Engineering Graphics
BALTGRAF 2013 June 5-7, 2013, Riga, Latvia
57/300
DRAWBACKS OF BIM CONCEPT ADOPTION
Modris DOBELIS1
ABSTRACT
Building Information Modelling (BIM) is a process of generating and managing
building data during its life cycle which involves representing a design as virtual
objects, which carry their geometry, relations and attributes. BIM design media
allows an extraction of different views from a building model for drawing production
and other uses. All the different views are automatically synchronized in the sense
that the objects are all of a consistent size, location, specification – since each object
instance is defined only once, just as in reality. BIM uses 3D, real-time, dynamic
building modelling software to increase productivity in design and construction. BIM
process co-ordinates products, project and process information throughout new
product introduction, production, service and retirement among the various players,
internal and external, who must collaborate to bring the concept to life. Universities
have to become the initiators of the promotion of BIM ideas not only to the designers
and engineers, but much wider public than at present. Universities have to seek
contacts/relationships with a view of developing joint actions with industry and
enterprises. Particular attention should be paid to Small and Medium sized
Enterprises as they account for an enormous part of economic growth and could be
the places where the innovations could be introduced easier. There is an evident role
for universities to play in lifelong learning and continuing education thought them to
offer possibilities of companies to increase competitiveness, productivity and
efficiency, total costs estimation, and to become concurrent on the global market.
KEYWORDS: BIM, BIM Teaching, Engineering Education
HISTORY OF BIM
It is assumed that the BIM concept originates from the projects of Professor
Charles Eastman at the Georgia Tech School of Architecture. Abbreviation BIM
stands for Building Information Modelling (or Model) in early 1970s. The developed
Building Description System (BDS) was the first software which manipulated with
individual library elements from the database in the model on PDP computers. This
idea was developed a long time before the victorious march of personal computers
and therefore could not get wide popularity because not many architects had a chance
1 Dep. of Computer Aided Engineering Graphics, Riga Technical University, Āzenes iela 16/20,
Rīga, LV-1048, Latvia, e-mail: [email protected]
58/300 The 12th International Conference on Engineering Graphics – BALTGRAF 2013
to get grips on it. Later several similar systems (GDS, EdCAAD, Cedar, RUCAPS,
Sonata and Reflex) were developed and tested on practical projects in United
Kingdom in 1980s [1]. A wider application into practice this concept acquired only
with the development of personal computers when the ArchiCAD software from
Graphisoft Company appeared on the scene, which incorporated the idea of Virtual
Building rather than drawing from the very first of its version Radar CH in 1984. The
power of software was amplified by flexible built-in programming environment for
its library components using GDL (Geometric Description Language).
The next step was when Irwin Jungreis and Leonid Raiz split from Parametric
Technology Corporation (PTC) and started their own software company called
Charles River Software in Cambridge, MA. They were equipped with the knowledge
of working on Pro/ENGINEER software (released 1988) development for mechanical
CAD that is utilizes a constraint based parametric modelling engine [1]. The two
wanted to create an architectural version of the software that could handle more
complex projects than ArchiCAD. A trained architect David Conan joined the project
and designed the initial user interface which lasted for nine releases. By 2000 the
company had developed a program called Revit, written in C++ and utilized a
parametric change engine, made possible through object oriented programming.
In 2002, Autodesk purchased the company and began to heavily promote the
software in competition with its own object-based software Architectural Desktop
(ADT), which provided a transitional approach to BIM, as an intermediate step from
CAD [2]. ADT creates its building model as a loosely coupled collection of drawings,
each representing a portion of the complete BIM.
Approximately at the same time period the concept of BIM was adopted by
another two software developers Bentley and Nemetschek in their further products.
Bentley Systems interpreted BIM differently as an integrated project model which
comprises a family of application modules that include Bentley Architecture
(internationally known under Microstation Triforma name), Bentley Structures,
Bentley HVAC, etc. Nemetschek provided a fourth alternative with its BIM platform
approach. The AllPlan database was “wrapped” by the Nemetschek Object Interface
(NOI) layer to allow third-party design and analysis applications to interface with the
building objects in the model [2].
HOW BIM WORKS?
The BIM concept first of all uses parametric object-oriented 3D data in virtual
models in contrary to the conventional 2D drawings, a long time used so far by
engineers and designers. Instead of drawing just a filled rectangular in plan view
which represents a wall of building in section, in BIM concept software the model is
built virtually in 3D space, the relative location with all the neighbour elements is
precisely determined and easy observable from arbitrary viewpoint for visualization
purposes. The model includes not only the geometric relationships between all
BALTGRAF 2013 – The 12th International Conference on Engineering Graphics 59/300
building elements, but these elements carry information on many real attributes
associated with them, like material, paint, class of fire safety, cost, etc. The drawings
– plans, elevations, and sections – are obtained automatically from the unique virtual
building model, along with the bills of materials and are updated immediately after
any changes are performed in the original building model. Amount of wall material in
specifications (schedules) is updated as soon as real virtual building elements like
windows and doors are placed in the model. This method highly eliminates the
human errors while producing drawing documents, which cannot be avoided using
the conventional 2D drafting technique. The synchronization between views,
elevations and sections in the manually produced drawing documents is the
responsibility of all parties involved, which in the case of large projects and many
parties involved could be a serious problem.
The concept of BIM besides the conventional three dimensions of the model
and real attributes attached to these elements includes the fourth dimension – time.
The so called 4D design approach allows the coordination between parties involved
not only during the building construction phase but also during exploitation,
reconstruction and finally even utilization. The information is maintained and updated
in the common database from the initial stage of the design through the whole
lifecycle of the building.
The fifth dimension incorporated in the BIM concept is “money”. One of the
most important attributes for elements and processes of the real rebuilding included in
the virtual model is cost. In this case the process is described as 5D design approach.
The databases may include building elements with their attributes from many vendors
and the designers could easily simulate several variants of the design. Numerous
design scenarios “what if” could be played to find out the most effective solution.
Besides the five more or less known dimensions the current BIM concept
supports also the sixth dimension which are facility management applications like
CAFM (Computer-Aided Facility Management) and the seventh dimension with
procurement solutions e.g. contracts, purchasing, suppliers, and environmental
standards.
In order to support all these dimensions of BIM concept in the numerous
software and application, it is evident that a common standard has to be used to share
the information between so many different “players on the field”. There are many
problems which have to be solved before this undoubtedly effective BIM process can
be widely used in practice [3].
The technology adoption lifecycle model describes the adoption or acceptance
of a new product or innovation, according to the demographic and psychological
characteristics of defined adopter groups. The process of adoption over time is
typically illustrated as a classical normal distribution or "bell curve." The model
indicates that the first group of people to use a new product is called "innovators,"
followed by "early adopters." Next come the early and late majority, and the last
group to eventually adopt a product are called "laggards".
60/300 The 12th International Conference on Engineering Graphics – BALTGRAF 2013
Since these BIM tools and techniques have become increasingly complex,
architectural and civil engineering schools have been faced with a great challenge not
to lie behind and not to become laggards. To train specific software requires first of
all mastering itself provided there is a financing for it. In general, industry lies behind
and picks up the innovations slowly. A student with knowledge of only one type
of software may well be trained to design according to the biases of the programs that
they are using to represent their ideas. Software performs useful tasks by breaking
down a procedure into a set of actions that have been explicitly designed by a
programmer. The programmer takes an idea of what is common sense and simulates a
workflow using tools available to them to create an idealized goal. In the case of BIM
tools, the building is represented as components including walls, roofs, floors,
windows, columns, etc. These components have pre-defined rules or constraints
which help them perform their respective tasks results.
PROBLEMS OF ADOPTION IN INDUSTRY
Contemporary hardware and software provides enormous potentials for the
nowadays designers. How come that these potentials are not introduced in everyday
practice and are not used in full scale? The two main factors that affect this are the
expenses and training. The BIM’s learning curve could be one of the top barriers of
implementation in construction. There is an opinion that wide use of BIM concept
mainly fails because of another two much more important factors – people factor and
change factor [5]. BIM implementation is not really about the software, but it is about
organizational change. Our experiences – and the experiences of our clients – have
demonstrated that people and processes are far more important than technology.
BIM is an absolutely wonderful tool, and it has great potential to streamline
costs and processes, to help different disciplines communicate effectively and to
ensure little confusion on a job site. But to get to that promised land of benefits, you
have to pass through the wilderness of adoption, which always seems to hinge on
organizational change, not technology. This is the inconvenient truth.
People’s factor has been acknowledged by many AEC/CAD/CAM analysts [5,
6]. The influence of people is significant factor in software product implementation
that requires from people to re-think the way they are doing their business. Both PLM
and BIM software can eliminate some roles in organizations and change business
processes between organizations. It makes the process of software adoption long and
complicated. This is a place where failure comes very often.
Changes are another aspect, which very often comes together with data and
object and/or process oriented software like PLM and BIM. The specific character of
almost every enterprise-level data and process management software is to focus on
how to change organization – improve processes, re-organize business relationships,
change tools, etc. It is extremely hard to people, since change is hard which
consequently leads to failures [5].
BALTGRAF 2013 – The 12th International Conference on Engineering Graphics 61/300
BARRIERS IN BIM EDUCATION
Innovative companies nowadays require professional employees who are able
to work effectively on projects undertaken with BIM. Several universities throughout
the world have been running a wide range of courses to meet this demand and provide
students with experience on this new paradigm. However, this learning experience is
relatively new and based on a pedagogical system that has not yet been consolidated.
In a recent analysis [6] an attempt was made to address the main obstacles
encountered with BIM teaching, as well as to give examples of how to overcome
them and introduce new strategies at introductory, intermediary and advanced levels.
The programs that are planning to introduce BIM into the curriculum face a
number of obstacles that can be grouped into three types: academic circumstances,
misunderstanding of the BIM concepts and difficulties in learning/using the BIM
tools [7]. In an academic environment a wide range of problems occur, just to name
the topics: time, motivation, resources, accreditation, and curriculum.
Misunderstanding of BIM concepts is associated with individualized instruction,
traditional teaching, little teamwork and week or lack at all collaboration between
curricula. The weakness of BIM tools is associated with creativity, learning, teaching,
and knowledge aspects.
An extensive survey on 119 building construction schools in the United States
found that only 9% of them teach BIM at a degree level [8]. The main problems
named by the respondents are as follows: lack of time or resources to prepare a new
curriculum, lack of space in the curriculum to include new courses and a lack of
suitable materials to teach BIM. Another survey involving 101 Architecture, Civil
Engineering and Construction Management programs in the U.S. [9] found that, apart
from these obstacles, there is a shortage of trained personnel in BIM, that the
curriculum is not focused on BIM, that its implementation takes time and that the
accrediting bodies for the construction programs have not drawn up clear guidelines
for BIM.
The summary on BIM education activities [6] showed that only a few
engineering schools have been teaching BIM since 2000, e.g. Georgia Institute of
Technology, which has carried out research on BIM since the early 1990s. Several
international schools have begun teaching BIM tools around 2003, but the vast
majority introduced BIM between 2006 and 2009. In exceptional cases, the
architecture programs were those that first showed interest in this area. Rapid
advances were made and today there are a large number of BIM courses [9-11].
TEACHING APPROACHES
Through surveys the current educational programs throughout the world were
reviewed and recommendations developed to assist universities with curriculum
development. Based on an extensive research on BIM teaching experience in [10]
three skill levels are given which define the BIM learning and teaching strategies.
62/300 The 12th International Conference on Engineering Graphics – BALTGRAF 2013
These three skill levels are introductory, intermediary and advanced. At introductory
level BIM usually is taught in typical engineering design graphics courses including
courses like Computer Aided Design.
The main purpose in an introductory level of curricula courses is to develop the
skills of geometric modelling using BIM supporting software. These courses do not
require the essentials of classic 2D CAD skills like AutoCAD, which are still
considered as a compulsory knowledge for architectural and civil engineering
graduates. The objective is to preferably learn those BIM tools that are most
commonly used in the field in order to obtain a good background of BIM concepts.
The BIM tools can be taught through lectures, workshops and labs. The students do
problem-solving exercises and carry out small individual tasks to practice the BIM
tool. It is recommended that before the students start the modelling they make
modifications to an existing model [10, 12-13]. This allows an exploration of basic
concepts of geometric modelling and provides understanding how to communicate
different type of information.
After this, the students create the model of a small building (or parts of it),
usually with an area of or less than 600 square meters to extract quantities from it,
and learn how to manipulate the model, types of basic components and their
behaviour. It is recommended that a modern single family residence is used as a
project. The modelling can be accompanied by analogue methods, sketches and
axonometric views, which allow the students to perform suitable adjustments to the
physical proportions [10, 13]. This approach is used at RTU Civil Engineering and
Architectural programs.
The architecture student can make a volume/mass representation of the house,
carry out an investigation of primary components (doors, windows, panels and
furniture) and, based on his/her research, develop and refine a new component. The
engineering student can do the following: identify a construction component of
his/her choice in the Structural and/or Mechanical, Electrical and Plumbing (MEP)
areas, make a list of the necessary information required for the construction of that
component, categorize this information throughout the life cycle to show how it can
be linked and managed from a life cycle perspective and decide how they should be
shared with the other subject-areas [13-14]. In [10] it is suggested that the assessment
of the students’ performance can be conducted through individual exercises
(components or simple models), written exams about BIM concepts and their
presentation of models.
BIM could be introduced in different courses of the curriculum and the study
[10] grouped them into eight categories: Digital Graphic Representation (DGR);
Workshop; Design Studio; BIM Course; Building Technology; Construction
Management; Thesis Project and Internship.
An introductory level of BIM at Riga Technical University is performed in
several courses dealing with classical engineering design graphics. The civil
engineering students have to apply the knowledge about the basics of architectural

BALTGRAF 2013 – The 12th International Conference on Engineering Graphics 63/300
design. After four formal lectures accompanied with training exercises on modelling
using ArchiCAD software, the students have to virtually build their own „dream
private house” which was analysed and designed before in a separate course
„Architectural Design” using the classical manual drafting technique. In this course
even AutoCAD drafting technique was not allowed to use. In the final project the
students have to compose all the required the basic supporting architectural
documentation – plans, elevations, sections, detail drawings, room inventory, exterior
and interior renderings – on a single sheet of A1 or A0 format paper. A standard or
self-created zone lists for room inventory have to be used. Standard or modified door
and window schedules have to be used to see the power of built-in features in the
BIM supporting software. Figures 1-3 demonstrate the complexity of individual
projects used in the introductory level of BIM concept study.
Fig. 1. A plan view of a two story building: An example showing the complexity
of project in the course „Computer Aided Design” for undergraduate
civil engineering students
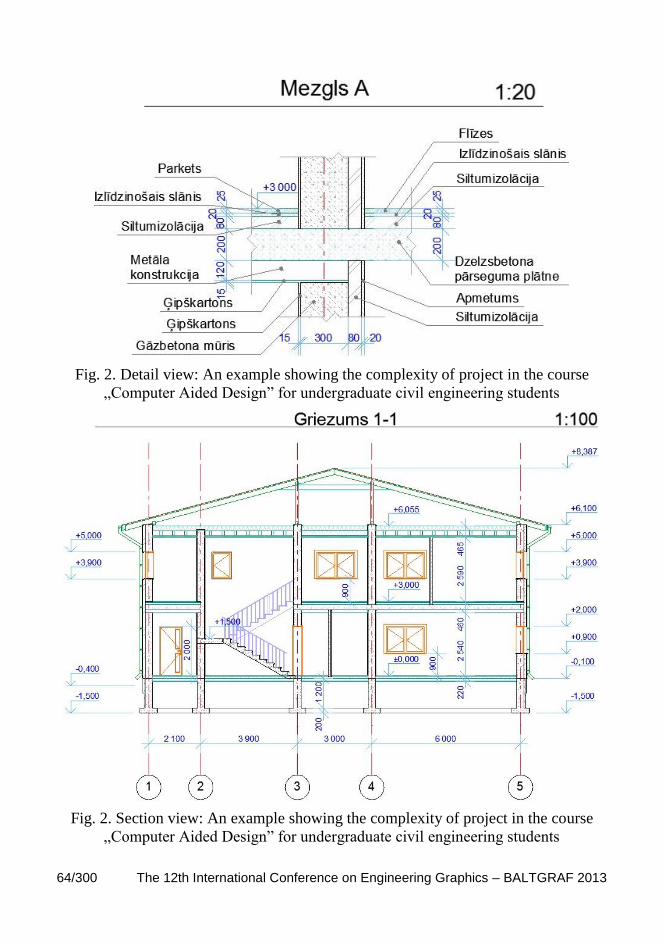
64/300 The 12th International Conference on Engineering Graphics – BALTGRAF 2013
Fig. 2. Detail view: An example showing the complexity of project in the course
„Computer Aided Design” for undergraduate civil engineering students
Fig. 2. Section view: An example showing the complexity of project in the course
„Computer Aided Design” for undergraduate civil engineering students
BALTGRAF 2013 – The 12th International Conference on Engineering Graphics 65/300
At the end of the course only one informative lecture is provided on the
possibility to streamline the prepared IFC compliant project for further energy
analysis or structural analysis on compatible software like Axis VM, Tekla
Structures, and Revit Structure which are typically used by local companies.
Educators can receive well prepared presentation materials and support from some
BIM software developers [15]. Unfortunately, the practice in the classroom reveals
that our students are quite reserved when they are offered just the theoretical lectures
about global issues. Practical training exercises during the class hours are more
appreciated, but the contact hours for the last two decades for classical engineering
design graphics subjects have decreased more than twice [16]. Further development
of civil engineering curricula is possible through the interaction between different
courses based on BIM collaboration. This would highly benefit the preparation of
graduates for the next BIM challenges.
CONCLUSIONS
Instead of trying to force through changes in the curriculum, the academic
world could join together with industry to promote BIM or collaborative thinking and
setting up a research, teaching and consultancy projects. A closer partnership is
expected between universities and industry. Unfortunately the local building industry
has faced well-known global issues and seems that the current period is not yet the
right time for changes. In fact, industry must be willing to provide funding for the
academic world. They must devote time to visit universities and be prepared to
discuss the current trends and scenarios with teachers and students, share generic
models and provide current materials for students to enable them to practice the
knowledge they have learned as stated in [11]. However, the biggest obstacle to the
progressive changes is a human factor!
REFERENCES
1. Quirk V. A Brief History of BIM / Michael S. Bergin. ArchDaily, Dec 7,
2012. http://www.archdaily.com/302490. [access Mar 16, 2013].
2. Howell I., Batcheler B. Building Information Modeling Two Years Later –
Huge Potential, Some Success and Several Limitations.
http://www.laiserin.com/features/bim/newforma_bim.pdf. -9 pp. [access Mar
16, 2013].
3. Eastman C., Teicholz P., Sacks R., Liston K. BIM Handbook. A Guide to
Building Information Modeling for Owners, Managers, Designers, Engineers,
and Contractors. John Wiley & Sons, Inc., 2008. -490 pp.
4. Technology Adoption Lifecycle.
http://en.wikipedia.org/wiki/Technology_adoption_lifecycle. [access Mar 16,
2013].
66/300 The 12th International Conference on Engineering Graphics – BALTGRAF 2013
5. Shilovitsky O. Why PLM and BIM Fail in the Same Way? Beyond PLM, May
4, 2012, http://beyondplm.com/2012/05/04/why-plm-and-bim-fail-in-the-
same-way. [access Mar 16, 2013].
6. Barison M. B., Santos T. B. BIM Teaching: Current International Trends.
Gestão e Tecnologia de Projetos, 2011, 6, (2), p. 67-80.
7. Kymmell W. Building Information Modeling: Planning and Managing
Construction Projects with 4D CAD and Simulations. McGraw Hill, New
York, NY, 2008. -416 pp.
8. Sabongi F. J. The Integration of BIM in the Undergraduate Curriculum: An
Analysis of Undergraduate Courses. Associated Schools of Construction. Int.
Proc. of the 45th Annual Conference, Gainesville, FL, Apr 1-4, 2009. -6 pp.
http://ascpro0.ascweb.org/archives/cd/2009/paper/CEUE90002009.pdf.
[access Mar 16, 2013].
9. Becerik-Gerber B., Gerber D. Ku K. The Pace of Technological Innovation in
Architecture, Engineering and Construction Education: integrating recent
trends into the curricula. Electronic Journal of Information Technology in
Construction, 2011, 16, p. 411-431.
http://www.itcon.org/data/works/att/2011_24.content.09244.pdf. [access Mar
16, 2013].
10. Barison M. B., Santos E. T. BIM Teaching Strategies: An Overview of
Current Approaches. Computing in Civil and Building Engineering. Proc. of
the International Conference. Nottingham, UK, Jun 30-Jul 2, 2010. -7 pp.
http://www.engineering.nottingham.ac.uk/icccbe/proceedings/pdf/pf289.pdf.
[access Mar 16, 2013].
11. Pavelko C., Chasey A. D. Building Information Modeling in Today’s
University Undergraduate Curriculum. Proceedings of the BIM-Related
Academic Workshop. Washington, D.C., Dec 7-9, 2010. -11 pp.
http://www.buildingsmartalliance.org/client/assets/files/bsa/bsa_conference_p
roceedings_1210.pdf. [access Mar 16, 2013].
12. Taiebat M., Ku K., McCoy A. BIM in Integrated Learning Environments for
Construction: The Students’ Perspectives. Proceedings of the BIM-Related
Academic Workshop. Washington, D.C., Dec 7-9, 2010. -10 pp.
http://www.buildingsmartalliance.org/client/assets/files/bsa/bsa_conference_p
roceedings_1210.pdf. [access Mar 16, 2013].
13. Brown N. C., Peña R. B., Folan J. Teaching BIM: Best Practices for
Integrating BIM into Architectural Curriculum? Autodesk University 2009.
Learn. Connect. Explore. Las Vegas, NV. Dec 1-4, 2009. -10 pp.
http://aucache.autodesk.com/au2009/sessions/5267/AU09_TeachingBIM_ED
122_1.pdf. [access Mar 16, 2013].
14. Koch D., Hazar D. Integrating BIM into Mechanical, Electrical and Plumbing
(MEP) Construction Management Curriculum. Proceedings of the BIM-
Related Academic Workshop. Washington, D.C., Dec 7-9, 2010. -6 pp.

BALTGRAF 2013 – The 12th International Conference on Engineering Graphics 67/300
http://www.buildingsmartalliance.org/client/assets/files/bsa/bsa_conference_p
roceedings_1210.pdf. [access Mar 16, 2013].
15. BIM Curriculum. A Teaching Material for Educators of BIM.
http://www.graphisoft.com/education/curriculum/. [access Mar 16, 2013].
16. Dobelis M. Computer Aided Architectural Design Training. Innovations in E-
learning, Instruction Technology, Assessment and Engineering Education,
(Ed. by M. Iskander), Springer, 2007, p. 267-272.

68/300 The 12th International Conference on Engineering Graphics – BALTGRAF 2013

The 12 th International Conference on Engineering Graphics
BALTGRAF 2013 June 5-7, 2013, Riga, Latvia
69/300
ASSESSMENT OF THE ENGINEERING GRAPHIC
LITERACY SKILLS
Modris DOBELIS1, Theodore BRANOFF
2, Imants NULLE
3
ABSTRACT
An engineering graphics literacy assessment for constraint-based modelling course
was developed and tested by a visiting Fulbright Scholar at North Carolina State
University (NCSU), USA. Later the students from Latvia University of Agriculture
(LUA) and from two sections at Riga Technical University (RTU) in Latvia
participated in an experiment to test this methodology. All the 75 students from three
universities were asked to create 3D models for seven parts given in an assembly
drawing of a mechanical device within two hours’ time period. The parts in the
assembly ranged in complexity from a simple ball to a complex valve body. Students
were given a ruler to measure parts on the B-size third quadrant or A3 size first
quadrant drawing and determine sizes of geometric elements based on the given scale
(2:1). It was difficult to compare the test scores on the modelling assessment and
other measures in the course (final project, final exam, and final course average)
because universities have different grading system. This paper summarizes how
students performed (number of parts modelled, scores, total time, etc.) on the
developed Riga-Raleigh Test (named after the cities where it was inspected at first),
reports analyses of relationships between their scores on the assessment and other
measures in the course, and also presents ideas for future studies.
KEYWORDS: Graphic Literacy, Engineering Drawing, Constraint-Based Modelling
INTRODUCTION
Regardless of a wide use of advanced PLM (Product Lifecycle Management)
3D digital product advancement techniques, engineering drawings with orthographic
multiviews still serve as legal documents for product development processes.
Usually, engineering drawing course includes: principles of two-dimensional
1 Dep. of Computer Aided Engineering Graphics, Riga Technical University, Āzenes iela 16/20,
Rīga, LV-1048, Latvia, e-mail: [email protected] 2 Dep. of Science, Technology, Engineering & Mathematics Education, College of Education, North
Carolina State University, P.O. Box 7801, Raleigh, North Carolina, 27695-7801, USA, e-mail:
[email protected] 3 Institute of Mechanics, Faculty of Engineering, Latvia University of Agriculture, J. Čakstes. bulv. 5,
LV-3001, Jelgava, Latvia, e-mail: [email protected]

70/300 The 12th International Conference on Engineering Graphics – BALTGRAF 2013
projection and spatial reasoning (descriptive geometry), basics of multiview
engineering drawings, specifications and requirements of technical standards,
working drawings of parts and assembly drawings and so on. One of the first skills
engineering students must master is the ability to read and interpret drawings or
communicate in graphic language. This was hardly disputable statement at the age of
sequential engineering when conventional drawings served as primary documents for
product development.
The integration of computer technology over the last 30 years into engineering
programs has caused changes in the types of courses offered which has also forced
most schools to make decisions about what types of topics must be offered. The
“computerization” of these programs has forced to provide students with current
skills, but has it come at the expense of deficiencies in other areas [1]? In general, the
number of engineering graphics courses has been reduced in engineering programs all
over the world – the United States, Europe, Australia and China. Universities have
eliminated many courses in engineering graphics and descriptive geometry and
typically replaced them with a single course that is focused on solid modelling and
engineering design [2-5].
The reduction in the number of courses seems to be true internationally. In the
courses that remain in curricula, CAD instruction appears to be the main focus.
Programs, however, still vary, and faculty have many opinions about what is essential
when preparing students for careers in engineering and design [6-11]. With the
increase in focus on 3D modelling, are students still able to read and interpret
engineering drawings well?
It is well known fact that using constraint-based 3D solid modelling software
one can express the understanding of visual form much faster than creating multiview
working drawing. Test like this is highly oriented on the spatial reasoning of
geometric forms which are present in the parts of multiview assembly drawings rather
than checking the CAD software usage skills. To complete the test only the basic
knowledge of modelling technique is required. This allows the students to focus more
on the main task how to prove their graphic literacy and build the models from simple
3D geometric primitives like prism, cylinder, cone, sphere, and helix.
Prior the actual test, a pilot study was conducted in constraint-based modelling
course at NCSU where 29 students were asked to model as many as possible of the
seven parts from assembly drawing within a 110 minute class period [12]. The main
purpose of this pilot study was to determine the procedures necessary for this type of
assessment in a classroom setting. Only eight students modelled all seven parts in the
assembly. Some of the students in the pilot study completely misinterpreted the 3D
geometry of some parts. The researchers wondered if this was the result of
insufficient practice reading drawings and/or the result of low spatial ability.
Spatial abilities have been used as a predictor of success in several engineering
and technology disciplines [13]. In engineering graphics courses, scores on spatial
tests have also been used to predict success [14-15]. Other studies have shown that
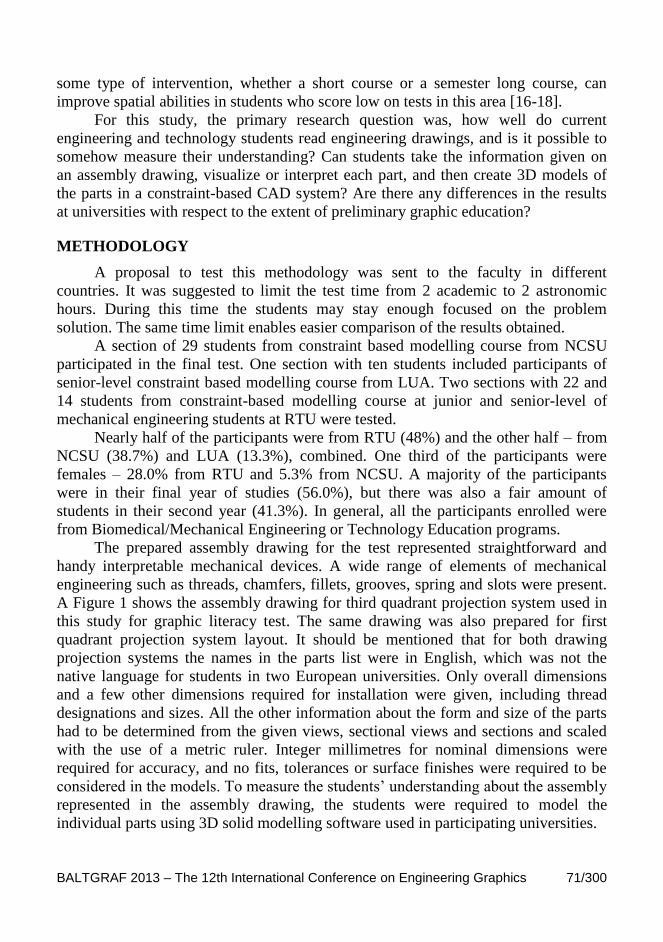
BALTGRAF 2013 – The 12th International Conference on Engineering Graphics 71/300
some type of intervention, whether a short course or a semester long course, can
improve spatial abilities in students who score low on tests in this area [16-18].
For this study, the primary research question was, how well do current
engineering and technology students read engineering drawings, and is it possible to
somehow measure their understanding? Can students take the information given on
an assembly drawing, visualize or interpret each part, and then create 3D models of
the parts in a constraint-based CAD system? Are there any differences in the results
at universities with respect to the extent of preliminary graphic education?
METHODOLOGY
A proposal to test this methodology was sent to the faculty in different
countries. It was suggested to limit the test time from 2 academic to 2 astronomic
hours. During this time the students may stay enough focused on the problem
solution. The same time limit enables easier comparison of the results obtained.
A section of 29 students from constraint based modelling course from NCSU
participated in the final test. One section with ten students included participants of
senior-level constraint based modelling course from LUA. Two sections with 22 and
14 students from constraint-based modelling course at junior and senior-level of
mechanical engineering students at RTU were tested.
Nearly half of the participants were from RTU (48%) and the other half – from
NCSU (38.7%) and LUA (13.3%), combined. One third of the participants were
females – 28.0% from RTU and 5.3% from NCSU. A majority of the participants
were in their final year of studies (56.0%), but there was also a fair amount of
students in their second year (41.3%). In general, all the participants enrolled were
from Biomedical/Mechanical Engineering or Technology Education programs.
The prepared assembly drawing for the test represented straightforward and
handy interpretable mechanical devices. A wide range of elements of mechanical
engineering such as threads, chamfers, fillets, grooves, spring and slots were present.
A Figure 1 shows the assembly drawing for third quadrant projection system used in
this study for graphic literacy test. The same drawing was also prepared for first
quadrant projection system layout. It should be mentioned that for both drawing
projection systems the names in the parts list were in English, which was not the
native language for students in two European universities. Only overall dimensions
and a few other dimensions required for installation were given, including thread
designations and sizes. All the other information about the form and size of the parts
had to be determined from the given views, sectional views and sections and scaled
with the use of a metric ruler. Integer millimetres for nominal dimensions were
required for accuracy, and no fits, tolerances or surface finishes were required to be
considered in the models. To measure the students’ understanding about the assembly
represented in the assembly drawing, the students were required to model the
individual parts using 3D solid modelling software used in participating universities.

72/300 The 12th International Conference on Engineering Graphics – BALTGRAF 2013
Fig. 1. The assembly drawing used for modelling test
All parts modelled were saved and files were submitted for the assessment.
Once the final test data was collected, one of the researchers evaluated all of the
SolidWorks 3D models produced by the students based on the rubrics pilot tested at
NCSU in early 2011. The assessment rubric spread sheet was created to account for
model accuracy and time required to model each part. Each feature and sketch (if
any) was analysed individually. Penalty points were assigned for each wrong
geometric dimension including under-defined sketches. Penalty points were added for
each dimension of the geometric primitive missing in the model, incorrect
dimensions, including misinterpreted scale or inaccurate measurement with ruler, and
failure to correctly represent cosmetic threads in SolidWorks models.
The assemblies were analysed with respect to their complexity. Several factors
were considered like number of geometric elements and modelling features, number
of threaded elements, and total number of dimensions. Finally, the complexity of the
part in an assembly drawing was characterized by the number of dimensions required
for the modelling of that particular part. This means that the dimensions accounted
for the size and location of geometric primitives from which the part was built. The
complexity of each part was determined as a ratio of number of dimensions for that
part and total number of dimensions in the assembly, normalized against 100. The
table on top right in Figure 1 represents the complexity of parts for the final 3D
modelling assessment in the study.

BALTGRAF 2013 – The 12th International Conference on Engineering Graphics 73/300
Figure 2 shows the 3D models of all individual parts for the final test assembly.
Parts in the image are shown half sectioned to better represent the geometric shape
and complexity.
Evaluated was the time every
individual student spent on modelling
each of the parts. The time stamps for
features and sketches in the
SolidWorks model file database were
examined to determine when each
item was created and last modified.
Time t1 was when the first feature’s
sketch was created and this was
assumed as a time when the student
started to create the model. The latest
time when any sketch or feature in
the design tree was modified was
assumed as the modelling end time tn
(Fig. 3). The total time t required for
part modelling was calculated as t =
tn-t1. All the data retrieved from the
files were collected in the Excel
spread sheet.
Fig. 3. Example of an Analysis of the SolidWorks’ Design Tree
RESULTS
In this extended study [19] an attempt was made to determine if it is possible to
compare the graphic literacy test results performed at different universities. Arranged
score points in Figure 4 represents the individual performance of all students in four
sections from three universities.
Fig. 2. The 3D models of the parts
from OVERFLOW VALVE

74/300 The 12th International Conference on Engineering Graphics – BALTGRAF 2013
The results for RTU are shown separate for junior and senior level students.
The data were analysed to determine if there were identifiable differences in the
means between the scores on the 3D modelling test among the universities. A part
modelling was calculated as t = tn-t1. All the data retrieved from the files were
collected in the Excel spread sheet. Table 1 summarises the descriptive statistics for
the scores in the 3D modelling test.
Fig. 4. Individual scores of the students in the “reading and writing” test
Table 1. Scores on the modelling test in participating universities
School N Mean SD Min Max
RTU Jun. 22 42.2 19.3 18.3 83.1
RTU Sen. 14 58.4 21.7 9.0 85.7
NCSU 29 54.0 26.0 5.9 92.0
LUA 10 81.3 10.3 58.7 91.9
TOTAL 75 50.2 22.8 5.9 92.0
Further analysis was performed to reveal how the complexity of the parts
influences the modelling time. To get a reliable result, only the performance of those
students in all sections was analysed who scored above 60 points.
Average time required to model all seven parts was calculated and represented
based on the number of dimensions required to define the features of each part.
Statistical analysis of these data revealed that more complex parts require much
longer time to model them; however, the increase in time is nonlinear. Figure 5 shows
the approximated relationships with exponential function for the time T spent on
modelling and the number of dimensions x required to completely define the part. In
this graph a data point from the pre-test at NCSU was also included. The best
pronounced exponential relationship was observed in NCSU section where the
correlation coefficient was statistically significant with p<0.004.

BALTGRAF 2013 – The 12th International Conference on Engineering Graphics 75/300
Fig. 5. Average time spent on the modelling
depending on the complexity of the part
The obtained theoretical relationships will be used in further studies to predict
the time necessary to complete the modelling test assignments during the regular
classes or home assignments. Another challenge to check the dependability of the
theoretical forecast will be for the preparation of competitions about engineering
graphics literacy at RTU where similar tasks are used. Selecting the assignments for
the forthcoming competitions, which are supposed to be completed within limited
time frame, it is important to know before the expected busy time of an average
student.
To reveal a potential trend in the strategies of modelling or performance
differences in participating universities or sections, the average data were calculated.
Figure 6 displays the performance of the students when average score is calculated
based on the number of parts the student modelled. Any attempt to model any
recognized geometric shape of the part from the assembly drawing was assessed so
that not necessarily all the part had to be complete.
To evaluate how efficiently the students used the test time, a modelling pace
was introduced. The modelling pace is calculated as score points per time in min.
Figure 6 shows the relationship of modelling pace depending on the number of parts
modelled.
The examined file database allowed the researchers to analyse the scores of
individual students with respect to his/her pace (Fig. 7). The graph shows that the
same score could be achieved in more or less effective way. For example, at NCSU
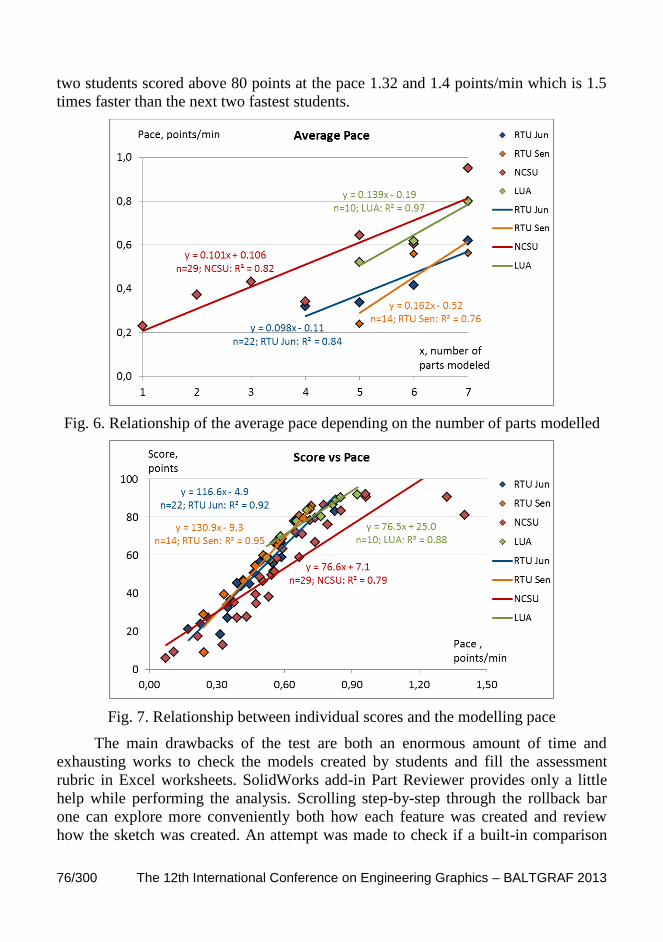
76/300 The 12th International Conference on Engineering Graphics – BALTGRAF 2013
two students scored above 80 points at the pace 1.32 and 1.4 points/min which is 1.5
times faster than the next two fastest students.
Fig. 6. Relationship of the average pace depending on the number of parts modelled
Fig. 7. Relationship between individual scores and the modelling pace
The main drawbacks of the test are both an enormous amount of time and
exhausting works to check the models created by students and fill the assessment
rubric in Excel worksheets. SolidWorks add-in Part Reviewer provides only a little
help while performing the analysis. Scrolling step-by-step through the rollback bar
one can explore more conveniently both how each feature was created and review
how the sketch was created. An attempt was made to check if a built-in comparison
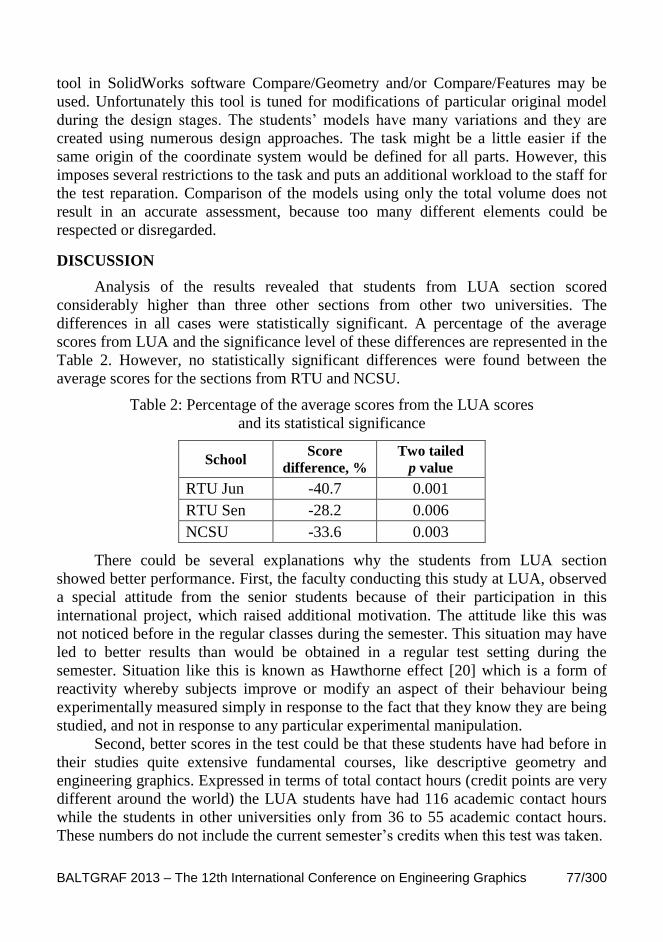
BALTGRAF 2013 – The 12th International Conference on Engineering Graphics 77/300
tool in SolidWorks software Compare/Geometry and/or Compare/Features may be
used. Unfortunately this tool is tuned for modifications of particular original model
during the design stages. The students’ models have many variations and they are
created using numerous design approaches. The task might be a little easier if the
same origin of the coordinate system would be defined for all parts. However, this
imposes several restrictions to the task and puts an additional workload to the staff for
the test reparation. Comparison of the models using only the total volume does not
result in an accurate assessment, because too many different elements could be
respected or disregarded.
DISCUSSION
Analysis of the results revealed that students from LUA section scored
considerably higher than three other sections from other two universities. The
differences in all cases were statistically significant. A percentage of the average
scores from LUA and the significance level of these differences are represented in the
Table 2. However, no statistically significant differences were found between the
average scores for the sections from RTU and NCSU.
Table 2: Percentage of the average scores from the LUA scores
and its statistical significance
School Score
difference, %
Two tailed
p value
RTU Jun -40.7 0.001
RTU Sen -28.2 0.006
NCSU -33.6 0.003
There could be several explanations why the students from LUA section
showed better performance. First, the faculty conducting this study at LUA, observed
a special attitude from the senior students because of their participation in this
international project, which raised additional motivation. The attitude like this was
not noticed before in the regular classes during the semester. This situation may have
led to better results than would be obtained in a regular test setting during the
semester. Situation like this is known as Hawthorne effect [20] which is a form of
reactivity whereby subjects improve or modify an aspect of their behaviour being
experimentally measured simply in response to the fact that they know they are being
studied, and not in response to any particular experimental manipulation.
Second, better scores in the test could be that these students have had before in
their studies quite extensive fundamental courses, like descriptive geometry and
engineering graphics. Expressed in terms of total contact hours (credit points are very
different around the world) the LUA students have had 116 academic contact hours
while the students in other universities only from 36 to 55 academic contact hours.
These numbers do not include the current semester’s credits when this test was taken.
78/300 The 12th International Conference on Engineering Graphics – BALTGRAF 2013
Third, the test at LUA section was not compulsory, so only better performing
and highly motivated students turned in. As a result a higher average score for LUA
section could have been obtained. Additional research should be performed to clarify
this effect.
CONCLUSIONS
A quantitative assessment method proposed in present study using an assembly
drawing “reading and writing” test in combination with 3D modelling software could
be used for the determination of a graphic literacy level of the engineering students.
The suggested assessment method was tuned for the use of constraint-based software
SolidWorks. The students from LUA showed on the average 1.6 times higher scores
in this engineering assembly drawing interpretation test than students from two other
universities. Further research is required to confirm that these differences were
associated with more extensive courses on graphic subjects in the sophomore studies
One of the main concerns for conducting future studies is the ability to scale-up to
handle more students. Although the rubric used in the pilot study and in this study
delivered accurate assessments of the students’ modelling abilities, the time required
to assess student work was very high. This potentially could prevent other faculty
from using the suggested method. The researchers plan on investigating alternative
methods for accurately assessing student models such as automated programs for
gathering the desired data from the digital models.
ACKNOWLEDGMENT
This research was performed within 2011 Fulbright Program grant “Evaluating
Engineering Graphics Literacy in CAD Age” and sponsored by the U.S. Department
of State's Bureau of Educational and Cultural Affairs.
REFERENCES
1. Livshits,V., Sandler B. Z. Upstairs/ Downstairs in Technical Education: The
Unsettling Effects of Computerization. International Journal of Technology
and Design Education, 9, p. 73-84, 1999.
2. Branoff T. J. The State of Engineering Design Graphics in the United States.
Proceedings of the 40th
Anniversary Conference of the Japan Society for
Graphic Science, Tokyo, Japan, May 12-13, 2007. -8 pp.
3. Clark A. C., Scales A. Y. A Study of Current Trends and Issues Related to
Technical/Engineering Design Graphics. Engineering Design Graphics
Journal, 64, (1), p. 24-34, 2000.
4. Meyers F. D. First Year Engineering Graphics Curricula in Major Engineering
Colleges. Engineering Design Graphics Journal, 64, (2), p. 23-28, 2000.
5. Zheng Jian. Teaching of Engineering Drawing in the 21st Century. 2011
Second International Conference on Mechanic Automation and Control
BALTGRAF 2013 – The 12th International Conference on Engineering Graphics 79/300
Engineering Proceedings, July 15-17, 2011, Inner Mongolia, China, p. 1713-
1715.
6. Dobelis M., Veide G., Leja E. Development of Spatial Imagination Abilities
in Mechanical Engineering Students. Proceedings of the 13th
International
Conference on Geometry and Graphics, August 4-8, 2008, Dresden,
Germany. e-Publication in CD format. -8 pp.
7. Harris L.V.A., Meyers F. Engineering Design Graphics: Into the 21st Century.
Engineering Design Graphics Journal, 71, (3), p. 20-34, 2007.
8. Jurane I. Educational Aids in Graphical Education. Proceedings of the 14th
International Conference on Geometry and Graphics, August 5-9, 2010,
Kyoto, Japan. e-Publication in CD format. -7 pp.
9. Kise S., Sekiguchi S., Okusaka K., Hirano S. Training on Three-dimensional
Computer-Aided Design for New Employees of Machine Design Department
and its Evaluation. Proceedings of the 13th
International Conference on
Geometry and Graphics, August 4-8, 2008, Dresden, Germany. e-Publication
in CD format. -7 pp.
10. Suzuki K., Schroecker H. P. Application of Descriptive Geometry Procedures
in Solving Spatial Problems with Feature and Parametric Modelling 3D-CAD.
Proceedings of the 13th
International Conference on Geometry and Graphics,
August 4-8, 2008, Dresden, Germany. e-Publication in CD format. -8 pp.
11. Wang J., Hao Y. Teaching Reform and Practice in Engineering Drawing
Based on 3D Modeling with Computer. Proceedings of the 14th
International
Conference on Geometry and Graphics, August 5-9, 2010, Kyoto, Japan.
e-Publication in CD format. -7 pp.
12. Branoff T. J., Dobelis M. Engineering Graphics Literacy: Measuring
Students’ Ability to Model Objects from Assembly Drawing Information.
Proceedings of the 66th
Midyear Conference of the Engineering Design
Graphics Division of the American Society for Engineering Education,
Galveston, Texas, January 22-24, 2012, p. 41-52.
13. Strong S., Smith R. Spatial Visualization: Fundamentals and Trends in
Engineering Graphics. Journal of Industrial Technology, 18, (1), p. 1-6, 2001.
14. Adanez G. P., Velasco A. D. Predicting Academic Success of Engineering
Students in Technical Drawing from Visualization Test Scores. Journal for
Geometry and Graphics, 6, (1), p. 99-109, 2002.
15. Leopold C., Gorska R. A., Sorby S. A. International Experiences in
Developing the Spatial Visualization Abilities of Engineering Students.
Journal for Geometry and Graphics, 5, (1), p. 81-91, 2001.
16. Hsi S., Linn M. C., Bell J. E. The Role of Spatial Reasoning in Engineering
and the Design of Spatial Instruction. Journal of Engineering Education, 86,
(2), p. 151-158, 1997.

80/300 The 12th International Conference on Engineering Graphics – BALTGRAF 2013
17. Martín-Dorta N., Saorín J. L., Contero M. Development of a Fast Remedial
Course to Improve the Spatial Abilities of Engineering Students. Journal of
Engineering Education, 97, (4), p. 505-513, 2008.
18. Sorby S. A. Improving the Spatial Visualization Skills of Engineering
Students: Impact on Graphics Performance and Retention. Engineering
Design Graphics Journal, 65, (3), p. 31-36, 2001.
19. Dobelis M., Branoff T., Nulle I. Quantitative Assessment of the Students’
Engineering Graphics Literacy via Modeling Objects from Assembly Drawing
Information. Proceedings of the 15th
International Conference on Geometry
and Graphics, August 1-5, 2012, Montreal, Canada. e-Publication in DVD
format. -12 pp.
20. The Hawthorne Effect. http://encyclopedia.thefreedictionary.com/Hawthorne
effect [access Mar 14, 2013].

The 12 th International Conference on Engineering Graphics
BALTGRAF 2013 June 5-7, 2013, Riga, Latvia
81/300
SOME REFLECTIONS ON TEACHING GEOMETRY AND
ENGINEERING GRAPHICS
Jolanta DZWIERZYNSKA1
1. ABSTRACT
The main aim of the paper is to present didactic experience resulting from introducing
a new concept of the laboratory exercise realized within the subject Geometry and
Engineering Graphics at Civil Engineering Faculty of Rzeszow University of
Technology. Wanting to make students be more creative and interested in drawing,
2D drawing has been replaced by 3D one. Thereby, new abilities of the program
AutoCAD 2012 have been exploited at creating projections of the figure on the basis
of the spatial model of it. The new concept of the students’ task has released the
students from the monotonous work and has left more time for creation of new forms
and accumulation of certain skills and knowledge.
The paper reflects the role of the educators in adaptation of the topics, teaching
methods and tools correspondingly to the needs of the future engineer.
KEYWORDS: Engineering Graphics, Education, AutoCAD
2. INTRODUCTION
A new educational system according to the Bologna Declaration has had a
significant impact on the creation and development of the new curricula at Polish
technical universities. In general, it has caused limitations of the teaching hours of the
particular subjects, as well as elimination or creation of the new ones. On the other
hand, a continuously developing CAD world has greatly influenced the technical
education at all levels of learning. Thereby, the content of teaching geometry as a
technical subject has changed a lot too. Moreover, the subject Geometry and
Engineering Graphics (Descriptive Geometry first) has been submitted to the new
rules and the new standards. The standards of teaching this subject have started to
cover not only descriptive geometry – different methods of projections and technical
drawings, but also introduction to Computer Aided Design.
1 Dep. of Architectural Design and Engineering Graphics, Rzeszow University of Technology, Al.
Powstancow Warszawy 12, 35-959 Rzeszow, Poland, e-mail:[email protected]
82/300 The 12th International Conference on Engineering Graphics – BALTGRAF 2013
3. GEOMETRY AND ENGINEERING GRAPHICS AT RZESZOW
UNIVERSITY OF TECHNOLOGY
The students of Civil Engineering Faculty at Rzeszow University of
Technology are taught Geometry and Engineering Graphics during two semesters at
the first year of study. The number of hours, which are devoted to technical drawings
and engineering graphics, is only twenty hours during the second semester of study.
The students spend these hours in a computer lab working with AutoCAD. Twenty
ours of the classes for getting acquainted with the bases and principles of making
technical drawings, architectural drawings and building structural drawings it is not a
lot. Due to this insufficient number of academic hours specified for the computer lab,
the teaching has been limited to the teaching of drawing only two-dimensional
pictures. At the beginning of the laboratory classes students are introduced with a
short review of the general fundamentals of the work with AutoCAD system, and
then they carry out the laboratory exercises. Although the program AutoCAD is
treated only as the tool for drawing, the students have to master this tool well, in
order to perform the laboratory tasks.
The exercises the students had to carry out as a part of the laboratory classes
were as follows:
1. The technical drawing of the figure.
Three projections according to the Monge’s method of the certain figure were
given. One had to copy the top and front views, draw the cross section of the figure
and make dimensions of it.
2. The architectural drawing of the ground floor plan of a building.
The template of the architectural drawing was given. One had to draw an
architectural ground floor plan of the building on the base of the template (draw outer
and inner walls, stairs, put the symbols of windows, doors, sanitary facilities, create
dimensions according to the standards) [3].
3. The working drawing of a ferroconcrete bean.
The draft of the ferroconcrete bean was given. One had to prepare a working
drawing of it (draw bean views and reinforcing, cross sections, make dimensions
according to the standards requirements) [3].
4. The working drawing of the steel pole or the base of the pole.
The draft of the steel pole was given. The pole was composed of two beams;
T-profile one and C-profile one. One had to prepare the working drawing of it [3].
It is worth remarking that, the designing assumptions of these four exercises
were prepared individually for each student, so every one of them had to work
independently.
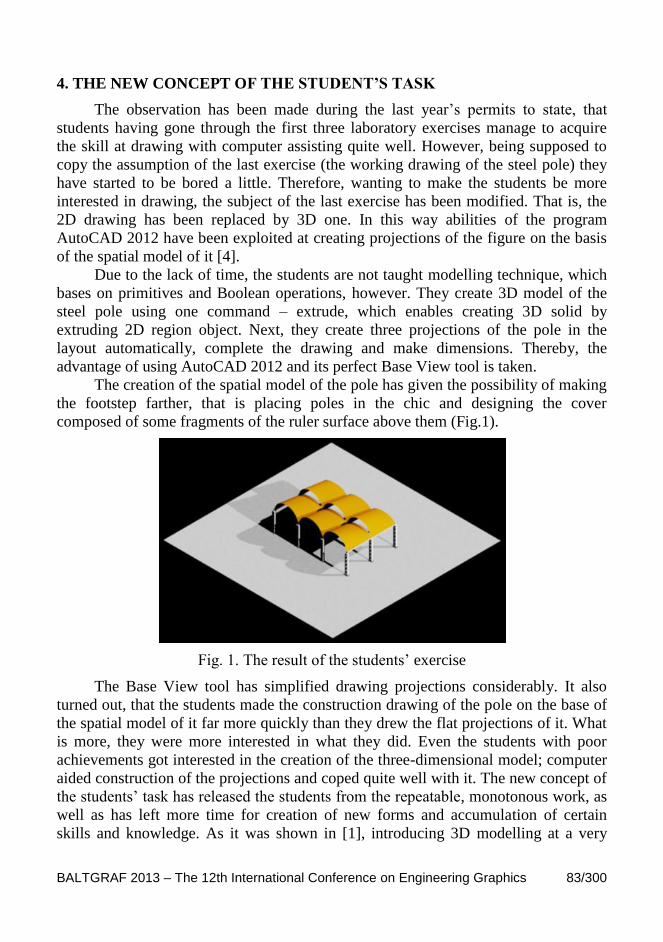
BALTGRAF 2013 – The 12th International Conference on Engineering Graphics 83/300
4. THE NEW CONCEPT OF THE STUDENT’S TASK
The observation has been made during the last year’s permits to state, that
students having gone through the first three laboratory exercises manage to acquire
the skill at drawing with computer assisting quite well. However, being supposed to
copy the assumption of the last exercise (the working drawing of the steel pole) they
have started to be bored a little. Therefore, wanting to make the students be more
interested in drawing, the subject of the last exercise has been modified. That is, the
2D drawing has been replaced by 3D one. In this way abilities of the program
AutoCAD 2012 have been exploited at creating projections of the figure on the basis
of the spatial model of it [4].
Due to the lack of time, the students are not taught modelling technique, which
bases on primitives and Boolean operations, however. They create 3D model of the
steel pole using one command – extrude, which enables creating 3D solid by
extruding 2D region object. Next, they create three projections of the pole in the
layout automatically, complete the drawing and make dimensions. Thereby, the
advantage of using AutoCAD 2012 and its perfect Base View tool is taken.
The creation of the spatial model of the pole has given the possibility of making
the footstep farther, that is placing poles in the chic and designing the cover
composed of some fragments of the ruler surface above them (Fig.1).
Fig. 1. The result of the students’ exercise
The Base View tool has simplified drawing projections considerably. It also
turned out, that the students made the construction drawing of the pole on the base of
the spatial model of it far more quickly than they drew the flat projections of it. What
is more, they were more interested in what they did. Even the students with poor
achievements got interested in the creation of the three-dimensional model; computer
aided construction of the projections and coped quite well with it. The new concept of
the students’ task has released the students from the repeatable, monotonous work, as
well as has left more time for creation of new forms and accumulation of certain
skills and knowledge. As it was shown in [1], introducing 3D modelling at a very

84/300 The 12th International Conference on Engineering Graphics – BALTGRAF 2013
initial level of university education accelerated the development of “spatial thinking”,
necessary for understanding geometric configuration of the engineering objects.
Nowadays, the students not only have to face similar quantity of material
(necessary elements of the image, contents of projections, principles of dimensioning
according to standards) as other students did in the past, but additionally, they have to
master computer as a drawing tool. On the other hand, new and new versions of
AutoCAD program give new and new possibilities of simplifying drawing and make
it more effective. Therefore, there is no doubt the updated drawing tools should be
used in students work. However, one should take advantage of the new versions of
AutoCAD and its new tools very carefully. AutoCAD 2013 enables drawing the cross
section automatically. In the author’s opinion, however, this option should be exploit
very carefully, or even omit at the first level of education, when student have to work
at shaping his/her spatial imagination. The program should not replace student’s
work, but only simplify it and help the student to express his/her design idea.
Therefore, application of the new tools and right selection of them should be
important and dependent on the level of education, as well as, the progress of
teaching.
6. CONCLUSIONS
It is educators responsibility to continually reflect on what they teach and
how [2].
They should carefully analyse the needs of the future engineer and adapt
topics and teaching methods correspondingly.
The application of the new drawing tools and choice of them should be
crucial.
To make students being creative and interested in a new presented material
one ought to be flexible and responding to contemporary world.
7. REFERENCES
1. Baušys R., Žiūrienė R. Some Aspects of Educational Paradigm of Engineering
Graphics, Proceedings of 10th
International Conference on Engineering
Graphics, Vilnius, 2009, p. 13-18.
2. Branoff T. Teaching at a Distance: Challenges and Solutions for Online
Graphics Education, Proceedings of 13th
International Conference on
Geometry and Graphics, Dresden, 2008. -9 pp.
3. Polish standards for: Technical Drawings, Construction Drawings, Building
Design, Technical Product Documentation. http://www.pkn.pl. (in Polish).
4. AutoCAD 2012/LT2012/WS+, Wydawnictwo Naukowe PWN, Warszawa,
2011. (in Polish).
The 12 th International Conference on Engineering Graphics
BALTGRAF 2013 June 5-7, 2013, Riga, Latvia
85/300
BIM TECHNOLOGY APPLICATION EFFICIENCY IN
ARCHITECTURAL ENGINEERING STUDIES AT VILNIUS
GEDIMINAS TECHNICAL UNIVERSITY
Tatjana GRIGORJEVA1, Birutė JUODAGALVIENĖ
2,
Eglė TAUTVYDAITĖ3
1. ABSTRACT
Architectural Engineering studies are very popular around the world. At Vilnius
Gediminas Technical University this study program has been taught for 10 years. The
graduates of this study program have successfully worked as architects or engineers
in Lithuanian and foreign companies. One of the reasons for this success lies in the
innovative study process. BIM technology is consistently integrated in the studies
covering four years of Bachelor’s and Master’s degree studies. Each project of
different types of structures consists of four parts: architectural and visualization part,
constructional part, calculation and design of structures and technical documentation.
According to the main principles of BIM technology, the single model for a full range
of actions starting from the development of virtual form, which describes all physical
parameters characteristic of a real project and defines the conditions of its position, is
created. Then the analysis of the model behaviour under real maintenance conditions
is performed: actions and loads are described and the obtained results are analysed.
The results obtained during the analysis are presented in technical documentation:
drawings are generated, detailing of nodes and elements is performed, specifications
and estimates are composed.
KEYWORDS: Architectural Engineering, Computer Aided Design, Building
Information Modelling, Study Process
2. INTRODUCTION
With the development of information technologies in the field of computer-
aided design the concept of BIM – Building Information Modelling or Building
Information Model is increasingly used. Today BIM represents a new concept of
1 Dep. of Architectural Engineering, Vilnius Gediminas Technical University, Sauletekio al. 11,
Vilnius, LT-10223, Lithuania, e-mail: [email protected] 2 Dep. of Architectural Engineering, Vilnius Gediminas Technical University, Sauletekio al. 11,
Vilnius, LT-10223, Lithuania, e-mail: [email protected] 3 Dep. of Architectural Engineering, Vilnius Gediminas Technical University, Sauletekio al. 11,
Vilnius, LT-10223, Lithuania, e-mail: [email protected]
86/300 The 12th International Conference on Engineering Graphics – BALTGRAF 2013
computer-aided design. The essence of this conception may be described as a way to
develop the strategy of building project design based on the computer-aided
modelling [1].
The main task of architects and engineers is to prepare the project of the
building quickly and efficiently. The project must be unique in terms of architecture
and ensure rational structural solutions. The design of building architectural part
begins with the conceptual stage, when ideas and primary suggestions are formulated
and presented. Later, according to all the requirements, particular volumetric-
planning solutions are prepared and all the necessary project documentation is issued.
The design of the building structural part – is firstly concerned with analyse bearing
structures. The analysis results are presented in the technical documentation:
drawings, final detailing of connections, bill of materials, various reports,
specifications and estimates. The documentation must be comprehensive and provide
sufficient amount of information in each stage of the project realization: design,
expertise and construction [2].
Today architectural and structural parts of the building project are presented as
general or detailed drawings with specifications of materials. The manufacturers of
bearing structures complement the project by detailing drawings and other fabrication
documentation. For these reasons, the quality of the project documentation in all its
stages suffer, errors occurs. Error detection hinders the process of design and
construction. Time and money are lost and in the worst case failures occurs in the real
object [3].
3. TRADITIONAL COMPUTER–DESIGN SYSTEMS AND ITS
APPLICATION IN STUDY PROCESS
Today general graphic systems, like AutoCAD, are used for preparing of
architectural and structural drawings and analysis of bearing structures is performed
in separate system. This standpoint does not ensure the solution of above mentioned
problems. Single source of information generation and designing process controlling
remains the human, who firstly is creating drawings, later make all corrections and
updates. Also the human detect all the errors and correct it. There is no doubt, that
this technology of project documentation creation has some advantages, but do not
ensure harmonized information updating between all the project participants during
the all design and construction stages. The analysis of the bearing structures is one of
the most important parts of building project. Any structural solution should be based
on calculations and analysis and satisfy all strength, reliability and durability
requirements. The engineer, in order properly determine stress and deformation state
of building structures, to solve design or verification tasks, forced to formalize the
actual structure, making it an idealized computational scheme. For a long time
graphical systems and analysis systems was developed in parallel as independent
systems. Today modern computer-aided design systems are fully integrated with
analysis systems [4].
BALTGRAF 2013 – The 12th International Conference on Engineering Graphics 87/300
So, the main purpose of computerization is to warrant circulation of information
between all project participants. It ensures by using of modern computer-aided design
systems integrated with analysis software.
These modern computer systems extensively implemented at Lithuanian
architectural and structural design companies. Department of Architectural
Engineering at Vilnius Gediminas Technical University in purpose to ensure
graduates competitiveness in labour market, intensively integrates into the study
process both traditional computer-aided design systems and systems based on
building information modelling.
4. MODERN BUILDING INFORMATION MODELING CONCEPTION
Modern computer aided design technology is based on fundamentally new
design methodology. According this methodology 3D graphical-information model of
building is creating. This 3D model contains all necessary information about building
geometrical, physical, and mechanical and other parameters.
In principle, this model is a project database, single information source for all
participants of building design and erection process [1, 5] (Fig. 1).
3D graphical–information model of building consists of parametric objects
arranged in the virtual space as real elements of a building. At any time graphical
information can be generated from a model in standard form: plans, elevations,
sections, images, details, and etc. Also from the same model various tables,
specifications, sheets of quantities of materials and production, reports and estimates
are generated. Associative links between the computer model and drawings allows
updating of all technical documentation after the revision and updating of the main
3D graphical – information model. Graphic–information modelling provides a unified
project management system that allows: adjust the technological design process steps,
synchronize and coordinate the actions of participants of the design process, store
design and development history in the unified database.
The design process based on a graphic–information modelling concept includes
the following steps:
a virtual prototype of a real structure with all inherent characteristics of the
actual structure (geometry, cross sections, materials, boundary conditions
and loads) is created;
the virtual model testing is conducted with the aim to evaluate the behaviour
of current structure and to find optimal design solution;
the kit of necessary technical documentation is generated directly from the
virtual model.
BIM technology using can achieve the following, very important for the smooth
building design, erection and management process aims:
co-operation between all building design and construction process
participants;

88/300 The 12th International Conference on Engineering Graphics – BALTGRAF 2013
data exchange with other participants; coordinated arranging, adjusting and updating of documents;
quantities of materials and products, financial resources calculation;
planning and searching of optimal variant.
The main advantages of BIM technology are:
consistent conceptual design;
complex analysis of the bearing structures;
creation of the drawings;
quantities of the materials and structures, specifications;
calculation of the estimates;
planning of the building construction;
selection of the optimal variant of project.
So, the modern BIM technology allows creating design, construction and
exploitation strategy of building object, based on computer–aided and graphic
modelling techniques. This technique provides integrated management of graphic
(CAD) and databases (DB). Allows separate participants of building design and
erection process to combine into united team, better, cheaper and faster to carry out
building design, erection and exploitation stages [4].
In future grows the number of BIM technology users, which are interested in
increasing of business efficiency and productivity.
5. BUILDING INFORMATION MODELING IN ARCHITECTURAL
ENGINEERING STUDIES
Architectural Engineering studies are popular around the world. At Vilnius
Gediminas technical university this study program is rather new and has been taught
Fig. 1. The concept of Building Information Modeling (BIM)
BIM
MODEL
Architectural
drawings
Architectural
visualizations
Structural
drawings
Structural
analysis and
design
Detailing of
structural joints Quantities of
materials
Construction
and
exploitation
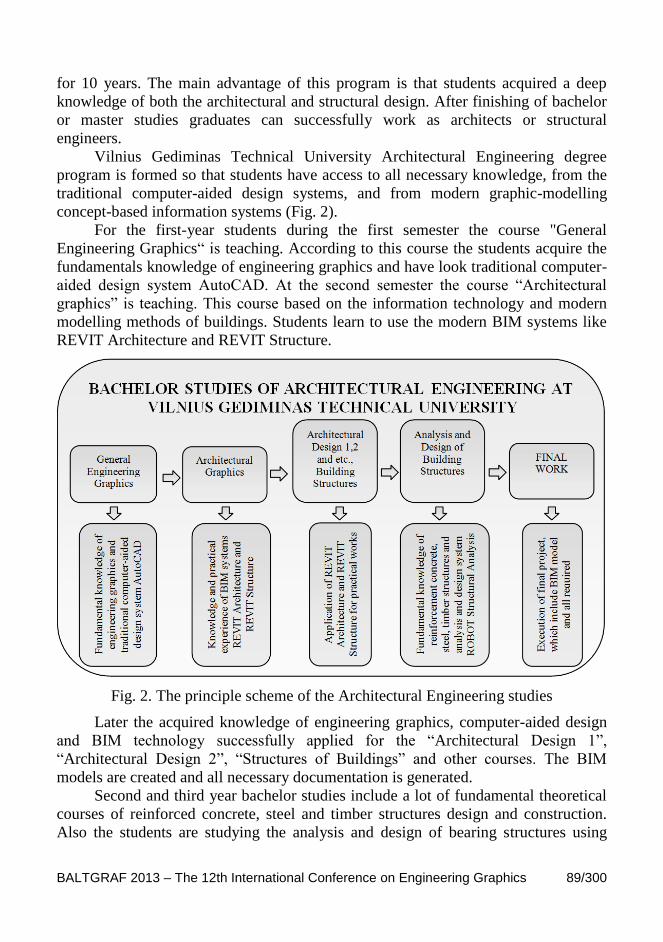
BALTGRAF 2013 – The 12th International Conference on Engineering Graphics 89/300
for 10 years. The main advantage of this program is that students acquired a deep
knowledge of both the architectural and structural design. After finishing of bachelor
or master studies graduates can successfully work as architects or structural
engineers.
Vilnius Gediminas Technical University Architectural Engineering degree
program is formed so that students have access to all necessary knowledge, from the
traditional computer-aided design systems, and from modern graphic-modelling
concept-based information systems (Fig. 2).
For the first-year students during the first semester the course "General
Engineering Graphics“ is teaching. According to this course the students acquire the
fundamentals knowledge of engineering graphics and have look traditional computer-
aided design system AutoCAD. At the second semester the course “Architectural
graphics” is teaching. This course based on the information technology and modern
modelling methods of buildings. Students learn to use the modern BIM systems like
REVIT Architecture and REVIT Structure.
Fig. 2. The principle scheme of the Architectural Engineering studies
Later the acquired knowledge of engineering graphics, computer-aided design
and BIM technology successfully applied for the “Architectural Design 1”,
“Architectural Design 2”, “Structures of Buildings” and other courses. The BIM
models are created and all necessary documentation is generated.
Second and third year bachelor studies include a lot of fundamental theoretical
courses of reinforced concrete, steel and timber structures design and construction.
Also the students are studying the analysis and design of bearing structures using

90/300 The 12th International Conference on Engineering Graphics – BALTGRAF 2013
ROBOT Structural Analysis software. At the end of bachelor study program the final
work is preparing. This final work consists of both architectural and structural parts.
6. BIM APPLICATION EXAMPLE
With the aim to demonstrate the efficiency of BIM technology the final
bachelor work “The Museum of Art at Vilnius, Upes Str.” of student of the
Department of Architectural Engineering at Vilnius Gediminas Technical University
Egle Tautvydaite defended at 2011 spring is presented below.
Firstly the architectural part of project was created. This part contains the
principle idea of architecture, the detailed architectural 3D model and all necessary
drawings (Fig. 3). The next step of project was the structural part. This part consists
of calculations of bearing structures and drawings (Fig. 4).
Fig. 3. The Architectural part of final work
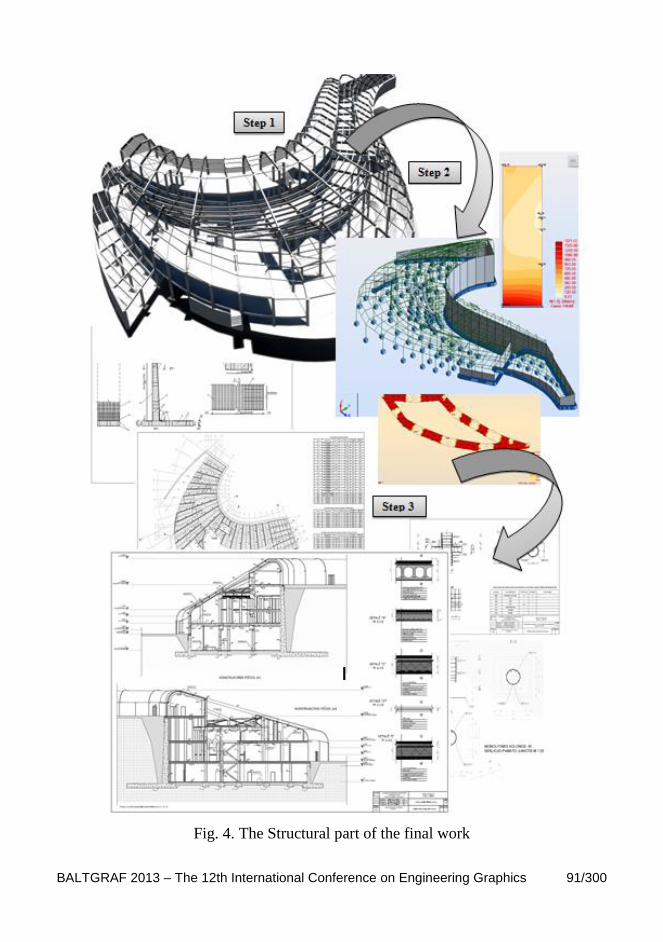
BALTGRAF 2013 – The 12th International Conference on Engineering Graphics 91/300
Fig. 4. The Structural part of the final work

92/300 The 12th International Conference on Engineering Graphics – BALTGRAF 2013
The detailed 3D model (Fig. 4, step 1) was imported into the environment of
calculations of structures. Then the design of bearing structures was done and the
results was analysed (Fig. 4, step 2) the drawings of structures were generated (Fig. 4,
step 3).
The last step of the final work was some interior visualization (Fig. 5). For the
final work defence the kit of architectural and structural drawings, the 3D model and
posters were prepared.
Fig. 5. The visualizations of the final work project
7. CONCLUSIONS
During the last years there is strong request from the market for the computer-
aided design software for the building design is occurs. It should be the flexible and
versatile software with extended graphics integration to simulation and analysis
systems within a user-friendly design environment. With the aim to give the more
possibilities at competitive struggle Vilnius Gediminas Technical University gives for
Architectural Engineering study graduate’s knowledge of innovative design software.
Such as BIM technology is consistently integrated in the study process. The
successful students’ final works shows the efficiency of such approach.

BALTGRAF 2013 – The 12th International Conference on Engineering Graphics 93/300
8. REFERENCES
1. C. Eastman, P. Teicholz, R. Sacks, K. Liston. BIM handbook. New Jersey:
John Wiley & Sons, 2008.
2. V. Popov, T. Grigorjeva. Integrated Design Systems in Building Construction.
Proc. Conf. on Advanced Construction, Kaunas, 2007, p. 30-39.
3. V. Popovas, A. Jarmolajevas, T. Grigorjeva. Automated Design Systems
Today. New construction magazine, 6-7, 2003, p. 26-29, p. 40-41.
4. V. Popov, T. Grigorjeva. Integrated Computer-aided Design of Building
Structures. Building Structures and Technologies, 2, 2010, p. 31-37.
5. W. Kymmell. Bilding Information Modeling. New York: McGraw-Hill, 2008.

94/300 The 12th International Conference on Engineering Graphics – BALTGRAF 2013

The 12 th International Conference on Engineering Graphics
BALTGRAF 2013 June 5-7, 2013, Riga, Latvia
95/300
GEOMETRICAL ASPECTS OF RESTITUTION
AND REVITALIZATION OF THE WOODEN
ARCHITECTURAL STRUCTURES
Renata Anna GÓRSKA1
1. ABSTRACT
The purpose of the work is to provide evidence of geometrical restitution of the old
wooden church which has been moved from the small village of Jawornik near
Myślenice in the Southern part of Poland into the district of Nowa Huta in the years
1983 to 1986. The reconstruction of the whole church together with the restitution of
a wooden bell tower which was burnt down in a fire required wide geometrical
knowledge of a perspective projection.
Reference to the old design drawings has been here provided. Good knowledge of
carpentry works and structures and various types of wooden joints have been used to
revitalize the old structure. This work has been dedicated to engineer architect
Kazimierz Terlecki who was the author of the architectural design project and who
supervised the reconstruction on the site.
KEYWORDS: Revitalisation of Architectural Structures, Geometry, CAD
2. INTRODUCTION
As the website [3] provides information there is “251 most valuable and highly
interesting historic wooden buildings”, which create the space of the “Wooden
Architecture Route in Małopolska” in the southern part of Poland. We can read
further that “along the trail are picturesque Roman Catholic, Greek Catholic and
Orthodox churches, tall bell towers, old polish manor and detached houses, heritage
parks, all of which are considered invaluable legacy of folk culture that stood the test
of time”.
It is a family story of the author whose father, Eng. architect Kazimierz
Terlecki, worked on reconstruction of the Auxiliary Church of St. John the Baptist
and our Lady of Scapular in Kraków-Krzesławice (Fig. 1). The baroque church was
originally built from 1633-48 in Jawornik near Myślenice (30 km out of Kraków in
direction to the South). The efforts of the parish priest Monsignor Jan Hyc brought
1 A-43, Faculty of Architecture, Cracow University of Technology, Warszawska st. 24/ 31-155,
Kraków, Poland, e-mail: [email protected]

96/300 The 12th International Conference on Engineering Graphics – BALTGRAF 2013
about a difficult at those still communist times decision made by the municipal
authorities who issued acceptance for the idea of moving the church to the district of
Nowa Huta. Decision of the location (dated: 13.05.1983) and the conditions for
execution of the investment have been preserved in the church archive. As the
construction site the location has been chosen in the district Krzesławice in Nowa
Huta, next to the old Jan Matejko’s manor2 (Fig. 4).
In 1983-1986 the author witnessed these historical moments when the wooden
elements of the church have been taken apart from the original construction, labelled
with the system of specific designations, moved to the new location and put together
to become a treasure on the historical track of the old wooden structures. The church
has a log construction. The structure of the church roof consists of the rafter framing.
The bell tower has been completely reconstructed based on the old photographs
(Fig. 2). At this point descriptive geometry played the key role in reconstruction
works. The old bell tower burnt down when the church stood still in Jawornik
(Fig. 2a) and there was no documentation available to support reconstruction works.
3. LOCATION SITE OF THE CHURCH
The church has been located on a plot that was the municipal ground property
in the district of Krzesławice. From the technical documentation which is still
preserved in the church files one can read the following technical data:
1) Ground area for the site location – 2950 m2;
2) Site area used by the church structure – 155.74 m2;
3) Site area used by the reconstructed tower – 48.26 m2;
4) Cubic capacity of the structure – 822.10 m3;
5) Cubic capacity of the tower – 1526.10 m2.
The roof structure consists of piles and the joists and has been covered with
wooden shingles. The reconstructed tower has also the structure with the elements of
the piles, braces and joists. Geometrical construction of the tower structure constitutes
of a truncated pyramid with the base 7.30×6.25 m, with two cupolas: one situated on
the level +15.10 m, the other at 19.20 m.
The walls of the church have cladding made of wooden planks. All the
woodwork elements such as doors and windows have been impregnated and fire
protected.
In a plan view the basic dimensions of the church structure are: the length
17.37 m, width 7.70 of the main nave of the church.
2 The Auxillary Church of St. John the Baptist and Our Lady of the Scapular in Kraków-Krzesławice
ul. Melchiora Wańkowicza, 31-983 Kraków, PL

BALTGRAF 2013 – The 12th International Conference on Engineering Graphics 97/300
a) Geodesic plan of the church
b) Land development plan for the church
Fig. 1. Plot location for the Church of St. John the Baptist and our Lady of Scapular
in Kraków- Krzesławice: a) geodesic plan, b) Land development plan for the church
4. GEOMETRICAL RECONSTRUCTION OF THE CHURCH TOWER
The reconstruction of a photographical picture complies with the methods
applied in theory of perspective projection. Leopold [1, p. 246-248] for example
provides in her textbook two methods for reconstruction of photographic pictures;
both methods are based on the ability to recognize a rectangle of the fixed dimensions
within the photographic picture. In practice two cases of the method have been
distinguished: 1) the recognized rectangle with the fixed dimensions can be
positioned vertically or 2) the rectangle can be positioned horizontally in reference to
the ground plane. In both cases the horizon line has been determined at first which in
most cases in not a difficult task. This type of photographic restitution refers to the
cases of a perspective projection (not the general case of a central projection) when
the verticals retain their vertical direction in the photographic picture.
Restitution of the picture (Fig. 2a) has been done (author: Dr hab. inż. O. Vogt)
based on the available pictures. Pillet’s ranges of points [1] have been used to
recognize the heights of the main points of the construction (Fig. 3). Firstly, Vogt
constructed the horizon line, then provided two linear measures (Fig. 3b) with
relevant scales 1:50 and 1:100 and spaced from each other at the distance of 20 cm
which in a scale 1:50 is equivalent to the distance of 10m. Then he fixed the Pillet’s
range of points to find the intermediate points on the enlarged picture. By connection
of respective points on two homographic ranges of points he determined the vertex of
the Pillet’s pencil and thus the main height points of the structure were labelled with
the relevant levels.
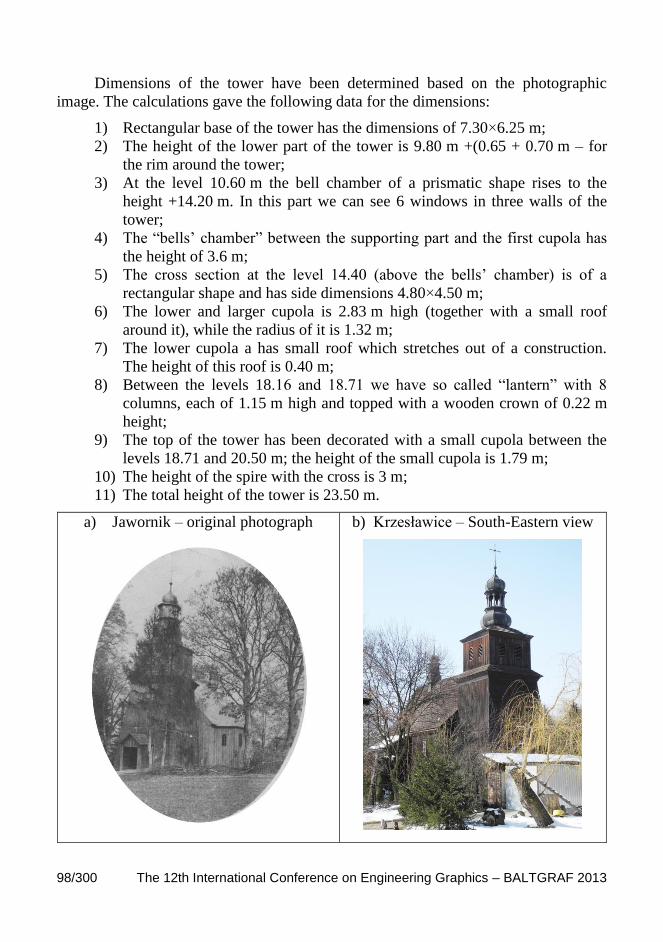
98/300 The 12th International Conference on Engineering Graphics – BALTGRAF 2013
Dimensions of the tower have been determined based on the photographic
image. The calculations gave the following data for the dimensions:
1) Rectangular base of the tower has the dimensions of 7.30×6.25 m;
2) The height of the lower part of the tower is 9.80 m +(0.65 + 0.70 m – for
the rim around the tower;
3) At the level 10.60 m the bell chamber of a prismatic shape rises to the
height +14.20 m. In this part we can see 6 windows in three walls of the
tower;
4) The “bells’ chamber” between the supporting part and the first cupola has
the height of 3.6 m;
5) The cross section at the level 14.40 (above the bells’ chamber) is of a
rectangular shape and has side dimensions 4.80×4.50 m;
6) The lower and larger cupola is 2.83 m high (together with a small roof
around it), while the radius of it is 1.32 m;
7) The lower cupola a has small roof which stretches out of a construction.
The height of this roof is 0.40 m;
8) Between the levels 18.16 and 18.71 we have so called “lantern” with 8
columns, each of 1.15 m high and topped with a wooden crown of 0.22 m
height;
9) The top of the tower has been decorated with a small cupola between the
levels 18.71 and 20.50 m; the height of the small cupola is 1.79 m;
10) The height of the spire with the cross is 3 m;
11) The total height of the tower is 23.50 m.
a) Jawornik – original photograph
b) Krzesławice – South-Eastern view

BALTGRAF 2013 – The 12th International Conference on Engineering Graphics 99/300
c) Wooden log construction of the
church
d) Krzesławice – South-Western view
Fig. 2. Four photographs of the Church a) the old photograph from Jawornik,
b) contemporary picture of the Church, c)
a) Heights determination using the
Pillet’s range
b) Pillet’s homographic ranges of points
Fig. 3. Scan of the restitution provided for the photographic image

100/300 The 12th International Conference on Engineering Graphics – BALTGRAF 2013
Reconstruction of the wooden tower required good knowledge of carpentry
work. Fig. 4a shows the construction carrying 2 bells (between the levels +10.60 and
14.20). The system of piles, joists and bracings carry the bells. Structural resistance
and rigidity has been achieved by application of the bracings.
In Fig. 4b we can see the construction of the small cupola between the levels
+18.71 and +20.50 where the top spire of the tower has been fixed. Both cupolas, the
lower and the upper one have been constructed based on the octagon and have the
symmetric construction.
a)
b)
Fig. 4. Wooden construction of the tower:
a) Piles, joists and bracing of the bells-carrying grate between the levels 10.60
and 14.20; b) Small cupola between the levels +18.71 and +20.50
Both cupolas have been constructed with aid of the wooden templates which
have been made of wood planks (5/4”) and driven by nails. The curvature of the
external edge of the template was obtained by segmentation of the curvature into 6
divisions. The whole construction of a cupola took 8 templates fixed together with the
system of braces. The cupolas have been coated with planks (1”) with the spaces of
1 mm provided between them. The whole structure has been faced with a copper
sheet 0.5-0.7 mm thick. The cross-section of the tower has been presented in Fig. 5.
Construction of the templates can be noticed in the picture.

BALTGRAF 2013 – The 12th International Conference on Engineering Graphics 101/300
Fig. 5. Architectural construction drawing of the large and small cupolas,
the lantern between them and the spire

102/300 The 12th International Conference on Engineering Graphics – BALTGRAF 2013
5. SIMPLICITY OF GEOMETRICAL SOLUTIONS
Fig. 6. Wooden construction of the supporting grate below the lower cupola
(level +14.40) – geometrical solutions for structural resistance
In Fig. 6 we can see the construction of a wooden grate supporting the columns
which create the lantern above the larger cupola (cross-section at level +14.40). The
construction joists of the tower floor (level +14.20) are uniformly displaced at 0.95 m
and parallel to the tower faces (vertical lines denoted with a centre line at the top of
Fig. 5). It has been assumed that there will be 8 columns creating the lantern. If
regularly distributed, they would be arranged around a circle. The radius of the circle
r = 0.80 m has been assumed. Fig. 7 presents the idea of distribution and the ideal
drawing of the supporting grate together with the principal directions of the joists
which were supposed to go somehow across the horizontals and vertical directions so
that they can be supported by the floor beams structure. The reason for such
distribution of joists laid on the assumption that every two neighbouring columns
should stand on a common joist.
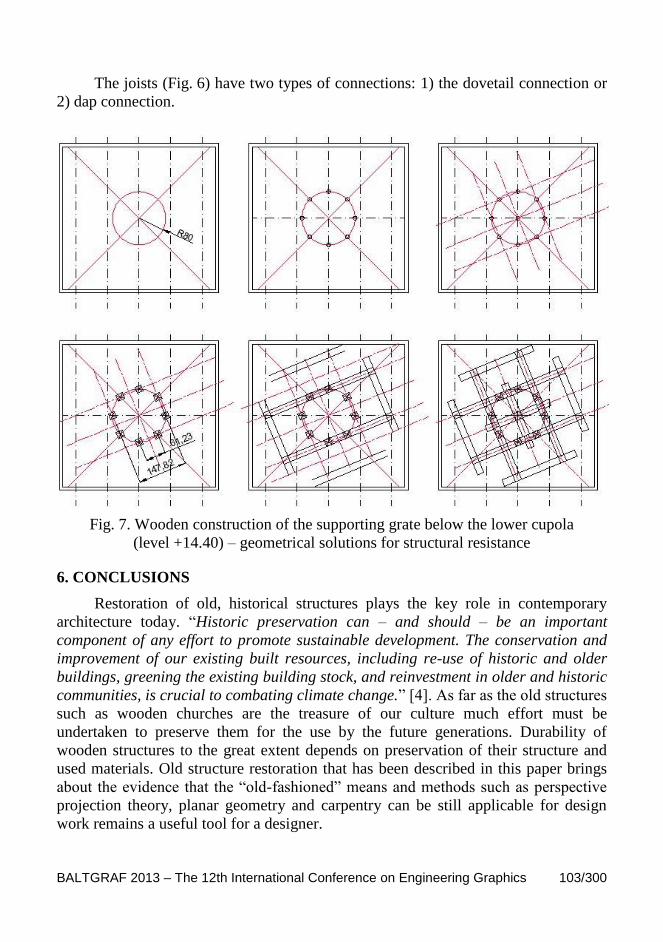
BALTGRAF 2013 – The 12th International Conference on Engineering Graphics 103/300
The joists (Fig. 6) have two types of connections: 1) the dovetail connection or
2) dap connection.
Fig. 7. Wooden construction of the supporting grate below the lower cupola
(level +14.40) – geometrical solutions for structural resistance
6. CONCLUSIONS
Restoration of old, historical structures plays the key role in contemporary
architecture today. “Historic preservation can – and should – be an important
component of any effort to promote sustainable development. The conservation and
improvement of our existing built resources, including re-use of historic and older
buildings, greening the existing building stock, and reinvestment in older and historic
communities, is crucial to combating climate change.” [4]. As far as the old structures
such as wooden churches are the treasure of our culture much effort must be
undertaken to preserve them for the use by the future generations. Durability of
wooden structures to the great extent depends on preservation of their structure and
used materials. Old structure restoration that has been described in this paper brings
about the evidence that the “old-fashioned” means and methods such as perspective
projection theory, planar geometry and carpentry can be still applicable for design
work remains a useful tool for a designer.

104/300 The 12th International Conference on Engineering Graphics – BALTGRAF 2013
All the technical drawings which are here inserted were originally hand-made
done by the architect Kazimierz Terlecki. The beauty of the drawings cannot be
neglected.
7. REFERENCES
1. Bartel K. Perspektywa malarska. PWN, Warszawa, 1955, -85 pp. (in Polish).
2. Leopold C. Geometrische Grundlagen der Architekturdarstellung. Verlag H.
Kohlhammer, 1999, S. 246-249. (in German).
3. http://www.drewniana.malopolska.pl/?page=obiekty&id=76. (in Polish).
4. Sustainable Preservation.
http://en.wikipedia.org/wiki/Sustainable_preservation.

The 12 th International Conference on Engineering Graphics
BALTGRAF 2013 June 5-7, 2013, Riga, Latvia
105/300
ZANIS WALDHEIMS' GEOMETRICAL ART
Yves JEANSON1
ABSTRACT
The intention of this paper is to make known the intellectual and artistic creative
process of Latvian born Zanis Waldheims (Riga, Latvia 1909 – Montreal, Canada
1993) who has come to imagine and develop an approach – similar to a graphic
design language – to illustrate in a nonfigurative art form – his interpretation of
concepts and findings inspired from his research in the broad range of scientific and
philosophic domains also from psychology. The original source of his inspiration
comes from the idea of French philosopher Maine de Biran, – in the creation of a map
for human orientation – that will find its way in a structural art based on geometry as
an abstraction, that will lead him to create – over a period of four decades – six
hundred large scale geometric artworks, also to copyright a twenty-two chapter thesis.
KEYWORDS: Geometrical Abstraction Art, Aesthetic Structural Language
TRANSCENDING SIGNS AND GRAFFITI
Looking at Waldheims’ research books, on can notice in the margins, hundreds
of small geometrical figures that he intuitively drew to transform the one-dimensional
linear order of words into a two – or a three-dimensional representation. Single
squares and circles, paired circles, concentric squares and circles, diagonals, arrows
indicating directions and similar basic geometrical figures viewed in plan or elevation
views are the basic elements of his abstract geometrical art. One understands that
Waldheims had a very strong natural inclination and sensibility towards geometrical
forms and visual arts. (Fig. 1. Transcending Signs and Graffiti. Excerpts from
Edmund Husserl’s French translation of General Introduction to Pure
Phenomenology.)
PROSPECTIVE IDEAS FROM THE DOMAIN OF THEORETICAL
PHYSICS
Although there are many sources of inspiration in Waldheims’ work, one source
that will play a definite influence in the elaboration of his graphic and geometrical
language will come from what is known in the scientific domain as Weyl-
Minkowsky’s Universe. Waldheins’ geometrisation idea is inspired from the
1 Freelancer, Montreal, Canada, e-mail: [email protected]

106/300 The 12th International Conference on Engineering Graphics – BALTGRAF 2013
graphical representation of – Causal structure, Light cone K, life line L – as
illustrated in Weyl’s book: Philosophy of Mathematics and Natural Science. (Fig. 2.
Causal Structure). However, he will reinterpret this representation in his own terms
by transferring on the horizontal axis what was originally on the vertical axis and he
will add to his schema, lines to represent concepts of thermodynamics: matter and
energy crisscrossing their axis. He will also add curved lines to represent outside
dynamic influential forces. (Fig. 3.) He will also retain the hatched lines from Weyl-
Minkowsky’s original graphic shown in Figure 2 that will represent the time-space
layer over the main idea of a drawing. (Fig. 4.)
PROSPECTIVE IDEAS FROM THE DOMAIN OF PHENOMENOLOGY
Another important source of influence will come from the domain of
phenomenology, a branch from contemporary philosophy by philosopher Edmund
Husserl in which domain intuition plays an important role in the process of general
understanding. A sentence from Husserl’s book: General Introduction to Pure
Phenomenology suggests that “absolute reality corresponds exactly to a round
square” will have a strong impact on Waldheims’ imagination. Although this is a
material impossibility, he will interpret this geometrical metaphor in his own way. He
will imagine the square, as an imaginary limit that would progressively deform
towards the inside, generating successively in its passage a series of convex and
concave figures of which he will only keep the square, the circle, the rhombus, the
inversed circle, the XY axis, and an imaginary point as the extreme limit of the
transformation. (Fig. 5. Husserl’s “Round Square”). This will be the key to his
philosophical argument in his exhaustive geometry, that is to say, that everything
concerning human nature has three elements: an extensive, an intensive and their
integration. He will also extract from this demonstration, six figures and align them
linearly on the horizontal plane and he will give them a symbolic and relational
meaning such that the square will represent the physical and geometrical space; the
circle will represent the human being; the rhombus, the equilibrium status or
homeostasis of an organism; the inverted circle, the intellectual faculties; the XY axis
of the Cartesian geometry will represent the mathematical mind; and the centre point
which will represent a limit. (Fig. 6. Extraction of six primary geometrical figures).
Once those concepts are assimilated, one can start interpreting the art works that are
compositions based upon layers of meaning.
AN INCURSION INTO WORDS AND MEANING
From Husserl's idea of the round square he will push one step further into
geometrical abstraction with the intention to put order into the subjective domain of
words which are for him the source of incomprehension between human beings.
Specifically to the square figure, he associated the word extensive, and to the point,
the word intensive. For him, extensive represented a large broad area, a space, a limit;

BALTGRAF 2013 – The 12th International Conference on Engineering Graphics 107/300
while intensive represented, energy, tension, the other limit. Extensive and intensive
and their meaning are linked to those geometrical figures that for Waldheims are
psycho-physical elements as they represent an organic relation between feeling,
seeing and thinking. He also drew from Hegel’s idealism the idea of dialectical triads.
Thus he extended the analysis process by annotating specific words in his books with
three small geometrical figures which will bear for him three distinct values:
extensive, intensive and integrative respectively represented by the square, the
rhombus and the point. He then built what he called in his vocabulary “Units of
Sense”, sense in the sense of what does your verbal proposition mean similar to
ethical opposite such as hate and love; sense units which were composed of three
words that are logically interrelated and repositories of information for discussion and
in the solution to a problem concerning the human nature. Thus for Waldheims, to
judge a situation in respect to human relations, it is necessary to create those units of
sense. A word such as mediation is an integrative word.
THE UP-MOTION OF CONSCIOUSNESS (FIG. 7)
Although it is not specifically a sentence that will trigger Waldheim’s creative
process but an ensemble of sentences, the introduction opening sentence from
Rudolph Arnheim's book, Towards a Psychology of Art (See Arnheim’s quotation)
can resume in one drawing most of Waldheims' artistic creative process. Arnheim, the
perception psychologist, introduced Waldheims to the idea of an organic pyramid of
science, while the French palaeontologist Pierre Teilhard de Chardin in his book: Le
Phénomène Humain will give Waldheims the intellectual material that will explain
parts of the coloured drawing, for instance the unfolding of the material cosmos from
primordial particles as well as the concept of evolution and the ages of earth and the
universe. Finally, the top three upper levels of Figure 7 will represent – from the
domain of psychology – the hierarchy of consciousness over the sub-consciousness
over the unconsciousness. In its 2D physical construction, this drawing is an
elongated ovoid form composed of different layers of spheres that varies from the
very small at the bottom, to the largest at the top. In its three-dimensional rendering,
it is an organic pyramid with four sides; that when seen from the top or the bottom is
a succession of squares within squares. The originality of this intriguing octahedron is
that the perimeter of the base, after gaining in width as it gains in altitude, attains a
maximum at approximately one third of its height. At this level of elevation, the
perimeter progressively reduces towards the last two thirds due to the size increase of
the spheres as their number decreases to reach one massive sphere at the top that
represents from the domain of psychology consciousness. One of the most amazing
characteristics of Waldheims’ design is that the whole form repeats successively at
smaller scales; it has the characteristics of fractals. One can imagine that there are
curved XY plane for each level of the structure that is perpendicular to the Z axis
which is in elevation view. (Fig. 8.) Many of Waldheims’ abstract drawings are

108/300 The 12th International Conference on Engineering Graphics – BALTGRAF 2013
illustrations of studies based on the meaning of the top three levels which represent –
from the domain of psychology – the conscious (top level), (Fig. 9.); the
subconscious (second level), (Fig. 10); and the unconscious (third level) (Fig. 11).
Each level is having their particular meanings.
TOWARDS THE THIRD DIMENSION (FIG. 12)
In the last five years of his artistic production Waldheims turned his drawings
into three dimensional structures. Using Styrofoam and/or cardboard he built a series
of prototypes of his original drawings that revealed unsuspected visual effects and
additional material for discussion and interpretation. For Waldheims, this tends to
prove that there resides in man’s mind, logical and visual structures that can help to
understand the meaning of an idea at least try to represent it even it is subject to be
subjective.
SCIENTIFIC CULTURE: AN INEXHAUSTIBLE SOURCE OF
INFORMATION
Once Waldheims had set in place his geometrisation language, he devoted all of
his energies to systematically interpret texts from many domains but mainly from
psychology in order to generate meaningful designs in singles, diptychs or triptychs.
One that consults his sketch books finds the graphical web of lines and colour palette
in many designs where the division of the square and colours will structure his art. As
per example Figure 13 (Eight to the square power) where the structure of the clear
and obscure creates this unprecedented modern art chiaroscuro.
COLOURS
Colours will give flesh to the skeletons of the geometric grids or meshes of
lines and figures composing the drawing. Colours also gives the illusion of depths of
a three dimensional figure. They express the individual differences of an organic
system such as the human being. No colours will have a particular meaning but will
rather be the object of his actual sensibility. In his artistically masterful hand
application of colours, he will be able to draw tones of colours into eighteen different
shades.
CONCLUSION
An idea that is susceptible – in its visual and symbolic form – to go through
such a series of dimensions, seems to carry a sense of reality and truth that is more
explicit than if only expressed in words or formulas. It is an organic and geometrical
exhaustion: linear to surface thinking; surface thinking to three dimensional rendering
that generates the positive and the inverse of the same form, and by colours tones
that gives a sense of harmony and beauty that attracts the eye and the mind see to
provoke an aesthetic experience.

BALTGRAF 2013 – The 12th International Conference on Engineering Graphics 109/300
Fig. 1.
Fig. 2.
Fig. 3.
Fig. 4.

110/300 The 12th International Conference on Engineering Graphics – BALTGRAF 2013
Fig. 5.
Fig. 6.
Fig. 7.
=
Fig. 8.
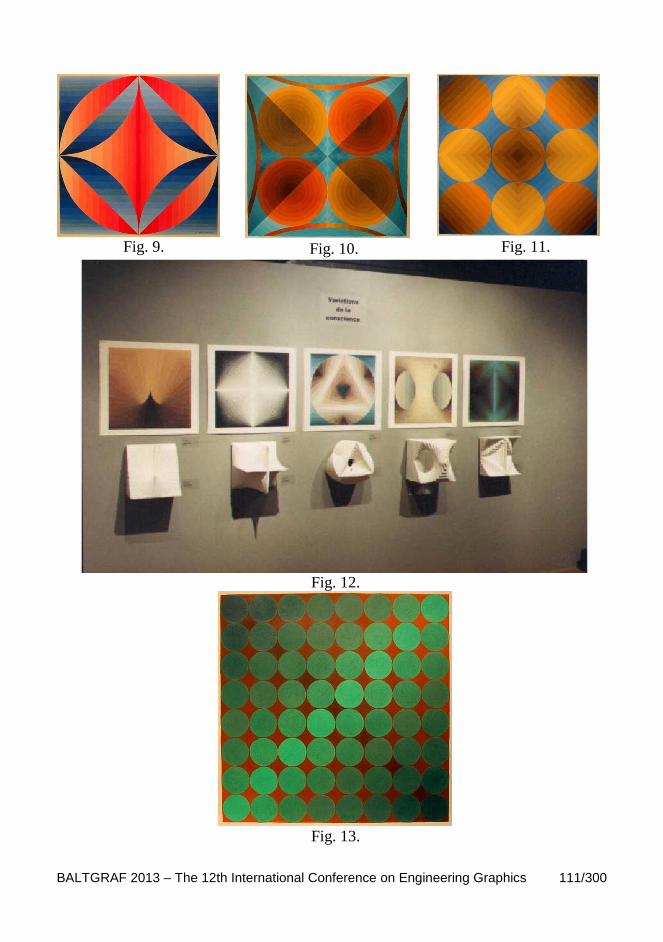
BALTGRAF 2013 – The 12th International Conference on Engineering Graphics 111/300
Fig. 9.
Fig. 10.
Fig. 11.
Fig. 12.
Fig. 13.

112/300 The 12th International Conference on Engineering Graphics – BALTGRAF 2013
SELECTED LIST OF QUOTATIONS FROM THE ZANIS WALDHEIMS
ARCHIVES:
- Rudolph Arnheim. R, Toward A Psychology of Art:
“A pyramid of science is under construction. The ambition of the builders is
eventually to “cover” all things, mental and physical, human and natural,
animate and inanimate, by a few rules. The pyramid will look sharp enough at
the peak, but toward the base it will vanish inevitably in a fog of stimulating
ignorance like one of those mountains that dissolve in the emptiness of
untouched silk in Chinese brush paintings. For as the base broadens to
encompass an ever greater refinement of species, those few sturdy rules will
intertwine in endless complexity and form patterns so intricate as to appear
untouchable by reason.”
- Pierre Teilhard de Chardin: Le Phénomène Humain:
“La nappe pensante” qui, après avoir germé au tertiaire finissant, s’étale
depuis lors par-dessus le monde des plantes et des animaux; hors et au-dessus
de la biosphère, une noosphère”.
SELECTED LIST OF REFERENCES FROM THE ZANIS WALDHEIMS
ARCHIVES
1. Albers J. Interaction of Color. New Haven and London, Yale University
Press. 1976.
2. Arnheim R. Toward A Psychology of Art. Berkeley: University of California
Press. 1966.
3. Birren F. Color Perception in Art. New York: Van Nostrand Reinhold
Company. 1976.
4. Cassirer E. La Philosophie des Formes Symboliques. Paris: Les Éditions de
Minuit. 1972. (in French).
5. Chardin Pierre Teilhard de. Le Phénomène Humain. Paris: Éditions du Seuil.
1955. (in French).
6. Husserl E. Idées Directrices Pour une Phénoménologie. Gallimard. 1950. (in
French).
7. Oswald W. The Color Primer. New York: Van Nostrand Reinhold Company.
1969. (in French).
8. Russell B. Introduction à la Philosophie Mathématique. Paris: Payot. 1961.
(in French).
9. Weizsacker Viktor von. Le Cycle de la Structure. (Der Gestaltkreis). Desclée
de Brouwer. 1958. (in French).
10. Weyl H. Philosophy of Mathematics and Natural Science. Princeton:
Princeton University Press. 1949.

The 12 th International Conference on Engineering Graphics
BALTGRAF 2013 June 5-7, 2013, Riga, Latvia
113/300
USAGE OF COMPUTER AIDED DESIGN SYSTEMS
IN STUDY PROCESS
Birutė JUODAGALVIENĖ1, Tatjana GRIGORJEVA
2
1. ABSTRACT
This paper presents trends of new technologies in teaching process for future
engineers of Vilnius Gediminas Technical University (VGTU) and describes the
opportunities and prospects of the available hardware of Lithuanian enterprises of
building design. The article deals with how to balance the presentation of latest
technologies of the civil engineering program in order training modules would be
relevant to labour market needs.
KEYWORDS: CAD, Revit Architecture, Engineering Graphics, Information
Technology
2. INTRODUCTION
Today, it is difficult to predict the balance between the prepared for students
certain discipline tasks in the teaching materials of universities. First or second year’s
training materials should be prepared so that it would be useful not only for further
studies, but also would meet future employers' needs. Employers' wishes increase as
technology improves. Subject teachers have to learn, develop and adapt to the new
technologies, solutions and achievements. Lithuanian market along with the
education system understands that an investment into the teaching staff of university
who is able to adapt and develop new technological advances, and provision of
universities with the adequate new technologies is the investment not only into the
future economy, but the matter of university’s prestige also. Essentially there are no
barriers while installing new computer programs in the computer classes of VGTU:
financial and other possibilities are found. There are no obstacles to progress for
teaching staff as well. There are organized trainings, consultations. Distribution
companies of software train teaching staff for a symbolic price. University faculties
and departments cooperate with each other so that the student could come to the
1 Dep. of Architectural Engineering, Vilnius Gediminas Technical University, Saulėtekio 11, Vilnius,
LT10223, Lithuania, e-mail: [email protected] 2 Dep. of Architectural Engineering, Vilnius Gediminas Technical University, Saulėtekio 11, Vilnius,
LT10223, Lithuania, e-mail: [email protected]
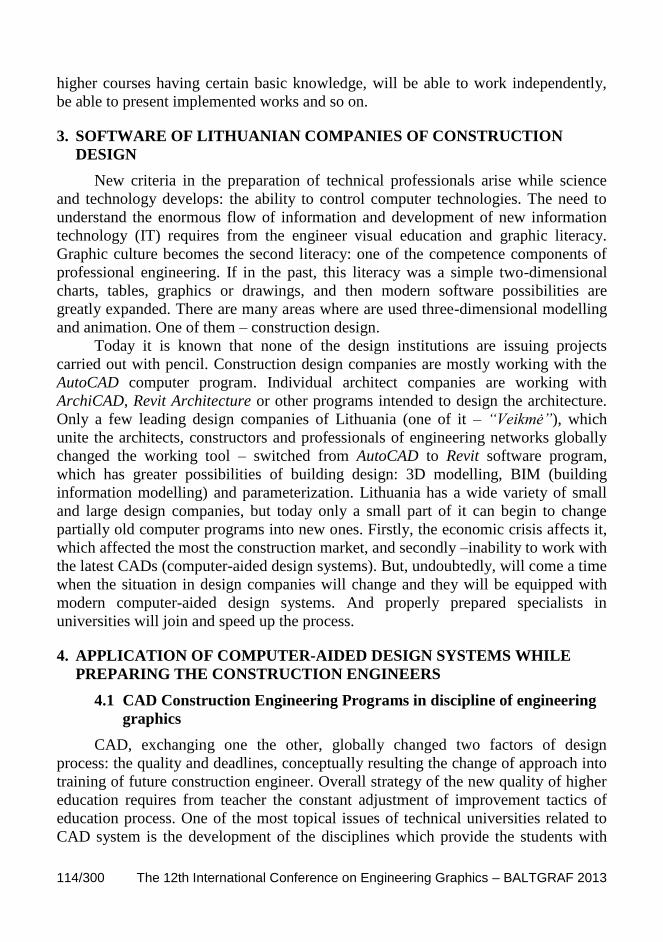
114/300 The 12th International Conference on Engineering Graphics – BALTGRAF 2013
higher courses having certain basic knowledge, will be able to work independently,
be able to present implemented works and so on.
3. SOFTWARE OF LITHUANIAN COMPANIES OF CONSTRUCTION
DESIGN
New criteria in the preparation of technical professionals arise while science
and technology develops: the ability to control computer technologies. The need to
understand the enormous flow of information and development of new information
technology (IT) requires from the engineer visual education and graphic literacy.
Graphic culture becomes the second literacy: one of the competence components of
professional engineering. If in the past, this literacy was a simple two-dimensional
charts, tables, graphics or drawings, and then modern software possibilities are
greatly expanded. There are many areas where are used three-dimensional modelling
and animation. One of them – construction design.
Today it is known that none of the design institutions are issuing projects
carried out with pencil. Construction design companies are mostly working with the
AutoCAD computer program. Individual architect companies are working with
ArchiCAD, Revit Architecture or other programs intended to design the architecture.
Only a few leading design companies of Lithuania (one of it – “Veikmė”), which
unite the architects, constructors and professionals of engineering networks globally
changed the working tool – switched from AutoCAD to Revit software program,
which has greater possibilities of building design: 3D modelling, BIM (building
information modelling) and parameterization. Lithuania has a wide variety of small
and large design companies, but today only a small part of it can begin to change
partially old computer programs into new ones. Firstly, the economic crisis affects it,
which affected the most the construction market, and secondly –inability to work with
the latest CADs (computer-aided design systems). But, undoubtedly, will come a time
when the situation in design companies will change and they will be equipped with
modern computer-aided design systems. And properly prepared specialists in
universities will join and speed up the process.
4. APPLICATION OF COMPUTER-AIDED DESIGN SYSTEMS WHILE
PREPARING THE CONSTRUCTION ENGINEERS
4.1 CAD Construction Engineering Programs in discipline of engineering
graphics
CAD, exchanging one the other, globally changed two factors of design
process: the quality and deadlines, conceptually resulting the change of approach into
training of future construction engineer. Overall strategy of the new quality of higher
education requires from teacher the constant adjustment of improvement tactics of
education process. One of the most topical issues of technical universities related to
CAD system is the development of the disciplines which provide the students with
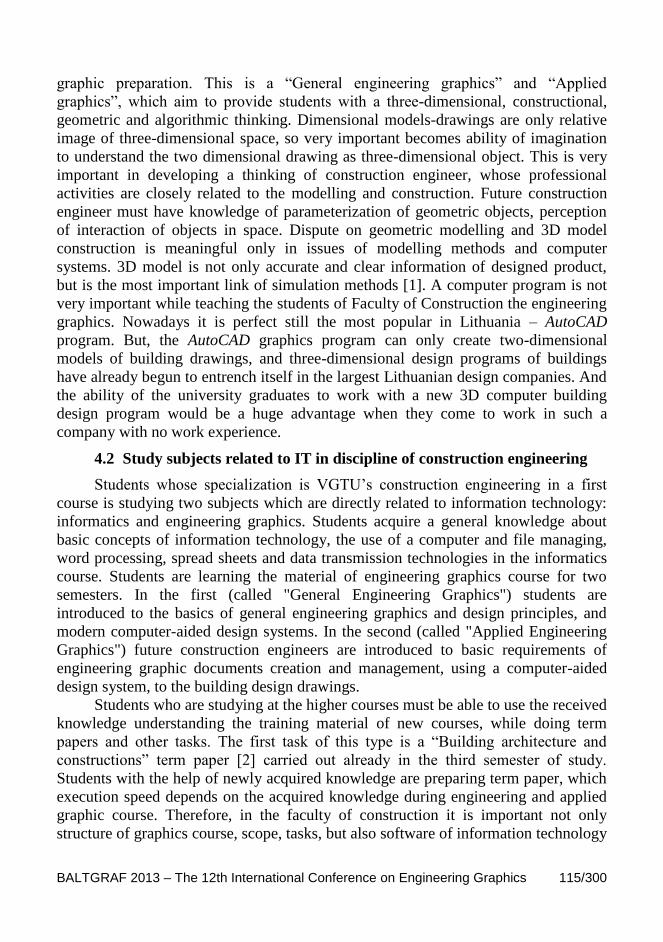
BALTGRAF 2013 – The 12th International Conference on Engineering Graphics 115/300
graphic preparation. This is a “General engineering graphics” and “Applied
graphics”, which aim to provide students with a three-dimensional, constructional,
geometric and algorithmic thinking. Dimensional models-drawings are only relative
image of three-dimensional space, so very important becomes ability of imagination
to understand the two dimensional drawing as three-dimensional object. This is very
important in developing a thinking of construction engineer, whose professional
activities are closely related to the modelling and construction. Future construction
engineer must have knowledge of parameterization of geometric objects, perception
of interaction of objects in space. Dispute on geometric modelling and 3D model
construction is meaningful only in issues of modelling methods and computer
systems. 3D model is not only accurate and clear information of designed product,
but is the most important link of simulation methods [1]. A computer program is not
very important while teaching the students of Faculty of Construction the engineering
graphics. Nowadays it is perfect still the most popular in Lithuania – AutoCAD
program. But, the AutoCAD graphics program can only create two-dimensional
models of building drawings, and three-dimensional design programs of buildings
have already begun to entrench itself in the largest Lithuanian design companies. And
the ability of the university graduates to work with a new 3D computer building
design program would be a huge advantage when they come to work in such a
company with no work experience.
4.2 Study subjects related to IT in discipline of construction engineering
Students whose specialization is VGTU’s construction engineering in a first
course is studying two subjects which are directly related to information technology:
informatics and engineering graphics. Students acquire a general knowledge about
basic concepts of information technology, the use of a computer and file managing,
word processing, spread sheets and data transmission technologies in the informatics
course. Students are learning the material of engineering graphics course for two
semesters. In the first (called "General Engineering Graphics") students are
introduced to the basics of general engineering graphics and design principles, and
modern computer-aided design systems. In the second (called "Applied Engineering
Graphics") future construction engineers are introduced to basic requirements of
engineering graphic documents creation and management, using a computer-aided
design system, to the building design drawings.
Students who are studying at the higher courses must be able to use the received
knowledge understanding the training material of new courses, while doing term
papers and other tasks. The first task of this type is a “Building architecture and
constructions” term paper [2] carried out already in the third semester of study.
Students with the help of newly acquired knowledge are preparing term paper, which
execution speed depends on the acquired knowledge during engineering and applied
graphic course. Therefore, in the faculty of construction it is important not only
structure of graphics course, scope, tasks, but also software of information technology
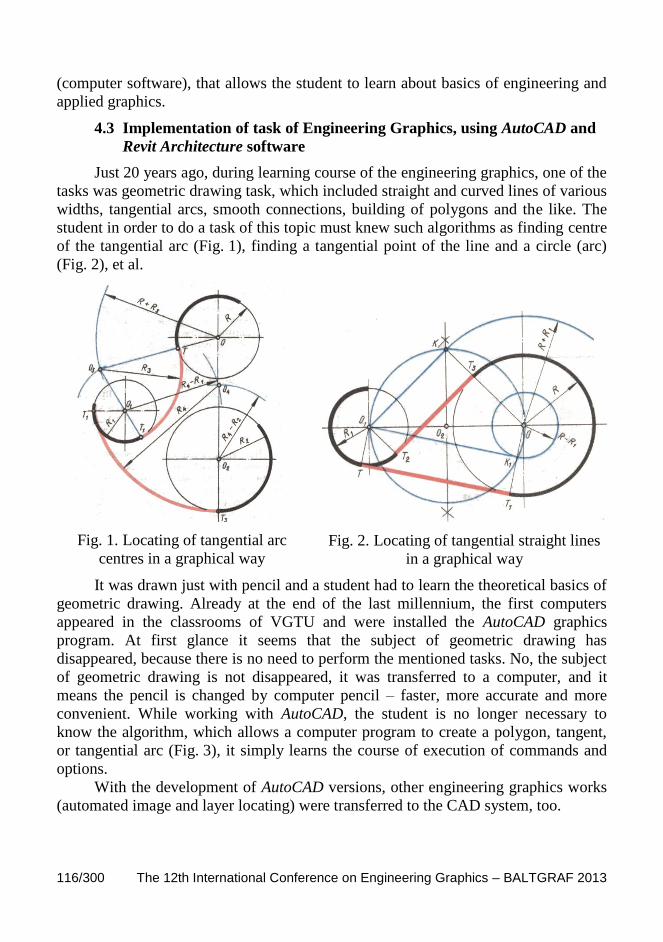
116/300 The 12th International Conference on Engineering Graphics – BALTGRAF 2013
(computer software), that allows the student to learn about basics of engineering and
applied graphics.
4.3 Implementation of task of Engineering Graphics, using AutoCAD and
Revit Architecture software
Just 20 years ago, during learning course of the engineering graphics, one of the
tasks was geometric drawing task, which included straight and curved lines of various
widths, tangential arcs, smooth connections, building of polygons and the like. The
student in order to do a task of this topic must knew such algorithms as finding centre
of the tangential arc (Fig. 1), finding a tangential point of the line and a circle (arc)
(Fig. 2), et al.
Fig. 1. Locating of tangential arc
centres in a graphical way
Fig. 2. Locating of tangential straight lines
in a graphical way
It was drawn just with pencil and a student had to learn the theoretical basics of
geometric drawing. Already at the end of the last millennium, the first computers
appeared in the classrooms of VGTU and were installed the AutoCAD graphics
program. At first glance it seems that the subject of geometric drawing has
disappeared, because there is no need to perform the mentioned tasks. No, the subject
of geometric drawing is not disappeared, it was transferred to a computer, and it
means the pencil is changed by computer pencil – faster, more accurate and more
convenient. While working with AutoCAD, the student is no longer necessary to
know the algorithm, which allows a computer program to create a polygon, tangent,
or tangential arc (Fig. 3), it simply learns the course of execution of commands and
options.
With the development of AutoCAD versions, other engineering graphics works
(automated image and layer locating) were transferred to the CAD system, too.
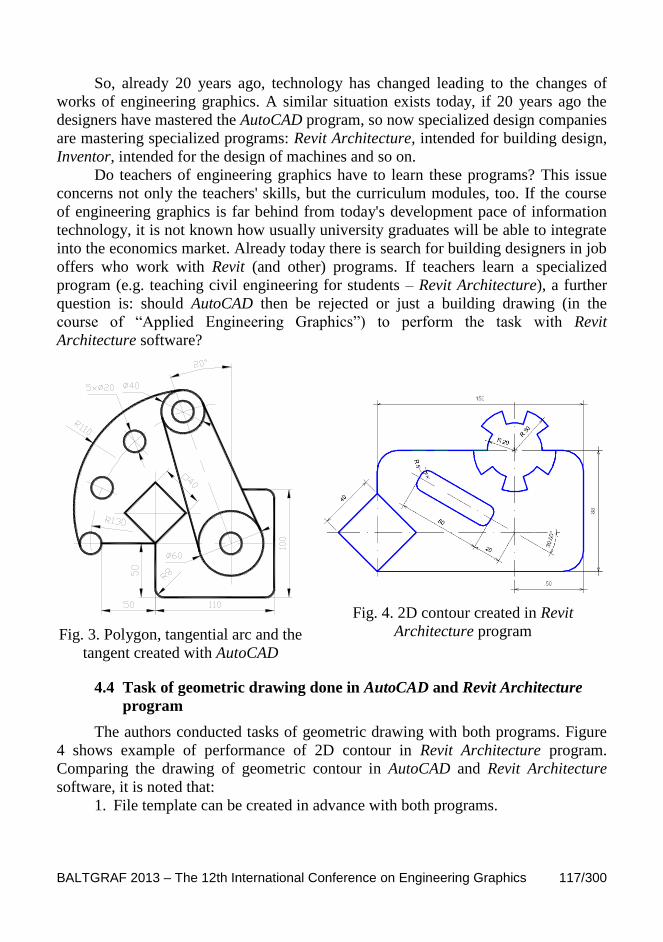
BALTGRAF 2013 – The 12th International Conference on Engineering Graphics 117/300
So, already 20 years ago, technology has changed leading to the changes of
works of engineering graphics. A similar situation exists today, if 20 years ago the
designers have mastered the AutoCAD program, so now specialized design companies
are mastering specialized programs: Revit Architecture, intended for building design,
Inventor, intended for the design of machines and so on.
Do teachers of engineering graphics have to learn these programs? This issue
concerns not only the teachers' skills, but the curriculum modules, too. If the course
of engineering graphics is far behind from today's development pace of information
technology, it is not known how usually university graduates will be able to integrate
into the economics market. Already today there is search for building designers in job
offers who work with Revit (and other) programs. If teachers learn a specialized
program (e.g. teaching civil engineering for students – Revit Architecture), a further
question is: should AutoCAD then be rejected or just a building drawing (in the
course of “Applied Engineering Graphics”) to perform the task with Revit
Architecture software?
Fig. 3. Polygon, tangential arc and the
tangent created with AutoCAD
Fig. 4. 2D contour created in Revit
Architecture program
4.4 Task of geometric drawing done in AutoCAD and Revit Architecture
program
The authors conducted tasks of geometric drawing with both programs. Figure
4 shows example of performance of 2D contour in Revit Architecture program.
Comparing the drawing of geometric contour in AutoCAD and Revit Architecture
software, it is noted that:
1. File template can be created in advance with both programs.

118/300 The 12th International Conference on Engineering Graphics – BALTGRAF 2013
2. Such editing and creation commands of the contour like Line, Circle, Arc,
Fillet, Rotate, Mirror, etc. are in the both programs, although the work with
them is a little different.
3. Time intended for performance of “2D contour” task depends on the work
skills of one or another program.
True, Revit Architecture program has couple of editing features which are
significantly different from already known ones, such as alignment (Align), split
(Split), and the algorithm of some other functions differs from the learned in
AutoCAD.
So what are the advantages of Revit Architecture program? Of course, this
program is not intended for drawing of 2D contour (though it can be done in it), so
we can say that implementing the task of geometric drawing, it is not appropriate to
choose Revit Architecture program.
But, the benefits of this program should feel the students of Civil Faculty while
implementing task of building drawing – and it is only the task of applied engineering
graphics. And there is no need to speak about the benefits of learned program in the
higher courses and future jobs, because it is obvious.
4.5 Task of construction drawing done in AutoCAD and Revit Architecture
program
Students of civil engineering during the course of "Applied graphics" are
introduced to the main architectural drawings of buildings: sections, plans and
facades. This course provides the features of construction drawings and
conditionality. There are resolved matches: plan – a horizontal section of the
building, the facade – view from the front/rear or the other and so on. This work has
been carried out in AutoCAD up till now. If this task starts to be prepared in Revit
Architecture program, the following problems will begin:
1. If in the course of "General Engineering Graphics" drawing tool is AutoCAD
program, it will take some time until the students absorb a minimum of Revit
Architecture program.
2. And if in the course of "General Engineering Graphics" Revit Architecture
program has been already a drawing tool, the students will not know how to
work with AutoCAD program, and will have problems even with other works
carried out during studies.
3. Students working in Revit Architecture program will not draw building
plans, but will create a virtual model of the building. So, they must have a
minimum understanding of building constructions, and this is not the subject
of teachers of engineering graphics.
The authors carried out the task of construction drawing with one and the other
programs, too. Clearly, the difference between time spent in AutoCAD and Revit
Architecture programs is obvious and huge. But the authors not only know the two of
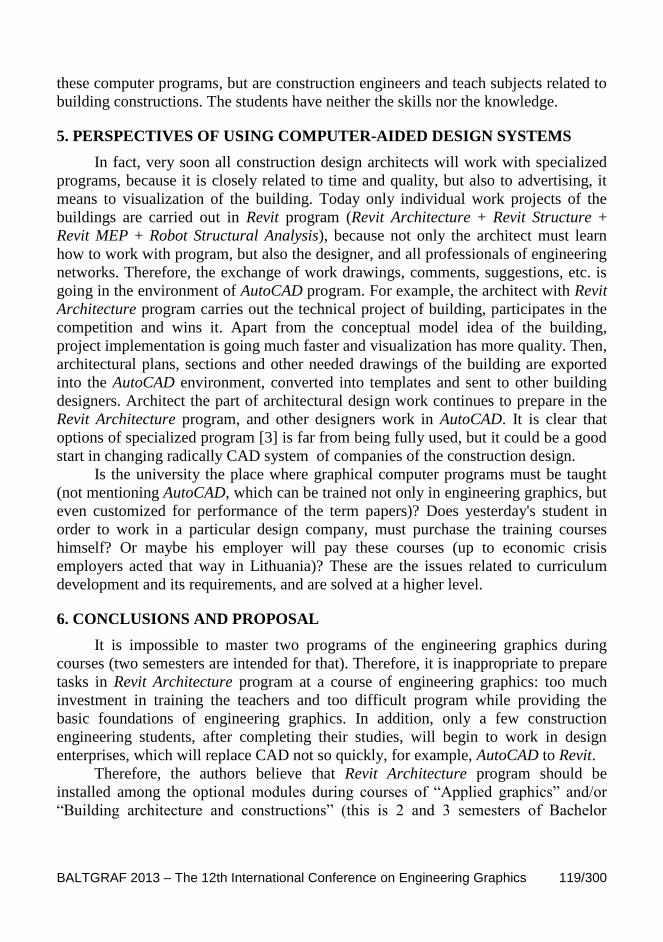
BALTGRAF 2013 – The 12th International Conference on Engineering Graphics 119/300
these computer programs, but are construction engineers and teach subjects related to
building constructions. The students have neither the skills nor the knowledge.
5. PERSPECTIVES OF USING COMPUTER-AIDED DESIGN SYSTEMS
In fact, very soon all construction design architects will work with specialized
programs, because it is closely related to time and quality, but also to advertising, it
means to visualization of the building. Today only individual work projects of the
buildings are carried out in Revit program (Revit Architecture + Revit Structure +
Revit MEP + Robot Structural Analysis), because not only the architect must learn
how to work with program, but also the designer, and all professionals of engineering
networks. Therefore, the exchange of work drawings, comments, suggestions, etc. is
going in the environment of AutoCAD program. For example, the architect with Revit
Architecture program carries out the technical project of building, participates in the
competition and wins it. Apart from the conceptual model idea of the building,
project implementation is going much faster and visualization has more quality. Then,
architectural plans, sections and other needed drawings of the building are exported
into the AutoCAD environment, converted into templates and sent to other building
designers. Architect the part of architectural design work continues to prepare in the
Revit Architecture program, and other designers work in AutoCAD. It is clear that
options of specialized program [3] is far from being fully used, but it could be a good
start in changing radically CAD system of companies of the construction design.
Is the university the place where graphical computer programs must be taught
(not mentioning AutoCAD, which can be trained not only in engineering graphics, but
even customized for performance of the term papers)? Does yesterday's student in
order to work in a particular design company, must purchase the training courses
himself? Or maybe his employer will pay these courses (up to economic crisis
employers acted that way in Lithuania)? These are the issues related to curriculum
development and its requirements, and are solved at a higher level.
6. CONCLUSIONS AND PROPOSAL
It is impossible to master two programs of the engineering graphics during
courses (two semesters are intended for that). Therefore, it is inappropriate to prepare
tasks in Revit Architecture program at a course of engineering graphics: too much
investment in training the teachers and too difficult program while providing the
basic foundations of engineering graphics. In addition, only a few construction
engineering students, after completing their studies, will begin to work in design
enterprises, which will replace CAD not so quickly, for example, AutoCAD to Revit.
Therefore, the authors believe that Revit Architecture program should be
installed among the optional modules during courses of “Applied graphics” and/or
“Building architecture and constructions” (this is 2 and 3 semesters of Bachelor

120/300 The 12th International Conference on Engineering Graphics – BALTGRAF 2013
studies), in order students could prepare term paper of the latter discipline (Fig. 5)
optionally in this program.
Fig. 5. A virtual building model carried out in Revit Architecture program during time
of term paper "Building architecture and constructions”
7. REFERENCES
1. Ch. Sang-Uk, H. Soonhung. A Template-based Reconstruction of Plane-
symmetric 3D Models from Freehand Sketches. Journal of Computer-Aided
Design, 40, 2008, p. 975–986.
2. B. Juodagalvienė, J. Parasonis, J. Mačiulytė. A Development of
Programmable Implementation of Course Projects within VGTU Faculty of
Civil Engineering, International Conference on Engineering Graphics
BALTGRAF-10 June 4-5, 2009, Lithuania, Vilnius: Technika, 2009. ISBN
9789955284529, p. 46-53.
3. V. Popovas, A. Jarmolajevas, T. Grigorjeva. Šiuolaikinės automatizuoto
projektavimo sistemos [Automated design systems today], Nauja statyba
[New Construction magazine], 6-7, p. 26-29, p. 40-41. (in Lithuanian).
The 12 th International Conference on Engineering Graphics
BALTGRAF 2013 June 5-7, 2013, Riga, Latvia
121/300
CONIC SECTIONS IN LOGO FORMING
Irina KUZNETSOVA1, Anna BURAVSKA
2
1. ABSTRACT
The research describes the most common elements of the logo, which can be obtained
with conic sections in computer design. To analyse their role in shaping the logo there
were selected signs in which dominant role in composition and aesthetic perception
belongs to point, line, and pair of intersecting lines, ellipse, circle, parabola, and
hyperbola and perspective images of circle.
KEYWORDS: Logo, Conic Sections, Plane, Aesthetic Reception
2. INTRODUCTION
Most modern logos represent a composition of different elements. Depending
on the information transmitted by creating an image, the same geometrically formed
element can play a major or minor formative role. Limited time to the logo review
requires a special selection of compositional means of expression and the way
information transfer. The aim of this study was to investigate the constituent elements
of the logo formed with conic sections. The objectives of the study included: an
analysis of the existing logo to identify key formative elements, comparing and
finding the most effective variations for geometric construction of selected items, as
well as analysis of the features of aesthetic perception, depending on the
characteristics of logo forming. Logos design and perception were analysed by D. K.
Verkman B. Elbryun V. O. Pobedin, N. V. Konik, V. N. Krasheninnikov, V. E.
Mikhailenko and M. I. Yakovlev investigated geometrical shaping of signs in graphic
design.
3. BASIC INFORMATION
In the process of investigating the possibilities of computer geometric
modelling logos we have analysed the formation of modern logos of companies and
organizations. A statistical study of more than 1000 logos shows that the most
common geometrically formed elements in them are variations of conic sections,
which include points, lines, a pair of intersecting lines, ellipse, circle, parabola,
hyperbola, and perspective views of the circle. In general signs containing one or
more conic sections account for 75% of the total analysed logos.
1 National Aviation University, Ukraine, Kiev, e-mail: [email protected]
2 National Aviation University, Ukraine, Kiev, e-mail: [email protected]
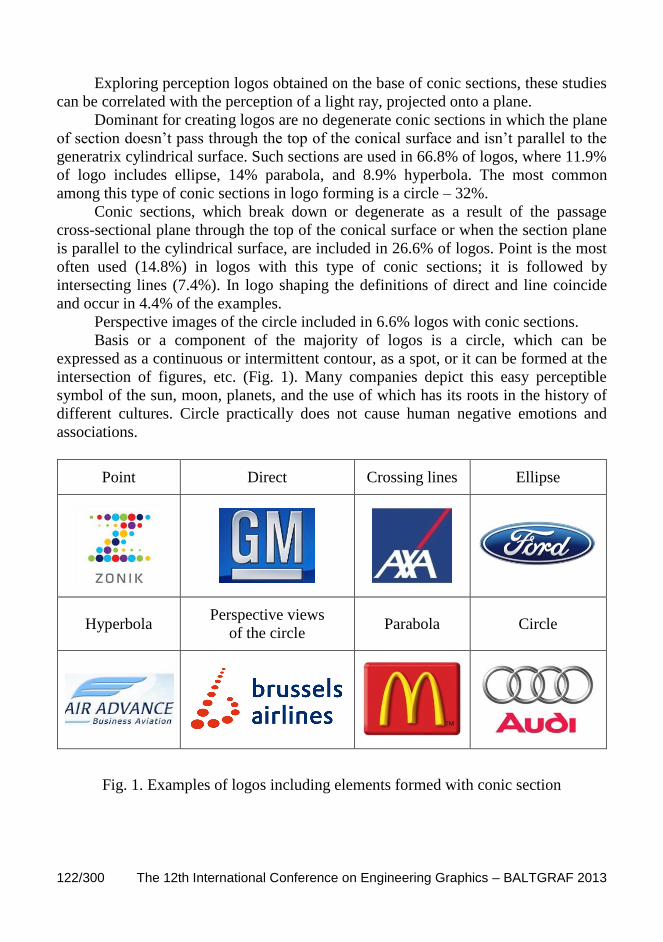
122/300 The 12th International Conference on Engineering Graphics – BALTGRAF 2013
Exploring perception logos obtained on the base of conic sections, these studies
can be correlated with the perception of a light ray, projected onto a plane.
Dominant for creating logos are no degenerate conic sections in which the plane
of section doesn’t pass through the top of the conical surface and isn’t parallel to the
generatrix cylindrical surface. Such sections are used in 66.8% of logos, where 11.9%
of logo includes ellipse, 14% parabola, and 8.9% hyperbola. The most common
among this type of conic sections in logo forming is a circle – 32%.
Conic sections, which break down or degenerate as a result of the passage
cross-sectional plane through the top of the conical surface or when the section plane
is parallel to the cylindrical surface, are included in 26.6% of logos. Point is the most
often used (14.8%) in logos with this type of conic sections; it is followed by
intersecting lines (7.4%). In logo shaping the definitions of direct and line coincide
and occur in 4.4% of the examples.
Perspective images of the circle included in 6.6% logos with conic sections.
Basis or a component of the majority of logos is a circle, which can be
expressed as a continuous or intermittent contour, as a spot, or it can be formed at the
intersection of figures, etc. (Fig. 1). Many companies depict this easy perceptible
symbol of the sun, moon, planets, and the use of which has its roots in the history of
different cultures. Circle practically does not cause human negative emotions and
associations.
Point Direct Crossing lines Ellipse
Hyperbola Perspective views
of the circle Parabola Circle
Fig. 1. Examples of logos including elements formed with conic section

BALTGRAF 2013 – The 12th International Conference on Engineering Graphics 123/300
Point in the logo design serves as the basic element both for geometric and
compositional constructions. Point can be a separate accent element or it can form
groups, depicting the congestion, rarefaction, movement in a certain direction.
With the help of straight line certain semantic components of logo composition
can be emphasized, for example – the inscription, accent element; it also creates the
direction of movement, causes the effect of the dynamics. Straight lines are the basic
elements of linguistic logos displayed with the alphanumeric signs. These logos have
a number of advantages: they are simple to use, easy to understand, they can be used
in different cases in any culture. As an independent artistic logo element straight lines
can emphasize name or part of an image to form a system of symbolic indication of
the direction of movement etc., can emphasize or conversely divide, create some
contrast.
To create the effect of combination or goal achievement designers use the
intersection lines in logo forming. This way of forming is often used to create logos
of institutions and organizations which are proud of their traditions, prefer legibility,
pithiness and clarity. Intersection lines represent the dynamism, that’s why the logo
content is often expressed in their direction and thickness.
Elements formed with mathematically programmed and similar curves are often
used as a basic element of the font lettering and as a modular element of the image.
The most common of these curves is parabola. A branch or complete symmetrical
image of parabola forms the basis of logos with heraldic symbols.
Hyperbole often acts as a repeating item, such as a part of the wing image.
Parabola and hyperbola as forming elements have clearly expressed plastic attraction
and generate a definite pattern in their visual perception. The human mind associates
new images with already known ones that are why such logos may cause of the
subconscious shapes of flora and fauna, optical patterns, etc.
Ellipse in logos depends on imaginative solutions and it can be expressed with a
contour or a stain. This form is often used as additional element to other images,
rarely it is used as an independent decorative element in conjunction with the
company name. Imaginative filling of this shape causes consumer associations with
movement in a circle or an orbit – world tours, which are used in the logos of travel
and airlines companies, as well as the illusion of infinity, which is often used in
automobile companies’ logos. The shape of ellipse is closed and has the ability to
organically fit the contrasting imagery and style characteristics of substantive form.
Perspective images of the circle create the illusion of dynamics in static images;
using several of these elements designers can transfer the direction of movement.
In most cases, each of the aforesaid elements forming logos is used in
conjunction with other forms and font lettering. The combination of elements in the
different order with the change in their number, position, size, distance, and other
characteristics forms a wide range of possibilities of logo forming with geometric
means.
124/300 The 12th International Conference on Engineering Graphics – BALTGRAF 2013
Taking into account the fact that in most cases logo is a combination of many
elements formed and integrated into a coherent whole with different geometric ways,
the question is in determining the extent and characteristics of aesthetic perception of
the logo depending on its degree of difficulty.
The perception of logo on the scheme matches the direct, consisting of links –
stages, the first of which is concept and strategy of identity for company, product or
service; the second – the logo; the third – the recipient or the consumer, the fourth
and crowning stage – concrete action.
Geometric arranging of logo’s elements acts as its aesthetic characteristic and
can be calculated by the relevant formulas.
Depending on the perception audience basic aesthetic indicators set out in the
logo begin to differ. Conditionally there can be distinguished two main aesthetic
directions of forming logo concept:
1. Elitist. Logos, formed on the basis of such direction include the desire to
deliver maximum enjoyment to minimum sophisticated consumers by difficult
recognizing real in the illustrated. In this case, the logo may take the form of riddle,
or completely lose relations with the real object. The main tool is the complexity of
the content and the transmission method, which increases the complication of
aesthetic perception, reduces the availability of the logo, but substantial reception
efforts cause the growth of aesthetic pleasure. Aesthetic pleasure from such logo can
be calculated with formula created by Eysenck [3]:
М = О × С (1),
in which the aesthetic measure M is product of order O and complexity C. Thus, the
intensity of aesthetic perception and enjoyment is directly proportional to order and
complexity of the logo. Most often in logos of this direction are used such elements
as an ellipse, parabola, hyperbola.
2. Mass. In this direction, the degree of conditionality is insignificant. Such
logo does not require intellectual effort for their understanding because of the ease of
recognition, matching the real object. These logos are commonly understood, but
aesthetically ineffective: they bring minimum pleasure to the maximum number of
cultural untrained consumers. The main tool is simplifying the content and the
method of transmission, what leads to the relief of its reception, which in its turn
leads to a reduction of aesthetic pleasure. Aesthetic pleasure for logos created in this
direction can be calculated with formula created by Birkhoff [1]
М = О: С (2),
in which the aesthetic measure M is directly proportional to order O, and inversely
proportional to the complexity C. Efforts to focus attention on the contours of the
object increase in proportion to the complexity of the parts. In the logos of mass
direction prevails straight lines, dots, and circles.
These studies have similar results to the hypothesis N. Yakovlev of the priority
perception images on the picture plane through the ellipse. Yakovlev carried out his
research on the base of the theory of irradiation contained by G. Ruuber. Further

BALTGRAF 2013 – The 12th International Conference on Engineering Graphics 125/300
studies of the perception of logos created with conic sections will be held on the basis
of their work.
4. CONCLUSIONS
Forming, as one of the main categories of design theory, is a basis for
classification of logos, where the geometry of formation acts as classifier.
In the process of research we developed the classification of forming basic
compositional elements of logos with conic sections, which include points, lines, a
pair of intersecting lines, ellipse, circle, parabola, hyperbola and a perspective view of
a circle.
There was determined the connection of aesthetic perception and geometric
methods of forming the elements of logos, on which base there were identified two
major directions of aesthetic perception of logos: elitist, where prevails usage of
ellipse, parabola and hyperbola, and mass, which is characterized by the use of lines,
dots and circles.
5. REFERENCES
1. Вirkhоff G. D. Aesthetic Measure. Cambridge: Mass. Harvard Univ. Press,
1932. -144 pр.
2. Bowman U. Graphical Representation of Information. Moscow: Mir,
1971. -228 pp. (in Russian).
3. Eysenck H. J. General Factor in Aesthetic Judgments. Brit. J. Psychology,
1941, №31, p. 94-102.
4. Heilbrunn B. Le Logo. Мoscow: ОLMA PRЕSS Invest, 2003. -127 pp.
5. Johnston D. Letterhead and Logo Design. Creating the Corporate Image.
Massachusetts: Rockport Publishers, 1996. -194 pp.
6. Konik N. V., Мaluev P. A., Peshkova T. A. Trade Marks. Moscow: ООО
АCТ, 2001. -198 pp. (in Russian).
7. Krashennikov V. N. Trade Marks. The Theory and Practice of Designing. –
Мoscow: Nauka, 2005. -95 pp. (in Russian).
8. Mikhailenko V. E., Yakovlev M. I. Basics of Composition (Geometric
Aspects of Artistic Shaping). Кiev: Karavela, 2008, p. 106-134. (in Russian).
9. Voloshinov А. V. Mathematics and Art. Мoscow: Prosveshchenie,
2000. -399 pp. (in Russian).
10. Werkman C. J. Trade Marks: Their Creation Psychology and Perception.
Мoscow: Progress, 1989. -689 pp. (in Russian).

126/300 The 12th International Conference on Engineering Graphics – BALTGRAF 2013

The 12 th International Conference on Engineering Graphics
BALTGRAF 2013 June 5-7, 2013, Riga, Latvia
127/300
COMBINATORIAL METHODS FORMING
OBJECTS OF DESIGN
Iryna KUZNETSOVA1, Oktyabrina CHEMAKINA, Tatyana SHIMANSKAYA
1. ABSTRACT
The work revealed the use and implementation the combinatorial forming methods in
objects design by the Ukrainian designers. By defining the structure of the
combinatorial process it is determined the basic directions of forming procedures that
are implemented in the design of industrial products and interiors in general.
KEYWORDS: Method, Combinatorics, Forms, Modules, Unification
2. INTRODUCTION
Relevance of the study is determined by the increase of the interest to the
creation of a rational and functional interior design. XXI Century opens up new
possibilities in the field of design development that are based on the use of structural
links of combinatorial methods. Patterns research of spatial elements variative
changes, and the methods of design objects ordering will push the design of industrial
products. In addressing important design problems combinatorial design methods are
the rational foundation. Relevant is the investigation of the combinatorial methods of
forming which studies the changing of the geometry and the size of the overall object
form, the composition of its parts and components.
In works of Genisaretskogo O. I., Saprykin N. A., Volkotruba I. T., Pronin E. S.
[1-5] the particularities of combinatorial methods in the design objects are described.
Genisaretsky regards the design of each new object not in isolation but in the context
of using the unification method, a certain set of parametric series of combinatorial
elements. Pronin divides the structure of combinatorial process to the formal and
conceptual level, which includes the general idea, its specification, search of
decorative combinatorial element. Design has been investigating intensively in
Ukraine over the last decade. But the use and implementation of the combinatorial
process methods is based on the geometric forming of design object.
Objective is the identifying of the optimal combinatorial methods of design
objects forming in the works of modern Ukrainian designers.
1 National Aviation University, Institute of the Airports, Department of Design Computer
Technologies, prospect Comarova 1, 03680, Kiev, Ukraine

128/300 The 12th International Conference on Engineering Graphics – BALTGRAF 2013
3. BASIC INFORMATION
Combinatorial methods of forming are used in the objects designing for
identifying the combination and placement of the structural elements of the object's
form, its composition.
Combinatorial elements in the design objects planning can have different forms.
Traditionally choosing a combinatorial element Ukrainian designers, as designers all
over the world, first of all apply to the prism, most often to tetrahedral. The most
common design object with combinatorial prismatic elements in the modern
Ukrainian residential interiors is wardrobe, traditionally known as sliding door
wardrobe (Fig. 1).
Fig. 1. Sliding door wardrobe
The prism may have rounding, but that does not change its main geometric
nature. Brick furniture set of KiBiSi design studio is made as masonry. A “Stony”
wall is formed by cushions folded and joined together in the proper order.
The number of edges can grow. The prism, as a basic element of combinatorics,
can be wrong. The more complex the shape, the more interesting to create
combinatorial composition, but also more difficult for designer to develop such form.
Streetwalk outdoor seats by Charlie Davidson do not have combinatorial elements
(Fig. 2).
Fig. 2. Streetwalk outdoor seats by Charlie Davidson
You can design them so that they will be combinatorially connected. But at the
same time the artistic image of "urban flowers" will be lost. To pick up a form to get
a relatively new combinatorial element and make it perform a specific function is the

BALTGRAF 2013 – The 12th International Conference on Engineering Graphics 129/300
important design task. The prototype of such triangular sofas, as shown in Figure 3,
for the Dutch UN Studio architects became geological formations.
Fig. 3. Geological formations by Dutch UN Studio architects
These „stones”, created of polyurethane foam on a steel frame and covered with
a cloth, can be combined in various configurations, rolled in different corners of
rooms, or gathered in the geological compositions in the middle of the room. It means
that the importance of the function and the artistic image must be considered while
combinatorial change designing.
In selecting combinatorial element Japanese designer Kei Harada took into
consideration streamlined form attractive to human and offered the concept of white
"marshmallow" sofa called „O keeffe”. Each pillow-ball is covered with a stretch
fabric that allows the balls to remain undamaged. The form of the sofa is easily
changed: chill-out can be easily transformed into a play area for children. The author
suggested only the sleek-balls form, which can be classified as a variety of rotational
surface.
The basic elements of „fun” cactus couch of Cerruti Baleri Company also
represents rotational surface by its shape. But as the chosen artistic image required
accordance to our certain perception, the forming line of the given surface was closer
to the circular arc, than more lengthened by Kei Harada.
Unification method is effective for the industrial facilities design planning. This
method uses a limited number of elements that can form the whole mass industrial
production. It uses the unified ranks. There are two main directions in using
unification in design practice: typical and intertypic. The latter is performed by
creating and applying in diverse articles the same standardized elements – aggregates,
components, details. Typical is implemented by creating and producing of unified
series of standardized products or with a help of standard size series.
Constructing the shape of the object it is appropriate to use geometric
operations: constructions, rearrangements, combinations, dense packing. Geometric
combinations in building interiors or form of industrial design object is not always
subject to the rules of geometry, the deviations from such rules are frequently
observed, the so called deformation of mathematical construction logics.
Kineticism method applies to combinatorial design methods, in particular to the
method of transformation. Kinetism is a kind of art, which is based on the idea of
130/300 The 12th International Conference on Engineering Graphics – BALTGRAF 2013
form motion, any change of it. Kineticism method resides in establishing the form
dynamics, decoration.
All combinatorial process, that includes a number of forming methods, is based
on the operations with initial structural elements (Fig. 4).
A number of Ukrainian designers base its projection on the idea of creating functional
objects – transformers, which will help to save the space in small interiors and create
aesthetically complete image. Some objects of Ukrainian industrial designers are
based on combinatorial design, creating totally innovative concepts, provocative
design. Up to 30% of the overall works number is referred to non-functional design,
due to their outrageous. This trend is not widely used in practice and it is explained
by the conceptual approaches and the search for new forms.
Combinatorial forming methods are constantly used by such modern native
designers, as Valery and Ekaterina Kuznetsov, Irina Belan, Ilya Taslitsky, Igor
Ostapenko, Grytsya Erde, Andrew Galuska.
Valery and Ekaterina Kuznetsovy frequently use in their project the method of
unification. More than half of their concepts are targeted on the non-functional
design. Group of room chairs with „Nesun-Polkonosets, Nesun-Spynogris and Prosto
Nesun”, “Iksoobras” retractable elements (Fig. 5) are based on the use of operations
with combinatorial elements. In this case, the main feature of the forming structure is
the mechanism of drawers, their configuration can be modified, as this method makes
it possible to treat the object as a prefabricated structure, „constructor”. In
“Iksoobras” concept it is created the chair with drawer and hooks for different needs.
The drawer is selected as a structural element of this concept, and a group of
functional hooks as an additional decorative combinatorial element.
Ilya Taslitsky offered the creation of “Tablet” chairs, which are based on the
idea of saving space and designed for offices, namely, meeting rooms. «Tablet»
chairs are configured so that if necessary they can be lifted from the floor. In the
construction of this group, there are three details that should be connected. In this
case, the basic is a combinatorial method of modularity. Certain parts of the object
are interconnected with composite objects like modules; herewith the order of
elements can differ. According to the type of operation with the structural elements
Taslitsky development refers to the formation of the groups and changes in the
number of elements. Operation with the formation of the groups was used in the
project of the bar counter, which was designed in conjunction with bar stools. The
main mechanism of the product is the design of sliding chairs.
Igor Ostapenko in his „Ostapenko” concept – a collapsible construction that
transforms from one version of washbasin to another, – used kineticism method. In
general, in most of his works, the designer is guided by the transformation process,
the shift of one form to another. Forming with implementation of kineticism method
allows us to obtain an unlimited number of combinations of specified basic structural
elements. Basic operations are carried out with the object plane, the components of
which are modified by the transfer, combinations.

BALTGRAF 2013 – The 12th International Conference on Engineering Graphics 131/300
Basic
Operations Rotation Permutation
Specular
Reflection Combination
1.
2.
Quantity
Adjustment
Ilya Taslitsky
Chaining
Valery Kuznetsov
Grouping
Ilya Taslitsky
Covering
of the
Plane
Igor Ostapenko
Fig. 4. Combinatorial operations with elements on the example
of Ukrainian designers’ works

132/300 The 12th International Conference on Engineering Graphics – BALTGRAF 2013
Fig. 5. Group of room chairs 2008, Valery and Ekaterina Kuznetsovy
Irina Belan in her designs mainly uses the method of modularity and similar
forms. While designing the object the designer takes a module as a basis and applies
it in various permutations, displacements. Thus, in one of her concepts,
„Pooftransformer”, the general form was divided into 4 equal parts (Fig. 6).
Fig. 6. Booklet Poof, Irina Belan. 2011
The main type of connection in this object is permutation, it achieves various
compounds transformations. To the operations with the elements of combinatorial
objects of Irina Belan we should refer the changes in the number, the formation of
groups and chains. Seemingly simple concise forms require complex rearrangements,
group formations and operations for getting a new object. It is also used the method
of similar forms, that makes it possible to combine geometrically similar elements in
a single object, it allows to control the size parameter, meaning.
Andrew Galuska, who also tends in his object design to complex modified
models, often resorts to the combinatorics. In his projects, he is working on the
process of the object morphological transformation, meanwhile considering its
materials and structure. On the example of his design of Tuby hanger (Fig. 7) it is
shown the way to build a concise form that is subject to morphological changes.
Fig. 7. Tuby Hanger, Andrew Galuska, 2011
BALTGRAF 2013 – The 12th International Conference on Engineering Graphics 133/300
4. CONCLUSIONS
By the example of Ukrainian designers’ works it is reflected the basic methods
of formation, which are based on the combinatorics operations: a method of random
and similar forms, modular combinatorial method, kinematics, method of unification.
Further tasks of the study consist in determining the features of forming the
innovative objects of industrial design based on the combinatorial methods with the
application of geometric operations.
5. REFERENCES
1. Genisaretsky O. I. Design Culture and Conceptualism. Moscow: Association
of Designers of Russia, 2004, Vol. 1. -296 pp. (in Russian).
2. Saprykin N. A. Fundamentals of Dynamic Shaping the Architecture. Moscow:
Architecture S, 2005. -27 pp. (In Russian).
3. Grashin A. A. Methodology for the Design-design Elements of Substantive
Protection. Tutorial. Moscow: Architecture S, 2004. -232 pp. (in Russian).
4. Pronin E. S. Theoretical Basis of the Architectural Combinatorics. Moscow:
Architecture S, 2004. -232 pp. (in Russian).
5. Rubin A. Transformational Potential Production Situation. Styling Aesthetic
Problems of Complex Objects. Moscow: Tr. VNIITE. Ser. Industrial art,
1980, Issue 25, p. 76-94. (in Russian).

134/300 The 12th International Conference on Engineering Graphics – BALTGRAF 2013
The 12 th International Conference on Engineering Graphics
BALTGRAF 2013 June 5-7, 2013, Riga, Latvia
135/300
ENGINEERING GRAPHICS EDUCATION AS THE
FOUNDATION OF INTERCULTURAL ENGINEERING
COMMUNICATION
Harri LILLE1, Aime RUUS
2
1. ABSTRACT
Engineering Graphics for engineering students is an introductory course to
engineering education within which the addressed fundamentals of graphics are:
sketching and graphics projections, sectioning, dimensioning and engineering
drawings. The engineering drawing as a graphic representation is a graphic language
(design language) serving as a means of communication between engineers. The
writer of the drawing should be able to create images and to encode them involving
for this his/her mental abilities, the eye and the hand. Visual communication
presumes presence of a receiver who is able to catch the signal by sight and to decode
it. The purpose of teaching Engineering Graphics is to provide the fundamentals of
graphics for acquiring skills to write the engineering drawing (sender message) and to
read the engineering drawing (receiver message) or, in other words otherwise to
create visual images which are converted into a real object (product).
KEYWORDS: Engineering Graphics, Design Language, Drawing, Communication
Model
2. INTRODUCTION
Freshmen faced with the design process need to be able to navigate within the
medium of engineering drawings, as well as to encode and decode them, in order to
acquire knowledge. The driving force behind how meaning is constructed and
understood is the invention and utilization of signs and symbols within any
communication model.
Within an Engineering Graphics course engineering students learn the
fundamentals of graphics: sketching, graphics projections, sectioning, dimensioning,
and engineering drawings, which serve as a foundation for intercultural engineering
communication [1]. Gary Bertoline has entitled his traditional Engineering Graphics
textbook as “Fundamentals of Graphics Communication” [2]. According to Suzuki,
1 Dep. of Rural Building, Inst. of Forestry and Rural Engineering, Estonian University of Life
Sciences, Kreutzwaldi 5, Tartu, 51014, Estonia, e-mail: [email protected] 2 Dep. of Technology, Tartu College of Tallinn University of Technology, Puiestee 78, Tartu, 51008,
Estonia, e-mail: [email protected]
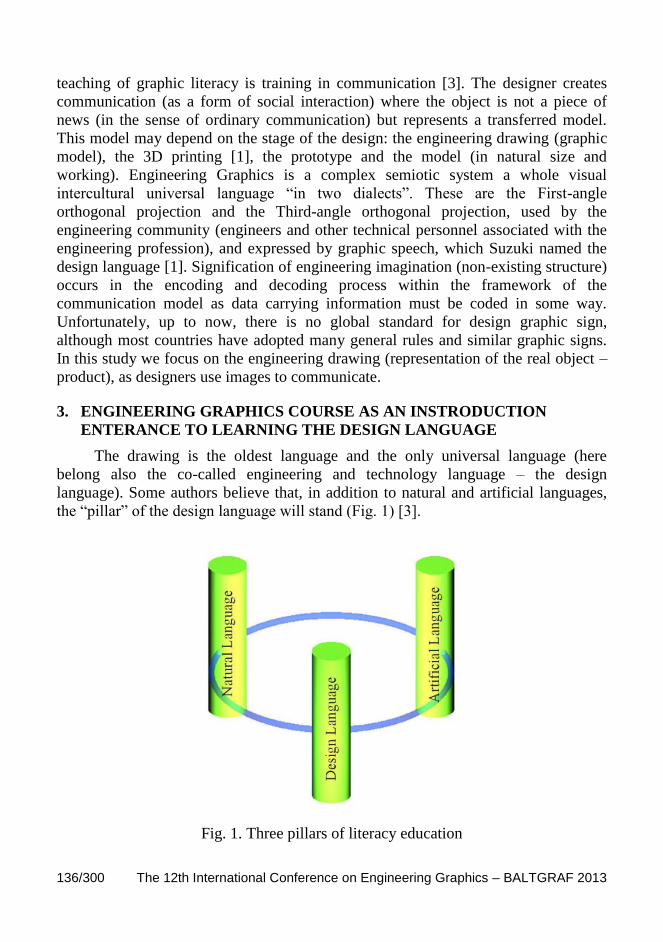
136/300 The 12th International Conference on Engineering Graphics – BALTGRAF 2013
teaching of graphic literacy is training in communication [3]. The designer creates
communication (as a form of social interaction) where the object is not a piece of
news (in the sense of ordinary communication) but represents a transferred model.
This model may depend on the stage of the design: the engineering drawing (graphic
model), the 3D printing [1], the prototype and the model (in natural size and
working). Engineering Graphics is a complex semiotic system a whole visual
intercultural universal language “in two dialects”. These are the First-angle
orthogonal projection and the Third-angle orthogonal projection, used by the
engineering community (engineers and other technical personnel associated with the
engineering profession), and expressed by graphic speech, which Suzuki named the
design language [1]. Signification of engineering imagination (non-existing structure)
occurs in the encoding and decoding process within the framework of the
communication model as data carrying information must be coded in some way.
Unfortunately, up to now, there is no global standard for design graphic sign,
although most countries have adopted many general rules and similar graphic signs.
In this study we focus on the engineering drawing (representation of the real object –
product), as designers use images to communicate.
3. ENGINEERING GRAPHICS COURSE AS AN INSTRODUCTION
ENTERANCE TO LEARNING THE DESIGN LANGUAGE
The drawing is the oldest language and the only universal language (here
belong also the co-called engineering and technology language – the design
language). Some authors believe that, in addition to natural and artificial languages,
the “pillar” of the design language will stand (Fig. 1) [3].
Fig. 1. Three pillars of literacy education
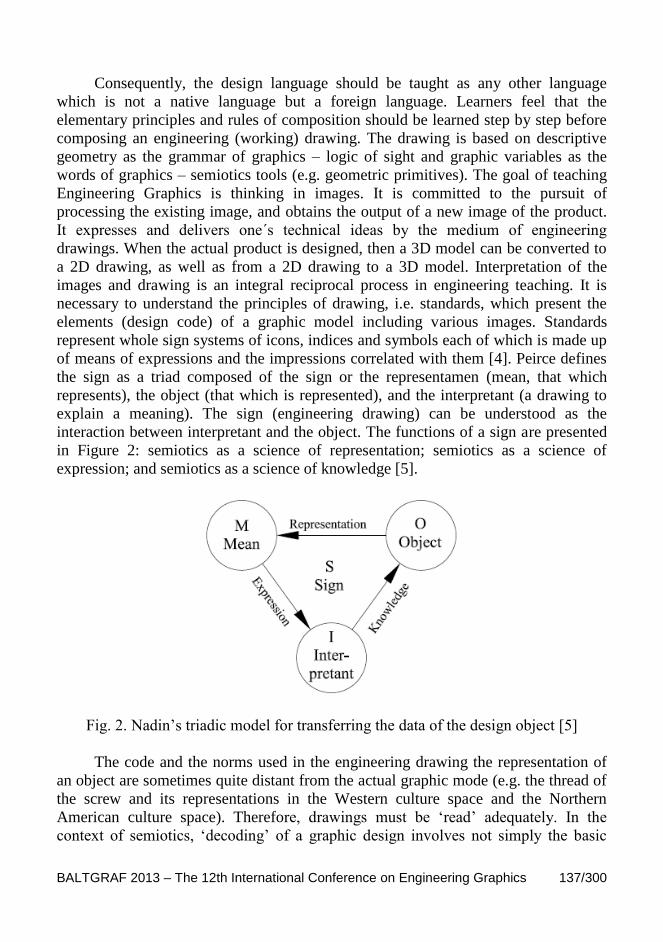
BALTGRAF 2013 – The 12th International Conference on Engineering Graphics 137/300
Consequently, the design language should be taught as any other language
which is not a native language but a foreign language. Learners feel that the
elementary principles and rules of composition should be learned step by step before
composing an engineering (working) drawing. The drawing is based on descriptive
geometry as the grammar of graphics – logic of sight and graphic variables as the
words of graphics – semiotics tools (e.g. geometric primitives). The goal of teaching
Engineering Graphics is thinking in images. It is committed to the pursuit of
processing the existing image, and obtains the output of a new image of the product.
It expresses and delivers one´s technical ideas by the medium of engineering
drawings. When the actual product is designed, then a 3D model can be converted to
a 2D drawing, as well as from a 2D drawing to a 3D model. Interpretation of the
images and drawing is an integral reciprocal process in engineering teaching. It is
necessary to understand the principles of drawing, i.e. standards, which present the
elements (design code) of a graphic model including various images. Standards
represent whole sign systems of icons, indices and symbols each of which is made up
of means of expressions and the impressions correlated with them [4]. Peirce defines
the sign as a triad composed of the sign or the representamen (mean, that which
represents), the object (that which is represented), and the interpretant (a drawing to
explain a meaning). The sign (engineering drawing) can be understood as the
interaction between interpretant and the object. The functions of a sign are presented
in Figure 2: semiotics as a science of representation; semiotics as a science of
expression; and semiotics as a science of knowledge [5].
Fig. 2. Nadin’s triadic model for transferring the data of the design object [5]
The code and the norms used in the engineering drawing the representation of
an object are sometimes quite distant from the actual graphic mode (e.g. the thread of
the screw and its representations in the Western culture space and the Northern
American culture space). Therefore, drawings must be ‘read’ adequately. In the
context of semiotics, ‘decoding’ of a graphic design involves not simply the basic

138/300 The 12th International Conference on Engineering Graphics – BALTGRAF 2013
recognition and comprehension of what the drawing says’ but also the interpretation
and evaluation of its meaning with a reference to the relevant code.
4. COMMUNICATION MODEL: INTERCULTURAL ENGINEERING
COMMUNICATION
Visual communication, where belongs also intercultural engineering
communication, is engaged in universal images [6]. By using the acquired design
language, it is possible to adequately communicate within the engineering
community. The element requisites for communication are: sender, receiver, channel,
medium and at least partially overlapping sign repertoire of sender and receiver
(Fig. 3).
The overlapping of the sign repertoire is a necessary condition for
communication but not a sufficient one. In this sphere there must be a complete
overlapping between the sender and the receiver in order to avoid that kind of an
exasperating dialogue as Jakobson cited: „The sophomore was plucked“, „But what is
plucked?“, „Plucked means the same as flunked“, „And flunked?“, „To be flunked is
to fail in an exam“, „And what is sophomore?”, “Persists the interrogator innocent of
school vocabulary”, „A sophomore is (or means) a second-year student.“ All these
equational sentences convey information merely about the lexical code of English:
their function is strictly metalingual (speed or text is focused on the code) [9], like
this on the drawings writing and reading.
Fig. 3. An engineering communication model after Shannon and Leopold involving
pictorial symbols (the model is editorially modified by Tasheva) [7-8]

BALTGRAF 2013 – The 12th International Conference on Engineering Graphics 139/300
As Deely notes “The sign appears, rather, as the linkage whereby the objects, be
they bodily entities or purely objective, come to stand one for another within some
particular context or web of experience” [10]. The writer of the drawing (sender)
should able to create images, and to encode them involving for this the senses, the eye
and the hand. In the engineering drawing, the visual representation is given in a
highly conventional way, expressing the meaning exactly and systematically. These
texts usually serve as a monomodel, with the written text playing a very limited role.
Visual communication previews the presence of a receiver (reader of a drawing) able
to catch the signal by sight and to decode it. In short, it is communication by using
professional figures.
Engineering drawings are not created as a medium of communication. Behind
them we can see, e.g. a dwelling-house which protects us from the impact of the
environment and guarantees necessary conditions of life, or e.g. a plough which is
expected to work efficiently for a long time on a stony field.
It is common to use CAD systems in the industrial design process however in
the early stages of the design process traditional freehand sketching is often more
efficient [1]. The sketch is a base to build a solid model of a future object and
generates an engineering drawing for final communication. Even physical 3D
prototypes that can be held in one`s hand can be printed out rapidly. The iconicity
(the icon as likeness to the object) of drawings makes them vivid, intuitive and
comprehensive.
5. CONCLUSIONS
The course of Engineering Graphics has two goals: to provide skills for reading
the engineering drawing and for writing the engineering drawing, which is treated as
a formal language – the design language for transferring the data of the existing or the
design object.
In the Shannon-Leopold communication model, which is the basic model in the
theory of communication, engineering drawings are used to forward the technical
ideas of a design object to the manufacturer. The role of the repertoire of signs used
in the design process is evident.
The acquired knowledge of engineering drawings is based on graphic
conventions and formal semiotics and it allows to encode (and decode) technical
ideas into a graphic representation (graphic model) as a medium through which visual
images in the mind of the designer are converted into the real object (product).
ACKNOWLEDGEMENTS
We would like to thank Professor Cornelie Leopold and anonymous reviewers for
making useful suggestions.

140/300 The 12th International Conference on Engineering Graphics – BALTGRAF 2013
6. REFERENCES
1. Barr R. Engineering Graphics Outcomes for the Global Engineer. In Proc.
15th Internat. Conf. on Geometry and Graphics, (Edited by Paul Zsombor-
Murray, Aaron Sprecher, Bruno Angeles), Montreal/Canada, August 1-5,
2012, (ISBN 978-0-7717-0717-9). Paper #00, -10 pp.
2. Bertoline G. R., Wiebe E. N. Fundamentals of Graphics Communication, 5
ed. McGraw-Hill. 2007. -832 pp.
3. Suzuki H., Miki N. A Graphic Science Education as Training of
Communication. Journal for Geometry and Graphics, 7, 2, 2003, p. 253-261.
4. ISO Standards Handbook. Technical drawings. Vol 1. Technical Drawings in
General, 2002. Vol 2. Mechanical Engineering Drawings. Construction
Drawing. Drawing Equipment, 2002.
5. Nadin M. Interface Design: A Semiotic Paradigm. Semiotica, 69-3/4, p. 269-
302, 1988.
6. Penna D. The Force of the Essential Language. In Proc. 15th Internat. Conf.
on Geometry and Graphics, (Edited by Paul Zsombor-Murray, Aaron
Sprecher, Bruno Angeles), Montreal/Canada, August 1-5, 2012, (ISBN 978-0-
7717-0717-9). Paper #88, -10 pp.
7. Leopold C. Geometrische Grundlagen der Architekturdarstellung,
Kohlhammer-Verlag Stuttgart, 1999, 3. ed. 2009, -15 S. (in German).
8. Tasheva S. B. Semiotics of Architectural Graphics. Detailed Summary of PhD
Thesis. Bulgarian Academy of Sciences, Sofia, 2012, -32 pp.
9. Jakobson R. Closing Statement: Linguistics and Poetics. Stylen in Language
(ed. Thomas Sebeok), New York, Wiley, 1960, p. 352-377.
10. Deely J. Basics of Semiotics. Fourth edition, Tartu University Press, Tartu,
2005. (bilingual in Estonian and English).

The 12 th International Conference on Engineering Graphics
BALTGRAF 2013 June 5-7, 2013, Riga, Latvia
141/300
ENGINEERING GRAPHICS AND HUMOR
Rein MÄGI1
1. ABSTRACT
Engineering Graphics is quite serious and difficult subject for students. By students’
opinion Descriptive Geometry is a difficult but interesting subject. It develops space
imagination of students and could be applied also in other disciplines – mathematics,
physics, chemistry etc. Everything that could increase the efficiency of teaching is
welcome.
By students’ opinions, the best exercises are those that are interesting and allow
getting maximum new information with minimum labour. The worst exercises are
those that are boring, too primitive and hardly understandable.
Good opportunities to increase students' attention are some activating means as jokes,
puzzles, tricks, attraction etc.
KEYWORDS: Engineering Graphics, Teaching Methods, Humour
2. INTRODUCTION
Drawing is the language of Engineering. But Engineering Graphics is quite
serious and difficult subject for students. For example, only 50% of students had been
able to pass the Descriptive Geometry exam successfully [1]. By students’ opinion
Descriptive Geometry is a difficult but interesting subject. It develops students’
spatial imagination and could be applied also in other disciplines – mathematics,
physics, chemistry etc. Everything that could increase the efficiency of teaching is
welcome.
Good opportunities to increase students' attention, optimism and creativity are
some reactivating means as jokes, puzzles, tricks, attraction etc.
Engineering Graphics subjects could be divided into:
Descriptive Geometry – theoretical preparation for the following areas;
Technical Drawing – forming representations, dimensions and other
information according to international standards;
Computer Graphics – creating technical drawings and other visual images
(2D and 3D) using computer hardware and software.
In each area we can use special means to awake students’ interest.
Some possibilities of these modes are illustrated by specific examples.
1 Centre of Engineering Graphics, Tallinn University of Technology, Ehitajate tee 5, Tallinn, 19086,
Estonia, e-mail: [email protected]
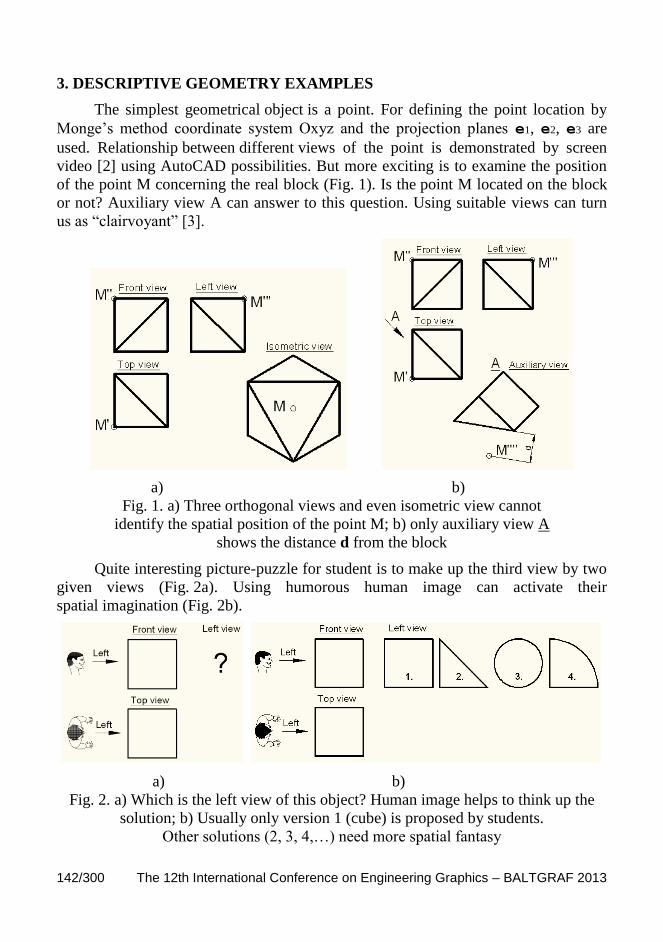
142/300 The 12th International Conference on Engineering Graphics – BALTGRAF 2013
3. DESCRIPTIVE GEOMETRY EXAMPLES
The simplest geometrical object is a point. For defining the point location by
Monge’s method coordinate system Oxyz and the projection planes e1, e2, e3 are
used. Relationship between different views of the point is demonstrated by screen
video [2] using AutoCAD possibilities. But more exciting is to examine the position
of the point M concerning the real block (Fig. 1). Is the point M located on the block
or not? Auxiliary view A can answer to this question. Using suitable views can turn
us as “clairvoyant” [3].
a) b)
Fig. 1. a) Three orthogonal views and even isometric view cannot
identify the spatial position of the point M; b) only auxiliary view A
shows the distance d from the block
Quite interesting picture-puzzle for student is to make up the third view by two
given views (Fig. 2a). Using humorous human image can activate their
spatial imagination (Fig. 2b).
a) b)
Fig. 2. a) Which is the left view of this object? Human image helps to think up the
solution; b) Usually only version 1 (cube) is proposed by students.
Other solutions (2, 3, 4,…) need more spatial fantasy

BALTGRAF 2013 – The 12th International Conference on Engineering Graphics 143/300
The main property of parallel projection is illustrated by horizontally flying
plane. Therefore we can determine the length of the plane L1 by measuring the
shadow’s length L2 (Fig. 3). But is it realistic or not?
Fig. 3. The shadow of the horizontally oriented airplane
is congruent to the origin plane
How to remember 5 variants of cone sections? Connection with some daily
object, for example conical wine glass, is quite witty possibility to save this
knowledge (Fig. 4).
Fig. 4. Five cone section variants illustrated by wine glass
4. TECHNICAL DRAWING EXAMPLES
Fundamental requirements for technical drawings are presented in international
standard ISO 128-1:2003 [4]:
• Unambiguous and clear. For any feature of a drawing there shall be only
one interpretation. It should be easy to understand for each involved person.
• In accordance with standards. The applied International Standard shall be
specified on the drawing in accordance with that standard. Additional related
documents necessary for the interpretation of the drawing shall be specified.
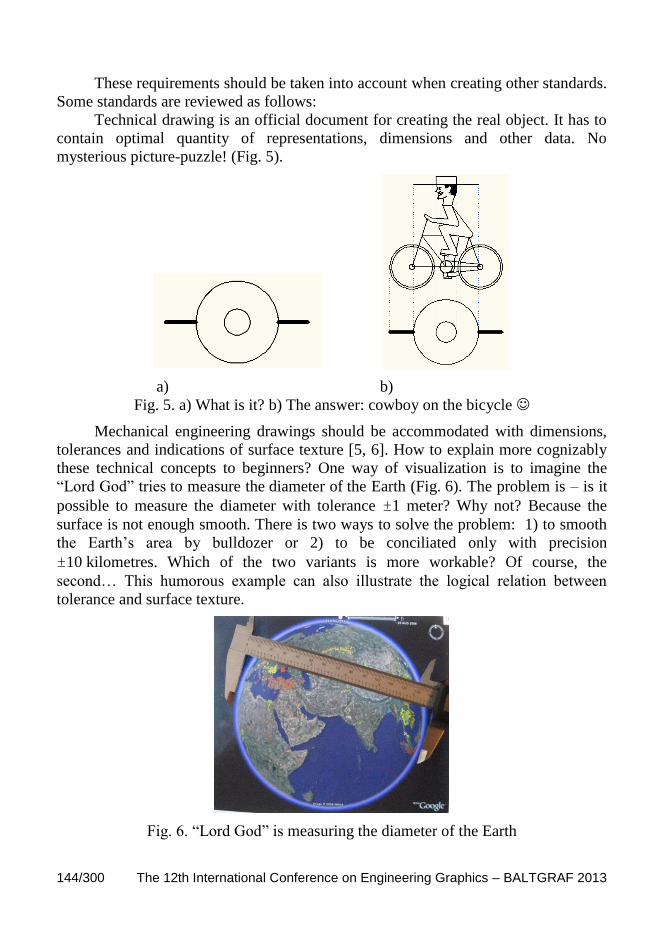
144/300 The 12th International Conference on Engineering Graphics – BALTGRAF 2013
These requirements should be taken into account when creating other standards.
Some standards are reviewed as follows:
Technical drawing is an official document for creating the real object. It has to
contain optimal quantity of representations, dimensions and other data. No
mysterious picture-puzzle! (Fig. 5).
a) b)
Fig. 5. a) What is it? b) The answer: cowboy on the bicycle
Mechanical engineering drawings should be accommodated with dimensions,
tolerances and indications of surface texture [5, 6]. How to explain more cognizably
these technical concepts to beginners? One way of visualization is to imagine the
“Lord God” tries to measure the diameter of the Earth (Fig. 6). The problem is – is it
possible to measure the diameter with tolerance ±1 meter? Why not? Because the
surface is not enough smooth. There is two ways to solve the problem: 1) to smooth
the Earth’s area by bulldozer or 2) to be conciliated only with precision
±10 kilometres. Which of the two variants is more workable? Of course, the
second… This humorous example can also illustrate the logical relation between
tolerance and surface texture.
Fig. 6. “Lord God” is measuring the diameter of the Earth
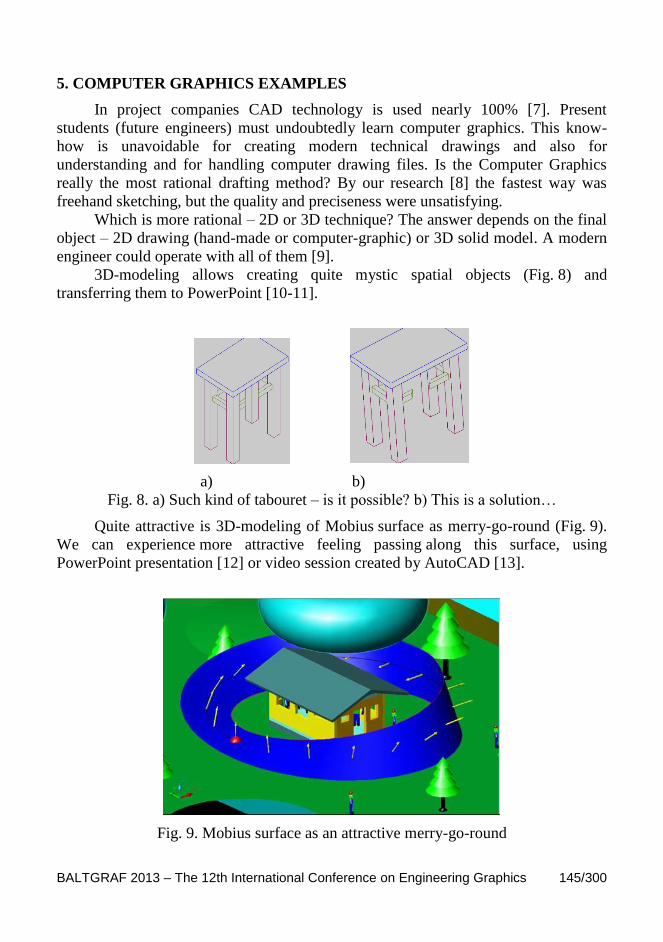
BALTGRAF 2013 – The 12th International Conference on Engineering Graphics 145/300
5. COMPUTER GRAPHICS EXAMPLES
In project companies CAD technology is used nearly 100% [7]. Present
students (future engineers) must undoubtedly learn computer graphics. This know-
how is unavoidable for creating modern technical drawings and also for
understanding and for handling computer drawing files. Is the Computer Graphics
really the most rational drafting method? By our research [8] the fastest way was
freehand sketching, but the quality and preciseness were unsatisfying.
Which is more rational – 2D or 3D technique? The answer depends on the final
object – 2D drawing (hand-made or computer-graphic) or 3D solid model. A modern
engineer could operate with all of them [9].
3D-modeling allows creating quite mystic spatial objects (Fig. 8) and
transferring them to PowerPoint [10-11].
a) b)
Fig. 8. a) Such kind of tabouret – is it possible? b) This is a solution…
Quite attractive is 3D-modeling of Mobius surface as merry-go-round (Fig. 9).
We can experience more attractive feeling passing along this surface, using
PowerPoint presentation [12] or video session created by AutoCAD [13].
Fig. 9. Mobius surface as an attractive merry-go-round
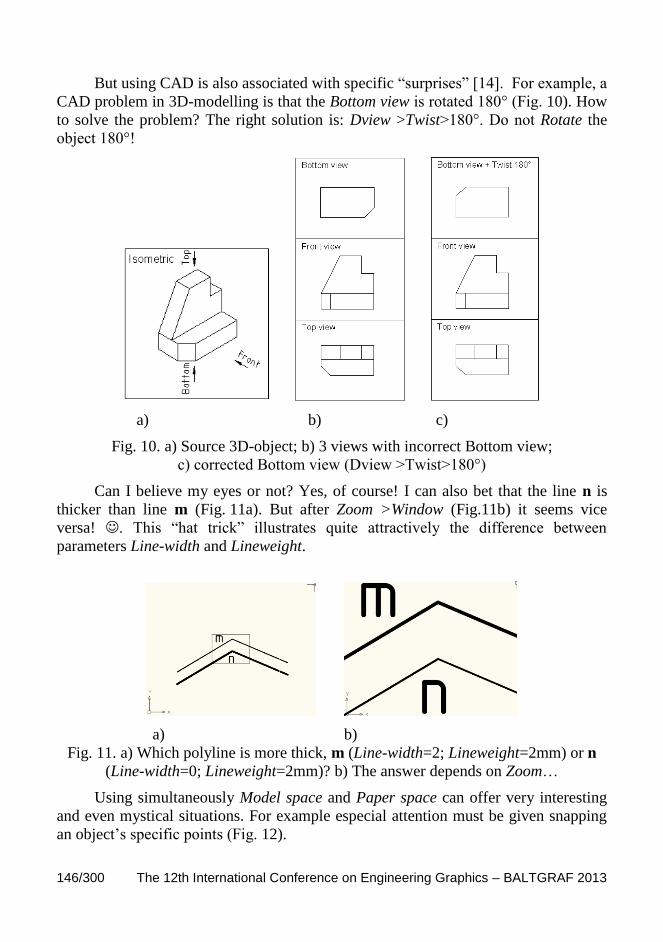
146/300 The 12th International Conference on Engineering Graphics – BALTGRAF 2013
But using CAD is also associated with specific “surprises” [14]. For example, a
CAD problem in 3D-modelling is that the Bottom view is rotated 180° (Fig. 10). How
to solve the problem? The right solution is: Dview >Twist>180°. Do not Rotate the
object 180°!
a) b) c)
Fig. 10. a) Source 3D-object; b) 3 views with incorrect Bottom view;
c) corrected Bottom view (Dview >Twist>180°)
Can I believe my eyes or not? Yes, of course! I can also bet that the line n is
thicker than line m (Fig. 11a). But after Zoom >Window (Fig.11b) it seems vice
versa! . This “hat trick” illustrates quite attractively the difference between
parameters Line-width and Lineweight.
a) b)
Fig. 11. a) Which polyline is more thick, m (Line-width=2; Lineweight=2mm) or n
(Line-width=0; Lineweight=2mm)? b) The answer depends on Zoom…
Using simultaneously Model space and Paper space can offer very interesting
and even mystical situations. For example especial attention must be given snapping
an object’s specific points (Fig. 12).
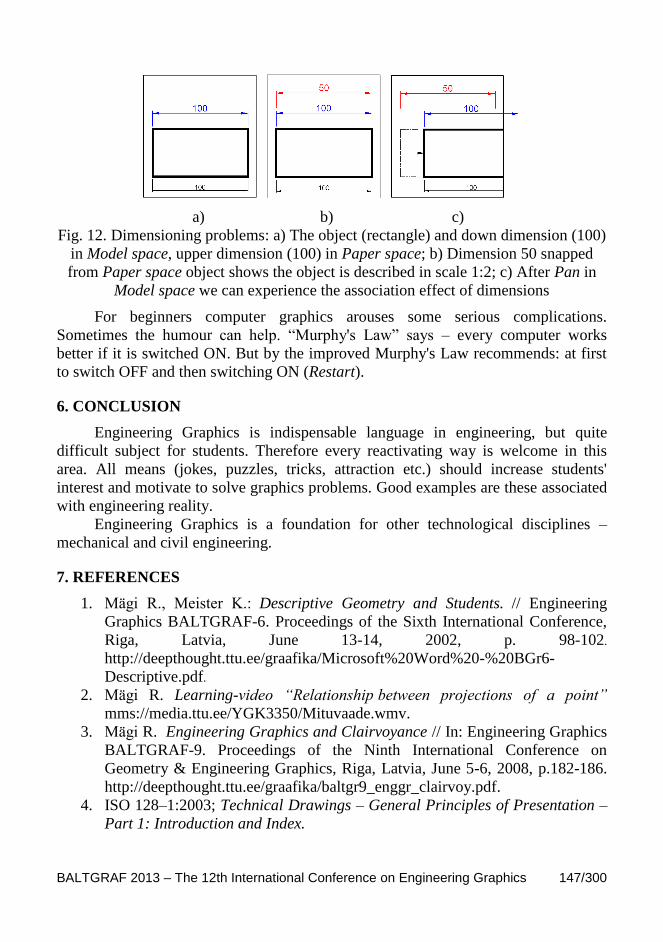
BALTGRAF 2013 – The 12th International Conference on Engineering Graphics 147/300
a) b) c)
Fig. 12. Dimensioning problems: a) The object (rectangle) and down dimension (100)
in Model space, upper dimension (100) in Paper space; b) Dimension 50 snapped
from Paper space object shows the object is described in scale 1:2; c) After Pan in
Model space we can experience the association effect of dimensions
For beginners computer graphics arouses some serious complications.
Sometimes the humour can help. “Murphy's Law” says – every computer works
better if it is switched ON. But by the improved Murphy's Law recommends: at first
to switch OFF and then switching ON (Restart).
6. CONCLUSION
Engineering Graphics is indispensable language in engineering, but quite
difficult subject for students. Therefore every reactivating way is welcome in this
area. All means (jokes, puzzles, tricks, attraction etc.) should increase students'
interest and motivate to solve graphics problems. Good examples are these associated
with engineering reality.
Engineering Graphics is a foundation for other technological disciplines –
mechanical and civil engineering.
7. REFERENCES
1. Mägi R., Meister K.: Descriptive Geometry and Students. // Engineering
Graphics BALTGRAF-6. Proceedings of the Sixth International Conference,
Riga, Latvia, June 13-14, 2002, p. 98-102.
http://deepthought.ttu.ee/graafika/Microsoft%20Word%20-%20BGr6-
Descriptive.pdf.
2. Mägi R. Learning-video “Relationship between projections of a point”
mms://media.ttu.ee/YGK3350/Mituvaade.wmv.
3. Mägi R. Engineering Graphics and Clairvoyance // In: Engineering Graphics
BALTGRAF-9. Proceedings of the Ninth International Conference on
Geometry & Engineering Graphics, Riga, Latvia, June 5-6, 2008, p.182-186.
http://deepthought.ttu.ee/graafika/baltgr9_enggr_clairvoy.pdf.
4. ISO 128–1:2003; Technical Drawings – General Principles of Presentation –
Part 1: Introduction and Index.
148/300 The 12th International Conference on Engineering Graphics – BALTGRAF 2013
5. ISO 129-1:2004; Technical Drawings – Indication of Dimensions and
Tolerances – Part 1: General Principles.
6. ISO 1302:2002; Geometrical Product Specifications (GPS) -- Indication of
Surface Texture in Technical Product.
7. Mägi R., Sepsivart M. Drawing Management in Estonian Companies //
Engineering Graphics BALTGRAF-7. Proceedings of the Seventh
International Conference, Vilnius, Lithuania, May 27-28, 2004, p. 111-115.
http://deepthought.ttu.ee/graafika/BaltGr-7_Draw-Manag.pdf.
8. Mägi R. Rational Drafting // In: 10th International Conference on Engineering
Graphics BALTGRAF-10. Conference Proceedings. June 4-5, Vilnius
Gediminas Technical University, Lithuania. Vilnius 2009, p. 92-97.
http://deepthought.ttu.ee/graafika/magirein_BaGr10-RatDra.pdf.
9. Mägi R. From 2D to 3D. // Engineering Graphics BALTGRAF-5. Abstracts
of the International Conference, Tallinn, Estonia, June 15-16, 2000, p. 26-30
http://deepthought.ttu.ee/graafika/Microsoft%20Word%20-%20From-2D-to-
3D.pdf.
10. Mägi R., Hunt T., Meister K. From AutoCAD to PowerPoint. In: Engineering
Graphics BALTGRAF-9. Proceedings of the Ninth International Conference
on Geometry & Engineering Graphics, Riga, Latvia, June 5-6, 2008, p. 167-
172. http://deepthought.ttu.ee/graafika/baltgr9_from_acad_to_pp.pdf.
11. Mägi R. Is it Possible? http://www.hot.ee/r/rmagi/Ons.pps. (in Estonian).
12. Mägi R. Moebius surface. http://www.hot.ee/r/rmagi/Mob1.ppt. (in Estonian).
13. Mägi R. Video: Moebius carousel.
mms://media.ttu.ee/YGK3350/2008_03_klipp3.wmv. (in Estonian).
14. Mägi R., Möldre H. CAD Problems and Solutions // In: 10th
International
Conference on Engineering Graphics BALTGRAF-10. Conference
Proceedings. June 4-5, Vilnius Gediminas Technical University, Lithuania.
Vilnius 2009, p. 104-109.
http://deepthought.ttu.ee/graafika/magirein_BaGr10-CADproblem.pdf.
The 12 th International Conference on Engineering Graphics
BALTGRAF 2013 June 5-7, 2013, Riga, Latvia
149/300
PERSPECTIVE VIEW POSSIBILITIES
Rein MÄGI1
1. ABSTRACT
Parallel projections are mainly used on technical drawings due to non-deformed
images unavoidable for dimensioning. But human vision and photography is based on
central projection (perspective) where the centre of projection rays is located in the
focus of the eye or the camera. Therefore the perspective view is more realistic and
expressive than parallel projection.
According to foreshortening the perspective drawings can be divided to one-, two-
and three-point perspective. The names of these categories refer to the number
of vanishing points in the perspective drawing.
Several methods of constructing perspectives exist, including:
Freehand sketching (common in art)
Graphically 2D-constructing (once common in architecture)
3D-modelling in CAD
Photo-composition with camera
The result of the perspective image depends on some parameters: view angle (Zoom),
distance, lights, shadows and other. Too large view angle causes inadvisable
deformities of peripheral objects.
Additional spatial effects can be obtained from two perspective images using
stereoscopic method. 3D-modelling in AutoCAD enables to produce video-clip with
moving camera.
Modern digital photo-camera allows to create very attractive panoramic image and
other effects.
Knowing perspective view possibilities gives the availability to create expressive
images in drawings and in photography.
KEYWORDS: Projection Types, Perspective View, Features of Perspectives
1 Centre of Engineering Graphics, Tallinn University of Technology, Ehitajate tee 5, Tallinn, 19086,
Estonia, e-mail: [email protected]

150/300 The 12th International Conference on Engineering Graphics – BALTGRAF 2013
2. INTRODUCTION
An engineering drawing, a type of technical drawing, is used to fully and
clearly define requirements for engineered items [1].
Graphical projection is a protocol by which an image of a three-
dimensional object is projected onto a planar surface without the aid of mathematical
calculation, used in technical drawing [2].
There are two graphical projection categories each with its own protocol: 1)
parallel projection and 2) perspective projection.
Parallel projections are mainly used on technical drawings due to non-deformed
images unavoidable for dimensioning.
Perspective projection is a linear projection where three-dimensional objects are
projected on a picture plane. This has the effect that distant objects appear smaller
than nearer objects.
But human vision and photography is based on central projection (perspective)
where the centre of projection rays is located in the focus of the eye or the camera.
Therefore the perspective view is more realistic and expressive than parallel
projection.
Perspective (from Latin perspicere, to see through) in the graphic arts, such as
drawing, is an approximate representation, on a flat surface (such as paper), of an
image as it is seen by the eye [3]. The two most characteristic features of perspective
are that objects are drawn:
Smaller as their distance from the observer increases;
Foreshortened: the sizes of an object's dimensions along the line of sight are
relatively shorter than dimensions across the line of sight.
The nature of perspective view is illustrated by real objects (Fig. 1).
a) b)
Fig. 1. Illustration of the perspective principle: a) by human vision through the
window and b) by photo-camera [4]
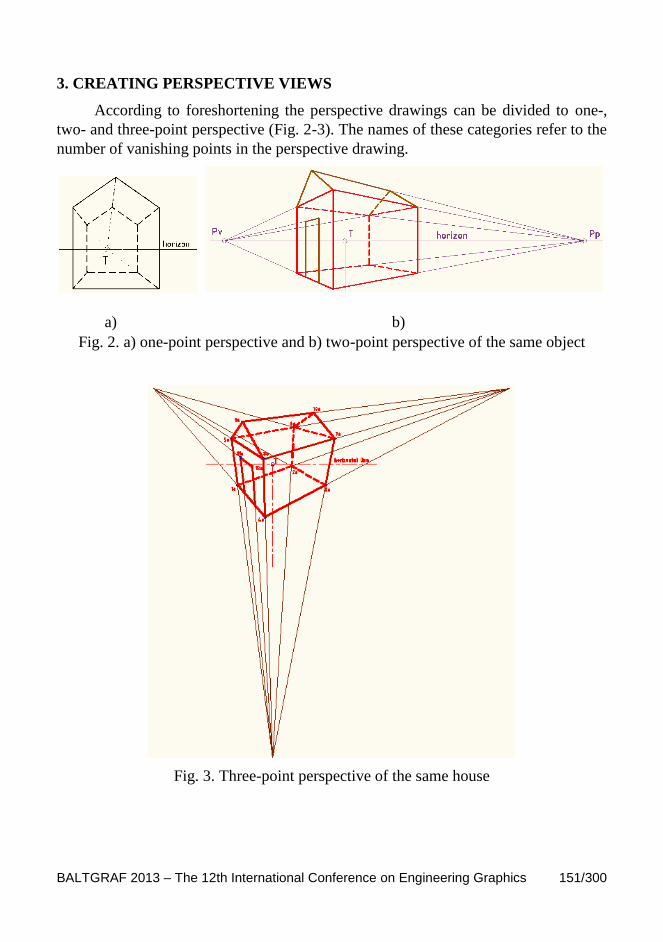
BALTGRAF 2013 – The 12th International Conference on Engineering Graphics 151/300
3. CREATING PERSPECTIVE VIEWS
According to foreshortening the perspective drawings can be divided to one-,
two- and three-point perspective (Fig. 2-3). The names of these categories refer to the
number of vanishing points in the perspective drawing.
a) b)
Fig. 2. a) one-point perspective and b) two-point perspective of the same object
Fig. 3. Three-point perspective of the same house

152/300 The 12th International Conference on Engineering Graphics – BALTGRAF 2013
Several methods of constructing perspective views exist, including:
Freehand sketching (common in art)
Graphically 2D-constructing (once common in architecture)
3D-modelling in CAD
Photo-composition with camera
For freehand sketching it is suitable to use vanishing points and auxiliary
square-mesh (Fig. 4).
Fig. 4. Auxiliary mesh of squares. T” – vanishing point of edges, Pd” – vanishing
point of diagonals
Creating perspective view by 2D-drafting is quite capacious and accuracy
demanding process (Fig. 5). Optimal view-angle = 20-40 [4].
Fig. 5. Creating perspective view issued from two orthogonal projections

BALTGRAF 2013 – The 12th International Conference on Engineering Graphics 153/300
But more comfortable is to get perspective view by 3D-modelling. In AutoCAD
it suits using command Dview>Points>Distance (Fig. 6).
Fig. 6. 3D-object (house) with target-points (T1, T2) and
camera-points (So, S1, S2; S1L, S1R)
Created perspective views according to different directions are shown in Figure
7. Views S1>T1 and S2>T2 are with two vanishing points; views S0>T1 and S2>T1
with three vanishing points.
Fig. 7. Perspective views according to Camera>Target direction: S0>T1, S1>T1,
S2>T2, S2>T1
Stereo-effect is based on two- eye seeing. Images in left and right eye are
different (Fig. 8).

154/300 The 12th International Conference on Engineering Graphics – BALTGRAF 2013
a) b)
Fig. 8. a) The principle of stereovision; b) Stereogram made by 3D-modeling
4. FEATURES OF PERSPECTIVE VIEWS
Foreshortening the camera and target has an effect on the result of the image.
Too large view-angle a can cause distortions in the outer objects (Fig. 9).
a) b)
Fig. 9. a) View-angle a = 60; b) View-angle a = 130
Bottom-up “frog-view” (S0>T1 – Fig. 7) and top-down “eagle-view” (S2>T1 –
Fig. 7) can give interesting results in photography (Fig. 10).
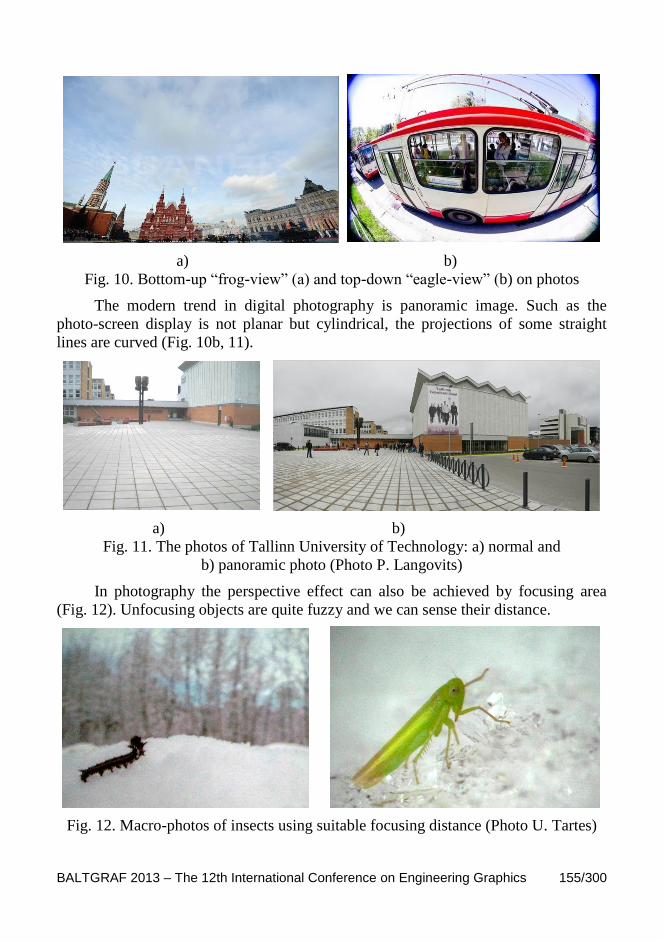
BALTGRAF 2013 – The 12th International Conference on Engineering Graphics 155/300
a) b)
Fig. 10. Bottom-up “frog-view” (a) and top-down “eagle-view” (b) on photos
The modern trend in digital photography is panoramic image. Such as the
photo-screen display is not planar but cylindrical, the projections of some straight
lines are curved (Fig. 10b, 11).
a) b)
Fig. 11. The photos of Tallinn University of Technology: a) normal and
b) panoramic photo (Photo P. Langovits)
In photography the perspective effect can also be achieved by focusing area
(Fig. 12). Unfocusing objects are quite fuzzy and we can sense their distance.
Fig. 12. Macro-photos of insects using suitable focusing distance (Photo U. Tartes)
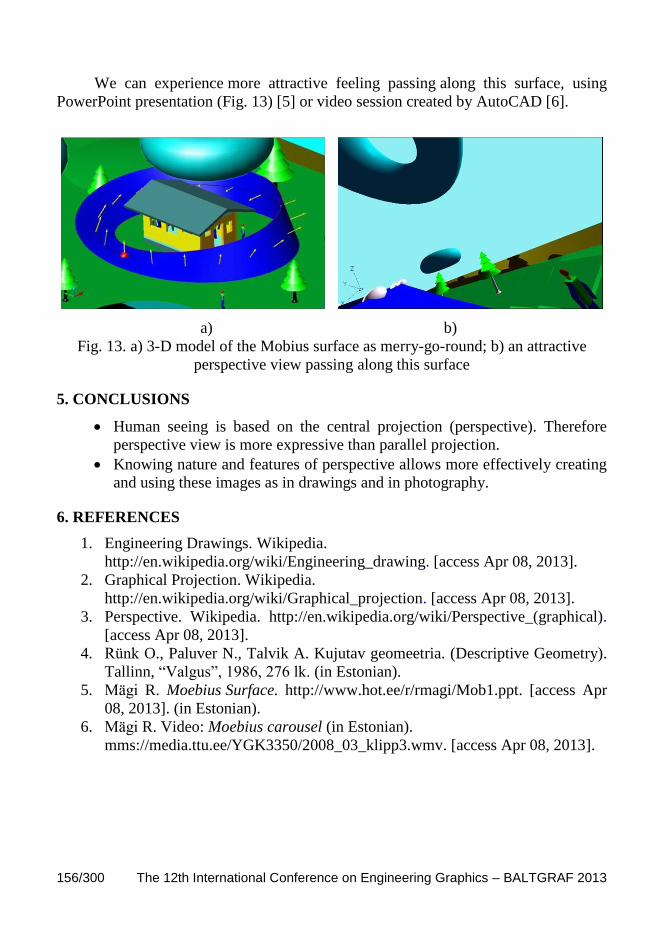
156/300 The 12th International Conference on Engineering Graphics – BALTGRAF 2013
We can experience more attractive feeling passing along this surface, using
PowerPoint presentation (Fig. 13) [5] or video session created by AutoCAD [6].
a) b)
Fig. 13. a) 3-D model of the Mobius surface as merry-go-round; b) an attractive
perspective view passing along this surface
5. CONCLUSIONS
Human seeing is based on the central projection (perspective). Therefore
perspective view is more expressive than parallel projection.
Knowing nature and features of perspective allows more effectively creating
and using these images as in drawings and in photography.
6. REFERENCES
1. Engineering Drawings. Wikipedia.
http://en.wikipedia.org/wiki/Engineering_drawing. [access Apr 08, 2013].
2. Graphical Projection. Wikipedia.
http://en.wikipedia.org/wiki/Graphical_projection. [access Apr 08, 2013].
3. Perspective. Wikipedia. http://en.wikipedia.org/wiki/Perspective_(graphical).
[access Apr 08, 2013].
4. Rünk O., Paluver N., Talvik A. Kujutav geomeetria. (Descriptive Geometry).
Tallinn, “Valgus”, 1986, 276 lk. (in Estonian).
5. Mägi R. Moebius Surface. http://www.hot.ee/r/rmagi/Mob1.ppt. [access Apr
08, 2013]. (in Estonian).
6. Mägi R. Video: Moebius carousel (in Estonian).
mms://media.ttu.ee/YGK3350/2008_03_klipp3.wmv. [access Apr 08, 2013].
The 12 th International Conference on Engineering Graphics
BALTGRAF 2013 June 5-7, 2013, Riga, Latvia
157/300
TO CREATE OR TO EXPLODE?
Rein MÄGI1, Heino MÖLDRE
2
1. ABSTRACT
This “Hamlet’s question” may arise dealing with the Computer Aided Design (CAD).
Certainly “to create” – it is the first reaction. But for creating new building it is
sometimes necessary at first to demolish the old one. Only rational solution is
reasonable. CAD objects can be very primitive or more compounded (Block, Mtext,
Hatch, Dimension etc.). Command Explode in AutoCAD breaks a compound object
into its component objects. Exploding objects allows sometimes provide effective
opportunities. But sometimes it is associated with dangerous risks – we may lose
some of the required properties (Line-width, Attributes and other). Some instructive
examples illustrate exploding possibilities and dangers in CAD. Practical
recommendations are included also.
KEYWORDS: CAD Objects, Hierarchy of Objects, Exploding Objects
2. INTRODUCTION
CAD objects can be divided into elementary and more complex according to
the hierarchy. The hierarchy level can be seen by using the command Explode. The
most primitive objects (Line, Arc, Circle etc.) cannot be exploded. But there is
impossible to explode also some more compound objects (Block, Minsert) if the
exploding this object is not allowed.
Why to explode objects? Of course to achieve a positive effect in designing.
This good idea is illustrated by some practical examples.
3. EXAMPLES OF USE EXPLODING
Our analysis of some CAD problems and desirable solutions are demonstrated
[1]. But a new “surprise” emerged with new version AutoCAD 2013 (Fig. 1).
1 Centre of Engineering Graphics, Tallinn University of Technology, Ehitajate tee 5, Tallinn, 19086,
Estonia, e-mail: [email protected] 2 Centre of Engineering Graphics, Tallinn University of Technology, Ehitajate tee 5, Tallinn, 19086,
Estonia, e-mail: [email protected]
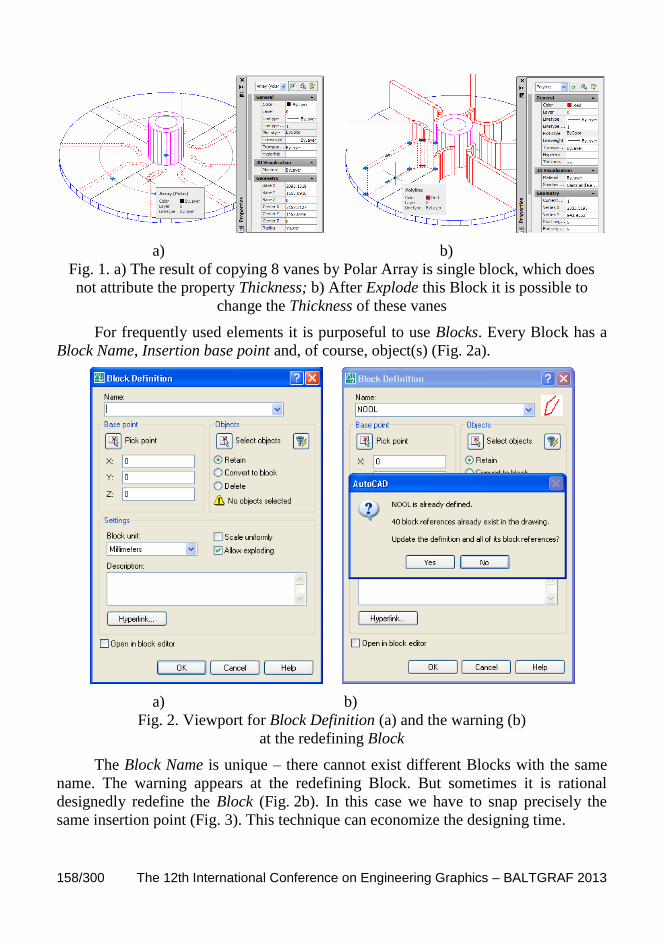
158/300 The 12th International Conference on Engineering Graphics – BALTGRAF 2013
a) b)
Fig. 1. a) The result of copying 8 vanes by Polar Array is single block, which does
not attribute the property Thickness; b) After Explode this Block it is possible to
change the Thickness of these vanes
For frequently used elements it is purposeful to use Blocks. Every Block has a
Block Name, Insertion base point and, of course, object(s) (Fig. 2a).
a) b)
Fig. 2. Viewport for Block Definition (a) and the warning (b)
at the redefining Block
The Block Name is unique – there cannot exist different Blocks with the same
name. The warning appears at the redefining Block. But sometimes it is rational
designedly redefine the Block (Fig. 2b). In this case we have to snap precisely the
same insertion point (Fig. 3). This technique can economize the designing time.

BALTGRAF 2013 – The 12th International Conference on Engineering Graphics 159/300
Fig. 3. Result of changing the content of the same name of Block,
retained the same Insertion point.
Quite attractive didactic possibilities we can achieve exploding 3D-solid
models (Fig. 4). After the first Explode the Solid-object break down to Surfaces and
Regions. But after second Explode the lines and curves will appear. Rather
comprehensive expression arises after rotating these images to horizontal plane (Fig.
5).
a) b) c) d)
Fig. 4. a) 2D-image of the cone cut by different planes; b) 3D-solid model;
c) after Explode the model; d) after next Explode this model
Fig. 5. Top view after rotating these images to the horizontal plane
ABlock
Insert ion point Insert ion pointBBlock

160/300 The 12th International Conference on Engineering Graphics – BALTGRAF 2013
But there is impossible to explode every Solid object. For example, if the 3D
solid object (Sphere) is inserted as Block with unequal scale factors then the object is
not able to be exploded (Fig. 6).
Variable EXPLMODE controls whether the EXPLODE command supports non-
uniformly scaled (NUS) blocks: 0 = does not explode NUS blocks; 1= explodes NUS
blocks. Desirable variant is EXPLMODE = 1.
Even command XPLODE is usable. It sets the colour, line type, line weight, and
layer of the component objects to that of the exploded object if the component
objects' colour, line type, and line weight are BYBLOCK and the objects are drawn
on layer 0.
a) b) c) d)
Fig. 6. a) The same Block (Solid Sphere) inserted with different scale factors;
b) objects after first Explode; c) after second Explode; d) after third Explode
4. EXAMPLES OF UNDESIRABLE USE EXPLODING
Quite often Blocks are applied to create Title blocks for technical drawing. It
may consist of both permanent text (Text) and changing text (Attribute) [3].
But after exploding these Blocks we can lose values of Attributes (Fig. 7). After
these kind of mistakes it has to use command Undo. But the command Undo we
can call back only once by command Redo! The right possibility for changing
Attribute values is to use Modify>Object>Attribute.
Until year 2000 it was possible to use the Polyline-width parameter for creating
thick lines. Since version AutoCAD 2000 the new more comfortable parameter
Lineweight appeared, which provides printing line-width (in mm) regardless of the
drawing scale.
But for Polyline only Polyline-width works. How to use Lineweight parameter
for Polyline? To Explode polyline? Then the Polyline loses its width and breaks to
Lines and Arcs, which is undesirable. More rational variant is to attach to the Polyline
Global width = 0 – only in this case the Lineweight parameter works for Polyline.

BALTGRAF 2013 – The 12th International Conference on Engineering Graphics 161/300
Fig. 7. Results of modifying Block (with Attributes) by command Explode and
Modify>Object>Attribute
5. CONCLUSIONS
To explode or not to explode objects? The answer depends on some
reasoning’s.
Exploding the compound object is recommendable for creating something
new and necessary.
Because the exploding is related to the risk, for safety reasons we should
make a reserve copy of the source object.
6. REFERENCES
1. Mägi R., Möldre H. CAD Problems and Solutions // 10th International
Conference on Engineering Graphics BALTGRAF-10; Conference
Proceedings. Vilnius Gediminas Technical University. Vilnius, Lithuania,
June 4-5, 2009, p. 104-109.
http://deepthought.ttu.ee/graafika/magirein_BaGr10-CADproblem.pdf.

162/300 The 12th International Conference on Engineering Graphics – BALTGRAF 2013
2. Mägi R. Blocks, Layers, Styles – Possibilities and Dangers // In: Engineering
Graphics BALTGRAF-9. Proceedings of the Ninth International Conference
on Geometry & Engineering Graphics. Riga, Latvia, June 5-6, 2008, p.103-
107. http://deepthought.ttu.ee/graafika/baltgr9_blocks_and_layers.pdf.
3. Mägi R. Handling CAD-files // In: Engineering Graphics BALTGRAF-8.
Proceedings of the Eighth International Conference. Tallinn, Estonia, June 8-
9, 2006, p. 116-120. http://deepthought.ttu.ee/graafika/RMagi2006_BaltGr-
8_Handling_CAD.pdf.

The 12 th International Conference on Engineering Graphics
BALTGRAF 2013 June 5-7, 2013, Riga, Latvia
163/300
GEOMETRICAL EDUCATION BY USING MULTIMEDIA
PRESENTATION
Miodrag NESTOROVIĆ1, Aleksandar ČUČAKOVIĆ
2,
Nataša TEOFILOVIĆ1, Biljana JOVIĆ
3
1. ABSTRACT
This paper proposed integration of multimedia presentation and implementation tools
for 3D animation applications, in the geometrical education. The aim of this method
is to simplify the perception of geometrical forms and the process of their
constructions and their combinations with each other, resulting in more complex
geometry that is easier to perceive in geometrical education. The innovative
interdisciplinary, hybrid approach resulting from the overlapping and intertwining of
multiple disciplines: descriptive geometry, architecture, structural systems, computer
animation and use of virtual technologies. Dynamic geometrical education is
presented on multimedia DVD that covers selected areas of the geometrical theory.
Multimedia DVD contains 16 integrated animated short forms with concise textual
explanations – subtitles. DVD titled "Geometric education using the principles and
tools of 3D animation" is the geometrical education learning material for students of
technical and artistic groups.
KEYWORDS: Geometrical education, multimedia, virtual technologies
ACKNOWLEDGEMENT
Authors are supported by the Serbian Ministry of Science and technological
development, project number TP36008
2. INTRODUCTION
Development of spatial visualization ability is improved by use of dynamic and
interactive animation programs for the study of geometry. New standard in geometry
education, emphasizes in this paper, is the use of multimedia tools in educations of
descriptive geometry. This work is important research in the field of application of
1 University of Belgrade, Faculty of Architecture, Bulevar Kralja Aleksandra 73/2, Belgrade, 11000,
Serbia, e-mail: [email protected], [email protected] 2 University of Belgrade, Faculty of Civil Engineering, Bulevar Kralja Aleksandra 73/1, Belgrade,
11000, Serbia, e-mail: [email protected] 3 University of Belgrade, Faculty of Forestry, Kneza Viseslava 1, Belgrade, 11030, Serbia, e-mail:

164/300 The 12th International Conference on Engineering Graphics – BALTGRAF 2013
methodological innovation in the area of space geometry and computer animations
with the focus on geometry education. The geometry in the plane and space geometry
is unseparated part of the geometrical education. Sketching, graphic design, static and
dynamic presentations are involved in the graphical education. Improvement of
spatial ability, accessible application, and pedagogical stimuli for encouragement in
further geometry exploration is provided by dynamic 3D geometry in education.
Fig. 1. DVD cover "Geometric education using the principles and
tools of 3D animation"
Educational DVD is published by Faculty of Architecture, University of
Belgrade (Fig. 1).
3. GEOMETRICAL EDUCATION
Ability of spatial representation, perception and understanding of space is
enabled by geometrical education. Drawing is a tool but not the aim of geometrical
education. Geometrical education is definitely the most important for all engineers
and students of art [1].
Learning process is carried out when students are able to build conceptual
models that are in accordance with what they already understand and with new
content as constructivist theory emphasizes. Pedagogical theory – constructivism
provides a valid and reliable basis for a theory of learning in a virtual environment
[2].
Professor Hannes Kauffmann from TU Vienna in his PhD Dissertation suggests
using different models of learning in a virtual environment from autodidactic learning
models to those which are guided by teachers [3].

BALTGRAF 2013 – The 12th International Conference on Engineering Graphics 165/300
We suggest the use of 3D animation with short textual explanation on
multimedia in geometrical education and consider that it is fully compatible with
constructivist pedagogical theory.
Kortenkamp in “Foundation of Dynamic Geometry” explain the comprehensive
work on the dynamic geometry [4]. The importance for the educational purposes is in
the fact that one can explore the geometry characteristics by moving the same
geometrical structure. It could be observed which parts of a construction change and
which remain the same, unchanged. It gives much more insight into the actual
construction and general geometry, if we can experience what happens when you start
moving that construction. In this paper we emphasize the importance of dealing with
design dynamically-generated form.
Geometrical areas that are processed on DVD geometrical learning tool consist
of 16 animations, 5 minutes duration in average.
Fig. 2. Content of multimedia DVD
Geometrical areas are: Platonic solids: cube, tetrahedron, octahedron,
dodecahedron and icosahedron; Ruled surface: conoid, rotational hyperboloid,
helicoid and hyperbolic paraboloid; The surface of revolution: the torus; Mutual
intersection: conic sections, cone and cylinder, sphere and cylinder and two half-

166/300 The 12th International Conference on Engineering Graphics – BALTGRAF 2013
cylinder; Experimental design (freeform) [8]: generating a surface with the two
profiles as guidelines, generating free form using lattice deformers and generate free-
form by the duplicating along curves; (Fig. 2). In terms of position of the geometrical
content in curriculum is very diverse [7]. Selected areas showed how the different
geometrical fields may be processed in the virtual environment. Using 3D animation
in the geometrical education supports different learning tools for students, guided by
teachers and auto didactical as well as more autonomous way of learning. The
interpretation of spatial constructions in the plane requires a lot of spatial thinking
and understanding of spatial problems. Spatial geometrical ideas could be tested,
developed and realized in a short time by using this kind of learning tools. The
significance in educational sense is that it is possible, in completely new examples
and applications, to perform the implementation of 2D geometry in a dynamic 3D
space. For our current and future work this is a very inspirative and perspective base,
for further research of different geometrical problems, using available applications for
3D animation in geometrical education.
4. MULTIMEDIA
The use of digital technology involves interdisciplinary approach. At the area of
digital art there are constant changes in the categorization of the digital art
terminology [5]. Hybrid art is category specifically dedicated to today's hybrid and
trans-disciplinary projects and approaches to projects and media arts. This open
approach allows changes in the art categorization as well as method used and
favoured in this paper [6].
For students of art and engineering field of technical – technological group the
specific contribution is in the education by working with 3D animation. We used and
finally presented geometrical areas as a short animated form. Constructive process is
directly recorded in of dynamic 3D software (Autodesk Softimage), and each
animation has additional text that follows and explains the procedure and gives the
basic definitions.
Fig. 3. Frames from different multimedia
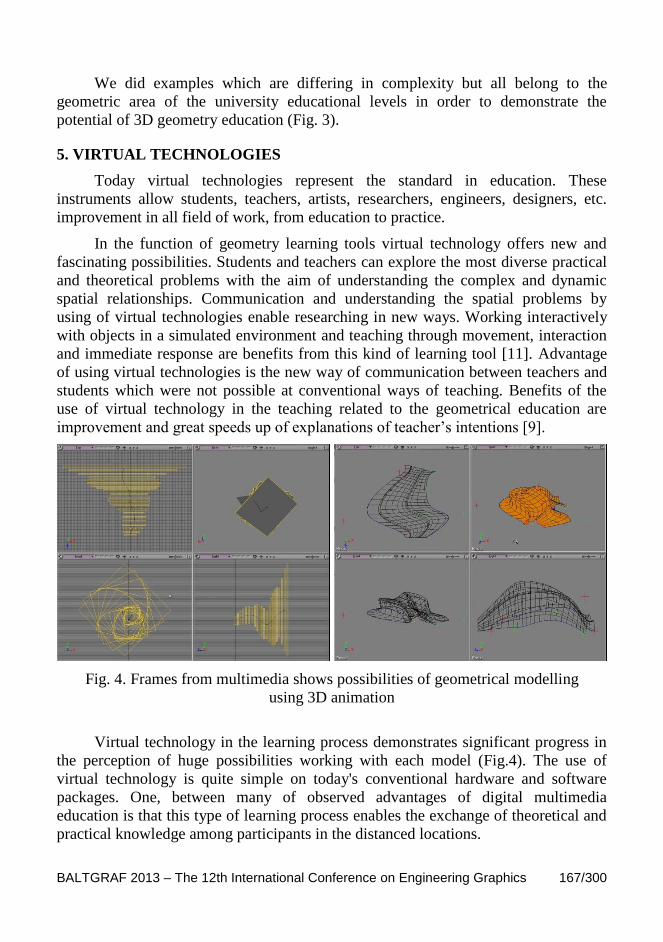
BALTGRAF 2013 – The 12th International Conference on Engineering Graphics 167/300
We did examples which are differing in complexity but all belong to the
geometric area of the university educational levels in order to demonstrate the
potential of 3D geometry education (Fig. 3).
5. VIRTUAL TECHNOLOGIES
Today virtual technologies represent the standard in education. These
instruments allow students, teachers, artists, researchers, engineers, designers, etc.
improvement in all field of work, from education to practice.
In the function of geometry learning tools virtual technology offers new and
fascinating possibilities. Students and teachers can explore the most diverse practical
and theoretical problems with the aim of understanding the complex and dynamic
spatial relationships. Communication and understanding the spatial problems by
using of virtual technologies enable researching in new ways. Working interactively
with objects in a simulated environment and teaching through movement, interaction
and immediate response are benefits from this kind of learning tool [11]. Advantage
of using virtual technologies is the new way of communication between teachers and
students which were not possible at conventional ways of teaching. Benefits of the
use of virtual technology in the teaching related to the geometrical education are
improvement and great speeds up of explanations of teacher’s intentions [9].
Fig. 4. Frames from multimedia shows possibilities of geometrical modelling
using 3D animation
Virtual technology in the learning process demonstrates significant progress in
the perception of huge possibilities working with each model (Fig.4). The use of
virtual technology is quite simple on today's conventional hardware and software
packages. One, between many of observed advantages of digital multimedia
education is that this type of learning process enables the exchange of theoretical and
practical knowledge among participants in the distanced locations.

168/300 The 12th International Conference on Engineering Graphics – BALTGRAF 2013
Virtual technologies are also good platform for teamwork. Collaboration
between teachers and students using interactive media includes design and
communication at a much more direct way than simple file sharing. The working
possibility is multiple and all participants showed a higher level of interaction.
Multimedia allows the joint participation in the processes of thinking, creating and
understanding. Virtual technologies demonstrate a possibility of establishing a unique
combination of communication and collaboration of interactive teaching process that
is transparent and direct [10]. Users of virtual systems have tremendous opportunities
to explore geometrical characteristics and spatial relationships of the topics being
processed in this paper [12].
Virtual technology implementation refers to the use for the dynamic
geometrical education in areas that are the most suitable for this method. Dynamic
tool for educational purposes was done by live recording of whole construction
process in 3D software at the Studio for digital 3D animation at the Faculty of
Architecture, University of Belgrade. Software for 3D animation – Autodesk
Softimage was donated by US AID to Faculty of Architecture, University of Belgrade
in 2007. The animations are subtitled as well. Every animation has additional text that
follows and explains the procedure and gives the basic definitions.
6. CONCLUSIONS
Dynamic educational experience in a virtual environment is especially
important because dynamic geometry education achieved much higher insight into
the actual structure and construction. Visually we learn about the changes in the
construction of the structure. New dimension in geometrical education is using of
animation. More complex communication and understanding of spatial relationships
of geometric area is enabled by using virtual systems. This innovative approach leads
to new form of design. The usage of tools for 3D animation in geometrical education
open up new perception of the tangible existence of geometric forms since all is in
motion; nothing is static, as well as the sensational dynamic manipulation of the
geometry.
The original contribution of this paper is in the implementation of multiple
disciplines, and this interdisciplinary hybrid approach. Overlapped several disciplines
such as architecture, descriptive geometry, computer animation and programming are
shown in resulting published DVD named: "Geometric education using the principles
and tools of 3D animation". Since the authors are educated in different disciplines:
architecture, descriptive geometry, digital animation, and constructive system, the
teamwork result is in implementation at the education of students in technical and art
faculties as well as for the further scientific research in the design of dynamically
generated forms.
BALTGRAF 2013 – The 12th International Conference on Engineering Graphics 169/300
7. REFERENCES
1. Stachel H.: What is Descriptive Geometry for? In: DSG-CK Dresden
Symposium Geometrie: Konstruktiv & Kinematisch, Feb 27 - Mar 1, 2003,
Dresden/Germany: TU Dresden, 2003 (ISBN 3-86005-394-9), p. 327-336.
2. Jović B. Geometrical Education in Domain of Visualization and Experimental
Design by Virtual Technologies. PhD Dissertation, University of Belgrade,
Faculty of Architecture, Belgrade, Serbia, 2012. (in Serbian).
3. Kaufmann H. Geometry Education with Augmented Reality. Dissertation.
Technology University of Vienna, Vienna, Austria, 2004. -179 pp.
4. Kortenkamp U. H. Foundation of Dynamic Geometry. PhD Dissertation.
Swiss Federal Institute of Technology, Zurich, Switzerland, 1999. -176 pp.
5. Teofilović N. 1:1 (3D Character Animation and Installation). PhD
Dissertation. University of Art in Belgrade, Interdisciplinary PhD studies,
Group of Digital Art, Belgrade, Serbia, 2010. (in Serbian).
6. Teofilović N. The Art of Movement in Empty Space (Technologies and
Practise of Virtual Characters). Faculty of Architecture, University of
Belgrade, Belgrade, Serbia, 2011. (in Serbian).
7. Čučaković A. Descriptive Geometry. Akademska misao, Belgrade, Serbia,
2010. (in Serbian).
8. Nestorović M. Constructive Systems – Principles of Construction and
Shapenig. Faculty of Architecture, University of Belgrade, Belgrade, Serbia,
2007. (in Serbian).
9. Čučaković A., Jović B. Constructive Geometry Education by Contemporary
Technologies, SAJ_2011_3_ Serbian Architectural Journal, original scientific
article, approval date 12.06.2011. UDK 514.18:62 ID 184977420, p. 164-183.
10. Čučaković A., Nestorović M., Jović B. Contemporary Principles of
Geometrical Modeling in Education. Abstracts – 2nd
Croatian Conference of
Geometry and Graphics Scientific-Professional Colloquium of CSGG,
Šibenik, Croatia, September 5-9, 2010, p. 10-11.
11. Wang X., Schnabel M. A. Mixed Reality in Architecture, Design and
Construction. Australia, Sydney, Springer Science + Business Media B. V.
2009. -288 pp.
12. Čučaković A., Jović B. Optional Course Engineering Graphics on
Department for Landscaping Architecture at the Faculty of Forestry,
University of Belgrade, International Conference SUNGIG moNGeometrija
2010, Jun 24-27, 2010, Belgrade, Serbia.

170/300 The 12th International Conference on Engineering Graphics – BALTGRAF 2013
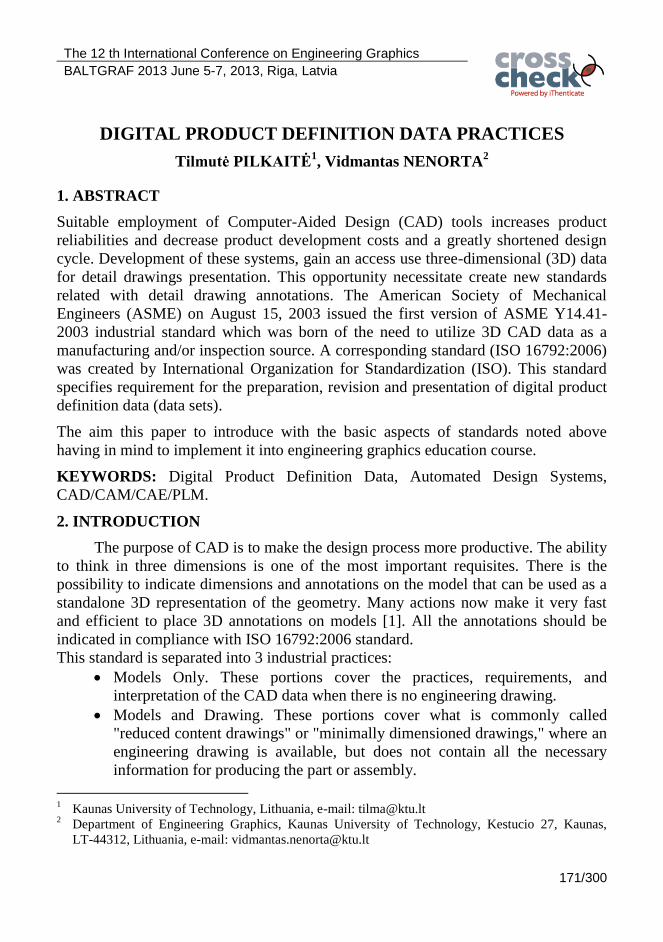
The 12 th International Conference on Engineering Graphics
BALTGRAF 2013 June 5-7, 2013, Riga, Latvia
171/300
DIGITAL PRODUCT DEFINITION DATA PRACTICES
Tilmutė PILKAITĖ1, Vidmantas NENORTA
2
1. ABSTRACT
Suitable employment of Computer-Aided Design (CAD) tools increases product
reliabilities and decrease product development costs and a greatly shortened design
cycle. Development of these systems, gain an access use three-dimensional (3D) data
for detail drawings presentation. This opportunity necessitate create new standards
related with detail drawing annotations. The American Society of Mechanical
Engineers (ASME) on August 15, 2003 issued the first version of ASME Y14.41-
2003 industrial standard which was born of the need to utilize 3D CAD data as a
manufacturing and/or inspection source. A corresponding standard (ISO 16792:2006)
was created by International Organization for Standardization (ISO). This standard
specifies requirement for the preparation, revision and presentation of digital product
definition data (data sets).
The aim this paper to introduce with the basic aspects of standards noted above
having in mind to implement it into engineering graphics education course.
KEYWORDS: Digital Product Definition Data, Automated Design Systems,
CAD/CAM/CAE/PLM.
2. INTRODUCTION
The purpose of CAD is to make the design process more productive. The ability
to think in three dimensions is one of the most important requisites. There is the
possibility to indicate dimensions and annotations on the model that can be used as a
standalone 3D representation of the geometry. Many actions now make it very fast
and efficient to place 3D annotations on models [1]. All the annotations should be
indicated in compliance with ISO 16792:2006 standard.
This standard is separated into 3 industrial practices:
Models Only. These portions cover the practices, requirements, and
interpretation of the CAD data when there is no engineering drawing.
Models and Drawing. These portions cover what is commonly called
"reduced content drawings" or "minimally dimensioned drawings," where an
engineering drawing is available, but does not contain all the necessary
information for producing the part or assembly.
1 Kaunas University of Technology, Lithuania, e-mail: [email protected]
2 Department of Engineering Graphics, Kaunas University of Technology, Kestucio 27, Kaunas,
LT-44312, Lithuania, e-mail: [email protected]

172/300 The 12th International Conference on Engineering Graphics – BALTGRAF 2013
Drawings only. These portions of the standard allow the historical practices
of using engineering drawings to define a product [2].
3. RELATED DATA
Related data shall be integral to, or referenced in, the data set. Related data
consists of, but is not limited to, analytical data, parts lists, test requirements, material
specifications, process and finish requirements in accordance with Figure 1. The
following specifies the structure and control requirements for data management.
Fig. 1. Content of a product definition data set Fig. 2. Content of a model
The model itself includes geometric elements in product definition data
representing the designed product. Annotations include dimensions, tolerances, notes,
text, or symbols visible without any manual or external manipulation. Attributes are
such elements as a dimension, tolerance, note, text, or symbol required to complete
the product definition or feature of the product that is not visible but available upon
interrogation of the model [3-4]. 3.1 Design Model Requirements
Design models represent a product in ideal geometric form at a specified
dimensional condition, for example minimum, maximum or mean. The dimensional
condition shall be specified as a general note. Design models shall be modelled using
a scale of 1:1. The design model precision indicates the numeric accuracy required in
the production of the work piece in order for it to fulfil the design intent. The number
of significant digits of the design model shall be specified in the data set. The number
of decimal places required for the design cannot exceed the precision of the design
model.
The model shall contain geometry, attributes and annotation as required to
provide a complete definition of the part. Work piece and sub-assembly models
shown in the assembly model need only have sufficient detail shown to ensure correct
identification, orientation and placement. The assembly model may be shown in an
exploded, partially assembled or completely assembled state. Location and
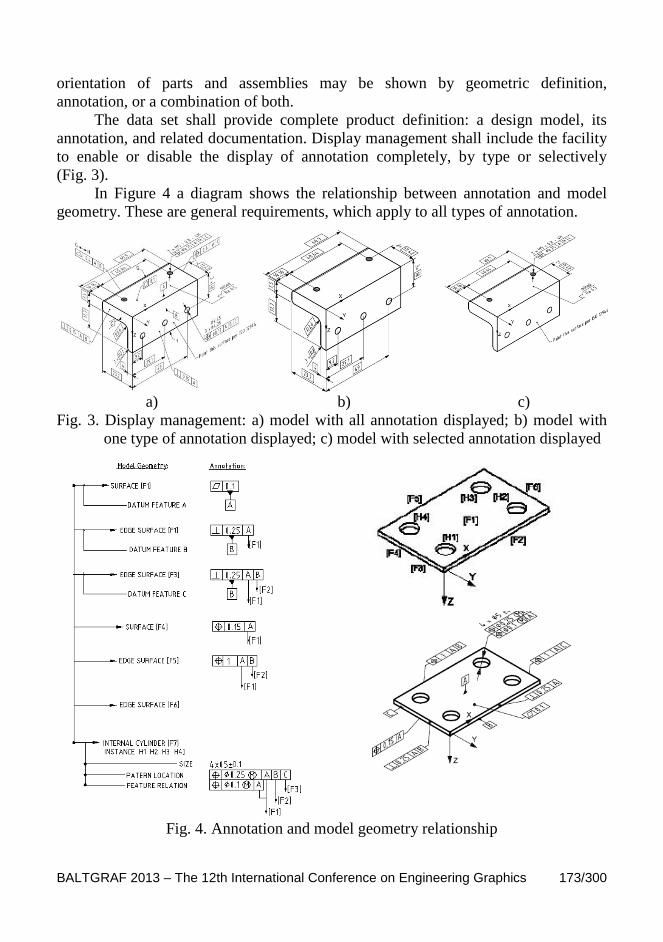
BALTGRAF 2013 – The 12th International Conference on Engineering Graphics 173/300
orientation of parts and assemblies may be shown by geometric definition,
annotation, or a combination of both.
The data set shall provide complete product definition: a design model, its
annotation, and related documentation. Display management shall include the facility
to enable or disable the display of annotation completely, by type or selectively
(Fig. 3).
In Figure 4 a diagram shows the relationship between annotation and model
geometry. These are general requirements, which apply to all types of annotation.
a) b) c)
Fig. 3. Display management: a) model with all annotation displayed; b) model with
one type of annotation displayed; c) model with selected annotation displayed
Fig. 4. Annotation and model geometry relationship

174/300 The 12th International Conference on Engineering Graphics – BALTGRAF 2013
3.2 Common to Annotated Models and Drawings
A complete definition of a product shall contain a model and a drawing that
may contain orthographic views, axonometric views or a combination thereof.
Product definition data created or shown in the model and on the drawing shall not be
in conflict. The drawing shall contain a drawing border and title block information.
The drawing shall reference all models and data relevant to the product. Annotation
displayed on the drawing shall be interpretable without the use of query. When
complete product definition is not contained on the drawing, this shall be noted.
Management data that is not placed on a drawing shall be placed on the model
or in the data set separate from the model or drawing. The management data shall be
contained in the data set: application data; approval; data set identification; design
activity transfer; revision history for the data set. The annotation plane shall be
available for display with the model. Management data placed on a model shall
include: CAD maintained notation; design activity identification; duplicate original
notation; item identification; unit of measurement, and navigation data.
Protection marking shall be placed on a protection-marking annotation plane, or
equivalent, which shall be available for display with the model. Reproductions of
technical data or any portions thereof, subject to asserted restrictions shall also
reproduce the asserted restrictions. When displayed, the protection-marking
annotation plane does not rotate with the model.
All model values and resolved dimensions shall be obtained from the model.
Saved views of a design model may be defined to facilitate presentation of the model
and its annotation. A saved view shall have an identifier, be retrievable on demand,
contain a model coordinate system that denotes the direction of the view relative to
the model and may contain one or more of the annotation plane(s), a selected set of
annotation, or a selected set of geometry.
Fig. 5. Design cutting model plane
A representation of a
cutting plane shall be used to
indicate the location and viewing
direction of a section. The edges
of the cutting plane shall be
continuous or long-dashed dotted
narrow lines. A means of
identifying all cutting planes in a
model shall be available. A
visible-view arrow or arrows
shall be included to show the
direction in which the section is
viewed (Fig. 5).

BALTGRAF 2013 – The 12th International Conference on Engineering Graphics 175/300
3.3 Drawing Requirements
Annotation may be applied to orthographic or axonometric views. For
axonometric views, the orientation of the annotation shall be parallel to, normal to or
coincident with the surface to which it applies. An annotation shall not overlap
another or the geometrical representation of the part. The relationship between a
model and a drawing are illustrated in Figures 6 and 7.
Fig. 6. Annotated model
Fig. 7. Design drawing
When orthographic views are used, the model coordinate system may be used
to indicate view orientation. A model coordinate system shall be included in each
axonometric view to indicate orientation of the view (Fig. 8).
Fig. 8. Axonometric views
Section views may be
created from axonometric views.
A section view may be
orthographic or axonometric. A
representation of a cutting plane
shall be used to indicate the
location and viewing direction of
a section. The edges of the cutting
plane shall be continuous or long-
dashed dotted lines. A visible
viewing arrow or arrows shall be
included to show the direction in
which the section is viewed
(Fig. 8).
In axonometric views, leader lines shall be used to associate each local note to
its related model feature. Theoretically exact dimensions not displayed on a drawing

176/300 The 12th International Conference on Engineering Graphics – BALTGRAF 2013
shall be obtained by querying the model. Displayed dimensions in views are true
dimensions. Dimensions shown in an axonometric view shall be actual values (not
out-of-scale).
Fig. 9. Datum targets and indicators in an
axonometric view
The corresponding model
coordinate system shall be
displayed in each axonometric
view in which a datum system
is cited.
In axonometric views the
datum indicator should be
attached to the surface of the
represented object. A single
extension line of a model
feature outline should not be
used for attachment of datum
indicators in an axonometric
view (Fig. 9).
5. CONCLUSION
Digital product definition (model based definition) allows a part completely
define as a 3D model. It compresses product development cycle reduces design
engineer’s time is spent creating 2D drawings much as 50% and becomes concurrent
in digital prototyping (3D modelling). Having mind CAD tools development
tendency, all the students of technical science should be introduced with standard ISO
16792:2006 because it specifies requirement for the preparation, revision and
presentation of digital product definition data
6. REFERENCES
1. Model Based Definition (MBD) with Wildfire 4.0.
http://www.imakenews.com/channel_3htechnology/e_article001136686.cfm?
x=b11,0,w.
2. ASME Y14.41-2003. http://en.wikipedia.org/wiki/ASME_Y14.41-2003.
3. http://www.google.lt/search?sourceid=navclient&aq=&oq=&ie=UTF-
8&rlz=1T4ADRA_enLT356LT358&q=digital+product+definition+data+prac
tices&gs_l=hp..0.41l208.0.0.0.1576...........0.
4. British Standard. BS ISO 16792:2006. Technical Product Documentation –
Digital Product Definition Data Practices.
http://learn.lboro.ac.uk/ludata/cd/cad/iso16792.pdf.
The 12 th International Conference on Engineering Graphics
BALTGRAF 2013 June 5-7, 2013, Riga, Latvia
177/300
INTERACTIVE 3D MECHANICAL DESIGN SOFTWARE
Nomeda PUODZIUNIENE1, Vidmantas NENORTA
2
1. ABSTRACT
Today the effective employment of Computer-aided technologies is the main reason
of successfully product development in the world market. Suitable employment of
CAD tools increases product reliabilities and decrease product development costs and
a greatly shortens design cycle. The comprehensive, interactive and flexible 3D CAD
software for 3D mechanical design aims help companies stay more competitive. 3D
CAD software help engineers in many operations like: part design, part positioning,
automated mechanism design, functional tolerances and annotations, assembly
drawing generation, kinematics simulation and photorealistic image creation. The
digital prototyping enabling to produce an accurate 3D model that can engineers help
to design, visualize, and simulate products before they are built, so companies design
better products, reduce development costs, and get product to market faster.
The aim of this paper is to overview some news aspects of automated design systems
for mechanical design.
KEYWORDS: Automated Design Systems, CAD/CAM/CAE/PLM, Digital Product
Development (DPD), Interactive 3D CAD Systems
2. INTRODUCTION
The aim of CAD is to apply computers to both: the 3D modelling and
communication of designs. This includes automating such tasks as the production of
drawings or diagrams and the generation of lists of parts in a design and etc. CAD
design now involves the creation of 3D model data which can be applied in all parts
design stages: design, analysis and simulation, manufacturing and presentation. CAD
allows engineers to create detailed and measured designs of parts with minimal time
and cost. Engineering industries, especially mechanical engineering use CAD widely
to design and develop new and competitive products, and also used to design the
overall layout of a manufacturing unit.
1 Department of Engineering Graphics, Kaunas University of Technology, Kestucio 27, Kaunas,
LT-44312, Lithuania, e-mail: [email protected] 2 Department of Engineering Graphics, Kaunas University of Technology, Kestucio 27, Kaunas,
LT-44312, Lithuania, e-mail: [email protected]
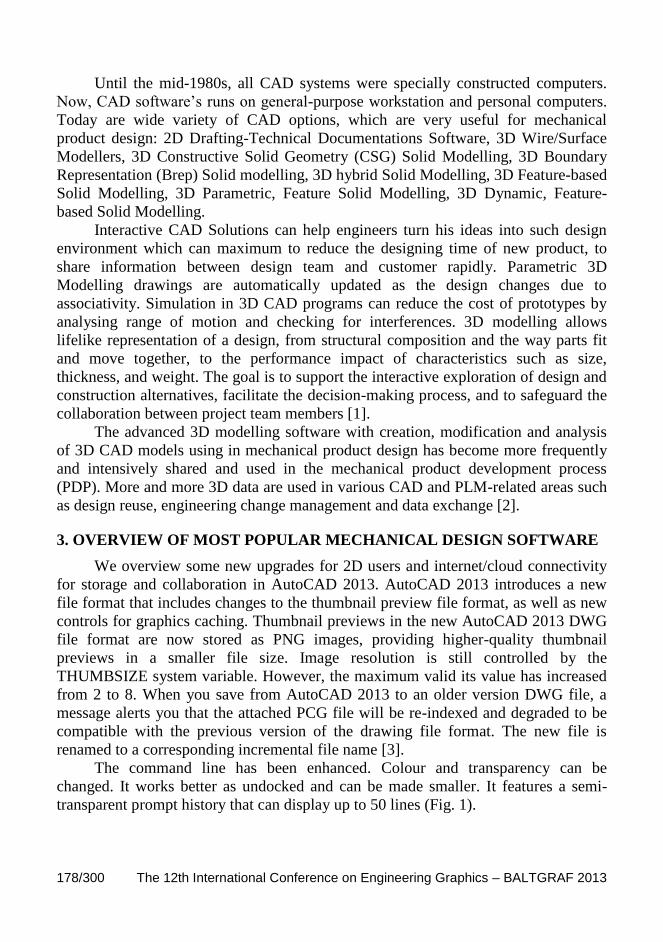
178/300 The 12th International Conference on Engineering Graphics – BALTGRAF 2013
Until the mid-1980s, all CAD systems were specially constructed computers.
Now, CAD software’s runs on general-purpose workstation and personal computers.
Today are wide variety of CAD options, which are very useful for mechanical
product design: 2D Drafting-Technical Documentations Software, 3D Wire/Surface
Modellers, 3D Constructive Solid Geometry (CSG) Solid Modelling, 3D Boundary
Representation (Brep) Solid modelling, 3D hybrid Solid Modelling, 3D Feature-based
Solid Modelling, 3D Parametric, Feature Solid Modelling, 3D Dynamic, Feature-
based Solid Modelling.
Interactive CAD Solutions can help engineers turn his ideas into such design
environment which can maximum to reduce the designing time of new product, to
share information between design team and customer rapidly. Parametric 3D
Modelling drawings are automatically updated as the design changes due to
associativity. Simulation in 3D CAD programs can reduce the cost of prototypes by
analysing range of motion and checking for interferences. 3D modelling allows
lifelike representation of a design, from structural composition and the way parts fit
and move together, to the performance impact of characteristics such as size,
thickness, and weight. The goal is to support the interactive exploration of design and
construction alternatives, facilitate the decision-making process, and to safeguard the
collaboration between project team members [1].
The advanced 3D modelling software with creation, modification and analysis
of 3D CAD models using in mechanical product design has become more frequently
and intensively shared and used in the mechanical product development process
(PDP). More and more 3D data are used in various CAD and PLM-related areas such
as design reuse, engineering change management and data exchange [2].
3. OVERVIEW OF MOST POPULAR MECHANICAL DESIGN SOFTWARE
We overview some new upgrades for 2D users and internet/cloud connectivity
for storage and collaboration in AutoCAD 2013. AutoCAD 2013 introduces a new
file format that includes changes to the thumbnail preview file format, as well as new
controls for graphics caching. Thumbnail previews in the new AutoCAD 2013 DWG
file format are now stored as PNG images, providing higher-quality thumbnail
previews in a smaller file size. Image resolution is still controlled by the
THUMBSIZE system variable. However, the maximum valid its value has increased
from 2 to 8. When you save from AutoCAD 2013 to an older version DWG file, a
message alerts you that the attached PCG file will be re-indexed and degraded to be
compatible with the previous version of the drawing file format. The new file is
renamed to a corresponding incremental file name [3].
The command line has been enhanced. Colour and transparency can be
changed. It works better as undocked and can be made smaller. It features a semi-
transparent prompt history that can display up to 50 lines (Fig. 1).
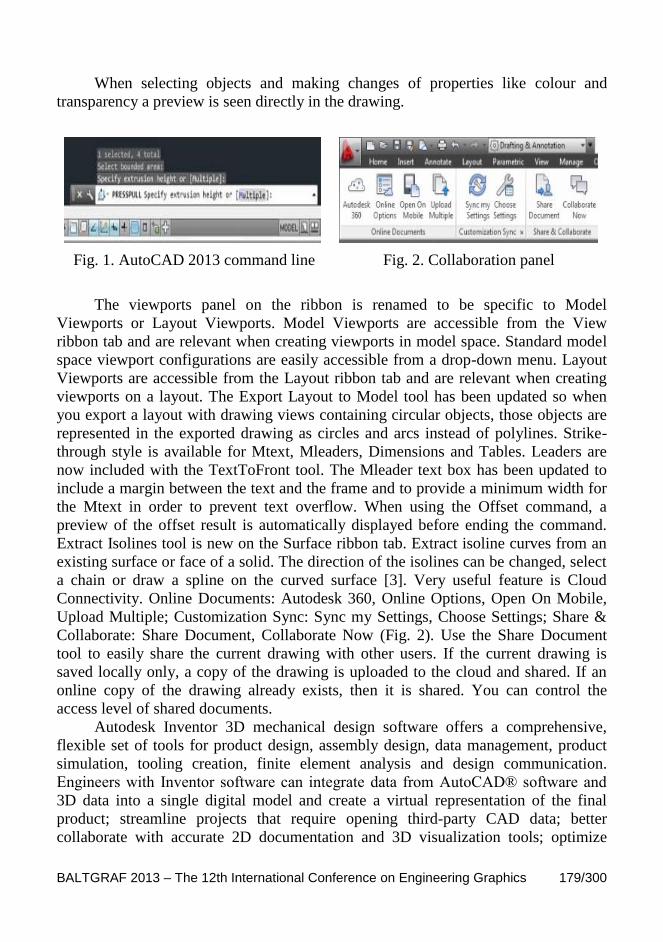
BALTGRAF 2013 – The 12th International Conference on Engineering Graphics 179/300
When selecting objects and making changes of properties like colour and
transparency a preview is seen directly in the drawing.
Fig. 1. AutoCAD 2013 command line Fig. 2. Collaboration panel
The viewports panel on the ribbon is renamed to be specific to Model
Viewports or Layout Viewports. Model Viewports are accessible from the View
ribbon tab and are relevant when creating viewports in model space. Standard model
space viewport configurations are easily accessible from a drop-down menu. Layout
Viewports are accessible from the Layout ribbon tab and are relevant when creating
viewports on a layout. The Export Layout to Model tool has been updated so when
you export a layout with drawing views containing circular objects, those objects are
represented in the exported drawing as circles and arcs instead of polylines. Strike-
through style is available for Mtext, Mleaders, Dimensions and Tables. Leaders are
now included with the TextToFront tool. The Mleader text box has been updated to
include a margin between the text and the frame and to provide a minimum width for
the Mtext in order to prevent text overflow. When using the Offset command, a
preview of the offset result is automatically displayed before ending the command.
Extract Isolines tool is new on the Surface ribbon tab. Extract isoline curves from an
existing surface or face of a solid. The direction of the isolines can be changed, select
a chain or draw a spline on the curved surface [3]. Very useful feature is Cloud
Connectivity. Online Documents: Autodesk 360, Online Options, Open On Mobile,
Upload Multiple; Customization Sync: Sync my Settings, Choose Settings; Share &
Collaborate: Share Document, Collaborate Now (Fig. 2). Use the Share Document
tool to easily share the current drawing with other users. If the current drawing is
saved locally only, a copy of the drawing is uploaded to the cloud and shared. If an
online copy of the drawing already exists, then it is shared. You can control the
access level of shared documents.
Autodesk Inventor 3D mechanical design software offers a comprehensive,
flexible set of tools for product design, assembly design, data management, product
simulation, tooling creation, finite element analysis and design communication.
Engineers with Inventor software can integrate data from AutoCAD® software and
3D data into a single digital model and create a virtual representation of the final
product; streamline projects that require opening third-party CAD data; better
collaborate with accurate 2D documentation and 3D visualization tools; optimize

180/300 The 12th International Conference on Engineering Graphics – BALTGRAF 2013
material selection based on environmental impact, cost. There are a few interesting
new tools in Inventor 2013. New Inventor has a great new learning environment. This
environment leads users through tutorials with step by step video, supporting text. In-
command marking menus are aligned to have consistent placement of the OK, Done,
Cancel, and Apply options. In-command marking menus display when user right-
click while a command is active (Fig. 3). The overflow menu displays below the
marking menu. Shorter versions of the overflow menu are defined for Inventor to
streamline the interface.
When user click Extrude or Revolve before you create a sketch, an error
message displays, and user can start a new 2D sketch. When user starts the Create 2D
Sketch command, the origin planes display. User picks the edge or face of a plane to
begin a new 2D sketch (Fig. 4). The first dimension in the first part sketch determines
the scale of the sketch. When you edit a part in the context of an assembly, you can
project sketch geometry from another part into the active part. This geometry is now
associative by default. The sketch and the part are set as adaptive to keep the
geometry associative. On the Assembly tab, an Application Option controls whether
projected sketch geometry is associative. The option is called Enable associative
sketch geometry projection during in-place modelling. With the latest 2013 version of
Inventor 3D CAD software, we can integrate 2D AutoCAD drawings and 3D data
into a single digital model, creating a virtual representation of the final product that
enables to validate the form, fit, and function of the product before it is built. Parts
colours and textures can be adjusted using an ‘in canvas’ mini toolbar to make the
manipulation of colour and scale texture mapping an intuitive experience. Inventor
2013 has a completely new materials and appearances structure. The main library is
now split into three components (Fig. 5):
• Autodesk Inventor Material Library – The familiar Inventor materials
• Autodesk Material Library – Materials (physical properties) that can be
shared across all Autodesk products
• Autodesk Appearance Library – Appearances (colours and textures) that can
be shared across all Autodesk products Materials and Appearances.
Fig. 3. Fragment of menu in Inventor 2013 Fig. 4. Fragment of drawing Inventor 2013

BALTGRAF 2013 – The 12th International Conference on Engineering Graphics 181/300
Fig. 5. Material browser in Inventor 2013
Inventor Fusion Technology Preview 2013 is fully interoperable with
AutoCAD and Autodesk Inventor software, enabling customers to choose the
modelling approach that is right for the task at hand. Autodesk Fusion 360, the
world's first complete 3D CAD solution offered in the cloud. Unleash your creativity
like never before. Designers and engineers now have the freedom to take their work
anywhere with powerful, collaborative, and accessible design and collaboration tools
– powered by the cloud [4-5].
In SolidWorks 2013 the new View Manipulator gives a quick access to all the
usual views. New sketch functionality enables users to create conic curves driven by
endpoints and rho value, permitting elliptical, parabolic, or hyperbolic curves without
the need to use splines or equations. New modelling tool enables users to add and
remove geometry in one operation. Users can intersect solids, surfaces, and planes, as
well as merge solids and cap surfaces, to define closed volumes and create multiple
geometries simultaneously. The enhanced Section View tool makes creating section
views in drawings faster, with simple drag-and-drop placement. New options in
Linear and Circular Pattern features enable you to vary feature dimensions and
instance locations incrementally for the entire pattern or individually for each
instance. Easily create sub-model studies of your designs to get more accurate results
for specific areas, while automatically utilizing loads and boundary conditions
applied to the full model. Built by rendering wizards, Luxology (luxology.com),
PhotoView 360 has now completely replaced the historical visualization tools that
had been in SolidWorks for a decade or more. Running in the modelling window as
well as a separate one for user flexibility, the system changes how rendering was
traditionally done in SolidWorks. With greater use of HDR images to provide
accurate lighting combined with existing camera and lighting tools, as well as drag
and drop materials, it’s seen a massive adoption by users. This release sees two key
new capabilities added. The first is that SolidWorks users can access the custom
materials from Luxology’s massive library of materials. The second is that support
for network rendering has been added [5].
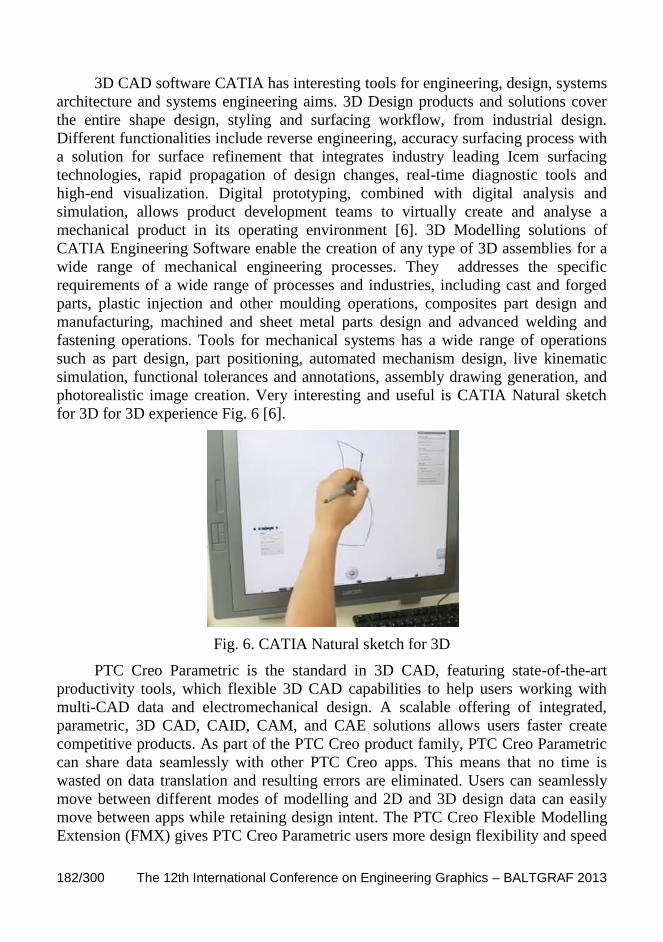
182/300 The 12th International Conference on Engineering Graphics – BALTGRAF 2013
3D CAD software CATIA has interesting tools for engineering, design, systems
architecture and systems engineering aims. 3D Design products and solutions cover
the entire shape design, styling and surfacing workflow, from industrial design.
Different functionalities include reverse engineering, accuracy surfacing process with
a solution for surface refinement that integrates industry leading Icem surfacing
technologies, rapid propagation of design changes, real-time diagnostic tools and
high-end visualization. Digital prototyping, combined with digital analysis and
simulation, allows product development teams to virtually create and analyse a
mechanical product in its operating environment [6]. 3D Modelling solutions of
CATIA Engineering Software enable the creation of any type of 3D assemblies for a
wide range of mechanical engineering processes. They addresses the specific
requirements of a wide range of processes and industries, including cast and forged
parts, plastic injection and other moulding operations, composites part design and
manufacturing, machined and sheet metal parts design and advanced welding and
fastening operations. Tools for mechanical systems has a wide range of operations
such as part design, part positioning, automated mechanism design, live kinematic
simulation, functional tolerances and annotations, assembly drawing generation, and
photorealistic image creation. Very interesting and useful is CATIA Natural sketch
for 3D for 3D experience Fig. 6 [6].
Fig. 6. CATIA Natural sketch for 3D
PTC Creo Parametric is the standard in 3D CAD, featuring state-of-the-art
productivity tools, which flexible 3D CAD capabilities to help users working with
multi-CAD data and electromechanical design. A scalable offering of integrated,
parametric, 3D CAD, CAID, CAM, and CAE solutions allows users faster create
competitive products. As part of the PTC Creo product family, PTC Creo Parametric
can share data seamlessly with other PTC Creo apps. This means that no time is
wasted on data translation and resulting errors are eliminated. Users can seamlessly
move between different modes of modelling and 2D and 3D design data can easily
move between apps while retaining design intent. The PTC Creo Flexible Modelling
Extension (FMX) gives PTC Creo Parametric users more design flexibility and speed

BALTGRAF 2013 – The 12th International Conference on Engineering Graphics 183/300
to overcome these challenges. Users no longer need to rebuild a model that can’t be
updated without breaking the original constraints. With PTC Creo FMX users can
easily select and edit a range of geometry and features including rounds and patterns.
PTC Creo FMX saves time and reduces errors and frustration. PTC Creo Advanced
Assembly enhances the productivity of distributed teams with capabilities for design
criteria management, top-down assembly design, and assembly process planning [7].
4. CONCLUSIONS
There are many CAD systems today in the world, however more than half of
the market is covered by the four main corporations involved in PLM concept:
Autodesk, Dassault Systèmes, Parametric technology corp. (PTC), Unigraphics corp.
(UGS).
Using CAD systems designers can solve basically all technical tasks related
with mechanical design process.
Popularity of the CAD system in the region depends on dealers’ activity. 3D design
possibilities for the all most popular CAD systems practically are similar.
CAD systems as an especially important contemporary technology should be
applied in all the stages of technical engineering education process.
5. REFERENCES
1. A. Bargelis, R. Monkute, D. Cikotiene. Integrated Knowledge-Based Model
of Imnovative Product and Process Development. Estonian Journal of
Engineering, ISSN 1936-6038, 2009, 15, p. 113-23.
2. A. Biere-Cote, L. Rivest, R. Maranzana. Comparing 3D CAD Models: Uses,
Methods, Tools and Perspectives. Computer-Aided Design and Applications,
2012, 9, (6), p. 771-794.
3. L. Khemlani. Autodesk’s 2013 Product Portfolio Launch. AECbytes.
Analysis, Researches, and Review of AEC Technology. Newsletter #56 (April
11, 2012). http://www.aecbytes.com/newsletter/2012/issue_56.html. [access
Dec 10, 2012].
4. Autotodesk. http://www.autodesk.com. [access Jan 10, 2013].
5. SolidWorks. http://www.solidworks.com. [access Jan 10, 2013].
6. Dassault Systemes. http://www.3ds.com. [access Jan 10, 2013].
7. PTC. http://www.ptc.com. [access Jan 10, 2013].

184/300 The 12th International Conference on Engineering Graphics – BALTGRAF 2013

The 12 th International Conference on Engineering Graphics
BALTGRAF 2013 June 5-7, 2013, Riga, Latvia
185/300
MODELLING OF SHORTEST ROUTE IN THE DRAWING
Algirdas SOKAS1
1. ABSTRACT
This article analyses problems of determining the shortest way among given towns.
The model of the problem presented as non-directional graph, where nodes are towns
and crossings outside towns, and edges are roads among towns and crossings. Each
node has some information attached to it: name and size of the town, and mark of the
crossing. All towns connected by roads. These roads are shown as graph edges. Each
edge also has information sketched in: length of road, type of road, allowable speed
on the road and other useful information. Retrieval of the shortest route executed in
two stages: modelling graph in the drawing and finding shortest way between two
towns. Procedures to both exercises’ solutions presented. Floyd-Warshall algorithm
selected for finding shortest way from one graph node to another selected node.
Graphical system for selected towns on Lithuanian roads graph finds the shortest
route. A solution presented in graphical form and a list of route’s towns written with
length of the route. The program is written in Visual Basic for Application language
working in the graphical system AutoCAD environment. It consists of main
program’s dialog window and two class modules: Graph and Route, which have some
properties and methods. The program controls database with two tables: Points and
Roads. Obtained results are discussed and conclusions are made.
KEYWORDS: Graph Model, Object-Oriented Programming, Shortest Route
2. INTRODUCTION
Literature analysis shows that different transport problems are solved by using
graph theory. Floyd-Warshall algorithm is often mentioned for finding shortest path.
For example, make use of a different shortest path computation from classical
approaches in computer science graph theory to propose a new variant of the
pathfinder algorithm [1]. Second example; compute the shortest time paths between
all pairs of variables, using the Floyd-Warshall algorithm [2]. Third example, present
a fully connected graph representing the unrealistic case of a product line model in
which every model element is connected to all other model elements [3]. Fourth
example, inverse Monge matrix problem can be solved using the Floyd-Warshall
algorithm [4].
1 Dep. of Engineering Graphics, Vilnius Gediminas Technical University, Sauletekio al. 11, Vilnius,
LT-10223, Lithuania, e-mail: [email protected]
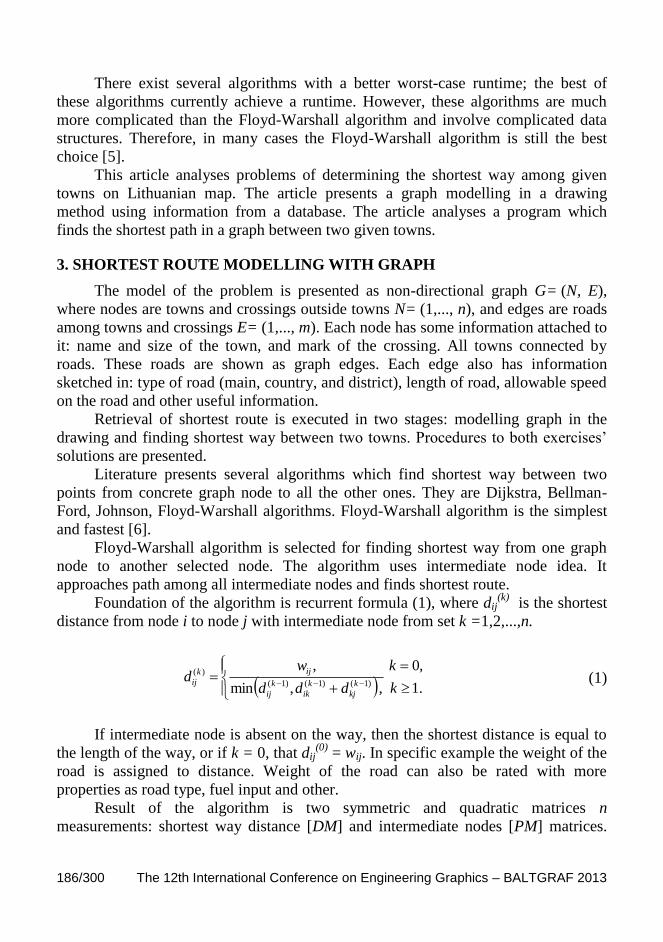
186/300 The 12th International Conference on Engineering Graphics – BALTGRAF 2013
There exist several algorithms with a better worst-case runtime; the best of
these algorithms currently achieve a runtime. However, these algorithms are much
more complicated than the Floyd-Warshall algorithm and involve complicated data
structures. Therefore, in many cases the Floyd-Warshall algorithm is still the best
choice [5].
This article analyses problems of determining the shortest way among given
towns on Lithuanian map. The article presents a graph modelling in a drawing
method using information from a database. The article analyses a program which
finds the shortest path in a graph between two given towns.
3. SHORTEST ROUTE MODELLING WITH GRAPH
The model of the problem is presented as non-directional graph G= (N, E),
where nodes are towns and crossings outside towns N= (1,..., n), and edges are roads
among towns and crossings E= (1,..., m). Each node has some information attached to
it: name and size of the town, and mark of the crossing. All towns connected by
roads. These roads are shown as graph edges. Each edge also has information
sketched in: type of road (main, country, and district), length of road, allowable speed
on the road and other useful information.
Retrieval of shortest route is executed in two stages: modelling graph in the
drawing and finding shortest way between two towns. Procedures to both exercises’
solutions are presented.
Literature presents several algorithms which find shortest way between two
points from concrete graph node to all the other ones. They are Dijkstra, Bellman-
Ford, Johnson, Floyd-Warshall algorithms. Floyd-Warshall algorithm is the simplest
and fastest [6].
Floyd-Warshall algorithm is selected for finding shortest way from one graph
node to another selected node. The algorithm uses intermediate node idea. It
approaches path among all intermediate nodes and finds shortest route.
Foundation of the algorithm is recurrent formula (1), where dij(k)
is the shortest
distance from node i to node j with intermediate node from set k =1,2,...,n.
.1
,0
, ,min
,)1()1()1(
)(
k
k
ddd
wd
k
kj
k
ik
k
ij
ijk
ij (1)
If intermediate node is absent on the way, then the shortest distance is equal to
the length of the way, or if k = 0, that dij(0)
= wij. In specific example the weight of the
road is assigned to distance. Weight of the road can also be rated with more
properties as road type, fuel input and other.
Result of the algorithm is two symmetric and quadratic matrices n
measurements: shortest way distance [DM] and intermediate nodes [PM] matrices.

BALTGRAF 2013 – The 12th International Conference on Engineering Graphics 187/300
Matrix [DM] is used for finding shortest route. Matrix [PM] is filled in this way: if
node k is on the way between i and j, then its index equals pij or we can write pij=k.
The algorithm is realized by class Route with method Floyd-Warshall.
Graphical system AutoCAD is a program used as operating environment, and
Visual Basic for Application (VBA) is a language used for programming. Drawing is
a very good environment for programming because each point has coordinates and
each line segment has start and end coordinates. The end coordinate of each polygon
line is the beginning coordinate of another line. This program determines the graph of
the Lithuania towns and roads drawing (Fig. 1).
Fig. 1. Graph in the AutoCAD drawing
The program controls database with two tables: Points and Roads (Fig. 2). The
database table Points have fields town names and its coordinates x, y. This table was
created in such a way by measuring horizontal and vertical distances of cities on the
map from the left and bottom edges in millimetres respectively. The database table
Roads haves fields from, to, length, type and speed limit of road.
Using these database tables it programmatically forms cities and crossings
nodes which coordinates are known. Cities and intersections have different ID codes.
Based on the cities’ codes the edges are drawn symbolizing the routes with a length
corresponding to the real length. This creates a graph in the drawing of the routes and
cities. Most importantly, this graph-making system is easily transformed to include
new cities and specifying new routes in the database.

188/300 The 12th International Conference on Engineering Graphics – BALTGRAF 2013
4. OBJECT-ORIENTED PROGRAMMING
Object-oriented programming as Visual Basic for Application (VBA) greatly
facilitates a programmer’s work because task divided into two parts, into two class
objects.
The first class Graph has three methods and two properties. Method Connect
Points designs class object, which has following properties: town name, its
coordinates and other field names as in the database table Points. The second method
Connect Roads designs class object, which has following properties: start point ID,
end point ID, road length and other field names as in the database table Roads.
The third method Drawing shows towns, crossings and roads in the graph
model. Presented one of the cycle which draw graph edges (roads) in the drawing:
Do Until rr_roads.EOF
i = rr_roads(0)
j = rr_roads(1)
t1(0) = mc(i, 3): t1(1) = mc(i, 4): t1(2) = 0
t2(0) = mc(j, 3): t2(1) = mc(j, 4): t2(2) = 0
Set obj = ThisDrawing.ModelSpace.AddLine(t1, t2)
obj.Layer = "grafas"
obj.Update
rr_roads.MoveNext
Loop
There mc is graph nodes (towns and crossings) coordinates matrix formed from
database table Points.
The second class Route has three methods: Extract Route, Floyd-Warshall,
Prepare Matrices.
The second class Route executes matrix operations and presents graphical
result. Method Prepare Matrices prepares array length matrix [DM], which keeps
graph’s shortest distances among nodes, and path matrix [PM], which keeps the
found shortest way intermediate node numbers.
Method Floyd-Warshall realizes following algorithm:
Public Sub Floyd_Warshall()
Dim i, j, k As Integer
For k = 1 To n
For i = 1 To n
For j = 1 To n
If (DM(i, k) + DM(k, j) < DM(i, j)) Then
DM(i, j) = DM(i, k) + DM(k, j)
PM(i, j) = k

BALTGRAF 2013 – The 12th International Conference on Engineering Graphics 189/300
End If
Next j
Next i
Next k
End Sub
A method Extract Route finds the shortest way between presented towns. In the
cycle from graph first node until end node use method Extract Route which realizes
following procedure:
Public Sub ExtractRoute(sp As Integer, ep As Integer)
rl = DM(sp, ep)
rs = 1
RP(0) = sp
RP(1) = ep
FindPath sp, ep
End Sub
There sp – start point index, ep – end point index, rl – route length, rs – route
size, DM – distance matrix, RP – route points vector, procedure Find Path finds
shortest distance among start and end nodes:
Private Sub FindPath(sp As Integer, ep As Integer)
If PM(sp, ep) = 0 Then
InsertRoutePart sp, ep
Else
FindPath sp, PM(sp, ep)
FindPath PM(sp, ep), ep
End If
End Sub
The procedure Insert Route Part realizes following code:
Private Sub InsertRoutePart(lp As Integer, rp As _ Integer)
For i = 0 To rs - 1
If RP(i) = lp Then
If RP(i + 1) <> rp Then
rs = rs + 1
For j = rs To i + 2 Step -1
RP(j) = RP(j - 1)
Next j
RP(i + 1) = rp

190/300 The 12th International Conference on Engineering Graphics – BALTGRAF 2013
End If
Exit Sub
ElseIf RP(i + 1) = rp Then
rs = rs + 1
For j = rs To i + 2 Step -1
RP(j) = RP(j - 1)
Next j
RP(i + 1) = lp
Exit Sub
End If
Next i
End Sub
There lp – left point index, rp – right point index, rl – route length, rs – route
size, RP – route points vector, i and j circle indices.
Modern programming database control technology is ActiveX Data Objects
(ADO), created in 1996 [7]. An example of procedure with variable cc_points can
read a concrete record rr_points from the database Keliai.mdb table Points (Fig. 2).
Fig. 2. Database tables Points and Roads
Using the same technique from a file named Keliai.mdb table Roads is called
and controlled by variable rr_roads.
This technology is used by the class Graph and is implemented by methods
Connect Point and Connect Roads.
Database presents the main Lithuanian cities and roads. It can be expanded by
adding new entries and the system easily creates another graph with a different
number of nodes and edges. It only needs the changed settings to be specified.
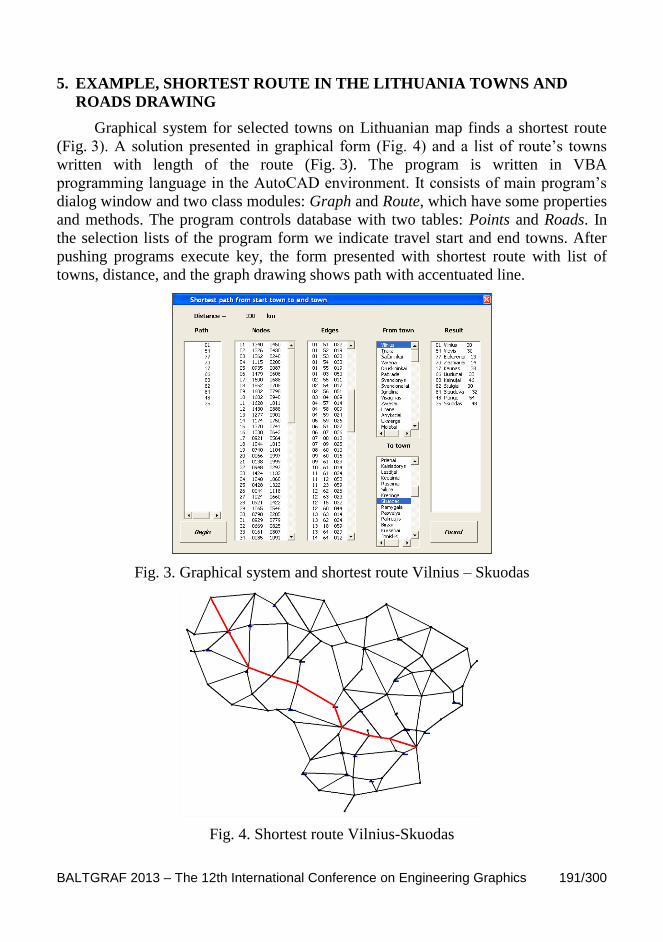
BALTGRAF 2013 – The 12th International Conference on Engineering Graphics 191/300
5. EXAMPLE, SHORTEST ROUTE IN THE LITHUANIA TOWNS AND
ROADS DRAWING
Graphical system for selected towns on Lithuanian map finds a shortest route
(Fig. 3). A solution presented in graphical form (Fig. 4) and a list of route’s towns
written with length of the route (Fig. 3). The program is written in VBA
programming language in the AutoCAD environment. It consists of main program’s
dialog window and two class modules: Graph and Route, which have some properties
and methods. The program controls database with two tables: Points and Roads. In
the selection lists of the program form we indicate travel start and end towns. After
pushing programs execute key, the form presented with shortest route with list of
towns, distance, and the graph drawing shows path with accentuated line.
Fig. 3. Graphical system and shortest route Vilnius – Skuodas
Fig. 4. Shortest route Vilnius-Skuodas
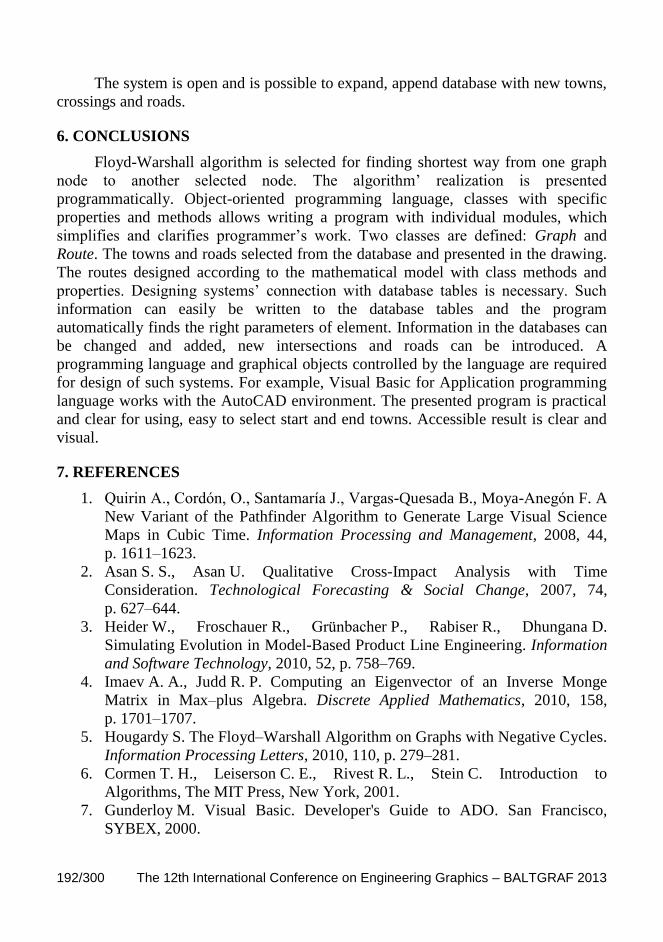
192/300 The 12th International Conference on Engineering Graphics – BALTGRAF 2013
The system is open and is possible to expand, append database with new towns,
crossings and roads.
6. CONCLUSIONS
Floyd-Warshall algorithm is selected for finding shortest way from one graph
node to another selected node. The algorithm’ realization is presented
programmatically. Object-oriented programming language, classes with specific
properties and methods allows writing a program with individual modules, which
simplifies and clarifies programmer’s work. Two classes are defined: Graph and
Route. The towns and roads selected from the database and presented in the drawing.
The routes designed according to the mathematical model with class methods and
properties. Designing systems’ connection with database tables is necessary. Such
information can easily be written to the database tables and the program
automatically finds the right parameters of element. Information in the databases can
be changed and added, new intersections and roads can be introduced. A
programming language and graphical objects controlled by the language are required
for design of such systems. For example, Visual Basic for Application programming
language works with the AutoCAD environment. The presented program is practical
and clear for using, easy to select start and end towns. Accessible result is clear and
visual.
7. REFERENCES
1. Quirin A., Cordón, O., Santamaría J., Vargas-Quesada B., Moya-Anegón F. A
New Variant of the Pathfinder Algorithm to Generate Large Visual Science
Maps in Cubic Time. Information Processing and Management, 2008, 44,
p. 1611–1623.
2. Asan S. S., Asan U. Qualitative Cross-Impact Analysis with Time
Consideration. Technological Forecasting & Social Change, 2007, 74,
p. 627–644.
3. Heider W., Froschauer R., Grünbacher P., Rabiser R., Dhungana D.
Simulating Evolution in Model-Based Product Line Engineering. Information
and Software Technology, 2010, 52, p. 758–769.
4. Imaev A. A., Judd R. P. Computing an Eigenvector of an Inverse Monge
Matrix in Max–plus Algebra. Discrete Applied Mathematics, 2010, 158,
p. 1701–1707.
5. Hougardy S. The Floyd–Warshall Algorithm on Graphs with Negative Cycles.
Information Processing Letters, 2010, 110, p. 279–281.
6. Cormen T. H., Leiserson C. E., Rivest R. L., Stein C. Introduction to
Algorithms, The MIT Press, New York, 2001.
7. Gunderloy M. Visual Basic. Developer's Guide to ADO. San Francisco,
SYBEX, 2000.
The 12 th International Conference on Engineering Graphics
BALTGRAF 2013 June 5-7, 2013, Riga, Latvia
193/300
PROGRAMMATICAL DETECTION METHOD OF FLAT
GRAPHICAL OBJECTS FORMED FROM LINES
Algirdas SOKAS1
1. ABSTRACT
This article analyses plate graphical objects in the drawing. Information on the
graphical objects is collected in a matrix. The goal of the program is to determine the
number of an object on the matrix line. A function is used which finds the smallest
value in a matrix column. Another matrix is formed with lines that are not assigned to
polygons. The program loops until there are no more undefined polygon lines.
Program and example of the drawing with objects is presented. Programming
methods for detection of plate graphical objects are discussed and conclusions are
made.
KEYWORDS: Detection of Graphical Objects, Visual Basic for Application
Programming Language
2. INTRODUCTION
Recognition of automated objects is very significant part of computer science.
Artificial intelligence is a new developing science. Machines recognize products and
decide what to do next. Welding crawler finds a car mark and knows where precisely
to weld. Parts supply robot is familiar with the factory environment and finds the path
to the specific machine. Factory floor environment may change over time and
inaccessible areas may be marked by prominent polygons. Polygons are formed by
drawing lines. Detection of graphical objects is the main subject of this article. All
polygon lines in the drawing are collected into a matrix and are numbered to define
their relationship to the specific polygon.
AutoCAD is a program used as operating environment, and Visual Basic for
Application (VBA) is a language used for programming [1]. Drawing is a very good
environment for programming because each point has coordinates and each line
segment has start and end coordinates. The end coordinate of each polygon line is the
beginning coordinate of another line. This program determines the polygons of the
drawing. The author has published methodological works on VBA language
programming using AutoCAD environment in Lithuanian language [2].
1 Dep. of Engineering Graphics, Vilnius Gediminas Technical University, Sauletekio al. 11, Vilnius,
LT-10223, Lithuania, e-mail: [email protected]
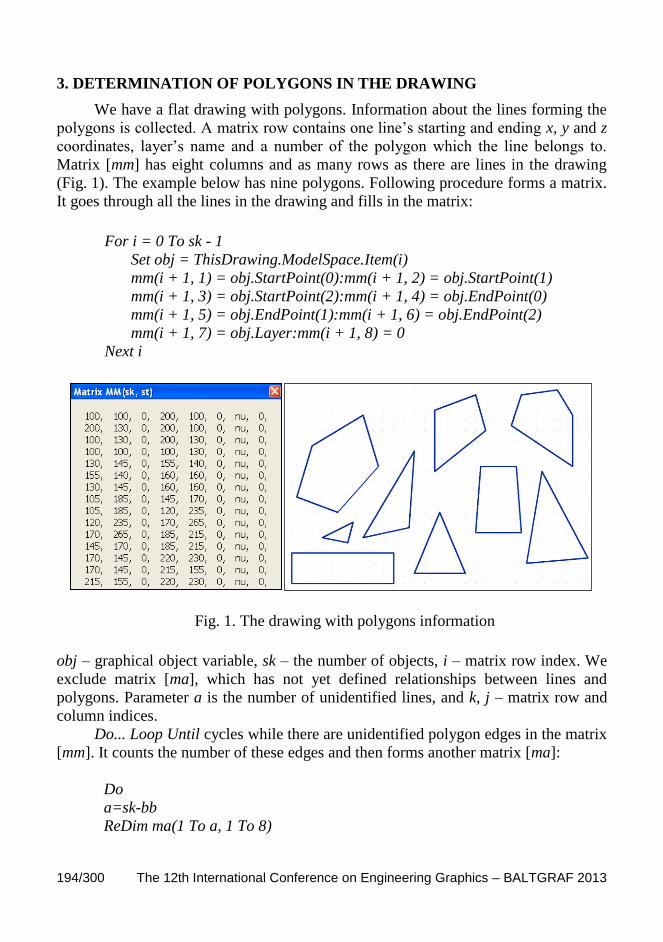
194/300 The 12th International Conference on Engineering Graphics – BALTGRAF 2013
3. DETERMINATION OF POLYGONS IN THE DRAWING
We have a flat drawing with polygons. Information about the lines forming the
polygons is collected. A matrix row contains one line’s starting and ending x, y and z
coordinates, layer’s name and a number of the polygon which the line belongs to.
Matrix [mm] has eight columns and as many rows as there are lines in the drawing
(Fig. 1). The example below has nine polygons. Following procedure forms a matrix.
It goes through all the lines in the drawing and fills in the matrix:
For i = 0 To sk - 1
Set obj = ThisDrawing.ModelSpace.Item(i)
mm(i + 1, 1) = obj.StartPoint(0):mm(i + 1, 2) = obj.StartPoint(1)
mm(i + 1, 3) = obj.StartPoint(2):mm(i + 1, 4) = obj.EndPoint(0)
mm(i + 1, 5) = obj.EndPoint(1):mm(i + 1, 6) = obj.EndPoint(2)
mm(i + 1, 7) = obj.Layer:mm(i + 1, 8) = 0
Next i
Fig. 1. The drawing with polygons information
obj – graphical object variable, sk – the number of objects, i – matrix row index. We
exclude matrix [ma], which has not yet defined relationships between lines and
polygons. Parameter a is the number of unidentified lines, and k, j – matrix row and
column indices.
Do... Loop Until cycles while there are unidentified polygon edges in the matrix
[mm]. It counts the number of these edges and then forms another matrix [ma]:
Do
a=sk-bb
ReDim ma(1 To a, 1 To 8)

BALTGRAF 2013 – The 12th International Conference on Engineering Graphics 195/300
k = 0
For i = 1 To sk
If mm(i, 8) = 0 Then
k = k + 1
For j = 1 To 8
ma(k, j) = mm(i, j)
Next j
End If
Next i
In the first column of the new array the program finds the minimum x value:
min = Minkord(ma, a, 1)
Use the specified column minimum value min detection by the reference
coordinates matrix [kor], the number of rows b and specific matrix column st
function.
Function Minkord(kor As Variant, b As Integer, st As Integer) As Double
Dim min As Double
min = kor(1, st)
For i = 2 To b
If kor(i, st) < min Then
min = kor(i, st)
End If
Next i
Minkord = min
End Function
Procedure finds and selects multiple rows for polygon in the matrix [ma]. First,
the procedure finds all the lines based on the minimum x coordinates and writes them
to vector vv (Fig. 2).
k = 0
For j = 1 To a
If ma(j, 1) = min Then
k = k + 1
vv(k) = j
End If
Next j

196/300 The 12th International Conference on Engineering Graphics – BALTGRAF 2013
Fig. 2. The number of founded rows
Second, the first vector member is assigned to index k and the first polygon
edge in this index row of the array is named. Polygons are numbered by index ii and
calculated by parameter bb:
k = vv(1)
ma(k, 8) = ii
bb = bb + 1
The procedure LineOfPolygon is called twice, which finds other polygon edges
based on the first polygon edge looking in counter-clockwise direction or clockwise
direction.
Public Sub LineOfPolygon(ma, a, bb, ii, k, k1, k2)
Third, the second edge has the same coordinates of the end k1 = 4, k2 = 5, and
are assigned to variables xx and yy:
For j = 1 To a
If ma(j, 8) = 0 Then
If (ma(j, 1) = ma(k, k1) And ma(j, 2) = ma(k, k2)) Then
ma(j, 8) = ii: bb=bb+1
xx=ma(j,4): yy=ma(j,5)
End If: End If
Next j
Fourth, it looks for the four lines in the selected direction.
For i = 1 To 4
For j = 1 To a
If ma(j, 8) = 0 Then
If (ma(j, 1) = xx And ma(j, 2) = yy) Then
ma(j, 8) = ii
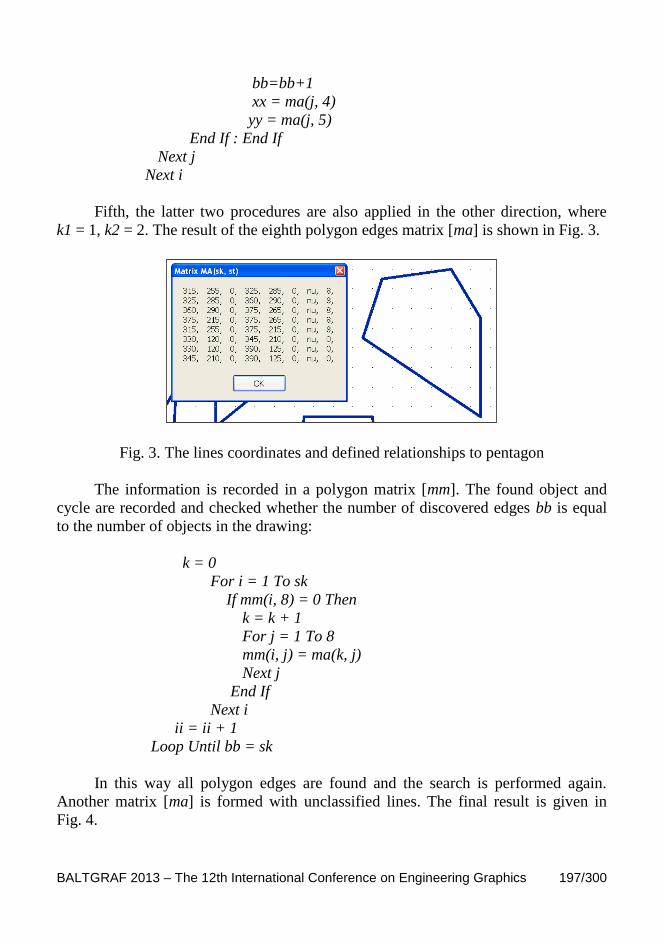
BALTGRAF 2013 – The 12th International Conference on Engineering Graphics 197/300
bb=bb+1
xx = ma(j, 4)
yy = ma(j, 5)
End If : End If
Next j
Next i
Fifth, the latter two procedures are also applied in the other direction, where
k1 = 1, k2 = 2. The result of the eighth polygon edges matrix [ma] is shown in Fig. 3.
Fig. 3. The lines coordinates and defined relationships to pentagon
The information is recorded in a polygon matrix [mm]. The found object and
cycle are recorded and checked whether the number of discovered edges bb is equal
to the number of objects in the drawing:
k = 0
For i = 1 To sk
If mm(i, 8) = 0 Then
k = k + 1
For j = 1 To 8
mm(i, j) = ma(k, j)
Next j
End If
Next i
ii = ii + 1
Loop Until bb = sk
In this way all polygon edges are found and the search is performed again.
Another matrix [ma] is formed with unclassified lines. The final result is given in
Fig. 4.
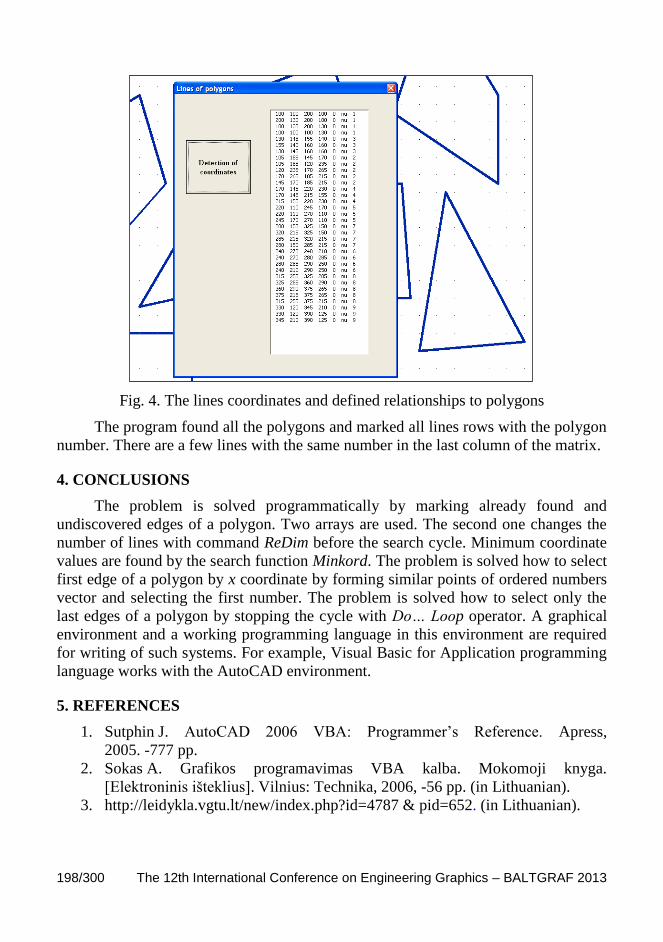
198/300 The 12th International Conference on Engineering Graphics – BALTGRAF 2013
Fig. 4. The lines coordinates and defined relationships to polygons
The program found all the polygons and marked all lines rows with the polygon
number. There are a few lines with the same number in the last column of the matrix.
4. CONCLUSIONS
The problem is solved programmatically by marking already found and
undiscovered edges of a polygon. Two arrays are used. The second one changes the
number of lines with command ReDim before the search cycle. Minimum coordinate
values are found by the search function Minkord. The problem is solved how to select
first edge of a polygon by x coordinate by forming similar points of ordered numbers
vector and selecting the first number. The problem is solved how to select only the
last edges of a polygon by stopping the cycle with Do… Loop operator. A graphical
environment and a working programming language in this environment are required
for writing of such systems. For example, Visual Basic for Application programming
language works with the AutoCAD environment.
5. REFERENCES
1. Sutphin J. AutoCAD 2006 VBA: Programmer’s Reference. Apress,
2005. -777 pp.
2. Sokas A. Grafikos programavimas VBA kalba. Mokomoji knyga.
[Elektroninis išteklius]. Vilnius: Technika, 2006, -56 pp. (in Lithuanian).
3. http://leidykla.vgtu.lt/new/index.php?id=4787 & pid=652. (in Lithuanian).
The 12 th International Conference on Engineering Graphics
BALTGRAF 2013 June 5-7, 2013, Riga, Latvia
199/300
FROM LEARNING OUTCOMES TO THE TEAM OF ADVISERS
Ants SOON1, Aime RUUS
2
1. ABSTRACT
The Tartu College of the Tallinn University of Technology (TUT) tested the
efficiency of applying ideas of problem and project-based learning inside the subject
of Computer Graphics (2 credits) for the students of civil engineering. The project’s
goal was the creation of a 3D model of the main building of the college,
visualisations, schedules, sun and shadow analysis and final presentation of the
project. Students got good experience in working on a team, and being innovative and
responsible. Teamwork gave students deep and varied knowledge and skills, in
addition to the subject’s learning outcomes they got the ability to work like a team of
advisers.
KEYWORDS: Computer Graphics, Revit, Teamwork
2. INTRODUCTION
Engineering will be more and more project-based, problems more complex and
teams more multidisciplinary – students must have to start with teamwork as early as
possible. The most important elements of the learning environment, which provide
broad engineering skills, are subject, project and team. Employers hope that the
graduates start active work at once rather than continuing with additional special
training.
3. OVERVIEW OF THE METHODS OF LEARNING
The Cone of Learning [1] was originally developed by Edgar Dale in 1946 and
was intended as a visual device to describe various learning experiences. It
characterises the results of passive and active learning methods, theory and practice,
and takes into account that learners retain more information by what they “do” as
opposed to what is “heard”, “read” or “observed”. The closer we move with our
teaching methods towards the base of the cone (do the real thing), the more
entrepreneurs will be satisfied with young graduates.
1 Dep. of Technology, Tartu College, Tallinn University of Technology, Puiestee Str.78, Tartu,
EE-51008, Estonia, e-mail: [email protected] 2 Dep. of Sustainable Engineering, Tartu College, Tallinn University of Technology, Puiestee Str.78,
Tartu, EE-51008, Estonia, e-mail: [email protected]

200/300 The 12th International Conference on Engineering Graphics – BALTGRAF 2013
The Engineering Education Model (EEM) was introduced in 2006 at the
University of Southern Denmark “in order to educate students with a distinct,
outstanding profile that meets current demands”. The EEM will create a motivating
context (do the real thing), promote teamwork and activate the students by inspiration
in problem-based and project-organised teaching [2]. Although the EEM is
curriculum-oriented, many ideas and experiences were used for designing and
performing the teaching activities of the CAD subject in the Tartu College of TUT
presented in this publication.
In January 2013 the taxonomy of significant learning was introduced in a
conference in Tallinn [3]. L. Dee Fink wrote in their Self-Directed Guide to
Designing Courses that students do not focus on, or “understand and remember”,
kinds of learning, rather more often they emphasise such things as critical thinking,
learning how to creatively use knowledge from the course, learning to solve real-
world problems, changing the way students think about themselves and others,
realising the importance of life-long learning, etc. [4]. Although the method is
subject-oriented, the capabilities of successful use of the ideology of significant
learning in our studies need time for elaboration and testing.
4. LEARNING OBJECTIVES AND OUTCOMES OF CAD STUDY
The Autodesk Official Training Guide (Ascent) specifies the learning
objectives for the first step of AutoCAD studies, and here we bring out only the first
words from these sentences: “understanding …”, “using …”, “creating …”,
“organising …”, “inserting …”, “adding …”, “setting …”, “drawing …”, “modifying
…”, “locating …”, and “making …” [5]. Unfortunately from very general studies is a
long way to “do the real thing” and effective teamwork.
The learning outcomes of the subject Computer Graphics in the Tallinn
University of Technology are formulated as an “Overview of the most popular CAD
software and knowledge and skills for composing and editing 2D/3D drawings with
AutoCAD”, which is also very general.
The Tartu College of the Tallinn University of Technology tested the efficiency
of applying ideas of problem and project-based learning inside the subject of
Computer Graphics (2 credits) for the students of civil engineering. The software
environment used was Revit 2012, activities organised keeping in mind the first step
towards BIM. For the specialisation of building restoration this looks like “a real
thing”.
5. ORGANIZATION AND STRUCTURE OF THE PROJECT AND
TEACHING
The project’s goal was the creation of the 3D model of the main building of the
college, visualizations, schedules, sun and shadow analysis and final presentation of
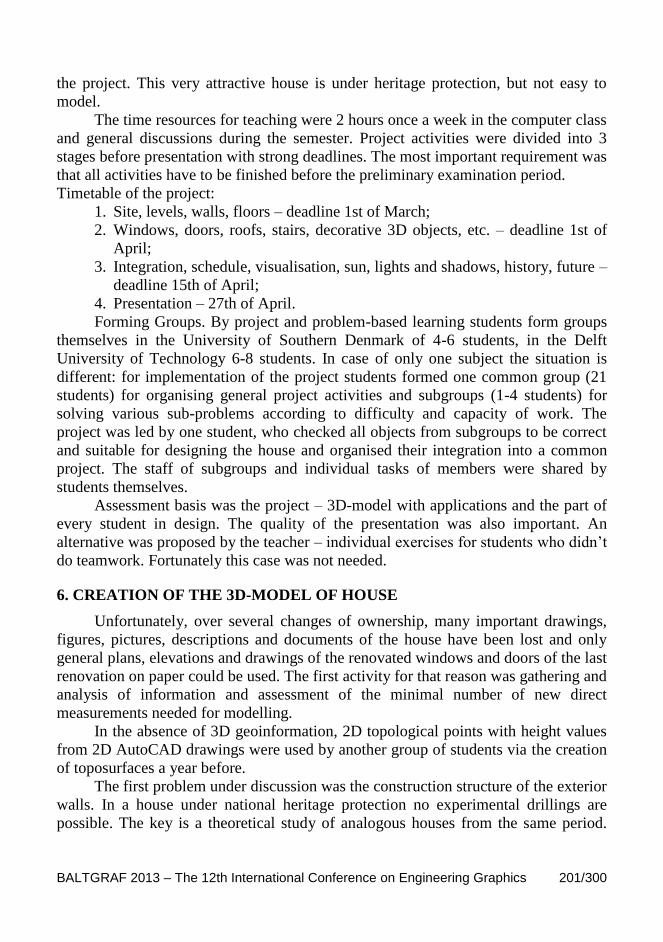
BALTGRAF 2013 – The 12th International Conference on Engineering Graphics 201/300
the project. This very attractive house is under heritage protection, but not easy to
model.
The time resources for teaching were 2 hours once a week in the computer class
and general discussions during the semester. Project activities were divided into 3
stages before presentation with strong deadlines. The most important requirement was
that all activities have to be finished before the preliminary examination period.
Timetable of the project:
1. Site, levels, walls, floors – deadline 1st of March;
2. Windows, doors, roofs, stairs, decorative 3D objects, etc. – deadline 1st of
April;
3. Integration, schedule, visualisation, sun, lights and shadows, history, future –
deadline 15th of April;
4. Presentation – 27th of April.
Forming Groups. By project and problem-based learning students form groups
themselves in the University of Southern Denmark of 4-6 students, in the Delft
University of Technology 6-8 students. In case of only one subject the situation is
different: for implementation of the project students formed one common group (21
students) for organising general project activities and subgroups (1-4 students) for
solving various sub-problems according to difficulty and capacity of work. The
project was led by one student, who checked all objects from subgroups to be correct
and suitable for designing the house and organised their integration into a common
project. The staff of subgroups and individual tasks of members were shared by
students themselves.
Assessment basis was the project – 3D-model with applications and the part of
every student in design. The quality of the presentation was also important. An
alternative was proposed by the teacher – individual exercises for students who didn’t
do teamwork. Fortunately this case was not needed.
6. CREATION OF THE 3D-MODEL OF HOUSE
Unfortunately, over several changes of ownership, many important drawings,
figures, pictures, descriptions and documents of the house have been lost and only
general plans, elevations and drawings of the renovated windows and doors of the last
renovation on paper could be used. The first activity for that reason was gathering and
analysis of information and assessment of the minimal number of new direct
measurements needed for modelling.
In the absence of 3D geoinformation, 2D topological points with height values
from 2D AutoCAD drawings were used by another group of students via the creation
of toposurfaces a year before.
The first problem under discussion was the construction structure of the exterior
walls. In a house under national heritage protection no experimental drillings are
possible. The key is a theoretical study of analogous houses from the same period.

202/300 The 12th International Conference on Engineering Graphics – BALTGRAF 2013
The solution of students is represented in Fig. 1, and the accuracy of that will be
checked after the first general maintenance with opening the walls. The inner
structure of walls used has no influence on visualisation, sun or shadow analyses, but
energy analyses, calculations of U-values (factors) and schedules of material take-offs
in the Revit 2013 environment require complete information. After precise
measurement the wall sweep profiles, Revit generates the decorative cornices very
easily.
Fig. 1. Design and structure of exterior wall
There are many different windows in this house, and therefore the creation of
families for windows was one of the most labour-intensive operations of the project.
The shape, dimensions and materials of windows are protected by the demands of
national heritage; therefore, minimum variable construction parameters were brought
into the families (Fig. 2).
Fig. 2. Window’s families

BALTGRAF 2013 – The 12th International Conference on Engineering Graphics 203/300
Flowers inside Gothic windows were reproduced from renovation drawings.
There was an uncomfortable surprise in case of application of the renovation
drawings for the biggest window on the second floor – the width dimensions were so
much different from reality that the students had to do this whole family again. One
little mistake, unlocking a reference plane in the window family, caused by the
window’s hosting spreading of window components and it took a lot of time to solve
this problem. An important task was the creation of various schedules with accurate
data for the department of administration and maintenance. It takes much care for
introduction adequate materials with required complex of properties for them. Similar
methods were used by creation of brick up window family.
For profiles of the decorative sweeps of heritage protected doors direct
measurements were used. Revit tools make it very simple to generate the 3D models
of profiled doors. Students decided to add door handles, but this element has been
used quite rarely due to the very weak support from the Internet and door handles
have to be custom-made (Fig. 3).
Fig. 3. Door Families
There are two main stairs in the house with quite complicated designs. The
most difficult was not the creation of 3D models of balusters (Fig. 6), but setting up
various parameters for stairs and railings (Fig. 4 and Fig. 5). It is certain that
members of the stair and railing team are now very good advisers in this specific
field.

204/300 The 12th International Conference on Engineering Graphics – BALTGRAF 2013
Fig. 4. Stairs (frontage side) Fig. 5. Stairs (inner side)
Fig. 6. Balusters Fig. 7. Rainwater pipes
The roof of the house has two slopes and some nonstandard approaches were
used successfully and the roof looks like the real one. Modelling rainwater gutters
passing across cornices (Fig. 7) required a new template to be created.
The preliminary task of creating and modifying schedules was to support the
department of administration and maintenance as much as possible in the creation of
various schedules and documentation. Areas of glass and frames could be calculated
from window schedules in various combinations of windows. This is important to
estimate the expenditure of labour and costs of spring cleaning. The room schedule
includes room numbers, application, floor and wall areas, volumes, etc., for all rooms,
but there are possibilities for making a selection for printing, which is very flexible
and fast in case of different bureaucratic demands from Mother University in Tallinn
(Fig. 8). An attempt was made to create a schedule in case of real property
management (maintenance).

BALTGRAF 2013 – The 12th International Conference on Engineering Graphics 205/300
Fig. 8. Room Schedule
Decorative objects were located too high to perform direct measurements.
Students took pictures and used scaled raster pictures in CAD and used Revit’s
Window template to place many analogous objects fast and accurately.
Fig. 9. Decorative objects
Analyses of sun and shadows were made using the location of our house and
the date and time of the presentation. The audience in the assembly hall could
compare the coincidence of real shadows from the sun and the artificial model
visualized by the programme as in Fig. 10.
The most interesting stage of modelling was visualization. The calculation
capacity of our computers was quite weak for rendering and all the processes took a
lot of time. Two specially upgraded computers were busy with visualisation for a
whole week. Students liked attractive results and tried again and again to find a new
foreshortening for an interesting picture (Fig. 11), but the generation of the video tour
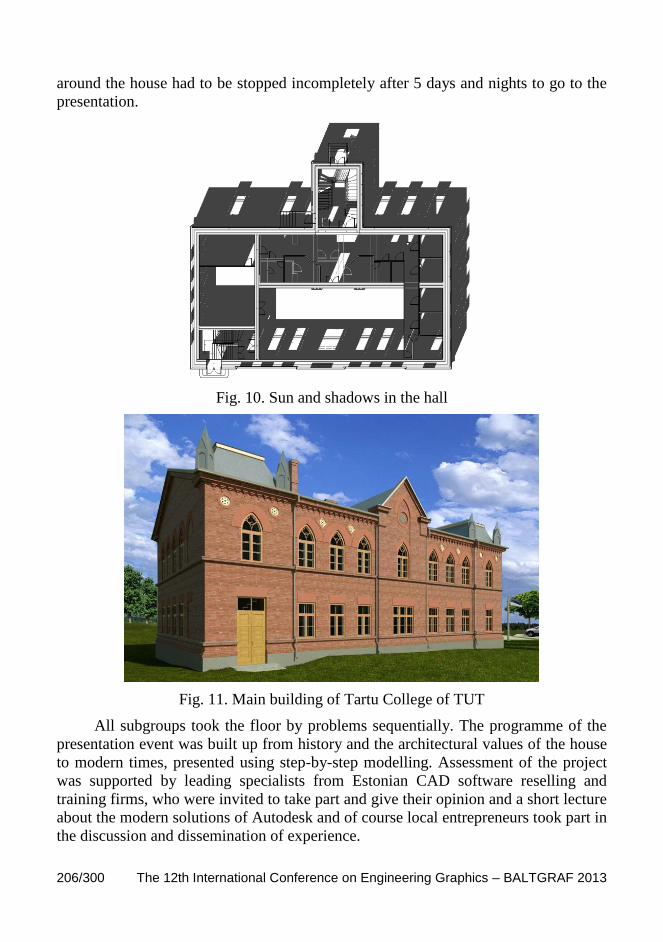
206/300 The 12th International Conference on Engineering Graphics – BALTGRAF 2013
around the house had to be stopped incompletely after 5 days and nights to go to the
presentation.
Fig. 10. Sun and shadows in the hall
Fig. 11. Main building of Tartu College of TUT
All subgroups took the floor by problems sequentially. The programme of the
presentation event was built up from history and the architectural values of the house
to modern times, presented using step-by-step modelling. Assessment of the project
was supported by leading specialists from Estonian CAD software reselling and
training firms, who were invited to take part and give their opinion and a short lecture
about the modern solutions of Autodesk and of course local entrepreneurs took part in
the discussion and dissemination of experience.
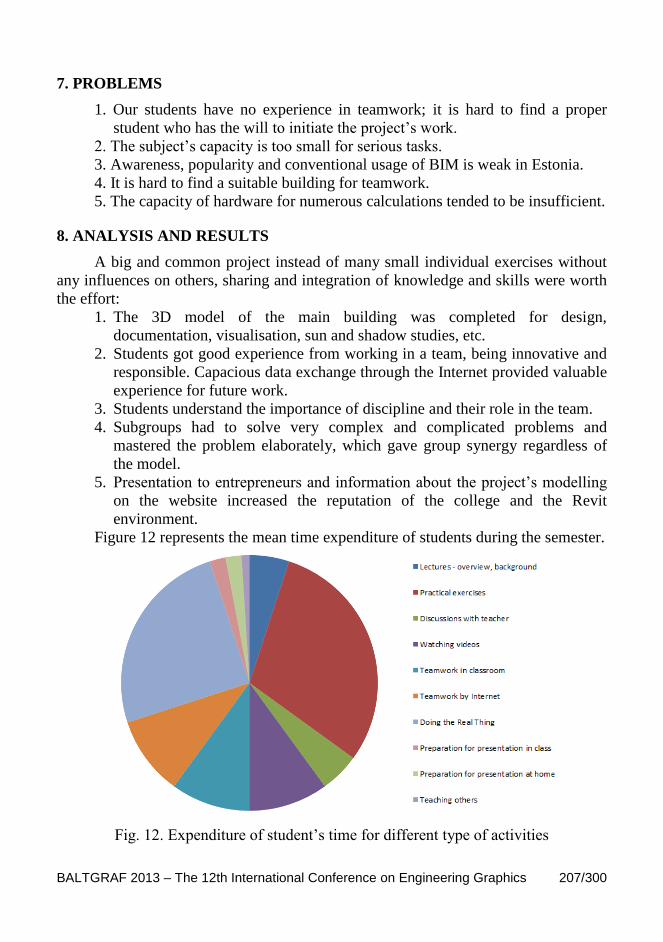
BALTGRAF 2013 – The 12th International Conference on Engineering Graphics 207/300
7. PROBLEMS
1. Our students have no experience in teamwork; it is hard to find a proper
student who has the will to initiate the project’s work.
2. The subject’s capacity is too small for serious tasks.
3. Awareness, popularity and conventional usage of BIM is weak in Estonia.
4. It is hard to find a suitable building for teamwork.
5. The capacity of hardware for numerous calculations tended to be insufficient.
8. ANALYSIS AND RESULTS
A big and common project instead of many small individual exercises without
any influences on others, sharing and integration of knowledge and skills were worth
the effort:
1. The 3D model of the main building was completed for design,
documentation, visualisation, sun and shadow studies, etc.
2. Students got good experience from working in a team, being innovative and
responsible. Capacious data exchange through the Internet provided valuable
experience for future work.
3. Students understand the importance of discipline and their role in the team.
4. Subgroups had to solve very complex and complicated problems and
mastered the problem elaborately, which gave group synergy regardless of
the model.
5. Presentation to entrepreneurs and information about the project’s modelling
on the website increased the reputation of the college and the Revit
environment.
Figure 12 represents the mean time expenditure of students during the semester.
Fig. 12. Expenditure of student’s time for different type of activities
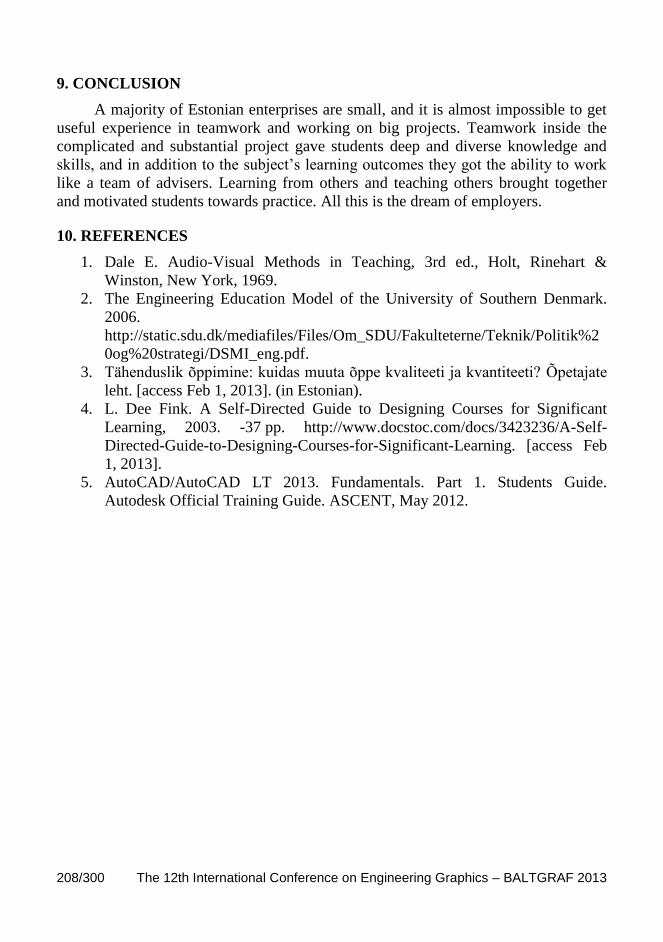
208/300 The 12th International Conference on Engineering Graphics – BALTGRAF 2013
9. CONCLUSION
A majority of Estonian enterprises are small, and it is almost impossible to get
useful experience in teamwork and working on big projects. Teamwork inside the
complicated and substantial project gave students deep and diverse knowledge and
skills, and in addition to the subject’s learning outcomes they got the ability to work
like a team of advisers. Learning from others and teaching others brought together
and motivated students towards practice. All this is the dream of employers.
10. REFERENCES
1. Dale E. Audio-Visual Methods in Teaching, 3rd ed., Holt, Rinehart &
Winston, New York, 1969.
2. The Engineering Education Model of the University of Southern Denmark.
2006.
http://static.sdu.dk/mediafiles/Files/Om_SDU/Fakulteterne/Teknik/Politik%2
0og%20strategi/DSMI_eng.pdf.
3. Tähenduslik õppimine: kuidas muuta õppe kvaliteeti ja kvantiteeti? Õpetajate
leht. [access Feb 1, 2013]. (in Estonian).
4. L. Dee Fink. A Self-Directed Guide to Designing Courses for Significant
Learning, 2003. -37 pp. http://www.docstoc.com/docs/3423236/A-Self-
Directed-Guide-to-Designing-Courses-for-Significant-Learning. [access Feb
1, 2013].
5. AutoCAD/AutoCAD LT 2013. Fundamentals. Part 1. Students Guide.
Autodesk Official Training Guide. ASCENT, May 2012.

The 12 th International Conference on Engineering Graphics
BALTGRAF 2013 June 5-7, 2013, Riga, Latvia
209/300
OPTIMIZATION OF TEACHING OF ENGINEERING
GRAPHICS SUBJECTS IN RIGA TECHNICAL UNIVERSITY
Veronika STROZEVA1, Zoja VEIDE
2
1. ABSTRACT
The lack of lecture hours in the curriculum of the subject requires students to study
the theoretical material independently; it’s difficult for understanding of and skills
mastering of the graphical subjects. In given article the example of interactive
multimedia theoretical and instructional applications for study of compulsory subject
“Descriptive Geometry and Engineering Graphics” and for free choice subjects
“Interactive Computer Graphics” and “Computer Aided Design” for first and second
year students of the Riga Technical University (RTU) are presented. The multimedia
lectures will facilitate the understanding of difficult themes of subject “Descriptive
Geometry and Engineering Graphics” resulting in improved student learning.
KEYWORDS: Engineering Graphics, Interactive Multimedia Materials, CAD
2. INTRODUCTION
In recent years, the possibilities for distance teaching have increased
tremendously. The widespread availability of the Internet and the ever increasing
bandwidth for telephone lines has allowed the use of rich media even over long
distances. In teaching, it is vital to use many different forms of information and
knowledge storage and retrieval methods, as students bring their own preferences for
knowledge gathering and storing. In addition, one should exploit the various ways of
getting the knowledge across in old fashioned class room type settings [1].
Current advances in information and communication technologies (ICT) have
spurred the need to incorporate higher levels of technology into university
classrooms. Educators use technological advances as powerful pedagogical tools not
only to present a plethora of information on a specific topic, but also to incorporate
material that is not available in print or that require synthesis from multiple resources
[2].
Hence, computer-assisted learning has become popular in educational settings,
having revolutionised the higher education sector. More specifically, the use of video,
1 Dep. of Computer Aided Engineering Graphics, Riga Technical University, Āzenes iela 16/20,
Rīga, LV-1048, Latvia, e-mail: [email protected] 2 Dep. of Computer Aided Engineering Graphics, Riga Technical University, Āzenes iela 16/20,
Rīga, LV-1048, Latvia, e-mail: [email protected]

210/300 The 12th International Conference on Engineering Graphics – BALTGRAF 2013
video streams or video-web communication has spanned the educational curriculum
in a range of fields such as mathematics science, language and others [3]. Even from
the students’ perspective, studies have shown that video can be a more effective
medium than text to enhance their satisfaction and motivation during the learning
process [4].
Video lectures are CD and web viewable files that present lecture materials and
narrative instruction from a course’s instructor [5]. They are used as additions to
classroom lectures and are not recordings of classroom lectures. In these lectures, the
instructor uses Microsoft Office content files, narrative instruction, and screen writing
with the keyboard and mouse pointer to deliver the lecture. Video lectures serve
major strategic purposes. First, they give additional teaching time to students who
cannot fully understand the course material through the classroom lectures and
support materials such as the textbook. Students can view and study the instructor’s
lectures as often as they wish until they understand material. This study resource is
particularly important in teaching a broad spectrum of students. Second, video
lectures allow classroom coverage of more complex and challenging subject material
that is more interesting to many students.
The first motivation for doing this video material was the conclusions that we
have made in our article “Moodle learning system in education process of Riga
Technical University” – students in the learning process more active use of video
materials in Moodle learning system at ORTUS portal of RTU [6]. The second
motivation was lack of classroom lecture time for the subject of Descriptive
Geometry and Engineering Graphics. The curriculum of the subject provides learning
hours to practical and laboratory training. The first year students have the deficiency
of basic pre-theoretical knowledge of geometry and, as a consequence, they have
difficulty in the independent study of the theoretical material.
Under experience of our work we should note that the readiness of students to
practical training is not satisfactory. On practical lessons it is necessary to spend a lot
of time to explain the theoretical material, which reduces the effectiveness of the
training. The video lectures creating will be especially helpful for the themes of free
choice subjects, such as an Interactive Computer Graphic and Computer Aided
Design, because attending classes on these subjects for the second year students is
optional. This paper describes an experience into preparation and using the video
material for learning Department of Computer Aided Engineering Graphics courses.
3. VIDEO MATERIAL CREATING
Video lectures help to achieve important educational goals of learning
improvement and retention for students most at risk of failure. Video lectures make
the lectures in the beginning of the semester available for study at the end of the
semester in preparation for the final exam. Video lectures support a comprehensive
teaching strategy. This strategy enables improved performance for weaker students, a
BALTGRAF 2013 – The 12th International Conference on Engineering Graphics 211/300
stronger curriculum, and more classroom time spent on the active learning. In
addition, video lectures are used as supplements to classroom lectures.
Video lectures are feasible for the average non-IT instructor’s use. Using a
personal computer, an instructor can create them quickly and easily. They are not
recordings of classroom lectures but cover lecture material as screen displays of
content files with audio lecture added. They can be produced before a course begins
or developed as it progresses. We used both approaches, distributing videos for the
entire course’s coverage at the beginning of the semester, and then preparing a new
video if needed to go over more slowly and extensively difficulties students are
having with subject material.
Video lectures are Windows Media video files (wmv) created using Camtasia
Studio 8, Microsoft Office, AutoCAD and ArchiCAD software. Camtasia gives you
the tools you need to truly customize and edit your videos. Record on-screen activity,
add imported media, create interactive content, and share high-quality, HD videos
that viewers can watch anytime, on nearly any device. Camtasia Studio add-in for
PowerPoint requires PowerPoint 2007 or 2010.
The encoding software captures screens from data files containing the materials
used in classroom lectures and narrative audio from a microphone connected to the
computer. They can be produced in the instructor’s office or home, with no special
set up required. In each video, the instructor navigates to display a topic-content file
and delivers the audio lecture using the microphone. Chalkboard writing is simulated
by using the keyboard and callouts tools to write comments and highlight information
on the screen (Fig. 1). Exploitation of highlighting by the cursor effect and the ‘zoom
and pan’ options of Camtasia software are an alternative and quick route to focus
students’ attention on more important steps of our lecture and still retain the sense of
the instructor's words bound to a chalkboard type action (Fig. 2).
This development of topics has the feel of a live lecture, although it is no live
classroom video. A key objective is to shorten the playing time in order to avoid
student loss of interest.
The lectures will help students acquire the skills solving the following tasks:
1. Orthographic projection construction of a point, line and plane by the given
coordinates;
2. Axonometric projections;
3. The determination of the line of intersection of the surface and a plane;
4. Section and sectional views;
5. Dimensioning principles;
6. Screw threads and conventional representations.
Also, we created video materials which offer a series of exercises to help the
students learn the 2D drawing techniques and 3D models creating of AutoCAD.
Video materials for ArchiCAD software are composed of a series of easy to use
training guides that help users learn by doing.

212/300 The 12th International Conference on Engineering Graphics – BALTGRAF 2013
Fig. 1. Video lecture creation on the theme “Orthographic projection of points,
lines and planes”
Fig. 2. ArchiCAD video lecture creation
BALTGRAF 2013 – The 12th International Conference on Engineering Graphics 213/300
5. CONCLUSIONS
The multimedia lectures are appeal to many students in the modern media
culture, where the medium of information delivery may improve study effectiveness
and learning. In this study, video lectures are designed to graphical subjects with
more time spent on step-by-step explanations of the methods of tasks solving.
Students can study video lectures at a time and locations of their choice, when
they may be better able to concentrate and focus on the subject material.
Video lectures allow pauses and repetition until sections of the material are
learned that facilitate the understanding of subject “Descriptive Geometry and
Engineering Graphics” as a result it improves of effectiveness of the training.
In other view when physically attending a live lecture, the lecturer can convey
their enthusiasm for the subject, thus grabbing the students’ attention. Additionally,
the viewer is less forgiving of the lecturer’s minor mistakes and audience disruptions
when watching the recording. Students don’t have possibilities to ask questions
during video lecture viewing.
A direction for future research is to investigate how video lectures may
strengthen or broaden teaching strategies, to evaluate the students’ feedback and
influence of the video use to final results of the course.
6. REFERENCES
1. Brecht H. D., Ogilby S. M. Enabling a Comprehensive Teaching Strategy:
Video Lectures. Journal of Information Technology Education, 2008, p.71-
86.
2. Panagiota N-S., Christos N. Evaluating the Impact of Video-based versus
Traditional Lectures on Student Learning. Educational Research, 2010, 1, (8),
p. 304-311.
3. Robert I. V. Modern Information Technologies in Education: Teaching Issues;
Prospects of Implementation. Moscow: IIO RAO, 2010. -140 pp. (in Russian).
4. Choi H. J., Johnson S. D. The Effect of Context-based Video Instruction on
Learning and Motivation in Online Courses. The American Journal of
Distance Education, 2005, 19, (4), p. 215-227.
5. Bennett E. Are Videoed Lectures an Effective Teaching Tool?
http://stream.port.ac.uk/papers/Are%20videoed%20lectures%20an%20effecti
ve%20teaching%20tool.pdf.
6. Veide Z., Stroževa V., Dobelis M. Moodle Learning System in Education
Process of Riga Technical University. The Interdepartmental Collection of
Proceedings of the 8th Crimean International Scientific-Practical Conference
Geometrical and Computer Simulation: Safe-Energy, Ecology, Design.
SED-11, 2011, p. 298-303.

214/300 The 12th International Conference on Engineering Graphics – BALTGRAF 2013
The 12 th International Conference on Engineering Graphics
BALTGRAF 2013 June 5-7, 2013, Riga, Latvia
215/300
ARCHITECTURAL FORM AND BUILDING MATERIAL
OF SUSPENSION AND CABLE-STAYED BRIDGES
– VISUALIZATION OF GEOMETRICAL STRUCTURE
Jolanta TOFIL1, Anita PAWLAK-JAKUBOWSKA
2
1. ABSTRACT
The paper discusses motives and inspirations behind the search for modern
architectural forms of suspended and cable-stayed bridges. Novel constructions and
materials as well as new functional tasks form the main motivation of such actions.
It is the domain of geometry as a source of structural forms which has been indicated
as inspiring and facilitating the discovery of shapes of those buildings. Together with
the presentation of design examples and visualization, values of bridges composition
of cable stayed type have been presented which are attributed to force expression and
shapes dynamics and these in turn decide on artistic character of architecture.
KEYWORDS: Architectural Form, String Construction, 3D Visualization, CAD
2. INTRODUCTION
Mario Salvadori states that structure can exist without architecture, giving
machines as examples but architecture cannot exist without structure. The idea of
bearing structure creates the constructional form of a building. The character of
cooperation between bearing elements results in its static advantages. The form of
bridges string constructions results from a suitable play of forces supported on a set
of pylons or arches and cables and lines, which together carry gangways and at the
same time allow to solve problems of span, height and width.
The form of bridges string construction which aims at proper static of a
building, inspires the structural form which is seen as particular kind of piece of art of
designing and architectural composing. Construction elements included in
architectural order of things inspire the form of objects of string structure and
determine relations with the environment.
1 Silesian University of Technology, Geometry and Engineering Graphics Centre, Krzywoustego 7
Street, Gliwice, Poland, e-mail: [email protected] 2 Silesian University of Technology, Geometry and Engineering Graphics Centre, Krzywoustego 7
Street, Gliwice, Poland, e-mail: [email protected]

216/300 The 12th International Conference on Engineering Graphics – BALTGRAF 2013
3. RESEARCH PART – DESIGN EXAMPLES
3.1 East Bridge over Great Belt [13]
Rail and road crossing over the Great Belt consists essentially of two parts: the
western bridge linking the islands Dual and Sprogø, of 6611.40 m length, east
connection from Sprogø to Zealand, realized by a bridge of 6790.00 m length – and a
rail tunnel of 8,024 m length (running at the bottom of the sea).
From Danish vast plains stretching around the Great Belt, the majesty of East
Bridge looks great already from a distance. Danish bridge was created as a part of one
of Europe's largest engineering projects of modern times, a permanent connection,
including highway and railway line between the Halsskov in Zealand and
Knudshoved in Fioni, bridging the obstacle of the 18 km wide Great Belt straits. The
connection ‘has closed the gap’ which has long been hindering road and railway
communications within the Danish state.
Around the middle of the Great Belt, Sprogø Island is located. From Funen and
Zealand it is separated by almost the same distance, but the passage of vessels mainly
goes along the Eastern Channel. Therefore, it was decided that the highway should
cross east canal, running over a high suspension bridge, whose span would allow
smooth, safe navigation, while over the Western Channel it was enough to build a
relatively low bridge3. The railroad tunnel goes over Eastern Channel
4, whereas
Western one runs parallel to the highway along a low bridge.
Eastern Bridge (Great Belt East) in terms of size, belongs to one of the leading
world record holders of suspension bridges, its total length is 2,694 m, including the
main span measuring 1,624 m. Side spans are symmetrical and each of them has a
span of 535 m. Its construction began at the end of 1991, after completion of a three-
year research and development phase of the project, it was finished in 1998.
3 Western Bridge – its construction began in the summer of 1989. This is low bridge because the
clearance above sea level is only 18 meters. The object was made of prestressed concrete of
prefabricated parts, which applies to both supports and spans. The supports were made in such a
way that the prefabricated caissons were guided to destination (after preparing the ground) and
were deposited at the bottom. Pedestals pillars of road and rail span were mounted on the caissons.
Box-section spans were made as prefabricated parts from prestressed concrete. The distance
between the road and rail bridge is 1.36 m. 4 Railway tunnel – 8024 m long, connects the island of Zealand Sprogø to Korsoru. The construction
of the tunnel in this section was determined by the east bridge height. Due to the very large drops,
which would the train have to overcome it is located 65 m above the sea level. The tunnel is routed
in marl layer showing numerous cracks, causing leaks, and therefore many problems. It consists of
two circular structures with a diameter of 8.50 m, made parallel to each other, at a distance of
16.50 m (axial distance of 25 m). Every 250 m the two tunnels are connected to a transverse tunnel
serving as a technical passage of 4.50 m internal diameter, in total there are 31 of them. The
housing of the tunnel is made of reinforced concrete covered with a suitable prefabricated
insulation.
BALTGRAF 2013 – The 12th International Conference on Engineering Graphics 217/300
Almost in every respect the task facing the builders was huge. In addition to the
suspension bridge project involved creating 23 flyover spans – 14 on the east, and 9
on the west of the suspension bridge. East Bridge consists of concrete parts –
caissons, piers and pylons and steel parts – carrying ropes and girders.
Trapezoidal concrete pylons have a height of 254 m above the sea level and
form the highest points in Denmark. In spite of the unusual height they look slender.
The pylons have a simple frame shape with a sharp outline. Each pylon is divided
into two equal parts with a narrow horizontal beam in the middle.
Classic design of a suspension bridge requires that the main cables are anchored
deep within large blocks at the ends of the side spans. With this bridge a lot of effort
was put into improving the shape of the anchor blocks, which in the existing bridges
have had structures often so massive that they unnecessarily dominated the rest of the
building. This time, the architects broke up the block into separate elements –
triangular parts for anchoring cables and a pillar supporting vertical pole end of the
flyover. The result is surprisingly lightweight design, if we take into account the
forces which it must withstand due to the tension of two main ropes.
The two main cables of the Eastern Bridge were built on the site, using well-
known methods of aerial twisting of ropes, used since the construction of the
Brooklyn Bridge in New York. These 85 cm thick, heavy cables are lifted by the
pylons, and, as mentioned above, are stabilized by anchor blocks. Vertical lines
(suspensions) were lowered from the main cables and steel trapezoidal girders of
aerodynamic shape were fastened to their ends.
In the construction of the Great Belt Bridge the combined effort of architects
and engineers has resulted in a unique piece which created one of the most elegant
bridges in the world – clear and deceptively lightweight, which is the real proof of the
truth of the principles governing the suspension bridges.
3.2 The Brigde Over Sund Strait (Oresund) [2]
Even in the early twenty-first century it is rare that two independent nations are
connected by a bridge. The crossing of 16.4 km length over the Strait of the Sund has
been planned as a road and railway tract. It connects the Danish city of Copenhagen
with the Swedish Malmö. The project started in March 1991. The first car went by the
tunnel in March 1999, and in December of that year the first railway track was
completed between Malmö and Copenhagen. The area on both sides of the strait,
which is the bustling marine area, is densely populated. Above we can see aircrafts
flying to and from Kastrup Airport in Copenhagen. Therefore, the bridge is visually
dominant object of both land, sea, and air and the aesthetic aspects played an
important role in its design.
The crossing has been divided into separate projects: a tunnel of 3,750 m length
below the channel Drogden (running from the airport in Copenhagen on Zealand to a
new artificial island), an artificial double island Peberholm of 4,210 m length, west
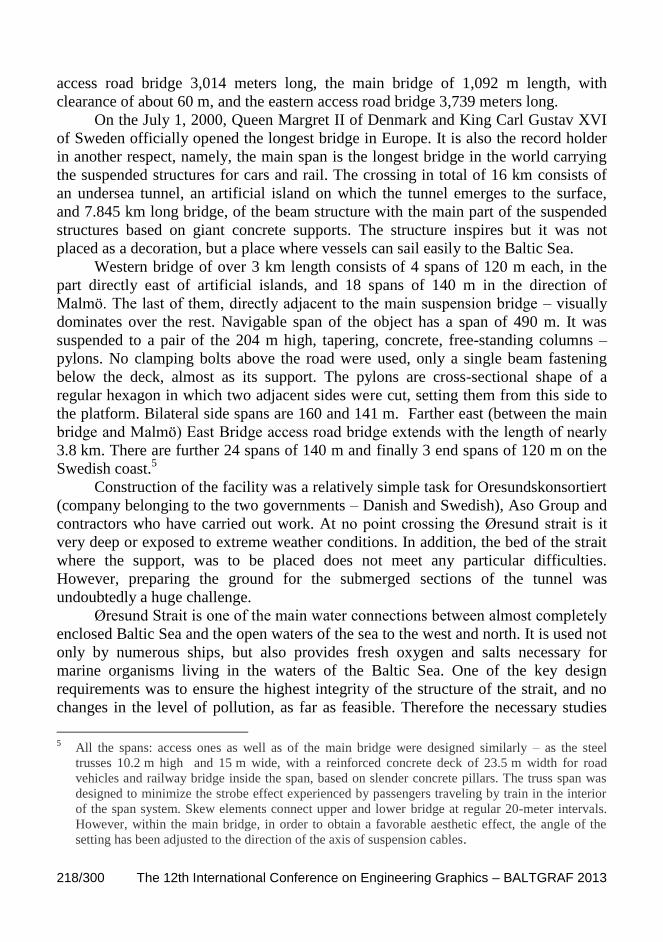
218/300 The 12th International Conference on Engineering Graphics – BALTGRAF 2013
access road bridge 3,014 meters long, the main bridge of 1,092 m length, with
clearance of about 60 m, and the eastern access road bridge 3,739 meters long.
On the July 1, 2000, Queen Margret II of Denmark and King Carl Gustav XVI
of Sweden officially opened the longest bridge in Europe. It is also the record holder
in another respect, namely, the main span is the longest bridge in the world carrying
the suspended structures for cars and rail. The crossing in total of 16 km consists of
an undersea tunnel, an artificial island on which the tunnel emerges to the surface,
and 7.845 km long bridge, of the beam structure with the main part of the suspended
structures based on giant concrete supports. The structure inspires but it was not
placed as a decoration, but a place where vessels can sail easily to the Baltic Sea.
Western bridge of over 3 km length consists of 4 spans of 120 m each, in the
part directly east of artificial islands, and 18 spans of 140 m in the direction of
Malmö. The last of them, directly adjacent to the main suspension bridge – visually
dominates over the rest. Navigable span of the object has a span of 490 m. It was
suspended to a pair of the 204 m high, tapering, concrete, free-standing columns –
pylons. No clamping bolts above the road were used, only a single beam fastening
below the deck, almost as its support. The pylons are cross-sectional shape of a
regular hexagon in which two adjacent sides were cut, setting them from this side to
the platform. Bilateral side spans are 160 and 141 m. Farther east (between the main
bridge and Malmö) East Bridge access road bridge extends with the length of nearly
3.8 km. There are further 24 spans of 140 m and finally 3 end spans of 120 m on the
Swedish coast.5
Construction of the facility was a relatively simple task for Oresundskonsortiert
(company belonging to the two governments – Danish and Swedish), Aso Group and
contractors who have carried out work. At no point crossing the Øresund strait is it
very deep or exposed to extreme weather conditions. In addition, the bed of the strait
where the support, was to be placed does not meet any particular difficulties.
However, preparing the ground for the submerged sections of the tunnel was
undoubtedly a huge challenge.
Øresund Strait is one of the main water connections between almost completely
enclosed Baltic Sea and the open waters of the sea to the west and north. It is used not
only by numerous ships, but also provides fresh oxygen and salts necessary for
marine organisms living in the waters of the Baltic Sea. One of the key design
requirements was to ensure the highest integrity of the structure of the strait, and no
changes in the level of pollution, as far as feasible. Therefore the necessary studies
5 All the spans: access ones as well as of the main bridge were designed similarly – as the steel
trusses 10.2 m high and 15 m wide, with a reinforced concrete deck of 23.5 m width for road
vehicles and railway bridge inside the span, based on slender concrete pillars. The truss span was
designed to minimize the strobe effect experienced by passengers traveling by train in the interior
of the span system. Skew elements connect upper and lower bridge at regular 20-meter intervals.
However, within the main bridge, in order to obtain a favorable aesthetic effect, the angle of the
setting has been adjusted to the direction of the axis of suspension cables.
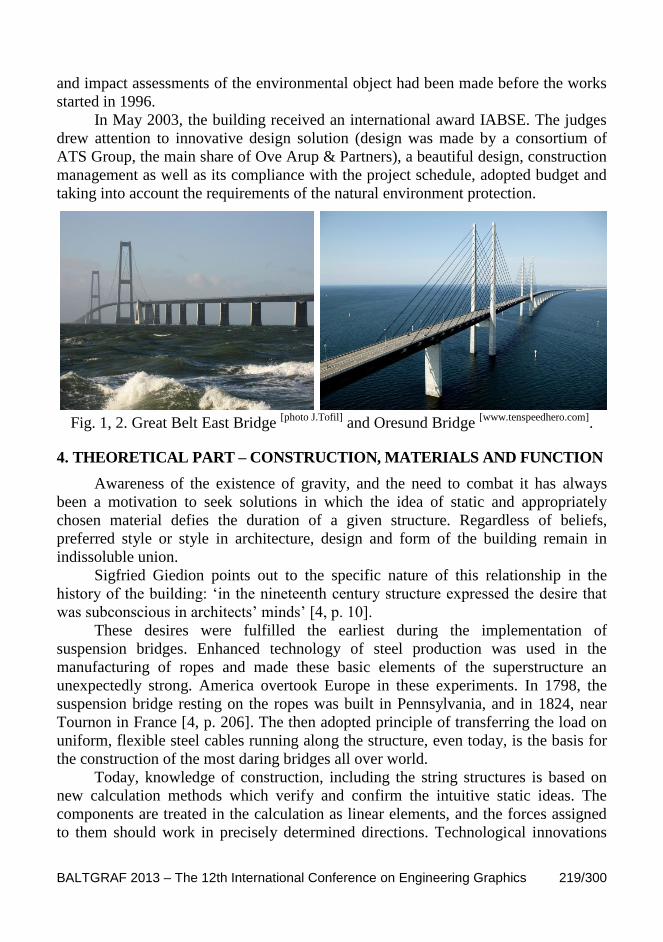
BALTGRAF 2013 – The 12th International Conference on Engineering Graphics 219/300
and impact assessments of the environmental object had been made before the works
started in 1996.
In May 2003, the building received an international award IABSE. The judges
drew attention to innovative design solution (design was made by a consortium of
ATS Group, the main share of Ove Arup & Partners), a beautiful design, construction
management as well as its compliance with the project schedule, adopted budget and
taking into account the requirements of the natural environment protection.
Fig. 1, 2. Great Belt East Bridge [photo J.Tofil]
and Oresund Bridge [www.tenspeedhero.com]
.
4. THEORETICAL PART – CONSTRUCTION, MATERIALS AND FUNCTION
Awareness of the existence of gravity, and the need to combat it has always
been a motivation to seek solutions in which the idea of static and appropriately
chosen material defies the duration of a given structure. Regardless of beliefs,
preferred style or style in architecture, design and form of the building remain in
indissoluble union.
Sigfried Giedion points out to the specific nature of this relationship in the
history of the building: ‘in the nineteenth century structure expressed the desire that
was subconscious in architects’ minds’ [4, p. 10].
These desires were fulfilled the earliest during the implementation of
suspension bridges. Enhanced technology of steel production was used in the
manufacturing of ropes and made these basic elements of the superstructure an
unexpectedly strong. America overtook Europe in these experiments. In 1798, the
suspension bridge resting on the ropes was built in Pennsylvania, and in 1824, near
Tournon in France [4, p. 206]. The then adopted principle of transferring the load on
uniform, flexible steel cables running along the structure, even today, is the basis for
the construction of the most daring bridges all over world.
Today, knowledge of construction, including the string structures is based on
new calculation methods which verify and confirm the intuitive static ideas. The
components are treated in the calculation as linear elements, and the forces assigned
to them should work in precisely determined directions. Technological innovations
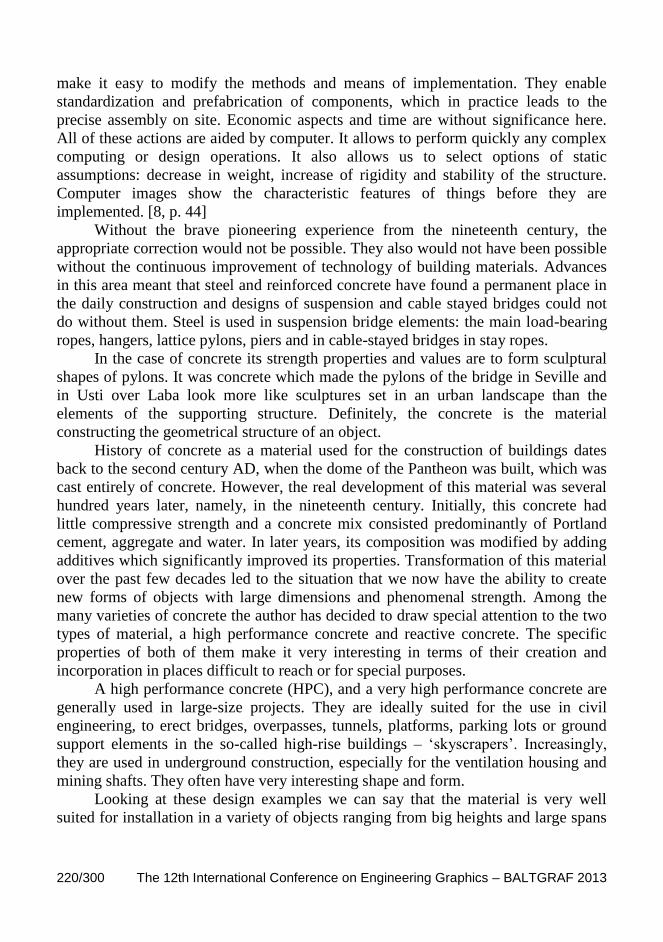
220/300 The 12th International Conference on Engineering Graphics – BALTGRAF 2013
make it easy to modify the methods and means of implementation. They enable
standardization and prefabrication of components, which in practice leads to the
precise assembly on site. Economic aspects and time are without significance here.
All of these actions are aided by computer. It allows to perform quickly any complex
computing or design operations. It also allows us to select options of static
assumptions: decrease in weight, increase of rigidity and stability of the structure.
Computer images show the characteristic features of things before they are
implemented. [8, p. 44]
Without the brave pioneering experience from the nineteenth century, the
appropriate correction would not be possible. They also would not have been possible
without the continuous improvement of technology of building materials. Advances
in this area meant that steel and reinforced concrete have found a permanent place in
the daily construction and designs of suspension and cable stayed bridges could not
do without them. Steel is used in suspension bridge elements: the main load-bearing
ropes, hangers, lattice pylons, piers and in cable-stayed bridges in stay ropes.
In the case of concrete its strength properties and values are to form sculptural
shapes of pylons. It was concrete which made the pylons of the bridge in Seville and
in Usti over Laba look more like sculptures set in an urban landscape than the
elements of the supporting structure. Definitely, the concrete is the material
constructing the geometrical structure of an object.
History of concrete as a material used for the construction of buildings dates
back to the second century AD, when the dome of the Pantheon was built, which was
cast entirely of concrete. However, the real development of this material was several
hundred years later, namely, in the nineteenth century. Initially, this concrete had
little compressive strength and a concrete mix consisted predominantly of Portland
cement, aggregate and water. In later years, its composition was modified by adding
additives which significantly improved its properties. Transformation of this material
over the past few decades led to the situation that we now have the ability to create
new forms of objects with large dimensions and phenomenal strength. Among the
many varieties of concrete the author has decided to draw special attention to the two
types of material, a high performance concrete and reactive concrete. The specific
properties of both of them make it very interesting in terms of their creation and
incorporation in places difficult to reach or for special purposes.
A high performance concrete (HPC), and a very high performance concrete are
generally used in large-size projects. They are ideally suited for the use in civil
engineering, to erect bridges, overpasses, tunnels, platforms, parking lots or ground
support elements in the so-called high-rise buildings – ‘skyscrapers’. Increasingly,
they are used in underground construction, especially for the ventilation housing and
mining shafts. They often have very interesting shape and form.
Looking at these design examples we can say that the material is very well
suited for installation in a variety of objects ranging from big heights and large spans

BALTGRAF 2013 – The 12th International Conference on Engineering Graphics 221/300
to those of great measures of dimensions. In addition, they fulfil the task, creating a
varied geometry of an object.
The need to meet new functional requirements provoked exceeding the existing
span of objects. It turned out that the boundaries that until recently seemed to be the
limit for the construction of bridges were easily crossed due to suspension string
structures. [12, p. 289] This type of construction, being both the mean and the aim in
itself becomes a starting point for other space management.
In practice of engineering design of bridges, the span is the starting point and it
remains a key criterion in the search for solutions. The principles of static string
constructions turn out to be extremely useful for this particular purpose. It was due to
functional motivations that in the world transferred by man architecture appeared at
such a surprising scale. This was made possible thanks to the tensioning structure,
which expanded repertoire of forms used in the architectural composition.
5. CONCLUSIONS PART – SUMMARY
5.1 Computer Technology as a Tool for the Development of Geometric
Shapes of Suspension and Cable Stayed Bridges
Computer techniques generate dynamic growth in every area of life. Prominent
aspect concerns the spatial geometric modelling. We can observe its boom that can be
seen for example in the implementation of cinematographic pictures or creating
computer games. There is a wide range of programs for 3D modelling. This type of
tool can not only be used to perform visualization but also to create a simulation of
mechanical objects that vary in time. Thus, by using these programs it is possible to
connect the geometry of shape to the architectural and construction dimension.
Architectural modelling of such objects consists on representing them in a
virtual space which representation of a real space which is the environment in which
they are to be realized. It is a very useful tool for an architect, which as early as at the
stage of a computer model can predict how the building fit in with the surrounding
landscape. This allows multiple changing of the decision on the form of geometric
shapes of individual elements or the entire body of the object. Nowadays, we are
witnessing a kind of competition in architectural realizations. The newly established
projects are bigger, have better construction and technology than their predecessors.
The use of computer is a very stimulating action for imagination and thus drives the
creative development.
For designers and engineers a design implemented in a computer program for
3D modelling is a valuable source of information. The object can be designed to carry
out a detailed analysis of the operation using a specific span or using different types
of material. This approach allows to make the most optimal decision.
222/300 The 12th International Conference on Engineering Graphics – BALTGRAF 2013
5.2 Creative Computer Visualization
Fig. 3, 4. Visualization of Great Belt East Bridge and Oresund Bridge
6. REFERENCES
1. Biliszczuk J. Mosty podwieszone. Projektowanie i realizacja. Wydawnictwo
Arkady, Warszawa, 2005. (in Polish).
2. Biliszczuk J. Stryjecka M. Scandinavian Communication Link. Engineering
and Construction, No. 9, 1995.
3. Czepiel J. AutoCAD: ćwiczenia praktyczne 3D. Wydawnictwo Politechniki
Śląskiej, Gliwice, 2012. (in Polish).
4. Giedion S. Przestrzeń, czas i architektura. Narodziny nowej tradycji.
Warszawa, 1968. (in Polish).
5. Harbeson P. Architecture in Bridge Design. Bridge Aesthetic Around the
World. Transportation Research Board, National Research Council,
Washington, 1999.
6. Jarominiak A. Mosty podwieszone. Oficyna Wydawnicza Politechniki
Rzeszowskiej, Rzeszów 2002. (in Polish).
7. Jaskulski A. AutoCAD 2013/LT 2013/WT+: kurs projektowania
parametrycznego i nieparametrycznego 2D i 3D. Wydawnictwo Naukowe
PWN, Warszawa, 2012. (in Polish).
8. Jodidio P. Nowe formy. Architektura lat dziewięćdziesiątych XX wieku,
translation: Motak M., Warszawa, 1998. (in Polish).
9. Murdock K. L. 3ds Max 2012. Biblia. Wydawnictwo Helion, Gliwice, 2012.
(in Polish).
10. Pałkowski Sz. Konstrukcje cięgnowe. Warszawa, 1994. (in Polish).
11. Salwadori M. Siła architektury. Dlaczego budynki stoją. Wydawnictwo
MURATOR, Warszawa, 2001. (in Polish).
12. Szczerbanowski R. Narzędzia wizualizacji. AutoCAD 2013 PL. Wydawnictwo
Politechniki Łódzkiej, Łódź, 2012. (in Polish).
13. http://www.storebaelt.dk/english.

The 12 th International Conference on Engineering Graphics
BALTGRAF 2013 June 5-7, 2013, Riga, Latvia
223/300
SYMBOLS USED TO DEFINE A PROJECTION METHOD
AND A CARTESIAN COORDINATE SYSTEM FOR
A THREE-DIMENSIONAL SPACE
Antanas VANSEVICIUS1
1. ABSTRACT
The important task becomes not the creation of the drawing but the interpretation of
the drawing. So using correct fundamentals for the projection method is cornerstone.
Arrangement of the front and the left side views is regulated by graphical symbols for
the indication of a projection method according to ISO 128-30:2001(E). Still we can
find different examples of symbols used to define a projection method when
arrangement of the front and the right side views is regulated. What does this
difference in accordance to a Cartesian coordinate system for a three-dimensional
space mean? It means to place an object into different octants. In the first case the
object will be placed into the first octant (first angle method) or the seventh octant
(third angle method). In the second case the object will be placed into the fifth octant
(first angle method) or the third octant (third angle method).
I have been interested in this problem for quite some time. In my opinion it is best for
a multiview drawing to place the object into the first octant. I would like to invite
colleagues for a discussion about the possibility of using the same projection method
or clearly defining in which octants the objects must be placed.
KEYWORDS: Projection Method, Graphical Symbol, Cartesian Coordinate System
2. INTRODUCTION
A modern computer technology level allows you to create drawings quickly and
efficiently but it is becoming a serious problem in the understanding of the drawings.
At ADDA (American Design Drafting Association) Technical Training Conference at
2007 it was said: “We can make drawings faster than ever but what good is it if you
cannot read it” [1].
Today I want to ask the others: We can make drawings faster than ever but
what good is it if we still do not have uniform rules for the interpretation of
projections? “Engineering drawings should be unambiguous and clear. For any part
of a component there must be only one interpretation. Drawings need to conform to
1 Institute of Hydraulic Constructional Engineering, Aleksandras Stulginskis University, Universiteto
10-745, Akademija, Kauno raj., LT-53361, Lithuania, e-mail: [email protected]
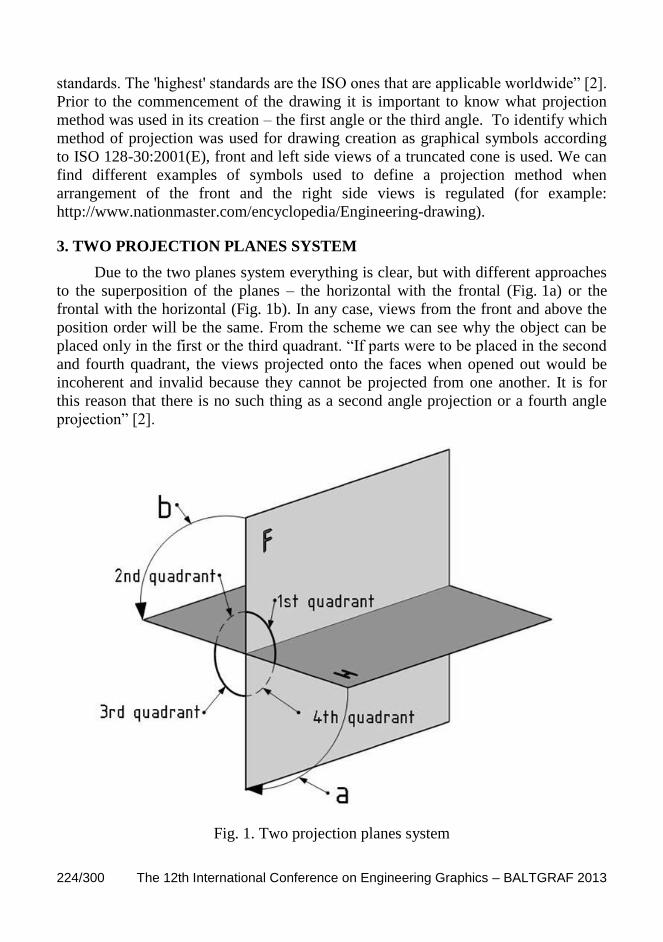
224/300 The 12th International Conference on Engineering Graphics – BALTGRAF 2013
standards. The 'highest' standards are the ISO ones that are applicable worldwide” [2].
Prior to the commencement of the drawing it is important to know what projection
method was used in its creation – the first angle or the third angle. To identify which
method of projection was used for drawing creation as graphical symbols according
to ISO 128-30:2001(E), front and left side views of a truncated cone is used. We can
find different examples of symbols used to define a projection method when
arrangement of the front and the right side views is regulated (for example:
http://www.nationmaster.com/encyclopedia/Engineering-drawing).
3. TWO PROJECTION PLANES SYSTEM
Due to the two planes system everything is clear, but with different approaches
to the superposition of the planes – the horizontal with the frontal (Fig. 1a) or the
frontal with the horizontal (Fig. 1b). In any case, views from the front and above the
position order will be the same. From the scheme we can see why the object can be
placed only in the first or the third quadrant. “If parts were to be placed in the second
and fourth quadrant, the views projected onto the faces when opened out would be
incoherent and invalid because they cannot be projected from one another. It is for
this reason that there is no such thing as a second angle projection or a fourth angle
projection” [2].
Fig. 1. Two projection planes system
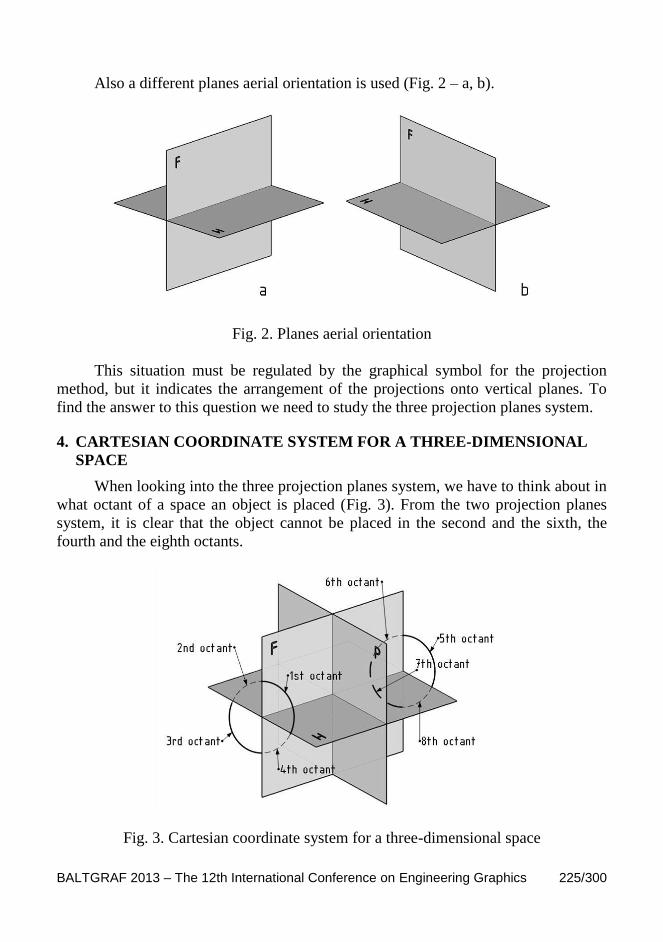
BALTGRAF 2013 – The 12th International Conference on Engineering Graphics 225/300
Also a different planes aerial orientation is used (Fig. 2 – a, b).
Fig. 2. Planes aerial orientation
This situation must be regulated by the graphical symbol for the projection
method, but it indicates the arrangement of the projections onto vertical planes. To
find the answer to this question we need to study the three projection planes system.
4. CARTESIAN COORDINATE SYSTEM FOR A THREE-DIMENSIONAL
SPACE
When looking into the three projection planes system, we have to think about in
what octant of a space an object is placed (Fig. 3). From the two projection planes
system, it is clear that the object cannot be placed in the second and the sixth, the
fourth and the eighth octants.
Fig. 3. Cartesian coordinate system for a three-dimensional space
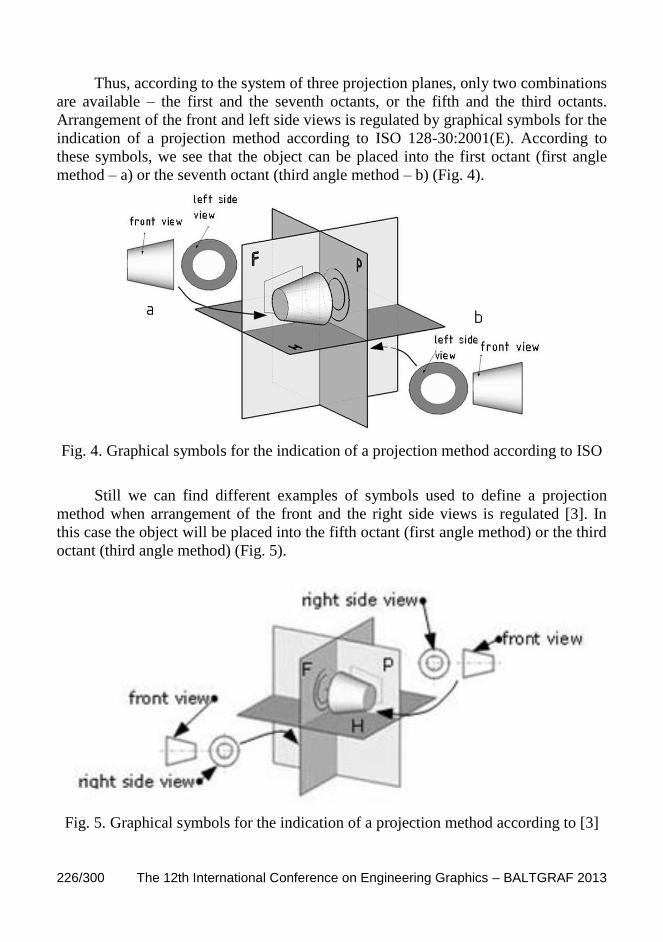
226/300 The 12th International Conference on Engineering Graphics – BALTGRAF 2013
Thus, according to the system of three projection planes, only two combinations
are available – the first and the seventh octants, or the fifth and the third octants.
Arrangement of the front and left side views is regulated by graphical symbols for the
indication of a projection method according to ISO 128-30:2001(E). According to
these symbols, we see that the object can be placed into the first octant (first angle
method – a) or the seventh octant (third angle method – b) (Fig. 4).
Fig. 4. Graphical symbols for the indication of a projection method according to ISO
Still we can find different examples of symbols used to define a projection
method when arrangement of the front and the right side views is regulated [3]. In
this case the object will be placed into the fifth octant (first angle method) or the third
octant (third angle method) (Fig. 5).
Fig. 5. Graphical symbols for the indication of a projection method according to [3]
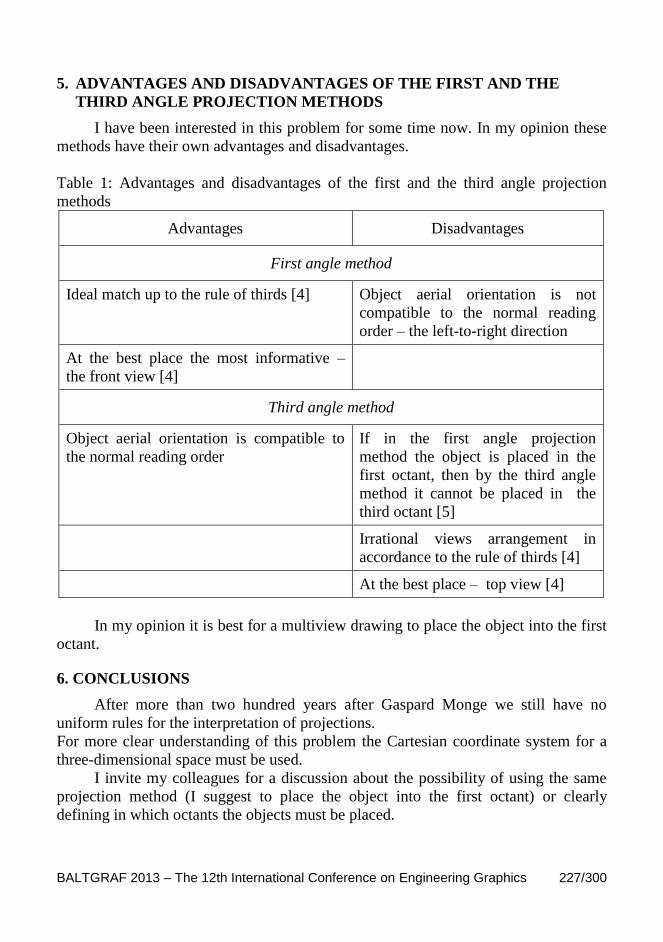
BALTGRAF 2013 – The 12th International Conference on Engineering Graphics 227/300
5. ADVANTAGES AND DISADVANTAGES OF THE FIRST AND THE
THIRD ANGLE PROJECTION METHODS
I have been interested in this problem for some time now. In my opinion these
methods have their own advantages and disadvantages.
Table 1: Advantages and disadvantages of the first and the third angle projection
methods
Advantages Disadvantages
First angle method
Ideal match up to the rule of thirds [4] Object aerial orientation is not
compatible to the normal reading
order – the left-to-right direction
At the best place the most informative –
the front view [4]
Third angle method
Object aerial orientation is compatible to
the normal reading order
If in the first angle projection
method the object is placed in the
first octant, then by the third angle
method it cannot be placed in the
third octant [5]
Irrational views arrangement in
accordance to the rule of thirds [4]
At the best place – top view [4]
In my opinion it is best for a multiview drawing to place the object into the first
octant.
6. CONCLUSIONS
After more than two hundred years after Gaspard Monge we still have no
uniform rules for the interpretation of projections.
For more clear understanding of this problem the Cartesian coordinate system for a
three-dimensional space must be used.
I invite my colleagues for a discussion about the possibility of using the same
projection method (I suggest to place the object into the first octant) or clearly
defining in which octants the objects must be placed.

228/300 The 12th International Conference on Engineering Graphics – BALTGRAF 2013
7. REFERENCES
1. Automated Drawing Creation. ADDA Technical Training Conference:
Illustrating the Future, April 16-19, 2007. Available from:
http://www.adda.org/documents/training/Preliminary_Conference_Brochure-
02-05-07.pdf.
2. Griffiths B. Engineering Drawing for Manufacture, Elsevier Science &
Technology Books, 2003. -169 pp.
3. Engineering Drawing. Encyclopedia. Available from:
http://www.nationmaster.com/encyclopedia/Engineering-drawing.
4. Vansevičius A. Viewing of Graphical Information. The Journal of Polish
Society for Geometry and Engineering Graphics. 2010, 20, p. 23-25.
Available from: http://ogigi.polsl.pl/biuletyny/zeszyt_20/z20_4.pdf.
5. Vansevičius A. Imprecisions in First-angle or Third-angle Projection Using/
Proceedings of Conference Geometry and Graphics, Ustron 24-26 June, 2009,
Silesian University of Technology, p. 61-62. Available from:
http://ogigi.polsl.pl/biuletyny/zeszyt_20/z20_4.pdf.
The 12 th International Conference on Engineering Graphics
BALTGRAF 2013 June 5-7, 2013, Riga, Latvia
229/300
EFFECT OF AUGMENTED REALITY TECHNOLOGY
ON SPATIAL SKILLS OF STUDENTS
Zoja VEIDE1, Veronika STROZEVA
2
1. ABSTRACT
Spatial skills are one of the factors of human intelligence structure. Development of
spatial skills in students is critically important for understanding the contents of
engineering graphics subjects. The aim of this study was to test an Augmented
Reality (AR) based applications that could influence on spatial ability of first year
students from Riga Technical University (RTU). A pre- and post-test was employed
using two intact classes of students which studied “Descriptive Geometry and
Engineering Graphics” subject. The treatment group learnt this subject carrying out
additional tasks of didactic AR based toolkit with aim to develop spatial skills during
their course, while the control group had their regular course.
KEYWORDS: Spatial Skills, Augmented Reality, Descriptive Geometry,
Engineering Graphics
2. INTRODUCTION
“Spatial abilities” refer to, in general, a collection of cognitive, perceptual, and
visualization skills. While lists may differ, substantial agreement exists that spatial
abilities involve [1]: the ability to visualize mental rotation of objects; the ability to
understand how objects appear in different positions; the skill to conceptualize how
objects relate to each other in space; three-dimensional (3D) understanding.
Engineering Graphics, Descriptive Geometry and its applications require
advanced abilities of visualization. Spatial visualization abilities are essential
qualities for engineers, important to success in scientific and technical fields, this
multi-faceted ability helps engineers to conceptualize links between reality and the
abstract model of that reality. In our daily lives, graphical communication is
becoming increasingly important through the emergence of computer graphics and
multimedia applications. Spatial abilities are especially important for student’s
1 Dep. of Computer Aided Engineering Graphics, Riga Technical University, Āzenes iela 16/20,
Rīga, LV-1048, Latvia, e-mail: [email protected]
2 Dep. of Computer Aided Engineering Graphics, Riga Technical University, Āzenes iela 16/20,
Rīga, LV-1048, Latvia, e-mail: [email protected]

230/300 The 12th International Conference on Engineering Graphics – BALTGRAF 2013
success in some engineering related subjects such as calculus, mathematics,
engineering drawing and computer-aided design and for solving geometric problems.
Therefore, a better understanding of this ability should be potentially beneficial to the
engineering education and profession.
Spatial ability is something that cannot be taught but it should rather be trained
and that training is the only way for its development and improvement. Training
tools, methodologies, and curricula are covered in the following reports: importance
of traditional graphics courses (sketching activities, orthographic projection,
isometric drawing) for improvement spatial skills [2-5]; description and presentation
of research results on the effectiveness of learning support tools eREFER and
eCIGRO, developed in response to the implementation of the Bologna Declaration in
1999, in the development of spatial visualization, freehand sketching, and
orthographic view generation skills [6]; the use of handheld mechanical dissection
manipulative by students during lectures and exercises leads to increased scores on
the Mental Rotations test (MRT) [7]; gaining and reinforcing expertise in 3D CAD
modelling provides enhanced result on tests of spatial reasoning skills [8-12];
usability validation of AR based application for development of spatial skills of
engineering students [13-14]. Interventions do not necessarily need to be computer-
based to be effective; technical drawing, 3D modelling with craft materials, and
drafting activities have been shown to help develop and improve spatial abilities [6,
8, 15-16]. These studies serve as a reminder that effective interventions can also be
low-cost and accessible, an important point to practitioners operating in limited
resources environments.
Currently in RTU there is a tendency towards the progressive reduction of
teaching hours dedicated to subjects related to engineering graphics. This in turn is
leading to a reduction in theoretical and practical contents, and the presentation of
some topics in a very condensed form. This situation may generate problems in the
process in which students develop their spatial skills. As teachers we realize which
difficulties have first year engineering students while learning “Descriptive Geometry
and Engineering Graphics” because of the low level of their spatial ability and we feel
the need of creating tools and methodologies for improving that ability.
In this study our experience in use of didactic toolkit AR-DEHAES for
development of spatial ability of first year students of RTU is described. This AR
based toolkit has been developed at the University of La Laguna in Spain [14]. AR
can be defined as integration of virtual elements in a real environment. Teachers of
University of La Laguna regarded AR as an attractive technology which offers the
necessary tools for creation of attractive teaching contents and development of spatial
skills.
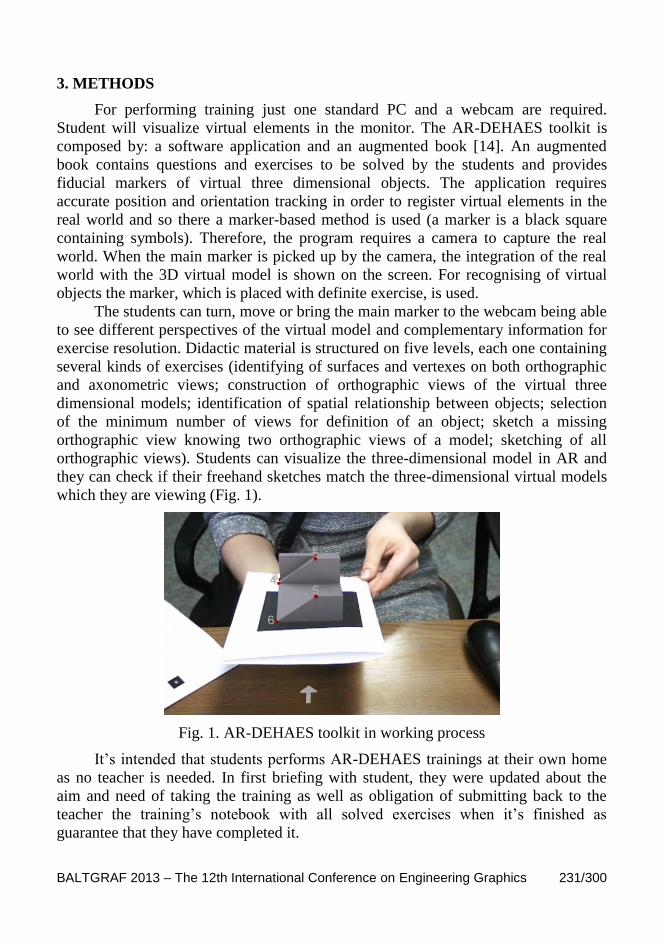
BALTGRAF 2013 – The 12th International Conference on Engineering Graphics 231/300
3. METHODS
For performing training just one standard PC and a webcam are required.
Student will visualize virtual elements in the monitor. The AR-DEHAES toolkit is
composed by: a software application and an augmented book [14]. An augmented
book contains questions and exercises to be solved by the students and provides
fiducial markers of virtual three dimensional objects. The application requires
accurate position and orientation tracking in order to register virtual elements in the
real world and so there a marker-based method is used (a marker is a black square
containing symbols). Therefore, the program requires a camera to capture the real
world. When the main marker is picked up by the camera, the integration of the real
world with the 3D virtual model is shown on the screen. For recognising of virtual
objects the marker, which is placed with definite exercise, is used.
The students can turn, move or bring the main marker to the webcam being able
to see different perspectives of the virtual model and complementary information for
exercise resolution. Didactic material is structured on five levels, each one containing
several kinds of exercises (identifying of surfaces and vertexes on both orthographic
and axonometric views; construction of orthographic views of the virtual three
dimensional models; identification of spatial relationship between objects; selection
of the minimum number of views for definition of an object; sketch a missing
orthographic view knowing two orthographic views of a model; sketching of all
orthographic views). Students can visualize the three-dimensional model in AR and
they can check if their freehand sketches match the three-dimensional virtual models
which they are viewing (Fig. 1).
Fig. 1. AR-DEHAES toolkit in working process
It’s intended that students performs AR-DEHAES trainings at their own home
as no teacher is needed. In first briefing with student, they were updated about the
aim and need of taking the training as well as obligation of submitting back to the
teacher the training’s notebook with all solved exercises when it’s finished as
guarantee that they have completed it.

232/300 The 12th International Conference on Engineering Graphics – BALTGRAF 2013
Forty eight freshman students (thirty three females and fifteen males) working
on an engineering degree at the RTU participated in this study using AR-DEHAES
toolkit. The majority of students were between 19 and 21 years old. Only two percent
had previously studied subjects related to engineering graphics at secondary school.
All students were full-time students and considered themselves to have difficulties
with spatial abilities. The target is that students who performed exercises of didactic
toolkit AR-DEHAES will improve their spatial abilities so it will help them for a
better understanding of the contents of the “Engineering Graphics” subject. For
checking of training effectiveness in the development of spatial ability of students we
had 24 first year mechanical engineering students which studied “Descriptive
Geometry and Engineering Graphics” subject and improve spatial skills traditionally
(sketching activities, orthographic projection, isometric drawing).
The study was performed during the second semester of the academic year
2011/12; at the time of taking part in the experience these students had attended
“Descriptive Geometry and Engineering Graphics” class in their degree courses.
Spatial abilities of engineering students were measured before and after training
through Mental Rotation Test (MRT).
4. RESULTS AND DISCUSSION
As stated previously, the study was carried out with 48 engineering students
who learnt “Descriptive Geometry and Engineering Graphics” subject and performed
AR-training and with control group mechanical engineering students having their
regular course at the second semester of the first academic year. At the beginning and
end of the course students have performed tests for measuring spatial skills. Fig. 2
and 3 illustrate histograms of participants’ pre-test and post-test scores. Horizontal
axes show score ranges. Table 1 shows the scores obtained by students in the MRT
test.
Fig. 2. Scores of MRT pre-test for experimental and control groups

BALTGRAF 2013 – The 12th International Conference on Engineering Graphics 233/300
For the statistical analysis we used a Student’s t-test, taking as the null
hypothesis (H0) the fact that mean values for spatial visualization abilities did not
vary after the end of the course. The t-test for paired series was applied and the ρ
values are ρ = 0.00000035 < 0.001. Hence the null hypothesis is rejected and we can
conclude, with a significance level of higher than 99.9%, that the mean scores for the
experimental group underwent a positive variation. In other words, the course
additionally using AR-DEHAES toolkit exercises had a measurable and positive
impact on the spatial ability of students, measured by MRT tests (the increase of
value is 5.33 points). However, the regular course of “Descriptive Geometry and
Engineering Graphics” also allows the development of spatial skills of the students
(Table 1).
Fig. 3. Scores of MRT post-test for experimental and control groups
Table 1. Mean pre- and post-test and gain test scores (standard deviation)
for experimental and control groups.
Groups Pre-test Post-test Gain
Experimental group
n=48
18.12
(5.91)
23.45
(4.05)
5.33
(4.31)
Control group
n=24
17.42
(5.39)
21.83
(5.08)
4.41
(4.26)
An analysis of variance (ANOVA) was performed to determine the effect of the
course type (regular or with AR training) on MRT. The analysis shows there was no
significant differences between groups (F = 0.598, ρ = 0.44).
234/300 The 12th International Conference on Engineering Graphics – BALTGRAF 2013
It is worth noting that research on factors that affect the development and
exercise of spatial abilities has traditionally focused on gender differences in
performance. It was determined that males perform better on tests of spatial
perception and mental rotation, and men and women perform equally well on spatial
visualization tests [17-19]. The difference in performance was large only for mental
rotation. In our research experimental group had about 70% of female and 30% of
male, while control group – 60% of male and 40% of female. The difference between
score gains of MRT test might have been more significant with approximately equal
gender ratio.
Besides we have conducted a questionnaire on usability and satisfaction with
the AR training application. Results show that all students expressed a highly positive
attitude to the material and contents. Most students considered it very useful, very
interesting and they were satisfied with the technology and methodology. All students
considered that AR-DEHAES system was pleasant to use. 82% of students mentioned
that AR training helped them in performance of graphical exercises of “Descriptive
Geometry and Engineering Graphics” subject. All the students whose responses are in
this questionnaire told that they would recommend this training to their fellow
students.
5. CONCLUSIONS
Training of spatial ability based on Graphic Engineering contents and AR
technology improves spatial abilities of students. “Descriptive Geometry and
Engineering Graphics” course supplemented with AR training provide a significant
gain in spatial abilities scores (5.33 points in MRT) compared with 4.41 points,
obtained in a “regular” engineering graphics course.
Good spatial ability levels allow student better understanding of engineering
graphic contents. So, if more students try to improve their spatial skills, by AR
training for example, academic performance rate will be greater.
The students’ feedback concerning AR-DEHAES toolkit was very positive, and
it is clear that AR technology will emerge as a real option at the university level.
AR-DEHAES is an efficient tool for developing of spatial abilities and for
learning of engineering graphics contents. AR is a cost-effective technology for
providing students with attractive contents respecting to paper books, giving new life
to classical pen and paper exercises.
6. REFERENCES
1. Sutton K., Williams A. Developing a Discipline-Based Measure of
Visualization. The UniServe Science Proceedings, 2008, p. 115-120.
2. Dejong P. S. Improving Visualization: Fact or Fiction? Engineering Design
Graphics Journal, 1977, 41 (1), p. 47-53.

BALTGRAF 2013 – The 12th International Conference on Engineering Graphics 235/300
3. Lord T. R. Enhancing the Visuo-Spatial Aptitude of Students. Journal of
Research in Science Teaching, 1985, 22 (5), p. 395-405.
4. Sorby S. A. Spatial Abilities and their Relationship to Computer Aided
Design Instruction. The Web Proceedings of the 1999 ASEE Annual
Conference and Exposition, 1999.
http://www.asee.org/acPapers/99conf577.PDF.
5. Alias M., Gray D. E, Black T. R. Attitudes Towards Sketching and Drawing
and the Relationship with Spatial Visualization Ability in Engineering
Students. International Education Journal, 2002, 3 (3), p. 65-75.
6. Contero M., Naya F., Company P., Saorín J. L. Learning Support Tools for
Developing Spatial Abilities in Engineering Design. The International
Journal of Engineering Education 2006, 22, (3), p. 470-477.
7. Ferguson C., Ball A., McDaniel W., Anderson R. A Comparison of
Instructional Methods for Improving the Spatial-Visualization Ability of
Freshman Technology Seminar Students. The Proceedings of the IAJC-IJME
International Conference, 2008, p. 123-131.
8. Martín-Dorta N., Saorín J. L., Contero M. Development of a Fast Remedial
Course to Improve the Spatial Abilities of Engineering Students. The Journal
of Engineering Education, October 2008, 97, (4), p. 505-513.
9. Onyancha R. M., Derov M., Kinsey B. L. Improvements in Spatial Ability as
a Result of Targeted Training and Computer-Aided Design Software Use:
Analyses of Object Geometries and Rotation Types. The Journal of
Engineering Education, April 2009, 98, (2), p. 157-167.
10. Onyancha R., Towle E., Kinsey B. L. Improvement of Spatial Ability Using
Innovative Tools: Alternative View Screen and Physical Model Rotator. The
Proceedings of the 114th ASEE Conference and Exposition, 2010, p. 234-240.
11. Sorby S. A., Baartmans B. J. The Development and Assessment of a Course
for Enhancing the 3-D Spatial Visualization Skills of First Year Engineering
Students.The Journal of Engineering Education, July 2000, 89, (3), p. 301-
307.
12. Sorby S. A., Drummer T., Hungwe K., Parolini L., Molzan R. Preparing for
Engineering Studies: Improving the 3-D Spatial Skills of K-12 Students. The
Proceedings of the 9th International Conference on Engineering Education,
2006, p. T3E-6-T3E-10.
13. Martin-Gutierrez J., Navarro R. E., Gonzalez M. A. Mixed Reality for
Development of Spatial Skills of First-Year Engineering Students.
Proceedings of the 41st Frontiers in Education Conference, October 12-15,
2011, p. T1A-1-T1A-6.
14. Martin-Gutierrez J., Contero M., Alcaniz M. Training Spatial Ability with
Augmented Reality. International Conference “Virtual and Augmented
Reality in Education, 2011, p. 49-53.

236/300 The 12th International Conference on Engineering Graphics – BALTGRAF 2013
15. Donohue S. K. Work In Progress: Identifying Undergraduate Courses Which
Develop and Enhance Spatial Abilities. The Proceedings of the 40th Frontiers
in Education Conference, 2010, p. F4E-1-F4E-2.
16. Olkun S. Making Connections: Improving Spatial Abilities with Engineering
Drawing Activities. The International Journal of Mathematics Teaching and
Learning, April 2003, p. 1-10.
17. Sharps M. J., Price J. L., Williams J. K. Spatial Cognition and Gender:
Instructional and Stimulus Influences on Mental Image Rotation Performance.
Psychology of Women Quarterly, 1994, 18, p. 413-425.
18. Sorby S. A. A Course in Spatial Visualization and its Impact on the Retention
of Female Engineering Students. Journal of Women and Minorities in Science
and Engineering, 2001, 7, p. 153-172.
19. Linn M. C., Peterson A. C. A Meta-Analysis of Gender Differences in Spatial
Ability: Implications for Mathematics and Science Achievement. In: J. S.
Hyde & M. C. Linn (Eds.), The Psychology of Gender: Advances through
meta-analysis. Baltimore: The Johns Hopkins University Press, 1986, p. 67-
101.
The 12 th International Conference on Engineering Graphics
BALTGRAF 2013 June 5-7, 2013, Riga, Latvia
237/300
PROBLEMS OF MOTIVATION OF STUDENTS TO STUDY
COMPULSORY SUBJECT “ENGINEERING GRAPHICS”
Zoja VEIDE1, Veronika STROZHEVA
2, Modris DOBELIS
3
1. ABSTRACT
Paper deals with a problem on how to raise an interest to the students during
preparation for practical training exercises and individual home assignments in the
course of Descriptive Geometry and Engineering Graphics. The methods of teaching
used for the decades should be reviewed taking into account a new generation of
students, their habits of learning and the existing challenges provided by
contemporary information technologies. An attempt was made to create new
educational materials which would motivate the students to work autonomously with
the theoretical materials. An Augmented Reality (AR) based applications were used
to entertain the students during the studies of the development of spatial reasoning in
the first year studies. The efficiency of the regular tests on understanding the
theoretical issues of descriptive geometry and engineering graphics was evaluated.
For this purpose a portal ORTUS of Riga Technical University (RTU) was used.
ORTUS – a multifunctional educational portal developed by IT Department of RTU –
links together all the individual online applications required for studies within one
framework in order to simplify the use of it and have a single access. As one of the
numerous modules in this portal is a Moodle based Learning Management System.
The recommended study materials like theoretical lectures, examples of completed
graphic exercises, video lectures, didactic toolkit for development of spatial skills and
tests are available to the students online with individual authorization. An approach
used was supposed to facilitate the students to acquire more practical skills in solving
graphic exercises and improve the quality of graphic education.
KEYWORDS: Engineering Graphics, Moodle Learning System, Augmented Reality
2. INTRODUCTION
Being one of the fundamental subjects of engineering education, the descriptive
geometry shall and may be brought into line with changes in the overall system of
1 Dep. of Computer Aided Engineering Graphics, Riga Technical University, Āzenes iela 16/20,
Rīga, LV-1048, Latvia, e-mail: [email protected] 2 Dep. of Computer Aided Engineering Graphics, Riga Technical University, Āzenes iela 16/20,
Rīga, LV-1048, Latvia, e-mail: [email protected] 3 Dep. of Computer Aided Engineering Graphics, Riga Technical University, Āzenes iela 16/20,
Rīga, LV-1048, Latvia, e-mail: [email protected]

238/300 The 12th International Conference on Engineering Graphics – BALTGRAF 2013
education. Experiments in various areas where the discipline might be updated have
been conducted over and over again. With the world changing, the methodology for
teaching descriptive geometry, which has been honed to perfection for years or
decades, suddenly becomes ineffective. The main challenge is to update both the
course in descriptive geometry and the methodology of its teaching within existing
time limitations, identify the ways to improve the efficiency of learning delivery and
make qualitative changes in both the process of professional training and its results.
The special nature of teaching students in their first years of studies should not
be omitted [1]. For students, yesterday’s schoolchildren, the first year is a period of
adaptation to the university’s requirements and new forms of learning. The trends
currently observed in the development of professional education bring forward an
independent work of students as the main form of learning.
In the presence of computer games a new generation has grown up. Today’s
students represent the first generations to grow up with this new technology [2]. They
have spent their entire lives surrounded by and using computers, videogames, digital
music players, video cams, cell phones, and all the other toys and tools of the digital
age. Our students today are all “native speakers” of the digital language of computers,
video games and the Internet. The children initially begin playing games and only
later they begin to learn writing and reading or the processes are parallel. It is now
clear that as a result of this ubiquitous environment and the sheer volume of their
interaction with it, today’s students think and process information fundamentally
differently from their predecessors. They would like to get necessary information
quickly. They like to parallel process and multi-task. They prefer their graphics
before their text rather than the opposite. They prefer random access. They prefer
games to “serious” work.
From the trend of reducing the number of contact hours in the class, there is a
need for more time to study the subject independently. On the other hand, it must be
borne in mind that this new generation of students is already at the university. Thus
there is an urgent need to change an approach to teaching and practical exercises.
In this paper we share our experience of the use of newly developed training
materials which take into account those special factors related to the new generation
of students tailored to study the material independently. It is assumed that these
practical exercises are more applicative, attractive and more entertaining to students.
3. COURSE IN MOODLE ENVIRONMENT
Moodle is an open-source learning course management system which helps the
educators to create effective online learning communities. Moodle is an alternative to
proprietary commercial online learning solutions, and is distributed free under open
source licensing. All the study materials of Department of Computer Aided
Engineering Graphics courses have been located in the Moodle based portal of RTU
named ORTUS and they help the students in mastering the topics of these courses.
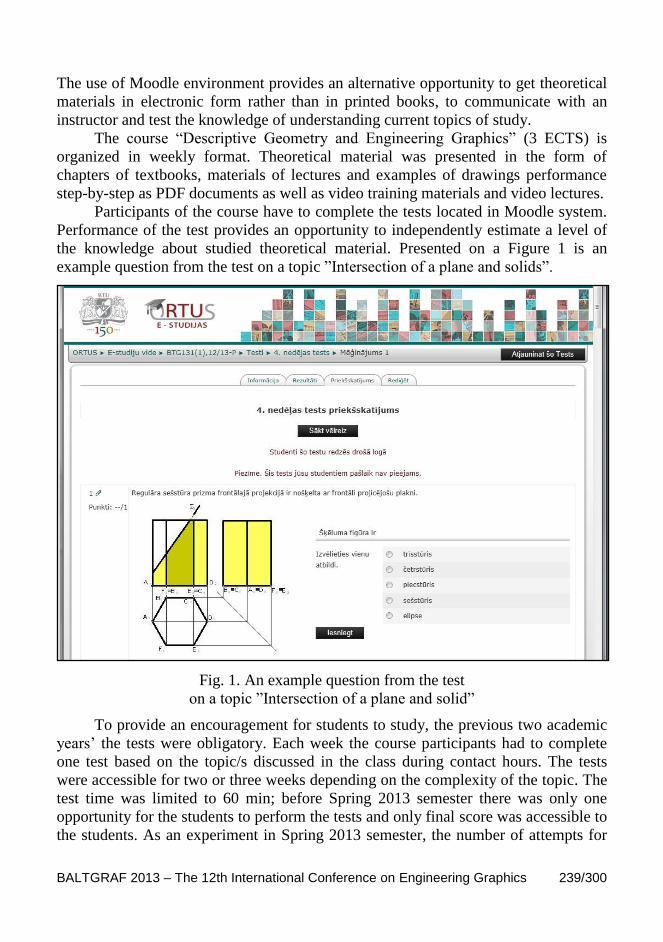
BALTGRAF 2013 – The 12th International Conference on Engineering Graphics 239/300
The use of Moodle environment provides an alternative opportunity to get theoretical
materials in electronic form rather than in printed books, to communicate with an
instructor and test the knowledge of understanding current topics of study.
The course “Descriptive Geometry and Engineering Graphics” (3 ECTS) is
organized in weekly format. Theoretical material was presented in the form of
chapters of textbooks, materials of lectures and examples of drawings performance
step-by-step as PDF documents as well as video training materials and video lectures.
Participants of the course have to complete the tests located in Moodle system.
Performance of the test provides an opportunity to independently estimate a level of
the knowledge about studied theoretical material. Presented on a Figure 1 is an
example question from the test on a topic ”Intersection of a plane and solids”.
Fig. 1. An example question from the test
on a topic ”Intersection of a plane and solid”
To provide an encouragement for students to study, the previous two academic
years’ the tests were obligatory. Each week the course participants had to complete
one test based on the topic/s discussed in the class during contact hours. The tests
were accessible for two or three weeks depending on the complexity of the topic. The
test time was limited to 60 min; before Spring 2013 semester there was only one
opportunity for the students to perform the tests and only final score was accessible to
the students. As an experiment in Spring 2013 semester, the number of attempts for

240/300 The 12th International Conference on Engineering Graphics – BALTGRAF 2013
the test completion was increased to three. After completion of each test the students
could see not only final points but also the correct answers. During the repetitive tests
the Moodle system provided the questions in a new sequence and the provided
answers also were in a new rearranged order.
According to our previous research [3], the students very actively used the
provided video materials in the learning process. In the surveys at the end of the
course many students described the video materials as a required tutoring resource.
Therefore we created video lectures for the following courses: Descriptive Geometry
and Engineering Graphics, Interactive Computer Graphic, Computer Aided Design.
Video lectures are prepared by lecturer and the students can view and study
them repeatedly as many times as needed to accommodate to their individual learning
abilities. Lectures are detailed step-by-step explanations of the materials covered in
the classroom lectures and are presented at a delivery pace that is significantly slower
than what can be accomplished in the limited time available in the classroom. They
can be paused and repeated and, thus, can be studied by students at their own learning
pace. In addition the video lectures are much more focused on the learning experience
rather than the traditional study from the written textbook. Textbooks usually contain
a broad range of topics and they cover the theory in the sequence that might be
inconsistent with the instructor’s presentation of the material in the classroom. The
video lectures are exclusively targeted to what the student needs to learn according to
the course syllabus.
Video lectures allow the instructor to shift the classroom time spent on basic,
less challenging material to more complex and difficult subject material [4]. By
including more-complex information in classroom lectures, they are faster paced and
provide the stimulation of more interesting material. Students who cannot fully
understand and learn at this pace have the video lectures as a slower and very
thorough second-lecture they can study at their own learning pace.
4. AUGMENTED REALITY TEHNOLOGY IN LEARNING PROCESS
Engineering graphics is the subject which is important for the transferring
technical information from design into manufacture. Developing ability to create and
read graphical representation of engineering structure is essential for any individual
modern engineering student. However, in the classroom, where lecture time is very
limited, it is hard for the instructors to clearly illustrate the relationship between the
3D geometry and 2D projection using only one kind of presentation technique.
Augmented Reality (AR) application enables faster comprehension of complex
spatial problems and relationships which will benefit the students greatly during their
learning processes [5]. Augmented Reality is a new technology that lets you interact
with the real world and virtual objects at the same time.
To facilitate the students’ perception of the study materials in the course
“Descriptive Geometry and Engineering Graphics” we prepared the 3D objects from
manual graphic exercises into AR environment. The 3D Augmented Reality scenes

BALTGRAF 2013 – The 12th International Conference on Engineering Graphics 241/300
were created using BuildAR software. The virtual 3D models were overlaid on the
real world environment as observed through the computer’s web camera, making
them to appear as part of the surrounding environment (Fig. 2). BuildAR uses
marker-based tracking, which means that the 3D models appear attached to a
physically printed markers. For each object both its individual marker and 3D model
were created and in that way the AR scene was built up. The 3D models were
modelled with SolidWorks and saved as STL files for later import into AR scene.
The surveys at the end of the semester revealed the student’s opinion on the
effectiveness and usability of AR models in the course. All the students considered
this approach as being very useful in the solving of graphic exercises. It was
acknowledged as very interesting and entertaining for the topic on formation of
multiview projections from 3D geometric objects. Especially interesting was the
provided freedom of arbitrary observation of the transformation of 3D AR model into
2D projections, which could be interactively manipulated in real time in front of
computer with web camera. The overall response of the students about AR model use
in the Descriptive Geometry and Engineering Graphics course was very positive.
Fig. 2. Three-dimensional virtual model in Augmented Reality environment
5. CONCLUSIONS
The created video lectures and AR models considerably improved the interest
of learning, supplied the students with higher degree of flexibility and understanding
of the teaching materials and entertaining them in an interactive and augmented way.
242/300 The 12th International Conference on Engineering Graphics – BALTGRAF 2013
Video lectures allowed getting the necessary information very quickly and
made the theoretical material more intuitive and understandable. During the study the
students could control the rate of perception of huge amount of graphic information.
The video lectures supplied with the study material which was more adapted and
focused to the learning habits and experience on today’s students rather than the
traditional study from the textbooks.
The AR application enables faster comprehension of complex spatial problems
and relationships which will benefit the students greatly during their learning
processes. Applying AR technology to support learning activities may become a trend
in the future not only for Engineering Graphics but also many other subjects.
However, the lack of financial resources at present situation prevents a further
development and implementation of this advanced technology in the study process.
Tests are useful tool for independent estimation of knowledge level of the
theoretical material. The compulsory tests facilitated increased students’ activities in
Moodle environment. This motivated the students to study more and superior in the
graphic literacy. The quality of engineering graphics education could be considerably
improved, but the preparation of the digitally usable materials in electronic form for
graphic subjects which contain a huge amount of engineering information, requires
enormous time and human resources.
6. REFERENCES
1. Keengwe J. Faculty Integration of Technology into Instruction and Students’
Perceptions of Computer Technology to Improve Student Learning. The
Journal of Information Technology Education, 2007, 6, p. 169-180.
2. Prensky M. Digital Natives, Digital Immigrants. On the Horizon, MCB
University Press, December 2001, 9, (6), p. 23-29.
3. Veide Z., Stroževa V., Dobelis M. Moodle Learning System in Education
Process of Riga Technical University. Applied Geometry and Graphics: The
Interdepartmental Collection of Proceedings of the 8th Crimean International
Scientific-Practical Conference Geometrical and Computer Simulation: Safe-
Energy, Ecology, Design. SED-11, September 26-30, 2011, Ukraine,
Simferopol, p. 298-303.
4. Cascaval R. C., Fogler K. A., Abrams G. D., Durham R. L. Evaluating the
Benefits of Providing Archived Online Lectures to In-Class Math Students.
Journal of Asynchronous Learning Networks, 2008, 12, (3-4), p. 61-70.
5. Redondo E., Navarro I., Sánchez A., Fonseca D. Augmented Reality on
Architectural and Building Engineering Learning Processes. Two Study
Cases. Special Issue on Visual Interfaces and User Experience: new
approaches. Ubiquitous Computing and Communication Journal, 2011,
p. 1269-1279.
The 12 th International Conference on Engineering Graphics
BALTGRAF 2013 June 5-7, 2013, Riga, Latvia
243/300
IMPROVEMENT CONCEPT OF ENGINEERING
GRAPHICS COURSE
Violeta VILKEVIČ1
1. ABSTRACT
Engineering graphics takes up an important place among technical disciplines
because knowledge and practical skills acquired in this course will be used not only
in the studying process, but also professional work. Successful studying of graphics
requires theoretical material to be constantly updated and properly prepared tasks.
The main goal of this work is to suggest model of graphics task performance that not
only improve the absorption of knowledge, but also form computer design skills. The
essence of improving graphics course is the continuity of the work, meaning the work
done by the student is used in solving subsequent tasks.
KEYWORDS: Engineering Graphics, 3D Modelling, Technical Drawings
2. INTRODUCTION
Theoretical fundamentals of engineering graphics barely change, but the
methods of presenting information to the students do (slides, animations, e-learning)
[1-2]. The practical methods of solving graphical tasks keep constantly evolving.
With the discovery of a new tool – computer and usage of new graphical systems,
graphical tasks or ways to perform them also had to change. For example: a part of
traditional works of engineering graphics are no longer performed (drawing fonts) or
performed with the help of computers (geometric drawing).The evolution of design
programs provided a wide and various range of opportunities of drafting and editing
drawings. With the decrease of hours dedicated for classes the volume of practical
works and their solving methods also changed. Furthermore, students these days have
mastered information technology, so methods of computer design are also quite
quickly and easily absorbed. All of this predisposes constant and consistent
improvement of engineering graphics course [3-4].
3. TASK COMPLETION MODEL
The course of engineering graphics in the Vilnius Gediminas Technical
University is taught during two semesters (in the second and third semester). The
course is divided into two parts – general engineering graphics and applied graphics.
1 Dep. of Engineering Graphics, Vilnius GediminasTechnical University, Saulėtekio al.11, LT-10223,
Vilnius-40, Lithuania, e-mail: [email protected]
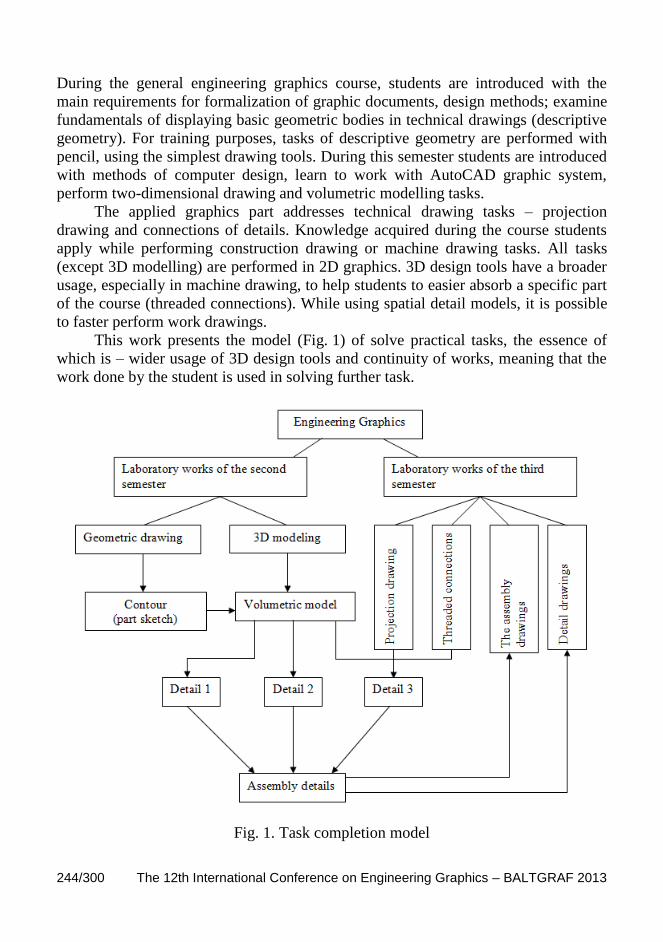
244/300 The 12th International Conference on Engineering Graphics – BALTGRAF 2013
During the general engineering graphics course, students are introduced with the
main requirements for formalization of graphic documents, design methods; examine
fundamentals of displaying basic geometric bodies in technical drawings (descriptive
geometry). For training purposes, tasks of descriptive geometry are performed with
pencil, using the simplest drawing tools. During this semester students are introduced
with methods of computer design, learn to work with AutoCAD graphic system,
perform two-dimensional drawing and volumetric modelling tasks.
The applied graphics part addresses technical drawing tasks – projection
drawing and connections of details. Knowledge acquired during the course students
apply while performing construction drawing or machine drawing tasks. All tasks
(except 3D modelling) are performed in 2D graphics. 3D design tools have a broader
usage, especially in machine drawing, to help students to easier absorb a specific part
of the course (threaded connections). While using spatial detail models, it is possible
to faster perform work drawings.
This work presents the model (Fig. 1) of solve practical tasks, the essence of
which is – wider usage of 3D design tools and continuity of works, meaning that the
work done by the student is used in solving further task.
Fig. 1. Task completion model

BALTGRAF 2013 – The 12th International Conference on Engineering Graphics 245/300
4. FEATURES OF THE MODEL REALISATION
The main goal of engineering graphics – teach to picture three-dimensional
objects on the flat surface, to create and read drawings according to standard
requirements. Step by step, by solving practical tasks of the graphic course one is
getting closer to this goal. Every task has a purpose to practically realize a specific
theoretical part of the course. By using this graphic task model, the solved task is later
on adapted while mastering other course material. In the part of general engineering
graphics, students have to perform two laboratory works. The first one is geometric
drawing task. Since it is performed with the help of AutoCAD program, student is
introduced with computer drawing tools, learns to display smooth connections, mark
dimensions and format the drawing. When using the new task solving model, 2D
model would be used as the sketch to make a volumetric model of the detail (Fig. 2a).
a) b) c)
Fig. 2. Volumetric modelling:
a) sketch; b) model obtained after stretching the contour;
c) model obtained after rotating the contour
The second laboratory work of the semester is volumetric design. By applying
different ways of modelling, not one but a couple of 3D models can be created, which
would be used in the second semester to make connections of details.
Laboratory work of applied graphics – technical drawing tasks (projection
drawing, demountable joints, mechanical drawing). While solving tasks of projection
drawing, students learn to choose images, arrange them on the drawing, and make
cuts in one and multiple parallel planes. Solved projection drawing tasks can also be
successfully used to create models of volumetric details. Next theme of this semester
– threaded details, demountable and non-demountable joints, types of screws,
viewing and marking of screws. In order to help for the students to better absorb
theoretical information, a new task can be given – to form a thread in 3D details,
when diameter, length and pitch of the thread are known (Fig. 3).
The last subject of applied graphics – mechanical drawings. The goal of this
part is to teach to read and detail assembly drawings, make work drawings of details,
mark dimensions. Practical assembly drawing (6-10 details) task is performed [5] and
work drawings of two details are created.
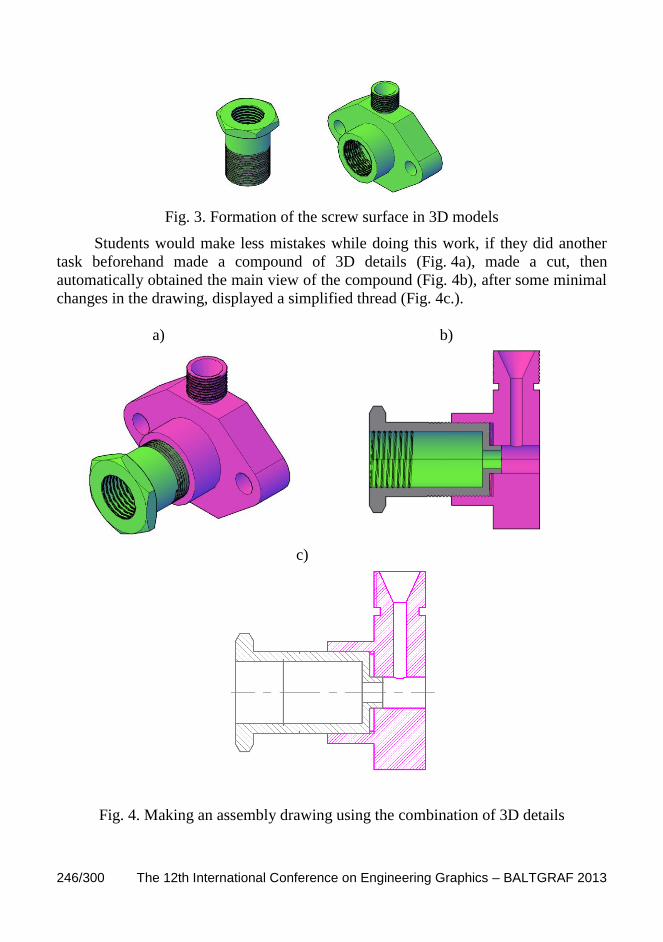
246/300 The 12th International Conference on Engineering Graphics – BALTGRAF 2013
Fig. 3. Formation of the screw surface in 3D models
Students would make less mistakes while doing this work, if they did another
task beforehand made a compound of 3D details (Fig. 4a), made a cut, then
automatically obtained the main view of the compound (Fig. 4b), after some minimal
changes in the drawing, displayed a simplified thread (Fig. 4c.).
a) b)
c)
Fig. 4. Making an assembly drawing using the combination of 3D details

BALTGRAF 2013 – The 12th International Conference on Engineering Graphics 247/300
The same principle can be applied while making a drawing of every detail.
Since 3D models of details are created during the course of studying graphics, these
tasks require minimal amounts of time and effort. Volumetric models also can be
successfully used for drawing sketches of details.
5. CONCLUSIONS
3D design tools have a broader usage, especially in machine drawing, to help
students to easier absorb a specific part of the course (threaded connections).
When using already completed work in solving other tasks, in the same time
bigger amounts and more diverse tasks can be solved.
Only after solving a sufficient amount of tasks corresponding to real
situations, skills allowing to solve other practical tasks can be obtained.
6. REFERENCES
1. Keršys R. Animation in Descriptive Geometry Teaching. Engineering
Graphics BALTGRAF-9. Proceeding of the Ninth International Conference,
Riga, Latvia, June 5-6, 2008, p. 196-200.
2. Špilaitė-Ramoškienė V. Usage of Interactive Teaching Equipment in Lectures
of Projection. Engineering and computer graphics. Proceedings of
Conference. Kaunas: Akademija, 2012, p. 74-79. (in Lithuanian).
3. Makutėnienė D., Čiupaila L., Zemkauskas J. The Model of Fundamental
Engineering Graphics Course. Engineering and Computer Graphics.
Proceedings of conference. Kaunas: Akademija, 2012, p. 24-47. (in
Lithuanian).
4. Makutėnienė D., Čiupaila L., Zemkauskas J. Peculiarities of Modelling of
Applied Engineering Graphics Course. Engineering and Computer Graphics.
Proceedings of Conference. Kaunas: Akademija, 2012, p. 48-54. (in
Lithuanian).
5. Rimkevičienė Z., Uljanovienė S.-D., Gerdžiūnas P., Lemkė V., Plakys V.
Mašinų braižyba: surinkimo brėžinių detalizavimo užduotys ir metodikos
nurodymai. Vilnius: Technika, 2005. -225 p: brėž. (in Lithuanian).

248/300 The 12th International Conference on Engineering Graphics – BALTGRAF 2013

The 12 th International Conference on Engineering Graphics
BALTGRAF 2013 June 5-7, 2013, Riga, Latvia
249/300
THE AUTOMATED SYSTEM FOR LEARNING OF
INNOVATIVE COURSE IN DESCRIPTIVE GEOMETRY
Vladimir VOLKOV1, Olga ILYASOVA
2, Natalya KAYGORODSEVA
3
1. ABSTRACT
This innovative method of training involves improving the methods of self-education.
It could help students who can’t attend a class or if there is a special format of
education, e.g. distance or E-learning. In that regard, there is an interest to create an
Automated Learning System (ALS) for such students. Such approach is introduced to
the example of teaching the course of descriptive geometry in the current article.
The ALS contains a theoretical material, practical exercises with hints of a possible
solution algorithms and tests. The ALS corresponds to the content of innovative
course of descriptive geometry on the basis of geometric modelling. This innovative
course allows students to develop the flexibility of a spatial imagination and the
logical thinking which is necessary in engineering education.
And student should consolidate his knowledge through practical problems as he got
to know a particular section of the innovative course.
KEYWORDS: Descriptive Geometry, Automated Learning System, Analysis and
Synthesis of Geometric Problems
2. INTRODUCTION
Now there are various forms of students training: full-time and part-time,
daytime and evening, classroom and distance. In that connection, there is a necessary
to develop a training system which can be used in all these forms of education and be
of great benefit to distance learning.
3. BASIC INFORMATION
This ALS is based on continuous monitoring of the understanding innovative
course for students. The problems are split by level of difficulty, and tests proposed to
1 Dep. of Descriptive Geometry, Engineering and Computer Graphics, Siberian State Automobile
and Highway Academy, pr. Mira 5, Omsk, 644080, Russia, e-mail: [email protected] 2 Dep. of Descriptive Geometry, Engineering and Computer Graphics, Siberian State Automobile and
Highway Academy, pr. Mira 5, Omsk, 644080, Russia, e-mail: [email protected] 3 Dep. of Engineering Geometry and CAD, Omsk State Technical University, pr. Mira 11, Omsk,
644050, Russia, e-mail: [email protected]

250/300 The 12th International Conference on Engineering Graphics – BALTGRAF 2013
students in order to assess quality understanding of each section of the course. This
feature allows the student to determine the level and quality of their learning of
descriptive geometry.
The proposed Automated Learning System has a standard user interface
(Fig. 1). We used Microsoft PowerPoint as its shell program. Initially, the user gets
acquainted with rules of working for the ALS (Fig. 2). After that he can select the
tools to solve problems. The two most common CAD-systems are offered as a tool in
the ALS. It's AutoCAD (produced by USA) and Compass (produced by Russia)
(Fig. 3).
Fig. 1. The ALS interface
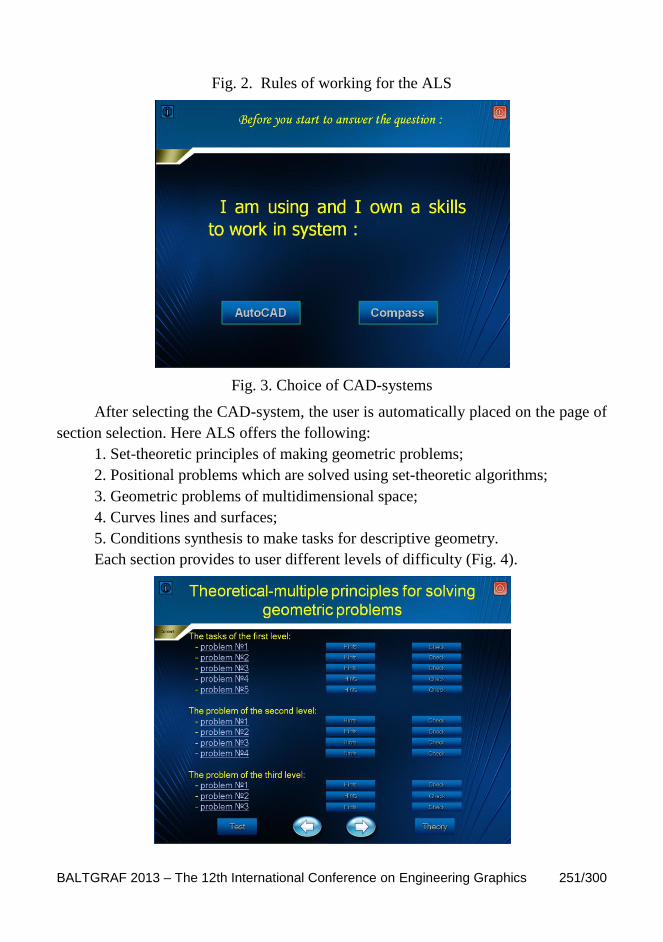
BALTGRAF 2013 – The 12th International Conference on Engineering Graphics 251/300
Fig. 2. Rules of working for the ALS
Fig. 3. Choice of CAD-systems
After selecting the CAD-system, the user is automatically placed on the page of
section selection. Here ALS offers the following:
1. Set-theoretic principles of making geometric problems;
2. Positional problems which are solved using set-theoretic algorithms;
3. Geometric problems of multidimensional space;
4. Curves lines and surfaces;
5. Conditions synthesis to make tasks for descriptive geometry.
Each section provides to user different levels of difficulty (Fig. 4).
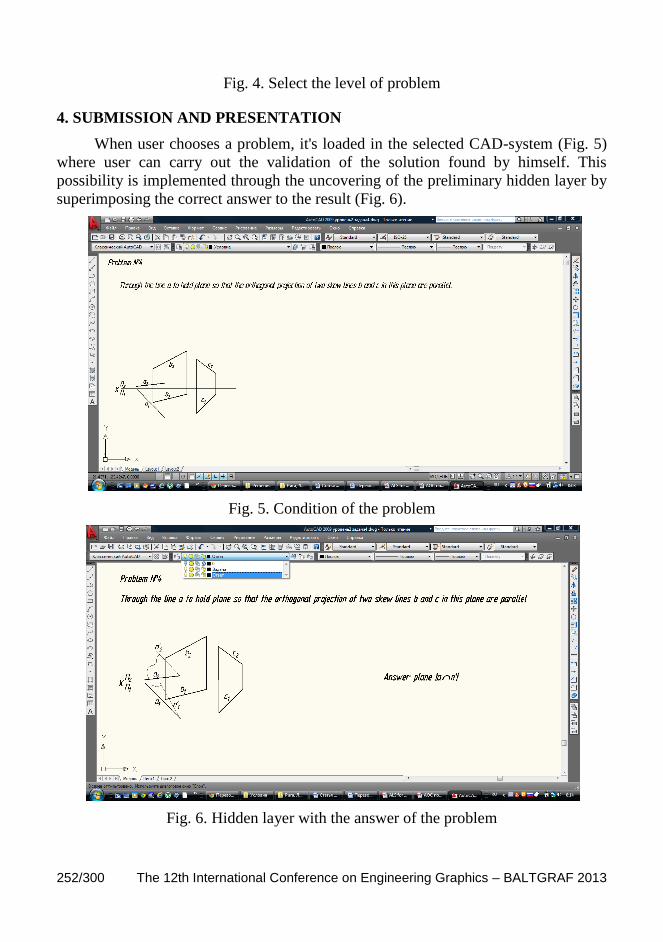
252/300 The 12th International Conference on Engineering Graphics – BALTGRAF 2013
Fig. 4. Select the level of problem
4. SUBMISSION AND PRESENTATION
When user chooses a problem, it's loaded in the selected CAD-system (Fig. 5)
where user can carry out the validation of the solution found by himself. This
possibility is implemented through the uncovering of the preliminary hidden layer by
superimposing the correct answer to the result (Fig. 6).
Fig. 5. Condition of the problem
Fig. 6. Hidden layer with the answer of the problem

BALTGRAF 2013 – The 12th International Conference on Engineering Graphics 253/300
If a user has difficulty in solving the problem, he can go to the link "Hits"
(Fig. 4) and he will get an algorithm solving the problem (Fig. 7).
Fig. 7. Algorithm solving the problem
Also there is a link to the appropriate section of the textbook where student can
get theoretical material (Fig. 8).
Fig. 8. Theoretical material which is relevant to the problem
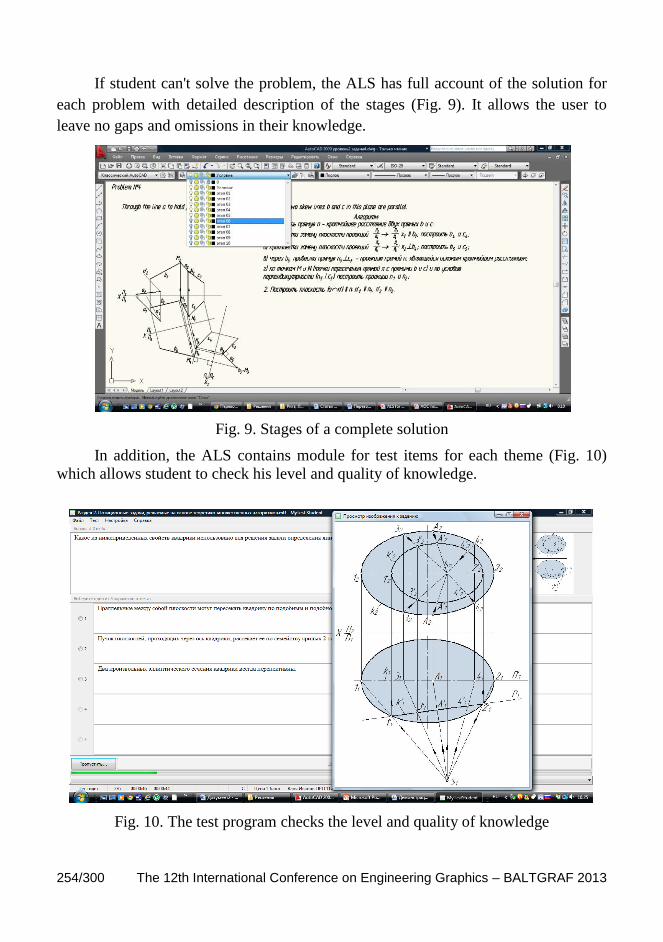
254/300 The 12th International Conference on Engineering Graphics – BALTGRAF 2013
If student can't solve the problem, the ALS has full account of the solution for
each problem with detailed description of the stages (Fig. 9). It allows the user to
leave no gaps and omissions in their knowledge.
Fig. 9. Stages of a complete solution
In addition, the ALS contains module for test items for each theme (Fig. 10)
which allows student to check his level and quality of knowledge.
Fig. 10. The test program checks the level and quality of knowledge

BALTGRAF 2013 – The 12th International Conference on Engineering Graphics 255/300
The general idea of the structure of the ALS can be obtained through the block
diagram, which shown in Fig. 11.
Fig. 11. A block diagram of the solution in the ALS
Is the Solution
Obtained?
Task
Test
the Solution
+
–
Is the Solution
True?
Do you Need
the Hint? Hint + –
+ –
See the
Theory
–
Theory
+
The Turnkey
Solution
The End

256/300 The 12th International Conference on Engineering Graphics – BALTGRAF 2013
5. CONCLUSIONS
The presented method of self-education can be the basis for the study of graphic
disciplines, such as engineering graphics, engineering or technology of computer
graphics and other graphic disciplines.
The ALS presented in this article will help students to study the innovative
course of descriptive geometry based on geometric modelling.
6. REFERENCES
1. Volkov V. Ya. Graphics Optimization Models of Multivariate Processes: a
monograph/ V. Ya. Volkov, M. A. Chizhik. Omsk, Omsk State Service
University, 2009. -101 pp. (in Russian).
2. Volkov V. Ya. Multivariate Enumerative Geometry: A monograph/
V. Ya. Volkov, V. Yu. Yurkov. Omsk, Omsk State Pedagogical University,
2008. -244 pp. (in Russian).
3. Volkov V. Ya. The Theory of Parameterization and Modelling of Geometric
Objects of Multidimensional Spaces and its Applications. Abstract. Thesis of
Doctor of engineering science/ V. Ya. Volkov. Moscow: Aviation Institute,
1983. -27 pp. (in Russian).
4. Lopatnikov L. I. Economics and Mathematics Dictionary: Dictionary of
modern economics/ L. I. Lopatnikov. – 5th ed., Revised. and add. Moscow:
Delo, 2003. -520 pp. (in Russian).
5. Rosenfeld B. A. Multidimensional Space/ B.A. Rosenfeld. Moscow: Nauka,
1966. -647 pp. (in Russian).
6. Chetverukhin N.F. Parameterization and its Applications in Geometry/
N. F. Chetverukhin, L. Jackiewicz/ Mathematics in School, 1963, № 5, p. 15-
23. (in Russian).
7. Grassmann H. Die lineare Ausdehnungslehre ein neuer Zaweig der
Mathematik/ H. Grassmann. Leipzig, 1844. -279 S. (in German).
8. Schubert H. Kalkul der Abzahlenden Geometrie/ H. Schubert. – Berlin,
Heidelberg, New-York: Springer Verlag, 1979. -349 S. (in German).
The 12 th International Conference on Engineering Graphics
BALTGRAF 2013 June 5-7, 2013, Riga, Latvia
257/300
GRAPHICAL COMPETENCE IN ENGINEERING SCIENCES
Olaf VRONSKY1
1. ABSTRACT
Experts of Eurydice have pointed out that the development of competence implies the
ability of individuals to mobilize, use, and integrate the acquired knowledge in
complex, varied and unpredictable in advance situations [3]. The article determines
and motivates criteria of competences of descriptive and graphical geometry and their
importance in the structure of professional competences of engineering sciences. In
the present investigation, criteria of competences are understood as the level of
student’s knowledge, skills, attitude, and spatial thinking of graphical competence. To
substantiate criteria of competences of graphical and descriptive geometry, the
concept of competence, its structure, and content were analysed. The required
competences for the descriptive geometry course were determined of which, in its
turn, the students’ level of graphical competence is dependent on. Graphical
competence is required in professional activities of every engineer.
KEYWORDS: Engineering Professional Competences, Graphical Competence,
Descriptive Geometry Competence
2. INTRODUCTION
The competence researchers include in its structure such elements as
knowledge, skills, abilities, motivation, attitude, values, responsibility, experience,
qualities of character, and thinking.
Analysing materials prepared by the European and Latvian working groups,
A. Rauhvargers found out an approach in the field of competence: competence is the
body of knowledge, skills and attitude that qualifies performance of tasks of certain
type or level [4]. The above mentioned author recommends the term competence
translating into Latvian as proficiency (expertise) emphasizing the practical use of
understanding of competence.
Dz. Ravens is of the opinion that competence is a specific ability, which is
needed for an effective performance of a particular activity in a particular field
including a narrow specialized knowledge, specific skills, and way of thinking as well
as understanding of responsibility of one’s own activity [7].
1 Institute of Mechanics, Faculty of Engineering, Latvia University of Agriculture, J. Cakstes bulv. 5,
Jelgava LV-3001, Latvia, e-mail: [email protected]

258/300 The 12th International Conference on Engineering Graphics – BALTGRAF 2013
B. Briede in her studies indicates that competence is a very complex concept
because it is mainly used to characterize the person’s intellectual potential and
significantly developed qualities. In Latin, the word competent is competo, i.e. to be
capable, to match, and be useful for. B. Briede defines competence as a body of
knowledge (formal, non-formal, informal), skills and reflection abilities which are
possible to check documentary, and with such activities in which the individual
agrees to be active in participating with a sense of responsibility [1].
Analysing researchers’ opinions, the author has drawn a conclusion that
actually there are four directions of competences to be developed:
1. Direction associated with man’s intellectual development based on
quantitative academic knowledge acquired as a result of formal, non-formal
and informal education;
2. Direction associated with man’s professional activity based on skills that are
acquired as a result of practical activities;
3. Direction associated with man’s social activity based on the attitude to
oneself, work and society;
4. Direction associated with the way of thinking.
3. BASIC COMPETENCE
Eurydice experts point out that traditionally basic competences have been
associated with professional education; however, experts of most part of the EU
countries have recognized the importance of development of basic competences for
all pupils irrespectively of the type of education they receive. As a result this concept
is broadened relating it to the general education too.
Eurydice investigations name those competences as the basic ones which they
consider necessary for successful participation in society throughout the lifetime. Also,
Eurydice emphasizes that people transfer their acquired knowledge and skills into
competences by their attitude. Furthermore, basic competences are called competences
that are necessary for a good life, and these competences are something more than just
knowledge and they make “know-how” forms not “know-what” forms [3].
The author agrees to the experts’ opinion because in the study course of
descriptive geometry it is not enough to have “know-what” knowledge, and the
student can acquire the course only if he also applies “know-how” forms.
After several meetings in autumn 2001 and spring 2002, the expert group
suggested eight main fields of basic competences: communication in the native
language; communication in foreign languages; information and communication
technologies; arithmetic skills and competences in mathematics, natural sciences and
technologies; entrepreneurship; interpersonal and civic competences; learning to learn
skills; general culture.
Without these fields of competences the becoming student will not be able to
adapt himself to society during the course of studies. The author considers natural

BALTGRAF 2013 – The 12th International Conference on Engineering Graphics 259/300
sciences and learning to learn skills as two most essential fields of basic competences
required in the study course of descriptive geometry.
4. PROFESSIONAL COMPETENCE
B. Gurshinsky expresses his opinion philosophically that within the educational
conception professional competence in any field of activity is a result of a certain
level of education: the category of professional competence is determined by one’s
professional education, experience, and man’s individual capacities, his motivated
aspirations for a continuous self-education, self-development, and creative and
responsible attitude to activity [5].
J. Kotochitova’s model of competence hierarchy comprises six competence
types: knowledge, activities, communicative, emotional, personality, and creativity
competence, moreover the principle of succession must be observed during the
acquisition of particular competences [6].
The process of competence development is also associated with ethical
competence (interrelationships), intellectual competence (logical thinking, analysing
skills), methodical and informative competence [2].
Having analysed the educators’ conclusions, the author of the article
determined the following criteria of professional competence of engineering sciences:
professional knowledge (machine designing and production, construction, wood
processing etc.), professional skills (skills to apply professional knowledge in the
field of profession), technical thinking (application of logical, graphical and spatial
thinking in solving technical problems), and attitude (interest in various engineering
project implementation).
5. GRAPHICAL COMPETENCE
E. Jutumova has worked out a concept of geometric graphical expertise and its
structure. The above mentioned author relates geometric graphical expertise to the
minimum of education in a particular field when the student knows such specific
activity ways as modelling, comparing, analysis, synthesis, deduction, induction, and
planning. Geometric graphical education includes such components as selectivity in
the deepened issues and quality component of the particular field that is the level of
knowledge and skills based on spatial thinking.
In her studies, as structural elements of geometric graphical competence
E. Jutumova has used the level of professional activity skills, the development level of
cognitive capacity, value orientation, and communication level in the particular field.
Within the framework of E. Jutumova’s research, geometric graphical competence is
regarded as the level of student’s knowledge and skills based on developed spatial
thinking [8].
E. Jutumova’s described element of spatial thinking is more related to the study
courses where you need a spatial imagination of a situation. Since graphical
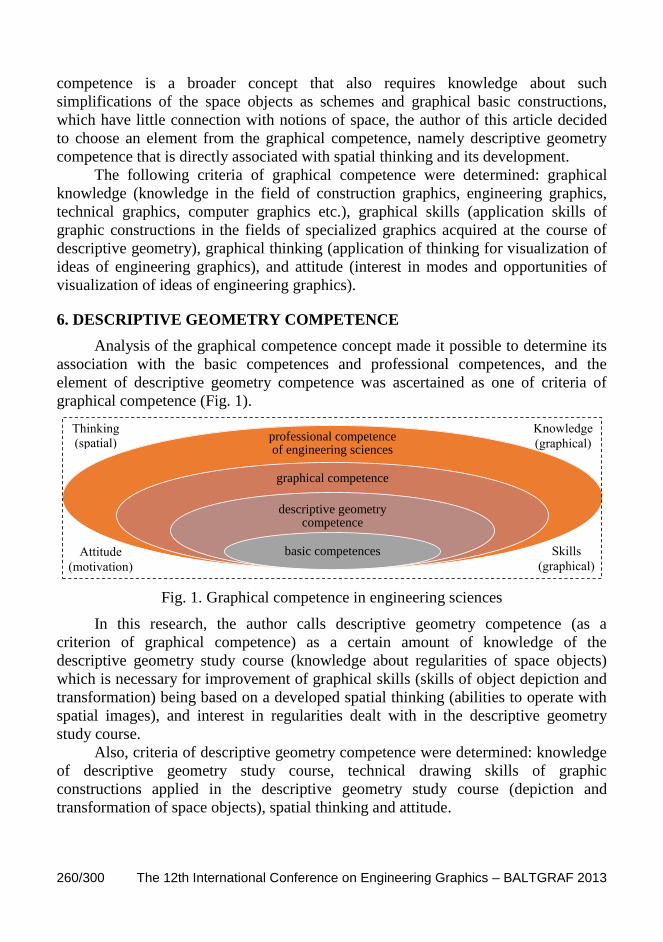
260/300 The 12th International Conference on Engineering Graphics – BALTGRAF 2013
competence is a broader concept that also requires knowledge about such
simplifications of the space objects as schemes and graphical basic constructions,
which have little connection with notions of space, the author of this article decided
to choose an element from the graphical competence, namely descriptive geometry
competence that is directly associated with spatial thinking and its development.
The following criteria of graphical competence were determined: graphical
knowledge (knowledge in the field of construction graphics, engineering graphics,
technical graphics, computer graphics etc.), graphical skills (application skills of
graphic constructions in the fields of specialized graphics acquired at the course of
descriptive geometry), graphical thinking (application of thinking for visualization of
ideas of engineering graphics), and attitude (interest in modes and opportunities of
visualization of ideas of engineering graphics).
6. DESCRIPTIVE GEOMETRY COMPETENCE
Analysis of the graphical competence concept made it possible to determine its
association with the basic competences and professional competences, and the
element of descriptive geometry competence was ascertained as one of criteria of
graphical competence (Fig. 1).
Fig. 1. Graphical competence in engineering sciences
In this research, the author calls descriptive geometry competence (as a
criterion of graphical competence) as a certain amount of knowledge of the
descriptive geometry study course (knowledge about regularities of space objects)
which is necessary for improvement of graphical skills (skills of object depiction and
transformation) being based on a developed spatial thinking (abilities to operate with
spatial images), and interest in regularities dealt with in the descriptive geometry
study course.
Also, criteria of descriptive geometry competence were determined: knowledge
of descriptive geometry study course, technical drawing skills of graphic
constructions applied in the descriptive geometry study course (depiction and
transformation of space objects), spatial thinking and attitude.
professional competence of engineering sciences
graphical competence
descriptive geometry competence
basic competences
Thinking
(spatial)
Skills
(graphical)
Knowledge
(graphical)
Attitude
(motivation)

BALTGRAF 2013 – The 12th International Conference on Engineering Graphics 261/300
7. RESULTS OF THE RESEARCH
The research was carried out as a qualitative one, and the nominal measurement
scale complies with it. Nine experts of the studied field from the Latvian University
of Agriculture, Riga Technical University, Daugavpils University, and Rezekne
Higher School participated in the study.
Basing on the theoretical investigations, several questions were formulated for
the experts comprising those of engineering professional, graphical and descriptive
geometry competence.
The questionnaire method was applied, and experts’ opinion was found out about
the component regularities and their significance of professional competences of
engineering sciences in the field of graphics. Experts’ opinion is presented in Figure 2.
1. Graphical competence is a significant component of professional competence of
engineering sciences;
2. Descriptive geometry competence is a significant component of graphical
competence;
3. Basic competences are a significant component of descriptive geometry.
Fig. 2. Evaluation of component regularities of professional competences
of engineering sciences
Also, the experts’ opinion was found out about criteria of each component,
which the author had chosen after theoretical literature studies. Experts’ opinion is
presented in Figure 3.
100
70
50
0
30
50
0 0 0 0
20
40
60
80
100
120
1 2 3
freq
uen
cy o
f re
spo
nse
s, %
totally agree
partially agree
disagree
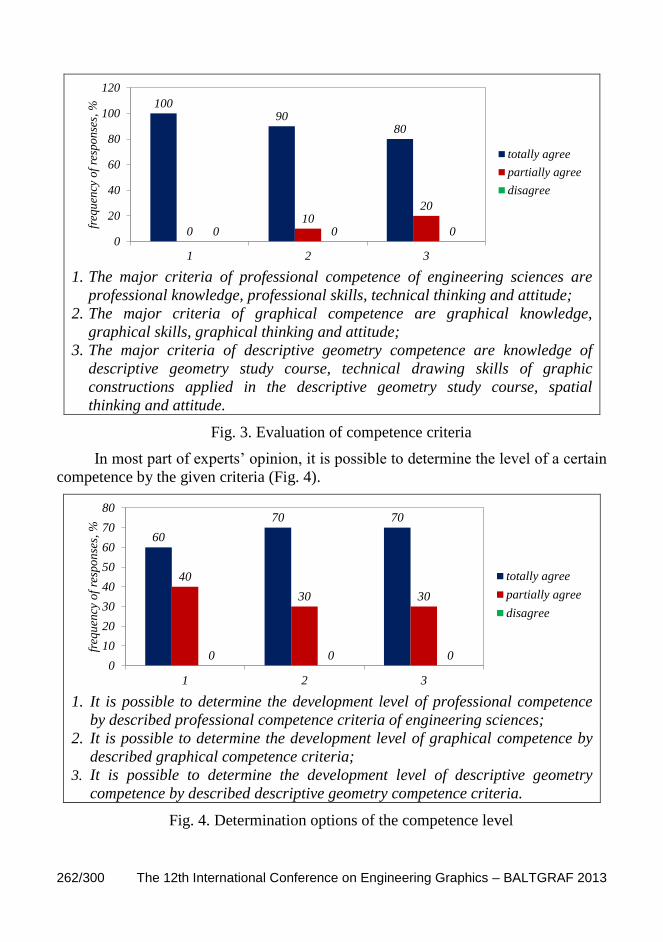
262/300 The 12th International Conference on Engineering Graphics – BALTGRAF 2013
1. The major criteria of professional competence of engineering sciences are
professional knowledge, professional skills, technical thinking and attitude;
2. The major criteria of graphical competence are graphical knowledge,
graphical skills, graphical thinking and attitude;
3. The major criteria of descriptive geometry competence are knowledge of
descriptive geometry study course, technical drawing skills of graphic
constructions applied in the descriptive geometry study course, spatial
thinking and attitude.
Fig. 3. Evaluation of competence criteria
In most part of experts’ opinion, it is possible to determine the level of a certain
competence by the given criteria (Fig. 4).
1. It is possible to determine the development level of professional competence
by described professional competence criteria of engineering sciences;
2. It is possible to determine the development level of graphical competence by
described graphical competence criteria;
3. It is possible to determine the development level of descriptive geometry
competence by described descriptive geometry competence criteria.
Fig. 4. Determination options of the competence level
100 90
80
0 10
20
0 0 0 0
20
40
60
80
100
120
1 2 3
freq
uen
cy o
f re
spo
nse
s, %
totally agree
partially agree
disagree
60
70 70
40
30 30
0 0 0 0
10
20
30
40
50
60
70
80
1 2 3
freq
uen
cy o
f re
spo
nse
s, %
totally agree
partially agree
disagree

BALTGRAF 2013 – The 12th International Conference on Engineering Graphics 263/300
Experts recommended adding quality and logical thinking criteria to those of
the descriptive geometry competence criteria, but the competence criteria of
engineering sciences – planning, organizational and self-evaluation skills.
8. CONCLUSION
Based on the obtained results of analyses of the competence structures, the
following element system was established:
1. Level of knowledge of the study course;
2. Level of skills within the extent of study course knowledge;
3. Development level of spatial thinking (cognitive abilities);
4. Level of attitude.
To determine the level of graphical competence it is necessary to determine
levels of all four elements of graphical competence system.
The highest level of graphical competence can be reached if the student knows
how to apply the acquired knowledge and skills into professional activity, i.e.
designing.
9. REFERENCES
1. Briede B. Problems of Reaching Competence During Studies at a Higher
School. Journal of Science Education, 2004, Nr. 5 (1), p. 8-12.
2. Garleja, R. Cilvēkpotenciāls sociālā vidē. Rīga: RaKa, 2006. -199 lpp. (in
Latvian).
3. Pamatkompetences. Jauns jēdziens vispārējā obligātajā izglītībā.
http://www.aic.lv/ar/gramatas/Eurydice_pamatkompetences_Latviski.pdf. 2002,
[access Jul 5, 2012]. (in Latvian).
4. Rauhvargers A. Veidojot kvalifikāciju ietvarstruktūru Latvijas augstākajai
izglītībai. Darba dokuments Latvijas mēroga diskusiju uzsākšanai.
http://www.aic.lv/bolona/Latvija/Atsev_prez/LV_FRame24012005.pdf. 2004.
[access Jul 12, 2011]. (in Latvian).
5. Gershunskij B. S. The Phylosofy of Education in the 21st Century. Moskow:
Sovershenstvo, 1998. -608 pp. (in Russian).
6. Kotochitova E. V. Psychological peculiarities of creative pedagogical
thinking. Summary of Candidate’s Dissertation in Psychological Sciences.
Yaroslavl: Yaroslavl State University, 2001. -24 pp. (in Russian).
7. Raven D. Competence in modern society. Identification, Development and
Implementation. Moscow: Kogito-Centre, 2002. -396 c. (in Russian).
8. Jutumova E. G. Formation of Geometric-Graphic Competence of Students of
the Technical Universities by Means of Computer Technologies. Thesis of
Candidate’s Dissertation in Pedagogical Sciences. Moscow: RGB,
2005. -212 pp. (in Russian).

264/300 The 12th International Conference on Engineering Graphics – BALTGRAF 2013

The 12 th International Conference on Engineering Graphics
BALTGRAF 2013 June 5-7, 2013, Riga, Latvia
265/300
SUPPLEMENT A
MATERIALS ABOUT THE EXIBITION
“ZANIS WALDHEIMS’ GEOMETRICAL ABSTRACTION”
ZANIS WALDHEIMS: GIVING MEANING TO
ABSTRACT ART – A NON CONFORMIST APPROACH
OR THE PATHWAY TO SELF-RELIANCE
BY YVES JEANSON
SUMMARY BIOGRAPHY OF
ZANIS WALDHEIMS (1909-1993)
BY YVES JEANSON
PARTIAL VIEWS OF ZANIS WALDHEIMS COLLECTION
GIVING MEANING TO ABSTRACT ART
BY YVES JEANSON

266/300 The 12th International Conference on Engineering Graphics – BALTGRAF 2013
The 12 th International Conference on Engineering Graphics
BALTGRAF 2013 June 5-7, 2013, Riga, Latvia
267/300
ZANIS WALDHEIMS: GIVING MEANING TO
ABSTRACT ART – A NON CONFORMIST APPROACH
OR THE PATHWAY TO SELF-RELIANCE
Yves JEANSON1
THE SCHOCK
In the mid 1950's Latvian immigrant Zanis Waldheims (Žanis Valdheims)
established in Montreal Canada in 1952, is beginning to build the foundations for a
method of orientation to recover from the tribulations of the times.
The post war events had made a profound wound on this humanist and lawyer
from University of Riga. He could not understand, why, in 1944 at the Yalta
Conference, the democratic occidental powers of the West had let go to the dictatorial
communists regime of the East, free, rich and democratic countries against their will
of which his native land Latvia that had fought and won its independence in the
1920s.
He could not understand what went wrong in the minds of the occidental
political leaders in their terrifying inability to foresee the consequences of their act
that degenerated in the cold war.
In this post war chaotic world, he will try to regain faith in human nature and
this will lead him to develop in the 1950s and 60s an original artistic and
philosophical approach oriented for the study and representation of ideas, that is to
say, the development of a visual and structural approach based on geometry and
mathematic as an abstraction.
A FIRST IDEA AND ITS HEURISTIC DEVELOPMENT
An idea from Maine de Biran, a French pioneer in psychology, “in the creation
of a map for human orientation” will trigger his quest for this map. Having a fertile
geometrical ability and imagination, he will draw in the margins of the scientific
books he read, geometrical figures to which he will associate meaning, that is to say,
geometrical figures such as the square, the circle, the diamond, the XY axis and the
point to represent concepts. A sentence from Edmund Husserl’s search in
phenomenology "that absolute reality corresponds exactly to a round square" will also
have a strong impact in the development of his ideas, He will use the “round square”
metaphor and transform it from the outside to the inside by a series of convex and
concave figures that will generate a series of primary geometrical forms such as the
circle, the diamond, the XY axis and the point. He will use this idea to represent the
1 Freelancer, Montreal, Canada, e-mail: [email protected]
268/300 The 12th International Conference on Engineering Graphics – BALTGRAF 2013
notion of limits. He will also take form philosophy the concepts of extensive and
intensive, respectively the square as being extensive, and the point as being intensive,
it will also bring ground to his philosophical argumentation, that equilibrium lies
between two extremes which will be illustrated by the diamond figure. One can see in
Waldheims his large size colour drawings, the recurrence of the diamond.
He will finally push one step further into abstraction, by associating this idea of
extremes and limits, to words, that will bear for him the concepts of extensive and
intensive associated to geometrical forms to create ethical opposites and in a dynamic
intellectual process, find a meaningful word that will integrate the two extremes in
man’s quest for meaning.
WRITING HIS THESIS
After having experienced and structured his original approach towards the
understanding of knowledge in general, he will take, in the 1960s, a full time ten year
period to lay down his ideas on paper. Zanis Waldheims thesis is deployed in two
principal sections: the first section of twenty-two chapters with foreword, and thirty-
three figures; and a second section containing three hundred and fourteen small
graphics.
One can follow in the first section of the thesis, the intellectual structure he will
use to explain his model of orientation. Here are the titles: Geometrisation (9 pp.);
Extension and Intensity (7 pp.); The empirical plan (3 pp.); Order (8 pp.); The square
(2 pp.); The fundamental degrees (3 pp.); The limitation (2 pp.); Centration (2 pp.);
Complementarity ( 4 pp.); The exhaustion (3 pp.); Transformation (4 pp.); The
correspondences (1 p.); Totality (1 p.); The unit of sense (7 pp.); The unified sense
(8 pp.); The structures (2 pp.); The control system (5 pp.); The abstractions (7 pp.);
The symbolic sense (9 pp.); The grouping of words (11 pp.); The orientation principle
(8 pp.); The unification theory (4 pp.). He will have his thesis copyrighted in Ottawa,
Canada in 1970. This theory will be his pathway and model to self-reliance in his
quest for truth and security of existence.
THE FUTURE OF AN ABSTRACT IDEA
Geometrical forms and structures, the notion of limits in mathematics, 2D and
3D, colours and meaning in Waldheims art that seems to suggest that there is a
graphic language which is in a direct rapport with our psyche that intuitively perceive
harmony and beauty and that the future resides in the visualisation of ideas to make
man more conscious of the elements at stake in the approach toward the solution of
problems concerning mankind and as the great poet Goethe once declared “One
should draw more and more, write less and less”.
BALTGRAF 2013 – The 12th International Conference on Engineering Graphics 269/300
NATIONAL AND INTERNATIONAL DIFFUSION OF ZANIS WALDHEIMS
IDEAS
2006 The Frank Lloyd Wright School of Architecture, Scottsdale, Arizona,
USA.
2008 20th Biennial Congress of the International Association of Empirical
Aesthetics, Chicago, Illinois, United States of America. Title: Aesthetic and
Psychology into the Future. Followed an invitation at the Saratov State
Technical University in Russia in 2009.
2010 21st Biennial Congress of the International Association of Empirical
Aesthetics, Dresden, Germany. Title: Aesthetics and Design. Followed an
invitation to Chongqing Southwest University in China in 2011, and Taipei,
Taiwan in 2012 for the 22nd
Biennial Congress of the IAEA held at the
National Chiao Tung University.
2012 15th
International Conference on Geometry and Graphics at McGill
University, Montreal, Canada. ICGG 2012.
2012 OCMA (Ontario Colleges Mathematics Association) Orillia, Ontario,
Canada, with the collaboration of a mathematics teacher from Boreal
Community College in Sudbury, Ontario, Canada.
2012 Fields Institute, Toronto University, Toronto. Ontario, Canada, with the
collaboration of a mathematics teacher from Boreal Community College in
Sudbury, Ontario, Canada.
2013 BALTGRAF 2013, The 12th
International Conference on Engineering
Graphics, Riga Technical University, Riga, Latvia.
NATIONAL AND INTERNATIONAL ART EXHIBITIONS
1976 (February). First solo exhibition at the Lachine Public Library,
Lachine, Quebec, Canada. Title: The Up-motion of Consciousness. One
hundred drawings are exhibited. Yves Jeanson organiser.
1981 (November). Second solo exhibition at École de la Pommeraie in
Mont St-Hilaire, Quebec, Canada. A hundred drawings are exhibited, also a
dozen small Styrofoam sculptures. Yves Jeanson organiser.
1983 (November). Third solo exhibition at Collège Brébeuf in Montreal,
Quebec, Canada. Fifty original drawings are exhibited also fifty small
Styrofoam sculptures. Yves Jeanson collaborator.
1988 (November). Exhibition at the Latvian Community Centre in Lachine,
Quebec, Canada. Original drawings, bas-reliefs and mini-sculptures Yves
Jeanson collaborator.
270/300 The 12th International Conference on Engineering Graphics – BALTGRAF 2013
1992 (November). Participation of Zanis Waldheims at the collective
exhibition L’Art populaire urbain (Urban popular Art) at the Maison de la
culture Frontenac in Montreal, Quebec, Canada, also held at the Lachine
Museum. Yves Jeanson initiator and collaborator.
2003 (November). Yves Jeanson, winner First Prize in sculpture at the Gala
Internationale des Arts Visuels, Montreal. Quebec, Canada. (Sculptural
reproduction in glass spheres of Zanis Waldheims original drawing # 142).
2004 (June). Exhibition of glass sculpture #142 in Pons, France.
2005 (January). Exhibition of glass sculpture #142 at the Kheireddine Palace
in Tunis, Tunisia, organized in collaboration with the Canadian Embassy in
Tunis.
2006 (November). Exhibition of glass sculpture #142 at the Frank Lloyd
Wright School of Architecture in Scottsdale, Arizona, United States of
America, (3rd Annual Design and Development Conference).
2008 (August). Poster session and exhibition of glass sculpture #142 and
poster session at the 20th Biennial Congress of the IAEA (International
Association of Empirical Aesthetics) in Chicago, Illinois, USA.
2010 (August). Poster session and bas-reliefs exhibition at the 21st Biennial
Congress of the IAEA (International Association of Empirical Aesthetics) in
Dresden, Germany.
2012 (May). Ontario Community Colleges Mathematics Association, Orillia
Ontario, Canada.
2012 (August). The 15th International Conference on Geometry and
Graphics 2012 at McGill University, Montreal, Canada.
2012 (November). Fields Institute, Toronto University, Toronto, Canada.
2013 (June) BALTGRAF 2013, The 12th
International Conference on
Engineering Graphics at Riga Technical University, Riga, Latvia.
PUBLICATIONS
1992 Article on Zanis Waldheims in an art book published in Latvia.
2003 (Winter issue). Article on Yves Jeanson’s glass sculpture #142 in the
Canadian arts magazine ESPACE SCULPTURE.
2010 (October). Yves Jeanson's name and glass sculpture #142 are
mentioned in the special issue of the Journal of the International Association
of Empirical Aesthetics.
The 12 th International Conference on Engineering Graphics
BALTGRAF 2013 June 5-7, 2013, Riga, Latvia
271/300
SUMMARY BIOGRAPHY OF
ZANIS WALDHEIMS (1909-1993)
Yves JEANSON1
Sept 19, 1909: Birth of the twin brothers Zanis (Žanis) and Alfred (Alfrēds)
Waldheims (Valdheims), born in Jaunpils in the province of Zemgale in
Latvia, sons of Ernest (Ernests) Waldheims, (1881-1935) whose parents
were of Polish origin, and their mother of Latvian origin Pauline Kakstins
(Paulīne Kakstiņš), (1879-1954). His father’s parents had a Polish name
which ended by Sky. His father's parents died young, and his father Ernest
was adopted by a German family bearing the name of Waldheims. During
his military service in Germany, Ernest leaves and abandons his patron to
live free. The family lived in the region of Sloka until 1914.
June, 1915: His father is mobilized by the army of the Czar Nicolas II as foot
soldier during the war; the German Army had invaded the Latvia’s territory.
August, 1915: During the war, the family takes refuge at their uncle's place
who lives in St-Petersburg. They had fled the German Army offensive
launched on the city of Riga (Rīga). One of his uncles is in the surrounding
of the leaders of the future Russian revolution: Lenin, Stalin and Trotsky.
February, 1916: Death in Finland, of Elmars (Elmārs) his youngest brother
from the consequences of a bad pneumonia. In the flat where they lived, they
had to break blocks of ice in the morning in order to boil water.
October, 1917: Desertion of his father from the Russian army which is in full
dispersion. His father re-joins his family in St-Petersburg. Quarrels occur
between his father and his uncle due to diametrical differences in point of
view on political issues. His father is Menchevic (меньшевик), and his uncle
is Bolshevik (большевик).
Spring, 1918: Return of the family in Riga, in the midst of a famine. His
father must take refuge and hide in the forest, while his mother works in
German canteens to feed the family. She has to walk long distances twice a
day to go to her work.
November, 1918. Armistice. They leave the city of Riga to return to Sloka.
His father smokes fish which he sells or exchanges for meat and vegetables
from the farmers.
During the War of liberation of Latvia, his father returns to fight with
Latvia's Nationalists, against the Germans, the White Russians and the Red
1 Freelancer, Montreal, Canada, e-mail: [email protected]
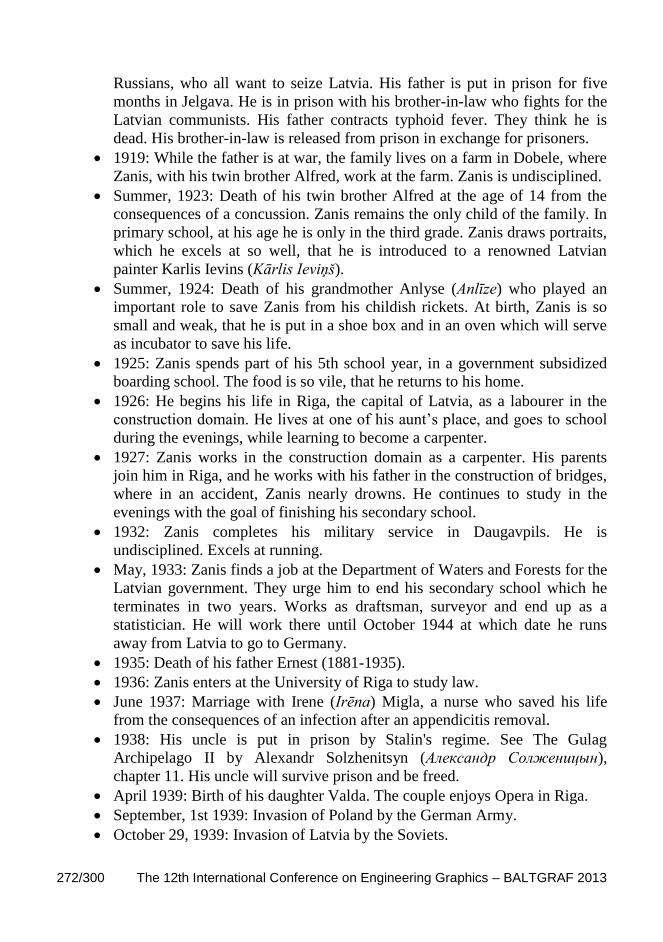
272/300 The 12th International Conference on Engineering Graphics – BALTGRAF 2013
Russians, who all want to seize Latvia. His father is put in prison for five
months in Jelgava. He is in prison with his brother-in-law who fights for the
Latvian communists. His father contracts typhoid fever. They think he is
dead. His brother-in-law is released from prison in exchange for prisoners.
1919: While the father is at war, the family lives on a farm in Dobele, where
Zanis, with his twin brother Alfred, work at the farm. Zanis is undisciplined.
Summer, 1923: Death of his twin brother Alfred at the age of 14 from the
consequences of a concussion. Zanis remains the only child of the family. In
primary school, at his age he is only in the third grade. Zanis draws portraits,
which he excels at so well, that he is introduced to a renowned Latvian
painter Karlis Ievins (Kārlis Ieviņš).
Summer, 1924: Death of his grandmother Anlyse (Anlīze) who played an
important role to save Zanis from his childish rickets. At birth, Zanis is so
small and weak, that he is put in a shoe box and in an oven which will serve
as incubator to save his life.
1925: Zanis spends part of his 5th school year, in a government subsidized
boarding school. The food is so vile, that he returns to his home.
1926: He begins his life in Riga, the capital of Latvia, as a labourer in the
construction domain. He lives at one of his aunt’s place, and goes to school
during the evenings, while learning to become a carpenter.
1927: Zanis works in the construction domain as a carpenter. His parents
join him in Riga, and he works with his father in the construction of bridges,
where in an accident, Zanis nearly drowns. He continues to study in the
evenings with the goal of finishing his secondary school.
1932: Zanis completes his military service in Daugavpils. He is
undisciplined. Excels at running.
May, 1933: Zanis finds a job at the Department of Waters and Forests for the
Latvian government. They urge him to end his secondary school which he
terminates in two years. Works as draftsman, surveyor and end up as a
statistician. He will work there until October 1944 at which date he runs
away from Latvia to go to Germany.
1935: Death of his father Ernest (1881-1935).
1936: Zanis enters at the University of Riga to study law.
June 1937: Marriage with Irene (Irēna) Migla, a nurse who saved his life
from the consequences of an infection after an appendicitis removal.
1938: His uncle is put in prison by Stalin's regime. See The Gulag
Archipelago II by Alexandr Solzhenitsyn (Александр Солженицын),
chapter 11. His uncle will survive prison and be freed.
April 1939: Birth of his daughter Valda. The couple enjoys Opera in Riga.
September, 1st 1939: Invasion of Poland by the German Army.
October 29, 1939: Invasion of Latvia by the Soviets.
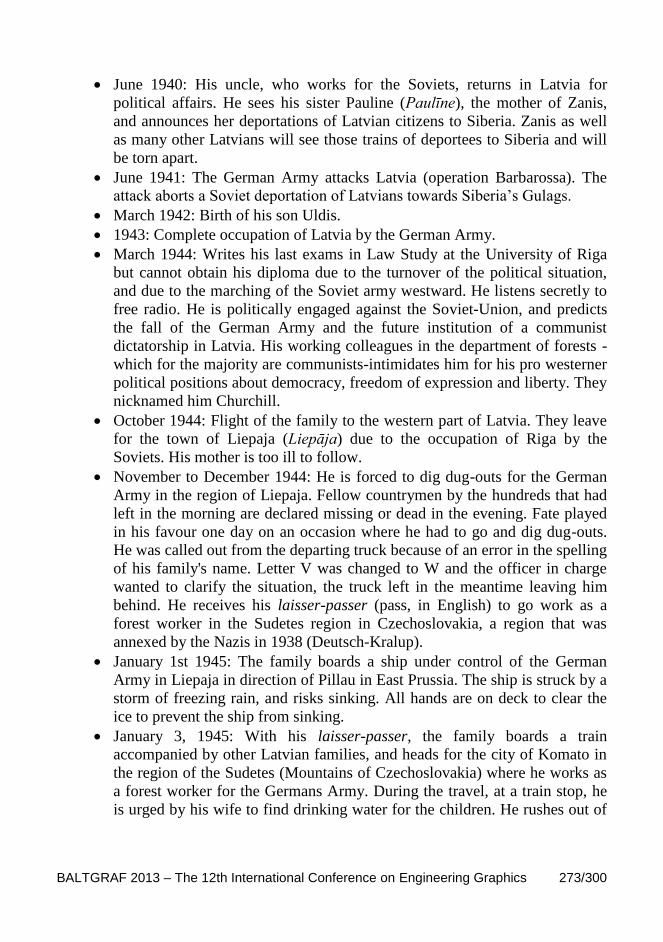
BALTGRAF 2013 – The 12th International Conference on Engineering Graphics 273/300
June 1940: His uncle, who works for the Soviets, returns in Latvia for
political affairs. He sees his sister Pauline (Paulīne), the mother of Zanis,
and announces her deportations of Latvian citizens to Siberia. Zanis as well
as many other Latvians will see those trains of deportees to Siberia and will
be torn apart.
June 1941: The German Army attacks Latvia (operation Barbarossa). The
attack aborts a Soviet deportation of Latvians towards Siberia’s Gulags.
March 1942: Birth of his son Uldis.
1943: Complete occupation of Latvia by the German Army.
March 1944: Writes his last exams in Law Study at the University of Riga
but cannot obtain his diploma due to the turnover of the political situation,
and due to the marching of the Soviet army westward. He listens secretly to
free radio. He is politically engaged against the Soviet-Union, and predicts
the fall of the German Army and the future institution of a communist
dictatorship in Latvia. His working colleagues in the department of forests -
which for the majority are communists-intimidates him for his pro westerner
political positions about democracy, freedom of expression and liberty. They
nicknamed him Churchill.
October 1944: Flight of the family to the western part of Latvia. They leave
for the town of Liepaja (Liepāja) due to the occupation of Riga by the
Soviets. His mother is too ill to follow.
November to December 1944: He is forced to dig dug-outs for the German
Army in the region of Liepaja. Fellow countrymen by the hundreds that had
left in the morning are declared missing or dead in the evening. Fate played
in his favour one day on an occasion where he had to go and dig dug-outs.
He was called out from the departing truck because of an error in the spelling
of his family's name. Letter V was changed to W and the officer in charge
wanted to clarify the situation, the truck left in the meantime leaving him
behind. He receives his laisser-passer (pass, in English) to go work as a
forest worker in the Sudetes region in Czechoslovakia, a region that was
annexed by the Nazis in 1938 (Deutsch-Kralup).
January 1st 1945: The family boards a ship under control of the German
Army in Liepaja in direction of Pillau in East Prussia. The ship is struck by a
storm of freezing rain, and risks sinking. All hands are on deck to clear the
ice to prevent the ship from sinking.
January 3, 1945: With his laisser-passer, the family boards a train
accompanied by other Latvian families, and heads for the city of Komato in
the region of the Sudetes (Mountains of Czechoslovakia) where he works as
a forest worker for the Germans Army. During the travel, at a train stop, he
is urged by his wife to find drinking water for the children. He rushes out of
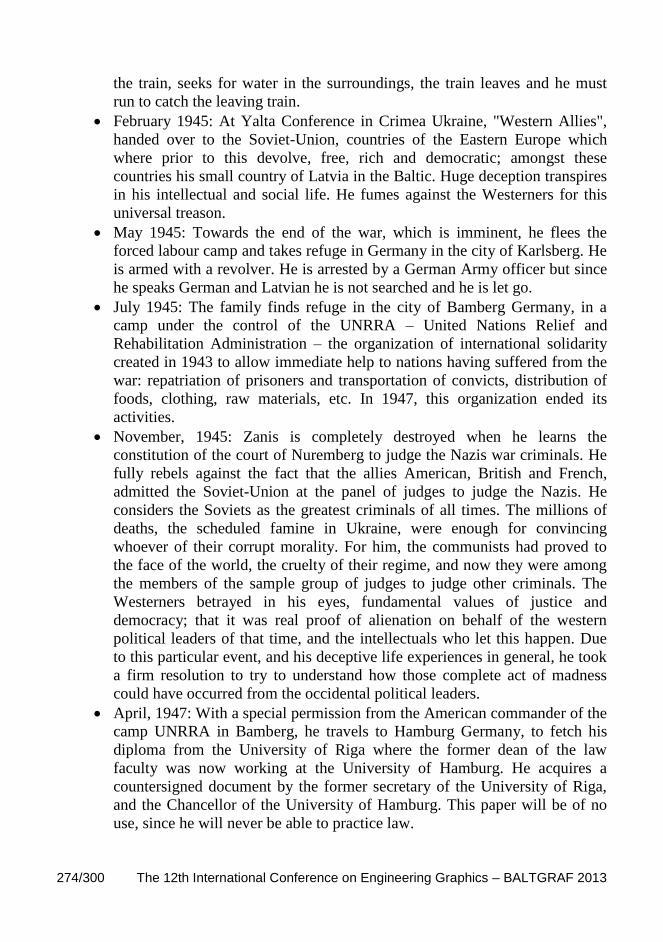
274/300 The 12th International Conference on Engineering Graphics – BALTGRAF 2013
the train, seeks for water in the surroundings, the train leaves and he must
run to catch the leaving train.
February 1945: At Yalta Conference in Crimea Ukraine, "Western Allies",
handed over to the Soviet-Union, countries of the Eastern Europe which
where prior to this devolve, free, rich and democratic; amongst these
countries his small country of Latvia in the Baltic. Huge deception transpires
in his intellectual and social life. He fumes against the Westerners for this
universal treason.
May 1945: Towards the end of the war, which is imminent, he flees the
forced labour camp and takes refuge in Germany in the city of Karlsberg. He
is armed with a revolver. He is arrested by a German Army officer but since
he speaks German and Latvian he is not searched and he is let go.
July 1945: The family finds refuge in the city of Bamberg Germany, in a
camp under the control of the UNRRA – United Nations Relief and
Rehabilitation Administration – the organization of international solidarity
created in 1943 to allow immediate help to nations having suffered from the
war: repatriation of prisoners and transportation of convicts, distribution of
foods, clothing, raw materials, etc. In 1947, this organization ended its
activities.
November, 1945: Zanis is completely destroyed when he learns the
constitution of the court of Nuremberg to judge the Nazis war criminals. He
fully rebels against the fact that the allies American, British and French,
admitted the Soviet-Union at the panel of judges to judge the Nazis. He
considers the Soviets as the greatest criminals of all times. The millions of
deaths, the scheduled famine in Ukraine, were enough for convincing
whoever of their corrupt morality. For him, the communists had proved to
the face of the world, the cruelty of their regime, and now they were among
the members of the sample group of judges to judge other criminals. The
Westerners betrayed in his eyes, fundamental values of justice and
democracy; that it was real proof of alienation on behalf of the western
political leaders of that time, and the intellectuals who let this happen. Due
to this particular event, and his deceptive life experiences in general, he took
a firm resolution to try to understand how those complete act of madness
could have occurred from the occidental political leaders.
April, 1947: With a special permission from the American commander of the
camp UNRRA in Bamberg, he travels to Hamburg Germany, to fetch his
diploma from the University of Riga where the former dean of the law
faculty was now working at the University of Hamburg. He acquires a
countersigned document by the former secretary of the University of Riga,
and the Chancellor of the University of Hamburg. This paper will be of no
use, since he will never be able to practice law.
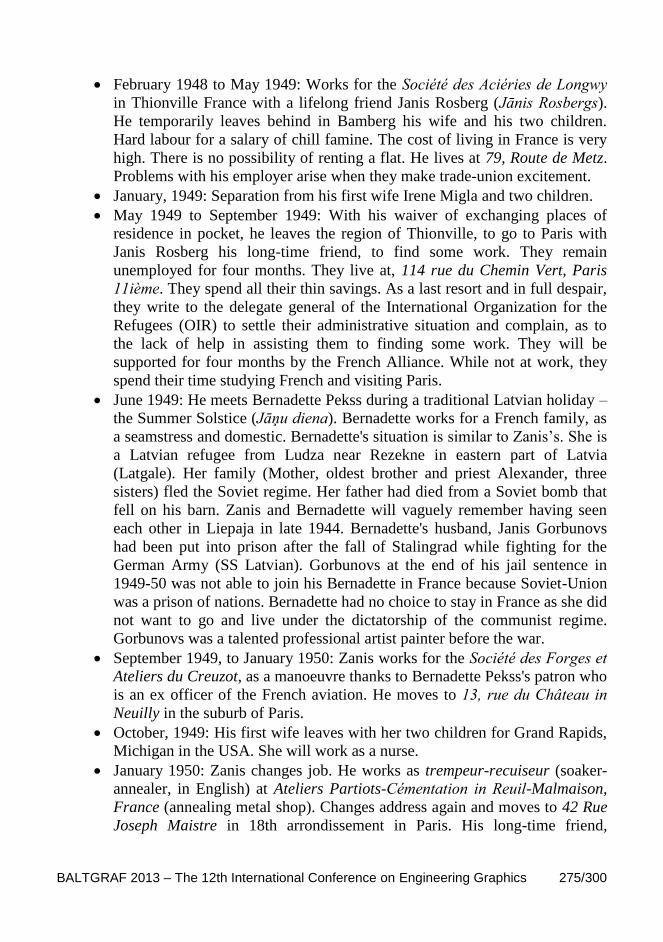
BALTGRAF 2013 – The 12th International Conference on Engineering Graphics 275/300
February 1948 to May 1949: Works for the Société des Aciéries de Longwy
in Thionville France with a lifelong friend Janis Rosberg (Jānis Rosbergs).
He temporarily leaves behind in Bamberg his wife and his two children.
Hard labour for a salary of chill famine. The cost of living in France is very
high. There is no possibility of renting a flat. He lives at 79, Route de Metz.
Problems with his employer arise when they make trade-union excitement.
January, 1949: Separation from his first wife Irene Migla and two children.
May 1949 to September 1949: With his waiver of exchanging places of
residence in pocket, he leaves the region of Thionville, to go to Paris with
Janis Rosberg his long-time friend, to find some work. They remain
unemployed for four months. They live at, 114 rue du Chemin Vert, Paris
11ième. They spend all their thin savings. As a last resort and in full despair,
they write to the delegate general of the International Organization for the
Refugees (OIR) to settle their administrative situation and complain, as to
the lack of help in assisting them to finding some work. They will be
supported for four months by the French Alliance. While not at work, they
spend their time studying French and visiting Paris.
June 1949: He meets Bernadette Pekss during a traditional Latvian holiday –
the Summer Solstice (Jāņu diena). Bernadette works for a French family, as
a seamstress and domestic. Bernadette's situation is similar to Zanis’s. She is
a Latvian refugee from Ludza near Rezekne in eastern part of Latvia
(Latgale). Her family (Mother, oldest brother and priest Alexander, three
sisters) fled the Soviet regime. Her father had died from a Soviet bomb that
fell on his barn. Zanis and Bernadette will vaguely remember having seen
each other in Liepaja in late 1944. Bernadette's husband, Janis Gorbunovs
had been put into prison after the fall of Stalingrad while fighting for the
German Army (SS Latvian). Gorbunovs at the end of his jail sentence in
1949-50 was not able to join his Bernadette in France because Soviet-Union
was a prison of nations. Bernadette had no choice to stay in France as she did
not want to go and live under the dictatorship of the communist regime.
Gorbunovs was a talented professional artist painter before the war.
September 1949, to January 1950: Zanis works for the Société des Forges et
Ateliers du Creuzot, as a manoeuvre thanks to Bernadette Pekss's patron who
is an ex officer of the French aviation. He moves to 13, rue du Château in
Neuilly in the suburb of Paris.
October, 1949: His first wife leaves with her two children for Grand Rapids,
Michigan in the USA. She will work as a nurse.
January 1950: Zanis changes job. He works as trempeur-recuiseur (soaker-
annealer, in English) at Ateliers Partiots-Cémentation in Reuil-Malmaison,
France (annealing metal shop). Changes address again and moves to 42 Rue
Joseph Maistre in 18th arrondissement in Paris. His long-time friend,
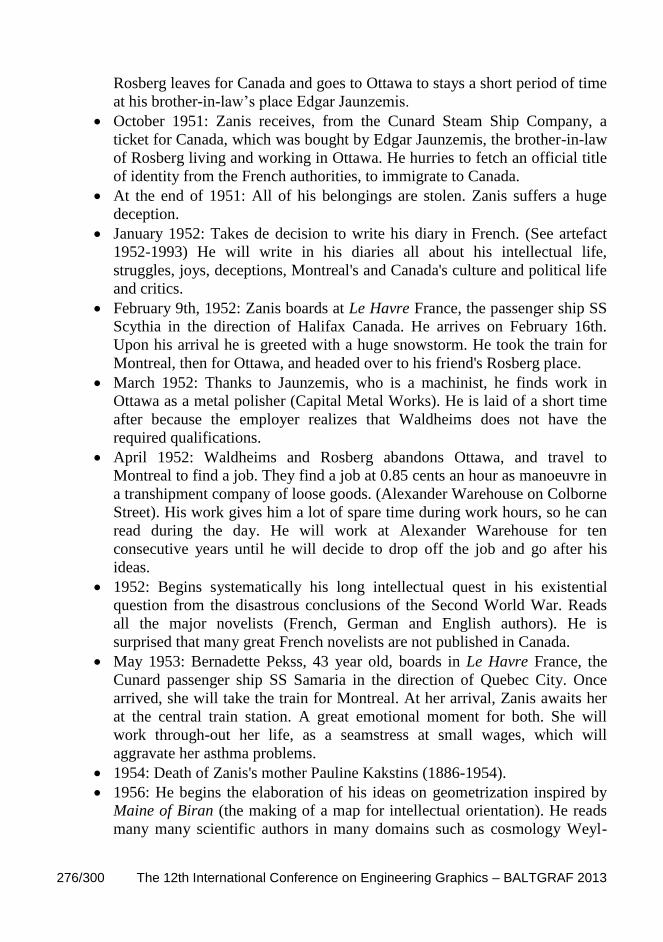
276/300 The 12th International Conference on Engineering Graphics – BALTGRAF 2013
Rosberg leaves for Canada and goes to Ottawa to stays a short period of time
at his brother-in-law’s place Edgar Jaunzemis.
October 1951: Zanis receives, from the Cunard Steam Ship Company, a
ticket for Canada, which was bought by Edgar Jaunzemis, the brother-in-law
of Rosberg living and working in Ottawa. He hurries to fetch an official title
of identity from the French authorities, to immigrate to Canada.
At the end of 1951: All of his belongings are stolen. Zanis suffers a huge
deception.
January 1952: Takes de decision to write his diary in French. (See artefact
1952-1993) He will write in his diaries all about his intellectual life,
struggles, joys, deceptions, Montreal's and Canada's culture and political life
and critics.
February 9th, 1952: Zanis boards at Le Havre France, the passenger ship SS
Scythia in the direction of Halifax Canada. He arrives on February 16th.
Upon his arrival he is greeted with a huge snowstorm. He took the train for
Montreal, then for Ottawa, and headed over to his friend's Rosberg place.
March 1952: Thanks to Jaunzemis, who is a machinist, he finds work in
Ottawa as a metal polisher (Capital Metal Works). He is laid of a short time
after because the employer realizes that Waldheims does not have the
required qualifications.
April 1952: Waldheims and Rosberg abandons Ottawa, and travel to
Montreal to find a job. They find a job at 0.85 cents an hour as manoeuvre in
a transhipment company of loose goods. (Alexander Warehouse on Colborne
Street). His work gives him a lot of spare time during work hours, so he can
read during the day. He will work at Alexander Warehouse for ten
consecutive years until he will decide to drop off the job and go after his
ideas.
1952: Begins systematically his long intellectual quest in his existential
question from the disastrous conclusions of the Second World War. Reads
all the major novelists (French, German and English authors). He is
surprised that many great French novelists are not published in Canada.
May 1953: Bernadette Pekss, 43 year old, boards in Le Havre France, the
Cunard passenger ship SS Samaria in the direction of Quebec City. Once
arrived, she will take the train for Montreal. At her arrival, Zanis awaits her
at the central train station. A great emotional moment for both. She will
work through-out her life, as a seamstress at small wages, which will
aggravate her asthma problems.
1954: Death of Zanis's mother Pauline Kakstins (1886-1954).
1956: He begins the elaboration of his ideas on geometrization inspired by
Maine of Biran (the making of a map for intellectual orientation). He reads
many many scientific authors in many domains such as cosmology Weyl-

BALTGRAF 2013 – The 12th International Conference on Engineering Graphics 277/300
Minskowski (idea on the parameters of a relative world) and in philosophy
among others E. Husserl (phenomenology) to quote only the main. He will
draw four years later his first "systematic plan". Extensive reading of the
scientific authors: Bergson, Beth, Piaget, Blanché, de Broglie, Cassirer,
Chambal, Chauchard, Couturat, Goldstein, Guichard, Guillaume, Hartman,
Heidegger, Heisenberg, James, Kant, Koehler, Lewin, Lupasco, Poincaré,
Ruyer, Russell, Weizsaecker, etc. who will be of great use as the base for his
further intellectual genesis that will lead him towards geometrical
abstraction.
1953-1961: Works very hard in the daytime as a manoeuvre at the
warehouse; works extremely hard in the evening at home in his research on
geometrization, even though his back is broken by the hard work and pain.
He will work with doggedness during his weekends and on his days off also.
In 1956, he developed the first sketches. Numerous problems with his first
wife in Grand Rapids Michigan that continually asks for money for her and
her two children.
1953-1961: Numerous correspondences with Latvian compatriots living in
Paris (Ilmar Anckaitis and Nikolajs Parups).
1960: He deploys the first "systematic plan" which will be the angular stone
of his metaphysical "invention". He will elaborate some 10 years later, his
theory of the “geometrization of the exhaustive thought”.
Note: The "systematic plan" will be more or less at that time, a square on
which will be integrated a set of concepts taken out from different scientific
sources with regards to the human nature. His domains of readings are
sociology, psychology, pure sciences, mathematics, biology, anthropology,
philosophy. The plan will include concepts of space and time; sensibility and
intelligibility; matter and energy. The left, the right, the top, the bottom of
his drawings, will all have their meanings. Other concepts are added:
transformation; outside, inside; input and output; extension and intensity;
middle term on which he will come to develop his main ideas on philosophy
where he will step directly in formal logic to contest its inhumane way of
treating mankind. (One or zero, Yes or no, right or wrong).
Between 1961-1972: Quits his job. He wants to dedicate himself full-time on
his ideas on geometrization. Very difficult period of time for ten consecutive
years. Only one income was being brought in by Bernadette who paid for
everything: food, rent, clothing, heating, books, colour crayons and paper, et
cetera. Bernadette on top of her hard work suffered from the disapproval of
her in-laws now living in Montreal (1955), and from her oldest brother
Alexander who was a catholic priest. He condemned their illegitimate
common life since 1953. In order not to rupture, in their moments of great
despair and isolation whether social or intellectual, their union remained

278/300 The 12th International Conference on Engineering Graphics – BALTGRAF 2013
strong and nothing could disrupt their love for one another. Zanis’s only
reward was his hard intellectual work, and the very small progress he made
in his ideas, progress which gave him immense intellectual satisfaction,
which also gave him the impression of being a pioneer in this adventure
aiming at the rehabilitation of moral values. He wanted the world to be a
better place, by inviting individuals to study his system of geometrical
analysis and aesthetics, to direct people in becoming artists and philosophers
themselves, and be more critical toward their programmed mind sets.
1963: He terminates a paper which he entitles “The Description of the Plan
of the Understanding”. This work is to be a detailed description of his
thoughts in thirteen chapters and 243 geometrical figures. This paper
includes a preface of four pages, and an explanatory text of 16 pages.
June 1963: He writes to the ambassador of France in Canada, of which a
letter for Charles de Gaule, president of the French Republic. He wishes to
seek the help of the French state to contact Professor Paul Chauchard,
whose work he appraises immensely. Professor Chauchard was during this
period Director of Studies at the School of the High Studies in Paris.
November 5th, 1963: He writes to Professor Paul Chauchard, and mentions
the immense respect which he has towards his high scientific morality. He
seeks his collaboration for his research. No answer. The end.
November 2nd, 1963: Marriage of Zanis and Bernadette in an Anglican
Church in Montreal.
1964: He writes a text "Exposition de mon projet”. He describes the purpose
of his project of geometrical abstraction. Good text. Also includes his
"Summary of my researches on the problem to build a geometrical system of
understanding, psychology and epistemology” (17 pages). Included are also
examples in 13 original drawings, one drawing per page with notes and
descriptions.
June 1964: He seeks the Canadian Company of the World Fair of 1967, with
the goal of proposing an exhibition project of his ideas and works. He thus
begins a correspondence which will result in many frustrations, and of their
refusal in April 1966, pleading that “…the time regrettably too short allows
us no change in the scenario of our pavilions, and secondly, the public who
will visit Expo 1967 is not specialized enough to appreciate these researches
far too technical”.
November 1964: With his savings fading rapidly, he makes a demand for
help at the Ministry of the Cultural affairs of Quebec, which replies denying
his request in February 1965, insisting that they could not help him "for the
moment". The end.

BALTGRAF 2013 – The 12th International Conference on Engineering Graphics 279/300
February, 1965: Seeks the director of the Museum of Contemporary Art of
Montreal with the aim of receiving help. Brief correspondence which
resulted in nothing. The end.
1960 -1965: Produces a set of 70 drawings 660×600 mm. Number 51-122.
February 1966: Consults an office of brand mark in Montreal with the aim of
patenting what is his invention. He is answered, that it is impossible to patent
such intellectual inventions. That patent cannot apply, except in the
mechanical or similar or chemical inventions. They suggest, all the same, to
obtaining a copyright on the description of his creation at the sum of $75.00
for registration fees. NOTE: in the statement of his idea to the office of
brand mark, he writes of an "art which looks for the harmony between the
beautiful and the truth in knowledge, as well as for the understanding
between the good and the fair”.
February 1966: Seeks the National Research Council of Canada. He sends
the same letter as the one sent previously to the office of brand mark. He
receives an answer, which suggests that he should try to discuss his ideas,
with some members of the Faculty of Psychology of the University of
Montreal.
Corresponds with his daughter Valda, who lives with her mother in the USA.
She wants to promote the ideas of her father at the University of Michigan.
No success.
March 1966: He writes to doctor Wilder Penfield, of the Montreal
Neurological Institute and Hospital, to ask him for his views on his research
work. Doctor Penfield replies amiably, that he cannot take charge of such
work, because he has other professional commitments but he makes the
effort to clarify in his letter: “Your very interesting manuscript has arrived
and I have looked through it with admiration for the care and the study that
you have shown, I unfortunately cannot give this work the attention it
deserves”. This letter will comfort him enormously, and will give him the
courage to continue in spite of its new disappointment.
March 1966: He writes to Doctor Donald O. Hebb, of the department of
psychology at the University of McGill to solicit his point of view on his
research work. Doctor Hebb answers is a refusal, as he is too engaged in
other works, however he too is very encouraging by writing him: “I have
read far enough to realize that this has a profoundly different approach from
any current theory, which means that it will require close attention and take
much time for its mastery and thus, I will be unable to study your work and
the elaboration of the ideas inherent in your beautiful designs”. Another sign
of encouragement, but still no assistance.
1966: Quarrel with the The Arts Council of Canada, which he had sought out
following an article which appeared in the La Presse newspaper, announcing
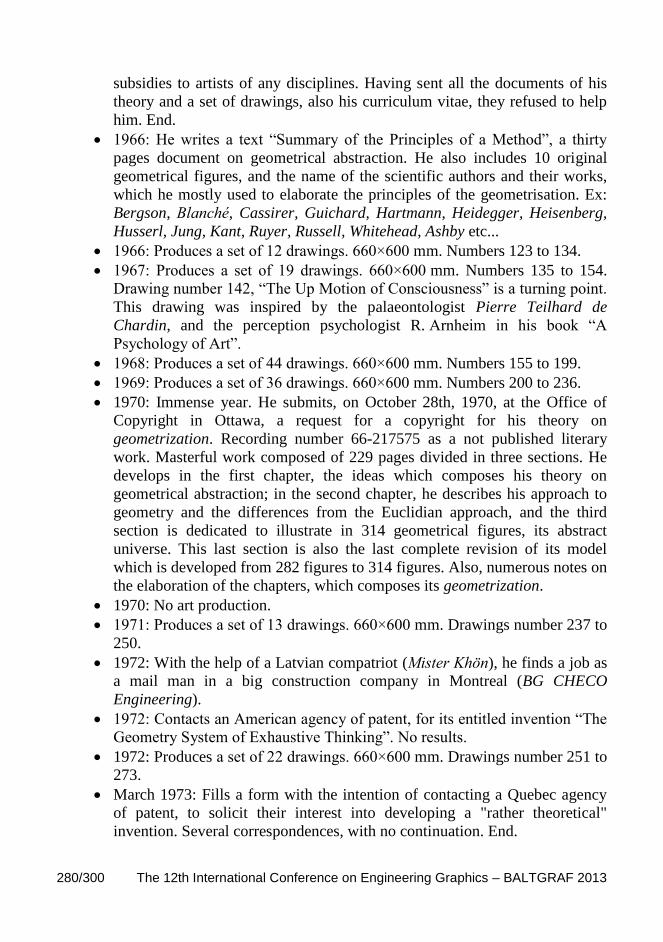
280/300 The 12th International Conference on Engineering Graphics – BALTGRAF 2013
subsidies to artists of any disciplines. Having sent all the documents of his
theory and a set of drawings, also his curriculum vitae, they refused to help
him. End.
1966: He writes a text “Summary of the Principles of a Method”, a thirty
pages document on geometrical abstraction. He also includes 10 original
geometrical figures, and the name of the scientific authors and their works,
which he mostly used to elaborate the principles of the geometrisation. Ex:
Bergson, Blanché, Cassirer, Guichard, Hartmann, Heidegger, Heisenberg,
Husserl, Jung, Kant, Ruyer, Russell, Whitehead, Ashby etc...
1966: Produces a set of 12 drawings. 660×600 mm. Numbers 123 to 134.
1967: Produces a set of 19 drawings. 660×600 mm. Numbers 135 to 154.
Drawing number 142, “The Up Motion of Consciousness” is a turning point.
This drawing was inspired by the palaeontologist Pierre Teilhard de
Chardin, and the perception psychologist R. Arnheim in his book “A
Psychology of Art”.
1968: Produces a set of 44 drawings. 660×600 mm. Numbers 155 to 199.
1969: Produces a set of 36 drawings. 660×600 mm. Numbers 200 to 236.
1970: Immense year. He submits, on October 28th, 1970, at the Office of
Copyright in Ottawa, a request for a copyright for his theory on
geometrization. Recording number 66-217575 as a not published literary
work. Masterful work composed of 229 pages divided in three sections. He
develops in the first chapter, the ideas which composes his theory on
geometrical abstraction; in the second chapter, he describes his approach to
geometry and the differences from the Euclidian approach, and the third
section is dedicated to illustrate in 314 geometrical figures, its abstract
universe. This last section is also the last complete revision of its model
which is developed from 282 figures to 314 figures. Also, numerous notes on
the elaboration of the chapters, which composes its geometrization.
1970: No art production.
1971: Produces a set of 13 drawings. 660×600 mm. Drawings number 237 to
250.
1972: With the help of a Latvian compatriot (Mister Khön), he finds a job as
a mail man in a big construction company in Montreal (BG CHECO
Engineering).
1972: Contacts an American agency of patent, for its entitled invention “The
Geometry System of Exhaustive Thinking”. No results.
1972: Produces a set of 22 drawings. 660×600 mm. Drawings number 251 to
273.
March 1973: Fills a form with the intention of contacting a Quebec agency
of patent, to solicit their interest into developing a "rather theoretical"
invention. Several correspondences, with no continuation. End.
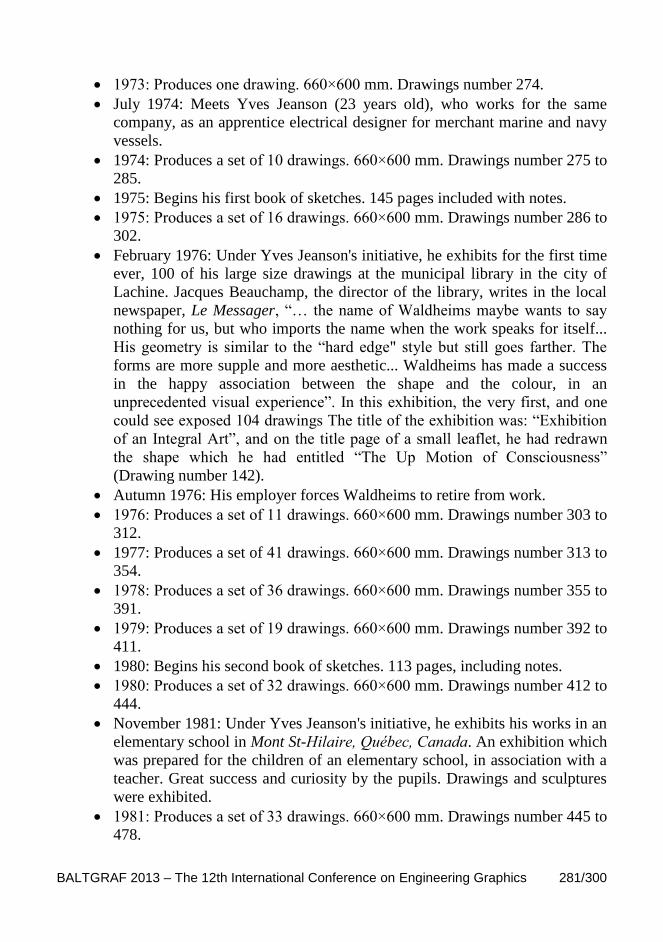
BALTGRAF 2013 – The 12th International Conference on Engineering Graphics 281/300
1973: Produces one drawing. 660×600 mm. Drawings number 274.
July 1974: Meets Yves Jeanson (23 years old), who works for the same
company, as an apprentice electrical designer for merchant marine and navy
vessels.
1974: Produces a set of 10 drawings. 660×600 mm. Drawings number 275 to
285.
1975: Begins his first book of sketches. 145 pages included with notes.
1975: Produces a set of 16 drawings. 660×600 mm. Drawings number 286 to
302.
February 1976: Under Yves Jeanson's initiative, he exhibits for the first time
ever, 100 of his large size drawings at the municipal library in the city of
Lachine. Jacques Beauchamp, the director of the library, writes in the local
newspaper, Le Messager, “… the name of Waldheims maybe wants to say
nothing for us, but who imports the name when the work speaks for itself...
His geometry is similar to the “hard edge" style but still goes farther. The
forms are more supple and more aesthetic... Waldheims has made a success
in the happy association between the shape and the colour, in an
unprecedented visual experience”. In this exhibition, the very first, and one
could see exposed 104 drawings The title of the exhibition was: “Exhibition
of an Integral Art”, and on the title page of a small leaflet, he had redrawn
the shape which he had entitled “The Up Motion of Consciousness”
(Drawing number 142).
Autumn 1976: His employer forces Waldheims to retire from work.
1976: Produces a set of 11 drawings. 660×600 mm. Drawings number 303 to
312.
1977: Produces a set of 41 drawings. 660×600 mm. Drawings number 313 to
354.
1978: Produces a set of 36 drawings. 660×600 mm. Drawings number 355 to
391.
1979: Produces a set of 19 drawings. 660×600 mm. Drawings number 392 to
411.
1980: Begins his second book of sketches. 113 pages, including notes.
1980: Produces a set of 32 drawings. 660×600 mm. Drawings number 412 to
444.
November 1981: Under Yves Jeanson's initiative, he exhibits his works in an
elementary school in Mont St-Hilaire, Québec, Canada. An exhibition which
was prepared for the children of an elementary school, in association with a
teacher. Great success and curiosity by the pupils. Drawings and sculptures
were exhibited.
1981: Produces a set of 33 drawings. 660×600 mm. Drawings number 445 to
478.

282/300 The 12th International Conference on Engineering Graphics – BALTGRAF 2013
September 1982: Exhibits his works and some of his miniature sculptures at
the College Jean de Bréboeuf in Montreal, Canada
1982: Produces a set of 28 drawings. 660×600 mm. Drawings number 479 to
507.
1983: Begins his third book of sketches. 119 pages including notes.
1983: Produces a set of 42 drawings. 660×600 mm. Drawings number 508 to
550.
1984: Produces a set of 42 drawings. 660×600mm. Drawings number 551 to
593. Writes for the members of the University of Old Age, of which he is a
member, a small interesting work on Wilhem Ostwald, a Latvian ex-fellow
countryman, and Nobel Prize winner in Chemistry in 1909, to demonstrate
that at any age it is possible to realize great projects. The paper is about
colour.
September 1985: Begins with Yves Jeanson, a baccalaureate program in
philosophy at the Université du Quebec in Montreal.
September 1985: Learns the death of his first wife Irene Migla.
1985: Produces a set of 24 drawings. 660×600 mm. Drawings number 594 to
618.
1986: Produces his last set of 5 drawings. 660×600 mm. Drawings number
619 to 623. Leaves for Europe to visit his godchild who lives in Western
Germany. Also travels to England to visit his cousin Lilly.
1987: Prepares a 50 page paper, where he sorts out his concepts to generalize
them even more. A section prepared with an introduction expressing what is
the geometrical unity of senses; carries on in a set of four drawings to
illustrate the decomposition of the Euclidian square into a round square,
(idea taken from the phenomenology of Husserl); gives an explanation in 23
particular figures how to understand his geometrical abstraction. He will
introduce a new approach by illustrating certain concepts in the form of
Cartesian geometry.
September 1988: He gets his baccalaureate in philosophy from the
Université du Quebec in Montreal. His results are: 7 A’s, 15 B’s, 6 C’s, 1 D
and 2 E’s.
1990: Writes a small paper, where he explains the main history behind his
artistic and philosophic method. Excellent poignant text, he also includes the
most significant sentences that impressed him: Maine of Biran, Goethe, René
Huyghe, Benda, Leonard de Vinci, Moles, Husserl, Whitehead, Read,
D. Donis, Broglie, Brion, Poincaré, Piaget, Vasarely and gives a rather
exhaustive bibliography of the main authors whom he read.
Spring 1991. Under Yves Jeanson's instigation, he begins to rewrite his
entire thesis of the geometrization of the exhaustive thought. He will work in
association with Yves Jeanson, who will correct his texts to have a better

BALTGRAF 2013 – The 12th International Conference on Engineering Graphics 283/300
comprehensibility. His final thesis makes twelve chapters, for a total of
about 450 pages including various drawings.
May 1992: Under Yves Jeanson's initiative, Zanis participates at an art
exhibition at the Maison de la Culture Frontenac in Montreal. Title: Art Brut
organized by Mrs. Pascale Galipeau, conservator and ethnologist. He gives
a conference on his art and his ideas.
July 1992: The Second phase of the exhibition “Art Brut” is held at the
Lachine Museum. Exhibition of original drawings and Styrofoam mini-
sculptures also Yves Jeanson’s 3D steel balls sculpture of collection drawing
# 142.
March 13th, 1993: Catholic marriage of Zanis and Bernadette in the church
of St Louis de France, Montreal Canada. First signs of cancer which will
bring him to his death.
July 19th, 1993: Death of Zanis Waldheims. He is buried in the cemetery of
the Côte des Neiges in Montreal. Land registry number L341.
June 23rd, 2002: Death of Bernadette Pekks at the age of 91 years old.
January 1st, 2009. Christopher Valdheims. 32 years old, law student at
UCLA in California, discovers by chance on the WEB, the story of his
grandfather Zanis Waldheims. During a search for his roots on the web, he
modifies letter V of his last name, for letter W, and fell on Yves Jeanson’s
promotional site on his grandfather Zanis. Christopher Valdheims, Valda
Valdheims’s son was adopted by the Tobin family while he was young. His
name will be changed for Jonathan Tobin.
June 2009. First visit of Jonathan Tobin in Montreal, Quebec, Canada.
August 2012. Second visit of Jonathan Tobin (now a California Lawyer) in
Montreal.
--------------The END-----------
Revised in April 2013, by Yves Jeanson, Montreal, Quebec, Canada.
Website: http://www.waldheims.net. e-mail: [email protected]

284/300 The 12th International Conference on Engineering Graphics – BALTGRAF 2013
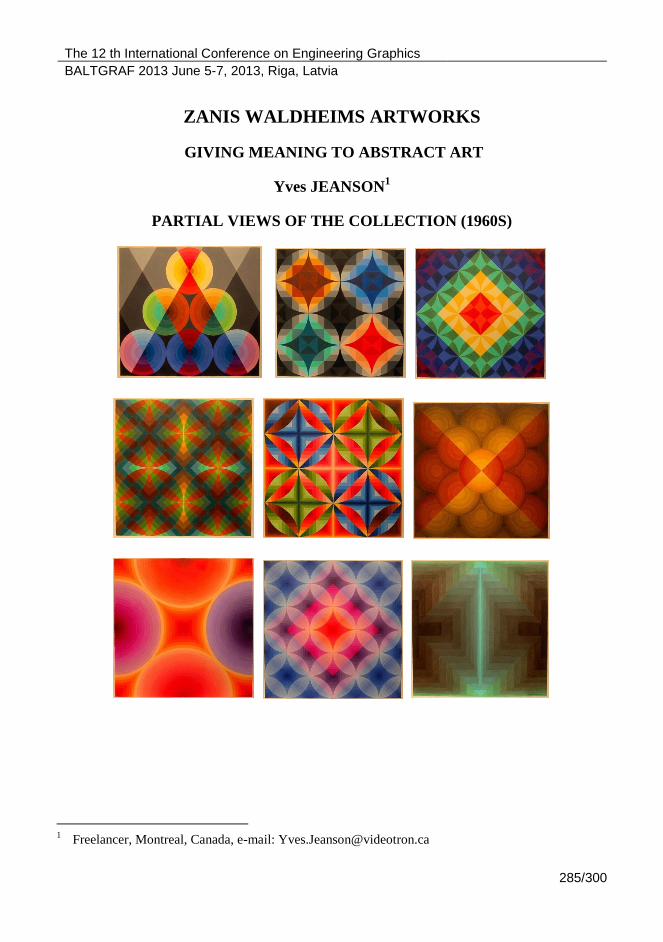
The 12 th International Conference on Engineering Graphics
BALTGRAF 2013 June 5-7, 2013, Riga, Latvia
285/300
ZANIS WALDHEIMS ARTWORKS
GIVING MEANING TO ABSTRACT ART
Yves JEANSON1
PARTIAL VIEWS OF THE COLLECTION (1960S)
1 Freelancer, Montreal, Canada, e-mail: [email protected]

286/300 The 12th International Conference on Engineering Graphics – BALTGRAF 2013
PARTIAL VIEWS OF THE COLLECTION (1970S)
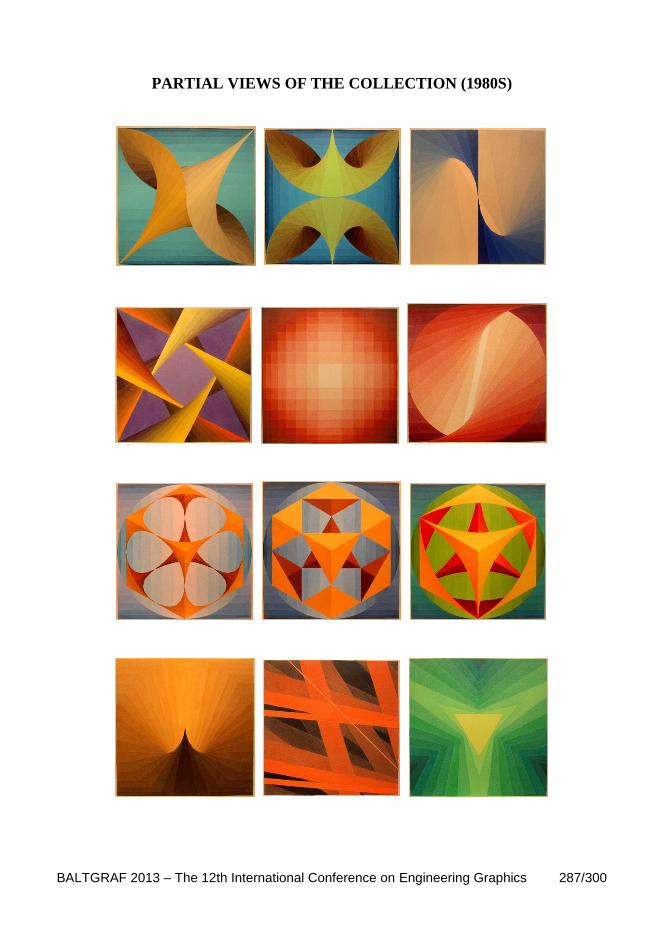
BALTGRAF 2013 – The 12th International Conference on Engineering Graphics 287/300
PARTIAL VIEWS OF THE COLLECTION (1980S)

288/300 The 12th International Conference on Engineering Graphics – BALTGRAF 2013
ZANIS WALDHEIMS MASTER PIECE DWG # 142 (1967)
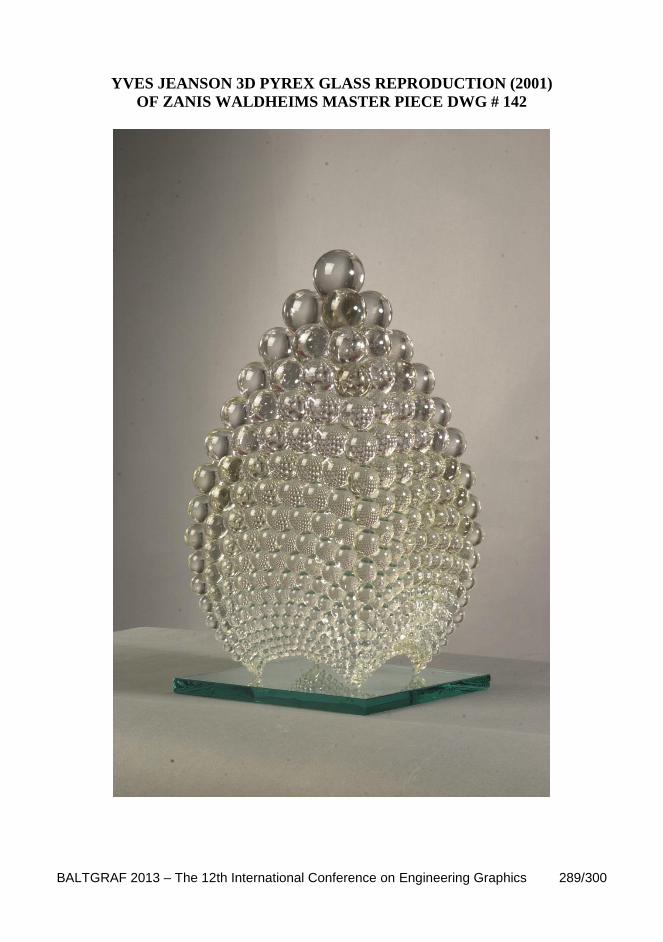
BALTGRAF 2013 – The 12th International Conference on Engineering Graphics 289/300
YVES JEANSON 3D PYREX GLASS REPRODUCTION (2001)
OF ZANIS WALDHEIMS MASTER PIECE DWG # 142

290/300 The 12th International Conference on Engineering Graphics – BALTGRAF 2013

The 12 th International Conference on Engineering Graphics
BALTGRAF 2013 June 5-7, 2013, Riga, Latvia
291/300
SUPPLEMENT B
SOLIDWORKS 3D CAD FOR STUDENTS
AND EDUCATION FOR REWARDING CAREERS

292/300 The 12th International Conference on Engineering Graphics – BALTGRAF 2013
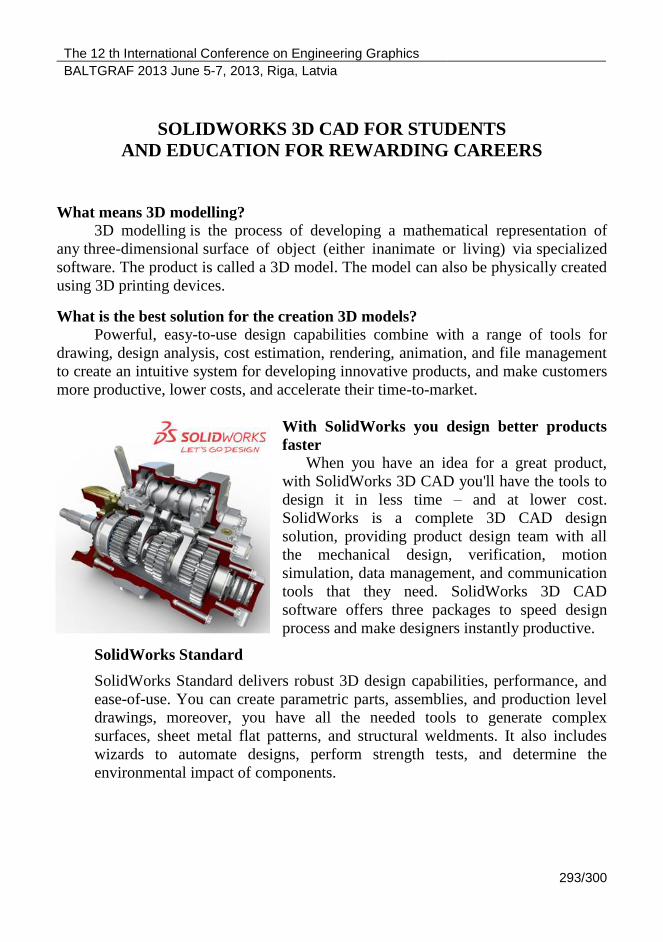
The 12 th International Conference on Engineering Graphics
BALTGRAF 2013 June 5-7, 2013, Riga, Latvia
293/300
SOLIDWORKS 3D CAD FOR STUDENTS
AND EDUCATION FOR REWARDING CAREERS
What means 3D modelling?
3D modelling is the process of developing a mathematical representation of
any three-dimensional surface of object (either inanimate or living) via specialized
software. The product is called a 3D model. The model can also be physically created
using 3D printing devices.
What is the best solution for the creation 3D models?
Powerful, easy-to-use design capabilities combine with a range of tools for
drawing, design analysis, cost estimation, rendering, animation, and file management
to create an intuitive system for developing innovative products, and make customers
more productive, lower costs, and accelerate their time-to-market.
With SolidWorks you design better products
faster
When you have an idea for a great product,
with SolidWorks 3D CAD you'll have the tools to
design it in less time – and at lower cost.
SolidWorks is a complete 3D CAD design
solution, providing product design team with all
the mechanical design, verification, motion
simulation, data management, and communication
tools that they need. SolidWorks 3D CAD
software offers three packages to speed design
process and make designers instantly productive.
SolidWorks Standard
SolidWorks Standard delivers robust 3D design capabilities, performance, and
ease-of-use. You can create parametric parts, assemblies, and production level
drawings, moreover, you have all the needed tools to generate complex
surfaces, sheet metal flat patterns, and structural weldments. It also includes
wizards to automate designs, perform strength tests, and determine the
environmental impact of components.
294/300 The 12th International Conference on Engineering Graphics – BALTGRAF 2013
SolidWorks Professional
SolidWorks Professional gives you all the power of SolidWorks Standard but
with additional capabilities that increase productivity, ensure accuracy, and help
you communicate all design information more effectively. Includes libraries of
standard parts and fasteners, tools to automatically estimate manufacturing cost.
Your designs can be realistically rendered with PhotoView 360 software and
shared with the eDrawings Professional package, an easily deployed tool that
lets everyone view, measure, and mark-up the design data.
SolidWorks Premium
SolidWorks Premium is a 3D design solution that adds to the capabilities of
SolidWorks Professional with powerful simulation, motion and design
validation tools, advanced wire and pipe routing functionality, point cloud data
import and much more. Rich simulation capabilities let users test product
performance against real life motion and forces. Extended toolsets help layout
and document electrical wiring, piping, and tubing, and let you quickly
incorporate PC board data into the 3D model.
SolidWorks Education Edition Software
A 3D design teaching tool for Educators teaching at all levels. SolidWorks
Premium software comes packaged with a full curriculum and interactive courseware
to help educators provide the best training for their students.
What SolidWorks Education Edition includes?
SolidWorks® Premium Software
SolidWorks® Simulation Premium
SolidWorks® Motion
SolidWorks® Flow Simulation
Complete Curriculum, including a Teacher Guide and Student Guides, that
makes teaching easier at every level
Extensive interactive Courseware projects
Access to our online educational community, plus our library of articles,
tutorials, product resources, and more
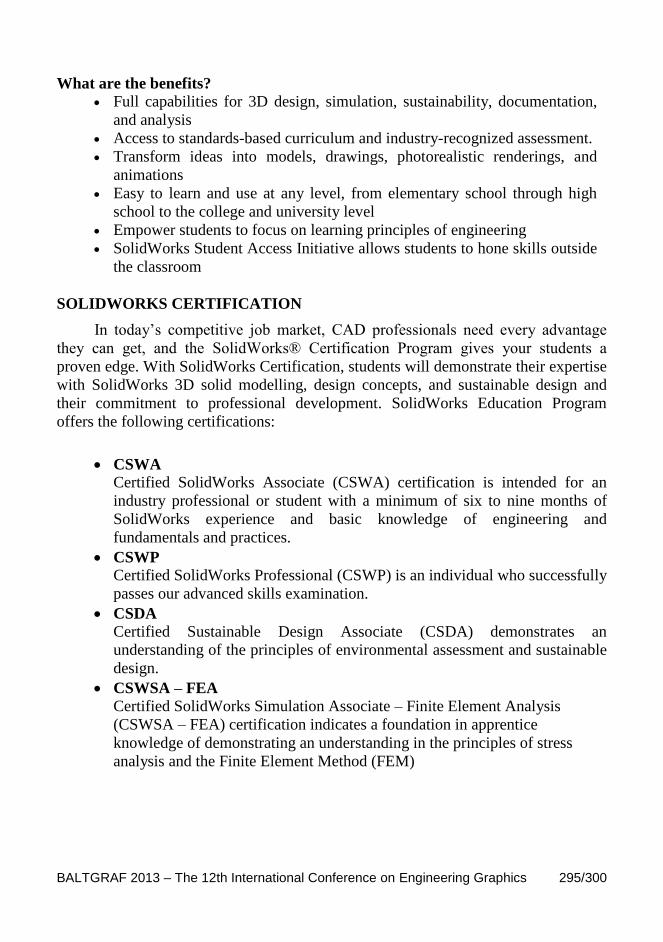
BALTGRAF 2013 – The 12th International Conference on Engineering Graphics 295/300
What are the benefits?
Full capabilities for 3D design, simulation, sustainability, documentation,
and analysis
Access to standards-based curriculum and industry-recognized assessment.
Transform ideas into models, drawings, photorealistic renderings, and
animations
Easy to learn and use at any level, from elementary school through high
school to the college and university level
Empower students to focus on learning principles of engineering
SolidWorks Student Access Initiative allows students to hone skills outside
the classroom
SOLIDWORKS CERTIFICATION
In today’s competitive job market, CAD professionals need every advantage
they can get, and the SolidWorks® Certification Program gives your students a
proven edge. With SolidWorks Certification, students will demonstrate their expertise
with SolidWorks 3D solid modelling, design concepts, and sustainable design and
their commitment to professional development. SolidWorks Education Program
offers the following certifications:
CSWA
Certified SolidWorks Associate (CSWA) certification is intended for an
industry professional or student with a minimum of six to nine months of
SolidWorks experience and basic knowledge of engineering and
fundamentals and practices.
CSWP
Certified SolidWorks Professional (CSWP) is an individual who successfully
passes our advanced skills examination.
CSDA
Certified Sustainable Design Associate (CSDA) demonstrates an
understanding of the principles of environmental assessment and sustainable
design.
CSWSA – FEA
Certified SolidWorks Simulation Associate – Finite Element Analysis
(CSWSA – FEA) certification indicates a foundation in apprentice
knowledge of demonstrating an understanding in the principles of stress
analysis and the Finite Element Method (FEM)
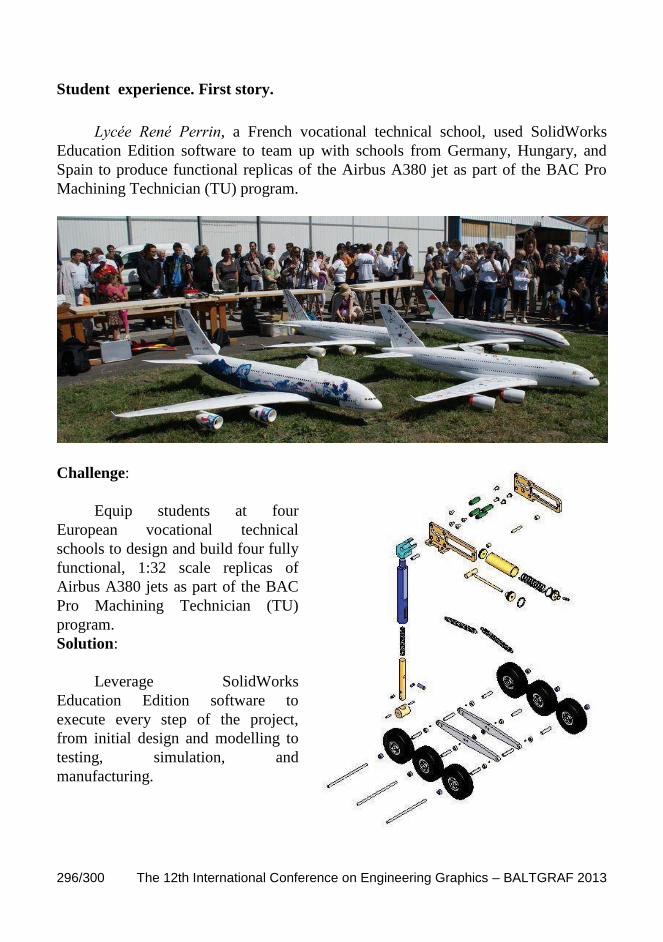
296/300 The 12th International Conference on Engineering Graphics – BALTGRAF 2013
Student experience. First story.
Lycée René Perrin, a French vocational technical school, used SolidWorks
Education Edition software to team up with schools from Germany, Hungary, and
Spain to produce functional replicas of the Airbus A380 jet as part of the BAC Pro
Machining Technician (TU) program.
Challenge:
Equip students at four
European vocational technical
schools to design and build four fully
functional, 1:32 scale replicas of
Airbus A380 jets as part of the BAC
Pro Machining Technician (TU)
program.
Solution:
Leverage SolidWorks
Education Edition software to
execute every step of the project,
from initial design and modelling to
testing, simulation, and
manufacturing.

BALTGRAF 2013 – The 12th International Conference on Engineering Graphics 297/300
Results:
• Assembled and flew four mini Airbus A380 jets
• Drove teamwork across four vocational schools
• Supported two-year TU study project
• Facilitated cross-institutional collaboration
Second story.
Children from the Netherlands use
SolidWorks to Prepare for FLL Robot
Competition. As children from the Netherlands,
ages 9-12, prepare for the First Lego League
(FLL) robot competition, they face many
challenges in design methodology, physics,
teamwork and planning. With the help of Bas
Kooman, Technical Director from SolidWorks
Reseller, these children experience how
SolidWorks helps in the design process.
Bas uses real world example from
SolidWorks commercial customers and takes the
children through a problem of letting the LEGO
robot move along a prescribed path. Due to
several parameters like part tolerance, kinematic
behaviour of the servo motors, and friction-
effects of the table, the robot always deviates
from the ideal path. With the help of SolidWorks
Motion, an event – based software application,
the children learn how to simulate the robot’s
behaviour and deal with the problem.

298/300 The 12th International Conference on Engineering Graphics – BALTGRAF 2013
The children will also explore model rendering and engineering drawings to
help with the design documentation required for the competition.
BALTGRAF 2013 – The 12th International Conference on Engineering Graphics 299/300
Hope to meet you again at the
13th
BALTGRAF
in Lithuania on 2015

SCIENTIFIC PROCEEDINGS OF THE 12
TH INTERNATIONAL CONFERENCE ON
ENGINEERING GRAPHICS BALTGRAF 2013 ISBN 978-9934-507-30-4
Editor M. Dobelis
RIGA TECHNICAL UNIVERSITY 2013