Embed Size (px)
Citation preview

Research Institute of Brewing and Malting, Plc.Published online: 15 October 2020
© 2020 The Author(s)This work is licensed under a Creative Commons Attribution- ShareAlike 4.0 International License.
KVASNÝ PRŮMYSL
Kvasny prumysl (2020) 66: 351–364https://doi.org/10.18832/kp2019.66.351
Balling’s attenuation theory and beer composition calculatorVilém Nohel
PMS Přerov a.s. – breweries Zubr, Litovel, Holba, Komenského 35, 750 02 Přerov, Czech Republic *corresponding author: [email protected]
Abstract
This article deals with ways in which calculations and checks of basic parameters of beer can be performed based on the knowledge of two parameters. The importance of this method is growing with the increase in craft beer produc-tion in our country, i.e. mini breweries, home-brewing, etc. The calculations are based on Balling’s equations, alcohol factors and attenuation quotients which have been published unchanged at least since 1876. In Balling’s time, they were used to determine an extract with a specific gravity of 17.5 °C/17.5 °C. In current brewing, specific gravities of 20 °C/20 °C are used. For this reason, new alcohol factors of apparent attenuation were derived and based on linear regression. Regression coefficients of the dependence of the alcohol factor of apparent attenuation on the extract in original wort were calculated. Some variants of calculations based on two input parameters were incorporated into the beer composition calculator using formulas that replace extract and alcohol tables. The accuracy of the results from the calculator was checked with analyses from the Anton Paar automatic analyser and with analyses obtained by the distillation method. The calculator is available at www.balling.cz.
Keywords: Balling’s equations, alcohol factors, attenuation quotient, apparent attenuation, real attenuation, specific gravity, alcohol content, real extract, Tabarie’s formula
1 Introduction
The basic parameters of beer include, but are not lim-ited to: extract in original wort, apparent extract, real extract, real degree of fermentation, apparent degree of fermentation, alcohol content, specific gravities of beer, alcohol and real extract. In the case of industrial brewer-ies, these values are usually obtained from an automatic analyser. From the perspective of craft beer production (mini-breweries, home-brewing), the purchase of an ex-pensive device for determining the basic parameters of beer has no economic justification, and it is generally necessary to make do with a saccharometer for measure-ments with technology. Professor Carl Napoleon Balling dealt with the fermen-tation processes of beer. Balling mathematically expressed the mass balance of wort during fermentation and exper-imentally verified it. This work brought him great recog-nition, and according to the relationships and formulas he
derived, the original concentration of wort in the brewing industry is still calculated from the determined values of alcohol and the real extract of beer (Basařová et al., 2010). While the derivation of large Balling’s formula for the calculation of the extract in original wort on the ba-sis of mass balance is mentioned in brewing literature, Balling’s alcohol factors and formulas resulting from the theory of attenuation are virtually non-existent in brew-ing literature today. An article by Budweiser Budvar em-ployees in the journal Kvasný průmysl (Šavel et al., 2015), and an article in the Journal of the Institute of Brewing (Cutaia et al., 2009), are recent exceptions.
List of symbolsp extract in original wort OE (% Plato, % m/m)A alcohol A%mas (% m/m = g/100 g) A alcohol A%vol (% v/v = ml/100 ml)

V. Nohel Kvasny prumysl (2020) 66: 351–364
352
m apparent extract AE (% m/m) n real extract RE (% m/m) SGBEER specific gravity of beerSGA specific gravity of distillateSGE specific gravity of residueADF apparent degree of fermentation (%)RDF real degree of fermentation (%)RDFASBC real degree of fermentation by ASBC (%) (ASBC American Society of Brewing Chemists) energy energy value of beer (kcal/100 ml, kJ/100 ml)ρ density of beer (g/cm3)a, b, c alcohol factorsq attenuation quotient
Note: Sentences and phrases in the following text written in italics in quotations marks indicate literal translation original text from historical literature.
2 Balling’s attenuation theory
2.1 Balling’s formulasBalling considered the following basic quantities:p – extract in original wortA – alcohol content n – real extractm – apparent extract
The difference (p – m) expresses the apparent attenua-tion, which is directly proportional to the amount of fer-mented extract, and thus the alcohol content. Assuming that 1% m/m of the apparent attenuation is a % of alco-hol, the following ratio applies:
from which (1a)
Value a is called the alcohol factor of apparent attenua-tion. Its variable value can therefore be calculated from the known values of A, p and m. If, on the other hand, the value of factor a is known, we can calculate the alcohol-ic content A at each stage of fermentation for the known p and m:
A = (p – m)a (2a)
From the ratio of apparent attenuation to the original ex-tract, the apparent degree of fermentation ADF is calcu-lated from the following ratio:
so (3a)
We can also derive the alcohol content from the real at-tenuation (p – n):
A = (p – n)b (2b)
and from it the alcohol factor of real attenuation
(1b)
and the real degree of fermentation
(3b)
The apparent attenuation is always numerically greater than the real attenuation. By subtracting the real atten-uation from the apparent attenuation, the attenuation difference is obtained:
(p – m) – (p – n) = n – m
If the c amount of alcohol corresponding to 1% m/m attenuation difference, and A alcohol pertaining to the whole attenuation difference with respect to 100 g fer-mented wort, then
and from it (1c)
A = (n – m)c (2c)
Factor c is the alcohol factor of the attenuation difference.
Another significant value is the attenuation quotient q, defined as the ratio of apparent and real attenuation:
(4)
By dividing equations 2a and 2b, we get the following re-lation:
(5)
a1
A(p – m)
=
100
ADFp
(p – m)=
a bq=
bA
(p – n)=
(p – n)RDF 100= p
c1
A(n – m)
=
cA
(n – m)=
q(p – n)
(p – m)=
AA
(p – m)a(p – n)b=
ba
(p – m)
(p – n)= = q
(p – m)ADF 100= p
aA
(p – m)=

V. Nohel Kvasny prumysl (2020) 66: 351–364
353
The alcohol factor of the attenuation difference c can also be derived from equations 2b and 2c:
A = A
c(n – m) = b(p – n)
(6)
From equation 4 we can derive a relation for calculating p:
p–m= (p – n)q p – m = pq – nq (7a) p–pq= m – nq
p(1–q)= m – nq (7b)
(7c)
or equation 7b can be modified to:
p(1–q)+nq= mp(1–q)+nq–n= m – n–p(q–1)+n(q–1)= m – n
p(q–1)=n(q–1)–m+n
(7d)
By combining equations 7d (Balling’s small for-mula) and 6, we receive a relation for calculating p in the following form:
and
and
(8)
By combining equations 7a and 5, a relation can be de-rived for calculating the real extract n:
nq=pq–p+m= pq – (p – m)
(9a)
(9b)
“After many, many tests and calculations, Balling calculat-ed the alcohol factors for each wort density from 5 to 30 degrees of saccharometer” (Suk, 1880).
Figure 1 shows a table of alcohol factors and attenua-tion quotients for the fermentation of worts with 6–16% (Schmelzer a Skvrna, 1877), and Figure 2 shows Balling’s table for alcohol factors and attenuation quotients for fermentation of beer worts containing 6–30% of extract (Šula, 1898).
Numerical values of alcohol factors are identical and ap-pear subsequently in professional brewing literature up to the present, e.g. (Suk, 1880; Thausing, 1882; Lhotský, 1954; Bednář et al., 1967; Albl et al., 1990; Hardwick, 1995). In the publication STRUČNÉ PIVOVARNICTVÍ (Brewery industry briefly) from 1877, Schmelzer and Skvrna end their preface IN PRAGUE on the day of St. Lu-cie 1876, meaning that values of factors do not change at least from this year on.
Figure 1 Alcoholfactorsandattenuationquotientsof6–16%originalwortfromthebookStručnépivovarnictví(SchmelzeraSkvrna,1877)
1 Table of alcohol factors and attenuation quotients for the fermentation of worts with 6–16 percent2 The original wort extract given in degrees of saccharometer3 Alcohol factors for *apparent and **real ***attenuation, ****attenuation difference4 Attenuation quotient
c(n – m)
b(p – n)=
n p – q (p – m)
=
n p – (p – m) ba
=
p (n – m)bc
= + n
c(n – m + p – p)
b(p – n)=
Lorem ipsum
c(p – m) – (p – n)
=(p – n)
b(p – n)
(p – n)
cb
(q – 1)=
q(p – m)
(p – n)=
p(1 – q)
(m – nq)=
p(q – 1)
(nq – m)=
p(q – 1)
(n – m)= n +
p(q – 1)
(n – m)= + n
p (n – m)(q – 1)
1= + n
bc=q – 1
cb
(q – 1)=
2
1
* **
*******
34

V. Nohel Kvasny prumysl (2020) 66: 351–364
354
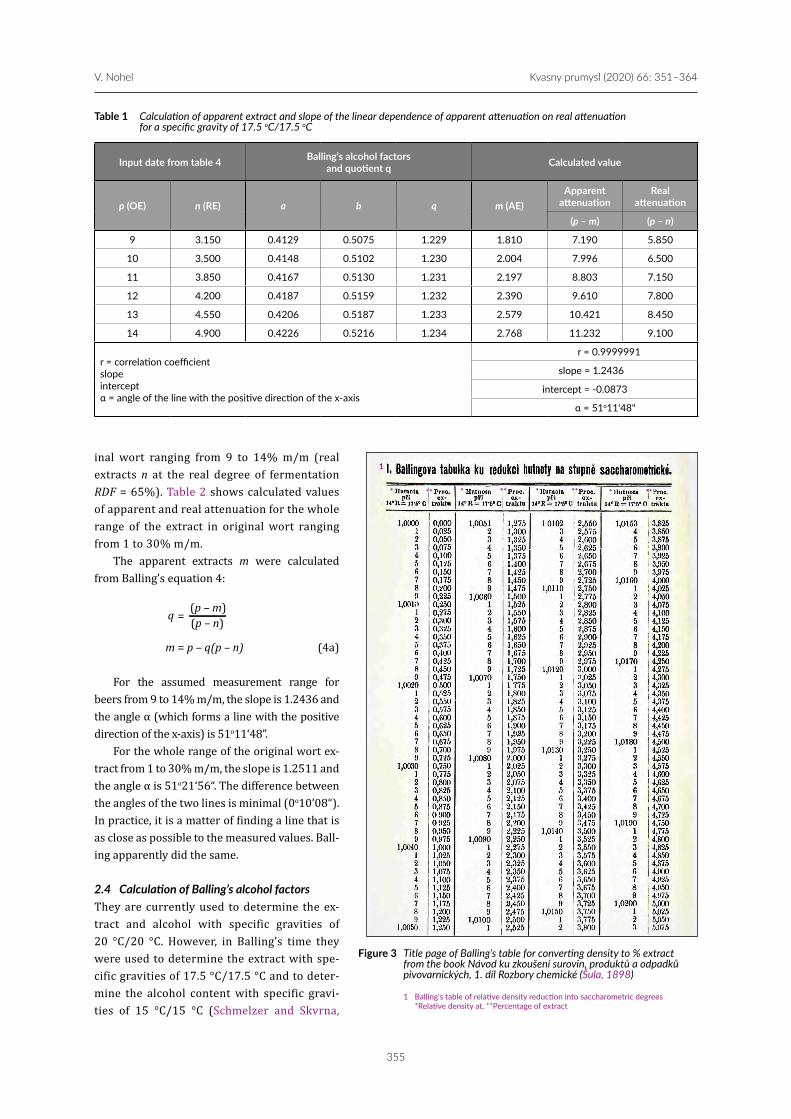
2.2 Balling’s saccharometric testBalling introduced a saccharometric test of beer in brewing based on the attenuation difference. “After re-moving carbonic acid from the beer by shaking in the bottle, the apparent extract m was determined with a saccharometer or pycnometer. Then, the beer is grad-ually boiled down to remove all the alcohol, which makes the beer lighter; after cooling, distilled water is added to get the beer to its original weight, and the real extract n is determined with a saccharometer or pycnometer” (Schmelzer and Skvrna, 1877). From the tabulated val-ues of alcohol factors and attenuation quotients, and us-ing equations 7d and 2c, “the extract in original wort and the amount of alcohol are determined”. With a pycnometer, the measured values “of relative weight” were found in Balling’s extract table and “saccha-rometric data in percentages were subtracted” for m and n (see part of Balling’s extract table in Figure 3). “To make it easier to understand and calculate the extract in original wort and to determine the amount of alcohol”, Balling created tables and guidelines for their use. Figure 4 shows the table “Determining the extract in
original wort”, where in the first column there is an attenuation difference ranging from 1.000 to 2.700, and in the following six columns there are values (n – m)/(q–1)for real attenuation (p – n), “towhichthesedifferencesinwortsof9–14%ofthe mean extract content belong”. When the ex-tract in original wort is determined according to this table, it is possible to determine the amount of alcohol according to the table in Figure 5. In the first column there are attenuation differ-ences, and the following six columns show “the amount of alcohol” corresponding to these at-tenuation differences at a “wort extract ranging from8.51to14.50%”. If the alcohol was determined directly by distil-lation, the extract in original wort was calculated according to Balling’s large formula:
(10)
Balling’s formula for calculating p was gradually revised by Holzener, Schönfeld, Doemens and Trol (Lhotský, 1954). Recently, Scandinavian authors have commented on the validity of Balling’s for-mula (Nielsen and Kristiansen, 2007, cited Šavel et al., 2015), and details of attempts to improve the model of Balling’s original equation have been dis-cussed (Cutaia et al., 2009). Due to its universality, the formula is a master tool for evaluating the pro-duction of alcohol under various conditions, and
a revision would disrupt its universality; this will not even happen in the future due to the 150 years of practice (Šavel et al., 2015).
2.3 Dependence of apparent attenuation on real attenuation
It can be assumed that Balling performed most of his measurements using beers with the extract in original wort that were on the market and for which he devel-oped “tables to determine the strength of the wort and the amount of alcohol” based on the attenuation differ-ence (see above). "10° beer wasmost often brewed inbreweries in Bohemia" (Šula, 1898). Based on these re-sults, he then calculated the appropriate values for the entire range of the extract in original wort ranging from 1 to 30% m/m. As can be seen from the calculations in Tables 1 and 2, there is a linear dependence between apparent and real attenuation. Table 1 shows the calculated val-ues of apparent attenuation (p – m) and real attenua-tion (p – n) based on the use of Balling’s alcohol factors a a b and quotients q for extracts of the extract in orig-
Figure 2 AlcoholfactorsandattenuationquotientsfromthebookNávodkuzkoušenísurovin,produktůaodpadkůpivovarnických,1.dílRozborychemické(Šula,1898)
1 Balling’s table for alcohol factors and attenuation quotients of fermented worts containing 6–30% of extract2 Percentage of extract in original wort3 Alcohol factors for **apparent and ***real *attenuation, ****attenuation difference4. Attenuation quotient
(2.0665A + n)p 100=
(1.0665A + 100)
2
1
*** ***
****
3 4
V. Nohel Kvasny prumysl (2020) 66: 351–364
355
inal wort ranging from 9 to 14% m/m (real extracts n at the real degree of fermentation RDF = 65%). Table 2 shows calculated values of apparent and real attenuation for the whole range of the extract in original wort ranging from 1 to 30% m/m. The apparent extracts m were calculated from Balling’s equation 4:
m = p – q(p – n) (4a)
For the assumed measurement range for beers from 9 to 14% m/m, the slope is 1.2436 and the angle α (which forms a line with the positive direction of the x-axis) is 51o11‘48”. For the whole range of the original wort ex-tract from 1 to 30% m/m, the slope is 1.2511 and the angle α is 51o21‘56“. The difference between the angles of the two lines is minimal (0o10’08“). In practice, it is a matter of finding a line that is as close as possible to the measured values. Ball-ing apparently did the same.
2.4 Calculation of Balling’s alcohol factorsThey are currently used to determine the ex-tract and alcohol with specific gravities of 20 °C/20 °C. However, in Balling’s time they were used to determine the extract with spe-cific gravities of 17.5 °C/17.5 °C and to deter-mine the alcohol content with specific gravi-ties of 15 °C/15 °C (Schmelzer and Skvrna,
Input date from table 4 Balling’s alcohol factors and quotient q Calculated value
p (OE) n (RE) a b q m (AE)Apparent
attenuationReal
attenuation
(p – m) (p – n)
9 3.150 0.4129 0.5075 1.229 1.810 7.190 5.850
10 3.500 0.4148 0.5102 1.230 2.004 7.996 6.500
11 3.850 0.4167 0.5130 1.231 2.197 8.803 7.150
12 4.200 0.4187 0.5159 1.232 2.390 9.610 7.800
13 4.550 0.4206 0.5187 1.233 2.579 10.421 8.450
14 4.900 0.4226 0.5216 1.234 2.768 11.232 9.100
r = correlation coefficientslope intercept α = angle of the line with the positive direction of the x-axis
r = 0.9999991
slope = 1.2436
intercept = -0.0873
α = 51o11'48"
Table 1 Calculationofapparentextractandslopeofthelineardependenceofapparentattenuationonrealattenuation foraspecificgravityof17.5oC/17.5oC
Figure 3 TitlepageofBalling’stableforconvertingdensityto%extractfromthebookNávodkuzkoušenísurovin,produktůaodpadkůpivovarnických,1.dílRozborychemické(Šula,1898)
1 Balling‘s table of relative density reduction into saccharometric degrees*Relative density at, **Percentage of extract
q(p – n)
(p – m)=
1
* ** *** **** **

V. Nohel Kvasny prumysl (2020) 66: 351–364
356
1877; Šula, 1898). For this reason, the use of Balling’s alcohol factors of apparent attenuation a in the current brewing industry would not lead to completely accu-rate results. For illustration, Table 3 shows values for specif-ic gravities of 20 °C/20 °C and for specific gravities of 17.5 °C/17.5 °C for the extract in original wort of 11%
m/m from the relevant tables and a real degree of fer-mentation of 65%. To calculate the specific gravity of beer 17.5 °C/17.5 °C, the formula according to Tabarie was used, which was also used by Balling at the time (Šav-el et al., 2015). An improved Tabarie’s formula was used to calculate the specific gravity of beer at 20 °C/20 °C (Nielsen and Aastrup, 2004).
Table 2 Calculationofapparentextractandslopeofthelineardependenceofapparentattenuationonrealattenuation foraspecificgravityof17.5oC/17.5oC
Input date fromtable 4
Balling’s alcohol factors and quotient q Calculated value
p (OE) n (RE) a b q m (AE)Apparent
attenuationReal attenu-
ation
(p–m) (p–n)
1 0.350 0.3983 0.4864 1.221 0.206 0.794 0.650
2 0.700 0.4001 0.4890 1.222 0.411 1.589 1.300
3 1.050 0.4018 0.4915 1.223 0.615 2.385 1.950
4 1.400 0.4036 0.4941 1.224 0.817 3.183 2.600
5 1.750 0.4054 0.4967 1.225 1.018 3.982 3.250
6 2.100 0.4073 0.4994 1.226 1.218 4.782 3.900
7 2.450 0.4091 0.5020 1.227 1.416 5.584 4.550
8 2.800 0.4110 0.5047 1.228 1.614 6.386 5.200
9 3.150 0.4129 0.5075 1.229 1.810 7.190 5.850
10 3.500 0.4148 0.5102 1.230 2.004 7.996 6.500
11 3.850 0.4167 0.5130 1.231 2.197 8.803 7.150
12 4.200 0.4187 0.5159 1.232 2.390 9.610 7.800
13 4.550 0.4206 0.5187 1.233 2.579 10.421 8.450
14 4.900 0.4226 0.5216 1.234 2.768 11.232 9.100
15 5.250 0.4246 0.5245 1.235 2.956 12.044 9.750
16 5.600 0.4267 0.5275 1.236 3.144 12.856 10.400
17 5.950 0.4288 0.5304 1.237 3.331 13.669 11.050
18 6.300 0.4309 0.5335 1.238 3.515 14.485 11.700
19 6.650 0.4330 0.5365 1.239 3.697 15.303 12.350
20 7.000 0.4351 0.5396 1.240 3.878 16.122 13.000
21 7.350 0.4373 0.5427 1.241 4.059 16.941 13.650
22 7.700 0.4395 0.5459 1.242 4.238 17.762 14.300
23 8.050 0.4417 0.5491 1.243 4.415 18.585 14.950
24 8.400 0.4439 0.5523 1.244 4.590 19.410 15.600
25 8.750 0.4462 0.5556 1.245 4.766 20.234 16.250
26 9.100 0.4485 0.5589 1.246 4.940 21.060 16.900
27 9.450 0.4508 0.5623 1.247 5.111 21.889 17.550
28 9.800 0.4532 0.5656 1.248 5.284 22.716 18.200
29 10.150 0.4556 0.5691 1.249 5.455 23.545 18.850
30 10.500 0.4580 0.5726 1.250 5.623 24.377 19.500
r = correlation coefficientslope intercept α = angle of the line with the positive direction of the x-axis
r = 0.99998
slope = 1.2511
intercept = -0.1074
α = 51o21'56"

V. Nohel Kvasny prumysl (2020) 66: 351–364
357
Alcohol factors a and b were calculated according to equations 1a and 1b, and attenuation quotients q according to equation 4. For a specific gravity of 17.5 °C/17.5 °C, we obtain identical values of the al-cohol factors a, b and the attenuation quotient q with the values derived by Balling. Due to the different numerical values of the ap-parent extracts m, there will also be different numer-ical values of the quotients q. Since the alcohol factor of real attenuation b is constant for a given p (does not change with fermentation) and is equal to the product of aq (a times q), the numerical values of al-cohol factors a will also vary. To determine the alcohol factors for specific grav-ities of 20 °C/20 °C, calculations were performed in an EXCEL spreadsheet for each extract in original wort from 1 to 30% m/m for real degree of fermenta-tion 65% (Table 4). Calculation principle: formula 3b for real fermen-tation was used to calculate the real extracts n, and Balling’s large formula 10 was used to calculate the alcohol contents A%mas. The respective values of specific gravities were subtracted directly by interpolation from the tables used in the Anton Paar automatic analyzer. For the extract „the extract according to ASBC tables" (ASBC, 2020); for alcohol from the annex to the guidebook Alcolyzer Plus “Density and Concentration of Water/Ethanol Solutions” (Anton Paar, © 2007).
The specific gravities of beers were calculated ac-cording to the improved Tabarie’s formula.Tabarie’s formula is as follows:
SGBEER = SGE + SGA – 1 (11)
According to Scandinavian authors (Nielsen and Aastrup, 2004), the accuracy of Tabarie’s formula is problematic – especially for strong beer. Based on many analyses of beer performed in Alfred Jørgensen’s labora-tory, an improved version of the old Tabarie’s formula is proposed:
SGBEER = SGE + SGA – 1 + 2.96(1 – SGA)2 – 381(1 – SGA)3
(12)
While the old Tabarie’s formula is less accurate for strong beer than for medium-strength beer, the improved ver-sion is valid for all beers up to A%mas = 8, unless the degree of fermentation is extreme. The real degree of fer-mentation should be 65 to 85%. Outside this range, accu-racy has not been checked and increasing deviations can be expected (Nielsen and Aastrup, 2004).
Table 3 Alcoholfactorsandquotientq for p=11%m/mandforspecificgravitiesof20oC/20oCand17.5oC/17.5oC
Specific gravity p (OE) RDF n (RE) SGE A%mas SGA SGBEER m (AE) ADF a b q
20 °C/20 °C 11 65 3.85 1.01510 3.67 0.99337 1.00849 2.175 80.22 0.4157 0.5130 1.234
17,5 °C/17,5 °C 11 65 3.85 1.01540 3.67 0.99338 1.00878 2.196 80.04 0.4166 0.5130 1.231
Figure 4 TableofdeterminingtheextractinoriginalwortfromthebookStručnépivovarnictví(SchmelzeraSkvrna,1877)
1 Table II. Extract determination of original wort2 Attenuation difference3 This corresponds to the value (p – n) of the original extract expressed
as a percentage
2
1
3

V. Nohel Kvasny prumysl (2020) 66: 351–364
358
According to our findings, the formula provides accept-able values of relative densities even for Czech beers (ex-tract in original wort 10 to 12% m/m), which have a real degree of fermentation lower than 65%. Apparent degrees of fermentation were calculated according to formula 3a. Alcohol factors a, b, c were calculated according to equations 1a, 1b, 1c, and the attenuation quotient q was calculated according to equations 4 and 5. The dependence of alcohol factors b on extracts in original wort p was derived by combining equations 1b and 10:
A is determined from Balling’s large formula:
(10a)
and introduced into the first equation:
(13)
The dependence of alcohol factors a on the extracts in original wort p was derived on the basis of linear regres-sion, because the correlation coefficient of the depend-
Table 4 CalculationofBalling’salcoholfactorsandattenuationquotientsof1–30%m/moriginalwortforaspecificgravityof20oC/20oC
p (OE) RDF n (RE) SGEA%-mas SGA SGBEER
m (AE) ADF a b c
q q
(p–m)/(p–n)
1 65 0.350 1.00136 0.32 0.99939 1.00075 0.193 80.70 0.3918 0.4864 2.0138 1.242 1.242
2 65 0.700 1.00273 0.64 0.99879 1.00152 0.391 80.46 0.3950 0.4890 2.0558 1.238 1.238
3 65 1.050 1.00409 0.96 0.99818 1.00228 0.586 80.47 0.3970 0.4915 2.0648 1.238 1.238
4 65 1.400 1.00546 1.28 0.99758 1.00304 0.780 80.49 0.3990 0.4941 2.0734 1.238 1.238
5 65 1.750 1.00682 1.61 0.99697 1.00381 0.978 80.45 0.4013 0.4967 2.0901 1.238 1.238
6 65 2.100 1.00819 1.95 0.99637 1.00458 1.175 80.41 0.4037 0.4994 2.1059 1.237 1.237
7 65 2.450 1.00957 2.28 0.99577 1.00536 1.375 80.36 0.4061 0.5020 2.1242 1.236 1.236
8 65 2.800 1.01095 2.62 0.99517 1.00614 1.575 80.31 0.4085 0.5047 2.1433 1.236 1.236
9 65 3.150 1.01233 2.97 0.99457 1.00692 1.774 80.29 0.4109 0.5075 2.1578 1.235 1.235
10 65 3.500 1.01371 3.32 0.99397 1.00770 1.973 80.27 0.4132 0.5102 2.1720 1.235 1.235
11 65 3.850 1.01510 3.67 0.99337 1.00849 2.175 80.22 0.4157 0.5130 2.1905 1.234 1.234
12 65 4.200 1.01649 4.02 0.99277 1.00927 2.374 80.22 0.4180 0.5159 2.2033 1.234 1.234
13 65 4.550 1.01788 4.38 0.99217 1.01005 2.572 80.22 0.4203 0.5187 2.2159 1.234 1.234
14 65 4.900 1.01928 4.75 0.99157 1.01083 2.771 80.21 0.4227 0.5216 2.2293 1.234 1.234
15 65 5.250 1.02068 5.11 0.99097 1.01161 2.969 80.21 0.4251 0.5245 2.2416 1.234 1.234
16 65 5.600 1.02208 5.49 0.99038 1.01239 3.166 80.21 0.4274 0.5275 2.2541 1.234 1.234
17 65 5.950 1.02349 5.86 0.98978 1.01317 3.363 80.22 0.4298 0.5304 2.2659 1.234 1.234
18 65 6.300 1.02490 6.24 0.98918 1.01394 3.558 80.23 0.4322 0.5335 2.2766 1.234 1.234
19 65 6.650 1.02632 6.63 0.98858 1.01472 3.755 80.24 0.4346 0.5365 2.2886 1.234 1.234
20 65 7.000 1.02773 7.01 0.98799 1.01549 3.949 80.26 0.4370 0.5396 2.2989 1.235 1.235
21 65 7.350 1.02915 7.41 0.98739 1.01625 4.140 80.29 0.4394 0.5427 2.3079 1.235 1.235
22 65 7.700 1.03058 7.81 0.98679 1.01701 4.331 80.31 0.4418 0.5459 2.3174 1.236 1.236
23 65 8.050 1.03201 8.21 0.98619 1.01776 4.519 80.35 0.4442 0.5491 2.3251 1.236 1.236
24 65 8.400 1.03344 8.62 0.98560 1.01851 4.708 80.39 0.4466 0.5523 2.3335 1.237 1.237
25 65 8.750 1.03488 9.03 0.98500 1.01926 4.895 80.42 0.4491 0.5556 2.3422 1.237 1.237
26 65 9.100 1.03631 9.45 0.98440 1.01999 5.078 80.47 0.4515 0.5589 2.3482 1.238 1.238
27 65 9.450 1.03775 9.87 0.98378 1.02069 5.253 80.55 0.4537 0.5623 2.3509 1.239 1.239
28 65 9.800 1.03920 10.29 0.98318 1.02141 5.433 80.60 0.4562 0.5656 2.3572 1.240 1.240
29 65 10.150 1.04065 10.73 0.98258 1.02211 5.607 80.66 0.4586 0.5691 2.3615 1.241 1.241
30 65 10.500 1.04210 11.16 0.98197 1.02281 5.781 80.73 0.4610 0.5726 2.3661 1.242 1.242
ba (p – n)
(p – m)
bA
(p – n)=
(p – n)A 100=
(206.65 – 1.0665p)
(p – n)b 100=
(206.65 – 1.0665p)(p – n)
1b =
(2.0665 – 0.010665p)

V. Nohel Kvasny prumysl (2020) 66: 351–364
359
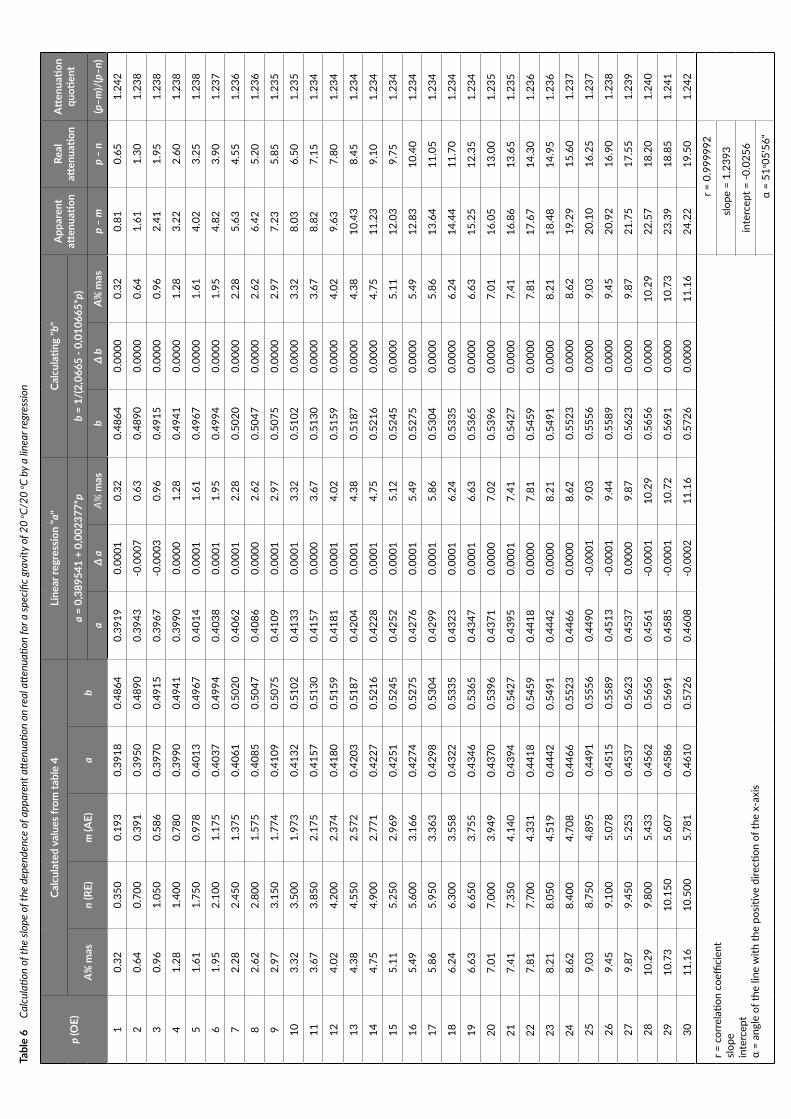
ence of a on p is significant (r = 0.99997). Regression co-efficients of the dependence of the alcohol factor a on the extract in original wort p were calculated (Table 5). The equation has the following form:
a = 0.389541 + 0.002377p (14)
Table 6 shows calculations of the values of alcohol factors a for p = 1 to 30% m/m according to regres-sion equation 14 and comparisons with the values of alcohol factors a calculated in Table 4 according to equation 1a. The differences are minimal, i.e. 0.0001 for the extract in original wort of Czech beers. Table 6 also shows values of apparent and real attenuation. For the whole range of the extract in original wort ranging from 1 to 30% m/m, the slope of the depend-ence of apparent attenuation on real attenuation for specific gravities of 20 °C/20 °C is 1.2393, and the angle α is 51o05 ‘56 “. The difference between the angle for 20 °C/20 °C specific gravities and the angle for 17.5 °C/17.5 °C specif-ic gravities (Table 2) is 00o16‘00”.
A graphic illustration is shown in Figure 6.
3 Calculation of beer composition based on two input values
Balling’s attenuation theory shows the relationship between the basic parameters of beer cited in the in-troduction. If two parameters are known, the rest can be calculated. For some calculation alternatives, a procedure was compiled where the individual variants of the in-put parameter pairs are in rows from A to M, and the individual calculated beer parameters are in columns from 1 to 15. The listed calculations are incorporated into a spreadsheet, which we called the BEER COMPO-SITION CALCULATOR (BCC). The calculator is available for practical use at www.balling.cz. In addition to the basic cited parameters, the calculation of alcohol factors a and b, the attenuation quotient q, the real degree of fermentation RDFASBC, energy values (kcal/100 ml and kJ/100 ml) and beer sample density (g/cm3) are added.
Extract and alcohol tables are replaced in the calcu-lator by polynomial formulas. The formulas were tak-en from domestic (Šavel, 1989) and foreign literature (Cutaia et al., 2009). Formulas for calculating alcohol A%vol, the real degree of fermentation according to ASBC, the energy
Table 5 Regressionequationofthedepenceofthealcoholfaktor"a"ontheoriginalextract(1–30%m/m)foraspecificgravityof20oC/20oC: a = B + M*p
Alcohol factorAlcohol factor "a" from table 4
Correlation coefficient Regression coefficients
a r B M
(–)0.99997 0.3895408891 0.002376648
a = 0.389541 + 0.002377*p
Figure 5 TableofdeterminingtheamountofalcoholfromthebookStručnépivovarnictví(SchmelzeraSkvrna,1877)
1 Table III. Determining of the ethanol content2 Attenuation difference3 Corresponding alcohol content at following values of the original wort extract
1
2 3

V. Nohel Kvasny prumysl (2020) 66: 351–364
360
value and the density of the beer sample were taken from the reference manual of Anton Paar (© 2007). Other necessary calculation formulas are the subject of this article. Calculated alcohol content in variant A (input p and m in craft beer production) based on equa-tion 2a using the newly calculated alcohol factors a for apparent attenuation at specific gravities of 20 °C/20 °C (Tables 4, 5 and 6) can be compared with the calculated alcohol content according to formulas published in foreign literature. Column 4a shows the calculation of alcohol content according to the following formula:
A%mas = 0.38726(OE – AE) + 0.00307(OE –AE)2
(15) (Cutaia et al., 2009)
This equation was derived on the basis of a stepwise regression technique in order to find a more modern and accurate procedure for determining the prediction assumption of A%mas compared to Balling’s equation A = a(p – m). However, by comparing the results of the calculated alcohol contents from both formulas, i.e. from the BEER COMPOSITION CALCULATOR (variant A) and according to formula 15, we find that we obtainvirtually identical values (the difference for Czech beersdepending on fermentation is + 0.00 to 0.03% m/m). Similarly, in column 5 the calculation of the alcohol content A%volis according to “The Craft Formula”:
(16) (Nielsen, 2004)
By comparing the results of the calculated alcohol contents from both formulas, i.e. from the BEER COMPO-SITION CALCULATOR (variant A) and according to formu-la 16, we find a difference for Czech beers ranging from +0.04 to 0.07% v/v. In general, formulas containing A%vol are less accurate than formulas containing A%mas. Column 4b shows the control calculation of the al-cohol content according to formula 2b (with the alco-hol factor of the real attenuation b), the result must be identical to the result in column 4a.
4 Practical verification of beer calculator accuracy
The accuracy of calculations according to the calculator was confronted with the results of analyses from Anton Paar analyzers from the database of breweries Zubr, Litovel and Holba according to variant L (input values A%mas and
SGBEER) for Czech beers with an extract in original wort of 10 to 12% m/m. The calculated values of n and p differed from the values found by the analyzers by 0.02 to 0.04% m/m. From the results of analyses using the Anton Paar analyzer, we can calculate attenuation quotients q as a share of apparent attenuation (p – m) and real attenu-ation (p – n). For Czech beers we get approximate values of 1.239. This corresponds to the calculated value of the slope of the apparent attenuation versus real attenuation for specific gravities of 20 °C/20 °C and for a range of p from1 to 30% m/m (Table 6). Table 7 illustrates the results of analyses provided by RIBM (Research Institute of Brewing and Malting in Prague) from both the Anton Paar analyzer and the dis-tillation method. Calculations are performed for both variants using the BEER COMPOSITION CALCULATOR. For comparison with the results from the Anton Paar analyzer, the input values are A%mas and SGBEER (variant L), and for comparison with the results of the distillation method, the input values are SGE and SGA (variant I). The difference found for the parameters n and p when the re-sults from the beer composition calculator and the Anton Paar analyzer were compared (0.01 to 0.04% m/m) is given by different attenuation quotients q. Compared to the value q = 1.239 from the Anton Paar analyzer, for each p the calculator calculates the corresponding value of q; for Czech beers (extract in original wort 10 to 12% m/m) these values are 1.234 to 1.235 (Table 6).
5 Practical use
In recent years, several dozen new microbreweries have been put into operation in the Czech Republic every year, and there is also a growing unprecedented inter-est in homebrewing. In general, only a saccharometer
Figure 6 Dependenceofapparentattenuationonrealattenuattion
(OE – AE)A% vol =
(2.048 – 0.0126OE)
Tabl
e 6
Calculationoftheslopeofthedependenceofapparentattenuationonrealattenuationforaspecificgravityof20
o C/20
o Cbyalinearregression
p (O
E)
Calc
ulat
ed v
alue
s fro
m ta
ble
4Li
near
regr
essi
on "a
"Ca
lcul
ating
"b"
App
aren
t att
enua
tion
Real
att
enua
tion
Att
enua
tion
quoti
ent
A% m
asn
(RE)
m (A
E)a
ba
= 0,
3895
41 +
0,0
0237
7*p
b =
1/(2
,066
5 - 0
,010
665*
p)
aΔ
a A%
mas
bΔ
bA%
mas
p –
mp
– n
(p–m
)/(p
–n)
10.
320.
350
0.19
30.
3918
0.48
640.
3919
0.00
010.
320.
4864
0.00
000.
320.
810.
651.
242
20.
640.
700
0.39
10.
3950
0.48
900.
3943
-0.0
007
0.63
0.48
900.
0000
0.64
1.61
1.30
1.23
8
30.
961.
050
0.58
60.
3970
0.49
150.
3967
-0.0
003
0.96
0.49
150.
0000
0.96
2.41
1.95
1.23
8
41.
281.
400
0.78
00.
3990
0.49
410.
3990
0.00
001.
280.
4941
0.00
001.
283.
222.
601.
238
51.
611.
750
0.97
80.
4013
0.49
670.
4014
0.00
011.
610.
4967
0.00
001.
614.
023.
251.
238
61.
952.
100
1.17
50.
4037
0.49
940.
4038
0.00
011.
950.
4994
0.00
001.
954.
823.
901.
237
72.
282.
450
1.37
50.
4061
0.50
200.
4062
0.00
012.
280.
5020
0.00
002.
285.
634.
551.
236
82.
622.
800
1.57
50.
4085
0.50
470.
4086
0.00
002.
620.
5047
0.00
002.
626.
425.
201.
236
92.
973.
150
1.77
40.
4109
0.50
750.
4109
0.00
012.
970.
5075
0.00
002.
977.
235.
851.
235
103.
323.
500
1.97
30.
4132
0.51
020.
4133
0.00
013.
320.
5102
0.00
003.
328.
036.
501.
235
113.
673.
850
2.17
50.
4157
0.51
300.
4157
0.00
003.
670.
5130
0.00
003.
678.
827.
151.
234
124.
024.
200
2.37
40.
4180
0.51
590.
4181
0.00
014.
020.
5159
0.00
004.
029.
637.
801.
234
134.
384.
550
2.57
20.
4203
0.51
870.
4204
0.00
014.
380.
5187
0.00
004.
3810
.43
8.45
1.23
4
144.
754.
900
2.77
10.
4227
0.52
160.
4228
0.00
014.
750.
5216
0.00
004.
7511
.23
9.10
1.23
4
155.
115.
250
2.96
90.
4251
0.52
450.
4252
0.00
015.
120.
5245
0.00
005.
1112
.03
9.75
1.23
4
165.
495.
600
3.16
60.
4274
0.52
750.
4276
0.00
015.
490.
5275
0.00
005.
4912
.83
10.4
01.
234
175.
865.
950
3.36
30.
4298
0.53
040.
4299
0.00
015.
860.
5304
0.00
005.
8613
.64
11.0
51.
234
186.
246.
300
3.55
80.
4322
0.53
350.
4323
0.00
016.
240.
5335
0.00
006.
2414
.44
11.7
01.
234
196.
636.
650
3.75
50.
4346
0.53
650.
4347
0.00
016.
630.
5365
0.00
006.
6315
.25
12.3
51.
234
207.
017.
000
3.94
90.
4370
0.53
960.
4371
0.00
007.
020.
5396
0.00
007.
0116
.05
13.0
01.
235
217.
417.
350
4.14
00.
4394
0.54
270.
4395
0.00
017.
410.
5427
0.00
007.
4116
.86
13.6
51.
235
227.
817.
700
4.33
10.
4418
0.54
590.
4418
0.00
007.
810.
5459
0.00
007.
8117
.67
14.3
01.
236
238.
218.
050
4.51
90.
4442
0.54
910.
4442
0.00
008.
210.
5491
0.00
008.
2118
.48
14.9
51.
236
248.
628.
400
4.70
80.
4466
0.55
230.
4466
0.00
008.
620.
5523
0.00
008.
6219
.29
15.6
01.
237
259.
038.
750
4.89
50.
4491
0.55
560.
4490
-0.0
001
9.03
0.55
560.
0000
9.03
20.1
016
.25
1.23
7
269.
459.
100
5.07
80.
4515
0.55
890.
4513
-0.0
001
9.44
0.55
890.
0000
9.45
20.9
216
.90
1.23
8
279.
879.
450
5.25
30.
4537
0.56
230.
4537
0.00
009.
870.
5623
0.00
009.
8721
.75
17.5
51.
239
2810
.29
9.80
05.
433
0.45
620.
5656
0.45
61-0
.000
110
.29
0.56
560.
0000
10.2
922
.57
18.2
01.
240
2910
.73
10.1
505.
607
0.45
860.
5691
0.45
85-0
.000
110
.72
0.56
910.
0000
10.7
323
.39
18.8
51.
241
3011
.16
10.5
005.
781
0.46
100.
5726
0.46
08-0
.000
211
.16
0.57
260.
0000
11.1
624
.22
19.5
01.
242
r = c
orre
latio
n co
effici
ent
slope
inte
rcep
tα
= an
gle
of th
e lin
e w
ith th
e po
sitive
dire
ction
of t
he x
-axi
s
r
= 0.
9999
92
s
lope
= 1
.239
3
inte
rcep
t = -0
.025
6
α
= 5
1o 05'
56"

V. Nohel Kvasny prumysl (2020) 66: 351–364
362
is used to check the technology. In cases where the final beer was prepared from one batch of wort, other beer parameters can be calculated based on the measure-ments of p and m (variant A). Calculations using the beer composition calculator are very accurate. In order for the calculated beer pa-rameters to correspond to reality, the input of the cor-rect p and m values must be ensured. Based on experi-ence from operational measurements in our research mini-brewery in the Litovel brewery, it is recommended to take into account the water with brewer’s yeast for the parameter p, which is why the value found in the fer-mentation cellar is introduced immediately after pitching (not in the brewhouse). When measuring the apparent extract m with a saccharometer, if the beer is not free of CO2 (this can also be ensured by manual shaking (Ba-sařová, 1993)), the CO2 bubbles lighten the saccharom-eter, and this creates an error in comparison with the measurement in beer freed of CO2 by shaking after previ-ous heating to a temperature close to 20 °C (Hlaváček and Lhotský, 1972). Table 8 shows an example of deriving an acceptable correction for CO2 for the apparent extract when measured with a saccharometer (0.2% m/m). Variant C or D can be used to calculate the minimum and maximum values of beer parameters for individual groups (draught, lager) or tax zones (e.g. for p = 11.00 to 11.99% m/m), which are required for audits of certified quality management systems. Brewing parametres, including fer-mentation, generally follow a normal (Gaussian) distribu-tion. Using the mean (μ) and the standard deviation (σ) in the interval μ ± 3σ, we calculate the required limit values. Variants G, H and I can be used in laboratories to check the accuracy of measuring three specific gravities – SGE, SGA and SGBEER – with a pycnometric distillation method.
6 Conclusion
Professor Balling excellently derived the theory of atten-uation, which is of immense importance to brewing. His formula for calculating the extract in original wort from specified values of the real extract and alcohol in finished beer is used worldwide. He introduced important quantities for the fermen-tation process such as apparent and real attenuation, ap-parent and real degree of fermentation, alcohol factors and the attenuation quotient. Alcohol factors and attenuation quotients derived by Balling in the mid-19th century have been published unchanged since at least 1876. Specific gravities of 17.5 °C/17.5 °C were used to determine the extract, and specific gravities of 15 °C/15 °C were used to determine
the alcohol content. Balling’s small formula can be used to calculate the values of apparent extracts m from the tabulated values of attenuation quotients q for known values of the extract in original wort p and the real ex-tract n. For a range of p from 1 to 30% m/m and a specif-ic gravity of 17.5 °C/17.5 °C, a linear dependence of the apparent attenuation on real attenuation (r = 0.99998), which is characterized by a slope of 1.2511 and an angle of α = 51o21‘56 “, can be deduced. In today’s brewing, the values of extract and alcohol are determined from specific gravities of 20 °C/20 °C. An improved Tabarie’s formula was used to calculate the specific gravities of beer to determine the dependence of apparent attenuation on real attenuation. For a range of p from 1 to 30% m/m, a linear dependence of the appar-ent attenuation on the real attenuation (r = 0.999992), which is characterized by a slope of 1.2393 and an angle of α = 51o05’56“, was deduced. The numerical difference of values of the slopes of both lines, or their angles (0o16’0“), is due to different values of attenuation quotients q (for different relative densities of 17.5 °C/17.5 °C and 20 °C/20 °C) and alco-hol factors of apparent attenuation a for the given p, as the alcohol factor of real attenuation b for the given p is constant and equal to the product of aq (a times q) (the q changed, so the a must also change so that their product remains the same). To use Balling’s alcohol factors in current brewing, new alcohol factors of apparent attenuation a were cal-culated for a range of p from 1 to 30% m/m. A formula was derived based on linear regression to calculate the alcohol factors a:
a = 0.389541 + 0.002377p
Alcohol factors of real attenuation b are derived from the equation b = A/(p – n), where a transformed Balling’s large formula is introduced for A[A=100(p–n)/(206.65–1.0665p)]; after modification, the equation has the fol-lowing form: b=1/(2.0665–0.010665p) The calculated values of the alcohol factors of real at-tenuation b are identical to the alcohol factors derived by Balling. The spreadsheet contains some variants of beer composition calculations based on the inputs of two parameters (BEER COMPOSITION CALCULATOR). The calculator results can be exported in PDF format. The calculator can be used by practice of mini-breweries or home brewing to determine the composition of beer, in laboratories to check the accuracy of beer analysis by the reference (distillation) method and also in teaching in brewing schools.

Tabl
e 7
ComparisonofbeeranalysisresultsfromanAntonPaaranalyzerandthedistillationmethod
withtheresultsofcalculationwiththecalculator(BCC)
Beer
RIBM
– b
eer f
rom
Ant
on P
aar a
naly
zer
BCC
– va
riant
LRI
BM –
bee
r by
disti
llatio
nBC
C –
varia
nt I
Δ p
desti
llatio
n –
Ant
on P
aar
Sour
ce o
f cal
cula
tion
A% m
as.
A% v
ol.
n (R
E)SG
BEER
p (O
E)So
urce
of c
alcu
latio
nA%
mas
.A%
vol
.n
(RE)
SGE
SGA
p (O
E)
1
RIBM
0.18
0.23
6.31
1.02
457
6.67
RIBM
0.
210.
276.
27
1.02
486
0.99
962
6.69
0.02
BCC
0.23
6.30
6.66
BCC
0.21
0.28
6.29
6.71
0.05
Δ R
IBM
– B
CC0
0.01
0.01
Δ R
IBM
– B
CC0
-0.0
1-0
.02
-0.0
2
2
RIBM
1.54
1.99
5.58
1.01
901
8.63
RIBM
1.
582.
045.
51
1.02
184
0.99
703
8.63
0
BCC
1.98
5.55
8.59
BCC
1.58
2.03
5.54
8.66
0.07
Δ R
IBM
– B
CC0.
010.
030.
04Δ
RIB
M –
BCC
00.
01-0
.03
-0.0
3
3
RIBM
4.39
5.62
4.96
1.01
151
13.4
1RI
BM
4.36
5.56
4.82
1.01
918
0.99
219
13.2
2-0
.19
BCC
5.61
4.92
13.3
7BC
C 4.
365.
574.
8713
.27
-0.1
0
Δ R
IBM
– B
CC0.
010.
040.
04Δ
RIB
M –
BCC
0-0
.01
-0.0
5-0
.05
4
RIBM
4.56
5.84
5.24
1.01
234
13.9
9RI
BM
4.52
5.78
5.10
1.02
038
0.99
194
13.7
8-0
.21
BCC
5.84
5.20
13.9
5BC
C 4.
515.
775.
1713
.83
-0.1
2
Δ R
IBM
– B
CC0
0.04
0.04
Δ R
IBM
– B
CC0.
010.
01-0
.07
-0.0
5
5
RIBM
3.88
4.94
3.93
1.00
831
11.4
6RI
BM
3.86
4.92
3.81
1.01
518
0.99
304
11.3
2-0
.14
BCC
4.95
3.90
11.4
4BC
C 3.
854.
913.
8711
.36
-0.0
8
Δ R
IBM
– B
CC-0
.01
0.03
0.02
Δ R
IBM
– B
CC0.
010.
01-0
.06
-0.0
4
6
RIBM
4.14
5.27
3.90
1.00
774
11.9
2RI
BM
4.11
5.23
3.80
1.01
508
0.99
262
11.7
8-0
.14
BCC
5.27
3.87
11.9
0BC
C 4.
105.
223.
8411
.80
-0.1
0
Δ R
IBM
– B
CC0
0.03
0.02
Δ R
IBM
– B
CC0.
010.
01-0
.04
-0.0
2
7
RIBM
3.71
4.74
3.96
1.00
870
11.1
9RI
BM
3.72
4.74
3.90
1.01
552
0.99
327
11.1
5-0
.04
BCC
4.73
3.93
11.1
5BC
C 3.
714.
743.
9611
.19
0.04
Δ R
IBM
– B
CC0.
010.
030.
04Δ
RIB
M –
BCC
0.01
0-0
.06
-0.0
4
8
RIBM
3.61
4.60
3.80
1.00
825
10.8
4RI
BM
3.59
4.58
3.68
1.01
461
0.99
348
10.6
9-0
.15
BCC
4.60
3.77
10.8
1BC
C 3.
594.
573.
7310
.73
-0.0
8
Δ R
IBM
– B
CC0
0.03
0.03
Δ R
IBM
– B
CC0
0.01
-0.0
5-0
.04

V. Nohel Kvasny prumysl (2020) 66: 351–364
364
7 Acknowledgements
The author of this article would like to thank Mrs. RNDr. Jana Olšovská, Ph.D. from RIBM Prague, for providing comparative analyses of beers performed on an Anton Paar analyzer and using the distillation method.
8 ReferencesASBC (2020). Tables Related to Determinations on Wort, Beer, and Brewing
Sugars and Syrups [20.03.2020]. Available from: https://www.asbc-net.org/Methods/Tools/Tables/Documents/TableWortBeerBrew-ingSugars.pdf#search=Determination%20on%20Wort%2C%20Beer%2C%20and%20Brewing%20Sugars%20and%20Syrups
Anton Paar (© 2007). Reference Manual, Alcolyzer Plus Beer, Beer Ana-lyzing System, Firmware Version: V5.01
Albl, V. (1990). Výroba piva a sladu pro učební obor biochemik-biochemič-ka se zaměřením pro: výrobu piva a sladu (trans. Production of beer and malt for the field of study biochemist with a focus on: production of beer and malt). Institut výchovy a vzdělávání MZVž ČR v Praze, Prague, 363 pp. ISBN 80-7105-003-2. (Available only in Czech)
Basařová, G., Doležalová, A., Kahler, M., Čepička, J. (1993). Pivovar-sko-sladařská analytika (trans. Brewing and malting analytics). Mer-kanta s.r.o., Prague, 966 pp. (Available only in Czech)
Basařová, G., Šavel, J., Basař, P., Lejsek, T. (2010). Pivovarství, Teorie a praxe výroby piva (trans. Brewing, Theory and practice of beer production). VŠCHT Praha, Prague, 863 pp. ISBN 978-80-7080-734-7. (Available only in Czech)
Bednář, J., Štekr, K., Vančura, M. (1967). Pivovarsko-sladařské tabulky (trans. Brewing and malting tables). SNTL, Prague, 137 pp. (Avail-able only in Czech)
Cutaia, A.J., Reid, A., Speers, R.A. (2009). Examination of the Relationship Between Original, Real and Apparent Extracts, and Alcohol in Pi-lot Plant and Commercially Produced Beers. J. Inst. Brew. 115 (4): 318–327.
Hardwick, W.A. (1995). Handbook of Brewing. Ed. Marcel Dekker Inc. New York, 714 s. ISBN 0-8247-8908-3.
Hlaváček, F., Lhotský, A. (1972). Pivovarství (trans. Brewing), 2. přepraco-vané vydání, SNTL Prague, 539 pp. (Available only in Czech)
Lhotský, A. (1954). Technologie sladu a piva, 2. díl Výroba piva a strojní zařízení pivovarů, pomocné úkony (trans. Malt and beer technology, part 2 Beer production and brewery machinery, auxiliary operations. SNTL Prague, 423 pp. (Available only in Czech)
Nielsen, H., Aastrup, S. (2004). Improving Tabarié’s Formula. Scandinavi-an Brewers’ Rewiew, 61(4), 30–34.
Nielsen, H. (2004). New Formulas for sharp Calculations. World Brewing Congress2004, San Diego, California U.S.A.
Nielsen, H., Kristiansen, A.G., Lasen, K. M., Erikstrøm, C. (2007). Ball-ing's formula - scrutiny of a brewing dogma. Brauwelt Interna-tional, II,90-93. Available from: https://www.scribd.com/docu-ment/334496873/Balling-Formula-Scrutiny-of-a-Brewing-Dogma
Schmelzer, A.St., Skvrna F. (1877). Stručné pivovarnictví (trans. Brief Brewing). Redakce „Kvasu“, Prague, 223 pp. (Available only in Czech)
Suk, J.T. (1880). Nový Poupě (trans. The New Poupě), 1. díl. Slavík & Bor-ový, Prague, 254 pp. (Available only in Czech)
Šavel, J. (1989). Použití výpočetní techniky v pivovarských laboratořích (trans. Use of computer technology in brewing laboratories). Kvasny prumysl, 35(3), 69–71. Availailable in Czech from: https://www.kvasnyprumysl.cz/pdfs/kpr/1989/03/02.pdf
Šavel, J., Košin, P., Brož, A. (2015). Balling Alcohol Factors from the Per-spective of Contemporary Brewing. Kvasny prumysl, 61(4), 120–128. https://doi.org/10.18832/kp2015015
Šula, J. (1898). Návod ku zkoušení surovin, produktů a odpadků pivo-varnických, 1. díl Rozbory chemické. Podporou „Jednoty k založení a vydržování výzkumného ústavu pro průmysl pivovarnický v Čechách“(trans. Instructions for testing of raw materials, products and brewery waste, Part 1 Chemical analysis. With the support of the “Unity for the Establishment and Maintenance of the Research Institute of Brewing Industry in Bohemia”. Nákladem vlastním (At my own expense), Prague, 336 pp. (Available only in Czech)
Thausing, J.E. (1882). Die Theorie und Praxis Malzberaitung und Bierfab-rikation, 2. ed., J.M. Gebhardt`s Verlag, Leipzig, 880 pp.
Table 8 DerivationofCO2correctionduringoperationalmeasurement ofapparentextractwithasaccharometer(%m/m)
Sample numberMeasurement with a saccharometer Anton Paar analyzer
A B C
1 2.75 2.60 2.56
2 3.25 3.10 3.09
3 3.10 2.95 2.95
4 3.30 3.00 3.07
5 3.15 2.90 2.86
6 3.10 2.85 2.85
7 2.76 2.56 2.62
8 2.72 2.51 2.57
average 3.02 2.81 2.82
Δ (A–B) → 0.21 A: operational measurementB: beer sample from measurement A heated to 20 oC and freed of CO2 by shakingC: beer from measurement B filtered through kieselguhr on filter paperΔ (A–C) → 0.19