Embed Size (px)
Citation preview

BALLAST WATER MANAGEMENT SYSTEMS
Proceedings of the Global RampD Forum on Compliance Monitoring
and Enforcement ndash The Next RampD Challenge and Opportunity
26-28 October 2011
İstanbul Turkey
Edited by Arzu Olgun Fatma Telli Karakoccedil Fredrik Haag
A REPUBLIC OF TURKEY AND IMO-GLOBALLAST INITIATIVE
ii
A TUumlBİTAK MRC ENVIRONMENT INSTITUTE
PUBLICATION IN COLLABORATION WITH THE GEF-
UNDP-IMO GLOBALLAST PARTNERSHIPS PROGRAMME
TUumlBİTAK MRC
PO BOX 41470
KOCAELI-TURKEY
First published in Turkey in 2012
All papers Copyright copy TUumlBİTAK-MRC Publications 2012 The views expressed are those of
the authors and do not necessarily reflect the view or policy of TUumlBİTAK - MRC or the GEF-
UNDP-IMO GloBallast Partnerships Programme TUumlBİTAK-MRC Publications and the
Editors while exercising the greatest care in compiling this volume do not hold themselves
responsible for the consequences arising from any inaccuracies therein
All rights reserved Except for quotation of short passages for the purposes of criticism and
review no part of this publication may be reproduced stored in a retrieval system or
translated in any form or by any means electronic mechanical photocopying recording or
otherwise without the prior permission of the publisher
ISBN 978-975-403-730-2
Cover image provided by Onur Tan
English Edition by Stephanie Messina Dikeccedil
iii
CONTENTS
Acknowledgements v
Foreword vii
Introduction xi
TUumlBİTAK Marmara Research Center
Opening Addresses 1
IMO- Marine Environment Division
Forum program 7
SELECTED CONFERENCE PAPER
Limitations with respect to vital staining techniques 13 for use in treated ballast water
August D Tobiesen Anne-Marie Bomo Stephanie Delacroix Aina C Wennberg and Helge Liltved
Ecological risk of treated ballast water a mesocosm experiment 21
AC (Andrea) Sneekes NHBM (Klaas) Kaag and EM (Edwin) Foekema
Technology of shiprsquos ballast water treatment using middotOH 31 radicals based on IMO Guidelines
Mindong Bai Nahui Zhang Zhitao Zhang Yiping Tian Xiyao Bai
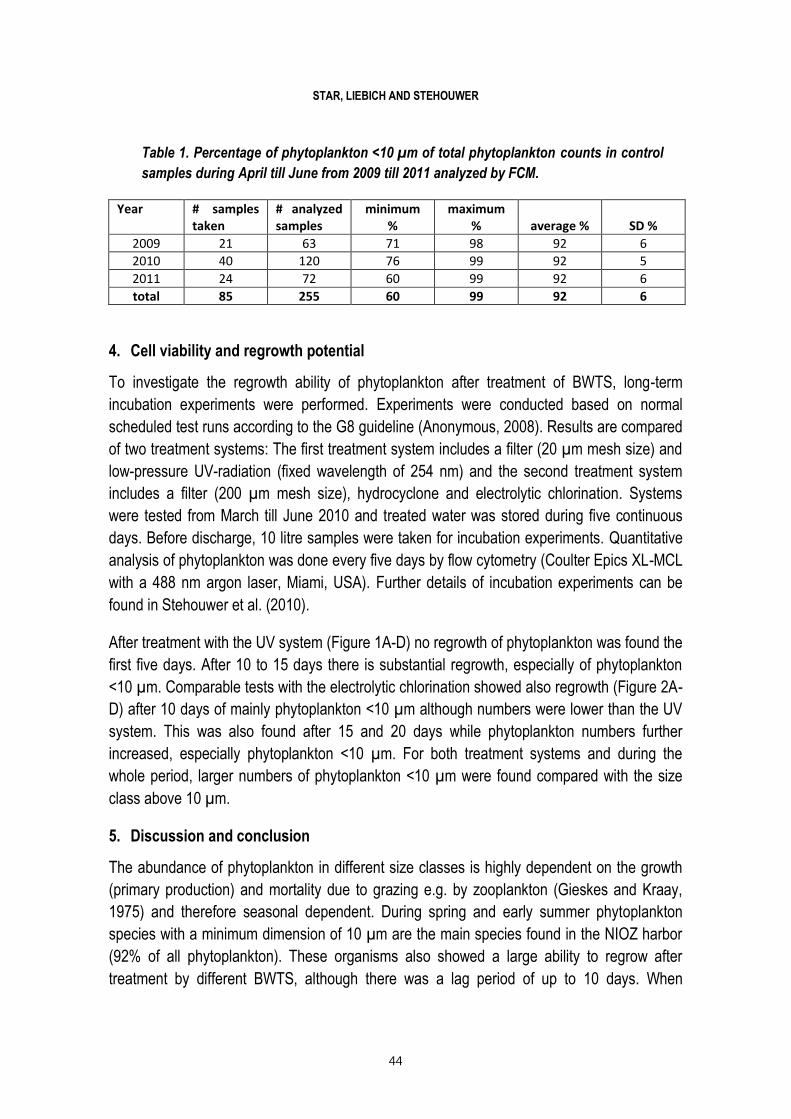
The forgotten fraction The importance of organisms 41
smaller than 10 microm when evaluating ballast water treatment systems
Isabel van der Star Viola Liebich Peter Paul Stehouwer
ERMA first BWTS an integrated and modular ballast water 51 treatment system Performance and compliance with IMO guidelines Efi Tsolaki Konstantinos Stampedakis Yannis Moulinos Nikos Kyritsis
Lab-Scale Chlorine Generation 67
Ceren Bilgin Guumlney Fatma Youmlnsel
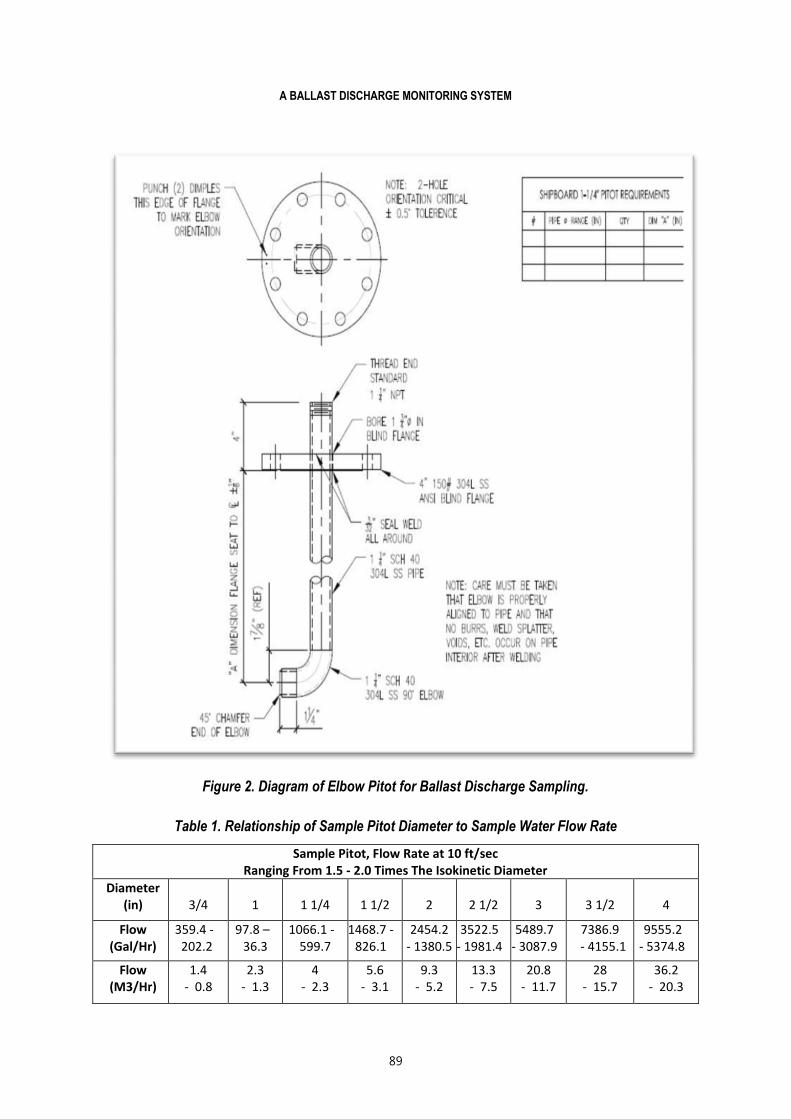
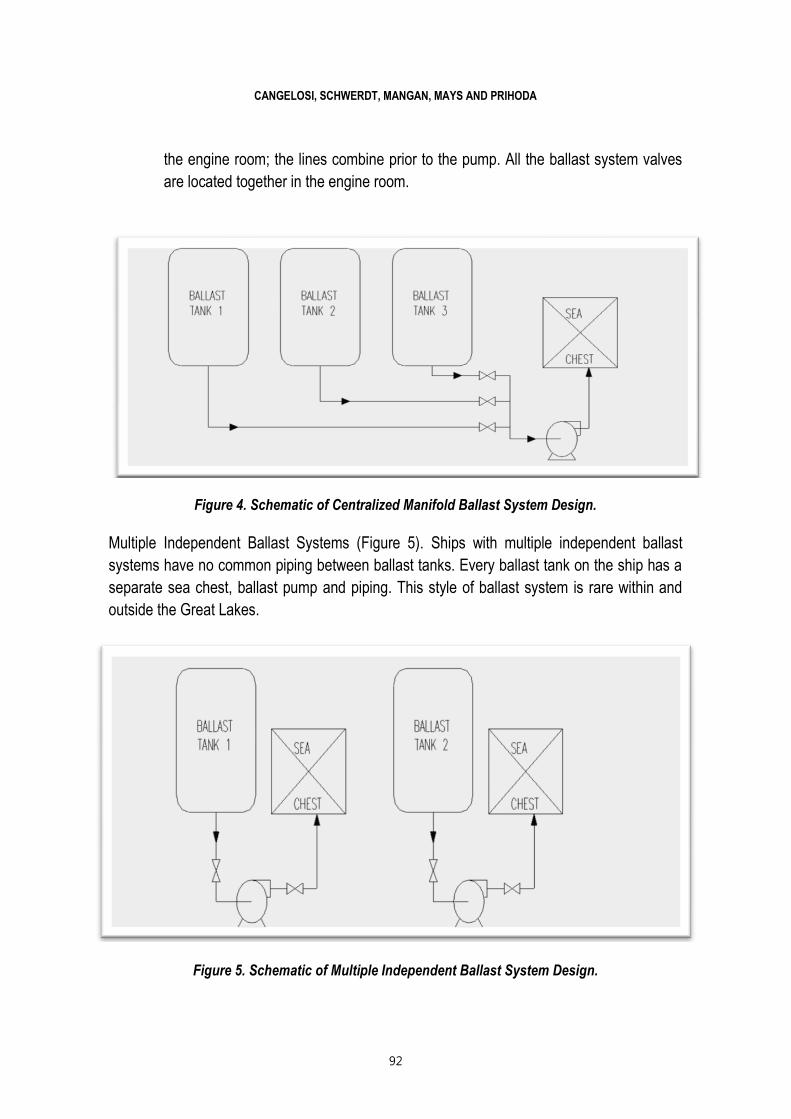
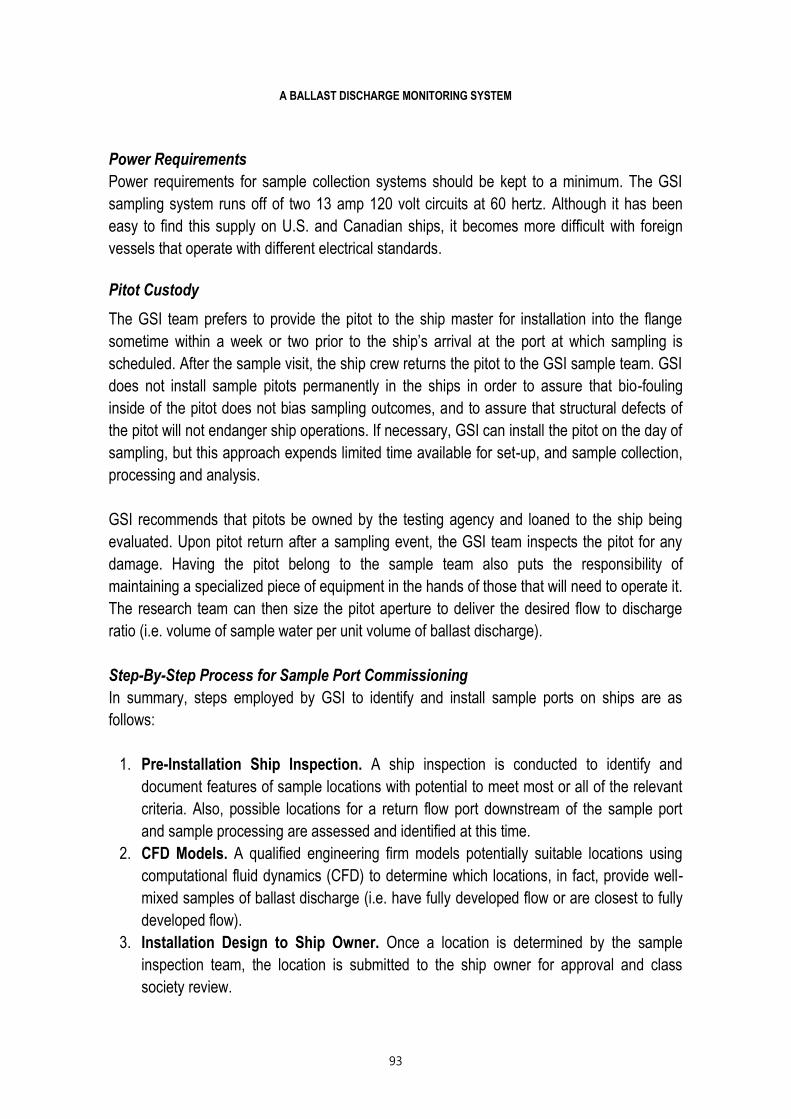
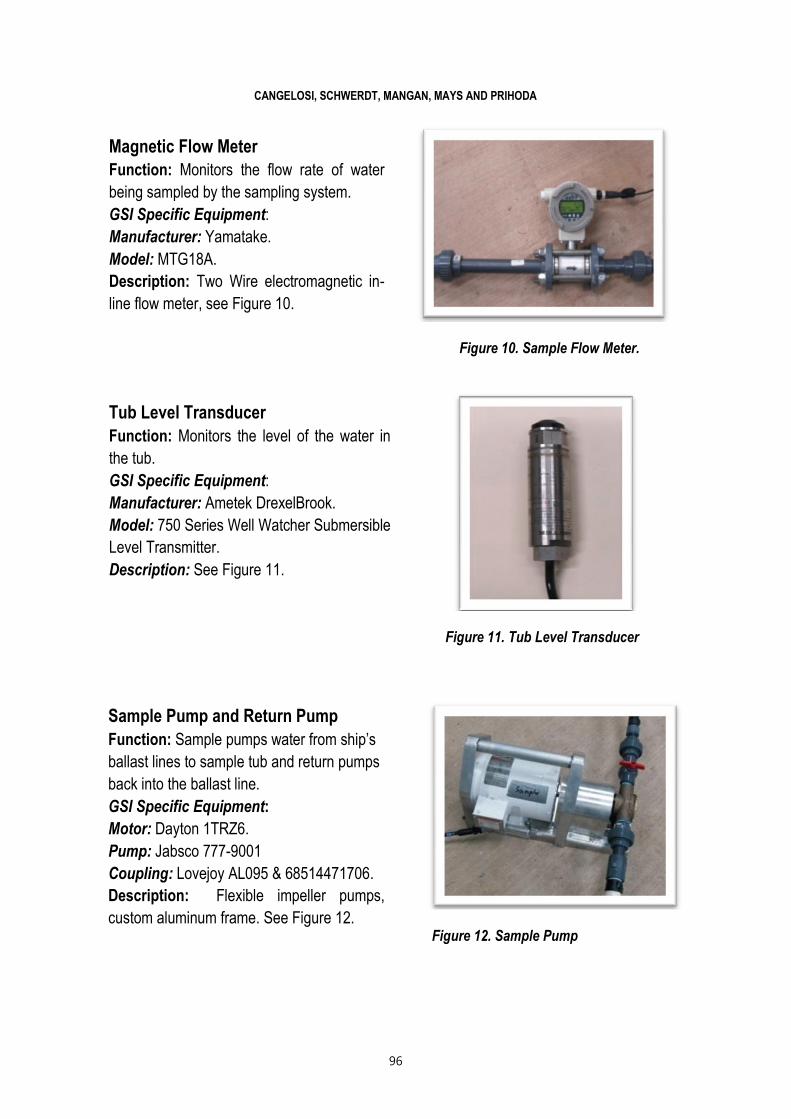
A ballast discharge monitoring system for great lakes 83 relevant ships a method for researchers ship owners and agency officials
Allegra Cangelosi Tyler Schwerdt Travis Mangan Nicole Mays Kelsey Prihoda
iv
Sampling of ballast water for compliance control 109
Stephan Gollasch Matej David
Validation of a shipboard filer skid for sampling zoo plankton 115 from ballast water
Matthew First
Efforts to develop a ballast water detecting device 117 Goran Bakalar
A portable sensitive plankton viability assay for IMO 127 shipboard ballast water compliance testing
Nick Welschmeyer Brian Maurer
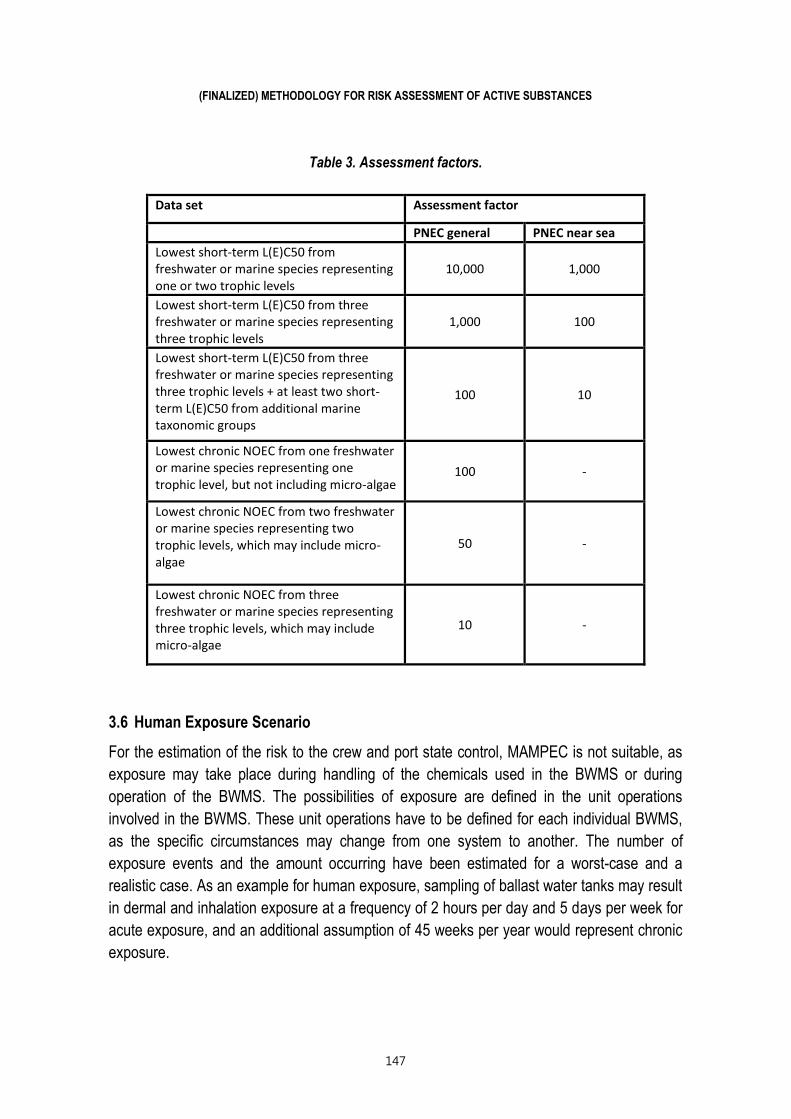
Finalized methodology for risk assessment of active 141 substances under procedure (G9) Jan Linders
Risk assessment for exemptions from BWM 151 the Intra-baltic HELCOM study
Matej David Stephan Gollasch Erkki Leppaumlkoski
Ballast Water Management in Turkey ndash an overview 157
Murat Korccedilak
Biological efficacy of electrolytic BWMs 171 (electro-cleentm system) during on board installation
Yong Seok Park Dong Hyun Shon Gwang Ho Lee Hyun Ju Moon Hyung Geun Jeon
Assessing of the Ballast Water Risk in Ceyhan Marine Terminal 177
Arzu Olgun Aslı Suha Doumlnertaş Cihangir Aydoumlner Yasemin Guumlmuumlşluumloğlu
Closing remarks 185
Mr Espinoza Ferrey Director MED IMO
Information about organizers 189
v
ACKNOWLEDGEMENTS
This publication contains a selection of presentations and papers the IMO - GloBallast Global
RampD Forum on Ballast Water Management ldquoCompliance Monitoring and Enforcement the Next
RampD Challengerdquo which was held in İstanbul Turkey on 26-28 October 2011
Special thanks are owed to the partners and sponsors who made this event possible in particular
IMarEST and ICS
Our very special thanks go to the Mr Jo Espinoza-Ferrey Director Marine Environment Division
IMO for their kind attention contribution welcoming addresses and his closing remarks to the
Forum
We would like to express our sincere gratitude to Dr Oumlzkan Poyraz Mr Oumlmer Tıktık and Mr
Murat Korccedilak from the Undersecretariat for Maritime Affairs (UMA) for all their valuable support
and taking part in the organization process of the Forum
Many thanks are also due to our colleagues for their hard work who supported the 2011 RampD
Forum from IMO in particular Mr Fredrik Haag Ms Aicha Cherif and Dr Joseacute Matheickal as well
as Dandu Pughiuc A special acknowledgement must go to the GloBallast Partnerships
Programme of the IMO for their initiative in recognizing the possibilities for this Forum towards
enhancing the momentum of the discussion on ballast water treatment and management systems
In particular we would like to thank the International Scientific Advisory Committee who aided into
selecting the topics and the papers for the Forum and of course we would also like to thank
every one of those thirty-five expert presenters for their addresses presentations and
interventions in the discussions as well as for their knowledgeable contributions of papers for
publication in these proceedings
We would like to express our heart-felt thanks to especially Dr Oumlzen Arlı Kuumlccediluumlkosmanoğlu
Emrah Ali Pekdemir İbrahim Tan and our friends in TUBITAK MRC Environment Institute for the
great job they achieved in all the relevant activities A special note of appreciation is also for
Stephanie Messina Dikeccedil for her outstanding efforts in the linguistic edit work
Arzu OLGUN Ahmet BABAN
TUumlBİTAK MARMARA RESEARCH CENTER
vii
FOREWORD
Global RampD Forum on Ballast Water Management ldquoCompliance Monitoring and Enforcement
the Next RampD Challengerdquo was held with the initiative of the GEF-UNDP-IMO Globallast
Partnerships Programme the TUumlBİTAK Marmara Research Center (TUBITAK- MRC) and
the Turkish Undersecreteriat for Maritime Affairs (UMA) The RampD Forum was held in
İstanbul Turkey on October 26 - 28 In conjunction with the Forum two different workshops
and conferences were held The Forum was attended by more than 130 participants
representing technology developers the maritime industry academia and the international
and regional agencies from around the world and was considered a major success by forum
participants
The third meeting of the Global Expert Forum on Ballast Water Test Facility Harmonization
was held on 24-25 October continuing their discussions and efforts to further harmonize the
approaches to testing and verifying ballast water treatment technologies The Forum was also
preceded by the 2nd IMO-IMarEST Shipbuildersrsquo Forum on Ballast Water Management on 25
October
The RampD Forum itself focused on ldquoCompliance Monitoring and Enforcement (CME) ndash the next
RampD issuerdquo and was opened by UMA IMO and TUBITAK The welcome speech on behalf
of IMO was delivered by Mr Jo Espinoza-Ferrey Director MED
The welcome remarks were followed by keynote speeches Ms Theresa Crossley Head of
Implementation European Maritime Safety Agency (EMSA) gave a keynote speech where
she highlighted the EU agenda for invasive alien species and EMSArsquos ballast water
programme and research in terms of compliance Mr Alfonso Castillero Director General
Merchant Marine Panama Maritime Authority delivered a powerful speech ensuring the
participants that Panama is committed to doing all it can as quickly as it can to address
marine biosecurity issues in ways which will safeguard the shipping industry interests and
deliver substantial net environmental benefit
viii
Over the three days of the Forum a breadth of topics were presented including the
experiences from testing of technologies for compliance Port State Control issues an
overview of current ballast water technologies and how these meet the compliance criteria
sampling and monitoring (including latest developments in rapid diagnostic tools) risk
assessments and related tools in the CME framework regional and developing country
perspectives on CME as well as the ship-ownersrsquo and shipbuildersrsquo perspectives
The busy agenda allowed almost every community to share their views and ideas on how to
meet the challenge but also their concerns and different perspectives The Forum also
illustrated the dedication of all those present from the shipping industry academia and
Administrations
There were very informative presentations followed by wide-ranging and active discussions
during both the plenary and panel sessions that also addressed issues such as the challenge
to meet the IMO Ballast Water Convention standards compliance and monitoring
A total of 35 technical papers and 8 posters were presented over the three days covering the
testing of the technologies for compliance port state control issues and experiences risk
assessments and related tools in the CME framework sampling and monitoring including
latest developments in rapid diagnostic tools performance of current technologies in meeting
the compliance criteria developing country perspective on CME and compliance for
alternative technologies
The Forum concluded with a Panel discussion highlighting the importance of the RampD efforts
now that the entry into force of the BWM Convention is imminent but also on the need for the
technologies to be validated for ship use and for the receiving environment to be closely
monitored The Forum was also informed that the next RampD Forum will take place in Republic
of Korea in October 2013 and that the next ICBWM (International Conference of Ballast
Water Management) will take place in Singapore in November 2012
ix
Over the course of the three days the significant progress made since the last RampD Forum
which was held in Malmouml Sweden in January 2010 was apparent For example in early
2010 there were 7 ballast water treatment systems having received their Type Approval
certificates At the time of the meeting in Turkey this had more than doubled (17 systems)
with a further 30-40 systems in different stages of development The theme of the Forum
taking a more in-depth look at the CME was thus very timely Even though challenges are
undoubtedly still there as the field of ballast water management is still developing the ever-
growing pool of knowledge and experiences around the world is an encouraging sign that the
global community is continuing to rise to the challenge determined to work together to
address the issue
Solutions that cater to the various needs of the shipping industry are being developed but
what is now more needed than ever is to share the growing amount of operational
experiences to overcome the remaining hurdles We therefore believe that conferences and
forums a such as the IMO-GloBallast RampD Forum will therefore continue to provide a crucial
platform for exchanging views end inspire constructive dialogue
The Organizing Committee
Dr Mustafa Tırıs Dr Arzu Olgun Dr Ahmet Baban Ms Oumlzen Arlı Kuumlccediluumlkosmanoğlu Dr Jose Matheickal
Dr Oumlzkan Poyraz Mr Oumlmer Tıktık Mr Murat Korcak Mr Fredrik Haag Ms Aicha Cherif
xi
INTRODUCTION
The increasing globalization of the world economy in recent decades has unavoidably
spurred international trade While this development has brought some favorable opportunities
around the globe it has caused some undesirable consequences In this sense one of the
areas in which international trade has raised concerns has been environmental sciences
While the debates on this issue include a multidimensionality based on different interest
groups within the field certain adverse effects emerged are obviously undeniable One of
these effects which needs immediate policy attention on a global base appears to be the
ballast water discharge of sea vessels
As well known maritime transportation constitutes a major part of international trade
particularly in terms of tonnage and hence is an inevitable means for transferring goods
However the sea vessels operating for this purpose throughout global waters do not only
transfer goods but also a variety of biological organisms including animals plants and
bacteria some of which deteriorate the aquatic ecosystem This unfavorable fact
unfortunately is led by the ballast water taken in by ships for stabilization purposes which is
discharged upon the loading of cargo Considering the huge amount of ballast water used by
the sea vessels due to the significant volume of maritime trade the danger posed for the
planet is certainly nontrivial
The main problem is that because the ballast water unintentionally transmits the species of a
certain region to another one the biological materials ending up alive at their new location
can act in an invasive manner to reproduce and establish a population Such behavior of
those alien organisms poses a threat for the native ones in terms of crowding-out or
destruction resulting in damage to the habitat they belong to
Various studies have shown that thousands of different species are carried in ballast tanks
which significantly threaten the biodiversity in the seas around the globe It is also underlined
in these studies that the rate as well as the extension of the bio-invasions continue to
increase affecting not only the marine environment but also the human health in an adverse
manner Hence the problems caused by invasive species de-ballasted into new national
xii
waters have been experienced by many countries to date including Turkey In this regard
the research has revealed that Turkish coasts host 400 non-native species a significant part
of which was brought by ships Among these one of the biggest damages known so far was
caused by the filter-feeding North American comb jelly Mnemiopsis leidyi that depleted a
considerable amount of native plankton stocks in the Black Sea generating a major economic
loss for the commercial fishery in the region
Therefore Turkey is quite familiar with and very conscious about the ballast water problem
and considers it one of the key environmental priorities to be handled both at national and
international levels as the solution lies at the heart of global cooperation That is why Turkey
has completed a national initiative to address the related threat by commissioning a one
million US Dollar project which has been conducted with collaboration between the
Undersecretariat for Maritime Affairs of Turkey (UMA) and the Scientific and Technological
Research Council of Turkey (TUBITAK) with the purpose of producing a synergy to develop
an operational ballast water management strategy and system in the country
Within the framework of the project an inventory of the maritime transport activities of the
Turkish coasts has been developed in the form of a database system in order to determine
the quantity and sources of the ballast water discharges at the Turkish ports In this
framework all these ports have been subjected to a risk assessment process using the
GloBallast Risk Assessment Methodology Furthermore a Geographical Information System
(GIS) as well as an Invasive Species Database have been developed during the project
period
So Turkey takes the issue seriously and keeps investing in the RampD activities in the field in
order to offer effective solutions to the problem In this regard we gladly hosted the Global
RampD Forum on Ballast Water Management in Istanbul in order to create a platform for
international participants to discuss the related subjects ranging from treatment technologies
to shipbuilding As expected it resulted in the following outcomes
xiii
Achieving close and fruitful collaboration among the scientists and administrators
Enhancing the awareness towards risks imposed by BW handling and transport
Providing the opportunity for the Turkish shipping sector to improve knowledge and
make assessment and projection for the existing conditions and future needs
Disseminating innovative methodologies and technologies for ballast water
monitoring and management
Adapting for the compliance of legislative issues and their relevant implementation
practices
Lastly it is important to note that Turkey has started the ratification procedure for the Ballast
Water Convention and hence it is believed that the successful results of the Global RampD
Forum on Ballast Water Management held in Istanbul would certainly have a positive impact
on relevant developments I am sure that this proceedings of the Forum will help disseminate
the research results on recent developments in the area of ballast water management and
benefit the scientists and researchers who try to bring solutions to the current issues
Prof Dr İbrahim Dinccediler (Acting) President of TUumlBİTAK MRC
1
Global RampD Forum on Ballast Water Management
ldquoCompliance Monitoring and Enforcement the Next RampD Challengerdquo
Istanbul Turkey
26-28 October 2011
Opening address by Mr Jo Espinoza-Ferrey
Director Marine Environment Division IMO
Welcome to Turkey
Dr Poyraz Director General of the Undersecretariat for Maritime Affairs
Dr Baban Acting Director of Environment Institute Marmara Research Center TUBITAK
Distinguished Panel members participants
Ladies and Gentlemen
It is a great pleasure to be with you here in Istanbul for this fourth Global Research and
Development Forum on Ballast Water Management
Dear friends The news of the devastating earthquake in Eastern Turkey has filled all of us with great
sadness even as we rejoice for the safe discovery of survivors and for the courage and
untiring determination of all those involved in the rescue operations
On behalf of the Member States of the International Maritime Organisation our Secretary-
General Mr Efthimios Mitropoulos and all of us in the Secretariat I wish to convey to the
Government and people of Turkey and especially to all those directly affected by the
earthquake our most sincere condolences and deep sympathy
As you may know IMO has arranged RampD conferences on Ballast Water Management
for almost a decade ndash in fact since 2002 The first two conferences focused on treatment
technologies Back then what has now grown into an industry and global market of its own
2
was just in its infancy and the RampD Fora held at IMO Headquarters were part of our strategy
to assist in the research and development efforts that were starting to grow around the world
The most recent and third RampD Forum was held in January 2010 hosted by the World
Maritime University in Malmouml Sweden That event focused on the emerging alternative
solutions to ballast water management During that wintery week in Malmouml participants were
introduced to solutions such as variable buoyancy concepts thermal systems applying
retrieved heat as well as single source systems to treat a variety of waste streams onboard
to mention but a few During the pre-conference workshop an open and constructive
discussion took place on how to prove equivalency between systems approved under the G8
and G9 Guidelines of the Convention and these new emerging ideas Also as a side-
meeting to the RampD Forum the worldrsquos test facilities for ballast water treatment systems met
for the first time to plant the first seeds for a global network on harmonization of testing
procedures
The third Forum emphatically demonstrated that the RampD community is ready to take on the
challenge of meeting the needs of the shipping industry when it comes to adapting to the
regulatory regime under the Ballast Water Management Convention Since then and
although it is only 18 months ago we have come even further and it is most pleasing to be
able to inform you that during the sixty-second session of IMOrsquos Marine Environment
Protection Committee which was held in July earlier this year the Committee endorsed a
procedure for approving lsquoother methodsrsquo of ballast water management in accordance with
regulation B-37 of the Convention This will certainly open the door for new methods and
concepts to prevent risks arising from the transfer of invasive species
In addition as of today 17 treatment systems have received type approval under the G8 or
G9 Guidelines which means that there are indeed a variety of technologies out there to meet
the demand from the shipping industry
3
And not least we now have 30 Parties to the Convention which actually means that the only
remaining hurdle for the Convention to enter into force is the tonnage criteria The current
contracting Parties represent 2644 of the gross tonnage of the worldrsquos merchant shipping
whereas 35 is required for the Convention to enter into force I therefore urge all of you in
a position to do so to promote the earliest possible ratification of the Convention by your
Governments so that the benefits to the environment that it was designed to deliver can be
attained expeditiously
So with this recent progress in mind what are the next challenges facing us Well as we get
closer to entry into force and countries prepare for implementation of the Convention it is
clear that there is a need to address the specific challenges of monitoring compliance with
and the enforcement of the Convention And in this context there is no doubt that the RampD
community will be playing a pivotal role This is exactly why we decided that the theme for this
yearrsquos RampD Forum should be ldquoCompliance Monitoring and Enforcement the next RampD
challenge and opportunityrdquo
The RampD Forum relay baton has now been taken over by the Republic of Turkey welcoming
us to and hosting this yearrsquos Forum in the beautiful historic and certainly maritime city of
Istanbul We are extremely grateful to our colleagues and friends in the Turkish Prime
Ministryrsquos Undersecretariat for Maritime Affairs and to TUBITAK the Scientific and
Technological Research Council of Turkey who have worked very hard over the last six
months or so to make this event possible And our thanks go also to the ICS and IMarEST for
their sponsorship of this weekrsquos activities
But even though the Forum starts today there have already been plenty of activities earlier
this week On Monday and yesterday the worldrsquos ballast water treatment test facilities
convened for their third meeting This is a unique and truly commendable effort with those
involved in the testing of treatment systems having recognized the need for a constructive
and continuing dialogue on this issue with a view to harmonize test procedures and
reporting Their aim is to set minimum testing standards and to strengthen cooperation and
4
exchange of information between the test facilities in order to improve the comparison of
testing and reporting of systems This will both increase the buyersrsquo confidence in the
products and have positive impacts on comparison of the systemsrsquo performance which will be
highly relevant for compliance monitoring and enforcement In their meeting over the last two
days representatives from Administrations and class societies were invited to discuss their
experiences and needs on issues such as reporting of test results The next step is to
formalise this network through the signing of a MoU
In addition to that activity the second IMO-IMarEST Shipbuildersrsquo Forum on Ballast Water
Management has also been held here at this hotel The intention of the Shipbuildersrsquo Forum
was to provide the latest information to shipbuilders and ship repair yards in particular on
those issues in which they will play a crucial role such as installation and retrofitting of ballast
water treatment systems This one-day Forum therefore saw presentations from ship
owners class societies vendors of systems IMO and IMarEST Furthermore it was an
opportunity for useful open dialogue among those that will be involved in the task of making
sure that the world fleet is ready for the Convention requirements when it enters into force
So the week has already gotten off to a flying start and we have a very busy programme for
the next three days We will have the opportunity to discuss issues such as testing for
compliance experiences with port State control the current state when it comes to ballast
water treatment technologies latest developments on sampling and monitoring and not least
the developing country perspective
Ladies and gentlemen
Before the detailed technical sessions start you will have the opportunity to listen to the views
of three keynote speakers - three extremely relevant perspectives on the Ballast Water
Management Convention delivered by Mr Dandu Pughiuc from IMO Ms Theresa Crossley
from the European Maritime Safety Agency (EMSA) and Mr Alfonso Castillero from the
Directorate of Merchant Marine in the Panama Maritime Administration Providing you with
5
views from the global regional and national levels I am sure that these three speakers will
give us an excellent backdrop for the presentations and discussions that follow
Fellow participants I certainly look forward to the debates and exchange of ideas and views
that lie ahead of us in the next three days and I am sure you do too
So on behalf of IMO and with renewed thanks to the Government of Turkey and TUBITAK
for hosting what promises to be a most stimulating event I hereby welcome you to the fourth
IMO-GloBallast RampD Forum on Ballast Water Management and I wish you a great
conference
Or as they say over here İstanbul`a hoşgeldiniz ve bu konferansa hoşgeldiniz
Thank you
7
FORUM PROGRAM
Tuesday 25 October
0830 - 0900 Registration
0900 ndash 0915 Welcoming remarks
UMA TUBITAK-MAM IMO-GloBallast and IMarEST
0915 ndash 0945 Introduction The regulatory framework - the Ballast Water Convention and its
implication for shipbuilders and repair yards
Jose Matheickal IMO-GloBallast
0945 ndash 1030 Keynote address Ship-owners Perspectives on Ballast Water Management
Options Experiences and concerns
William Nugent OSG
1030 ndash 1100 Coffee break
1100 ndash 1145 Ballast Water Treatment Technologies - Technical considerations experiences and
concerns in retrofitting and new-builds
Jad Mouawad DNV
1230 ndash 1400 Lunch break
1400 ndash 1445 BWM Technologies ndash Remaining scientific and technological challenges
David Wright IMarEST and Jim Mackey Hyde Marine
1445ndash 1530 Challenges of installing Ballast Water Treatment Systems on large vessels such as
tankers and in Explosion Zones
Leif Erik Caspersen OceanSaver AS
1530ndash 1600 Coffee break
1600ndash 1630 Class society perspectives on survey and certification
Jad Mouawad DNV
1630 ndash 1700 Discussion Do the current solutions address the industry needs and concerns
Opportunities and challenges ahead for shipyards and shipbuilders
Day 1 ndash Wednesday 26 October
Opening Session
0900-1000 Registration and refreshments
1000-1015 Welcome from the organizers
Undersecretariat for Maritime Affairs of Turkey TUBITAK-MAM and IMO-GloBallast
8
FORUM PROGRAM
1015-1030 Opening address
Jo Espinoza-Ferrey Director Marine Environment Division International Maritime
Organization (IMO)
Plenary keynote session
Moderator Jose Matheickal Chief Technical Adviser GloBallast Partnerships IMO
1030-1100 Keynote address
Dandu Pughiuc Head Biosafety Section IMO
1100-1130 Keynote address
Theresa Crossley Head Implementation Department European Maritime Safety
Agency
1130-1200 Keynote address
Alfonso Castillero Director General Directorate of Merchant Marine Panama
1200-1230 QampA with keynote speakers
1230-1400 Lunch break
1400-1530 Session 1 Testing of technologies for compliance
Moderator Mario N Tamburri MERC United States
Session keynote Testing of technologies and the emerging global network of test facilities including a
report from the 3rd Global Test Facility Forum
Sjur Tveite NIVA Chairman of the Global Network of Test Facilities Norway
Harmonisation of testing regimes ndash comparability of testing in tropical and temperate climates
Martin Andersen DHI Ballast Water Technology Innovation Centre Singapore
Improved procedures for sampling and analysis of disinfection by-products and toxicological
parameters of treated ballast water
Stephanie Delacroix NIVA Norway
Limitations with Respect to Vital Staining Techniques for Use in Treated Ballast Water
Anne Maria Bono NIVA Norway
Ecological risk of treated ballast water a mesocosm experiment
Andrea Snakes IMARES Netherlands
Technology of shiprsquos ballast water treatment using bullOH radicals based on IMO Guidelines
Mindong Bai Dalian Maritime University China
The importance of organisms smaller than 10 um
Isabel van der Star Viola Liebig and Peter Paul Stehouwer NIOZ Netherlands
Session 2 Port State Control issues and experiences
Moderator Murat Korccedilak UMA Turkey
Session keynote Key aspects of Port State Control under the BWM Convention
Raphael Baumler World Maritime University
9
FORUM PROGRAM
A Proposed Framework for Compliance Monitoring of Ballast Water Discharge Regulations
Mario N Tamburri MERC United States
The Occurrence of Pathogenic Bacteria in Some Shipsrsquo Ballast Water Coming from Various Marine
Regions to the Sea of Marmara Turkey
Guumllşen Altuğ Istanbul University Turkey
An Examination of the Practicalities of Compliance Monitoring and Enforcement
Jon Stewart International Maritime Technology Consultants United States
Day 2 ndash Thursday 27 October
0945-1030 Session 3 Overview of current ballast water technologies meeting the compliance
criteria
Moderator Allegra Cangelosi GSI United States
Session keynote Overview of current technologies
Graham Greensmith Lloydrsquos Register United Kingdom
Type approval of BW treatment systems ndash experiences
Jad Mouawad DNV Norway
ERMA FIRST ballast water treatment system an integrated and modular ballast water treatment
system Performance and compliance with IMO Guidelines
Efi Tsolaki ERMAFIRST ESK Engineering Solutions SA
Ballast Water Treatment Solution From Turkey Akballast TM
Buumllent İşmen AK Gemi Company Turkey
The second generation of Ballast water treatment systems
Leif Erik Caspersen OceanSaver AS Norway
Lab-Scale Chlorine Generation
Ceren Bilgin Guumlney Fatma Yonsel Department of Shipbuilding and Ocean Engineering Istanbul
Technical University Istanbul Turkey
Session 4 Sampling and monitoring including latest developments in rapid diagnostic tools
Moderator Jan Linders GESAMP BWWG Chair and Brian Elliot EMSA (TBC)
Session keynote Sampling aspects for CME under the BWM Convention
Brian Elliot EMSA
Great Ships Initiative Sampling Systems for Land- and Ship-based Ballast Water Treatment System
Performance Testing
Allegra Cangelosi GSI United States
Sampling of ballast water for compliance control and Possible tools for organism detection in ballast
water samples
Stephan Gollasch GoConsult Germany
10
FORUM PROGRAM Validation of a shipboard filer skid for sampling zoo plankton from ballast water
Matthew First SAIC Inc Naval Research Laboratory United States
Efforts to develop a ballast water detecting device
Goran Bakalar Maritime Consultancy Croatia
Evaluations of Total Residual Oxidant Technologies for use in Monitoring Ballast Water Treatment
System
Amy Zimmer Faust Maritime Environmental Resource Center University of Maryland United States
Updated Experiments using a portable imaging instrument as a rapid diagnostic tool for IMO Indicative
monitoring compliance for BWTS
Kent Peterson FlowCam United States
A portable sensitive plankton viability assay for IMO shipboard ballast water compliance testing
Nick Welschmeyer and Brian Maurer United States
Day 3 ndash Friday 28 October
0945-1030 Session 5 Risk assessments and related tools in the CME framework
Moderator Adnan Awad IOI
Session keynote The Turkish approach to Risk Assessments
Arzu Olgun Emrah Ali Pekdemir TUBITAK Turkey
Finalized methodology for risk assessment of active substances under procedure (G9)
Jan Linders National Institute for Public and Environment-Expert Centre for Substances Netherlands
Ballast water management related risk assessment ndash The intra-Baltic HELCOM study
Erkki Leppaumlkoski Akademi University Turku Finland
Session 6 Regional and developing country perspectives on CME
Fredrik Haag GloBallast Partnerships Marine Environment Division IMO
Session keynote The role ofexperiences with Port Biological Baseline Surveys in developing countries
Adnan Awad International Ocean Institute Southern Africa
Ballast Water Management in the Wider Caribbean Region Progress and Challenge
Andrew Wood RAC-REMPEITC-Carib
Ballast Water Management in Turkey ndash an overview
Murat Korcak Undersecretariat for Maritime Affairs of Turkey
Session 7 The ship-ownersrsquo and shipbuildersrsquo perspectives
Moderator Dandu Pughiuc IMO
Session keynote Technical issues for selection of a ballast water system for an Aframax tanker
Vayia Hatziyianni and Maria Sotiriou OSG
11
FORUM PROGRAM QampA session
1500-1600 Plenary session - Panel Discussion
Compliance and monitoring Are the current RampD efforts matching requirements of the Convention
Moderator Jose Matheickal IMOGloBallast
Closing remarks
Mr J Espinoza-Ferrey Director Marine Environment Division IMO and Undersecretariat for Maritime
Affairs of Turkey TUBITAK-MAM
Forum closes
POSTER PRESENTATIONS
Analysis Of Actıve Substance And Relevant Substance in Shiprsquos Ballast Water Management (BWM)
System
Ji Hyun Lee Young Keun Im Dong Yoon Kim Jin Hoon Do Jun Ho Park Sung Uk Lee Won Tae Cho
Effects of Fresh Water Electrolysis On Algal GrowthEunjoo Choi Sojung Jung Yongseok Park Myung
Hwan Do Kyung Soon Shin Kitate Rhie
Biological Efficacy of Electrolytic BWMs (Electro-Cleen Tm System) During on Board Installation
Yong Seok Park Dong Hyun Shon Gwang Ho Lee Hyun Ju Moon Hyung Geun Jeon
Harmful Algal Species in Anthropogenically Impacted Water of The Syrian Coastal Waters
Feirouz Darwich
Ballast Water Risk Assessment SystemndashAlien Species Module
Arzu Olgun Oumlzen Arlı Kuumlccediluumlkosmanoğlu Tolga Atalay Fatma Telli Karakoccedil
Vildan Tuumlfekccedili
Ballast Water Risk Assessment SystemndashBallast Water Reporting Module
Emrah Pekdemir Arzu Olgun Tolga Atalay Cihangir Aydoumlner
Assessing of the Ballast Water Risk and the Alien Species in Iskenderun Bay Turkey
Arzu Olgun Aslı Suha Doumlnertaş Cihangir Aydoumlner Yasemin Guumlmuumlşluumloğlu
Ballast Water Risk Assessment System ndash Risk Assessment and Route Analysis Module
Cihangir Aydoumlner Arzu Olgun Tolga Atalay Onur Akyol Emrah Pekdemir Oumlzen Arlı
12
13
BALLAST WATER MANAGEMENT SYSTEMS
Limitations with Respect to Vital Staining
Techniques for Use in Treated Ballast Water
August D Tobiesen1 Anne-Marie Bomo Stephanie Delacroix
Aina C Wennberg and Helge Liltved
Abstract
Staining cells in the ge10-50 microm size group in treated ballast water with the vital stain 5-
carboxyfluorescein diacetate acetoxymethyl ester (CFDA) has been used to detect viable cells In
intact viable cells the non-fluorescent CFDA will be taken up in the cytosol where it becomes
hydrolysed into fluorescence end products Viable cells can be identified and distinguished from dead
cells by studying the stained sample with an epifluorescence microscope Some limitations with this
method have been observed during full-scale land-based testing of UV treatment systems
Determination of viable cells in the 10-50 um size group using the CFDA method seems to
overestimate the number of viable cells compared to results based on plate counts and dilution
cultures the two latter techniques being a direct measurement of the cells ability to reproduce In an
attempt to investigate the consistency between the three methods (CFDA staining technique plate
counts and dilution culture) on UV-treated samples some preliminary laboratory-scale experiments
were carried out where the algae Tetraselmis suecica in seawater was treated with different UV
doses and viability in samples quantified using CFDA staining plate counts and dilution culture The
results were compared with a parallel study where Tetraselmis suecica was treated with ozone doses
in the range of 0 ndash 180 mg TROsl using the same three methods The results from the study with
ozone gave more consistant results between CFDA and the culture-based methods For UV-treated
water large deviations were observed at UV doses up to 600 mWscm2 At higher UV doses (ie up to
2400 mWscm2) consistency among the methods was evident However such high dosages are not
used for ballast water treatment
Based on these results one may conclude that staining techniques may overestimate viability in UV-
treated samples compared to cultivation methods Additionally staining procedures should be
amended to incorporate the time needed for UV treatment to manifest itself It may be suggested that
methods based on cell cultivation are more reliable with respect to the organisms ability to reproduce
and should be used for evaluation of long-term viability of algae in UV-treated water either alone or
complementary to staining methods for organisms that are not easily cultivated in the laboratory
Key words viable stain enumeration algae ballast water
1 Norwegian Institute for Water Research Gaustadalleen 21 0349 Oslo Norway
14
TOBIESEN BOMO DELACROIX WENNBERG AND LILTVED
Introduction
The introduction of invasive marine species into new environments by shipsrsquo ballast water has
been identified as having serious impacts on the marine ecology of the worldrsquos oceans The
International Convention for the Control and Management of Shipsrsquo Ballast Water amp
Sediments was adopted by the International Maritime Organization (IMO) in 2004 The IMO
convention sets discharge limits on densities of live organisms by size class of organisms
For instance for organisms in the size group ge10m and lt50 m discharge water should
contain less than 10 viable organisms per milliliter (lt10 cellsml) To comply with the
discharge limits by IMO this implies that the worldrsquos fleet must invest in approved technology
for treatment of their ballast water before discharge
Since the success of a treatment system and the ability of a ship to meet the ballast water
discharge standards are determined by the number of viable organisms in treated water
general methods are required that can be used to detect these living organisms at low
densities in treated water
Common methods for analyzing and quantifying organisms in the 10-50 microm range are
measuring chlorophyll culture dependent methods (dilution culture plate counts) ATP
assays flow cytometry and direct counts andor in combination with fluorescent vital stains
(Garvey et al 2007 Reavie et al 2010 Steinberg et al 2011a Steinberg et al 2011b)
Vital staining methods with different fluorescent stains (ie FDA CFDA CFDMA) either
alone or in combinations have been emphasized as suitable methods for detecting living
organisms in the 10-50 microm range in treated ballast water (Reavie et al 2010 Steinberg et
al 2011b) One fluorescent staining method for detecting viable cells in the ge10-50 microm size
group in ballast water is to incubate samples with 5-carboxyfluorescein diacetate
acetoxymethyl ester (CFDA) and study the stained cells with an epifluorescence microscope
(Ganassin et al 2000) In intact viable cells the non-fluorescent CFDA will be taken up in the
cytosol where it becomes hydrolysed into fluorescence end products Viable cells can be
identified and distinguished from dead cells as viable cells are a bright yellowgreen colour
while non-viable cells are pale green (heterotrophic cells) or pale green with red
autofluorescence of the chloroplast (photoautotrophs)
Since 2006 numerous ballast water management systems have been tested through land-
based testing at NIVArsquos (Norwegian Institute for Water Research) test facility for ballast water
management systems in Solbergstrand Norway Documentation of viable organisms in the
10-50 um size group are performed using the CFDA staining technique In addition standard
culture techniques such as dilution cultures and plate counts are always conducted as a
supplement to the CFDA staining technique However when performing land-based tests on
technologies that utilize UV irradiation the CFDA staining technique has been shown to
15
LIMITATIONS WITH RESPECT TO VITAL STAINING TECHNIQUES
overestimate the number of viable cells relative to complimentary methods used that are
based on regrowth (ie organism concentration in treated water being higher than the
discharge requirement (gt10 cellsml) and the results using the CFDA method deviating from
results based on plate counts and dilution cultures (cell concentration lt10 cellsml)) The
consequences of not fulfilling the discharge requirements can be disqualification of test
cycles possibly leading to non-approval of the treatment system by national administrations
and IMO
In an attempt to better understand the extent of these observations from land based testing
(ie to investigate the consistency of the three methods (CFDA staining technique plate
counts and dilution culture) on UV treated samples and to assess to what extent the UV dose
applied could impact the deviating results) some preliminary laboratory-scale experiments
were carried out where the algae Tetraselmis suecica in seawater was treated with different
UV doses and living cells were quantified using CFDA staining plate counts and dilution
culture As a comparison to UV treatment quantification of Tetraselmis suecica with the same
three methods was also conducted in ozone treated seawater
The algae Tetraselmis suecica from NIVAs algae culture collection was used as the test
organism in all laboratory experiments Tetraselmis suecica was grown autotrophically in
seawater growth media with added nutrients and harvested in the exponential phase Cell
density was determined using a Beckman Coulter ldquoMultisizer 3rdquo coulter counter In case of too
dense cell cultures the algae solution was mixed with 045m seawater (salinity gt 32 PSU)
Initial concentrations of algae in all experiments were 104 - 105 cellsml
Materials and Methods
Test organisms
The algae Tetraselmis suecica from NIVArsquos algae culture collection was used as the test
organism in all laboratory experiments Tetraselmis suecica was grown autotrophically in
seawater growth media with added nutrients and harvested in the exponential phase Cell
density was determined using a Beckman Coulter ldquoMultisizer 3rdquo coulter counter Where cell
cultures were too dense the algae solution was mixed with 045 m seawater (salinity gt 32
PSU) Initial concentrations of algae in all experiments were 104 - 105 cellsml
UV-irradiation
Algae solutions (15 ml) were added to Petri dishes and slowly stirred during UV irradiation
The UV lamp used was a 15 W (35 W of 254 nm UV output) low pressure germicidal lamp
(Philips Ltd Einhoven Netherlands) mounted in an apparatus which provided a collimated
16
TOBIESEN BOMO DELACROIX WENNBERG AND LILTVED
beam (Qualls and Johnson 1983) The UV dose defined as the product of average intensity
across the Petri dish and the exposure time was varied by varying the exposure time UV
doses ranging from 0 (control) to 2400 mWscm2 were applied in the experiment
Ozonation
Ozone was produced in an ozone generator (Wedeco Modular 8 HC) An ozone stock
solution (8 mgl TRO) was made by bubbling ozone produced by the ozone generator into a
bottle of 045m filtered seawater (32 PSU) Aliquots of this stock solution were diluted with
seawater and algae to achieve ozone doses of 0 (control) 24 60 120 and 180 mg TROsl
Ozone concentration was measured using the colorimethric DPD method (Hach method
8167) and ozone doses were defined as the product of measured TRO concentration (TRO
as mgl Cl2) in the ozonated seawater and algae mixture and contact time (two minutes)
After two minutes of contact time all samples were neutralized with natriumthiosulphate prior
to being analyzed
Determination of viable Tetraselmis suecica after treatment
Cultivation on agar plates
Samples were spread on a seawater agar growth medium and incubated in constant light for
3-7 days at 20 oC Colonies of Tetraselmis suecica were observed by viewing agar plates in a
stereo microscope at 160x magnification
Dilution culture method (after Throndsen 1978)
Sample volume of 1 ml was added to 9 ml of media (20 Z8 seawater media) After mixing
1 ml of this sample was further diluted with 9 ml The number of dilutions was set to cover the
expected cell density range in the original sample Three to five parallels were employed in
order to provide statistical significance of the estimated number Test tubes were incubated in
constant light for two weeks at 20ordmC After two weeks positive test tubes (ie tubes were
growth occurred) where counted Based on this the number of cells in the original sample
was calculated
CFDA staining (after Ganassin et al 2000)
The viability of the Tetraselmis suecica was determined by observing cells incubated with
CFDA Samples were inspected with an epifluorescence microscope using an excitation filter
of 485 nm and an emission filter of 530 nm In the epifluorescence microscope viable cells
were observable as bright yellowgreen cells while non-viable cells were pale green
(heterotrophic cells) or pale green with red autofluorescence of the chloroplast
(photoautotrophs) Cells were counted at 300x ndash 480x magnification
17
LIMITATIONS WITH RESPECT TO VITAL STAINING TECHNIQUES
UV treated samples were stored for 24 hours at 4ordmC in the dark before staining with CFDA
Ozonated samples were stained with CFDA on the same day as ozone treatment was
performed
Results and Discussion
Results from the study with ozone doses in the range of 0 ndash 180 mg TROsl showed that
enumeration of algae cells with the CFDA staining method was consistent with the culture
based methods (Figure 1)
Figure 1 Quantification of ozonated algae cells (Tetraselmis suecica) using plate
counts dilution culture and CFDA staining
Ozone is a strong oxidizing agent and will cause rapid damage to the cell membrane with
leakage of cellular constituents when the dose is high enough It was therefore expected
that it should be easier to distinguish between dead and live cells when enumeration with the
CFDA staining method and that the results based on CFDA staining should be consistent
with methods based on cell cultivation When using the same three methods for enumeration
of live algae in UV treated water significant deviations were observed for UV doses up to 600
mWscm2 (Figure 2) The vital staining method is based on cell activity which depends on a
non-damaged cell membrane and the presence of necessary enzymes As the principal effect
of UV irradiation is damage of the cellsrsquo DNA or RNA which in turn blocks replication of
nucleic acids and prevents cell multiplication the cell membrane and enzyme activity can be
intact for several hours or even days after treatment Such cells can still take up and
01
1
10
100
1000
10000
100000
0 40 80 120 160 200 240
Ozone dose (mg TROsl)
cfu
ml
01
1
10
100
1000
10000
100000
cell
sm
lPlate counts (cfuml) Serial dilution (cellsml) CFDA staining (cellsml)
18
TOBIESEN BOMO DELACROIX WENNBERG AND LILTVED
hydrolyse CFDA and may give false positive counts This is apparently the reason for the
deviating results as seen in Figure 2 At higher UV dosages (ie up to 2400 mWscm2)
consistency among the methods was more evident At the highest UV dose no living cells
could be detected neither with the culture dependent methods (all results below the detection
limit of the methods) nor with the CFDA staining method It should be noted however that
UV doses as high as 2400 mWscm2 are not used in ballast water treatment UV doses
necessary to inactivate marine organisms in the 10-50 um size group does not normally
exceed 300 mWscm2
Figure 2 Quantification of UV irradiated algae cells (Tetraselmis suecica) using
plate counts dilution culture and CFDA staining
The results from these preliminary experiments using the CFDA staining technique shows an
initial weak efficacy of UV treatment when cells are exposed to UV irradiation dosages that
do not immediately kill the cells We therefore conclude that the CFDA method will
overestimate the number of viable cells especially if the period following UV treatment before
staining with CFDA is short
Hence the methods based on cell cultivation should be regarded as more reliable with
respect to Tetraselmis suecica and should be used as complementary methods for the
evaluation of long-term viability of UV irradiated cells Experience from land-based testing at
NIVA have shown that the CFDA method and also the complementary methods based on
regrowth become more consistent if CFDA staining is delayed for some time after UV
treatment With awareness of the limitations with culture dependent methods in particular
01
1
10
100
1000
10000
100000
0 150 300 600 1200 2400
UV dose (mWscm2)
CF
Um
l
01
1
10
100
1000
10000
100000
cell
sm
lPlate counts (cfuml) Serial dilution (cellsml) CFDA (cellsml)
19
LIMITATIONS WITH RESPECT TO VITAL STAINING TECHNIQUES
the fact that culture media will only support the growth of some organisms and not the entire
plankton community underestimation of cell number is a consequence When estimating
viability in UV treated water it has therefore been decided to use all three methods (CFDA
staining plate counts and dilution culture) for quantification of organisms in the 10-50 microm size
group during land-based testing of UV ballast water treatment systems at NIVAs test facility
The problem addressed in this paper is limited to our experience with Tetraselmis suecica as
a test organism and should be further explored using natural organisms in the 10-50 um size
group
REFERENCES
Ganassin RC Schrimer K and Bols N (2000) Cell and Tissue culture In Ostrander GK (ed) The
laboratory fish Academic Press San Diego pp 631-651
Garvey M Moriceau B and Passow U (2007) Applicability of the FDA assay to determine the
viability of marine phytoplankton under different environmental conditions Marine Ecology Progress
Series 352 17-26
Reavie ED Cangelosi AA and Allinger LE (2010) Assessing ballast water treatments Evaluation
of viability methods for ambient freshwater microplankton assemblages Journal of Great Lakes
Research 36 540 ndash 547
Steinberg MK First MR Lemieux EJ Drake LA Nelson BN Kulis DM Anderson DM
Welschmeyer NA and PR Herring (2011a) Comparison of techniques used to count single-celled
viable phytoplankton Journal of Applied Phycology
Steinberg MK Lemieux EJ and Drake L (2011b) Determining the viability of marine protists using
a combination of vital fluorescent stains Marine Biology 158 1431 ndash 1437
Throndsen J (1978) The dilution-culture method In Sournia A (Ed) Phytoplankton manual
Unsesco Paris pp 218 ndash 224
21
BALLAST WATER MANAGEMENT SYSTEMS
Ecological risk of treated ballast water
a mesocosm experiment
AC (Andrea) Sneekes1 NHBM (Klaas) Kaag EM (Edwin) Foekema
Abstract
As a consequence of the IMO Ballast Water Convention in the near future large amounts of water
treated with an active substance will be discharged into harbours and coastal areas With regard to the
ecological risk assessment of active substances used in ballast water treatment systems mesocosms
may be applied Routinely mesocosms are applied as lsquohigher tier testsrsquo in the ecological risk
assessment of pesticides For ballast water testing adaptation of the test set-up is necessary as not a
small amount of a toxic substance is added but rather a significant volume of water is replaced
During spring 2011 such an experiment was conducted in 4-m3 outdoor marine mesocosms with
PERACLEAN Oceanreg as the active substance Three different treatment levels were created by
replacing 10 of the volume of test systems with treated ballast water aged for 1 hour (BW-d0) 24
hours (BW-d1) or 5 days (BW-d5) Two control systems did not receive any treatment At the same
time the toxicity of the ballast water was tested with standard laboratory bioassays confirming earlier
test results During the 69-day exposure period the water compartment was sampled weekly At the
end the test systems were drained and the bottom compartment was sampled
The results show that replacement of water without remaining active substances is not free from
effects However the level of toxic substances present in the treated water corresponded with the
degree of impact Effects seen in bioassays are not directly copied in mesocosms Results might be
affected by physical characteristics like pH oxygen DOC and nitrogen or phosphorus levels However
high risk indicated by the toxicity tests corresponded with high levels of disturbances in the ecosystem
Mesocosms can be used in higher tier assessment of whole effluents such as ballast water Even
when as much as 10 of the water volume is replaced by treated water treatment effects are obvious
Moreover clear recovery of some systems was observed within the test period enabling to assess the
No Observed Ecological Adverse Effects Concentration (NOEAEC) conform to De Jong et al (2008)
The mesocosms are a useful tool for assessment of treatments including the side effects in
discharged ballast water by integrating effects as well as recovery of multiple interacting species
Introduction
For ballast water treatment systems that use active substances there is a need to test their
system under IMO guideline G9 This guideline asks for estimating the ecological risk of the
1 IMARES Wageningen UR Dept Environment PO Box 57 1780AB Den Helder the Netherlands
22
SNEEKES KAAG FOEKEMA
active substance used in the BWMS [Ballast Water Management System] for the receiving
environment Toxicity tests the so-called bioassays need to be conducted to estimate the
ecotoxicological impact of the treatment on the environment A bioassay is a test in which an
organism is exposed to a series of concentrations of a substance or to whole effluents (WET-
testing) like discharged ballast water A batch of these tests including different trophic levels
of organisms like algae crustacean and fish are used to assess the risk of treated ballast
water in a harbor
However there is a large difference between the limited organisms used in bioassays when
compared to the vastness and complexity of a harbor not to mention the extensive variations
in the different harbors around the world Therefore results from these single species tests
must to be used with caution In the risk assessment this is done by using safety or
assessment factors (Table 1)
Table 1 Assessment factors for risk assessment of ballast water under IMO G9 as
presented by GESAMP in the 38th meeting
Assessment factor GESAMP 38th meeting (PNEC general)
10000 Lowest short-term L(E)C50 from 1-2 freshmarine species from one or two
trophic levels
1000 Lowest short-term L(E)C50 from 3 freshmarine species representing
three trophic levels
100 Lowest short-term L(E)C50 from 3 freshmarine species representing
three trophic levels + 2 additional marine species
100 1 chronic NOEC from freshmarine species but not algae
50 2 chronic NOEC from freshmarine species including algae representing
two trophic levels
10 3 chronic NOEC from freshmarine species including algae representing
three trophic levels
If limited information is available the uncertainty is higher and for translation to ecosystem
levels a higher safety factor is used As more information is gathered the safety factor can
be lowered Nonetheless as long as only single species tests are used and considered it is
difficult to translate the effects to an ecosystem where various populations interact
For (non-) agricultural biocides this problem was recognized and experimental ecosystems
(mesocosms) with multiple species have been developed These mesocosms allow the fate
and impact of a treatment on the ecosystem to be examined under longer-term controlled but
realistic (semi-natural) conditions In the legislation procedure of biocides mesocosms are
well accepted tools and data can overrule toxicity data derived from single species laboratory
23
ECOLOGICAL RISK OF TREATED BALLAST WATER
tests These mesocosm tests are all performed in stagnant fresh water systems and dosed
with an active substance More recently IMARES developed marine stagnant systems and
tested these systems with additions of substances Applicability for use with effluents like
ballast water discharge was not investigated yet The replacement of a portion of water may
in itself already cause multiple effects Therefore as part of the InterregIVb project called
ldquoNorth Sea Ballast Water Opportunityrdquo (NSBWO) the applicability of mesocosms for use in
whole effluent testing was investigated This pilot study was designed to try to answer two
research questions
- How can the effects caused by replacement of water and the effects of toxic
substances be discriminated
- How predictive are toxicity test results (ie bioassays) for the effects of treated
ballast water on ecosystems
Materials and Methods
The mesocosms that were used for this study were intended to mimic a shallow soft
sediment ecosystem as much as possible This type of ecosystem is common along the
whole European coast The mesocosms however are static whereas the ldquorealrdquo ecosystem is
characterised by a high rate of water refreshment It was decided however not to use flow-
through mesocosms for this test in order to allow a good determination of the fate of the
treatment In total eight tanks were selected for this pilot study Each circular tank had a
volume of 4 m3 The tanks were filled with a sediment layer and a water compartment Phyto-
and zooplankton were introduced with the test water at the start of the establishment phase
Lists of species representative for various taxonomic classes that are commonly present in
shallow soft sediment coastal ecosystems were introduced deliberately Sponges and
bivalves both use phytoplankton as their primary food resource For the bivalve species the
sediment dwelling cockle was selected Two gastropod species were introduced the small
mudsnail and the larger periwinkle Both species feed mainly on benthic algae but the
mudsnails live on the sediment surface while periwinkles prefer the solid substrate of the
mesocosm sides As a representative of the group of crustaceans larger than zooplankton
the mudshrimp was introduced This shrimp lives in the top layer of the sediment where it
feeds on organic material Deeply burrowed in the sediment the lugworm can be found in its
habitat in U-shaped burrows Lugworms are very important sediment bioturbators in many
shallow coastal ecosystems For stabilization of the ecosystems the water fraction was re-
circulated for one month This creates a stable community of pelagic invertebrates and micro-
flora as well as similar water quality conditions in all mesocosms at the start of the
application of the test substance (chlorophyll-a pH dissolved oxygen concentration salinity
and nutrient concentrations) Just before the start of the exposure phase each mesocosm
unit became static Within each system water circulation was created by continuous aeration
24
SNEEKES KAAG FOEKEMA
The salinity in the mesocosms was kept at the initial value 30plusmn2permil Evaporation losses were
replenished with demineralised water Each mesocosm was covered with a transparent lid to
minimise the influence of rainfall
Seawater was treated on several days to mimic different discharge and concentration
circumstances The following water treatment discharge scenarios were created 5days old
(BW-d5) 24 hours old (BW-d1) and freshly treated (BW-d0) Each treatment was dosed into
two mesocosms Two control tanks (Control) did not receive any ballast water Dosing into
the mesocosms was performed on the same day by replacing approximately 10 of the total
water volume The ballast water was treated with PERACLEAN Oceanreg provided by Evonik
Degussa GmbH This treatment consists of two main active substances ndash Peracetic acid
(PAA) and hydrogen peroxide (H2O2) To check the dosing concentrations the discharge
water was measured before and after dosage in the mesocosm tanks No H2O2 and PAA
could be measured for the control and BW-d5 H2O2 was still present in the BW-d1 and BW-
d0 treated water and about 10 could still be measured after dosing into the mesocosms
Hardly any PAA could be measured in BW-d1 and none was detected after dosing in the
mesocosms Only BW-d0 showed the presence of PAA The dosed mesocosms were
monitored for another 69 days to monitor the effects Extensive analyses were performed
during the exposure period These included water quality parameters like oxygen and pH but
also sampling of zoo- and phytoplankton communities After the deployment period the
systems were emptied and the sediment compartment was also sampled intensively
As results from the study were still being processed at the time of the presentation only
observations were presented Statistical analysis of the data had not been done
Results
Toxicity of the ballast water was tested at the start of the exposure in the mesocosm
experiment In total three bioassays were selected a bacteria test (ISO 2007) an algae test
(ISO 2006) and rotifer test (MicroBioTests Inc) Each bioassay tested all of the different
treated ballast waters and a sample of untreated ballast water The samples were diluted in a
concentration series according to the test procedures of each bioassay At 10 dilution the
expected effects of the treated ballast water samples in the mesocosms could be derived
(Figure 1) For the Control tanks and for the BW-d5 tanks no toxicity was found The algal
toxicity test showed inhibitory effects of approximately 40 for the BW-d1 No effects were
found for the bacteria and the rotifer test All three bioassays showed effects for the freshly
prepared ballast water (BW-d0) ranging from 100 inihibition for the bacteria to
approximately 60 effect for the algae and rotifers
25
ECOLOGICAL RISK OF TREATED BALLAST WATER
Figure 1 Results of the bioassays at 10 of the discharge ballast water samples Presented
are results from a bacterium an algae and a rotifer test
Figure 2 shows a selection of the results for the mesocosm study The line graphs present the
number of days on the x-axis before and after dosing For the bar graphs the treatment is
presented on the x-axis In all graphs the error bars are the ranges of the different
treatments For the line graphs the ranges of the control are accentuated with a green color
The biomass of the phytoplankton community is presented as total chlorophyll-a
concentration The before period is the stabilization time for the systems The graph shows
that the systems were following similar patterns After dosage a short stimulation is seen for
the five-day old ballast water (BW-d5) After about three weeks the pattern is similar to the
control again BW-d1 showed negative effects during the first ten days and stimulation effects
for about three to four weeks BW-d0 reduced during the first ten days and then remained
stimulated for about five weeks After six weeks all systems show very low concentrations of
chlorophyll which is normal for summer conditions Due to the very low concentrations it is
uncertain whether full recovery took place
The zooplankton community was sampled weekly and biweekly samples were selected for
analyses Calanoid copepods seem to show stimulation for BW-d5 and BW-d1 but not for
BW-d0 This effect is seen more often in mesocosm research and is often referred to as a
classic mesocosm result As a response to effects on other species a population is
stimulated until the dose becomes toxic Stimulation of the harpacticoid copepods is seen for
BW-d1 and BW-d0 BW-d5 follows the control system After 42 days the zooplankton
populations collapse in all systems
Bivalvia larvae produced by the introduced cockles were more numerous in BW-d1 and BW-
d0 when compared to the control system and BW-d5 After a short period the larvae settled
and disappeared from the water column However sampling the benthic community at the
end of the study confirmed the higher amounts of juvenile cockles in BW-d1 and BW-d0
Bacteria toxicity test10 of discharge samples
Control BW-d5 BW-d1 BW-d00
20
40
60
80
100
Treatment
inh
ibit
ion
(
)
Algal toxicity test10 of discharge samples
Control BW-d5 BW-d1 BW-d00
20
40
60
80
100
Treatment
inh
ibit
ion
(
)
Rotifer toxicity test10 of discharge samples
Control BW-d5 BW-d1 BW-d00
20
40
60
80
100
BW-d5
Control
BW-d1
BW-d0
Treatment
mo
rtality
(
)
26
SNEEKES KAAG FOEKEMA
Figure 2 Graphs of a selection of the ballast water mesocosm results Presented
are phytoplankton (chlorophyll-a) zooplankton (copepods and bivalvia)
amphipods (Corophium volutator and Microdeutopus gryllotalpa) and polychaeta
(Polydora ciliate)
Total Chlorophyll-a (microgl)
-42 -28 -14 0 14 28 42 56 70
5
10
15
20
daynr
Copepod (calanoid)
Daynr
co
un
t
0 14 28 42 56 70
500
1000
1500
2000
2500Control
BW-d5
BW-d1
BW-d0
Copepod (harpacticoid)
Daynr
co
un
t
0 14 28 42 56 70
500
1000
1500
Bivalvia
Daynr
co
un
t
0 14 28 42 56 70
500
1000
1500
Corophium volutator
Treatment
co
un
t
Control BW-d5 BW-d1 BW-d00
200
400
600Control
BW-d5
BW-d1
BW-d0
Microdeutopus gryllotalpa
Treatment
co
un
t
Control BW-d5 BW-d1 BW-d00
20
40
60
80
Polydora ciliata
Treatment
co
un
t
Control BW-d5 BW-d1 BW-d00
5
10
15
Cockle (juveniles)
Treatment
co
un
t
Control BW-d5 BW-d1 BW-d00
1000
2000
3000
4000
5000
27
ECOLOGICAL RISK OF TREATED BALLAST WATER
The population of Corophium volutator amphipods in the mesocosms seemed to be able to
cope with the stress of the dosing with BW-d5 and BW-d1 The population was reduced for
the mesocosms which were dosed with BW-d0 However another amphipod (Microdeutopus
gryllotalpa) showed up in the BW-d0 discharge and not in the other systems Still total
amphipod counts remained lower when compared to the other treatments
The polychaeta Polydora ciliata shows the classic mesocosm graph wherein the species
population compared to the control system is stimulated for BW-d5 inconclusive for BW-d1
and reduced for BW-d0
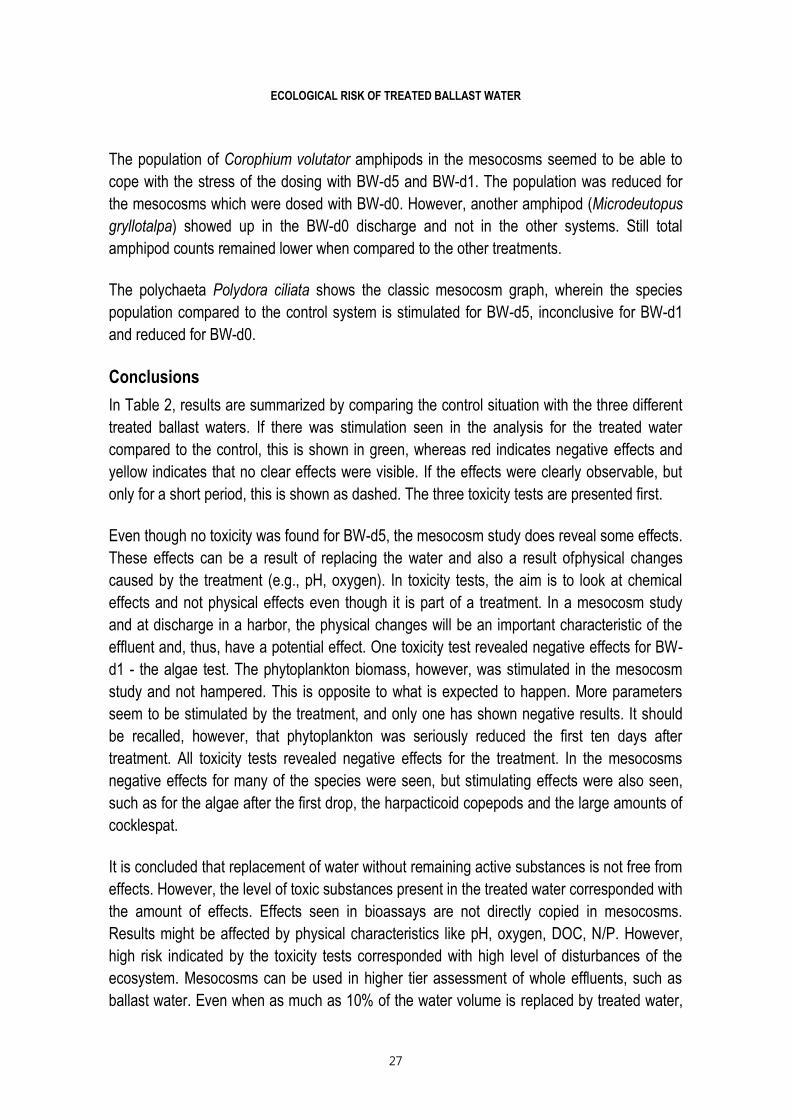
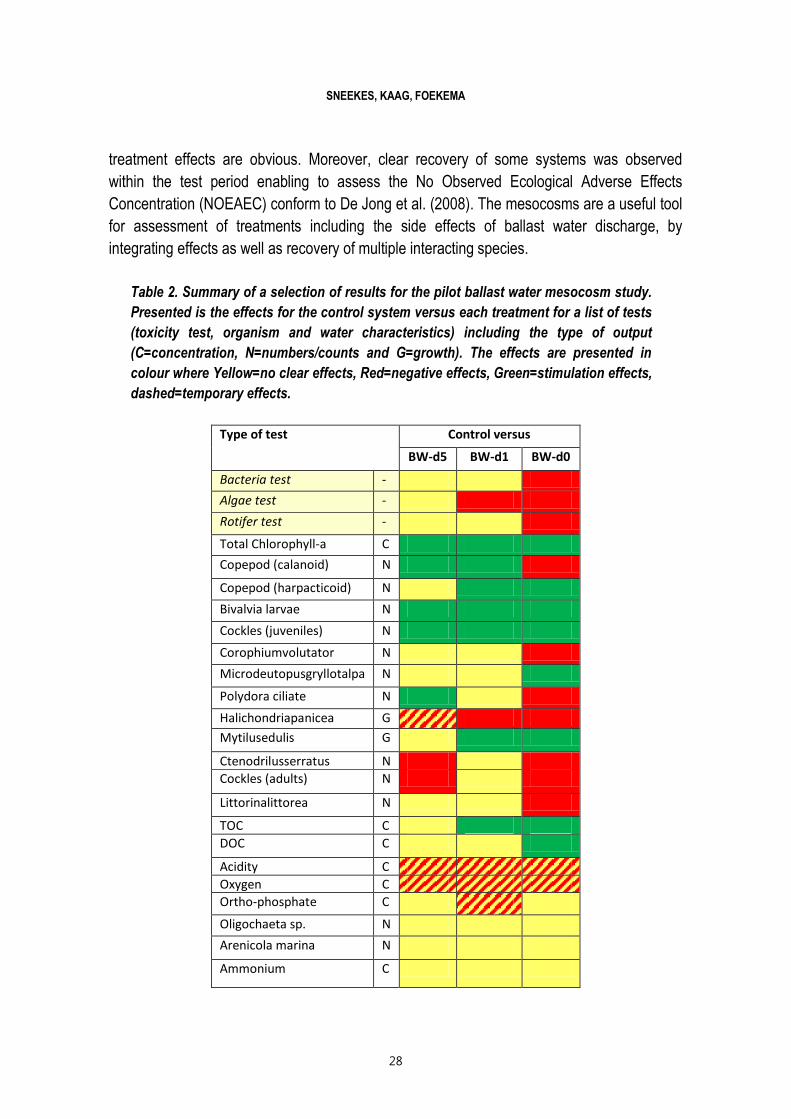
Conclusions
In Table 2 results are summarized by comparing the control situation with the three different
treated ballast waters If there was stimulation seen in the analysis for the treated water
compared to the control this is shown in green whereas red indicates negative effects and
yellow indicates that no clear effects were visible If the effects were clearly observable but
only for a short period this is shown as dashed The three toxicity tests are presented first
Even though no toxicity was found for BW-d5 the mesocosm study does reveal some effects
These effects can be a result of replacing the water and also a result ofphysical changes
caused by the treatment (eg pH oxygen) In toxicity tests the aim is to look at chemical
effects and not physical effects even though it is part of a treatment In a mesocosm study
and at discharge in a harbor the physical changes will be an important characteristic of the
effluent and thus have a potential effect One toxicity test revealed negative effects for BW-
d1 - the algae test The phytoplankton biomass however was stimulated in the mesocosm
study and not hampered This is opposite to what is expected to happen More parameters
seem to be stimulated by the treatment and only one has shown negative results It should
be recalled however that phytoplankton was seriously reduced the first ten days after
treatment All toxicity tests revealed negative effects for the treatment In the mesocosms
negative effects for many of the species were seen but stimulating effects were also seen
such as for the algae after the first drop the harpacticoid copepods and the large amounts of
cocklespat
It is concluded that replacement of water without remaining active substances is not free from
effects However the level of toxic substances present in the treated water corresponded with
the amount of effects Effects seen in bioassays are not directly copied in mesocosms
Results might be affected by physical characteristics like pH oxygen DOC NP However
high risk indicated by the toxicity tests corresponded with high level of disturbances of the
ecosystem Mesocosms can be used in higher tier assessment of whole effluents such as
ballast water Even when as much as 10 of the water volume is replaced by treated water
28
SNEEKES KAAG FOEKEMA
treatment effects are obvious Moreover clear recovery of some systems was observed
within the test period enabling to assess the No Observed Ecological Adverse Effects
Concentration (NOEAEC) conform to De Jong et al (2008) The mesocosms are a useful tool
for assessment of treatments including the side effects of ballast water discharge by
integrating effects as well as recovery of multiple interacting species
Table 2 Summary of a selection of results for the pilot ballast water mesocosm study
Presented is the effects for the control system versus each treatment for a list of tests
(toxicity test organism and water characteristics) including the type of output
(C=concentration N=numberscounts and G=growth) The effects are presented in
colour where Yellow=no clear effects Red=negative effects Green=stimulation effects
dashed=temporary effects
Type of test Control versus
BW-d5 BW-d1 BW-d0
Bacteria test -
Algae test -
Rotifer test -
Total Chlorophyll-a C
Copepod (calanoid) N
Copepod (harpacticoid) N
Bivalvia larvae N
Cockles (juveniles) N
Corophiumvolutator N
Microdeutopusgryllotalpa N
Polydora ciliate N
Halichondriapanicea G
Mytilusedulis G
Ctenodrilusserratus N
Cockles (adults) N
Littorinalittorea N
TOC C
DOC C
Acidity C
Oxygen C
Ortho-phosphate C
Oligochaeta sp N
Arenicola marina N
Ammonium C
29
ECOLOGICAL RISK OF TREATED BALLAST WATER
REFERENCES
De Jong FMW TCM Brock EM Foekema and P Leeuwangh (2008) Guidance for summarizing
and evaluating aquatic micro- and mesocosm studies A guidance document of the Dutch Platform for
the Assessment of Higher Tier Studies RIVM report 6015060092008
ISO (2006) International Standard Water quality - Marine algal growth inhibition test with Skeletonema
costatum and Phaeodactylum tricornutum Second Edition 2006-04-15 NEN-EN-ISO 102532006(E)
ISO (2007) International Standard Water quality - Determination of the inhibitory effect of water
samples on the light emission of Vibrio fischeri (Luminescent bacteria test) - Part 3 Method using
freeze-dried bacteria Second edition 2007-12-01 ISO 11348-32007(E)
MicroBioTests (sa) ROTOXKIT Mtrade Brachionus toxicity screening test for estuarine and marine
waters MicroBioTests Inc Belgium V071090
31
BALLAST WATER MANAGEMENT SYSTEMS
Technology of shiprsquos ballast water treatment using
middotOH radicals based on IMO Guidelines
Mindong Bai1 Nahui Zhang Zhitao Zhang Yiping Tian Xiyao Bai
Abstract
A new method of middotOH radicals is available for fast killing (within several seconds) of harmful aquatic
organisms and pathogens in the course of discharging a shiprsquos ballast water With the strong electric-
field discharge the O2 in air and H2O in a gaseous state are ionized and dissociated into a number of
activated particles such as O2+ O3 H2O+ and H2O2 which are injected into a portion of the ballast
water to form the dissolved middotOH and other active substances including O2macr HO2- HO3 O2+ H2O etc
In an middotOH treatment system of 10 th a series of experiments were completed As a result the D-2
ballast water discharge standard of IMO was satisfied and realized The contents of 45 kinds of
chemical substances such as bromated haloalkane haloacetic acid haloacetonitriles and halophenols
were under the test limit according as the Drinking Water Standard of World Health Organization
(WHO) The evaluated results showed that treated ballast water posed a low potential risk to the
aquatic environment and there was no unacceptable risk to human health
Key Words Ships ballast water strong electric-field discharge OH radicals IMO Guidelines D-2
discharge standard WHO drinking water standard no potential risk
1 Introduction
The introduction of invasive marine species into new environments by a shiprsquos ballast water
has been identified as one of the four greatest threats to the worldrsquos oceans Until today
about 500 different species are known to have been transported via ballast water Sixteen
kinds of invasive red tide algae introduced into China Sea by ballast water resulted in great
destruction to aquiculture As a result whole ecosystems are being changed and economic
losses of up to 10 billion USD is being caused each year Consequently IMO Regulation D-2
ballast water discharge standard is forced to require that the aquatic organism concentrations
in the discharge of ballast water should be below specified limits At the same time a ballast
water treatment system for producing and using chemical active substances such as middotOH
radicals ozonation chlorination is necessary to obtain Basic and Final Approvals G9 of IMO
As a result many technologies for the treatment of shipsrsquo ballast waters have been
developed such as filtration and ultraviolet radiation (UV) chlorination ozonation thermal
1 Environmental Engineering Institute Dalian Maritime University Dalian (116026) China
32
M BAI N ZHANG Z ZHANG TIAN AND XBAI
techniques electrolysis deoxygenation and so on None of these potential solutions is in
wide use however For example treatment systems combining UV with filtration have been
installed only on a small number of ships and it is not known whether any systems now
available will consistently and efficiently meet the discharge requirements of developing
regulations In addition the lamps of UV technology need periodic cleaning and are easily
broken So far no effective method is available for fast killing (within several seconds) of
harmful aquatic organisms and pathogens in the course of discharging a shiprsquos ballast water
Based on the G9 Guidance and D-2 ballast water discharge standard of IMO a new
treatment method for ballast water using middotOH radicals were presented In a 10 tmiddoth-1 (tonne
per hour) OH treatment system a series of experiments such as biological efficacy water
qualities chemical analysis and aquatic toxicity were completed
2 Strong electric-field discharge and formation of OH radicals
21 Strong Electric-Field Discharge
A physical method based on the strong electric-field discharge (SED) was applied to treat
ballast water The configuration of SED is shown in Figure 1 The strong discharge plasma
was filled in two micro-gaps (width=047mm) Two α-Al2O3 dielectric layers with a thickness
of 02mm dielectric constant of 10 and an insulation intensity of 350 kVcm were covered on
an Ag thin plate discharge electrode (180times90 mm2) The self-made power supply was applied
on the discharge electrodes with the following parameters peak voltage 7 kV frequency
104 kHz current pulse width and 5~10 ns With the dielectric layers (15) problems such as
restricted electric current uniform and unstable distribution of micro plasma bundle and the
power deposition were solved The micro discharge gap allows the electrons to be
accelerated resulting in increased numbers of high-energy electrons compared to the
conventional discharges at atmospheric pressure The electron density in the discharge gap
was high due to the applied high-frequency power supply
Figure 1 Photo of SED
The SED in micro-gap
The exposure time 1125 s
Discharge zone
Micro streamer
The exposure time 1micros
Discharge path Charge deposition
0
200
400
600
800
500
900
100
700
300
Relative ligh
t rad
iation
inten
sity
33
TECHNOLOGY OF SHIPrsquoS BALLAST WATER TREATMENT USING middotOH RADICALS
In order to obtain larger numbers of OH radicals the electron energy has to be higher than
the ionization potential of O2 and H2O (125eV and 126eV) and dissociation potential of O2
(84 eV) respectively With a method of strong electric-field discharge the electrons have an
average energy of 9 eV allowing many electrons to have a high enough energy to ionize and
dissociate O2 and H2O
22 Formation of OH Radicals
The plasma processes of middotOH formation are shown in Figure 2 (a) (b) and (c) In part (a) the
O2 molecules are ionized and dissociated into the oxygen activated particles of O2+ O(1D)
O(3P) etc In part (b) the H2O molecules are ionized into H2O+ and H3O+ and then form H2O2
In part (c) these active particles are injected into the GasLiquid dissolver by a high pressure
injector in which the middotOH radicals are efficiently produced
The dissolution of middotOH in ballast water involves very complicated chain reactions It is very
quickly converted into other activated molecules such as HO2- HO2 HO3 OH- O3OH+ O2
-
O3- O3 H2O2 and so on meanwhile rapidly killing the harmful microorganisms in a given
shiprsquos ballast water
Figure 2 Plasma process of OH formation
23 Active substance
The term ldquoactive substancerdquo means a substance that has a general or specific action on or
against harmful aquatic organisms and pathogens In our treatment system OH combined
O2
O
O2
O3-
H+
HO3
H2O
O2 H2O
H2O
H3O+
O2
+
OH
HO2-
H+H2O2
O2-
HO2
O2
H2O2
H2O+
H
e
e
H3O+
H2O
2e
e
H2O
H3O+
e
e
+
e
2e
H2O
O2
O2
H+
(a) (b) (c)
(2)
(1)
(3)
34
M BAI N ZHANG Z ZHANG TIAN AND XBAI
with other kinds of oxygen active substances such as HO2
macr O2macr HO3 O2
+H2O etc had
the most significant contributions with respect to killing harmful organisms due to their strong
oxidizing effects
In addition OH radicals react with bromide ions (Brmacr) in seawater to form hypobromous
acidhypobromite (HOBrOBrmacr) and bromamines Theoretically speaking however both
HOBrOBrmacr and bromamines have a certain germicidal effect on controlling bacteria algae
and macroscopic bio-fouling organisms during the storage period of treated ballast water
The concentration of total oxygen active substances is measured by TRO (total residual
oxidant) analyzer during the treatment The TRO refers to all of the oxidants which have the
ability to kill harmful aquatic organisms and pathogens
3 Experiment
31 Experimental System
The experimental system for ship ballast water treatment is shown in Figure 3 When
ballasting as a first step ballast water is filtered by an automatic self-cleaning filter for
removing the large particles and organisms of gt50 μm In the main pipe a part of ballast
water is pumped into middotOH equipment to produce large numbers of middotOH radicals and other
active substances including HO2macr O2
macr HO3 O2+H2O etc so that harmful organisms and
pathogens are rapidly killed in the course of conveying the shiprsquos ballast water This effluent is
then directed into the ballast tank for 5 days of testing When de-ballasting the filter and the
middotOH equipment are passed-by and the treated ballast water is to be neutralized at discharge
to ensure that the TRO is less than 02 mgL in any case There are three sampling points of
A B and C corresponding to the samples for control water treated water and treated water
with neutralization
Figure 3 Schematic diagram of middotOH ballast water treatment system
35
TECHNOLOGY OF SHIPrsquoS BALLAST WATER TREATMENT USING middotOH RADICALS
Two different salinity ballast waters ndash with high salinity (337 PSU) and low salinity (231 PSU)
ndash were used for OH killing experiments Water samples were collected from the ballast tank
0 2 and 5 days after OH treatment The flow velocity of ballast water in the main pipe was
15 ms and the flow rate measured by Model 8035 Burkert Flow meter (Burkert Co in
France) was 10 m3h The energy cost for the treatment of the shiprsquos ballast water was
30Whm3 without considering the energy cost of pumping
32 Test Methods
321 Biological test
Algae and bacteria The living bodies of algae were identified and counted using the
automatic Fluorescence Microscope (Olympus BX61) The bacteria were fast-counted using
Epics Altra II Flow Cytometry (Co Beckman Coulter) meanwhile the colony-forming unites
were calculated by plating the membrane filtered sample on ocean 2216E agar medium
322 Chemical analysis
The chemical analysis methods and corresponding analyzers are shown in Table 1 The
items of ballast water quality including pH Temperature DO Salinity Turbidity ORP were
measured using Multiparameter water quality sondes (YSI-6600 V2) The DOC and POC
were tested by Ligui TOC
Table 1 List of analytical methods used for each chemical tested
Item Test method Analyzer
TROTRC DPD Method UNICO7200 type Spectrophotometer
Bromate Ion Chromatographic Method ICS-1500 Ion chromatograph DIONEX
Trihalomethane Gas Chromatographic Method
7890A Gas chromatograph Agilent Haloacetic acids Gas Chromatographic Method
Haloacetonitriles Gas Chromatographic Method
Sodium thiosulfate Iodometric Method - The detection value of TRO is the amount of OH O2
macr O3 HOBrOBrmacr and bromamines And the detection value of TRC is the amount ofOH O2
macr O3 and HOBrOBrmacr
4 Experimental Results and Discussion
Both high and medium salinity sea water was used for analysis however the test results of
the high salinity sea water is only shown in the following section (Table 2 and Table 3)
41 OH killing experiment
For the OH killing experiment five kinds of algae and three kinds of bacteria were in the
system of the shiprsquos ballast water The dimensions of algae were in the range of 10~50 μm
Two group experiments were done for different algae contents of 123times104 cellsmL and
36
M BAI N ZHANG Z ZHANG TIAN AND XBAI
0508times104 cellsmL The concentrations of E coli I Enterococci and Heterotrophic bacteria
were about 13times104 12times104 and 38times104 cellMl respectively After OH treatment the algae
content of 123times104 cellsmL was decreased to 8 cellmL when the TRO was 186 mgL and
algae content of 0508times104 cellsmL was reduced to 9 cellsmL when the TRO was 141
mgL After both 2 days and 5 days of storage no living algae were detected in the ballast
tank At the same time no living bacteria were found in the ballast tank after either 0 days 2
days or 5 days of storage The results were tested by the Detecting Center of Xiamen
University with Accreditation of ISOIEC 17025 The results indicate that the D-2 ballast water
discharge standard of IMO was satisfied
Table 2 Experiment results of high salinity water
Item 0h (Day 0) 48h (Day 2) 120h (Day 5)
Control Treated Control Treated Control Treated
TRO (mgL) 0 141 0 021 0 0
Organism ge10 ~ 50 microm
(cellmL) 0508times104 9 2400 0 1000 0
Escherichia coli
(cfu100mL) 14times104 0 13times104 0 11times104 0
Intestinal Enterococci
(cfu100mL) 12times104 0 11times104 0 95times104 0
Heterotrophic bacteria
(cellmL) 39times104 0 33times104 0 29times104 0
TRO (mgL) 0 186 0 044 0 0
Organism ge10 ~ 50 microm
(cellmL) 1235times104 8 05times104 0 021times104 0
Escherichia coli
(cfu100mL) 13times104 0 11times104 0 10times104 0
Intestinal Enterococci
(cfu100mL) 12times104 0 10times104 0 78times104 0
Heterotrophic bacteria
(cellmL) 38times104 0 32times104 0 29times104 0
42 Water qualities
Water properties are shown in Table 3 Three basic water qualities including temperature
salinity and pH showed almost no change after OH treatment on Day 0 Day 2 and Day 5
respectively
The oxidation-reduction potential (ORP) increased three times with the injection of oxygen
active substances when TRO is 186 mgL but returned to the original value with the
neutralization of Na2S2O3 The ORP of 6836 mV after OH treatment decreased with the
decrease of TRO which decreased to 2626 mV on Day 2 and 2591 mV on Day 5 Dissolved
oxygen (DO) increased with the injection of TRO and decreased with the attenuation of TRO
37
TECHNOLOGY OF SHIPrsquoS BALLAST WATER TREATMENT USING middotOH RADICALS
However DO after 5 days of storage was still higher than that of the original value of 708
mgL Both total suspended solids (TSS) and turbidity decreased significantly at the intake of
the tanks due to the filtration
The addition of OH resulted in an immediate increase in the DOC in ballast water at the
intake of the tanks about from 252 to 531 mgL A possible explanation for these results is
that due to the sterilizing characteristics of the hydroxyl radical which can kill invasive
species in ballast water rapidly making the biological cells rupture and a large number of
cellular content overflow thus the DOC content increases initially By contrast the addition of
OH resulted in an immediate decrease of the POC in ballast water at the intake of the tanks
from about 205 to 001 mgL and then increased slowly to a final stable trend
Table 3 Water qualities (high salinity seawater)
Item
0 day 2 day 5 day
Control Treated Treated with neutralization
Treated Treated
TRO (mgL) ---- 186 ---- 044 001
Salinity (PSU) 337 336 339 338 336
Temperature (degC) 1273 1379 1359 1450 1442
pH 821 820 826 830 824
ORP (mV) 2291 6836 2294 2626 2591
DO (mgL) 708 798 957 900 830
TSS (mgL) 113 68 69 64 55
Turbidity (NTU) 290 199 222 210 20
DOC (mgL) 252 531 551 372 351
POC (mgL) 205 001 005 091 11
POC (particulate organic carbon) is estimated from total organic carbon (TOC)
Based on these results we can reach a conclusion that OH can purify water and decline the
contaminant levels
41 Chemical analysis
The potential by-products in the seawater treated by middotOH have been tested and analyzed
Chemical analysis results are given in Table 4
The results indicate that bromate was always below the MDL in all samples From the other
tested compounds four THMs (tribromomethane trichloromethane dibromochloromethane
and bromodichloromethane) all nine HAAs (monochloroacetic acid dichloroacetic acid
trichloroacetic acid monobromoacetic acid dibromoacetic acid tribromoacetic acid
38
M BAI N ZHANG Z ZHANG TIAN AND XBAI
bromochloroacetic acid bromodichloroacetic acid and dibromochloroacetic acid) were
detected The maximum concentration of bromoform and tribromoacetic acid which have
been detected in treated ballast water during the development of middotOH treatment were 682
microgL in high salinity water It is obvious that the formation of THMs and HAAs increased over
time initially and then decreased slightly (especially halogenated carbon) which can be
related to the degradation of TRO TRO degraded very rapidly under conditions tested In all
tests TRO completely degraded below 02 mgL (detection limit ppm) within less than hours
Then the degradation rate was slightly slower after 70 hours probably trended to be stable
Thus the formation of halogenated carbon increased in the presence of TRO whereas it
decreased with the decline of TRO over time It is assumed that the maximum concentration
of halogenated carbon would occur around 70 hours after OH treatment and then begin to
decrease slowly
Table 4 Data summary for chemical analysis (337 PSU)
Chemical name Unit MQL
Day 0 Day 2 Day 5
Control Treated Treated after neutralization
Treated Treated
TRO mgL 001 ND 241 ND 044 001
TRC mgL 001 ND 23 ND 042 ND
Bromate microgL 001 ND ND ND ND ND
Tribromomethane microgL 001 ND 425 412 626 487
Trichloromethane microgL 001 206 078 074 079 206
Dibromochloromethane microgL 001 ND 083 046 228 299
Bromodichloromethane microgL 002 038 088 014 016 0017
Monobromoacetic acid microgL 001 ND 261 248 145 188
Dibromoacetic acid microgL 002 291 603 413 176 122
Tribromoacetic acid microgL 002 107 578 502 56 108
Monochloroacetic acid microgL 001 ND 650 ND 162 225
Dichloroacetic acid microgL 001 227 223 217 067 ND
Trichloroacetic acid microgL 001 250 ND ND 078 091
Bromochloroacetic acid microgL 001 ND 603 ND ND ND
Bromodichloroacetic acid microgL 001 381 380 379 ND ND
Chlorodibromoacetic acid
microgL 001 ND ND ND ND ND
Dibromoacetonitrile microgL 001 ND ND ND ND ND
Sodium thiosulfate mgL 002 ND ND 08 ND ND
MDL method detection limit ND not detected
39
TECHNOLOGY OF SHIPrsquoS BALLAST WATER TREATMENT USING middotOH RADICALS
44 TRO decay
All TRO concentrations in the ballast tanks declined over time TRO levels reduced rapidly
during the first 24 hours of sampling (Figure 4) and then the rate of decay slowed after 48
hours The TRO declines below 02 mgL nearly 72 hours after storage
Our results suggested that a higher initial TRO concentration in ballast water would decay
more slowly than a lower initial TRO concentration Therefore increasing the initial TRO
would provide the disinfectant effect over a longer period of time This increased disinfection
period would not only be able to increase the effectiveness of treatment on those organisms
but would also inhibit the re-growth of organisms with rapid reproductive rates such as
bacteria
The test results indicated that the rate of TRO decay was dependent on the chemistry of the
ballast water Reasons for these differences could be due to the uncontrolled variables
among tests such as chemical compositions of the source water and non-selective oxidation
of organic matter Inorganic compounds including iron ammonia and others may also affect
residual oxidant decay
0 12 24 36 48 60 72 84 96 108 12000
02
04
06
08
10
12
14
16
18
20
22
24
26
TR
O C
on
cen
trat
ion
(m
gL
)
Elapsed time (hr)
25 ppm
15 ppm
20 ppm
Figure 4 TRO decay over a period of 120h for high salinity (measured as Cl2)
40
M BAI N ZHANG Z ZHANG TIAN AND XBAI
45 Toxicity Tests
According to the guidelines of the US EPA the algae growth inhibition test for high salinity
ballast water after middotOH treatment was performed
The definitive test was conducted with the 100 treated ballast water under laboratory
conditions During the 96-hour test period growth inhibition and other toxic signs were not
observed in the treated and control cultures The test results indicated that IrC50 (96hr)
IyC50 (96hr) and NOAEC (No Observed Adverse Effect Concentrations) to Platymonas
helgolandica were all greater than 100 treated ballast water
41
BALLAST WATER MANAGEMENT SYSTEMS
The forgotten fraction The importance of organisms
smaller than 10 microm when evaluating
ballast water treatment systems
Isabel van der Star1 Viola Liebich Peter Paul Stehouwer
Abstract
Aquatic organisms in the size class of 10 to 50 microm and larger than 50 microm are the main parameters
when qualifying ballast water treatment systems (BWTS) Organisms smaller than 10 microm in minimum
dimension are not taken into account when testing BWTS following the D-2 standard of the IMO This
size class includes bacteria phytoplankton and protozoa as micro-zooplankton species which can be
analysed conveniently by flow cytometry Results of numerous land-based tests showed that 90 of all
phytoplankton organisms were smaller than 10 microm in minimum dimension Besides a high numerical
abundance it is well known that many toxic phytoplankton species belong to this size fraction
Therefore the importance of this size class should be reconsidered when evaluating BWTS and
deserves to be taken into account in the requirements for certification of BWTS
Keywords ballast water convention D-2 standard minimum dimension harmful algal blooms flow-
cytometry plankton
1 Introduction
Biological invasions are facilitated by human actions One main activity contributing to
biological invasions is shipping ballast water (Carlton 1987 Wohnham et al 2001) Due to
ecological and economic damages caused by invasive species in the past (Ruiz et al 1997
Waite et al 2003 Gregg et al 2009) the International Maritime Organization (IMO)
implemented the Ballast Water Management Convention The Convention specifies in the D-2
standard the amount of viable organisms allowed in ballast water upon discharge
(Anonymous 2004) According to the BWM Convention the D-2 standard requires that
ballast water upon discharge should contain
- Less than 10 viable orgm3 ge 50 μm in minimum dimension
- Less than 10 viable orgml lt 50 μm and ge 10 μm in minimum dimension
1 Department of Biological Oceanography Royal Netherlands Institute for Sea Research POBox 59 NL-1790
AB Den Burg Texel The Netherlands Corresponding author ivanderstarmea-nlcom Questions referring to the ballast water project at NIOZ LouisPeperzaknioznl
42
STAR LIEBICH AND STEHOUWER
Indicator microbes at the following concentrations (cfu= colony forming units)
- Vibrio cholerae lt 1 cfu100ml
- Escherichia coli lt 250 cfu100ml
- Intestinal Enterococci lt100 cfu100ml
Besides some indicator microbes the D-2 standard does not include requirements of
organisms smaller than 10 μm in minimum dimension
2 Organisms lt10 μm Biology toxicity and high health risks
The size class smaller than 10 μm in minimum dimension comprises a great variety
phytoplankton micro-zooplankton protozoa bacteria and viruses The size classes as
defined in the D-2 standard refer to minimum dimension ie the widest dimension of the
smallest visible axis of the body excluding appendages (Miller et al 2011 Gollasch et al
2007)
Numerous marine species are on average below 10 μm in minimum dimension eg Pseudo-
nitzschia sp Nitzschia sp Skeletonema sp and Bodo sp Especially in elongated or needle
shaped diatom taxa like Pseudo-nitzschia and Nitzschia the minimum dimension can be
below 5 microm (transapical axis) while cell length can be more than 30 microm (apical axis) Besides
these there are also organisms around 10 μm in minimum dimension (eg Thalassiosira sp
Balanion sp and Tetraselmis sp) A third group is formed by organisms having a complex life
cycle including stages belonging to more than one size class An example for this is Pfiesteria
piscicida It shows a complex life cycle including transformation forms of flagellate amoebe
and cyst (Burkholder and Glasgow 1997) Size in this species depends on life stage and diet
It ranges between 5-450 μm
Resting stages and cysts are smaller than their vegetative cells and a lot are lt10 μm in
minimum dimension They easily survive transport in ballast water or in the sediment at the
bottom of ballast tanks
Hallegraeff and Bolch (1992) investigated the viability of phytoplankton cysts in sediment of a
ballast water tank Twenty cysts of 53 identified species showed viable regrowth in cultures
Among the surviving species numerous belonged to the group of toxic dinoflagellates
including Alexandrium catenella Alexandrium tamarense and Gymnodinium catenatum The
occurrence of toxin producing plankton species can result in negative effects since they can
be harmful already in low cell concentrations Also blooming phytoplankton species can be
harmful by causing anoxic conditions following their decay (eg Skeletonema sp
Thalassiosira sp and Phaeocystis sp)
43
THE IMPORTANCE OF ORGANISMS SMALLER THAN 10 microm
Toxicity of these harmful bloom forming species with an average cell size of less than 10 microm
affects other organisms in the ecosystem but it may also affect humans Humans can be
exposed through different ways like seafood consumption dermal contact (Knap et al 2002)
or by inhalation (Kirkpatrick et al 2004) Exposure can pose health risks including irritation of
skin eye and respiratory tract gastroenteritis and short term neurocognitive disorders (for
references see Sellner et al 2003 and Grattan et al 2001) Toxic species may become
invasive because this size class is not included in compliance testing of BWTS
The main part of invasive phytoplankton species found is larger than 10 microm in size eg
diatoms like Rhizosolenia indica and Coscinodiscus wailesii (Goacutemez and Souissi 2010
Nehring 1998) This might be due to their cell size which makes them easier to monitor by
microscopy which is the established standard method Data are scarce on invasive species
below 10 microm in minimum dimension Nehring (1998) reviewed studies discussing invasive
species and mentioned Prorocentrum triestinum ranging from 6-11microm in minimum dimension
Fifteen other invasive phytoplankton species in the North Sea reviewed in the same study are
bigger than 10 microm in minimum dimension However some of the larger cells form cysts
which are much smaller than their vegetative cells and can survive long periods in the dark
Therefore for numerous reasons the whole range of phytoplankton cell sizes should be
considered and not exclusively those larger than 10microm
3 Enumerating and size determination of phytoplankton with a cell size of lt10 μm
Flow cytometry (FCM) is used as analytical method for microorganisms (unicellular algae
protozoa bacteria and viruses) in aquatic ecosystems since the early 1980rsquos (eg Dubelaar
and Jonker 2000 Veldhuis and Kraay 2000 Vives-Rego et al 2000 Yentsch et al 1983
Troussellier et al 1993) It is a faster tool for quantifying microorganisms compared to
microscopic analysis especially for the smaller phytoplankton species where high numbers
can be found above 108 per litre (Veldhuis and Kraay 2000)
Quantitative analysis of phytoplankton smaller than 10 μm in minimum dimension can be
done by flow cytometry Guideline G8 does not require these measurements (Anonymous
2008) However the Royal Netherlands Institute for Sea Research (NIOZ) performs this
analysis from the beginning of land based testing of BWTS at their harbor (Texel The
Netherlands) For further information on this test facility for BWTS see Veldhuis et al (2006)
Data presented here come from control samples taken during testing of BWTS before any
treatment Analysis is done in triplicate Quantitative results of the last three years show that
phytoplankton smaller than 10 μm comprises 92 (SD= 6) of the total phytoplankton cells
found in control samples (Table 1) This research is based on a total of 85 samples and 255
measurements
44
STAR LIEBICH AND STEHOUWER
Table 1 Percentage of phytoplankton lt10 microm of total phytoplankton counts in control
samples during April till June from 2009 till 2011 analyzed by FCM
Year samples taken
analyzed samples
minimum
maximum average SD
2009 21 63 71 98 92 6
2010 40 120 76 99 92 5
2011 24 72 60 99 92 6
total 85 255 60 99 92 6
4 Cell viability and regrowth potential
To investigate the regrowth ability of phytoplankton after treatment of BWTS long-term
incubation experiments were performed Experiments were conducted based on normal
scheduled test runs according to the G8 guideline (Anonymous 2008) Results are compared
of two treatment systems The first treatment system includes a filter (20 microm mesh size) and
low-pressure UV-radiation (fixed wavelength of 254 nm) and the second treatment system
includes a filter (200 microm mesh size) hydrocyclone and electrolytic chlorination Systems
were tested from March till June 2010 and treated water was stored during five continuous
days Before discharge 10 litre samples were taken for incubation experiments Quantitative
analysis of phytoplankton was done every five days by flow cytometry (Coulter Epics XL-MCL
with a 488 nm argon laser Miami USA) Further details of incubation experiments can be
found in Stehouwer et al (2010)
After treatment with the UV system (Figure 1A-D) no regrowth of phytoplankton was found the
first five days After 10 to 15 days there is substantial regrowth especially of phytoplankton
lt10 microm Comparable tests with the electrolytic chlorination showed also regrowth (Figure 2A-
D) after 10 days of mainly phytoplankton lt10 microm although numbers were lower than the UV
system This was also found after 15 and 20 days while phytoplankton numbers further
increased especially phytoplankton lt10 microm For both treatment systems and during the
whole period larger numbers of phytoplankton lt10 microm were found compared with the size
class above 10 microm
5 Discussion and conclusion
The abundance of phytoplankton in different size classes is highly dependent on the growth
(primary production) and mortality due to grazing eg by zooplankton (Gieskes and Kraay
1975) and therefore seasonal dependent During spring and early summer phytoplankton
species with a minimum dimension of 10 microm are the main species found in the NIOZ harbor
(92 of all phytoplankton) These organisms also showed a large ability to regrow after
treatment by different BWTS although there was a lag period of up to 10 days When
45
THE IMPORTANCE OF ORGANISMS SMALLER THAN 10 microm
Figure 1 Phytoplankton counts by FCM chlorophyll (FL4log) against the size of the
phytoplankton (FSlog) at discharge after treatment including filter and UV at day A=0
B=5 C=10 and D=15The size class large is gt10microm
comparing systems filter together with UV treatment showed faster regrowth and higher
numbers compared to the system using filter hydrocyclone and electrolytic chlorination
Faster regrowth after UV treatment is unexpected due to the fact that water is treated twice by
an UV system namely before intake and before discharge However phytoplankton regrowth
after UV treatment is also found in other studies (Waite et al 2003 Stehouwer et al 2010
Sutherland et al 2001)
Determination of regrowing phytoplankton species was also done after UV treatment
Different phytoplankton species were found including Chaetoceros sp Skeletonema sp and
Thalassiosira sp in the lt10 microm and 10-50 microm size class (Liebich et al 2011) Results of this
FS LOG
FL4 L
OG
100
101
102
103
104
100
101
102
103
104
medium
small
large
FS LOG
FL4 L
OG
100
101
102
103
104
100
101
102
103
104
medium
small
large
FS LOG
FL4 L
OG
100
101
102
103
104
100
101
102
103
104
medium
small
large
FS LOG
FL4 L
OG
100
101
102
103
104
100
101
102
103
104
medium
small
large
A B
C D
46
STAR LIEBICH AND STEHOUWER
Figure 2 Phytoplankton counts by FCM (chlorophyllFL4log against the size of the
phytoplankton FSlog) at discharge after treatment including filter hydro cyclone and
electrolytic chlorination at day A= 0 B=5 C=10 and D=15 The size class large is gt10 microm
study suggest that only certain phytoplankton species are able to survive after treatment in a
ballast water tank Regrowth abilities of these survivors might be due to a broader
temperature tolerance high growth rates and the ability to form resting stages in their life
cycle These traits imply the potential of the species to become invasive once discharged
(Liebich et al 2011) Besides the well discussed phytoplankton lt10 microm it is known that this
size class includes various other groups of organisms like micro-zooplankton protozoa
bacteria and viruses In particular the smaller sized organisms possess a high growth rate
(Kagami and Urabe 2011) favoring their regrowth ability when discharged in recipient water
Due to toxic and harmful species in this size class successful invasion may result in negative
effects on ecosystems and may cause health risks
FS LOG
FL4 L
OG
100
101
102
103
104
100
101
102
103
104
medium
small
large
FS LOG
FL4 L
OG
100
101
102
103
104
100
101
102
103
104
medium
small
large
FS LOG
FL4 L
OG
100
101
102
103
104
100
101
102
103
104
medium
small
large
FS LOG
FL4 L
OG
100
101
102
103
104
100
101
102
103
104
medium
small
large
A B
C D
47
THE IMPORTANCE OF ORGANISMS SMALLER THAN 10 microm
The problem of invasive species in the oceans is still a huge issue to solve The IMO made
important progress by the Ballast Water Management Convention although it is not
implemented yet However when this convention becomes into force living organisms
smaller than 10 microm in minimum dimension will still be able to be discharged This is due to
the fact that these organisms are not mentioned in the D-2 standard except for certain
indicator microbes Invasiveness of this size class by ballast water transportation is possible
because they are not analyzed when testing BWTS following the G8 guideline (Anonymous
2008)
Besides the D-2 standard other standards are developed including the proposed ldquoCalifornian
standardrdquo and USCG Phase-2 standard which do mention bacteria and viruses No other
organisms smaller than 10 microm as phytoplankton micro-zooplankton and protozoa are
mentioned It is possible to quantify viruses and bacteria in marine and fresh water by flow
cytometry However it is questionable if it is needed to include viruses in any standard
because viruses are not regarded as living organisms Bacteria occur in high numbers in
surface water but also in drinking water bacteria numbers between 556times102 and 394times104
per ml have been found (Hoefel et al 2003) Therefore it might be impractical to have a high
standard for bacteria when testing BWTS It is more realistic to have high standards for
phytoplankton and zooplankton species below 10 microm in minimum dimension However when
it becomes possible to amend the D-2 standard after ratification it will be difficult to decide
how While this is still under debate it is clear that organisms below 10 microm in minimum
dimension are important and should be taken into account in the requirements for certification
of ballast water treatment systems
REFERENCES
Anonymous (2004) International Convention for the Control and Management of Shipsrsquo Ballast Water
and Sediments International Maritime Organization httpwwwimoorg
Anonymous (2008) Guidelines for approval of ballast water management systems
(G8)Annex3Resolution MEPC174(58) Annex Parts 123 and 4
Burkholder JM Glasgow HB (1997) Pfiesteria piscicida and other Pfiesteria-like dinoflagellates
Behavior impacts and environmental controls Limnol Oceanogr 42 1052-1075
Carlton JT (1987) Patterns of Transoceanic Marine Biological Invasions in the Pacific-Ocean
Bulletin of Marine Science 41452-465
Dubelaar GBJ Jonker RR (2000) Flowcytometry as a tool for the study of phytoplankton Sci
Mar 64135-156
Gieskes WWC and Kraay G (1975) The phytoplankton spring bloom in Dutch coastal waters of the
North Sea Neth J Sea Res 9166-196
48
STAR LIEBICH AND STEHOUWER
Gollasch S David M Voigt M Dragsund E Hewitt C and Fukuyo Y (2007) Critical review of
the IMO international convention on the management of shipsrsquoballast water and sediments Harmful
Algae 6585-600
Goacutemez F and Souissi S (2010) The diatoms Odontella sinensis Coscinodiscus wailessii and
Thalassiosira punctigera in the European Atlantic recent introductions or overlooked in the past
Fresenius Env Bull191424-1433
Grattan LM Oldbach D and Morris JG (2001) Human Health risks of exposure to Pfiesteria
Piscicida Bioscience 51853-858
Gregg MD Rigby G and Hallegraeff M (2009) Review of two decades of progress in the
development of management options for reducing or eradicating the phytoplankton zooplankton and
bacteria in ships ballast water Aquatic invasions 4521-565
Hallegraeff GM and Bolch CJ (1992) Transport of diatom and dinoflagellate resting spores in ships
ballast water implications for plankton biogeography and aquaculture J Plankton Res 141067-1084
Hoefel D Grooby WL Monis PT Andrews S and Saint CP (2003) Enumeration of water-borne
bacteria using viability assays and flow cytometry a comparison to culture-based techniques J of
Microbiol Meth 55585-597
Kagami M and Urabe J (2001) Phytoplankton growth rate as a function of cell size an experimental
test in Lake Biwa Limnology 2111ndash117
Kirkpatrick P Fleming LE Squicciarini D Backer LC Clark R Abraham W Benson J
Cheng YS Johnson D Pierce R Zaias J Bossart GD and Baden DG (2004) Literature
review of Florida red tide implications for human health effects Harmful Algae 399-115
Knap A Dewailly E Furgal C Galvin J Baden D Bowen RE Depledge M Dugua L
Fleming LE Ford T Moser F Owen R Suk WA and Uluata U (2002) Indicators of ocean
health and human health developing a research and monitoring framework Environ Health
Perspect110839-845
Liebich V Stehouwer PPand Veldhuis M (2011) Re-growth of potential invasive phytoplankton
following UV-based ballast water treatment Aquatic Invasions 7 published online doi
103391ai20127
Miller AW Frazier M Smith GE Perry ES Ruiz GMand Tamburri MN (2011) Enumerating
sparse organisms in shipsrsquo ballast water why counting to 10 is not so easy Environmental Science
and Technology 453539-3546
Nehring S (1998) Establishment of thermophilic phytoplankton species in the Nort Sea biological
indicators of climatic changes ICES J of Marine Sci 55818-823
Ruiz GM Carlton JT Grosholz ED and Hines AH (1997) Global invasions of marine and
estuarine habitats by non-indigenous species mechanisms extent and consequences American
Zoologist 37621ndash632
49
THE IMPORTANCE OF ORGANISMS SMALLER THAN 10 microm
Sellner KG Doucette GJand Kirkpatrick GJ (2003) Harmful algal blooms causes impacts and
detection J Ind Microbiol Biotechnol 30383-406
Stehouwer PP Fuhr F Veldhuis M (2010) A novel approach to determine ballast water vitality and
viability after treatment In Bellefontaine N Haag F Linden O Matheickal J (eds) (2010)
Proceedings of the IMO-WMU Research and Development Forum 2010 Malmouml Sweden 233-240
Sutherland TF Levings CD Elliott CC Hesse WW (2001) Effect of a ballast water treatment
system on survivorship of natural populations of marine plankton Mar Ecol Prog Ser 210139-148
Troussellier M Courties Cand Vaquer A (1993) Recent applications of flow cytometry in aquatic
microbial ecology Biol Cell 78111-121
Veldhuis MJW Fuhr F Boon JPand Ten Hallers-Tjabbers C (2006) Treatment of ballast water
How to test a system with a modular concept Environmental Technology 27909-921
Veldhuis MJW and Kraay GW (2000) Application of flow cytometry in marine phytoplankton
research current applications and future perspectives Scientia Marina 64121-134
Vives-Rego J Lebaron Pand Nebe-von Caron G (2000) Current and future applications of flow
cytometry in aquatic microbiology FEMS Microbiology reviews 24429-448
Waite TD Kazumi J Lane PVZ Farmer LL Smith SG Smith SL Hitchcock Gand Cap
TR (2003) Removal of natural populations of marine plankton by a large-scale ballast water
treatment system Marine Ecology-Progress Series 25851-63
Wonham MJ Walton WC Ruiz GM Frese AMand Galil BS (2001) Going to the source role
of the invasion pathway in determining potential invaders Marine Ecology-Progress Series 2151-12
Yentsch CM Horan PK Murhead K Dortch Q Haugen E Legendre L Murphy LS Perry
MJ Phinney DA Pomponi SA Spinrad RW Wood M Yentsch CSand Zahuranec BJ
(1983) Flow cytometry and cell sorting A technique for analysis and sorting of aquatic particles
Limnol Oceanogr 281275-1280
51
BALLAST WATER MANAGEMENT SYSTEMS
ERMA FIRST BWTS
An Integrated and Modular Ballast Water Treatment
System ndash Performance and Compliance with IMO Guidelines
Efi Tsolaki1 Konstantinos Stampedakis Yannis Moulinos Nikos Kyritsis
Abstract
The ERMA FIRST Ballast Water Treatment System (BWTS) produced by ERMA FIRST ESK SA
(Greece) is an integrated ballast water treatment system It consists of a combination of a mechanical
separation system and an electrolysis system The combination of an automatic back-flushing filter with
an advanced cyclonic separator ensures trouble-free operation as well as efficient removal of biota
and particles with a minimum diameter of 50 microns The separation stage is necessary for
conditioning the quality of ballast water before the electrolysis unit The electrolysis apparatus follows
the ballast water conditioning The unit utilizes special coated electrodes for the production of chlorine
as a disinfectant that ensures sufficient chlorine concentration even in low salinity waters The
blockage-free operation of the system its efficiency and the compliance with the Regulations D2 and
Guidelines regulated by the International Maritime Organization through land-based and shipboard
testing are demonstrated in this study It is established beyond doubt that the ERMA FIRST Ballast
Water Treatment System could be regarded as a fast and effective way for reducing the number of
viable organisms in ballast water of ships
Keywords ballast water electrolysis mechanical separation D2 standards risk assessment
1 Introduction
The introduction of invasive marine species into new environments by the discharge of a
shiprsquos ballast water the attachment of these species to a shiprsquos hull and via other vectors has
been identified as one of the four greatest treats to the worldrsquos oceans Shipping moves over
80 of the worldrsquos commodities and transfers approximately 3 to 10 billion tonnes of ballast
water internationally each year
Ballast water is essential to the safe and efficient operation of modern shipping providing
balance and stability to ships The translocation and release of ballast water causes
environmental economic and health threats that are concerns of governments maritime
environmental entities and public health organizations As shipping is probably the most
international industry the only effective way to address shipping-related issues is through a
standardized international system This has been one of the targets of IMO during the last 50
years of its existence IMO member States adopted a new ballast water Convention in
1 ERMA FIRST ESK ENGINEERING SOLUTIONS SA
52
TSOLAKI STAMPEDAKIS MOULINOS AND KYRITSIS
February 2004 The International Convention for the Control and Management of Shipsrsquo
Ballast Water and Sediments was adopted by a Diplomatic Conference at IMO in London on
Friday 13 February 2004 As of September 2011 the Convention had been ratified by 28
contracted states representing 2637 of world tonnage In order to attain the necessary
ratification of the Convention in the near future the urgent of approval of systems is more
important than ever The ERMA FIRST BWTS has been designed and developed by ERMA
FIRST ESK Engineering Solutions SA a Greek company established to produce a sound and
reliable ballast water treatment system
ERMA FIRSTrsquoS RampD department started operational research in 2006 for the development of
the ballast water treatment system exploring various aspects of the electrochemical
generation of sodium hypochlorite in relation to the biological efficacy required by the D2
performance standard of the Convention Laboratory testing was conducted that was aimed
at evaluating the efficacy of the whole process testing different concentrations of free active
chlorine on representative species of taxonomic groups that prevail in the fraction of less than
20 microm of filtered sea water In the bench-scale testing that followed issues such as dose
effectiveness were assessed to determine the optimum operational characteristics of the
system and the need for neutralization of residual products before discharge of treated ballast
water into the sea
In this study the operation of the system is demonstrated as well as its efficiency and the
compliance with the Regulations D2 and Guidelines regulated by the IMO through land-based
and shipboard testing
2 ERMA FIRST Ballast Water Treatment System Overview
The ERMA FIRST BWTS is an integrated autonomous and modular treatment system for
ballast water jointly developed by a group of scientists and engineers with extensive
experience in the design and production of equipment for ship-generated liquid waste
treatment
The treatment process includes two distinctive stages ndash a primary stage that enables the
separation of coarser suspended materials and relatively larger living organisms in ballast
water and a secondary stage in which electrolytic disinfection takes place to meet the
required biological efficacy standard for treated ballast water as stipulated in the Convention
At the primary stage of the process removal of material with diameters larger than 20 microm is
accomplished by means of an advanced cyclonic separator made from frictionless material
To prevent blocking of the separator from large particles that might pass though the sea
53
ERMA FIRST BWTSAN INTEGRATED AND MODULAR BALLAST WATER TREATMENT SYSTEM
chests and strainers of the vessel a 200 microm self-cleaning basket filter has been installed
prior to the separator
Electrolysis of ballast water to produce in situ free active chlorine up to10 mgL constitutes the
second stage of treatment that takes place during ballasting The products of this process
flow into the ballast tanks of the vessel so that the residual oxidants disinfect any harmful
organisms taken onboard Integral components of the system are the control and monitoring
equipment that ensure its proper operation as well as the neutralization process of treated
ballast water prior to its eventual discharge into the sea
The operational status of the system is continuously monitored at a central data logger
located on the central control panel of the system Data logging includes the operation status
of the system operation flow and temperature at the electrolytic cell pressure differences
across the self-cleaned filter and the cyclonic separator the operational status of the
neutralizing agent dosing pump as well as the chlorine level of the system The control panel
can be positioned into the cargo control room of the vessel
3 ERMA FIRST BWTS OPERATION
The ERMA FIRST BWTS is an autonomous fully automatic operational unit The system has
two different operational modes one during ballasting and one during the discharge of treated
ballast water (de-ballasting) The two operational modes are described in the following
paragraphs
Mode one Ballasting
During ballasting ballast water passes through the 200 microm pre-filter and then into the
cyclonic separator The underflow stream rich in sediments and coarse material from the
latter returns back into the sea via a drain line The overflow enters the electrolytic cell A flow
sensor installed upstream of the cell provides a signal to the cell through the PLC of the
system to apply a DC current to the electrodes in order to initiate the electrochemical process
and the production of the Active Substances A free chorine sensor (TRO sensor) located
downstream of the cell monitors the free chlorine concentration
The production rate of the Active Substances is continuously adjusted in accordance with the
ballast flow rate and the measurement of the free chlorine at the sensor Depending on the
flow rate and the free chlorine measurement the voltage at the cell changes in order to
maintain the pre-set free chorine concentration
The electrolytic cell of the system has been specifically designed to produce the identified
Active Substances at temperatures as low as 5oC and a water salinity gt 60 PSU The ability
54
TSOLAKI STAMPEDAKIS MOULINOS AND KYRITSIS
of the cell to produce free chlorine under such conditions is based on the special coating
material of its electrodes and also on its design that enables sufficient contact time of
chlorides in the water stream with the electrodes thus providing enough contact time to
convert into Active Substances
Figure 1 Operation mode during the ballasting
Similarly the electrolytic cell of the system can operate effectively in salinities above 32 PSU
due to the fact that water of such salinity results in high electrical resistance and thus the
PLC of the system will adjust the voltage at the electrodes in such manner to maintain the
production of free chlorine at the pre-set valuesThe whole unit is current-driven controlled by
the chlorine sensor arranging for the set concentration and current applied to the electrodes
resulting in a specific amount of active substance production By monitoring the operating
Amperes on the electrodes of the cell and adjusting the applied voltage the PLC of the
system ensures a constant production rate of Active Substances in an extended salinity and
55
ERMA FIRST BWTS AN INTEGRATED AND MODULAR BALLAST WATER TREATMENT SYSTEM
temperature range Note that the ballast water management system can be bypassed using
the appropriate valve arrangement (eg in cases of emergency)
Operation mode two Deballasting
During de-ballasting neutralization of the total residual oxidants takes place by adding an
aqueous sodium bisulfite solution (38 ww) At this mode the pre-filtering equipment the
cyclonic separator and the electrolytic cell of the system are bypassed with the exception of
the free chlorine sensor
For the efficient control of the neutralizing process during de-ballasting and the avoidance of
the surplus consumption of the neutralizing media the ERMA FIRST system is equipped with
an additional chlorine sensor The new chlorine sensor is of the same type as the two others
already equipped on the system and it is installed at the de-ballasting line prior the
neutralizing agent injection point The reading of this sensor drives the dosing rate of the
neutralizing pump The dosing rate of the neutralizing pump is based on the stoichiometry of
the neutralization reaction between the chlorine and sodium bisulfite
From the stoichiometry of the reaction for the neutralization of 1 mgL of chlorine 15-17
mgLi (Metcalf amp Eddy 2003) of sodium bisulfite (ie for the 10 mgL concentration of total
residual oxidants) and 17 mgL of NaHSO3 are required for effective neutralization According
to this stoichiometry and the readings of the free chlorine sensor installed upstream of the
dosing point a neutralizing pump is activated By using a safety margin of 10 the dosing
pump of the neutralizing agent should be set at a point to deliver 187 mgL sodium bisulfite
As recommended a discharge control point for TRO has been added to the system with the
fitting of a second sensor in the deballasting procedure that will ensure that the maximum
allowable discharge concentration (MADC) of 02 mgL (as Cl2) will not be exceeded The
third sensor of the system is installed on the far end point of the de-ballasting line after the
neutralization injection point but close to the discharge point This sensor confirms that the
chlorine concentration is well below the MADC In case that the total chlorine level at the
discharge will reach the maximum MADC of 02 mgL then the dosing rate of the pump of the
neutralization unit will increase in order to reduce the TRO to the recommended lowest
MADC A schematic diagram of the operation of the system during de-ballasting is illustrated
in figure 2
56
TSOLAKI STAMPEDAKIS MOULINOS AND KYRITSIS
Figure 2 Operation mode during deballasting
4 Efficacy of the ERMA FIRST BWMS
The land-based testing of the ERMA FIRST ballast water treatment system according to IMO
respective G8 and G9 Guidelines was successfully completed in July 2010 in the testing
facility of the Royal Netherlands Institute for Sea Research in the Netherlands demonstrating
the effectiveness of the system to comply with the D2 performance standard as well as its
reliability and environmental acceptability The Whole Effluent Toxicity Testing that was
conducted during the land-based testing proved that the discharge of neutralized treated
ballast water is not toxic as no toxic effects were observed to the organisms exposed
Compliance with the Regulations D2 and Guidelines The ERMA FIRST followed the appropriate procedure as indicated by the Guidelines in order
to obtain Basic Final and Type Approval for its ballast water treatment system ERMA FIRST
collaborated with the expert scientists from among the most knowledgeable in the field in
order to be competent in the market of ballast water systems
57
ERMA FIRST BWTS AN INTEGRATED AND MODULAR BALLAST WATER TREATMENT SYSTEM
At first Basic Approval was granted in the MEPC 62 (July 2011) as the Application for Basic
approval was recommended by 15th GESAMP meeting (December 2010) Application for
Final Approval was submitted to the Secretary of IMO to be evaluated in the 63rd MEPC
(March 2012)
Land-based tests were carried out at the Royal Netherlands Institute for Sea Research
(NIOZ) in the Texel Netherlands from March through July 2010 The system was a full-scale
commercially available system The hydraulic capacity of the system tested was 100 m3h
Shipboard tests on board MV COSCO GUANGZOOU (IMO No 9305570) a 9600 TEU
container vessel were carried out from January until June 2011 The system was modular of
hydraulic capacity 500 m3h
Land-based testing Land-based tests were carried out at the Royal Netherlands Institute for Sea Research
(NIOZ wwwnioznl) in the Texel Netherlands from March through July 2010 [3] The
system was a full-scale commercially available system The hydraulic capacity of the system
tested was 100 m3h (NIOZ 2011)
A summary of water parameters in the NIOZ test facility is presented in the Table 1 The
procedure was in conformance with Guidelines for approval of ballast water management
systems (G8)
Table 1 Summary of water parameters in the NIOZ test facility
Parameter Value
Temperature (degC) Variable
Salinity (PSU) 20-34
TSS (mgl) 5-400
POC (mgl) 5-20
DOC (mgl) 1-5
Organisms ge 50micromm3
10000-1000000
Organisms lt50 ge 10micromm3
100-100000
Heterotrophic bacteria ml
10000-10000000
(Source Report of Global expert workshop on harmonization of methodologies for test facilities of ballast water management systems (24-25 January 2010) World Maritime University Malmouml Sweden)
Physical and chemical analysis of treated ballast water
Sample handling and volumes were in accordance with G8 Guidelines Temperature pH
Dissolved Oxygen DOC TSSPOC were monitored prior during and after ERMA FIRST
58
TSOLAKI STAMPEDAKIS MOULINOS AND KYRITSIS
ballast water discharge Also chlorine decay was studied in-situ using samples from the
ballast tanks Chemical analyses for disinfection by-products of treated ballast water were
performed also during land-based testing by OMEGAM Laboratories Relevant chemicals
were measured for both low and high salinity test cycles at Day 1 and Day 5 of treatment
Total Residual Oxidants
During each test cycle the concentration of the active compound (Total Chlorine) was
measured as soon as possible after filling of the treated ballast water tank also at regular
intervals during the 5-day holding period and during discharge
Total Residual Oxidant (TRO) was measured as total chlorine using the Hach portable
spectrophotometer DR 2800 The device employs the DPD Method accepted for reporting
water analyses by the USEPA and is equivalent to USEPA method 3305 for wastewater and
Standard Method 4500-Cl G for drinking water The method had a detention limit of 002 mgL
as Cl2 Samples were collected from the ballast tanks immediately after the completion of
ballasting and afterwards every 24h from the ballast tank
Retention time was 120 h Neutralization occurred five days after ballasting during discharge
of the ERMA FIRST treated water TRO as chlorine was not detected post neutralization
procedure
Disinfection By-products
All samples were taken at discharge to ensure that the data represent full-scale employment
Samples indicated that trichloromethane was the only non-detectable THM (Trihalomethanes)
compound The following HAA (haloacetic acids) had measurable concentrations in treated
ballast water Monobromoacetic acid bromochloroacetic acid dibromoacetic acid
tribromoacetic acid and dibromochloroacetic acid Bromate was also detected once In low
salinity water the most predominant haloform was tribromomethane comprising more than
95 of the total trihalomethanes Dibromochloromethane and bromodichloromethane
constituted 2 and 3 respectively Trichloromethane was not detected The most
predominant haloacetic acid was dibromoacetic acid accounting for more than 83 of the
total haloacetic acids Tribromoacetic acid bromochloroacetic acid and monobromoacetic
acid constituted up to 12 3 and 2 respectively Monochloroacetic acid dichloroacetic
acid trichloroacetic acid dibromochloroacetic acid and bromodichloroacetic acid were not
detected
In high salinity water the most predominant haloform was tribromomethane accounting for
more than 98 of the total trihalomethanes Dibromochloromethane constituted 2 of the
total trihalomethanes Trichloromethane and bromodichloromethane were not detected The
59
ERMA FIRST BWTS AN INTEGRATED AND MODULAR BALLAST WATER TREATMENT SYSTEM
most predominant haloacetic acid was tribromoacetic acid accounting for more than 93 of
the total haloacetic acids Dibromochloroacetic acid and dibromoacetic acid constituted up to
1 and 6 respectively Monochloroacetic acid monobromoacetic acid dichloroacetic acid
trichloroacetic acid dibromochloroacetic acid and bromodichloroacetic acid were not
detected Bromate was only detected in high salinity test cycle on Day 5 Higher
concentrations of bromo haloacetic acids in seawater could be attributed to a high bromide
content of the seawater
Biological effectiveness
Sample handling and volumes were in accordance with G8 Guidelines Organisms larger than
50 microm were collected using modified Hydrobios net The effluent of the Hydrobios net was
collected and corresponded to the fraction of organisms 10 to 50 microm A 10 microm sieve was
used to filter a subsample from the effluent net in order to enumerate organisms less than 10
microm
The analyses of bacteria (total heterotrophic bacteria) and human pathogens (Intestinal
Enterococci and E coli) were carried out according to international standards NEN-EN-ISO
62221999 7899-2 9308-1 respectively
Table 2 Summary of Biological Efficiency of ERMA FIRST BWTS of Land-Based Testing in NIOZ
ERMA FIRST Treated ballast water
Organisms Run test
gt50 microm (numbersm3)
lt10 microm (numbersm3)
10-50 microm (numbersm3)
E coli (cfumL)
Enterococci (cfu100mL)
Total bacteria
(countsmL)
Comply with D2
standards I 197 262 103 lt01 lt1 187E+06 X
II 23 627 08 lt01 lt1 120E+05 radic
III 2 198 0 lt01 lt1 820E+04 radic
IV 17 56 0 lt01 lt1 153E+05 radic
V 27 413 0 lt01 lt1 166E+05 radic
VI 27 32 08 lt01 lt1 220E+05 radic
VII 0 16 0 lt01 lt1 209E+05 radic
VIII 03 08 0 lt01 lt1 188E+05 radic
IX 03 32 0 lt01 lt1 237E+05 radic
X 0 0 0 lt01 lt1 213E+05 radic
XI 0 63 08 lt01 lt1 222E+05 radic
All 10 test runs were effectively conducted according to the IMOrsquos G8 Guidelines During test
runs the numbers of viable organisms at discharge were at least one order of magnitude
60
TSOLAKI STAMPEDAKIS MOULINOS AND KYRITSIS
lower than the D2 Standard The residual number of organisms at discharge was well in
compliance with the D2 Standard
All detailed data are presented in the official NIOZ report (NIOZ Report 2011) and a
summary of the 11 run cycles of two conditions of ballast water are presented in Table 2 With
the exception of the first run all 10 subsequent runs were successful in complying with D2
standards
Ecotoxicity testing of treated ballast water land based testing
The toxicity of treated ballast water was evaluated at the laboratories of the Institute for
Marine Resources amp Ecosystem Studies ndash IMARES in Den Helder Netherlands [5]
Four bioassays were performed representing four different phyla of marine organisms the
marine diatom Phaeodactylum tricornutum the crustacean Artemia franciscana the rotifer
Brachyonus plicatilis and the fish larvae Solea solea (IMARES 2010)
Treated ballast water and neutralized treated ballast water were evaluated in two salinity
regimes in a concentration series that was made by diluting test water with untreated ballast
water Algal growth inhibition tests were carried out with water sampled directly after
treatment (T0) and storage for 1 day (T1) 2 days (T2) and 5 days (T5) respectively while the
tests for the other organisms were carried out following the storage of treated ballast water for
1 day (T1) and 5 days (T5)
Algae growth inhibition Phaeodactylum tricornutum
Algal growth inhibition by exposure to a sample is determined by the so-called algal growth
inhibition test according to ISO 10253 (2006) and OECD 201 (1984) procedures Exposure to
neutralized treated ballast water did not result in reduced growth of Phaeodactylum
tricornutum in most growth inhibition tests
Rotifer mortality test with Brachionus plicatilis
The test applied is commercially available as Testkit at MicroBiotest Innc Belgium under the
name ROTOXKIT M and performed according to the Standard Operational Procedure
provided by the manufacturer No mortality was observed in any of the rotifer tests with
exposure to neutralized treated ballast water
Crustacean mortality with Artemia franciscana
The Crustacean mortality test was performed in a multi-well testplate using instar II-III larvae
of the brine shrimp Artemia franciscana obtained as dried cysts from Microlan BV
Netherlands The test conformed with the Standard Operational Procedure for ARTOXKIT
61
ERMA FIRST BWTS AN INTEGRATED AND MODULAR BALLAST WATER TREATMENT SYSTEM
Mtrade (MicroBioTests Inc V100603) No mortality was observed in any of the crustacean tests
with exposure to neutralized treated ballast water
Fish mortality test with Solea solea
The fish mortality test protocol is based upon OECD-203 (1992) No mortality was observed
in any of the fish tests with exposure to neutralized treated ballast water
Shipboard testing
Shipboard testing of the system is being currently conducted onboard a 9600 TEU Greek-
flagged container vessel Cosco Guangzhou Until now three successful test cycles have
been conducted from January to August 2011 which are presented in Table 3 below ERMA
FIRST collaborated with GoConsult for the performance procedure of the shipboard testing
Table 3 Summary of Biological efficiency of ERMA FIRST BWTS of Shipboard Testing
ERMA FIRST Treated ballast water
Organisms
Run test
gt50 microm (numbersm3)
lt10 microm (numbersm3)
10-50 microm (numbersm3)
E coli (cfumL)
Enterococci (cfu100mL)
Vibrio cholerae
(countsmL)
Comply with D2
standards I 19 nd Nd Nd 2 nd radic
II 12 nd Nd Nd 53 nd radic
III 44 nd Nd Nd 37 nd radic
nd not detected
IMO Guideline G8 was followed and met during trial tests The D2 standard was met during
uptake and discharge procedures
Corrosion testing
ERMA FIRST contracted TNO to evaluate the corrosivity of the ERMA FIRST system
following the recently published GESAMP recommendations for corrosivity testing (MEPC
59216 Report of the 8th GESAMP meeting group) The aim of this study was to compare the
corrosivity of seawater treated with the ERMA FIRST BWTS relative to untreated seawater
The different corrosivity tests were performed on coated and uncoated samples according to
the above mentioned GESAMP recommendations [6] The project ended in the middle of
August of 2011 and the complete report will be submitted for the Type Approval procedure
(TNO 2010)
A 6-month corrosion testing project was carried out by TNO involving certain immersion tests
of coated and uncoated materials as well as electrochemical measurements summarized
below
62
TSOLAKI STAMPEDAKIS MOULINOS AND KYRITSIS
Crevice corrosion testing of stainless steel alloys AISI 316L and AISI 304 in treated
seawater and untreated seawater
Cyclic potentiodynamic polarization measurements to determine relative susceptibility
to localized corrosion (pitting and crevice corrosion) in treated seawater and untreated
seawater for the varying materials (ie Stainless steel alloy AISI 316L Stainless steel
alloy AISI 304 Low carbon steel ST 37 and CuNi 90-10)
Immersion corrosion testing for varying materials (ie Stainless steel alloy AISI 316L
Stainless steel alloy AISI 304 Low carbon steel ST 37 CuNi 90-10 and Rubber)
Determination of the resistance of intact and damaged coatings (which were applied
according to the standard specifications) to the effects of treated water and untreated
water and evaluation of the adhesion of coatings and the degree of blistering
Measurements of the electrochemical impedance spectroscopy of coatings
The medium in which the tests were performed was filtrated (50microm) natural seawater of
North Sea origin All tests were conducted in two separate media to enable the comparison of
corrosivity between treated and untreated seawater Both testing media (treated and
untreated sea water) were refreshed each working day The duration of the test was six
months
Figure 3 Corrosion on AISI 316 (top) and AISI 304L (bottom) materials in
untreated seawater (left) and treated seawater from the ERMA FIRST BWTS (right)
after 90 days
63
ERMA FIRST BWTS AN INTEGRATED AND MODULAR BALLAST WATER TREATMENT SYSTEM
Figure 4 Intact coated panels in untreated water for 90 days (left) and intact coated steel panels in treated water for 90 days (right)
Figure 5 Scratched coated panels in untreated water for 90 days (left) and scratched coated steel panels in treated water for 90 days (right)
For treated and untreated seawater electrochemical impedance spectroscopy measurements
were performed in two-fold after 0 1 7 and 21 days and 1 2 3 4 5 and 6 months of
immersion
64
TSOLAKI STAMPEDAKIS MOULINOS AND KYRITSIS
Figure 6 Development of coating resistance in treated seawater after 1 day 30
days 60 days and 90 days
Figure 7 Development of coating resistance in untreated seawater after 1 day 30
days 60 days and 90 days
The measurements taken after 90 days of immersion show that the value of coating
resistance is approximately 108 ohmcm2 Both treated and untreated seawater panels have
similar coating resistance This indicates that the protective properties of the
65
ERMA FIRST BWTS AN INTEGRATED AND MODULAR BALLAST WATER TREATMENT SYSTEM
coating in treated and untreated seawater meets the resistance commonly found in practice
for good protective coatings with this layer thickness
5 Discussion
The ERMA FIRST BWTS is an integrated autonomous and modular treatment system for
ballast water treatment The benefits offered from the pre-filtering and the cyclonic separation
towards the removal of coarse inorganic and organic material present in ballast water relate
to a lower disinfectant concentration demand which in turn results in less energy
consumption and less consumption of electrode coatings
The Land-Based Tests performed in the challenging Wadden Sea in NIOZ Texel The
Netherlands and the Shipboard Tests on board MV COSCO GUANGZHOU (IMO No
9305570) a 9600 TEU container vessel presented excellent results reaching discharge
limits far below the IMO D-2 revealing a prospective and promising performance even for the
stricter United States Certification requirements
Ecotoxicity testing demonstrated that the discharge of neutralized treated ballast water was
not toxic as no toxic effects were observed to the organisms exposed during the testing The
testing further confirmed the necessity of the neutralization of treated ballast water
Corrosion testing was performed according to GESAMP recommendations for corrosivity
testing (MEPC 59216 Report of the 8th GESAMP meeting group) With regard to the
evaluation of coatings the visual examination of all panels after 3 months of exposure
showed comparable results in treated and untreated water Specifically no deposits were
present on the coatings no degradation of coatings were observed and no blistering was
present while the damaged panels showed corrosion in a similar manner as in the untreated
scenario Corrosion rates of specimens will be available after the finalization of the report by
the TNO and will be available for the Type Approval procedure
Enforced by the above unique features ERMA FIRST is promptly coming one significant step
closer to the Final Approval and Type Approval process Lloyds Register Classification
Society who are further supervising shipboard Tests are currently performing the technical
appraisal of ERMA FIRST and will be in a position to officially issue the Type Approval on
behalf of Hellenic Flag in March 2012
REFERENCES
Metcalf and Eddy (2003) ISBN McGraw-Hill ScienceEngineeringMath 4th Edition
66
TSOLAKI STAMPEDAKIS MOULINOS AND KYRITSIS
MEPC 61211 Application for Basic Approval of the ERMA FIRST Ballast Water Management System
NIOZ (2011) Final Report of the Land based testing of ERMA FIRST Ballast Water treatment system
for type approval according to Regulation-D2 and the relevant IMO Guidelines
Report of Global expert workshop on harmonization of methodologies for test facilities of ballast water
management systems (24-25 January 2010) World Maritime University Malmouml Sweden
IMARES Report C09310 Toxicity test with ballast water from ERMA FIRST SA BWMS land based
tests August 2010
TNO (2011) Report Evaluation of the corrosivity of the ERMA FIRST BWTS according to GESAMP
Recommendations
67
BALLAST WATER MANAGEMENT SYSTEMS
Lab-Scale Chlorine Generation
Ceren Bilgin Guumlney1 Fatma Youmlnsel
Abstract
Chlorine disinfection is one of the most commonly considered techniques for ballast water treatment
The main areas of concern with respect to using chlorine disinfection for ballast water organisms are
the safety risk during handling and onboard storage of chlorine gas or HOCl solutions Electrochemical
generation of active chlorine onboard is a good alternative to eliminate these unfavorable features of
chlorine disinfection
A new hybrid ballast water treatment system has been developed within the project ldquoBaWaPla ndash
Sustainable Ballast Water Management Plantrdquo funded by the European Union under contract number
031529 This self-controlled system consists of filter systems UV and electrochemical technologies
The electrochemical component of BaWaPla produces active substances onboard through electrolysis
of seawater and eliminates the need to carry or store hazardous and corrosive chemicals
This study covers some of the laboratory-scale experiments conducted by Istanbul Technical
University for the best and optimal electrochemical cell design Five different electrochemical cells
were assessed for the BaWaPla system The cells were supplied from FumaTech GmbH Germany A
laboratory system was provided to Istanbul Technical University by the project partner LVPG GmbH
Germany This system was used for testing assumptions and proposals for the best and optimal cell
design The final cell design for the BaWaPla Pilot System was tested at Blyth England during the
period from July to September 2009
Keywords Ballast water treatment chlorine generation electrochemical cells
Nomenclature
A Amperage
ASW Substrate prepared with tap water
DI Substrate prepared with deionized water
mgL milligrams per liter
Sal Salinity
SW Substrate prepared with seawater
1 Introduction
Ballast water treatment has been widely studied throughout the last decade The studies have
focused on different technologies (Tsolaki and Diamadopoulos 2009 Abu-Khader et al
1 Istanbul Technical University Faculty of Naval Architecture and Ocean Engineering Department of Naval
Architecture and Marine Engineering
68
GUumlNEY AND YOumlNSEL
2011) Both chlorine disinfection and electrochemical systems are among those considered
techniques for ballast water treatment
Chlorine is a well known and widely used disinfectant around the world [Sawyer et al 1994
Hammer and Hammer Jr 2004] and it has also been proven to be effective for disinfection
of many ballast water organisms at different concentrations [Stocks 2004 Zhang et al
2004 Derek et al 2006] The main areas of concern with respect to the use of chlorine
disinfection for ballast water organisms is the safety risk during handling and onboard storage
of chlorine gas or HOCl solutions
On the other hand there are number of studies for using electrochemical systems for ballast
water treatment Some of these studies are focused on the direct electrolytic disinfection of
ballast water [Dang et al 2004 Kim et al 2006 Tsolaki et al 2010)] while others aim to
produce disinfectant to be used for treatment [Aliotta et al 2003 Lefler et al 2004
Matousek et al 2006]
In-situ electrochemical generation of chlorine onboard would have many advantages such as
eliminating storage and handling of chlorine gas or HOCl solutions [Kraft et al 1999
Jonnalagadda and Nadupalli 2004 Kerwick et al 2005] This technique depends on the
electrolysis of sodium chloride which is readily found in seawater
In electrochemical systems resultant disinfectant fluid can be affected by the design of the
electrochemical cell and the selection of material used to produce the permeable membrane
that separates the fluid paths as well as the electrical current applied to the electrodes The
choice of the materials used for coating the relevant electrodes must also be considered
This work has been conducted within the project ldquoBaWaPla ndash Sustainable Ballast Water
Management Plantrdquo funded by the European Union under the contract number 031529
which began 15 November 2006 and was finalized 15 May 2010 A new hybrid ballast water
treatment system was developed during the project This self-controlled system consists of
filter systems UV and electrochemical technologies The electrochemical component of
BaWaPla produces active substances onboard through electrolysis of seawater and
eliminates the requirement to carry or store hazardous and corrosive chemicals The portion
of the work presented herein covers some of the laboratory-scale experiments conducted by
Istanbul Technical University for the best and optimal electrochemical cell design In this
study five different electrochemical cells are assessed for the BaWaPla system The cells are
supplied from FumaTech GmbH Germany The variable parameters of the cell design are the
geometry and dimensions of the electrodes and the materials used for the electrodes and
their coatings
69
LAB-SCALE CHLORINE GENERATION
11 BACKGROUND
The electrolysis of sodium chloride is also referred as the chlor-alkali process As a result of
this process chlorine sodium hydroxide and hydrogen are formed simultaneously [Rajeshwar
and Ibanez 1996 Srinivasan 2006]
222 22 ClHNaOHOHNaCl ergyElectricEn (1)
Within the chlor-alkali process brine passes through the first chamber of the electrochemical
cell and the chloride ion (Cl-) is oxidized at the anode as
oeClCl 22 2 (2)
In the membrane cell the anode and cathode are separated by an ion-permeable membrane
in the center of the cell and this membrane allows only the liberated sodium ions (Na+) to
pass through to the second chamber The unreacted sodium chloride (NaCl) and other ions
cannot pass through the membrane
At the cathode hydrogen in water is reduced to hydrogen gas releasing hydroxide ions into
the solution (eq3) Simultaneously the chlorine gas that is formed by oxidation of Cl- reacts
with water in the first chamber Hypochlorous acid (HOCl) and hydrochloric acid are formed
(eq4) [Abdul-Wahab and Al-Wesbahi 2009]
OHHeOH o 222 22 (3)
HClHOClOHCl 22
(4)
On the other hand protolysis of HOCl yields to hypochlorite ion (OCl-) depending upon pH
and temperature
OClOHOHHOCl 32 (5)
83 1052][
]][[
HOCl
OClOHKa
at 20ordmC (6)
1
100
3
OH
KHOCl
a
(7)
70
GUumlNEY AND YOumlNSEL
pHOH 10][ 3
(8)
The product in the first compartment such as elemental chlorine (Cl2) hypochlorous acid
(HOCl) and hypochlorite ion constitute ldquofree available chlorinerdquo which is the first concept of
chlorine disinfection If there is ammonia in water chlorine reacts with ammonia and forms
chloramines (Hammer M J and Hammer MJJr 2004 Vijayaraghavan K et al 2004
Walter Jand Weber J R 1972) The chloramines are referred as ldquocombined available
chlorinerdquo which is the second concept of chlorine disinfection And finally the sum of free
available and combined available chlorine constitutes the ldquototal available chlorinerdquo in the
chlorine disinfection process
The disinfection effect of the combined available chlorine is dramatically less than the free
available chlorine For the disinfection of cysts of E hisytolica dichloramines (NHCl2) were
found to be 60 as efficient as HOCl and monochloramines (NH2Cl) were found to be 22
as efficient as HOCl under comparable conditions (Walter Jand Weber J R 1972)
Considering the contact time for a bactericidal effect 100 times more contact time is needed
for combined available chlorine compared to the same amount of free available chlorine
(Oğur et al 2004)
2 MATERIALS AND METHODS
21 EXPERIMENTAL DESIGN AND TEST SYSTEM
Figure 1 Test System
71
LAB-SCALE CHLORINE GENERATION
A laboratory system was provided to Istanbul Technical University by one of the Project
partners LVPG GmbH Germany This system was used for various test assumptions and
proposals for the best and optimal cell design Employing electrolysis techniques to produce
disinfectants saline waterseawater is introduced into an electrochemical cell in the heart of
the test system Electrochemical reaction within the cell results in the production of highly
effective ldquoHypochlorous acid-richrdquo disinfectant The disinfectant produced with the regular
current direction is called AnoFluid whereas the disinfectant produced with the reverse
current direction is called CathoFluid
22 Electrochemical Cells
In this study five different electrochemical cells are assessed for the BaWaPla system The
cells are been supplied from FumaTech GmbH Germany The cells are referred as ldquostandard
cell FTEC 100 FTEC 500 EC 100 Nr 201 EC 100 Nr 240rdquoThe variable parameters of the
cell design are the geometry and dimensions of the electrodes and the materials used for the
electrodes and their coatings1 (Table 1)
Table 1 Electrochemical cell specifications
1 The cells are supplied from FumaTech GmbH The Constructional and The technical details about the cells
depend on the personal communications correspondences and unpublished documents during the BaWaPla Project
Standard FTEC 100 FTEC 500 EC 100Nr 201
EC 100Nr
240
Dim
en
sio
n Anode 88x42 mm 88x42 mm 175x175mm 88x42 mm 88x42 mm
Cathode 88x42 mm 88x42 mm 175x175mm 88x42 mm 88x42 mm
Ge
om
ety
Anode Expanded grid Compact
planar
Compact
planar
Special Special
Cathode Expanded grid Expanded
grid
Expanded
grid
Special Special
Mat
eri
al
Anode Mixed metal
oxide
Mixed
metal
oxide
Mixed metal
oxide
Special coating
with a polarity
reversal finish
Special
coating with
a polarity
reversal
finish
Cathode Stainless Steel Stainless
Steel
Stainless
Steel
Special coating Special
coating
Membrane Fabric reinforced perfluorinated cation exchange membrane as separator
between catholyte and anolyte compartment
72
GUumlNEY AND YOumlNSEL
23 Water for the Experiments
For the experiments different types of substrates were used as outlined below
DI To produce disinfectant for the preliminary experiments with the Standard Cell deionised
water and saturated saline solution were used
ASW To avoid any uncontrolled effects of natural seawater artificial seawater prepared with
tap water and salt was used as test media for the preliminary investigations of cell types
FTEC 100 FTEC 500 EC 100 Nr201 and EC 100 Nr240
SW Further experiments were carried out with seawater collected from the Bosphorus at
Yenikoumly (Spermil~18)
24 Measured Parameters and Instruments
Total chlorine and free available chlorine were the main parameters investigated with respect
to the effectiveness of disinfectants They were measured by a Hach DR 2000
Spectrophotometer using the DPD method Redox potential pH temperature salinity and
conductivity were also measured as control parameters The equipment used for the
laboratory measurements are given within Table 2
Table 2 Parameters and instruments
Parameter Instrument
Redox Potential Hach Sension1 pH mV Meter
pH WTW 720 InoLabseries - pH Meter
Temperature WTW 720 InoLabseries - pH Meter
Salinity WTW LF 196 ndashMicroprocessor Conductivity Meter
Conductivity WTW LF 196 ndashMicroprocessor Conductivity Meter
Chlorine (Total and Free Available) Hach DR 2000- DPD method
3 Results and Discussions
The experimental procedures varied for each electrochemical cell based on the different
design parameters of the cells and the phase reached with the previous cell
Standard cell experiments were carried out with three different substrate salinities (9permil 20permil
35permil) under three different current stresses (8A 12A 16A) AnoFluid was produced with a
flow rate of 100 Lh and the samples were taken at the 10th minute of production
The results show that the effectiveness of AnoFluid increases with salinity and current as
expected due to principles of the electrochemical cells (Khelifa et al 2004) However it
should be noted that the change is not linear with the control parameters (Figure 2) The
results obtained with similar salinities reveal the irregularity of chlorine content change with
the current
73
LAB-SCALE CHLORINE GENERATION
Figure 2 Effect of salinity and current
On the other hand the temperature of the produced AnoFluid changed between 225-23ordmC
while pH values were distributed between 30 and 35 The calculations reveal that more than
9999 of free available chlorine is in the form of hypochlorous acid (HOCl)
Several sets of tests are carried out to develop specifications for regular operation with FTEC
100 The system was found to be stable at currents above 10 A and salinity above 10permil
(Figure 3) Therefore basically two different salinities (20permil 30permil) were tested with two
different currents (10 A and 16 A) under three different AnoFluid production rates (50 Lh
60Lh 75Lh) Artificial seawater was used as substrate AnoFluid production lasted 120
minutes and the values given in Figure 4 were derived from the samples taken at the end of
the production
Figure 3 Operation tests with FTEC 100 (Youmlnsel and Bilgin Guumlney 2010)
y = 1766ln(x) + 18226 Rsup2 = 08567
y = 58829ln(x) - 47376 Rsup2 = 09969
y = 57055e00556x Rsup2 = 09372
0
50
100
150
200
0 4 8 12 16 20 24 28
Chlo
rine
Tota
l [m
gL
]
Current [A]
Sal 9permil
Sal 20permil
Sal 35permil
0
2
4
6
8
10
12
0 30 60 90 120 150
Curr
ent [A
]
Duration [min]
Salinity 10permil Salinity 20permil
74
GUumlNEY AND YOumlNSEL
The results of FTEC 100 confirm the results of standard cell as the chlorine content rises with
current and salinity However these experiments also show the importance of the production
rate the higher chlorine contents were obtained with lower AnoFluid flow rates (Figure 4)
Figure 4 Effect of flow rate
Experiments with FTEC 500 were carried out under a 100 Lh flowrate with four different
maximum current settings (30A 40A 50A 60A) AnoFluid production lasted 10 minutes to
avoid heat excess on the cell Both artificial seawater (Sal 20permil) and natural seawater (Sal
~18permil) were used as substrates The numbers in the legends of related figures refer to the
number of experiment with the relevant substrate
Figure 5 Effect of substrate on current
0
50
100
150
200
250
300
50 55 60 65 70 75
Chlo
rine
Tota
l [m
gL
]
Flow rate [Lsa]
Sal20permil Current 10A Sal20permil Current 16A Sal30permil Current 10A
0
10
20
30
40
50
60
70
10 20 30 40 50 60 70
Obta
ined C
urr
ent
[A]
Maximum Setting [A]
SW1 SW2 ASW1 ASW2
75
LAB-SCALE CHLORINE GENERATION
The results underline that the properties of the substrate that go under the electrochemical
process have direct effect on the AnoFluid content Figure 5 shows the obtained current
values versus maximum current settings with each substrate The currents with natural
seawater generally lie below 30A even when the maximum setting reaches to 60 A whereas
with artificial seawater obtained and set values coincide This fact is also reflected in the
chlorine contents (Figure 6 and 7)
Figure 6 Effect of substrate on total chlorine
Figure 7 Effect of substrate on free available chlorine
Total and free available chlorine contents rise with rising currents with artificial seawater
However chlorine contents form groups around certain values as the currents cannot go
beyond 30A with natural seawater The maximum chlorine content of the AnoFluid produced
0
100
200
300
400
500
600
700
10 30 50 70
Chlo
rine
Tota
l [m
gL]
Current [A]
SW 1
SW 2
ASW 1
ASW 2
0
50
100
150
200
250
300
350
400
450
500
10 30 50 70
Chlo
rine
Fre
e [m
gL]
Current [A]
SW 1
SW 2
ASW 1
76
GUumlNEY AND YOumlNSEL
with natural seawater stays below the minimum chlorine content of the AnoFluid produced
with artificial seawater (Total chlorine332 mgL Free available chlorine 212 mgL)
Seawater contains a wide range of salts at various concentrations and combinations (Riley amp
Skirrow 1976) Our formerly published studies have shown that the chlorine figures decrease
as the Ca2+ and Mg2+ concentrations of the substrate increase to the typical seawater levels
and the accumulation of these ions on electrodes and membranes leads to a dramatic loss in
the AnoFluid quality over time (Bilgin Guney and Yonsel 2009) Additionally coastal
seawater may also contain high levels of ammonia (Yonsel et al 2000) and the ammonia
content of the intake ballast water has a direct effect on the seawater generated disinfectant
As the active chlorine produced at the electrode reacts rapidly with ammonia in the reaction
zone chloramines are formed The formation of chloramines causes a decrease in both total
and free available chlorine concentrations of the electrochemically produced disinfectant
(Bilgin Guumlney and Youmlnsel 2011) The difference between total and free available chlorine
contents of the produced AnoFluid indicates the presence of ammonia in the used seawater
The results of the tests show the need for the cells to have the ability to work with reverse
polarity onboard This necessity leads to new cell designs and consequently EC 100 Nr 201
and EC 100 Nr 240 were supplied from FumaTech GmbH The new electrode types were
designed to be seawater resistant which means resistant against typical seawater salt
contents The cells have electrodes equipped with polarity reversal finish which has an
additional protective layer between the coating metal and glossier electrode surface This
protective layer allows for reverse current direction such that self-cleaning of the cell can be
maintained simultaneously with the production of disinfectant The disinfectant produced in
this manner is referred to as CathoFluid to distinguish it from the disinfectant produced with
the regular current direction
The disinfectant production with EC 100 Nr 201 and EC 100 Nr 240 lasted 90 minutes for
each direction The samples of artificial seawater (Sal 20permil) and natural seawater (Sal
~18permil) were used as substrates The values given in Figure 8 and Figure 9 were derived from
the samples taken at the end of the production The numbers in the legends of related figures
refer to the number of the experiment with the relevant substrate
When using artificial seawater EC 100 Nr 240 shows better performance for both AnoFluid
and CathoFluid (Figure 8) The chlorine content of AnoFluid with artificial seawater was
generally greater than 150 mgL and for CathoFluid chlorine content was greater than 50
mgL even exceeding 150 mgL in some cases On the other hand the chlorine figures was
far less (lt50 mgL) when natural seawater was used as the substrate
77
LAB-SCALE CHLORINE GENERATION
Figure 8 Disinfectant produced with EC 100 Nr240
Figure 9 Disinfectant produced with EC 100 Nr201
EC 100 Nr 201 had much better performance when producing AnoFluid with natural
seawater (Figure 9) The chlorine content of AnoFluid was greater than 100 mgL throughout
the production But this cell did not have the same performance for CathoFluid The chlorine
content of CathoFluid was below 16 mgL in all cases
4 Conclusions
The overall results show that the best chlorine figures were achieved with FTEC 500 under
comparable conditions Considering the only exception between FTEC 100 and FTEC 500
was the electrode dimensions enlargement of other cells would also lead to this
consequence The best chlorine figures for AnoFluid with natural seawater were achieved
with EC 100 Nr 201 even though chlorine figures were far less for CathoFluid independent of
0
50
100
150
200
0 15 30 45 60 75 90 Chlo
rine
Tota
l [m
gL
]
Duration [min]
Anofluid ASW1
Anofluid SW1
Anofluid SW2
0
20
40
60
80
100
120
140
0 15 30 45 60 75 90
Chlo
rine
Tota
l [m
gL
]
Duration [min]
An fluid ASW1 Anofluid ASW2 Anofluid SW1
Anofluid SW2
Cathofluid ASW1 Cathofluid ASW2
78
GUumlNEY AND YOumlNSEL
dimensions Since the main objective is producing the best disinfectant using natural
seawater EC 100 Nr 201 is considered the best cell among the five in terms of cell design
Taking into consideration these laboratory results FumaTech GmbH optimised new cells for
BaWaPla These cells have the electrode dimensions like those of FTEC 500 and the
material used for electrodes and their coatings are similar to EC 100 Nr 201 The cells have
a capacity of 500 Lh disinfectant production and they have the ability to be operated with
reverse polarity such that a self-cleaning process can take place simultaneously with
disinfectant production Such cells will present substantial advantages considering the
operations onboard Six of these cells were employed within the land-based pilot BaWaPla
system at Blyth-England during the period from July to September 2009 (Figure 10) Under
optimal operation conditions the electrochemical module of the BaWaPla system had the
capability to provide 3-35mgL of active chlorine to the test tank which was capable of
disinfecting the organisms to IMO levels under operational conditions (ie seawater
properties organism load) (Carney et al 2009)
Figure 10 BaWaPla Pilot System Blyth-England (2009)
79
LAB-SCALE CHLORINE GENERATION
Acknowledgments
Authors thank all of the partners of ldquoBaWaPla ndash Sustainable Ballast Water Management
Plantrdquo Project funded by the European Union under contract number 031529 for their
support particularly Mr Michael Laverty and Mr Frank Voigtlaender from LVPG International
for providing the electrolyzing generator
REFERENCES
Abdul-Wahab SA and MA Al-Wesbahi (2009) Brine Management Substituting Chlorine with On-Site
produced sodium hypochlorite for Emvironmentally Improved Desalination Processes Water Resouce
Management 23 2437-2454
Abu-Khader MM Badran O and M Attarakihet (2011) Ballast water treatment technologies
hydrocyclonic a viable option Clean Techn Environ Policy (2011) 13403ndash413
Aliotta J Rogerson A Campbell CB and M Yonge (2003) Ballast water treatment by electro-
ionization In Raaymakers S (Ed) 2003 1st International Ballast Water Treatment RampD Symposium
IMO London 26ndash27 March 2001 Symposium Proceedings GloBallast Monograph Series No5 IMO
London p 61-69
Bilgin Guumlney C and F Yonsel (2009) Onboard electrochemically generation of disinfectant for ballast
water treatment 13th Congress of Intl Maritime Assoc of Mediterranean IMAM 2009 İstanbul 12-15
Ekim 2009
Bilgin Guumlney C and F Yonsel (2011) Effects of ammonia on electrochemical chlorine generation for
ballast water treatment Proceedings International Conference on Ocean Offshore and Arctic
Engineering OMAE 2011 June 19-24 Rotterdam
Carney KJ Delany J Mesbahi E Pazouki K Rajarajan N and K Emami (2009) Biological
technical and operational assessment and recommendations for systemrsquos operational optimisation
BaWaPla Deliverable 53 Draft
Dang K Yin P Sun P Xiao J and Y Song (2004) Application study of ballast water treatment bt
electrolyzing seawater In Matheickal JT Raaymakers S (Eds) 2004 2nd International Ballast
Water Treatment RampD Symposium IMO London 21ndash23 July 2003 Symposium Proceedings
GloBallast Monograph Series No15 IMO London p 103-110
Derek KG Duggan IC and HJ MacIsaac (2006) Can sodium hypochlorite reduce the risk of
species introductions from diapausing invertebrate eggs in non-ballast ships Marine Pollution
Bulletin 52 689-695
Hammer MJ MJ Hammer Jr (2004) Water and Wastewater Technology Fifth Edition Prentice-
Hall Inc 2004 New Jersey ABD
80
GUumlNEY AND YOumlNSEL Jonnalagadda SB and S Nadupalli (2004) Effluent tretment using electrochemically bleached seawater-oxidative degradation of pollutants Talanta 64 18-22 Yonsel F et al (2000) İstinye deresinin İstanbul Boğazırsquona taşıdığı kirlilik IV Ulusal Kimya
Muumlhendiliği Kongresi 4-7 Eyluumll Istanbul
Kerwick MI Reddy SM Chamberlain AHL and DM Holt (2005) Electrochemical disinfection an
environmentally acceptable method of drinking water disinfection Electrochimica Acta 50 5270-5277
Khelifa A Moulay S Hannane F Benslimene S and M Hecini (2004) Application of experimental
design method to study the performance of electrochlorination cells Desalination 160 91-98
Kim E Shin K Kang JH Pak D Lee KP Lee IS and K Rhie (2006) Consideration on the
environmental acceptability and biological effectiveness of the electrochemical disinfection system for
balast water management Oceans 2006- Asia Pacific Conference Singapore 16-19 May
Kraft A Stadelmann M Blaschke M Kreysig D Sandt B Schroumlder and F Rennau J (1999a)
Electrochemical water disinfection Part 1 Hypochlorite production from very dilute chloride solutions
Journal of Applied Electrochemistry 29 861-868
Leffler C E Rogerson A Paul W Germaine G Elliot M Antonelli V Grubs S Campbell C Beall G and A Salamone (2004) Electro-sanitization of ballast water In Matheickal JT Raaymakers S (Eds) 2004 2nd International Ballast Water Treatment RampD Symposium IMO London 21ndash23 July 2003 Symposium Proceedings GloBallast Monograph Series No15 IMO London p 111-120 Matousek R C Hill DW Herwig RP Cordell JR Nielsen BC Ferm NC Lawrence DC and
JC Perrins (2006) Electrolytic sodium hypochlorite system for treatment of ballast water Journal of
Ship Production 22 No3 160-171
Oğur R Tekbaş OumlF and M Hasde (2004) Klorlama Rehberi (İccedilme ve Kullanma Sularının
Klorlanması) Guumllhane Askeri Tıp Akademisi Halk Sağlığı Anabilim Dalı Ankara
Rajeshwar K and JG Ibanez (1997) Environmental Electrochemistry Fundamentals and Applications
in Pollution Abatement Academic Press California
Sawyer C N McCarty PL Parkin and GF (1994) Chemistry for Environmental Engineering
Fourth edition McGraw-Hill series in water resources and environmental engineering New York
Srinivasan S (2006) Fuel Cells From Fundamental to applications Springer Science+Business
Media New York ABD
Stocks D T OrsquoReilly M and W McCracken (2004a) Treatment of ballast water in the NOBOB ship
using heat In Matheickal JT Raaymakers S (Eds) 2004 2nd International Ballast Water
81
LAB-SCALE CHLORINE GENERATION Treatment RampD Symposium IMO London 21ndash23 July 2003 Symposium Proceedings GloBallast
Monograph Series No15 IMO London p 80-87
Tsolaki E and E Diamadopoulos (2009) Technologies for ballast water treatment A review J Chem
Technol Biotechnol 2010 85 19ndash32
Tsolaki E Pitta P and E Diamadopoulos (2010) Electrochemical disinfection of simulated balast
water using Artemi salina as indicator Journal of Chemical Engineering 156 305-312
Vijayaraghavan K Ramanujam TK and N Balasubramanian (1999) In situ hypochlorous acid
generation for the treatment of syntan wastewater Waste Management 19319-323
Weber Jr JW 1972 Physichochemical Process for Water Quality Control Wiley-Interscience Series
of Texts and Monographs
Youmlnsel F Bilgin C and C Guumllşen (2000) İstinye Deresinin İstanbul Boğazına Taşıdığı Kirlilik
UKMK-IV Bildiri Kitabı 2 Cilt S 769-774 4-7 Eyluumll 2000 İstanbul Uumlniversitesi Avcılar-İstanbul ISBN
975-404-615-8
Youmlnsel F and C Bilgin Guumlney (2010) Electrochemical chlorine generation applications for ballast
water treatment International Conference on ship design and operation for environmental
Sustainability 10 - 11 March 2010 RINA Hq London UK Bildiriler kitabı sayfa 95-103 ISBN 978-1-
905040-69-8
Zhang S Yang CD Gong W Wang Q Xiao J Zhang H and Q Wang (2004) Effects of the
chlorination treatment for ballast water In Matheickal JT Raaymakers S (Eds) 2004 2nd
International Ballast Water
Treatment RampD Symposium IMO London 21ndash23 July 2003 Symposium Proceedings GloBallast
Monograph Series No15 IMO London p 148-157
83
BALLAST WATER MANAGEMENT SYSTEMS
A Ballast Discharge Monitoring System for Great Lakes Relevant Ships A Method for Researchers
Ship Owners and Agency Officials
Allegra Cangelosi1 Tyler Schwerdt Travis Mangan Nicole Mays Kelsey Prihoda
Abstract
The Great Ships Initiative (GSI) is a collaborative project led by the Northeast-Midwest Institute
devoted to ending the problem of ship-mediated invasive species in the Great Lakes-St Lawrence
Seaway System and globally In support of that goal GSI has established superlative freshwater
ballast treatment evaluation capabilities at three scalesmdashbench land-based and onboard ship GSI
testing takes place at the scale appropriate to the treatmentrsquos state of development The goal is to help
meritorious BWTSs progress as rapidly as possible toward an approval-ready and market-ready
condition through supplying rigorous status testing or certification testing of biological efficacy
GSI developed and tested onboard five ships a ship discharge monitoring method to share with
regulatory authorities ship owners and researchers The method details an approach for collecting and
analyzing representative samples of living organisms in ballast discharge from Great Lakes-relevant
ships Specifically the method describes a feasible practicable and cost-efficient approach for
retrieving quantitative samples from ships to determine live organism densities in three size classes of
organisms (equal to or greater than 50 micrometers in minimum dimension less than 50 micrometers
and equal to or greater than 10 micrometers in minimum dimension and less than 10 micrometers in
minimum dimension) water quality parameters and whole effluent toxicity tests
GSI designed the ship discharge monitoring method for planned ship discharge monitoring exercises
(the method would not be suitable to surprise spot checks) As such the method is highly applicable to
a wide range of quantitative ballast treatment performance research and validation including type
approval testing and planned treatment performance monitoring events post approval Any application
of the method to regulatory purposes however would require close review and revisions of method
specifics per specific regulatory guidelines
Key Words Great Ships Initiative Great Lakes Ballast Water Ballast Discharge Ship Discharge
Monitoring Shipboard Tests Ballast Water Treatment Systems Ballast Water Samples
Introduction
The objective of this paper is to document a Great Ships Initiative (GSI) ship discharge
monitoring method which GSI developed to prepare regulatory authorities ship owners and
1 Northeast-Midwest Institute
84
CANGELOSI SCHWERDT MANGAN MAYS AND PRIHODA
researchers for collecting and analyzing representative samples of living organisms in ballast
discharge from Great Lakes-relevant ships Specifically the GSI method allows monitoring
entities to retrieve quantitative samples from ships to determine live organism densities in
three size classes of organisms (equal to or greater than 50 micrometers in minimum
dimension less than 50 micrometers and equal to or greater than 10 micrometers in minimum
dimension and less than 10 micrometers in minimum dimension) water quality parameters
and whole effluent toxicity tests Methods associated with sample analysis were not part of
the scope of the project GSI has already developed Standard Operating Procedures for
these analyses which can be downloaded from GSIrsquos website (wwwgreatshipsinitiativeorg)
It is important to note that the method described here is preliminary and subject to revision
over time GSI will periodically update the method and repost new versions on its website
GSI designed the ship discharge monitoring method reported here for planned ship discharge
monitoring exercises (the method would not be suitable to surprise spot checks) As such the
method detailed in this paper is highly applicable to a wide range of quantitative ballast
treatment performance research and validation including type approval testing and planned
treatment performance monitoring events post approval Any application of the method to
regulatory purposes however would require close review and revisions of method specifics
per particular regulatory guidelines
This paper
Presents an overview of the GSI ship discharge sampling approach
Describes details of the sample and return port installations necessary for this
sampling approach to be used on Great Lakes-relevant ships
Details the set-up and break-down processes for implementing this approach for a
sampling event and
Provides a discussion of the feasibility of the methods including their strengths and
weaknesses based on GSI trials in the field
Background on the Great Ships Initiative (GSI)
GSI is a collaborative project led by the Northeast-Midwest Institute (NEMWI) devoted to
ending the problem of ship-mediated invasive species in the Great Lakes-St Lawrence
Seaway System and globally NEMWI is a Washington DC-based non-profit and non-
partisan research organization dedicated to the economic vitality environmental quality and
regional equity of Northeast and Midwest states In support of that goal NEMWI has
established through GSI a superlative freshwater ballast treatment evaluation capabilities at
three scalesmdashbench land-based and onboard ship GSI research is carried out
85
A BALLAST DISCHARGE MONITORING SYSTEM
collaboratively with contracting entities including the University of Wisconsin-Superior (UW-
S) AMI Consulting Engineers Broadreach Services and the University of Minnesota-Duluth
(UM-D)
GSI testing takes place at the scale appropriate to the treatmentrsquos state of development The
goal is to help meritorious BWTSs progress as rapidly as possible toward an approval-ready
and market-ready condition through supplying rigorous status testing or certification testing of
biological efficacy To assure relevancy of test output GSI test protocols generally are as
consistent with the International Maritime Organization (IMO) Convention for the Control and
Management of Ships Ballast Water and Sediments Convention (IMO 2004) and federal and
state requirements as practicable For example United States Environmental Protection
Agency (USEPA) Environmental Technology Verification (ETV) Program testing is performed
consistent with ETV protocols (eg NSF International 2010)
A GSI Advisory Committee is comprised of top-level officials of key stakeholder groups and
provides direct input on GSI award decisions program direction finances and fund-raising
The GSI Advisory Committee which meets three times a year includes elected leadership
environmental organizations port directors and federal officials from the United States and
Canada and industry representatives
GSIrsquos Quality Management Plan (GSI 2011) outlines the activities that GSI uses to ensure
that personnel have the necessary education qualifications and experience needed to
effectively carry out their specific roles and responsibilities within the project
Background on GSI Ship Discharge Monitoring Project
GSI received funding from the Legislative Citizenrsquos Commission on Minnesota Resources
(LCCMR) the Maritime Administration and the Great Lakes Protection Fund to design install
and test a ship-based ballast discharge sampling approach on the range of commercial cargo
ships which ply the Great Lakes The primary goal of this GSI project was to inform ship
owners researchers and regulators about effective and efficient methods for carrying out
ballast discharge monitoring on Great Lakes ships A secondary goal was to initiate the
installation of effective sampling ports on Great Lakes-relevant ships for BWTS testing and
monitoring
GSI developed a proposed sampling approach which included permanent sample port flange
installation guidelines consistent with those of the IMO (IMO 2004) and the USEPA ETV
Program (NSF International 2010) portable sampling system equipment and methods for
shipboard use and portable sample analysis equipment and methods for port-side use
86
CANGELOSI SCHWERDT MANGAN MAYS AND PRIHODA
GSI personnel visited a range of ships to identify optimal locations for sample port flanges
given a set of the project criteria (see Methods) Sample locations that had the potential to
meet most or all of these criteria were identified and photographed during the ship visit and
later modeled using computational fluid dynamics (CFD) to determine which location would
deliver the most representative sample
GSI in consultation with the ship owner then selected the best location based on the
inspection information and the ships were then outfitted with sample flanges GSI visited the
ships to trial and review the GSI sampling approach in real-world applications This paper
provides the method and lessons learned from this project activity The sample ports will stay
in place for possible future use in research and compliance monitoring Data gathered on
living organisms in ballast discharge sampled through this project will be provided to the State
of Minnesota and published on GSIrsquos website (wwwgreatshipsinitiativeorg)
Sampling Approach Overview
GSI designed the sampling approach described here to be applicable to a range of test
applications It employs simultaneous in-line and continuous collection of large and small
quantities of sample water from subject ballast water discharge to estimate live organism
densities and types in and water quality characteristics of that discharge The method is
adaptable to a wide range of sampling intensities and ships with diverse ballast line diameters
and ballast system types
It is important to note that hardware and personnel alone will not deliver useful sampling
exercises The sampling team must also have a robust and valid test plan and standard
operating procedures (SOPs) to accompany any ship sampling exercise The test plan will
describe the objectives of the test the hypotheses the experimental design the analytical
methods and quality control and quality assurance (QAQC) procedures for the work The
SOPs will detail specific methods The GSI website (wwwgreatshipsinitiativeorg) includes
test reports on ship-based ballast treatment research providing examples of these
documents
Details of the sampling approach are provided in subsequent sections Fundamentally the
process involves
Prior installation of two permanent 4-inch diameter blind flanges in a strategically
selected segment of the shiprsquos ballast line (detailed below) and insertion of a
temporary sampling pitot in one such flange
87
A BALLAST DISCHARGE MONITORING SYSTEM
Space and services on the ship to support sample collection (detailed below)
A port-based set-up sampling and ballast team of four people and nearby analytical
space and equipment (detailed below) and
A time window affording 45 minutes to one hour for sampling system set-up and 45
minutes to one hour for its break-down in addition to the selected sampling period
duration
Figure 1 Schematic of the GSI Ship Discharge Sampling System and
Component Parts
Figure 1 illustrates the GSI sampling system lay out In summary the installation of the blind
flangesmdasha relatively minor permanent change to the ship costing less than $5000mdashis
completed according to strict location guidelines well before sampling is to occur At the time
of or just prior to the sampling event an elbow-shaped sampling pitot is installed in the
upstream flange to deliver flow to the sampling system For zooplankton sampling (ie
organisms equal to or greater than 50 micrometers in minimum dimension) sample flow from
88
CANGELOSI SCHWERDT MANGAN MAYS AND PRIHODA
the discharge line is pumped from the sampling pitot at a known flow rate through a plastic
line equipped with a flow meter into a 35 micron plankton net that is suspended in a 50 gallon
tub with a level transmitter and a bottom discharge flange The fraction of the ballast line flow
pumped through the sample port should remain constant throughout the sampling process
This ratio is monitored using an in-line magnetic flux flow meter on the sample line and a
portable ultrasonic flow meter mounted to the ships ballast piping A second pump draws
spent sample water from the 50 gallon tub through plastic line to the return flange in the
ballast line for discharge overboard with other ballast water The water level in the tub is
maintained at near full as the net filters the plankton into a bottom cod-end A small side
stream of the sample water flow (pre-plankton net) is directed into a carboy for whole water
samples which can be used to assess water quality protists (ie organisms less than 50
micrometers and equal to or greater than 10 micrometers in minimum dimension) bacteria
(ie organisms less than 10 micrometers in minimum dimension) and effluent toxicity Grab
samples can be extracted from the line (ie hose) feeding into the nets or through a
dedicated side port off the main sample line which can be opened and closed Sample
analysis can take place on-ship but is easiest to arrange off-ship
METHODOLOGY
Sample PortsReturn Ports
GSI installed sample ports and return ports as 4 ldquo150 ANSI flanges with blinds GSI
employed stainless steel bent elbow style pitots (Figure 2) installed so that the opening faces
into the flow at the center of the pipe
GSI first determined the target sample volume per unit ballast discharge based on
experimental design criteria Then it assured the internal diameter of the pitot opening was
large enough to guarantee that sample water pumped through the pitot was able to provide
the target volume but at a subisokinetic flow velocity that ranges between 44-25 of the
discharge flow velocity of the ship An isokinetic flow rate occurs within a pitot when the
sample water flow velocity is the same as discharge line flow velocity
A subisokinetic velocity means there is a slower flow velocity in the pitot than in the line being
sampled Consistent with recommendations by the United States Coast Guard (USCG) to
maintain a pitot inlet of 15-20 times the isokinetic diameter (USCG 2008) GSI assumes that
subisokinetic flow helps prevent organism damage by edge interactions with pitot inlet and
walls Assuming most ballast systems are designed for a flow rate of around 10 feetsecond
the pitot sizes required to collect a range of volume of sample water per hour are shown in
Table 1
89
A BALLAST DISCHARGE MONITORING SYSTEM
Figure 2 Diagram of Elbow Pitot for Ballast Discharge Sampling
Table 1 Relationship of Sample Pitot Diameter to Sample Water Flow Rate
Sample Pitot Flow Rate at 10 ftsec Ranging From 15 - 20 Times The Isokinetic Diameter
Diameter (in)
34
1
1 14
1 12
2
2 12
3
3 12
4
Flow (GalHr)
3594 - 2022
5 978 ndash 363
10661 - 5997
14687 - 8261
24542 - 13805
35225 - 19814
54897 - 30879
73869 - 41551
95552 - 53748
Flow (M3Hr)
14 - 08
23 - 13
4 - 23
56 - 31
93 - 52
133 - 75
208 - 117
28 - 157
362 - 203
90
CANGELOSI SCHWERDT MANGAN MAYS AND PRIHODA
Step-by-Step Approach to Pitot Diameter Selection
1 Determine Test Plan Sample VolumeRate requirements (eg the test plan requires
60 m3 in 2 hours or 30 m3hr)
2 Assure the pump is capable of that flow rate
3 Consult with the ship engineer to determine ship ballast discharge flow rate (usually
around 10 ftsec but not always)
4 Select a pitot diameter that assures the flow velocity is in the subisokinetic range of
44 - 25 ballast discharge flow rate If they ballast at 10 ftsec Table 1 can be used
(eg For a desired flow rate of 30 m3hr per Table 1 a 125 pitot can be used since
it has a valid range of 40-23 m3hr)
Criteria for Sample Port Location
The location of the sample port is critical to its ability to deliver representative samples of live
organisms in ballast discharge Both fluid dynamic properties of a location physical access
and safety considerations come into play
Table 2 GSI Criteria for Sample Port Location in a Ship Ballast System
Criteria Reason
Single location services all tanks equally
A single sample point means fewer flanges are needed and less sampling effort is required
Long length of straight pipe preceding the sample port
Long lengths of straight pipe create a ldquofully developedrdquo flow characteristic assuring water is well-mixed at the point of sampling and samples are representative of the discharge
Locations as close to overboard as possible
Samples collected closer to discharge will more closely represent the quality of water entering the receiving system
A suitable adjacent area for sample processing suitable for technician occupancy and with accessible light and power supply
A sample port alone wonrsquot deliver a good sample Technicians must be able to work in proximity to it to collect and process samples
Necessary clearances to install the sample pitot
The sample team or ship personnel must be able to install and remove the pitot without damaging other equipment
Piping that can be isolated Piping around the sample location must be isolated so that the sample equipment can be safely installed or removed
No explosion or other hazards Explosive environments require special equipment to assure safety of the ship crew and sampling team
91
A BALLAST DISCHARGE MONITORING SYSTEM
A suitable location for a return flow port is somewhat simpler as the flow mechanics of the
return location are unimportant but locating it a minimum of two pipe diameters downstream
of the sample port assures that it in no way interferes with the sample port fluid dynamics
GSI uses the criteria detailed in Table 2 to guide selection of sample port location
Sample Pitot Locations in Ballast Systems Found on Great Lakes-Relevant Ships
Types
A ballast system comprises the pump sea chests and piping associated with moving ballast
water on and off the ship Most ships have two ballast systems mirrored along the centerline
of the ship one system services the port side tanks and the other the starboard tanks Thus
most ships require a minimum of two sample points for monitoring ballast discharge Ballast
systems associated with ships in service on the Great Lakes can be quite different from each
other as will the best location for a sample point given the criteria noted in Table 2 During
GSI ship inspections three fundamentally different types of ballast systems were identified
Distributed Manifold Ballast System (Figure 3) in a distributed manifold system a
single pump or pair of pumps is installed in the engine room with ballast main(s)
traveling the length of the ship Branches off the main service each tank Flow in or
out of the tank is controlled by manual or actuated valves at the ballast tank This
ballast system design typically had straight lengths of pipe suitable for sampling
locations in the ship tunnel
Figure 3 Schematic of Distributed Manifold Ballast System Design
Centralized Manifold Ballast System (Figure 4) this ballast system style is similar to
a distributed manifold except each ballast tank has an individual line leading back to
92
CANGELOSI SCHWERDT MANGAN MAYS AND PRIHODA
the engine room the lines combine prior to the pump All the ballast system valves
are located together in the engine room
Figure 4 Schematic of Centralized Manifold Ballast System Design
Multiple Independent Ballast Systems (Figure 5) Ships with multiple independent ballast
systems have no common piping between ballast tanks Every ballast tank on the ship has a
separate sea chest ballast pump and piping This style of ballast system is rare within and
outside the Great Lakes
Figure 5 Schematic of Multiple Independent Ballast System Design
93
A BALLAST DISCHARGE MONITORING SYSTEM
Power Requirements
Power requirements for sample collection systems should be kept to a minimum The GSI
sampling system runs off of two 13 amp 120 volt circuits at 60 hertz Although it has been
easy to find this supply on US and Canadian ships it becomes more difficult with foreign
vessels that operate with different electrical standards
Pitot Custody
The GSI team prefers to provide the pitot to the ship master for installation into the flange
sometime within a week or two prior to the shiprsquos arrival at the port at which sampling is
scheduled After the sample visit the ship crew returns the pitot to the GSI sample team GSI
does not install sample pitots permanently in the ships in order to assure that bio-fouling
inside of the pitot does not bias sampling outcomes and to assure that structural defects of
the pitot will not endanger ship operations If necessary GSI can install the pitot on the day of
sampling but this approach expends limited time available for set-up and sample collection
processing and analysis
GSI recommends that pitots be owned by the testing agency and loaned to the ship being
evaluated Upon pitot return after a sampling event the GSI team inspects the pitot for any
damage Having the pitot belong to the sample team also puts the responsibility of
maintaining a specialized piece of equipment in the hands of those that will need to operate it
The research team can then size the pitot aperture to deliver the desired flow to discharge
ratio (ie volume of sample water per unit volume of ballast discharge)
Step-By-Step Process for Sample Port Commissioning
In summary steps employed by GSI to identify and install sample ports on ships are as
follows
1 Pre-Installation Ship Inspection A ship inspection is conducted to identify and
document features of sample locations with potential to meet most or all of the relevant
criteria Also possible locations for a return flow port downstream of the sample port
and sample processing are assessed and identified at this time
2 CFD Models A qualified engineering firm models potentially suitable locations using
computational fluid dynamics (CFD) to determine which locations in fact provide well-
mixed samples of ballast discharge (ie have fully developed flow or are closest to fully
developed flow)
3 Installation Design to Ship Owner Once a location is determined by the sample
inspection team the location is submitted to the ship owner for approval and class
society review
94
CANGELOSI SCHWERDT MANGAN MAYS AND PRIHODA
4 Flange Installation Once the ship owner and class society agree to the design the
ports can be installed with blind flanges
5 Pitot Installation Prior to a sampling event the blind flange is removed and replaced
with a sample pitot of an appropriate size
Equipment Set up and Tear Down
GSI selected sampling equipment for its reliability and portability All of the equipment and
components of the process described here are no greater than 45 lbs in weight GSI includes
spare parts for critical components in case of component failure during sampling Set up and
tear-down of the sampling system consumes approximately one and one-half (15) hours
each by two technicians
SAMPLING SYSTEM COMPONENTS
The following components comprised GSIrsquos sampling system
Sample Pitot and Sample and Return Port Flange
Function A section of pipe sized to allow water to be collected from the center of the ballast
line
GSI Specific Equipment
Manufacturer Custom designed and manufactured
Model Custom
Description A 90 degree elbow mounted on a 4rdquo 304L stainless steel sample port blind
flange The sample pitot is made from 1-14rdquo sch 40 304L stainless steel pipe There is a 1-
14rdquo full port ball valve with plug installed on the outlet of both to prevent leaking The pitot
aperture is sized to deliver 15-2 times isokinetic flow from the line being sampled The return
flange is a board flange with threaded nipple welded to match the size of the pitot
See Figure 6 for an installation example
Figure 6 Sample Pitot and Sample and Return Port Flange
95
A BALLAST DISCHARGE MONITORING SYSTEM
Electrical Cabinet
Function Monitor and control the system logic
GSI Specific Equipment
Manufacturer Rockwell Automation
Model Custom
Description Contains the PLC motor drives and other necessary components see Figure 7
Figure 7 Electrical Cabinet
Ultrasonic Flow Meter9
Description Monitors the ballast discharge flow rate from the exterior of the ballast
discharge pipe
GSI Specific Equipment
Manufacturer Fuji Electronics
Model FSC wFSD410B1 transmitters
Description See Figures 8 and 9
Figure 8 Ultrasonic Flow Meter Figure 9 Flow Meter Transducer
9 GSI team determined that this approach to monitoring the ballast discharge flow rate was not sufficiently reliable and flexible
across ships to warrant continued use Instead ideally ballast treatment systems should be installed with magnetic flow meters In the worse -case scenario indirect methods of determining ballast discharge flow using tank level changes should be used
96
CANGELOSI SCHWERDT MANGAN MAYS AND PRIHODA
Figure 10 Sample Flow Meter
Figure 11 Tub Level Transducer
Figure 12 Sample Pump
Magnetic Flow Meter
Function Monitors the flow rate of water
being sampled by the sampling system
GSI Specific Equipment
Manufacturer Yamatake
Model MTG18A
Description Two Wire electromagnetic in-
line flow meter see Figure 10
Tub Level Transducer
Function Monitors the level of the water in
the tub
GSI Specific Equipment
Manufacturer Ametek DrexelBrook
Model 750 Series Well Watcher Submersible
Level Transmitter
Description See Figure 11
Sample Pump and Return Pump
Function Sample pumps water from shiprsquos
ballast lines to sample tub and return pumps
back into the ballast line
GSI Specific Equipment
Motor Dayton 1TRZ6
Pump Jabsco 777-9001
Coupling Lovejoy AL095 amp 68514471706
Description Flexible impeller pumps
custom aluminum frame See Figure 12
97
A BALLAST DISCHARGE MONITORING SYSTEM
Sample Tub
Function Provides a reservoir for the sampling net with inlet and outlet
GSI Specific Equipment
Manufacturer RubberMaid
Model 32 Gallon Heavy Duty trash can
Description Bulkhead fitting with a valve on the bottom as a water outlet and an adjustable
riser to hold the sample nets See Figure 13
Figure 13 Sample Tub
Laptop
Description Provides the interface for running the Ballast Sampling Program and data
logging
GSI Specific Equipment
Manufacturer Panasonic Semi-Rugged Toughbook
Model CF-52
Description The Toughbook provides some splash resistance and fall protection as well as
dust protection that is above what a typical laptop would provide It also provides access to
equipment manuals troubleshooting guides and other useful information while in the field
See Figure 14
98
CANGELOSI SCHWERDT MANGAN MAYS AND PRIHODA
Figure 14 Laptop
Whole Water Sampling Apparatus Function For small volume collection that is representative of an individual sample period GSI Specific Equipment Manufacturer Key Instruments (flow meter) Model 5079K53 Description Known as the ldquoSeep Samplerrdquo the apparatus consists of a PVC T section on
the 1rdquo hose (with PVC union fittings) from the collection pitot to the sampling tub (Figure 1) A
frac12rdquo brass fitting was used to connect the rotometer (flowmeter) to the PVC section A brass
fitting on the outlet of the rotometer connects to a small PVC hose (18rdquo) leading into a
carboy A pinch clamp on the small tubing provides flow control See Figure 15
Figure 15 Seep Sampler
99
A BALLAST DISCHARGE MONITORING SYSTEM
Human Machine Interface (HMI) Software The GSI shipboard sample equipment is controlled using FactoryTalk Historian ME
FactoryTalk is a brand of HMI software that includes graphical representation (see Figure 16)
Any HMI software used to control sampling equipment should include the following abilities
1 Control of pump actives through PLC loops
2 Ability to set sample pump as a percent of ballast line flow
3 Data Logging and live data display and
4 Fault and warning notifications
Figure 16 Sample Screen Image from GSI HMI Software
100
CANGELOSI SCHWERDT MANGAN MAYS AND PRIHODA
Sample Gear
Sample gear included the following items Plankton Net and Cod-End Manufacturer Sea-Gear Corporation Model 9000 (30cm 31 35 micrometer mesh) Description Zooplankton samples are collected by concentrating the sample volume
through a 35 micrometer mesh plankton net (ie 50 micrometers on the diagonal) into a 1
Liter cod-end for analysis A minimum of one plankton net is required per sample The
plankton nets used by GSI during shipboard sampling were purchased from Sea-Gear
Corporation of Melbourne Florida (Figure 17)
Figure 17 Plankton Net (35 micrometers) with Attached 1 Liter Cod-End
Sample Collection Containers Carboy 20 Liter Manufacturer ULine Model S12768 Description High-density polyethylene (HDPE) containers for time-integrated sample
collection the type and quantity of which are dependent on the test plan For example the
time-integrated ldquoseeprdquo sample is collected using a 19 liter HDPE carboy (one per replicate
101
A BALLAST DISCHARGE MONITORING SYSTEM
Figure 18) For collection of whole effluent two time-integrated ldquoseeprdquo samples are collected
one for whole water samples and one for whole effluent toxicity testing From one time-
integrate sample total suspended solids and percent transmittance subsamples as well as
whole water for analysis of protists are collected using HDPE sample bottles (Figure 18)
Organic carbon samples (ie non-purgeable organic carbon and dissolved organic carbon)
are collected using 125 mL glass sample bottles prepared by soaking in Micro-90reg
Concentrated Cleaning Solution (Figure 18) Microbial samples (a minimum of three
subsamples per carboy) are collected using sterile 1 liter polypropylene bottles (not pictured)
Extra sample containers should be carried aboard
Figure 18 Sample Collection Containers used for Shipboard Sampling Events
Transport Coolers and Ice Packs Description To ensure sample integrity proper sample holding and transport is of the
upmost importance Following sample collection sample bottles are immediately placed into
small sample transport coolers (Figure 19) and are kept cold until they are delivered to the
sample analysis personnel by using a minimum of two ice packs per cooler (Figure 19)
YSI Multiparameter Water Quality Sonde with Data Display and Logging System
Manufacturer YSI Incorporated (Yellow Springs Ohio)
Model YSI 6-Series Model 6600 V2-4 Sonde and YSI 650MDS Data Logging System
102
CANGELOSI SCHWERDT MANGAN MAYS AND PRIHODA
Description Water quality parameters are measured from the time-integrated sample using
a YSI Multiparameter Water Quality Sonde (Figure 20) It is recommended that two Sondes
be brought onboard in case one of the Sondes is not functioning correctly The 6600 V2-4
Sonde (Figure 20) was used by GSI and included sensors to measure the following
parameters specific conductivity salinity pH temperature dissolved oxgen (concentration
and percent saturation) turbidity and total chlorophyll The measured values are displayed
using the YSI 650 MDS data logger (Figure 21)
Figure 19 Small Sample Transport Cooler with Samples and Ice Packs
Figure 20 (left)YSI 6-Series Multiparameter Water Quality Sonde (YSI 6600 V2-4)
Figure 21 (right) YSI 650 MDS Data Logging System
103
A BALLAST DISCHARGE MONITORING SYSTEM
Standard Operating Procedures Test Plan Datasheets and Laboratory Notebooks
Description A copy of the Test Plan as well as the sample collection SOPs must be
brought on board during the sampling event and must be readily accessible to the sample
collection team The appropriate datasheets will be identified in the Test Plan and extra
datasheets should be brought onboard along with extra pens (indelible ink only) Data may
also be recorded in laboratory notebooks although pre-printed datasheets are preferred due
to the increased efficiency of data recording
Personal Protective Gear and Dress
The equipment listed below is the recommended and in most cases the required protective
gear for personnel involved with the shipboard ballast sampling and operation of the
equipment The requirements of the vessels or the facilities through which the vessels are
accessed may vary and the sample team is expected to follow safety procedures required of
the dock or ship including Occupational Safety and Health Administration (OSHA)
requirements
Hardhat
Steel toe boots
Safety Glasses
Hearing Protection (ear plugs or muffs or in some cases both may be advisable)
Flashlight or headlamp
Work Gloves
Work Clothing ndash work clothing should cover arms and legs and fit in a manner
as to not create a safety hazard Jewelry (including rings) is not recommended
and on many facilities not allowed
Transportation Worker Identification Card (TWIC) ndash Some facilities require for
access
Equipment Set Up and Tear-Down
Equipment loading and unloading to and from the ship should be as swift as possible to
minimize disruption to ship operations and to avoid the possibility of needing to re-route entry
during the loading Two to four people can effectively accomplish set up and tear-down within
45 minutes to one hour for each operation It is advisable to have one member of the set-up
104
CANGELOSI SCHWERDT MANGAN MAYS AND PRIHODA
team assigned to sonic flow meter set up while the others bring the rest of the gear to the
sampling location since flow meter set up can be time consuming It is important to make sure
that hose unions have the rubber grommet installed and that all connections are proper and
snug Equipment should be laid out with consideration to
Keeping walkways clear of wires and other equipment
Keeping wires and hoses neat using wire ties to secure hoses and wiring out of the
way and
Planning for good work flow
Once all of the hoses are installed the valves may be opened on the sample and return ports
and at the pumps and sample tub With the software program in manual mode the pump
rotation should be verified by powering the pump motor for a few seconds while someone
checks for rotation If the pump does not turn the motor should be disconnected from the
electrical cabinet and the guard removed to allow the pump to be manually turned over
several times This usually should require a ldquoLockoutTagoutrdquo procedure The guard should
then be reinstalled and the pump rechecked
During equipment tear-down the sample port and return port valves must first be closed and
the plugs secured GSIrsquos Ballast Sampling System is designed to automatically empty the
sample tub at the conclusion of a test Depending on the amount of water left in the sample
tub it may be best to place the control program into manual mode and completely drain the
sample tub of water tilting the sample tub to get the water into the drain The sample lines
must also be manually emptied into the sample tub
Other tasks are
Packing the pump for removal
Removing the hoses from the sample pitots via unions
Shutting the valve on the return port to prevent any flow that may otherwise push
back through the return pump
Backing up the data log file separately from the laptop
Packing and removing from the vessel the remainder of the hose wiring and
equipment
Conducting a final visual check to assure that all equipment and personal items have
been removed and
Ensuring that both the Sample and Return port valves are fully closed and the plugs
firmly installed
105
A BALLAST DISCHARGE MONITORING SYSTEM
Discussion
Overall the sampling approaches and supporting equipment detailed in this paper performed
well during GSIrsquos ship visits GSI successfully loaded set up and operated the sampling
method described here within a feasible time window and ldquoleft no tracerdquo upon departing the
ship except for the pitot flange which was removed later by the ship crew
The costs of carrying out a sampling event using this method (excluding scientific supplies
associated with sample analysis) are detailed in Table 3
Table 3 GSI Costs Per Sampling Event
One-Time
Costs
Cost Factor TimeCost
Ship Inspection $1500
Installation of flanges in a ship $2000-$5000
Reuseable Operational Equipment $45000
Biological Sampling Equipment
$500-$2000
depending on Test
Plan
Set up and Tear Down of Sampling Equipment 15 ndash 2 hrs (total)
assuming 2-3 staff
Per Sampling
Event Costs
Sample Collection Staff Time TBD depending on
Test Plan
Staff Travel TBD depending on
Test Plan
Equipment Performance
Sampling operational equipment performed as expected with the following exceptions
The Ultra-Sonic Flow Meter on the shipsrsquo ballast discharge line performed
inconsistently and unreliably jeopardizing the extent to which representativeness of the
sample can be proven It is important to sample a constant fraction of the ballast line flow
through using an in-line magnetic flux flow meter on the sample line and a portable ultrasonic
flow meter mounted to the ships ballast piping If one of these monitors is inconsistent there
is no direct means to assure that the sample volume and the flow volumes are proportional
throughout the sampling process Without this information it becomes difficult to translate
106
CANGELOSI SCHWERDT MANGAN MAYS AND PRIHODA
organisms per unit volume in the sample to organisms per unit volume in the ballast
discharge
The ultrasonic flow meter was also difficult to mount properly It is highly recommended that
ship owners and authorities encourage treatment system developers to include flow meters in
their systems that have a proven in-situ performance to within 3 It is also recommended to
have a standardized output connection so that the sample team can make use of that flow
meter to facilitate the constant percent sampling necessary for a representative sample
It was necessary to tune up the PLC Control Loop Because the sampling equipment is
used on a number of different ships each having different arrangements flow rates and
pressures sometimes it is necessary to fine-tune the automation of the sample system to
prevent unstable rates or oscillating rates of the sample flow It is recommended that the PLC
control loop parameters be available (ie the Gain Reset and Rate)
The 32 Gallon heavy duty tub (sample collection barrel) though strong and light was
awkward to bring aboard Attaching backpack straps in the future may remedy this
Delivery of the 19 liter carboys for effluent toxicity testing was improved by placing each
carboy inside a frame backpack for navigation from the sampling location to the dock
Recommendations
Key lessons learned in terms of sample event planning and staffing were
Scheduling of the sampling event is subject to changes in weather ship equipment and
port schedules Even when the ship has docked the schedule is still subject to change
Depending on each ship and each cargo load the ballasting and deballasting operation
varies and may start and stop at various times (ie 6 hours of sampling may actually take 12
hours) Fresh sampling and analysis personnel are essential to quality data It is
recommended that sampling and analysis crew shifts of 24 hours be in place to address
schedule contingencies
Equipment set-up and break-down is easier when shared among several team
members Initially the engineers were more familiar with the equipment set up As more
sampling events took place all personnel became familiar with the set up and break-down
and could therefore provide more support and assistance in those areas
107
CANGELOSI SCHWERDT MANGAN MAYS AND PRIHODA
The ship pumping schedule is subject to variation making ldquobeginning middle and
endrdquo grab samples difficult to plan The ballast pump (or pumps) move water at a rate that
may be faster than the loading of cargo resulting in starting and stopping of the pump (and
therefore sampling) As a result determining three sets of discrete grab samples spaced
approximately near the beginning middle and end proves difficult One hour samples seemed
to work for all parties (ie each sample was one hour of collection) The test plan should
require that a certain volume duration or number of tanks of ballast water discharge be
sampled instead
Have a dedicated handling and sample transport person This additional person allows
maximum support aboard the ship and efficient delivery of the samples This person could
also return the previous samplesrsquo cooler and ice packs to ship personnel eliminating the need
to carry multiple transport equipment aboard the ship
Conclusions
The operational method for sampling ship discharge described in this paper is a feasible and
cost-effective approach which can yield representative samples for a range of experimental
objectives It appears to be applicable to most ships which ply the Great Lakes The costs of
the exercise are dominated by a one-time investment in operational equipment Installation of
sample ports on ships is a relatively minor one-time expense Costs of deployment of the
sampling team and sample analysis are largely dictated by the test plan under consideration
as well as the number of schedule changes associated with the ship visit
Acknowledgements
The GSI team wishes to thank the Legislative Commission on Minnesota Resources the
United States Department of Transportation Maritime Administration and the Great Lakes
Protection Fund for financial support for the work leading to the development of this
Guidebook We are indebted to the technical teams at the Navy Research Laboratory and
Work Groups of the International Maritime Organization Maritime Environment Protection
Committee for initial guidelines for effective sampling from ships Most of all the GSI project
benefited from the participation and assistance of the ship owners and their capable Officers
and Crew Members involved in the GSI effort to develop and test these methods Specifically
we thank the owners operators officers and crew of the Niagara Saguenay MV Tim S
Dool MV Indiana Harbor Edwin H Gott Str Herbert C Jackson MV James R Barker MV
Hon James L Oberstar Federal Hunter and Isolda
108
A BALLAST DISCHARGE MONITORING SYSTEM
REFERENCES
GSI (2011) Great Ships Initiative (GSI) Quality Management Plan Northeast-Midwest Institute
Washington DC
IMO (2004) International Convention for the Control and Management of Ships Ballast Water and
Sediments As adopted by consensus at a Diplomatic Conference at IMO London England February
13 2004
NSF International (September 2010) Generic Protocol for the Verification of Ballast Water Treatment
Technology Version 51 EPA600R-10146 Produced for the USEPA Environmental Technology
Verification Program in Conjunction with US Coast Guard Environmental Standards Division and US
Naval Research Laboratory Center for Corrosion Science and Engineering NSF International Ann
Arbor Michigan
United States Coast Guard (2008) Analysis of Ballast Water Sampling Port Designs Using
Computational Fluid Dynamics United States Coast Guard Research and Development Center
Report No CG-D-01-08 February 2008
GSI Team Members
PRINCIPAL INVESTIGATOR
Allegra Cangelosi NEMWI
RESEARCH TEAM
Euan Reavie PhD NRRI UMD Deanna Regan LSRI UWS Donald Reid Consultant Elaine Ruzycki NRRI UMD Heidi Saillard LSRI UWS Heidi Schaefer LSRI UWS Tyler Schwerdt AMI Engineering Tyler Snetting AMI Engineering Matthew TenEyck LSRI UWS
Lisa Allinger NRRI UMD Mary Balcer PhD LSRI UWS Lana Fanberg LSRI UWS Debra Fobbe LSRI UWS Steve Hagedorn LSRI UWS Travis Mangan NEMWI Nicole Mays NEMWI Christine Polkinghorne LSRI UWS Kelsey Prihoda LSRI UWS
109
BALLAST WATER MANAGEMENT SYSTEMS
Sampling of Ballast Water for Compliance Control
Stephan Gollasch1 Matej David2
Abstract
Ballast water sampling is an important option to assess the compliance with ballast water management
requirements Organism diversity and behaviour are triggering complexity in ballast water sampling As
a result different sampling strategies may be required to obtain a representative sample of ballast
water discharge The authors conducted two sampling studies onboard commercial vessels to study
differences in the application of different sampling methods This paper summarises the
recommendations for how to obtain a representative sample of the whole ballast water discharge as
required by the International Convention on the Management of Ships Ballast Water and Sediments
2004
Key Words maritime transport ballast water management convention sampling for compliance
Introduction
The International Maritime Organization (IMO) the United Nations body to address shipping
noted the problems caused by species movements with ballast water and tasked its Marine
Environment Protection Committee (MEPC) specifically the Ballast Water Working Group
(BWWG) to draft an instrument to take care of this problem As a result of many years of
negotiations at IMO the International Convention on the Management of Shipsrsquo Ballast Water
and Sediments (BWM Convention) was adopted in 2004 (IMO 2004) The BWM Convention
introduces two different protective approaches which will sequentially be implemented after
the BWM Convention enters into force
1) The Ballast Water Exchange Standard (outlined in Regulation D-1 of the BWM
Convention) requiring ships to exchange a minimum of 95 ballast water volume
and
2) The Ballast Water Performance Standard (outlined in Regulation D-2 of the BWM
Convention)
The latter standard limits the number of viable organisms in the ballast water discharged as
shown below
1 GoConsult Grosse Brunnenstr 61 22763 Hamburg Germany sgollaschaolcom 2 University of Ljubljana Faculty of Maritime Studies and Transport Pot pomorščakov 4 SI 6320 Portorož
Slovenia
110
GOLLASCH DAVID
Regulation D-2 Ballast Water Performance Standard
1 Ships conducting Ballast Water Management in accordance with this regulation shall
discharge less than 10 viable organisms per cubic metre greater than or equal to 50
micrometres in minimum dimension and less than 10 viable organisms per millilitre
less than 50 micrometres in minimum dimension and greater than or equal to 10
micrometres in minimum dimension and discharge of the indicator microbes shall not
exceed the specified concentrations described in paragraph 2
2 Indicator microbes as a human health standard shall include
1 Toxicogenic Vibrio cholerae (O1 and O139) with less than 1 colony forming
unit (cfu) per 100 millilitres or less than 1 cfu per 1 gram (wet weight)
zooplankton samples
2 Escherichia coli less than 250 cfu per 100 millilitres
3 Intestinal Enterococci less than 100 cfu per 100 milliliters
Sampling ballast water of vessels to assess compliance with ballast water management
requirements is very specific and includes sampling the biology of ballast water (eg David
and Perkovič 2004 David et al 2007) and the sample collection process should by no
means influence such an assessment It is possible to over or under-sample the real
organism concentrations because of various potential errors (Gollasch et al 2007) As the
sampling process represents additional stress for organisms they may be damaged during
the process and the underestimation may result in false compliance as such sampling
representativeness becomes a key issue (Gollasch amp David 2009 2010)
To overcome this the BWWG of IMO developed a sampling guideline (ie Guidelines for
Ballast Water Sampling (G2) (IMO MEPC 2008)) to provide sampling guidance However
some key aspects were not addressed such as the sampling frequency the minimum water
volume to be sampled and the number of samples to be taken
An IMO correspondence group on ballast water sampling was established to deal with these
issues It is expected that at the next meeting of the Bulk Liquid and Gases Sub-committee in
early 2012 the correspondence group will present their findings
The authors were recently involved in two studies which aimed to recommend how to take
representative samples of ballast water (Gollasch amp David 2009 2010) During both studies
several different options to sample the ballast water of vessels were practically tested
onboard commercial vessels The method comparison included short-time sequential
samples versus samples taken over the entire ballast water pumping time Results from these
111
SAMPLING OF BALLAST WATER
studies suggest possible sampling strategies to obtain a representative sample of the whole
ballast water discharge
BWS Methods for Compliance Monitoring
The results show that different approaches in the sampling process influence the results
regarding organism concentrations The organisms in the discharge are affected in different
ways therefore the selection of the ldquowrongrdquo sampling approach may influence the compliance
control result The organism concentrations in the ballast water discharge may therefore be
underestimated and a ldquofaultyrdquo ballast water treatment system (BWTS) could be recognised
as compliant Conversely organism concentrations may be overestimated and a BWTS
complying with the D-2 Standard may fail in compliance tests
It should be noted that a certain level of pragmatism is required during on-board ballast water
compliance control sampling especially when larger volumes of water need to be sampled
This is especially relevant when sampling for organisms above 50 micron in minimum
dimension and attempts should be made to avoid negatively impairing organism survival
during the sampling process Compliance control sampling teams are unlikely to have large
water collection tanks (gt1000 litres) available during the sampling event and will probably
need to work with nets to concentrate the sample during the sampling procedure
During the two studies the authors have undertaken it was observed that the sampling
duration (ie length of the sampling process) timing (ie which point in time during the
discharge that the sampling is conducted) the number of samples and the sampled water
quantity are the main factors which influence the results regarding organism concentrations
Recommended sampling duration
The results show that mainly zooplankton organisms above 50 microns in minimum
dimension are negatively affected by longer sampling times As these are the main
component of the organisms in the group gt50 micron longer sampling times result in an
underestimation of the viable organism concentration for this group in the discharge
Recommended sampling timing and number of samples
The results show that organism patchiness occurs in ballast tanks so that the organism
concentrations vary considerably during the discharge The highest variability was recognized
in samples at the beginning or at the end of the discharge Therefore it is recommended that
the sampling is conducted randomly anytime in the middle of the discharge with more than
one sequential sample being taken
112
GOLLASCH DAVID
Recommended sample quantity
In this study sequential sampling was conducted every 5 minutes for up to almost 2 hours
To obtain the most representative results it is recommended that
for the organisms greater than 50 microns less than 500 liters may be filtered and
concentrated not to extend the sampling time
for the organisms greater than 10 microns and less than 50 microns a continuous
drip sample totaling approximately 5 liters should be taken
for bacteria a sample of approximately 1 liter should be taken as a continuous drip
sample
Sampling logistics feasibility
Different types sizes and cargo profiles of vessels trigger very different ballast water
discharge profiles and times Ballast water discharge may be conducted ldquoat oncerdquo or ldquoin
sequencerdquo lasting from approximately one hour up to several days depending on the length
of the cargo operation It is important to take this factor into account as it is difficult to
imagine that the PSC officer andor sampling team would stay on-board the vessel for several
days
Conclusions
If different sampling approaches are used by different PSC around the EU it may occur that a
vessel is sampled and determined to be in compliance in one port but not in another This
would be an unacceptable situation
Both studies have shown that different sampling approaches result in different organism
concentrations The sequential trials showed different numbers of organisms in the samples
taken in the beginning middle and end of the pumping event but no consistent trend could
be identified
Considering the above recommendations on representative sampling sampling of at least
two random samples is feasible and relatively easy while sampling over the entire time of the
ballast water discharge would be quite difficult especially if long sampling times are required
over several days or during night
Therefore a harmonised sampling approach seems essential to provide consistent
compliance tests
SAMPLING OF BALLAST WATER
Acknowledgements
The first study was undertaken 2009 and was funded by the Federal Maritime and
Hydrographic Agency Hamburg Germany The second study was conducted in 2010 funded
by the European Maritime Safety Agency (EMSA) Lisbon Portugal We would like to thank
the vessel crews for their outstanding support to enable the sampling events Further our
grateful thanks are expressed to the treatment system vendors Resource Ballast
Technologies ltd (Cape Town South Africa) Mahle Industriefiltration GmbH (Hamburg
Germany) and Aquaworx ATC GmbH (Munich Germany) as well as Wilhelmsen Ships
Equipment (Norway Poland) without their support the sampling voyages would not have
been possible
REFERENCES
David M amp M Perkovič (2004) Ballast water sampling as a critical component of biological invasions
risk management Marine Pollution Bulletin 49 313ndash318
David M Gollasch S Cabrini M Perkovič M Bošnjak D amp D Virgilio (2007) Results from the First
Ballast Water Sampling Study in the Mediterranean Sea - the Port of Koper Study Marine Pollution
Bulletin 54(1) 53-65
David M amp S Gollasch (2008) EU Shipping in the Dawn of Managing the Ballast Water Issue Mar
Pollut Bull vol 56 no 12 1966-1972
Gollasch S amp M David (2009) Results of an on-board ballast water sampling study and initial
considerations how to take representative samples for compliance control with the D-2 Standard of the
Ballast Water Management Convention Submitted by Germany to IMO Sub-committee Bulk Liquid
and Gases as BLG 14INF6 11 pp (Study funded by The German Federal Maritime and Hydrographic
Agency Hamburg (BSH))
Gollasch S David M Voigt M Dragsund E Hewitt C and Y Fukuyo (2007) Critical review of
the IMO International Convention on the Management of Shipsrsquo Ballast Water and Sediments Harmful
algae iss 4 vol 6 585-600
Gollasch S amp M David (2010) Testing Sample Representativeness of a Ballast Water Discharge and
developing methods for Indicative Analysis Report for Tender Ndeg EMSANEG092010 European
Maritime Safety Agency (EMSA) Lisbon Portugal 124 pp
IMO (2004) International Convention for the Control and Management of Shipsrsquo Ballast Water and
Sediments International Maritime Organization 36 pp
IMO MEPC (2008) Guidelines for Ballast Water Sampling (G2) International Maritime Organization
London 14 pp
115
BALLAST WATER MANAGEMENT SYSTEMS
Validation of a Shipboard filer skid
for Sampling Zooplankton from Ballast Water
Matthew First1 Edward J Lemieux2 Cameron S Moser3 Timothy P Wier3 Jonathan F
Grant4 Stephanie H Robbins Wamsley1 Scott C Riley1 Mia K Steinberg5
Lisa A Drake6
Abstract
Proposed US and international performance standards for shipsrsquo ballast water allow for very low
concentrations of live organisms The limit for organisms ge 50 microm in minimum dimension (nominally
zooplankton) is lt10 living organisms m-3 Large volumes of water (ie several m3 to 10s of m3) must be
sampled to estimate zooplankton concentrations with suitable statistical confidence Traditional
sampling devices (eg plankton nets) are not well suited for use aboard ships as nets are unwieldy
and difficult to manage in the available small spaces and the water filtered through plankton nets must
be managed in the limited spaces of the commercial shipboard environment To sample relatively large
volumes from ballast discharges in a manner compatible with the shipboard environment a novel
shipboard filter skid (SFS) consisting of two stainless steel housings each containing a filter bag was
constructed for use with closed fluidic systems such as shipboard piping
Keywords zooplankton sampling shipboard
Objectives
The objective of this study was to validate the efficacy of a prototype SFS for capturing living
zooplankton at a land-based ballast water facility Validation of the SFS included examining
the retention efficiency of zooplankton proxies (microbeads) assessing the potential toxicity
of filter skid materials and comparing zooplankton samples collected with SFS to those
collected with a plankton net at two sample volumes (5 and 10m3) Capture efficiency (CE)
defined here as concentration of zooplankton in the SFS relative to the plankton net was the
metric used to evaluate the SFS The overall goal of this work was to determine if the SFS
could capture zooplankton efficiently without introducing high rates of zooplankton loss or
mortality and thus be used as a substitute for plankton nets
1 SAIC Inc Naval Research Laboratory Key West FL 2 Naval Research Laboratory Code 6130 Washington DC 3 EXCET Inc Naval Research Laboratory Key West FL 4 Battenkill Technologies Manchester Center VT 5 Naval Surface Warfare Center Carderock Division West Bethesda MD 6 Naval Research Laboratory Code 6136 Key West FL
116
FIRST LEMIEUX MOSER WIER GRANT WAMSLEY RILEY STEINBERG DRAKE
Results
Microbead recovery in filter bags was gt89 and 100 for microbeads of 50microm and 150microm
diameters respectively Exposure to the sealant used to seal the filter bagsrsquo seams and the
stainless steel materials of the housings did not lead to mortality in two zooplankton species
Overall CE was higher in the SFS than in the plankton net 108plusmn66 (mean plusmn SD n=6) The
SFS provided higher capture efficiency of zooplankton in trials using 5m3 sample volumes
(CE=147 plusmn 74 n=3) whereas CE was lower in trials using 10m3 sample volumes (69plusmn28
n=3) In trials with low CE ciliates approximately 50 microm in minimum dimension were poorly
retained by the SFS relative to the plankton net Mortality in both the filter skid and the
plankton net was low (lt4)
Conclusions
The data presented here show that at lower sample volumes (ie 5m3) the SFS was a valid
substitute for a plankton net for concentrating living zooplankton from ballast water systems
Future work should be done to validate the SFS aboard a vessel where the flow rates and
system pressure may fluctuate throughout the course of the sampling event Additionally the
SFS should be validated in freshwater environments to verify that high CE of the filter skid is
applicable to freshwater zooplankton communities which may be dominated by soft-bodied
organisms
117
BALLAST WATER MANAGEMENT SYSTEMS
Efforts to Develop a Ballast Water Detecting Device
Goran Bakalar B Sc1
Abstract
Research of ballast water treatment devices does not address the research of repairs for these devices
and the research of the permanent quality of such machinery There is a need for a follow-up system
In this research it analysed what technology is sufficient to support development of the ballast water
bio-invasive organism detection There are static and dynamic detecting efforts and challenges Two
methods were considered as good examples for each of them static and dynamic detection are
possible Methods of detection involving the DNA method are not reliable as dynamic detecting
methods Characteristics of the DNA method are described in this paper Another method with some
existing devices is already in use as another form of detection Spectroscopy and cytometry have been
explained as well Products that use this methodology were listed and the functionality of the system
has been explained The use itself and reasons for it were researched in this paper and the
conclusions are discussed
Key words Ballast water treatment devices on the ships professional service and repairs detection
methods DNA cytometry bio-invasive organisms scientific research using inducting method
Introduction
International law led to Convention of Ballast Water Management (BWM) 2004 The
Convention requires that certified inspectors do their best to avoid not needed stoppage
caused by potentional sampling of all of the ships (p12) In other words attention is usually
given to respect the contracts of transportation rather than protect the seasThe inspector
can give an order to a designated institution or certified laboratory to take samples and to
analyse ballast water that any crew intends to discharge into the sea This inspection in a
laboratory includes analyses to find whether microorganisms exist in ballast water and to
determine salinity and the kind of salt in such a way as to determine is the source of the
ballast water If the analyses find no microorganisms or any other reason that would prevent
ballast water discharge all the expenses would be paid by the Ministry that the inspector
represents Those expenses are very large and could even cause loss of the cargo in next
port of call There is a need for cheaper and faster inspections New technologies could help
lead to such solutions
1 Maritime consultancy Put Radosevca 52 21000 Split Croatia
email GoranBakalarxnethr
118
BAKALAR
Another reason why we need other solutions is weather conditions on the ships and among
the crew members Experience has shown problems with the repairs that occur on the ships
There is a large difference between the correction of damage in the cargo tanks and in the
ballast water tanks on ships A good example is correction of the pittings in cargo tanks after
the cargo of sulfur acid has been discharged and the tanks cleaned The repair of the heating
coils that exist in cargo tanks (one of the ways to hold liquid cargo at a consistent
temperature) would be much more difficult if it were necessary in ballast water tanks Another
example is to derust and correct by welding a constructional problem in ballast or cargo
tanks when needed The basic difference is in the height of the tanks mdash cargo tanks are
three to ten metres high and ballast tanks are a half meter up to 15 metres tall To do any
repair or welding job in that height is extremely difficult The same problem could happen with
any possible repair of a ballast water treatment device or welded holders of that device Any
equipment that exists in the salt water is in constant exposure to elements that cause
damage A ships movement in storms combined with salt exposure results in a very big risk
for damage or improper functionality of any device heating coils or other methods of ballast
water treatment in the ballast water tanks Heating coils become loose over time and the fluid
in the heating system may leak and contaminate ballast water Oil is usually used as the
heating fluid in heating coils It would be impossible to find from the location of the heating coil
fluid leaks if the ballast inspector found the contamination Even if the hole was found there
are measures and the law that requires how and where it is allowed to repair such damage
One of the solutions to control whether a ballast water devicesystem is actually functioning
properly is to give opportunity to new technologies
Detection Methods
The detection of algae and other bio-invasive organisms in ballast water is important It is
necessary to avoid expenses that could be incurred by wrongful inspectors decisions and
there is an obligation to protect the nature The crew and the ship owners take the
responsibility of ballast water treatment onboard the ships The experience of using other
monitoring devices (even not fixed in the salt water) (for example oil discharge monitor) has
resulted in various overworks by crew members The most popular one is to bypass the oil
discharge monitor in the monitoring system onboard the ships It is expected that crew
members all over the world will invent ways to bypass improperly functioning devices and in
the above mentioned case ballast water treatment To evaluate good or improper funtioning
of ballast water treatment systems onboard a ship requires a good method to detect bio-
invasive algae and other microorganisms Good methods are dynamic methods A good
method that could detect unwanted microorganisms needs to be dynamic and able to scan
extremely quickly It is also necessary to format data analyse that data and process large
data files Advantages of silico-imaging or scanning are the high acquisition rate of up to 1000
119
EFFORTS TO DEVELOP A BALLAST WATER DETECTING DEVICE
scans per second through a USB interface the suitability of the data format for standard flow
cytometer data analysis and fast processing of large data files
DNA Detection Method
DNA analysis led to a new way to answer old questions in science The DNA analysis method
is an initiation to cytometry analyses DNA analyses are done in a laboratory and sometimes
it requires days to inspect some objects of detection DNA taxonomy is based on the analysis
of small segments of genomas Group of nucleotides of each alga is a different barcode that
exists in different algae Those barcodes filed in a database are used to identify all algae of
the world The following example shows that the time for DNA detection in that case was
shortened to three hours
A technique used for detecting Raphidophycean a bloom-forming genus of algae was
developed using a specific DNA probe The design of the probe was based on a sequence
polymorphism within the small subunit ribosomal DNA (rDNA) gene of a strain by using
fluorescence polarization analysis and the BIAcore 2000 biosensor which utilized surface
plasmon resonance The specific sequence for Heterosigma carterae was determined by
sequence data analysis One pair of polymerase chain reaction probes was designed for use
in making the identification Heterosigma carterae rDNA was amplified by using a fluoroscein
isothiocyanate-labeled or biotin-labeled oligonucleotide probe the amplified rDNA was
selectively detected as an intensive change via analysis or as a resonance-unit change
Although total time for final detection after sampling was within 3 hours specific rDNA could
be detected within 10 minutes through these detection methods [1]
Cytometry Detection Method
The power of the flow cytometric analysis principle is that the cells are passing a laser beam
one-by-one at high speed and their individual light scattering and fluorescence properties are
recorded to form an optical fingerprint for each cell This separates the flow cytometric
method from bulk methods for fluorescence spectra andor size spectra for bulk volumes of
water where it is much harder to discriminate between the contributions of the various groups
in the water since the readings are collected for all particles at once Flow cytometry allows
easy recognition of the different groups in the sample and quantification of their abundance
as well as their optical properties (size pigment) - even the detection of a few rare cells from
within a high number of cells from a blooming species
History
The first impedance-based flow cytometry device using the Coulter principle was disclosed
in US Patent 2656508 issued in 1953 to Wallace H Coulter The first fluorescence-based
flow cytometry device (ICP 11) was developed in 1968 by Wolfgang Goumlhde from the
120
BAKALAR
Figure 1 Some scans of flow cytometry technology [ 2 ]
University of Muumlnster and first commercialized in 196869 by German developer and
manufacturer Partec through Phywe AG in Goumlttingen At that time absorption methods were
still widely favored by other scientists over fluorescence methods Soon after flow cytometry
instruments were developed including the Cytofluorograph (1971) from BioPhysics Systems
Inc (later Ortho Diagnostics) the PAS 8000 (1973) from Partec the first FACS instrument
from Becton Dickinson (1974) the ICP 22 (1975) from PartecPhywe and the Epics from
Coulter (197778)
The original name of the flow cytometry technology was pulse cytophotometry Only 20
years later in 1988 at the Conference of the American Engineering Foundation in Pensacola
Florida the name was changed to flow cytometry a term that quickly became popular
Principle of flow cytometry
A beam of light (usually laser light) of a single wavelength is directed onto a
hydrodynamically-focused stream of fluid A number of detectors are aimed at the point where
the stream passes through the light beam one in line with the light beam (Forward Scatter or
FSC) several perpendicular to it (Side Scatter or SSC) and one or more fluorescent
detectors Each suspended particle from 02 to 150 micrometers passing through the beam
121
EFFORTS TO DEVELOP A BALLAST WATER DETECTING DEVICE
scatters the ray and fluorescent chemicals found in the particle or attached to the particle
may be excited into emitting light at a longer wavelength than the light source This
combination of scattered and fluorescent light is picked up by the detectors and by analysing
fluctuations in brightness at each detector (one for each fluorescent emission peak) it is then
possible to derive various types of information about the physical and chemical structure of
each individual particle FSC correlates with the cell volume and SSC depends on the inner
complexity of the particle (ie shape of the nucleus the amount and type of cytoplasmic
granules or the membrane roughness) [3]
Flow cytometers
Modern flow cytometers are able to analyze several thousand particles every second in real
time and can actively separate and isolate particles having specified properties A flow
cytometer is similar to a microscope except that instead of producing an image of the cell
flow cytometry offers high-throughput (for a large number of cells) automated quantification
of set parameters To analyze solid tissues a single-cell suspension must first be prepared
A flow cytometer has five main components
a flow cell - liquid stream (sheath fluid) which carries and aligns the cells so that they pass single file through the light beam for sensing
a measuring system - commonly used are measurement of impedance (or conductivity)
and optical systems - lamps (mercury xenon) high-power water-cooled lasers (argon
krypton dye laser) low-power air-cooled lasers diode lasers (blue green red violet)
resulting in light signals
a detector and Analogue-to-Digital Conversion (ADC) system - which generates FSC
and SSC as well as fluorescence signals from light into electrical signals that can be
processed by a computer
an amplification system - linear or logarithmic
a computer for analysis of the signals [3]
The process of collecting data from samples using the flow cytometer is termed acquisition
Acquisition is mediated by a computer physically connected to the flow cytometer and the
software which handles the digital interface with the cytometer The software is capable of
adjusting parameters (ie voltage compensation etc) for the sample being tested and also
assists in displaying initial sample information while acquiring sample data to insure that
parameters are set correctly Early flow cytometers were in general experimental devices
but technological advances have enabled widespread applications for use in a variety of both
clinical and research purposes Due to these developments a considerable market for
122
BAKALAR
instrumentation analysis software as well as the reagents used in acquisition such as
fluorescently-labeled antibodies has developed
Modern instruments usually have multiple lasers and fluorescence detectors The current
record for a commercial instrument is four lasers and 18 fluorescence detectors Increasing
the number of lasers and detectors allows for multiple antibody labeling and can more
precisely identify a target population by their phenotypic markers Certain instruments can
even take digital images of individual cells allowing for the analysis of fluorescent signal
location within or on the surface of a cell
Data analysis
The data generated by flow-cytometers can be plotted in a single dimension (to produce a
histogram) in two-dimensional dot plots or even in three dimensions The regions on these
plots can be sequentially separated based on fluorescence intensity by creating a series of
subset extractions termed gates Specific gating protocols exist for diagnostic and clinical
purposes especially in relation to hematology The plots are often made on logarithmic
scales Because different fluorescent dyes emission spectra overlap signals at the detectors
have to be compensated electronically as well as computationally Data accumulated using
the flow cytometer can be analyzed using software Once the data are collected there is no
need to stay connected to the flow cytometer For this reason analysis is most often done on
a separate computer This is especially necessary in core facilities where usage of these
machines is in high demand
Fluorescence-activated cell sorting
Fluorescence-activated cell sorting (FACS) is a specialized type of flow cytometry It provides
a method for sorting a heterogeneous mixture of biological cells into two or more containers
one cell at a time based upon the specific light scattering and fluorescent characteristics of
each cell It is a useful scientific instrument as it provides fast objective and quantitative
recording of fluorescent signals from individual cells as well as physical separation of cells of
particular interest
The cell suspension is entrained in the center of a narrow rapidly flowing stream of liquid
The flow is arranged so that there is a large separation between cells relative to their
diameter A vibrating mechanism causes the stream of cells to break into individual droplets
The system is adjusted so that there is a low probability of more than one cell per droplet
Just before the stream breaks into droplets the flow passes through a fluorescence
measuring station where the fluorescent character of interest of each cell is measured An
electrical charging ring is placed just at the point where the stream breaks into droplets A
123
EFFORTS TO DEVELOP A BALLAST WATER DETECTING DEVICE
charge is placed on the ring based on the immediately prior fluorescence intensity
measurement and the opposite charge is trapped on the droplet as it breaks from the stream
The charged droplets then fall through an electrostatic deflection system that diverts droplets
into containers based upon their charge In some systems the charge is applied directly to
the stream and the droplet breaking off retains charge of the same sign as the stream The
stream is then returned to neutral after the droplet breaks off [ 4 ]
Applications
The technology has applications in a number of fields including molecular biology pathology
immunology plant biology and marine biology It has broad application in medicine
(especially in transplantation hematology tumor immunology and chemotherapy genetics
and sperm sorting for sex preselection) In marine biology the auto-fluorescent properties of
photosynthetic plankton can be exploited by flow cytometry in order to characterise
abundance and community structure In protein engineering flow cytometry is used in
conjunction with yeast display and bacterial display to identify cell surface-displayed protein
variants with desired properties It is also used to determine ploidy of grass carp fry [5]
Particle scanning
Traditional flow cytometers analyze thousands of cells per second acquiring basic total
fluorescence and light scattering per cell This is proportional to particle size and pigment
content
In the cytosense instruments the signals from all the detectors are not only digitized
continuously they are also stored for each particle Since the particles flow through the laser
focus in a stretched-out manner these digital profiles are actually length scans of the particle
representing the distribution of its body parts along its length axis with regard to the their light
scattering and fluorescing properties This fluid driven laser scanning of individual particles is
called silico-imaging and uses the normal flow cytometer setup combined with special data
grabber boards The optional curvature sensor adds a two-dimensional component to the
silico-images using a laser beam polarization setup only available on flow cytometers
Advantages of silico-imaging or scanning is the high acquisition rate of up to 1000 scans per
second through a USB interface and the suitability of the data format for standard flow
cytometer data analysis and fast processing of large data files Libraries of these fingerprints
allow the automatic classification and enumeration of groups and species from many data
sets as well as online warning for target (algae) species
124
BAKALAR
Cytobuoy
CytoBuoy instruments use silico-imaging as the basic data format data-extensive but highly
informative optical fingerprints obtained by fluid-driven laser scanning of individual particles
Libraries of these fingerprints allow the automatic classification and enumeration of groups
and species from large data sets as well as online warning for targeted harmful algae
species
Figure 2 Principle of screening and filing data of harmful algae [ 5 ]
To be able to take the instrument and put it inunder water the flow cytometer was completely
redesigned to be significantly smaller and modular The basic instrument which is a scanning
flow cytometer which can hold two lasers and up to ten optical detectors in a 30x45cm
cylinder of only 15KGs The instrument is fully computer programmable with the possibility to
read the data files over the internet if needed The same instrument can be placed in a
moored buoy or a high pressure submersible housing which makes it possible to do field
measurements on actual live samples (without filtering - fixatives - transportation - waiting)
anywhere and at anytime
Applications of the cytobuoy are screening of phytoplankton cultures natural samples
detection of rare species population dynamics research general phytoplankton monitoring
assessment of biodiversity bio-indicators harmful algal blooms grazing (micro)zooplankton
protection of aquaculture bathing water resource water lake restoration alarm for
herbicides invasive species control and bio-effect monitoring marine optics and lake or sea
truth for remote sensing
Conclusions
An instrument is required that combines a high level of information content and a high level of
frequency in sampling times andor space (coverage) Dynamic ecosystems require sampling
at critical scales the temporal andor spatial scales at which data must be collected in order
125
EFFORTS TO DEVELOP A BALLAST WATER DETECTING DEVICE
to resolve patterns and processes (including early warning) In practice this means the flow
cytometer could be fixed on ships underwater and on moorings and should allow a high level
of autonomous operation combined with high speed and high throughput
Figure 3 Buoy equipped for flow cytometry detection [ 5 ]
Ballast water inspectors can inspect ballast water but it is not necessary That is in
accordance with Ballast Water Convention Inspectorate has to pay stoppage expenses if the
analyses were negative A fast analysis method combined with increased fines would
diminish any possibility of non-compliant work
The fast and quantitative diagnostic capabilities of the flow cytometers may be of great help
for the fast screening of ballast water by generating countings and accurate size spectra for
sediment particles phytoplankton and other groups of particles This can be used to monitor
the efficiency of selected treatment schemes for organisms or even serve as a feedback
mechanism to actively control treatment performance [6]
126
BAKALAR
REFERENCES
1 httpwwwspringerlinkcomcontent5wr78nck7m01vheu
2 httpenwikipediaorgwikiFilePicoplancton_cytometriejpg
3 httpenwikipediaorgwikiFlow_cytometry
4 wwwcytobuoycom
5 httpwwwcytobuoycomapplicationsaquaticsciencephp
6 httpwwwcytobuoycomproductscytobuoy_flow_cytometerphp
127
BALLAST WATER MANAGEMENT SYSTEMS
A Portable Sensitive Plankton Viability Assay
for IMO Shipboard Ballast Water Compliance Testing
Nick Welschmeyer1 Brian Maurer
Abstract
One of the most difficult aspects of implementing ballast water regulatory compliance is field
verification testing of ballast treatment systems to validate proper biological inactivation efficacy
Whether tests are to be carried out by regulatory personnel as an enforcement tool or by ship crew
members as a process verification tool a rapid simple accurate test that can be performed onboard
ship with a minimum amount of effort is needed
A rapid method for estimating living planktonic biomass based on the quantitative enzymatic
transformation of fluorescein diacetate (FDA) into its fluorescent product fluorescein has been
developed for use in ballast water compliance testing FDA has been utilized as a cell-specific tag for
cellular viability for almost five decades (Rotman and Papermaster 1966) and is now a recommended
procedure in US EPAETV ballast water testing protocol However the technique has been criticized
often for the apparent cellular efflux of fluorescein which results in rapid optical fading of fluorescently
labeled lsquolivingrsquo cells We completed a flow cytometric analysis of the time-based cell-specific
fluorescent labeling properties of FDA in phytoplankton clearly identifying the rapid influxefflux kinetics
of its fluorescent product Simultaneous temporal measurements of the extracellular medium revealed
a linear quantitative increase in bulk fluid fluorescence that can be used as a sensitive analytical
estimate of lsquolivingrsquo biomass That is the production rate of extracellular fluorescein is quantitatively
proportional to total living biomass in contrast killed cells produce no fluorescent product Assay
conditions including quantitative temperature effects specific incubation buffers (that prevent abiotic
conversion of FDA to fluorescein) and reaction termination techniques were developed Tests can be
completed in less than one hour with portable equipment (hand-held battery-operated fluorometer)
and modest technical training if desired samples can be terminated and stored for analysis at a later
time
The assay reagents were developed specifically to minimize lsquofalse positivesrsquo and to allow accurate
assay of ballast water ranging in salinity from 0-35 PSU The resultingmbulk fluorescence assay
provides estimates of living biomass with sensitivity comparable to ATP analyses without many of the
drawbacks associated with ATP testing The sensitivity is such that the regulated ballast water
organism size class 10-50 microm (100 mL sample) can be tested for lsquogross exceedancersquo compliance
1 Moss Landing Marine Laboratories Moss Landing California 95039 USA and Golden Bear Facility (GBF)
California Maritime Academy Vallejo California 94590 USA
email welschmeyermlmlcalstateedu
128
WELSCHMEYER AND MAURER
criteria in less than 15 minutes When executed with larger volumes (1 L) at elevated temperatures
(30 C) and longer incubations (2h) the method can detect living biomass at levels lower than current
IMO regulatory tolerance levels for example less than 10 live cellsmL (10 microm equivalent spherical
diameter) The FDA bulk viability assay was executed successfully onboard the training ship Golden
Bear (California Maritime Academy) in real-time ballast tests in Busan S Korea Kobe Japan Guam
USA and San Francisco Bay USA
This method has the potential to solve the problems currently associated with compliance and process
control testing carried out onboard ship The speed sensitivity simplicity and economics of the new
method will make it a useful tool for those interested in verifying the function of ballast water treatment
systems
1 Introduction
The discharge of shipsrsquo ballast water is considered the primary vector in the spread of aquatic
invasive species The maritime industry and international federal and state agencies have
made significant efforts to foster the development of commercial ballast treatment systems
that will remove or inactivate planktonic organisms from ballast water for the purpose of
abating the aquatic invasive species problem Unfortunately existing regulations such as
IMO D-2 require exhaustive analytical procedures to verify biological inactivation efficiency of
treatment systems relative to regulatory performance standards The labor time and
workforce required to fully substantiate successful adherence to ballast performance
standards precludes such exhaustive tests for routine ship inspections
At this time there is a need for a simple rapid analysis of plankton viability for the purpose of
ballast treatment verification through Port State Control either at the dock or onboard ship
Moreover such a method should be available to shipsrsquo crews so that non-technical personnel
can easily verify ballast treatment performance during routine shipboard ballasting operations
A rapid portable viability assay is described here that provides single-step analytical
determination of ballast compliance in less than one hour The method breaks from the
conventional tedious determination of numeric live counts (microscopycytometry) and utilizes
a bulk quantitative fluorescence determination of total viable biomass based on the universal
enzymatic conversion of fluorescein diacetate (FDA) to its fluorescent product fluorescein
2 Fluorescein Diacetate as Bulk Indicator of Viable Biomass
FDA has a long history of use as a visual marker for cell-specific determination of viability
(Rotman and Papermaster 1966) FDA is a non-fluorescent compound which when
hydrolyzed by biological enzyme activity yields fluorescein a highly fluorescent compound
that clearly marks lsquoliversquo cells with optically-induced green fluorescent emission (Figure 1)
129
A PORTABLE SENSITIVE PLANKTON VIABILITY ASSAY
Figure 1 Simplified summary of the use of fluorescein diacetate (FDA) as a tag
for viable organism metabolism esterase activity is present in all living
organisms and is rapidly lost upon cell death
FDA cell-specific viability analysis is commonly quantified by numeric counts made either by
epifluorescence microscopy or flow cytometry (Dorsey et al 1989 Brussaard et al 2001
Garvey et al 2007) It should be understood however that the FDA technique is not a
staining procedure per se (eg the reaction product fluorescein) is not chemically bound to
specific targets within the cell FDA and fluorescein readily pass diffusively through cell
membranes making the loading of FDA into the interior of cell tissue a simple task in aqueous
cellular suspensions Unfortunately the subsequent efflux of fluorescein out of the cellrsquos
interior results in rapid fading of the optical cellular signature FDA cell-specific viability
assays have been criticized often for this apparent inconvenience which requires immediate
numerical analysis and offers no opportunity for storage of samples for later analysis (Garvey
et al 2007) As a result chemical variants of FDA utilizing larger molecular moieties of
fluorescein such as chloro-methoxy fluorescein diacetate (CMFDA) and Calcein AM
(Invitrogen Inc) have been developed these larger molecules extend the period of optical
recognition
In contrast to the classic internal cell-specific application of FDA in viability assays described
above a few reports have described the use of FDA as a bulk indicator of viable cell biomass
in this case based on simple fluorometric analysis of the extracellular bulk fluid in which the
cellular material is suspended This procedure has been described for use with soil samples
130
WELSCHMEYER AND MAURER
leaf litter and industrial cell slurries (Breeuwer et al 1995) Generally the bulk approaches
have enjoyed limited application due to a) well known non-biological conversion of FDA into
fluorescein in the extracellular media (Clarke et al 2001) and 2) uncertainties in the relation
between fluorescein production and viable biomass concentrations per se (Breeuwer et al
1995)
In the present work we re-examine the extra-cellular bulk analysis of FDA-derived fluorescein
for the purpose of quantitatively and rapidly determining viable biomass of ballast water
organisms We have converted the FDA methodology into a bulk assay that yields simple
cuvet-based fluorometric readings this is ideal for ballast water testing Reagent mixtures
were developed to accommodate the wide range of salinities that can characterize ballast
water organisms (eg 0-35 PSU) Reagents were developed to prevent non-biological
conversion of FDA to fluorescein thus reducing the possibility of a lsquofalse-positiversquo indication of
viable cells The protocol was optimized to yield the highest sensitivity in the shortest period
of time Our plan was to devise a relatively fool-proof method that can be executed reliably in
the field with minimum technical training yet still provide the sensitivity to detect undesirable
living planktonic biomass in ballast water at low levels commensurate with ballast water
performance standards
3 Methodology
Biological samples Both cultured phytoplankton and natural plankton assemblages were
used to generate FDA viability response and to determine the cellular densities required to
elicit adequate analytical sensitivity Phytoplankton cultures were obtained from collections
that have been maintained by Drs GJ Smith and N Welschmeyer for years at Moss
Landing Marine Laboratories The cultures were grown in F2 enriched seawater (marine
organisms) or enriched freshwater media (Algo-Gro Carolina Biological Inc) in temperature
controlled incubators with 12h12h darklight cycles under fluorescent irradiance (18degC)
Cultures were also maintained on a north-facing windowsill at room temperature subject to
seasonal changes in day length Natural plankton were sampled from Moss Landing Harbor
a shallow turbid marine harbor environment and also from open water in Monterey Bay CA
accessed through cruises aboard the research vessel POINT SUR
Instrumentation A high sensitivity Spex Fluoromax 2 spectrofluorometer was used determine
excitationemission spectral characteristics of FDA derived fluorescein The same instrument
was used in non-scanning mode at optimized excitationemission wavelengths to provide the
most sensitive fluorescence response when biological samples were diluted to their weakest
concentrations (eg less than IMO D-2 performance concentrations for organisms 10-50 μm
in size) At our request a Turner Designs hand-held battery-operated fluorometer
131
A PORTABLE SENSITIVE PLANKTON VIABILITY ASSAY
(Aquafluortrade) was modified by the manufacturer to yield optimized response sensitivity to
aqueous solutions of fluorescein This includes a change in LED excitation source exem
filters and circuit board power characteristics this resulted in a portable fluorescein
fluorometer that was roughly fifteen-fold more sensitive to fluorescein than the standard off-
the-shelf configuration
Cellular densities of cultured phytoplankton were measured by flow cytometry on either a
Becton Dickinson FACScan cytometer or an Accuri C-6 cytometer each calibrated for flow
rates using BD Accumax calibration beads Organism size characteristics were determined
microscopically on a Zeiss Standard epifluorescence microscope
Reagents All reagents used in this study were obtained from readily available chemical
sources however specific mixtures treatments and concentrations remain proprietary
Briefly an aqueous incubation buffer with organic modifiers was developed that 1) promotes
FDA enzymatic hydrolysis by all single-celled organisms regardless of the original salinity of
their natural waters (0-35 PSU) and 2) prevents undesired non-biological degradation of
FDA to fluorescein in the absence of viable biota a problem which yields high blanks and
false detection of viable cells FDA in DMSO was administered in 10 μL quantities to yield
final FDA concentrations in incubation buffers of 10 μM Generally organisms were harvested
onto appropriate filters the filters were incubated in the appropriate buffer and fluorescence
was determined in the incubation fluid after removal of the filter and gentle mixing
4 Results
Intracellular and Extracellular Fluorescence Derived From FDA
Time-based studies were initiated to define the time scales and fate of fluorescence derived
from FDA-labeling of live phytoplankton cells Flow cytometry was used to quantify the
intensity of intracellular fluorescence that accumulates (and fades) after FDA inoculation At
least 2000 cells were analyzed at each time-point to capture individual cellular levels of
green fluorescence over the course of approximately one hour The population mean
fluorescence was computed for each time-point yielding the temporal changes in average
fluorescencecell (Figure 2) Parallel measurements of the same sample were made
simultaneously over the same time period in a conventional cuvet-based fluorometer (Spex
Fluoromax 2) so that total fluorescence of the suspension could be monitored At the end of
the observation period the cells were removed by centrifugation and the extracellular fluid
was measured for fluorescence
The results in Figure 2 give an example of the FDA labeling characteristics generally found
for all samples analyzed The intracellular fluorescence rose quickly after FDA inoculation
132
WELSCHMEYER AND MAURER
and for the diatom Thalassiosira sp peaked at approximately 5 minutes (Figure 2) There
was a slow but continuous drop in fluorescencecell that eventually approached the initial
time-zero level of fluorescence All species tested showed the same trend with maximum
fluorescence found somewhere between 4-20 minutes Interestingly even though the cellular
fluorescence was adequately bright for cytometric detection the total fluorescence of the
algal suspension was dominated entirely by extracellular fluorescence That is removal of the
cells by centrifugation resulted in less than 1 reduction in the measured fluorescence of the
fluid in the cuvet
As seen in Figure 2 the resultant extracellular fluid fluorescence rose linearly over the time
course of the experiment The results suggested that a predictable analytical production rate
of fluorescein was evident in each experiment (eg the live cells exhibit a constant rate of
fluorescein production) and at the FDA final concentrations used here (10 μM) the
extracellular fluid fluorescence could be predicted over the course of at least one hour in this
experiment and over two hours in corroborative experiments
Figure 2 Time series of FDA derived fluorescence measured intracellularly (w
flow cytometry) and extracellularly (w conventional cuvet fluorometry) with living
suspensions of the diatom Thalassiosira sp Note that the fluorescence
response of both instruments are not directly comparable (relative units)
133
A PORTABLE SENSITIVE PLANKTON VIABILITY ASSAY
FDA-derived fluorescence as a function of lsquoliversquo biomass
Experiments were conducted to test the fluorescence response of cell suspensions to relative
biomass loading under conditions of constant incubation conditions (eg identical
temperature FDA concentration and incubation time) The biomass levels were controlled by
quantitative volumetric filtration of sample suspensions (cultures or natural seawater) onto
filters of appropriate pore size As shown in Figure 3 under equivalent FDA substrate
concentrations the production of fluorescein was proportional to loaded biomass Figure 3
shows experimental results for laboratory algal cultures and natural samples from Moss
Landing Harbor CA which were size-fractionated into the lt10 μm and 10-50 μm size classes
A linear relationship between fluorescein production and viable biomass was clearly evident
the FDA response of natural plankton communities could be assessed with filtration of as little
as 100 mL The biomass-dependent yield of FDA-derived fluorescence has been observed
for all experiments to date and constitutes the fundamental quantitative premise of the
analytical method described here
Figure 3 FDA-derived fluorescence as a function biomass Relative biomass loading was
controlled by quantitative volumetric filtration on appropriate pore size filters lt10um
fractions captured on GFF filters nylon 10 and 50um filters were cut from sheets of
Nitex screen
134
WELSCHMEYER AND MAURER
Figure 3 cont
FDA response in live and dead organisms
Side-by-side samples of live and dead organisms killed by a variety of methods commonly
utilized in ballast water treatment technology but reduced to bench-scale operation were
analyzed using the bulk FDA incubation technique In each case the original sample of algal
culture was split into two aliquots the untreated sample was measured for lsquoliversquo FDA
response the remaining treated sample was subjected to the kill-process and analyzed within
one hour of the treatment (ie a nominal 24 hour hold time as in ballast treatment protocol
was not utilized) The results in Fig 4 show that all kill factors produced significant
depressions in FDA response relative to the corresponding live aliquot at times by as much
as 2 orders of magnitude (Fig 4)
Figure 4 FDA bulk viability response in live phytoplankton relative to lsquokilledrsquo treatment
samples Method of kill is listed for each sample pair untreated (lsquoliversquo) sample responses
were normalized to 10 for comparison The Ratio of live fluorescence to dead
fluorescence is noted for each logical pair of samples
135
A PORTABLE SENSITIVE PLANKTON VIABILITY ASSAY
Temperature effects on FDA response
The enzymatic hydrolysis of FDA to fluorescein is expected to be temperature dependent due
to the catalytic enzyme activity of the living biological systems that are being tested The
temperature effect was quantified using three temperature controlled water baths set at 10
20 and 30degC The incubators were used to incubate replicate aliquots of the prasinophyte
Tetraselmis sp aliquots were identical in volume and derived from the same culture
originally grown at 20degC Figure 5 shows the resulting linear Arrhenius plot with a calculated
Q10 of 205 (eg a 10degC increase in temperature yields a two-fold increase in fluorescence
signal all other factors held constant)
Figure 5 Standard Arrhenius plot (inverse temperature (Kelvin) vs natural
logarithm of reaction response) showing expected temperature-dependent
linearity with a Q10 of 205
Simplified rapid execution of the bulk FDA viability assay
Our overall objective was to develop a rapid portable and sensitive viability assay for
quantitative ballast water testing Given the results summarized above we combined a series
of steps summarized in Figures 6 and 7 to yield an example protocol that stresses
experimental simplicity for use onboard ship For instance Figure 6 shows the convenient
preparation of samples when only the 10-50 μm size class is tested In this case small
sample volumes (lt500 mL) can be pre-screened through 50 μm mesh and gravity-filtered
136
WELSCHMEYER AND MAURER
Figure 6 Example operation of FDA bulk viability assay for 10-50 μM organisms
(see text)
onto a 10 μm final filter (eliminating the need for vacuum filtration) The nylon 10 μm filter
yields minimum seawater retention (a cause of high blanks) and produces a final cuvet
solution with no filter pulp (eg optical clarity) filtrationcentrifugation is not required for clean
fluorescence readings Figure 7 shows the use of hypochlorite as a logical lsquokilled blankrsquo We
found that a 15 minute exposure of sample water to 60ppm hypochlorite produces a killed
sample that captures all the appropriate features of an analytical blank that is the killed blank
cuvet contains the organisms sample filter incubation reagent and FDA thus mimicking the
sample cuvet exactly Figure 7 shows that with a high-sensitivity fluorometer a 100 mL
sample after 15 minutes of incubation produces a signalblank reading of approximately 30
Thus as an example of a possible rapid test strategy a treated ballast water sample might be
judged to be in lsquogross exceedancersquo of regulations on the basis of its signal relative to a killed
blank
From rapid compliance assay to full-scale treatment testing
The results presented above have focused on rapid simple compliance testing It should be
clear however that with appropriate choices in filters sample volumes and FDA incubation
conditions the rapid method can be expanded into a full scale test Figure 8 shows results
recently acquired on TS Golden Bear (Golden Bear Facility Calif (GBF)) while completing
137
A PORTABLE SENSITIVE PLANKTON VIABILITY ASSAY full-scale shipboard testing of the Balpure electrochlorinationfiltration treatment system (now
Type Approved) in Kobe Japan
Figure 7 Rapid FDA bulk viability assay comparing lsquoliversquo harbor water to
complementary blank samples killed with reagent grade hypochlorite Signal to noise
is evaluated as signalblank based on observed fluorescence (see text) A
successfully-treated ballast water sample of equivalent volume would expected to
produce a signal at or near the killed blank level the resultant SN could be used as
an indicator of gross exceedance relative to ballast performance standards
Figure 8 The rapid FDA bulk viability assay applied to all regulated organism size
classes during full-scale shipboard ballast treatment testing in Kobe Japan aboard
TS Golden Bear (see text)
138
WELSCHMEYER AND MAURER
Samples were collected in integrated continuous fashion during all three ballasting cycles
(uptake control and treatment) each cycle yielded triplicate integrated samples collected
over a two hour period Samples were size fractionated appropriately again in triplicate
processed with FDA and incubated for two hours at room temperature The fluorescence
responses were normalized to the volume filtered and plotted as a function of regulatory size
fractions (lt10 10-50 and gt50 μm) for each of the ballast cycles (Figure 8) Note not
surprisingly that the largest viable biomass levels are contained in the microbial size fraction
lt10 μm Most importantly the FDA bulk viability assay demonstrated that all regulated size
classes showed remarkable inactivationremoval by the ballast water treatment system
(treatment data are plotted in the figure though the responses were so low that they are
hidden within the x-axis) This finding was corroborated by all the labor-intensive numeric
counting procedures required for successful full-scale IMO testing made at the same time
Thus the entire suite of regulated organisms was tested using a single methodology the bulk
FDA assay the full exercise (filtration incubation and instrument measurement) could be
completed in three hours
5 Discussion
A rapid bulk viability assay based on FDA is introduced here The method utilizes concepts
outlined in the original cell-specific application of FDA as a viability tag but here the lsquoleakyrsquo
nature of FDA is exploited to yield a simple cuvet-based fluorescence assay that produces a
signal that is directly proportional to living biomass Thus tedious numerical counting is
eliminated Side-by-side comparisons (data not shown) showed the FDA response to be
comparable in sensitivity to ATP analyses (boiling Tris extraction Karl 1993) the FDA
method however is significantly simpler The magnitude of the FDA fluorescent signal can
be controlled by 1) volume filtered 2) incubation temperature and 3) incubation time The
nature of the sample can also be controlled by choice of filter pore size For the purpose of
speed and simplicity we focused on the 10-50 μm size class Organisms in this size class
can be measured with adequate sensitivity using conveniently small volumes (lt500 mL)
furthermore because the pore size of the capture filter (10 μm) is relatively coarse sample
processing procedures are streamlined analysis time is reduced optical interference is
minimized and instrumentation is minimal The resulting portable method can easily be
executed onboard ship with relatively little technical training and no formal laboratory
provisions
The purpose of this paper was to introduce the bulk FDA viability assay as a promising
indirect measurement for ballast water compliance testing A discussion of the quantitative
analytical aspect of the bulk FDA measurement per se and its exact relation to specific
ballast regulations is beyond the scope of this paper Briefly however it is clear that this new
rapid method based on viable biomass response will need correlations to regulatory
139
A PORTABLE SENSITIVE PLANKTON VIABILITY ASSAY
numerical limits (eg IMO D-2 USCG P-1) That work is underway now with empirical
confirmation of fluorescein mass production rates (traceable to NIST standards) and their
expected relations to lab-reared organisms of known cell size (Coulter-measured equivalent
spherical diameter) A relation of fluorescein produced per biovolume living organism under
standard incubation conditions will allow us to estimate the equivalent numeric density of
living cells of any size given a simple measurement of FDA-derived fluorescein production
This will set the appropriate scales and error limits for rational ballast water compliance
testing relative to extant ballast water performance standards The convenience and
sensitivity of the FDA bulk viability measurement may raise the question of whether current
numeric standards are logistically the most appropriate regulatory metric for ballast water
management
REFERENCES
Rotman B and B W Papermaster (1966) Membrane properties of living mammalian cells as studied
by enzymatic hydrolysis of fluorogenic esters Proc Nat Acad Sci 55 134-141
Breeuwer P J L Drocourt N Bunschoten M H Zwietering F M Rombouts and T Abee (1995)
Characterization of uptake and hydrolysis of fluorescein diacetate and carboxyfluorescein diacetate by
intracellular esterases in Saccharomyces cerevisiae which result in accumulation of fluorescent
product Appl Environ Microbiol 61 1614-1619
Brussaard CPD D Marie R Thyrhaug and G Bratbak (2001) Flow cytometric analysis of
phytoplankton viability following viral infection Aquatic Microbial Ecology 26157-166
Clarke JM MR Gillings N Altavilla and AJ Beattie (2001) Potential problems with fluorescein
diacetate assays of cell viability when testing natural products for antimicrobial activity J
Microbiological Methods 46261-267 15
Dobroski N C Scianni D Gehringer and M Falkner (2009) Assessment of the efficacy availability
and environmental impacts of ballast water treatment systems for use in California waters Prepared for
the California State Legislature California State Lands Commission 173p
Dorsey J C M Yentsch S Mayo and C McKenna (1989) Rapid analytical technique for the
assessment of cell metabolic activity in marine microalgae Cytometry 10 622-628
Garvey M B Moriceau and U Passow (2007) Applicability of the FDA assay to determine the
viability of marine phytoplankton under different environmental conditions Mar Ecol Prog Ser 352
17-26
Karl D M (1993) Total microbial biomass estimation derived from the measurement of particulate
adenosine-5-triphosphate In P F Kemp B F Sherr E B Sherr and J J Cole (Eds) Current
methods in aquatic microbial ecology pp 359-368 Lewis Publishers Boca Raton Florida
141
BALLAST WATER MANAGEMENT SYSTEMS
(Finalized) Methodology for Risk Assessment of
Active Substances under Procedure (G9)
Jan Linders1
Abstract
After some years of experience and the more recent knowledge on the submission of Ballast Water
Management Systems (BWMS) the GESAMP-Ballast Water Working Group (GESAMP-BWWG) has
further developed its methodology to evaluate the BWMS to avoid unreasonable risks for the
environment human health and for the shipsrsquo safety The latest proposals on the methodology have
been established in so-called stock-taking workshops These proposals will be sent to the joint Group
of Experts on the Scientific Aspects of Marine Protection (GESAMP) and to the Marine Environmental
Protection Committee for adoption at their next meetings After its adoption the methodology will be
used in the evaluation process of BWMS in the future The methodology is considered to be a living
document that will be updated if necessary and will be based on developments of the submission of
BWMS within the framework of the Ballast Water Management Convention Models have been
developed for the estimation of the Predicted Environmental Concentrations (PEC) in the marine
environment The model is called MAMPEC-BW 30 and is especially developed for ballast water
although originally crafted for antifouling products The new model will be used for the estimation of
potential effects on humans and the environment This paper deals with the final proposals in the
development of the methodology and will focus on risk assessment The purpose is the protection of
the worldrsquos oceans and coastal areas from bio-invasion ensuring at the same time that ballast water
management practices used to comply with the Convention do not cause greater harm that they
prevent
1 Introduction
In 2004 the Ballast Water Management Convention (BWMC) was adopted which would
oblige ships to treat their ballast water preventing the discharge of ballast water containing
harmful organisms that could cause bio-invasion in the area of discharge Treatment of
ballast water can be carried out using certain chemicals Therefore a guideline (G9) became
part of the BWMC regulating that the discharge of treated ballast water using chemicals
should occur without any harmful effects to the ship its crew humans and the environment
1 Chairman of GESAMP-BWWG P Pieckweg 8 NL-3828 PR Hoogland The Netherlands
Tel +31334554567 e-mail Janfamilielindersnl
142
LINDERS
To provide advice on the effects of ballast water management systems (BWMS) using active
substances with respect to these subjects at risk a technical group (the GESAMP-BWWG)
was established After about five years of experience this working group has further
developed its methodology on the conduct of work to prepare advice to the Marine
Environmental Protection Committee (MEPC) taking into account the knowledge gained
evaluating approximately 60 BWMS The proposed methodology addressed in this document
focuses on the exposure of aquatic organisms
2 Evaluation of BWMs
The GESAMP-BWWG evaluates the BWMS with respect to several topics 1) the risk of
discharge of ballast water to the receiving environment (aquatic organisms) 2) the risk to the
people that work with ballast water management systems because of their profession (crew
and port state control) 3) the risk to the public at large that may recreate in waters or eat
contaminated seafood harvested where ships discharge ballast water and 4) risks to the ship
itself (eg corrosion)
The process of risk assessment for chemicals is well developed As many countries have to
make decisions about the registration of chemicals intended for the control of harmful pests
and diseases (eg pesticides and biocides) and also as they must make decisions about
putting industrial chemicals on the market the risk assessment management tool is used
The basic principles of this process are also adopted by the GESAMP-BWWG to evaluate the
risks of discharge ballast water The applicant provides a dossier to the regulating authorities
in this case to IMO and MEPC containing information on the substance and its use
including data on the identity (physic-chemical properties) the fate and behavior (sorption
and degradation) and potential toxic effects (human toxicology and ecotoxicology) First the
data are evaluated with respect to quality and whether the data are generated using generally
accepted methods (eg OECD-guidelines) Only scientifically justified data are accepted for
further use in the risk assessment Some data are used for the estimation of potential
concentrations in the environment mdash the environmental exposure assessment The final
result of this evaluation is the predicted environmental concentrations (PEC) Often use is
made of mathematical models to describe the behavior of the substance in the environment
based on typical information such as the octanol water partition coefficient the sorption
capacity to soil or sediment and the abiotic or biotic degradation potential of the substance
(eg half-life in water or soil) In the hazard assessment the effect data are used for the
estimation of safe levels of the substance in the environment or for humans The (eco)toxicity
data include acute and chronic endpoints Using safety factors to account for required safety
and uncertainty in the data a safe level is estimated resulting in a predicted no-effect
concentration (PNEC) for the environment or a derived no-effect level (DNEL) for human
143
(FINALIZED) METHODOLOGY FOR RISK ASSESSMENT OF ACTIVE SUBSTANCES
exposure Finally the results of the exposure assessment and the hazard assessment are
compared to each other using a risk characterization ratio (RCR) The value of the CRC
defines whether or not a potential risk may be expected for the topic under consideration In
the case that risk cannot be excluded a further in-depth assessment may be needed
3 Risk Assessment Tools for BWMs
In order to perform the approach outlined in Section 2 the GESAMP-BWWG has developed a
methodology on the conduct of work The proposed methodology has been forwarded to
MEPC for comments suggestions and adoption The focus of the new methodology has been
on 1) the development of a database for the most commonly occurring disinfection
byproducts (DBP) generated during the BWMS operation 2) the model development and
scenario description to calculate the PEC in a standardized harbor environment and 3) the
definition and analysis of the unit operations for crew and port state control in the handling of
BWMS
31 Database
Especially if electrolysis of seawater is the main disinfection process which is the case in the
majority of the BWMS currently evaluated a huge number of DBP may be formed of which
trihalomethanes (THM) and haloacetic acids (HAA) are the most important A list of 18 DBP
have been prepared that contain those occurring most frequently and in the highest
concentrations The physico-chemical properties and the fate and effect data have been
incorporated in the database for further use in the risk assessment
The database serves two primary goals 1) to ensure that for all substances included in the
database the same physic-chemical data and effect data are used in the risk assessment for
these substances independent of the BWMS in which they occur (providing consistency
between the substances and systems evaluated) and 2) the main DBP currently identified in
BWMS happen to be quite well-known rather simple organic compounds For many of them
risk assessments have been carried out by other institutions including those in the USA and
EU but also by non-governmental gremia like WHO Therefore the GESAMP-BWWG and
IMO face the submission of data in manifold as each applicant will provide the data available
in public literature on for instance the substance bromoform Once a substance has been
included in the database no publicly available data will no longer need to be submitted with
the dossier for Basic and Final Approval
The currently proposed list of DBP contains the substances as indicated in Table 1
The waiving of data is restricted to information on these substances that may be found in
scientific literature and in risk assessment documents carried out by national or international
144
LINDERS
bodies that generally also have carried out an evaluation of the quality of the data based on
established criteria like standard test guidelines (OECD) GLP etc It should be recognized
that data required for the functioning of the BWMS like the whole effluent toxicity (WET) test
and the chemical analysis of treated ballast water can never be waived and are exempted
from this waiving process
Table 1 DBP in database
Substance Substance
1 sodium bromate 10 dibromoacetic acid
2 potassium bromate 11 tribromoacetic acid
3 Bromoform 12 monochloroacetic acid
4 Chloroform 13 dichloroacetic acid
5 dibromochloromethane 14 trichloroacetic acid
6 dichlorobromomethane 15 bromochloroacetic acid
7 sodium hypochlorite 16 monochloroamine
8 sodium thiosulphate 17 trichloropropane
9 monobromoacetic acid 18 dibromoacetonitrile
32 MAMPEC
As the model to be used for the calculation of the PEC the GESAMP-BWWG adopted the
MAMPEC-model as the most suitable model currently available In the model a specific
scenario has been defined describing the harbor environment and an emission scenario for
the discharge of ballast water In the harbor scenario the most relevant parameters are
defined as pH temperature particulate organic matter dimensions of the port and exchange
volume with the surroundings The harbor scenario is given in Table 2 where the relevant
parameters that define the harbor are presented including the exchange volume with the
shipping lane or the open sea
The emission scenario defines the amount of ballast water discharged each day A value of
E+5 m3d was chosen as a representative worst case discharge of ballast water in the
recipient environment The multiplication of the discharged ballast water and the measured
concentration of a substance in the discharged ballast water as given in the dossier of the
applicant yields the total load of the substance in the recipient harbor
145
(FINALIZED) METHODOLOGY FOR RISK ASSESSMENT OF ACTIVE SUBSTANCES
The result of the MAMPEC calculation is the yearly average and median concentration of the
substance under consideration its maximum minimum and its 95th-percentile As a worst-
case situation the maximum value is currently used for the evaluation The MAMPEC-BW
version 30 has been specifically developed for the GESAMP-BWWG For the human
exposure scenario the MAMPEC results may be used as well for the estimation of the
exposure to the general public
Table 2 Standard harbor scenario
Parameter Value Unit Parameter Value Unit
Tidal period 1241 m3
Width y1 1000 m
Tidal difference 15 m Width y2 500 m
Tidal density
difference
04 kg m-3
Depth 15 m
Water level change 0 m Mouth width x3 1000 m
Flow velocity 1 m s-1
Latitude 50 NH
SPM concentration 35 mg L-1
Depth mixed sediment
layer
02 m
POC concentration 1 mg L-1
Sediment density 1000 kg m-3
DOC concentration 2 mg L-1
Degradation rate om 0 d-1
Chlorophyll 3 microg L-1
Net sedimentation
velocity
1 m d
-1
Salinity 34 psu Fraction om in sediment 2852E2 -
Temperature 15 ordmC Depth in harbor entrance 15 m
pH 8 -
Exchange area harbor
mouth
15000 m
2
Length x1 5000 m Tidal exchange 2432E7 m3
Length x2 5000 m Tidal exchange 3243
34 The Near Sea Scenario
The Group considered that also for the area around the ship where the actual discharge
takes place a situation of higher risk may occur Therefore a near sea scenario has been
defined as well taking an additional dilution factor of 5 into account for the short-term
exposure of aquatic species The following equation gives the calculation of the exposure
concentration for aquatic organisms and general public in the near sea situation
146
LINDERS
where
Cmax = the maximum concentration due to near sea exposure (microgL)
Cbw = the concentration in the ballast water (microgL)
S = dilution factor the proposed default value is 5
Cmean = the calculated mean concentration with MAMPEC (microgL)
The general public may be exposed by oral intake dermal uptake and inhalation of
discharged ballast water during swimming in contaminated areas and additionally oral
exposure takes place during consumption of fish caught in these contaminated areas
35 Assessment Factors
Whilst in the area of exposure a Predicted Environmental Concentration (PEC) is needed to
perform the risk assessment and a Predicted No-Effect Concentration (PNEC) is needed in
the area of effects of substances in the environment The derived PNEC-value is defined as
the concentration to which an ecosystem may be exposed without negative effects to the
populations of organisms in the ecosystem To establish a meaningful PNEC that is
comparable with the PEC it should be derived based on sound scientific principles Several
methods have been described in the scientific literature and the method adopted by
GESAMP-BWWG has been based on the principles used by USEPA and EU in their risk
assessment reports Based on the amount and quality of the data of a specific substance an
overall assessment factor is assigned
The value of the assessment factor depends on the type of effect acute or chronic For
environmental effects no effects on the individual organism are considered only the potential
effects on the population are considered relevant In the case of DBP and the evaluation of
BWMS the Group decided that the relevance of sediment toxicity was not significant as all
DBP considered have a low lipophilicity and therefore do not adsorb to the sediment
Toxicity for sediment organisms was considered unlikely If the Group came across
substances with high lipophilicity also a risk assessment would be needed and standard
assessment techniques should be used Normally for a hazard evaluation for aquatic
organisms a set of three toxicity tests would be required for algae crustaceans and fish both
for acute and chronic toxicity Even for the well-known DBP a complete set of toxicity data is
often not available To arrive at a PNEC based on a complete or incomplete data set the
table of assessment factors is used as given in table 3
147
(FINALIZED) METHODOLOGY FOR RISK ASSESSMENT OF ACTIVE SUBSTANCES
Table 3 Assessment factors
Data set Assessment factor
PNEC general PNEC near sea
Lowest short-term L(E)C50 from freshwater or marine species representing one or two trophic levels
10000 1000
Lowest short-term L(E)C50 from three freshwater or marine species representing three trophic levels
1000 100
Lowest short-term L(E)C50 from three freshwater or marine species representing three trophic levels + at least two short-term L(E)C50 from additional marine taxonomic groups
100 10
Lowest chronic NOEC from one freshwater or marine species representing one trophic level but not including micro-algae
100 -
Lowest chronic NOEC from two freshwater or marine species representing two trophic levels which may include micro-algae
50 -
Lowest chronic NOEC from three freshwater or marine species representing three trophic levels which may include micro-algae
10 -
36 Human Exposure Scenario
For the estimation of the risk to the crew and port state control MAMPEC is not suitable as
exposure may take place during handling of the chemicals used in the BWMS or during
operation of the BWMS The possibilities of exposure are defined in the unit operations
involved in the BWMS These unit operations have to be defined for each individual BWMS
as the specific circumstances may change from one system to another The number of
exposure events and the amount occurring have been estimated for a worst-case and a
realistic case As an example for human exposure sampling of ballast water tanks may result
in dermal and inhalation exposure at a frequency of 2 hours per day and 5 days per week for
acute exposure and an additional assumption of 45 weeks per year would represent chronic
exposure
148
LINDERS
4 Conclusions
The methodology of GESAMP-BWWG has been further developed during a series of three
stock-taking workshops to which additional experts have been invited on specific topics like
the model development and the human exposure scenario development The Group
considered the current methodology quite complete and more or less in place Therefore the
time has arrived to request partiesrsquo suggestions and criticism on the proposals The
methodology should be considered a living document to which new information may be added
or items changed if scientific developments indicate the need In addition the methodology
has to be tested in practice Changes have been performed taking into account current
experience and knowledge which is based on the major use of disinfection by electrolysis of
seawater and the production of DBP If other substances are proposed as active substances
changes or other concepts must be developed and used to perform an acceptable risk
assessment for those cases Nevertheless the main principles of risk assessment exposure
assessment hazard assessment and risk characterization will be kept as the basic
keystones
Potential areas for further development of the methodology may include the evaluation of key
model parameters like the tidal exchange volume of water in the harbor the temperature in
the harbor in relation to the temperature at which degradation of the substance has been
determined and a correction factor that may be needed to account for temperature
differences An important area of research could be the necessity for a second or higher tier
assessment in the event that the worst-case scenario leads to unacceptable risk Also the
occurrence of many other possible DBP should be further assessed Literature sources have
shown that over 600 different substances have been analyzed in all kinds of disinfection
processes It remains to be seen whether applicants have to search more thoroughly for more
DBP Finally the potential exposure to substances showing carcinogenicity mutagenicity and
reproductive toxicity (so-called CMR-substances) should be further analyzed as some of the
DBP have such classifications
To answer the questions posed in these potential areas of concern stock-taking workshops
will be held on a yearly basis and successively the group will discuss possible solutions with
invited experts in the field The final aim of controlling the world-wide spread of invasive
aquatic species may require additional scientific input to gain more insight in the area of
ballast water management and advance the protection of the worldrsquos oceans and coastal
areas from bio-invasion at the same time ensuring that ballast water management practices
used to comply with the Convention do not cause greater harm that they prevent
149
(FINALIZED) METHODOLOGY FOR RISK ASSESSMENT OF ACTIVE SUBSTANCES
Acknowledgment
The author wishes to acknowledge the input of the GESAMP-BWWG and of all the invited
experts who contributed to the current status of the methodology on the evaluation of the
environmental and human risk assessment of ballast water discharges
150
151
BALLAST WATER MANAGEMENT SYSTEMS
Risk Assessment for Exemptions from
Ballast Water Management ndash The Intra-Baltic HELCOM Study
Matej David12 Stephan Gollasch3 Erkki Leppaumlkoski4
Abstract
This study focuses on intra-Baltic shipping for exemptions from ballast water management
requirements based on risk assessment (RA) As a basic framework the HELCOM Guidance to
distinguish between unacceptable high risk scenarios and acceptable low risk scenarios and the IMO
G7 Guideline were used RA methods were selected considering these documents After studying
shipping profiles in the Baltic Sea possible RA applications were studied on four different routes The
current lack of information regarding alien and cryptogenic species as well as human pathogens
present in port areas of the ballast water donor and recipient points were found as most limiting factors
to conduct a RA This study may be of particular interest for regional seas for example the Black and
Baltic Seas share some RA-relevant features such as intensive shipping inside the area and different
salinities throughout the sea
Key Words maritime transport ballast water management exemptions risk assessment
Introduction
The International Convention for the Management and Control of Ballast Water and
Sediments (BWM Convention) was adopted by the IMO in February 2004 to set global
standards on ballast water management (BWM) requirements (Gollasch et al 2007) The
BWM Convention introduces the selective BWM approach with Article 42 which allows to
adapt BWM measures to local conditions based on risk assessment (RA) In light of
exemptions from BWM requirements these can be given on the basis of Regulation A-4
(IMO 2004) Clearly to enable a port state to introduce such a selective approach an
appropriate RA is essential and necessary Globally agreed procedures for granting
exemptions are described in the IMO Guidelines for Risk Assessment under Regulation A-4
of the BWM Convention (IMO G7 Guideline) (IMO MEPC 2007)
1 University of Ljubljana Faculty of Maritime Studies and Transport Pot pomorščakov 4 SI-6320 Portorož
Slovenia 2 corresponding author e-mail address matejdavidfppuni-ljsi
3 GoConsult Grosse Brunnenstr 61 DE-22763 Hamburg Germany 4 Aringbo Akademi University Environmental and Marine Biology FI-20520 Turku Finland
152
DAVID GOLLASCH AND LEPPAumlKOSKI
HELCOM went further and prepared and adopted a Baltic Sea specific guidance for RA-
based exemptions the Guidance to distinguish between unacceptable high risk scenarios
and acceptable low risk scenarios ndash a risk of spreading of alien species by ships on Intra-
Baltic voyages (HELCOM RA Guidance 2010) This study focussed on testing the possible
application of the HELCOM RA Guidance for intra-Baltic shipping (the Kattegat included)
considering also the IMO G7 Guideline In general environmental issues in shipping should
be dealt with at a global scale however the implementation may occur through regional
agreements to consider local specifics (David and Gollasch 2008)
Risk Assessment Methods for Exemptions from BWM
The IMO G7 Guideline specifies three basic RA methods ldquoenvironmental matchingrdquo
ldquospecies-specificrdquo and ldquospecies biogeographicalrdquo The risk estimation on the assessment of
environmental matching between the areas of ballast water origin and discharge considers
salinity and temperature as surrogates for the assessment of the speciesrsquo capability of
survival in the new environment Speciesrsquo biogeographical risk assessment identifies
overlapping species in the donor and recipient ports and biogeographical regions and these
are direct indications of the similarity of environmental conditions The risk identification in the
species-specific approach is focused on the assessment of the potential invasiveness of each
species and anticipations of the harm that it could cause in the new environment
The risk assessment based upon an environmental match was found applicable considering
water salinity as key feature in this approach Temperature was also considered as a risk
assessment quantifying factor in the environmental match approach but it was agreed that
this is of lesser reliability to identify low risk scenarios The salinity is believed to be a
relatively solid indicator for species compatibility and survival in a new environment and on
the other hand this information is easily available for ballast water source and discharge
areas Acceptable risk is assessed should the salinity between ballast water donor and
recipient ports be freshwater (lt 05 PSU) to marine (gt 30 PSU) Such a salinity difference
does not occur for intra-Baltic shipping and therefore this environmental match approach
alone cannot be applied as a RA concept A new approach (ie the combination of
environmental match with species-specific considerations) was developed
In terms of the application of the species-specific approach the target species approach
was selected Target species need to be selected out of all alien cryptogenic and harmful
native species present in the Baltic Sea area Selection criteria to be used are set in the IMO
G7 Guideline
Further should both the ballast water donor and recipient regions have the same target
species but occurring in much different abundance a low risk indication needs to be
153
RISK ASSESSMENT FOR EXEMPTIONS FROM BWM
evaluated on a case-by-case basis Basically it would not be acceptable to transfer
unmanaged ballast water if a target species would occur in much higher abundance in any of
the donor ports than in the recipient port
Plants and animals native as well as non-native have the theoretical potential to spread
naturally from a donor to a recipient port without being assisted by any man-related vectors
It was recognized that this is species-specific and that the risk could be acceptable only if all
target species of concern could easily and naturally spread from the donor to the recipient
port
It was also considered that a coastal state may introduce a control or eradication program
for certain most unwanted species in their waters The further introduction of any such
species to the ballast water recipient area would not be acceptable
For the combined environmental and species-specific approach it was agreed that it
may be still acceptable when ballast water is moved between freshwater ports and brackish
ports with salinities higher than 18 PSU in which case a species-specific approach would be
also required especially considering the species that have known salinity tolerance higher
than lt05 PSU and gt18 PSU Should such species occur in only one of the considered donor
ports a low risk cannot be assumed
The species biogeographical risk assessment was found not applicable as the ballast water
movements considered here are not undertaken between different biogeographical regions
IMO Guideline G7 further states a species-specific risk assessment may be best suited to
situations where the assessment can be conducted on a limited number of harmful species
within a biogeographic region
In terms of vector factors the relevance of species survival during a voyage ballast water
discharge quantities and frequencies were considered As all intra-Baltic voyages are
relatively short (from hours to a couple of days) it was assumed that if one species is
present in the ballast water donor port it will survive the voyage and will be discharged viable
with ballast water in the recipient port The quantity of ballast water discharge is also one
of the factors related to the level of risk
However considering that also a small number of harmful organisms present in the
discharged ballast water may cause critical consequences this RA considers unacceptable
discharge of any quantity of ballast water if it contains target species not yet present in the
recipient port More frequent ballast water discharges from one donor port may increase the
154
DAVID GOLLASCH AND LEPPAumlKOSKI
risk however one ballast water discharge may already be sufficient to introduce a species
hence is not acceptable
The RA methods and principles for granting exemptions from BWM in intra-Baltic shipping are
organised in a flowchart and presented in
Figure 1
RA FOR INTRA-BALTIC SHIPPING
Data quality
- Is quality of data for RA good
enough
Yes ndash conduct RA
No ndash raquoHigh risklaquo
Environmental matching RA
- Salinity difference of donor port(s) and
recipient environment
Low ndash proceed to Species specific RA
lt05 ndash gt18 PSU = proceed to Combined RA
lt05 ndash gt30 PSU = raquoLow risklaquo
Species-specific RA
-Is there any target species that could not
easily naturally spread from donor to
recipient port
- Is there any target species in any of the
donor port(s) in higher abundance than in
the recipient port
- Is the target species in the recipient port
under a control or eradiaction program
Yes ndash raquoHigh risklaquo
No ndash raquoLow risklaquo
Combined RA
- Is there any high salinity tolerant
target species in any of the donor
port(s)
Yes ndash raquoHigh risklaquo
No ndash raquoLow risklaquo
Decision
- Low risk = Exemption granted
- High risk = Exemption not granted
Figure 1 Risk assessment (RA) methods and principles for granting exemptions
from ballast water management in intra-Baltic shipping
155
RISK ASSESSMENT FOR EXEMPTIONS FROM BWM
RA APPLICATION TEST
Based on studying shipping profiles in the Baltic Sea the following shipping routes were
selected
o St Petersburg (RU) ndash Gothenburg (SE)
o Klaipeda (LT) ndash Kiel (DE) and
o Kiel (DE) ndash Gothenburg (SE)
The routes recognized show frequent shipping pattern and represent different distances and
environmental conditions
Another route was selected for risk assessment with one donor port outside the Baltic region
o Terneuzen (NL) ndash Moumlnsterarings (SE) ndash Karlshamn (SE)
When starting the target species selection process it became clear that essentially needed
data (ie on already introduced alien species in the Baltic Sea ports cryptogenic species and
harmful native species) are missing to undertake such an assessment The most
comprehensive data on alien species was recognised to be the HELCOM MONAS list
(HELCOM 2009) Target species could still be identified from the data available but having in
mind also the precautionary approach it was recognised that vessels could not be exempted
based on RA conducted on such limited data Further assessments of the possible natural
spread and abundance comparison of target species as well as the presence of human
pathogens in the donor ports were not enabled due to the lack of data
Conclusions
RA for granting exemptions from BWM results in vessels continuing to operate on the
assessed route without conducting any ballast water management effort The RA is focused
on the identification of acceptable or non-acceptable ballast water discharges from donor
ports on a certain route This makes it clear that for such RA it is crucial to have reliable data
about port and surrounding environments in terms of biology as well as salinity
Nevertheless the study resulted in an agreement on the methods and principles to be used in
RA for exemptions in intra-Baltic shipping which can be applied when reliable data become
available Data for such RA would need to be obtained with port baseline surveys and
monitoring programmes using best available scientific knowledge and methods
156
DAVID GOLLASCH AND LEPPAumlKOSKI
Acknowledgements
The authors would like to express their grateful thanks to HELCOM for funding this study The
research has received co-funding from the European Communityrsquos Seventh Framework
Programme (FP72007-2013) under Grant Agreement No 266445 for the project Vectors of
Change in Oceans and Seas Marine Life Impact on Economic Sectors (VECTORS) where
David and Gollasch participate
REREFENCES
David M and S Gollasch (2008) EU shipping in the dawn of managing the ballast water issue Mar
Pollut Bull 56 1966-1972
Gollasch S David M Voigt M Dragsund E Hewitt C and Y Fukuyo (2007) Critical review of the IMO
International Convention on the Management of Shipsrsquo Ballast Water and Sediments Harmful Algae 6
585-600
HELCOM (2009) Monitoring and assessment of alien species according to the international
regulations HELCOM MONAS 122009 Doc 74 26 pp
HELCOM (2010) Guidance to distinguish between unacceptable high risk scenarios and acceptable
low risk scenarios ndash a risk of spreading of alien species by ships on Intra-Baltic voyages
(wwwhelcomfistcfilesshippingHELCOM20Guidance20on20risk20voyages20July202010
pdf)
IMO (2004) International Convention for the Control and Management of Shipsrsquo Ballast Water and
Sediments International Maritime Organization 36 pp
IMO MEPC (2007) Guidelines for Risk Assessment under Regulation A-4 of the BWM Convention
(G7) International Maritime Organization Resolution MEPC162(56) 16 pp
157
BALLAST WATER MANAGEMENT SYSTEMS
Ballast Water Management in Turkey ndash an overview
Murat Korccedilak1
Abstract
The Turkish coasts are one of the most vulnerable coasts because of the intensive maritime traffic
Currently there are 23 million tons of ballast water discharged to Turkish coastal waters annually
Further 66 different invasive species are carried by ships to Turkish coasts of which 19 of them can
be categorized as harmful organisms In particular three major alien and invasive species ndash namely
Mnemiopsis leidyii from the North Atlantic Rapana venosa from the Japan Sea and Beroe ovata from
the North Atlantic ndash were transferred to the Black Sea where they collapsed the entire fish stock and
caused significant economic loss to the region
The Turkish Undersecretariat for Maritime Affairs initiated an in-depth study on 26 July 2006 entitled
Project on Control and Management of Harmful Organisms Transferred by Ballast Waterrdquo The project
was undertaken by the Scientific and Technological Research Council of Turkey (TUBITAK) Marmara
Research Centrersquos (MRCrsquos) Environment Institute (EI) The project also aimed to produce a synergy
between these two public bodies to develop an operational ballast water management strategy and
system in Turkey
Within the framework of the project an inventory of the shipping activities along Turkish coasts was
developed in the form of a database system in order to quantify the amount of ballast water discharges
in Turkish ports and to define the sources of the ballast water An electronic reporting system was used
for this purpose All of the Turkish ports were subjected to a risk assessment process using the
GloBallast Risk Assessment Method Also a Geographical Information System (GIS) and an invasive
species database were produced during the project All these activities also contributed towards
Turkeyrsquos participation in the GloBallast project in which Turkey is a Lead Partnering Country (LPC) for
the Mediterranean region Turkey has also hosted a number of regional meetings such as ldquoTraining on
Port Biological Baseline Surveyrdquo and ldquoWorkshop on Legal Implementation of the BWM Conventionrdquo as
well as regional BWM strategy development meetings
This paper contains the details of the Turkish national ballast water management project and also
gives information of the national system of Turkey and future planned activities
1 Undersecretariat for Maritime Affairs of TURKEY
158
KORCcedilAK
Introduction
The Turkish National Ballast Water Management Project is defined in two main sections The
first section was conducted between 2006-2008 and the second section was conducted
between 2010-2011 The first section of the project (2006-2008) consists of 13 different work
packages These are
1 Inventory Study
a Shipping traffic data for a 5-year period
b Ballast water discharge and uptake amounts
c Ballast water origins and transportation patterns
d Impacts of invasive species to Turkish Coasts
e Determination of sensitive coastline areas
2 Trend Analysis
a Next 10 yearsrsquo approximation for maritime traffic
b Next 10 yearsrsquo approximation for ballast water discharge amounts
3 Risk analysis
a Determination of the risks for Turkish ports with Globallast Risk
Assessment Methodology
b Determination of the risks for Turkish ports with HELCOM Risk Assessment
Methodology
4 Establishment of Geographical Information System
5 Defining the ballast water management models
a Ballast water exchange probabilities within Turkish Territorial Areas
b Defining the roles of the stakeholders on ballast water management
c Defining the ballast water management strategy for Turkey
6 Reporting the pros and cons of signing the Ballast Water Management Convention
7 Preparing the national draft legislations
8 Defining the procedure on compliance and enforcement
9 Defining the roles of public bodies private sectors and NGOrsquos on ballast water
management
10 Defining the relevant technical infrastructure and supply chains
11 Preparing training material
12 Preparing an invasive species database
13 Establishing procedures for sediment reception facilities The second section of the project (2010-2011) consists of 5 different work plans These are
1- Ballast Water Risk Assessment Software
2- Ballast Water Exchange Route Analysis Software
3- Preparing a Port Environment Parameters Database
4- Revision of the Invasive Species Database
159
BALLAST WATER MANAGEMENT IN TURKEY ndash AN OVERVIEW
5- Revision of the Ballast Water Reporting Form Database
ACHIEVEMENTS FROM THE PROJECT
Inventory Study
The time period for the inventory study was 5 years All of the data were collected between
2002 and 2006 The amount of ballast water discharge and uptake were defined with respect
to ship transportation data Also the origins and transportation patterns were defined
available literature was scanned and the known impacts of the invasive species to Turkish
coasts were defined The sensitive coastline areas were defined with respect to current
legislation
Figure 1 Ballast water discharged into the Turkish
It was determined that 23 million tons of ballast water are discharged into Turkish coastal
waters annually Most of the ballast water is discharged to four hot spots in Izmit Iskenderun
Izmir and Istanbul bays
Ballast Water Reporting Form System
Ballast water reporting is a voluntary implementation However in Turkey a web-based
reporting form system was established and defined as mandatory The agents of the ships fill
in the form via the internet and after the approval of the harbor masters the ship is allowed to
arrive or depart the port
160
KORCcedilAK
Figure 2 Ballast Water Reporting Form System coasts (Ballast Water Management Project
2008)
Trend Analysis
The maritime transport data and ballast water discharge amounts were studied with a
statistical interpolation method and the amounts of ballast water discharged for 2016 was
estimated for all ports
Figure 3 Ballast water discharge trend analysis
Marmara Ege Denizi Akdeniz Karadeniz
45
23 25
7
41
18
35
6
2002-2006 2016
161
BALLAST WATER MANAGEMENT IN TURKEY ndash AN OVERVIEW
Risk Assessment Study
All of the Turkish ports were categorized with two different methods namely the Globallast
Risk Assessment Method and the Developed Baltic Risk Assessment Approach Also a
target invasive species list was prepared for Turkish Coasts
Figure 4 Risk Assessment coasts (Ballast Water Management Project 2008)
Ballast water risk assessment methods define the risk of donor ports with respect to
discharge port as low medium high and very high In the figure 4 the risk categorization of
donor ports to Ceyhan Port (discharge port) is shown
Geographical Information System
All of the data collected and all of the results achieved during the project were used to build a
geographical information system (Figre 5) This system is a decision support tool for the
implementation of the Ballast Water Management Convention
Route analysis
All the suitable sea areas are defined with respect to Ballast Water Management
Conventionrsquos ballast water exchange criteriarsquos The routes are identified by using ship type
162
KORCcedilAK
GT of ship and average speed By using that analysis all the routes are classified as suitable
or not suitable for exchange (Figure 6)
Figure 5 GIS System coasts (Ballast Water Management Project 2008)
Figure 6 Route analysis (Ballast Water Management Project 2008)
163
BALLAST WATER MANAGEMENT IN TURKEY ndash AN OVERVIEW
Invasive Species Data Base
The literature on reported invasive aquatic organisms was studied Relevant properties of this
invasive species were collected in a database system This database can be accessed from
the internet The users can conduct searches according to the name or habitat of the invasive
species
Figure 7 Invasive Species Database
SECOND SECTION (2010-2011)
Risk Assessment Software
This is a Geographical Information System based software which can calculate the risk
between ports for ballast water transportation with GloBallast BWRA-Methodology
The Globallast Risk Assessment methodology is a complex system which uses different
calculation software and computer databases It is a system that you can use to calculate the
risk for ports for only a defined time period For another time period you have to make
calculations from the beginning by using different calculation methods one by one
164
KORCcedilAK
Ballast Water Reporting Form
bull Scientific publicationsbull Port publications bull Climate databasesbull National tide-tablesbull Satellite images (google
earth)bull NOAA (National
Oceanographic Data Center)bull Lloydrsquos- Ports and Terminals
Guide
C1 - ballast water discharge frequency
C2 - ballast water discharge volume
R1 ndash tank volume
R2 -voyage time
Port Environmental Database for C3
Background data for Risk Assessment Data sources
Risk species database for C4
or
Shipping records
bull Scientific publications
bull Port baseline surveys
bull Invasive species databases worlwide
Ballast Water Risk Assessement System
BW Reporting Form Database
Figure 8 Risk Assessment Data Resources
In our software all calculation methods are modified to work together automatically and give
results for different time periods instantaneously This is a perfect tool for the port state
investigation officers to use as a decision support tool for defining the most appropriate ship
to be investigated
This tool was produced to be used on port state investigations and also it is a useful decision
support tool for Turkey on deciding exchangetreatment exemptions for ships with respect to
the Ballast Water Management Convention
There are four different kind of coefficients have to be calculated with respect to the
methodology Also there are two different risk reduction factors that have to be calculated
These coefficients are related to the frequency of ballast water discharge (C1) amount of
ballast water discharge (C2) Environmental similarity (C3) and information on known invasive
species (C4)
There are six different parameters that are calculated by using 3 different database systems
All databases and the risk assessment software are working via the webThis makes the
system available from all over the world The databases are the BW Reporting Form
Database Port Environmental Database and Risk Species Database
165
BALLAST WATER MANAGEMENT IN TURKEY ndash AN OVERVIEW
Deniz Ulaştırması Genel Muumlduumlrluumlğuuml
Figure 9 Screen image of the risk assessment software
The second section of the software reports the ballast water reporting forms and all
information about the shipping traffic for Turkish ports On the third section you run the risk
assessment software
Risk assessment software reports the risk evaluation of the ports with respect to the other
donor ports You first choose which port you need to assess the risk The system
automatically gives information about the risk amounts of all possible donor ports
As shown in the figure 10 the risk assessment for the İzmit port was conducted (plotted with
a big white spot) the red plotted ports are the high risk ports and the green plotted ports are
low risk ports Also the system gives a report for a risk assessment and all parameters can
be investigated from risk report
166
KORCcedilAK
Figure 10 Screen image of the risk assessment
Route Analysis
Route analysis is one of the important components of the risk assessment system It reports if
a ship is available to make a ballast water exchange with respect to its route
The user only inputs the last port of call and the arrival port from Turkey The system
automatically takes the properties of the ship such as ballast water amount and the tonnage
and the type of the ship Afterwards the system draws the most probable route for the ship
and calculates the distance and available places to make an exchange At the end the
system calculates the exchange duration and gives a result regarding whether this ship can
make and exchange during this voyage or not
This system is also a perfect tool for port state control officers as a decision support tool
THE TURKISH BALLAST WATER MANAGEMENT SYSTEM
The ratification process of the Ballast Water Convention in Turkey is nearly finalized All the
sub-commissions in the parliament approved the convention Turkey will be a party of the
convention after the approval of the parliament
167
BALLAST WATER MANAGEMENT IN TURKEY ndash AN OVERVIEW
Figure 11 Route Analysis
The national draft legislations are ready and awaiting the ratification process of the
convention After the ratification of the convention the draft legislation will put into force
immediately
There is a pilot implementation that was carried out during this ratification period in order to
test the capabilities of the Turkish port state control officers on ballast water Management
inspections The Botaş Harbor Master was chosen for this pilot implementation because of its
intensive maritime traffic This area is the oil loading terminal for the Baku-Tbilisi-Ceyhan
pipeline All of the ships calling Ceyhan are coming under full ballast conditions and discharge
their ballast water into this terminal area
The main idea of this pilot implementation is to force the ships to make exchanges and try to
inspect them We ordered all ships calling this port to make an exchange before entering the
port in suitable places with respect to the Ballast Water Convention If the ship did not or
could not make the exchange the ship was surveyed and BW samples were taken After the
analysis of the samples if an invasive species was determined to be present an exchange
will be a ldquoshouldrdquo for this route All of the other ships coming from that route would not be
allowed to enter the port without exchange After this pilot implementation we realized that
the training of the port state control officials is one of the most important concerns of ballast
168
KORCcedilAK
water management system It is a complicated process and training dramatically affects the
success
As the maritime authority of Turkey we can easily say that after the two phases of the
national ballast water management project Turkey is ready to implement all of the aspects of
the Ballast Water Management Convention
Especially in the second phase of the national project a decision support tool was prepared
which we can use for
bull Deciding to allow or not to allow the ship to enter a port bull Chosing the highest risk ship for inspection bull Defining the port rules about Ballast Water Management bull Evaluating the probability of ballast water exchange of a ship bull Deciding about exemptions for a ship and bull Collecting statistical data for scientific studies
Turkey is also a Leading Partnership Country for the Mediterranean Region with Croatia
through the GloBallast Partnership Project Some of the main activities of the project were
held in Turkey These activities included the Port Baseline Survey Workshop (21-24 October
2008) Legal Training (2-3 December 2009) and the Second Regional Task Force Meeting
(1-3 June 2010)
Turkey executes the Chairmanship of the Regional Task Force and plays an important role in
the preparation of the Regional Ballast Water Management Strategy This document was
approved by the contracting parties of the Barcelona Convention and put in force
Figure 13 Blue Book
Turkey also published a report
called ldquoBlue Book about the
Ballast Water Management
Activities in Turkeyrdquo The Blue
Book contains three reports which
are the National Ballast Water
Management Strategy for Turkey
Ballast Water Status Assessment
Report for Turkey and Economic
Assessments for Ballast Water
Management in Turkey
169
BALLAST WATER MANAGEMENT IN TURKEY ndash AN OVERVIEW
Future plans of Turkey include the successful implementation of the Ballast water
Management Convention Within this context we will implement all of the activities defined in
National Strategy seriously and enact and enforce the national legislation as soon as
possible
REFERENCES
Hilliard Rob Clarke C Stevens C Polglaze J and C THayes (2003) Ballast Water Risk Assessment (Activity 31) User Guide (v14) GEFUNDPIMO Global Ballast Water Management Programme (GloBallast) for the BWRA Database GIS System
Leppaumlkoski E and S Gollasch Risk Assessment of Ballast Water Mediated Species Introductions ndasha
Baltic Sea Approach 2006
Olgun A Avaz G Doumlnertaş A S Aydoumlner C Bozkaya Ş Pekdemir E A Murat S Oral N
Başar E Feyzioğlu M and et al(2009) The Control and Management of Harmful Aquatic Organisms
Transported by Ballast Water Project Report TUBITAK-Marmara Research Center-Environment
Institute CcedilE0910
Olgun A Aydoumlner C and T Atalay (2011) Development of Ballast Water Risk Assessment Software
Project TUBITAK-Marmara Research Center-Environment Institute
171
BALLAST WATER MANAGEMENT SYSTEMS
Biological Efficacy of Electrolytic BWMS
(Electro-Cleen Tm System) During Onboard Installation
Yong Seok Park Dong Hyun Shon1 Gwang Ho Lee Hyun Ju Moon
Hyung Geun Jeon
Abstract
An electrolytic ballast water treatment system (Electo-CleenTM System ECS) which obtained a type
approval in December 2009 was continuously evaluated to ensure its biological efficacy during
onboard installation in newly built vessels Thirteen shipboard tests were performed to determine the
biological efficacy of the system The evaluations were carried out in the major ship building yards in
Korea and Japan between June 2009 and December 2010
Keywords 2004 BWM Convention Electo-CleenTM System Shipboard test biological efficacy D-2
standard Total Residual Oxidant
1 Introduction
Since the International Maritime Organization (IMO) adopted the 2004 BWM Convention (lsquothe
International Convention for the Control and Management of Shipsrsquo Ballast Water and
Sedimentsrsquo) to prevent risks induced by transfer of non-indigenous organisms and pathogens
14 systems on the market have been type-approved under G8 as of May 2011 (Lloyds
Register 2011) Currently over 40 ballast water technologies are expected to obtain type
approval soon These commercially available systems or system that are going to be
commercially available soon need to be evaluated to ensure they always meet the
requirements of the IMO D-2 regulation This study focused on the biological efficacy of an
electrolytic ballast water treatment system (Electo-CleenTM System ECS) which obtained a
type approval by the Korean authority in December 2009 The system was evaluated 13
times during shipboard installation to confirm that the D-2 standards were met between June
2009 and December 2010
2 Materials and Methods
Shipboard tests were carried out to evaluate the viability of organisms specified by D-2
standards after the treatment A volume of 1 m3 of water samples was netted for organisms
over 50microm (mesh size 32microm) Organisms between 10 microm and 50 microm were collected using a
net which has a mesh size of 5microm A volume of 10 L of water samples were netted for
1 RampD Division Techcross Inc 25-1 Kwanam-ri Inju-myun Asan Chung Nam 336-833 S Korea
172
PARK SHON LEE MOON AND JEON
organisms between 10 microm and 50 microm All samples were collected in triplicate Triplicate
bacterial samples of Escherichia coli Enterococci and Vibrio cholera were collected using 1L
sterilized bottles
Viable organisms larger than 50 microm (mainly zooplankton) were determined based on the
appendages movement under a stereomicroscope Organisms were considered to be
ldquoviablerdquo if they were actively moving or exhibited an escape behavior when probed with a fine
needle If no activity or movement of any kind was observed after the additional sticking with
a fine needle organisms were considered to be ldquodeadrdquo The viability was confined to the
unimpaired body of zooplankton
Viable organisms between 10 microm and 50 microm (mainly phytoplankton) were assessed using
light microscopy and epifluorescence microscopy Sliding or its own original movement was
considered as an indication of viable organisms The emission of chlorophyll-induced red
color (autofluorescence) was also determined as an indicative signal of cell viability
(Pouneva 1997) A working stock solution of FDA (5 mgmL) was prepared by diluting the
primary DMSO solution 100 times with chilled distilled water (50 μgmL) The solution was
mixed during preparation to prevent the precipitation and kept cold in the dark Each sample
was stained by adding 33 μl of the working solution to a 1 mL sample (end concentration 17
μg mLndash1 FDA) (Gervey et al 2007) Stained samples were kept in a cool and dark place for a
minimum of 10 minutes prior to enumeration The fraction of FDA-stained cells (viability) was
determined under an epifluorescence microscope at 100X to 200X magnification depending
on cell size Organisms which emitted green-fluorescence and red-fluorescence were
counted under blue light excitation (wavelengths 450 to 500 nm) as viable organisms
Escherichia coli was evaluated by filtrating 10mL of sample water onto the 02 microm membrane
filter Filters were placed on the top of E coli Coliform and Coliform Count Plates (3MTM
Petrifilm plate) The Petrifilm plates were incubated for 24 hrs at 35degC The blue to red-blue
colonies associated with entrapped gas in the Petrifilm EC plate was considered as E coli
Vibrio cholerae (serotypes O1 and O139) was evaluated by filtrating 5 to 10 mL of sample
water onto the 02microm membrane filter Filters were placed on the TCBS (Bisulfate Citrate Bile
Sucrose) agar Pre-treated TCBS agar plates were incubated for 24 hrs at 35degC The green
colored CFU was considered as Vibrio parahaemolyticus The yellow colored CFU was
isolated into nutrient agar and incubated for 24 hrs at 35degC If the cultivated CFU showed
purple color it was considered to be positive If the incubated CFU was determined as
positive API20E test was carried out
173
BIOLOGICAL EFFICACY OF ELECTROLYTIC BWMS (Electro-Cleen TM System)
Enterococci was evaluated by filtrating 20 ~ 40 mL of sample water onto the 02 microm
membrane filter Filters were placed on the Intestinal Enterococci agar plate The pre-treated
agar plates were incubated for 48 hrs at 35degC The pink to brown coloured CFU with a
diameter of 05 to 2 mm was considered to be Enterococci
3 Results
Shipboard tests for biological efficacy were performed to evaluate the D-2 criteria There were
13 shipboard tests for biological efficacy of the equipment (Table 1)
Table 1 Shipboard evaluation for ECS during installation water qualities and operational
condition
Date
Installation
No
pH
Salinity
(PSU)
Temperature
(Cdeg)
TRO
concentration
(mg L-1)
Unit
installation
Water
flow
(m3
hr-1)
Ship
Yard
Jun509 S1 82 306 238 60 ECS300A X 2 600 A
Sep1509 S2 84 344 235 71 ECS300A X 2 620 B
Sep1709 S3 81 345 233 65 ECS300A X 2 580 A
Oct2309 S4 80 362 182 83 ECS300A X 1 150 C
Nov2009 S5 83 290 138 78 ECS300A X 2 500 A
Dec1709 S6 82 317 102 83 ECS300A X 2 480 B
Mar1210 S7 84 328 165 67 ECS300A X 2 630 A
July0810 S8 82 356 241 89 ECS300A X 2 580 A
Aug1310 S9 85 343 253 85 ECS300A X 2 550 A
Oct1310 S10 81 321 174 89 ECS300A X 2 610 A
Dec0910 S11 80 343 149 72 ECS600A X 1 620 C
Dec2410 S12
(APT) 82 345 121 81 ECS600A X 1 550 D
Dec2710 S13
(BWT) 82 343 123 84 ECS600A X 8 5100 D
ECS300A Treatment Rated Capacity 300 m3 h-1 ECS600A Treatment Rated Capacity 600 m3 h-1
APT After Peak Tank BWT Ballast Water Tank
The water temperature ranged between 102 degC and 253 degC while the range of pH was from
77 and 85 during the study The salinity range was between 290 PSU and 362 PSU The
early installations of 10 vessels were equipped with single or multiple units which have a
treatment rated capacity (TRC) of 300 m3 h-1 Shipsrsquo installation numbers of these vessels
were S1 S2 S3 S4 S5 S6 S7 S8 S9 and S10 The remaining three tests were carried out
with units which have a TRC of 600 m3 h-1 (S11 S12 APT S13 BWT) (Table 1)
174
PARK SHON LEE MOON AND JEON
The sufficient biological efficacy to comply with D-2 standard was found if the total residual
oxidant (TRO) was maintained between 60 mg L-1 to 89 mg L-1 (Table 1 and Table 2) The
population density of untreated sample larger than 50 microm was higher than 86 X 102 inds m-3
(S6) during all evaluations while that of untreated sample reached to 62 X 104 inds m-3 on
August 13 2010 during the evaluation of S9 (Table 2) The population densities of treated
sample larger than 50 microm were always less than 2 inds m-3 (S1 S3) The cell densities of
organism between 10 microm and 50 microm showed that the highest population density of untreated
sample reached to 20 X 102 cells mL-1 on December 27 2010 during the evaluation of S13
BWT The cell densities of viable organisms between 10 microm and 50 microm in treated sample
were maintained below 2 cells mL-1 (Table 2)
Table 2 Biological efficacy of ECS mean values of triplicate analysis
SD Standard deviation
Installation No
Samples
Test Items (D-2 Criteria)
gt50um 10-50um Ecoli Enterococcus Vibrio cholerae
inds m-3 cells mL-1 CFU 100mL-1 CFU 100mL-1 CFU 100mL-1
S1
Treatment 2 1 0 0 0
SD 2 0 0 0 0
Control 6080 12 0 0 0
SD 1990 1 0 0 0
S2
Treatment 0 0 0 0 0
SD 0 0 0 0 0
Control 9533 2 0 0 0
SD 1384 1 0 0 0
S3
Treatment 2 2 0 0 0
SD 2 1 0 0 0
Control 11897 20 0 0 0
SD 2411 7 0 0 0
S4
Treatment 1 0 0 0 0
SD 2 0 0 0 0
Control 2167 165 0 0 0
SD 430 8 0 0 0
S5
Treatment 0 0 0 0 0
SD 0 0 0 0 0
Control 2255 26 1 0 0
SD 400 4 1 0 0
S6
Treatment 0 0 0 0 0
SD 0 0 0 1 0
Control 863 39 0 0 0
SD 58 11 0 1 0
S7
Treatment 0 0 0 0 0
SD 0 0 0 0 0
Control 39330 17 100 65 0
SD 8048 4 20 22 0
S8
Treatment 0 0 0 0 0
SD 0 0 0 0 0
Control 5105 106 0 0 0
SD 2151 19 0 0 0
175
BIOLOGICAL EFFICACY OF ELECTROLYTIC BWMS (Electro-Cleen TM System)
Installation No
Samples
Test Items (D-2 Criteria)
gt50um 10-50um Ecoli Enterococcus Vibrio cholerae
inds m-3 cells mL-1 CFU 100mL-1 CFU 100mL-1 CFU 100mL-1
S9
Treatment 0 0 0 0 0
SD 0 0 0 0 0
Control 62435 156 8100 0 0
SD 3728 31 2022 0 0
S10
Treatment 1 0 0 0 0
SD 1 0 0 1 0
Control 2378 23 47770 919 0
SD 362 3 3233 341 0
S11
Treatment 0 0 0 0 0
SD 0 0 0 0 0
Control 2546 13 100 1 0
SD 283 4 100 1 0
S12 (APT)
Treatment 0 0 0 0 0
SD 0 0 0 0 0
Control 1317 96 0 23 0
SD 147 5 0 4 0
S13 (BWT)
Treatment 0 0 0 0 0
SD 0 0 0 0 0
Control 1253 197 0 4 0
SD 47 25 0 4 0
The results of bacterial analysis showed that no countable CFU was found in treated samples
except during the evaluation of S10 for enterococcus on October 13 2010 (SD = 1) (Table
2) The viable E coli collected from untreated samples reached over 47 X 104 CFU 100 mL-1
on October 13 2010 (S10) while the density of viable enteroccous was 92 X 102 CFU 100
mL-1 There were no viable V cholerae for both untreated and treated water samples during
evaluations
4 Discussion
All 13 shipboard evaluations for biological efficacy satisfied D-2 standard under various water
conditions when TRO concentration was over 60 mg L-1 The dominant group of organisms
bigger than 50 microm was barnacle larvae during the installation of S9 while copepoda
dominated during the installation of S3 and S7 Diatom predominated organisms between 10
microm and 50 microm during the installation of S4 and S13 However dinoflagellate dominated
during the installation of S9
REFERENCES
Garvey M B Moriceau and Passow U (2007) Applicability of the FDA assay to determine the
viability of marine phytoplankton under different environmental conditions Marine Ecology Progress
Series 352 17-26
176
PARK SHON LEE MOON AND JEON
Lloyds Register (2011) Ballast water treatment technology current status London June
Pouneva I (1997) Evaluation of algal culture viability and physiological state by fluorescent
microscopic methods Bulg J Plant Physiol 23(1-2) 67-76
177
BALLAST WATER MANAGEMENT SYSTEMS
Assessing of the Ballast Water Risk in Ceyhan Marine Terminal
Arzu Olgun1 Aslı Suumlha Doumlnertaş Cihangir Aydoumlner Yasemin Guumlmuumlşluumloğlu2
Abstract
Shiprsquos ballast water and sediments serve as a main vector in the transportation and spreading of
planktonic organisms toxic dinoflagellates bacteria and other unicellular organisms A proportion of
these species are capable of causing serious harm to native biodiversity industries and human health
Ceyhan Marine Terminal (CMT) which is located on the N-NW coast of the Gulf of Iskenderun
(Eastern Mediterranean Sea in Turkey) is an export terminal which transports crude oil from the Azeri
Caspian Sea to the world market via tankers With the starting of tanker traffic in Ceyhan Marine
Terminal in June-2006 the volume of the discharged ballast water from various seas of the world into
the CMT and the possibility of the introduction of invasive species to İskenderun Bay have increased
significantly And this site has been the most risky zone of Turkey coasts in the scope of ship-borne
species introduction
The main aim of this study is to assess the ballast water risk of the tankers on Iskenderun Bay
(Turkey) The relative overall risk (ROR) posed by each BW source port to CMT has been identified by
using four-year shipping traffic data and Ballast Water Reporting Form System data According to data
obtained from the Ballast Water Reporting Forms and the shipping traffic records 45551876 tonnes
of BW were discharged to CMT between 4June2006 and 02June2010 (annual average 11300000
tonnes) from 1126 visits In the BWRA 20 ports from the 133 source ports have been identified as
ldquohighrdquo risk ports 17 ports have been identified as ldquohighestrdquo risk ports also
Keywords Ballast Water Risk Analysis Invasive species Iskenderun Bay Turkey
Introduction
The Mediterranean Sea as an enclosed sea is particularly vulnerable to ship-associated
impacts due to a high-volume of shipping routes long history of use and sensitive shallow
and deep-sea habitats One of the major threats to marine biodiversity changes in the
Mediterranean Sea is biological invasion It is well known that the opening of the Suez Canal
(19th Century) has led to the introduction of hundreds of species of Indo-Pacific and
Erythraean origin which have established permanent populations particularly in the eastern
Mediterranean (Levantine Basin) According to recent scientific study reports approximately
1 TUumlBİTAK Marmara Research Center ndash Environment Institute Gebze Kocaeli TURKEY 2 Baku-Tbilisi Ceyhan Pipeline Company Environment Department Ankara TURKEY
178
OLGUN DOumlNERTAŞ AYDOumlNER GUumlMUumlŞLUumlOĞLU
400 non-native species were reported along the Turkish coast 331 of these alien species
were recorded from East Mediterranean sea coasts and 56 of 331 species are ship-borne
species (Ccedilınar et al 2011)
Ceyhan Marine Terminal (CMT) which is located on the N-NW coast of the Gulf of Iskenderun
is one of the major oil export ports of Eastern Mediterranean and the port area is also
susceptible to invasion of ship-borne organisms With the starting of tanker traffic in June -
2006 this site has been the highest risk area of Turkey coasts because of ship-borne species
introduction
Under Regulation A-4 of the Ballast Water Convention parties may grant exemptions to
ballast water management requirements of the ships which only operate between specified
ports or locations Vessels may hence be exempt from applying any measures as long as it
can be documented that the risk of introduction is low or acceptable The IMO Guidelines for
Risk Assessment under Regulation A-4 of the BWM Convention (G7) provide advice and
information regarding risk assessment principles methods and procedures for granting
exemptions
In this study was undertaken a ballast water risk assessment (BWRA) study according to the
IMO ndash GloBallast BWRA methodology for tanker movements between ports of tanker origin
(source ports) and Ceyhan Marine Terminal (CMT) port to determine the risk of biological
contamination between the ports for last 4- year period (June2006ndashJune2010) The
discharged ballast water amount into the İskenderun Bay and their origins was also
determined
Methodology
IMO Globallast BWRA methodology was used during the BWRA studies for CMT The BWRA
Database software was developed by GloBallast project team to provide a lsquofirst-passrsquo risk
assessment for training demonstration and evaluation purposes The database employed the
BW discharge port environmental matching and bioregion species distributionthreat data to
calculate as objectively as possible the relative risk of a harmful species introduction to a
port site as posed by discharges of BW and associated organisms that were ballasted at
each of its identified source ports [1]
The database calculates the ROR (Relative Overall Risk of a potentially harmful introduction
for all source ports that have C1-C4 coefficients and R1-R2 risk reduction factors The ROR
value for each source port represents a proportion of the threat posed to the receiver port as
result of its contemporary trading pattern Figure 1 and Figure 2 show schematic of the
GloBallast BWRA System and the Risk Coefficients respectively
179
ASSESSING OF THE BALLAST WATER RISK IN CEYHAN MARINE TERMINAL
Figure 1 Schematic of the GloBallast BWRA System [1]
The formula for calculating the relative overall risk (ROR) posed by a source port is
ROR = (C1 + [C2 x R1] + C3 + [C4 x R2]) 4
The shipping data used in the CMT-BWRA study was provided by BOTAŞ International
Limited (BIL) Designated Operator for BTC and from the Ballast Water Reporting Form
(BWRF) system between the dates 4 June 2006 ndash 04 June 2010
Environmental Similarity Analysis and Port Environmental Data (C3)
The more a BW receiver port is environmentally similar to a BW source port the greater the
change that organisms discharged with the imported BW can tolerate their new environment
and maintain sufficient numbers to grow reproduce and develop a viable population
Comparing port to port environmental similarities provides a relative measure of the risk of
organismrsquos survival establishment and potential spread The environmental distances
between the receiver port and the source port are determined using a multivariate method in
the Primer package Table 3 shows environmental parameters used for determining the
environmental similarities (C3) between two ports Totally 133 source ports were analysed to
180
OLGUN DOumlNERTAŞ AYDOumlNER GUumlMUumlŞLUumlOĞLU
identify their environmental similarities with Ceyhan Marine Terminal by using Primer
program
Figure 2 Risk Coefficients
Risk species and NIS Data for C4 Calculation
One of the BWRA objectives was to identify lsquohigh-riskrsquo species that may be transferred to
receiver port The Access database was therefore provided with tables for storing the names
distribution and other information on risk species For the purposes of the BWRA and its lsquofirst-
passrsquo risk assessment a risk species was considered to be any introduced cryptogenic or
native species that might pose a threat if transferred from a source port to a receiver port The
database manages the bioregional locations and status of each entered species using the
same bioregions displayed on the GIS world map Bioregion map provided by the Australian
Centre for Research on Introduced Marine Pests (CRIMP)
Frequency of ships discharging
BW from each Source Port
Amount discharged from each
source port
Similarity between the receiving
port and all source port
Percentage of all available risk
species in each source port
Ballast Water Storage Time
(Voyage duration)
Tank Volume
(C1) Percentage of all BW tank
discharges
(C2) Percentage of total BW volume
dischaged
(C3) Environmental matching
coefficient
(C4) Coefficient of risk species threat
(R2) Risk reduction factor for long
voyages time
(R1) Risk reduction factor for small
tank volume
181
ASSESSING OF THE BALLAST WATER RISK IN CEYHAN MARINE TERMINAL
Table 1 Port Environmental Parameters used by the Environmental Similarity Analysis
No Name Variable Type
1 Port type Categorical
2 Mean water temperature during warmest season (oC) Scalable
3 Maximum water temperature at warmest time of year (oC) ldquo
4 Mean water temperature during coolest season (oC) ldquo
5 Minimum water temperature at coolest time of year (oC) ldquo
6 Mean day-time air temperature recorded in warmest season (oC) ldquo
7 Maximum day-time air temperature recorded in warmest season (oC) ldquo
8 Mean night-time air temperature recorded in coolest season(oC) ldquo
9 Minimum night-time air temperature recorded in coolest season (oC) ldquo
10 Mean water salinity during wettest period of the year (ppt) ldquo
11 Lowest water salinity at wettest time of the year (ppt) ldquo
12 Mean water salinity during driest period of year (ppt) ldquo
13 Maximum water salinity at driest time of year (ppt) ldquo
14 Mean spring tidal range (metres) ldquo
15 Mean neap tidal Range (metres) ldquo
16 Total rainfall during driest 6 months (millimetres) ldquo
17 Total rainfall during wettest 6 months (millimetres) ldquo
18 Fewest months accounting for 75 of total annual rainfall Integer
19 Distance to nearest river mouth (kilometres) - negative value if upstream Scalable
20 Catchment size of nearest river with significant flow (square kilometres) ldquo
Logarithmic habitat-distance category - from closest BW discharge site to nearest
21 Smooth artificial wall Categorical
22 Rocky artificial wall ldquo
23 Wooden pilings ldquo
24 High tide salt marsh saline flats ldquo
25 Sand beach ldquo
26 Stony beach ldquo
27 Low tide mud flat ldquo
28 Mangroves ldquo
29 Natural rocky shore or cliff ldquo
30 Subtidal firm sands ldquo
31 Subtidal soft mud ldquo
32 Seagrass meadow ldquo
33 Rocky reef or pavement ldquo
34 Coral reef (carbonate framework) ldquo
Results
According to data obtained from the Ballast Water Reporting Forms and the shipping traffic
records 45551876 tonnes of BW were discharged to CMT between 4June2006 and
02June2010 (annual average 11300000 tonnes) from 1126 visits The majority of the BW
volume discharged to CMT area was from the Mediterranean Sea (69) which was followed
182
OLGUN DOumlNERTAŞ AYDOumlNER GUumlMUumlŞLUumlOĞLU
by North East Atlantic (11) North West Atlantic (10) and Indo-Pacific Ocean (6) The
highest BW discharge volume belongs to the Western Mediterranean Sea with ~ 14061894
tonnes (Figure 3)
Figure 3 Proportion of BW volume discharges according to the seas in the Iskenderun
Gulf (June 2006 ndash June 2010)
Risk Assessment Results
From the 1126 visit records in the database it was identified 17 of the 133 source ports as
representing the ldquohighestrdquo risk group (in terms of their BW source frequency volume
environmental similarity and assigned risk species) These ports which all were
Mediterranean provided the top 1971 of the total ROR with individual values in the 023-
019 range (Table 4) The highest risk port was led by Haifa (ROR = 023) followed by
Ashkelon with the same risk values (ROR = 023) The other highest risk ports are
AugustaPriolo Trieste Sidi Kerir Tartous and Porto Foxi (Sarroch) with 022 risk values Fos
Sur Mer Santa Panagia and Banias with 021 risk values Savona Aliaga and Porto Vecchio
with 020 risk values and Piraeus Milazzo Bizerte and Skaramanga with 019 risk values 6
ports from highest risk ports were from MED-III and MED-II bioregions in the West
Mediterranean 5 ports were from the same bioregion (MED-V) with CMT Other 6 ports were
from Mid Mediterranean
183
ASSESSING OF THE BALLAST WATER RISK IN CEYHAN MARINE TERMINAL
20 ports have been detected as high risk ports 14 ports from 20 ldquohighrdquo risk ports (1967)
were also in the Mediterranean Their ROR values are between 019 and 017 6 non-
Mediterranean ports Leixoes (France-North East Atlantic ROR 018) Cadiz and Huelva
(Spain- North East Atlantic ROR 017) and Sines (Portugal- North East Atlantic) from NEA-V
bioregion and Mohammedia (Morocco-North East Atlantic ROR 017) from WA-I bioregion
and Yosu (Korea- North West Pacific ROR 017) from NWP-3a bioregion were identified in
the high risk category
Figure 4 GIS world map outputs showing the location and categories of relative
overall risk (ROR) of the BW source ports identified for CMT
The number of BW source ports in the ldquomediumrdquo ldquolowrdquo and ldquolowestrdquo risk categories were 23
28 and 45 respectively 14 ports from 23 ldquomediumrdquo risk ports were from Mediterranean Their
ROR values are between 017 and 014 Also 3 ports from North East Atlantic 1 port from
North East Pacific 2 ports from North West Pacific and 3 ports from Indian Ocean were other
ports in the medium risk category
The 73 source ports in the ldquolowrdquo (28) and ldquolowestrdquo (45 ROR 012-02) risk categories were
generally a mixture of cool and very warm water ports plus riverbrackish ports with a wide
distribution The source port with the lowest ROR value (002) was New Orleans from United
184
OLGUN DOumlNERTAŞ AYDOumlNER GUumlMUumlŞLUumlOĞLU
States (Table 9) New Orleans is located near the river and its salinity is 0 Becancour
Quebec from Canada was also in the lowest risk categories (ROR=003) This port is also
located near the river and its salinity is 0 Most of the other lowest risk ports are also located
near the river or in the estuary The water salinity of the CMT is generally around 039
Organisms in the lower saline brackish water or fresh water taken onboard during BW
operations will not likely survive when being discharged in higher saline waters The species
introduction risk is also minimal Results from the BWRA for the CMT are shown on Figure 4
Acknowledgements
This study is a part of the project ldquoCeyhan Marine Terminal Ballast Water Risk Assessmentrdquo
conducted by TUBITAK MRC Environment Institute and supported by Baku-Tbilisi Ceyhan
Pipeline Company
REFERENCES
1 Hilliard Rob Clarke C Stevens C Polglaze J and C THayes (2003) Ballast Water Risk Assessment (Activity 31) User Guide (v14) GEFUNDPIMO Global Ballast Water Management Programme (GloBallast) for the BWRA Database GIS System
2 Olgun A Avaz G Doumlnertaş A S Aydoumlner C Bozkaya Ş Pekdemir E A Murat S Oral N
Başar E Feyzioğlu M and et al(2009) The Control and Management of Harmful Aquatic
Organisms Transported by Ballast Water Project Report TUBITAK-Marmara Research Center-
Environment Institute CcedilE0910
3 Olgun A AvazG Bozkaya Ş Aydoumlner C ve A Doumlnertaş ldquoCeyhan Marine Terminal Ballast Water Risk Assessment-3 and potential Invasive Species in İskenderun Bayrdquo Project Report CcedilE1048 15092010
185
BALLAST WATER MANAGEMENT SYSTEMS
Global RampD Forum on Ballast Water Management
ldquoCompliance monitoring and enforcement the next RampD Challengerdquo
Istanbul Turkey
26-28October 2011
Closing remarks by Mr Jo Espinoza-Ferrey
Director Marine Environment Division IMO
Colleagues and friends
Ladies and Gentlemen
As we conclude this fourth IMO-GloBallast RampD Forum on Ballast Water Management we
can look back at a very successful event designed to let us all take stock of where we are
today in terms of our capacity to monitor and enforce compliance with the Ballast Water
Management Convention and if the current RampD efforts are sufficient and also in alignment
with what is needed
It has been a very busy week with activities spanning the entire ballast water management
field The test facilities met first and came ever closer to the signing of an MOU on the
establishment of the GloBalTestNet Through their commitment to improve and harmonize the
testing and reporting of ballast water treatment technologies the worldrsquos test facilities are
showing leadership and vision and we should all encourage them to continue their efforts
towards a global network which will be extremely valuable not only to the test facilities
themselves but also to those who will buy the systems as well as the wider ballast water
management community
Next we had the Shipbuildersrsquo Forum This was an opportunity for dialogue among a wide
range of stakeholders and I hope this exchange of ideas continues long after this weekrsquos
activities The future entry into force of the Convention puts great responsibility on the ship
186
owners shipbuilders and ship repair yards and dialogue amongst them will be crucial in
meeting the deadlines for installation and retrofitting of technologies onboard ships
Over the last three days the RampD Forum itself saw cutting-edge presentations and
challenging discussions We have heard about technical and regulatory aspects of
compliance monitoring and enforcement and various ideas on how to meet the challenge In
addition we were able to appreciate the progress that has been made in the continuous
development of ballast water treatment systems
I am sure that the stimulating discussions and cooperative spirit of this week will continue
even after we have reluctantly left the beautiful city of Istanbul and returned to our respective
countries We have all learnt a great deal both in terms of developing solutions to treat
ballast water but also when it comes to testing verifying and monitoring compliance with the
Convention
This Forum in the series of IMO-GloBallast RampD conferences on Ballast Water Management
also illustrated another important fact that continuous innovation and collaborative RampD
efforts have been and will continue to be instrumental to the success of the global efforts to
address marine biosafety issues in general and ballast water issues specifically It has
therefore been very encouraging to see that all of you ndash representing the majority of the
worldrsquos expertise on Ballast Water Management from the shipping industry academia and
Administrations ndash chose to come to Istanbul for this our Forum your Forum This is a great
vote of confidence for our joint determination to meet the challenges ahead of us and it
shows what we can accomplish in the maritime sector when we work together towards a
common goal
This RampD Forum could not have come at a better time IMO has been actively seeking a
solution to the ballast water issue since the late 1980s mdash first through the adoption of
voluntary guidelines and later through the adoption of the Convention in February 2004 As
you know we have already met the requirements for the Conventionrsquos entry into force when it
comes to the number of contracting Parties I sincerely hope it will not be long until we also
187
meet the tonnage criteria 35 of the worldrsquos merchant tonnage after which the Convention
will enter into force within twelve months
But regardless of when that happens this will not be an end-point The work of IMO continues
through our committees and sub-committees our Integrated Technical Cooperation
Programme the Biosafety Section of the Secretariat itself as well as the GloBallast
Programme and the Global Industry Alliance A Convention is a living instrument and we will
continue to work with our Member States intergovernmental and non-governmental
organizations and all our other partners to ensure that the transfer of invasive alien species
through the pathway of ships is reduced and ultimately eliminated In this respect you may
know that the Organization is also pursuing the other vector for transferring invasive species
by ships ndash hull fouling In fact as a first but significant step the latest meeting of the Marine
Environment Protection Committee held at IMO in July this year adopted the 2011
Guidelines for the control and management of ships biofouling to minimize the transfer of
invasive aquatic species
Ladies and Gentlemen allow me to conclude by thanking those that have been involved in
the lead up to and coordination of this very busy week of activities and I know that you are
many Preparations for the various activities started almost a year ago and since then a
number of people in several organisations have worked together to make sure that it came to
fruition
First and foremost allow me to thank our hosts the Government of the Republic of Turkey
for having the vision to embrace this extremely important and timely Forum I would in
particular single out the Turkish Prime Ministryrsquos Undersecretariat for Maritime Affairs and the
Scientific and Technological Research Council of Turkey for the coordination of all of the
events for making all the logistical arrangements and for their very generous hospitality In
this regard special mention should be made of Mr Murat Korccedilak from the Undersecretariat
for Maritime Affairs and Dr Arzu Olgun and Dr Oumlzen Arlı from TUBITAK for their
outstanding and relentless dedication during the preparations Thank you very much and our
188
thanks go also to all of your colleagues who have been involved in the preparations for this
week
I would also like to thank our other partners in this weekrsquos events mdash the International
Chamber of Shipping and the Institute for Marine Engineering Science and Technology for
their support during the organization and promotion of these activities
I cannot close without thanking my colleagues in the Marine Environment Division of IMO for
their hard work ndash the GloBallast Partnerships Project Coordination Unit with Jose Matheickal
Fredrik Haag and AichaCherif as well as DanduPughiuc and the Biosafety Section I know
that they have been working on the preparations for this weekrsquos activities for a long time and
I am sure that they are extremely pleased to see the excellent fruit of all this work during this
highly successful week
Ladies and Gentlemen
As I now officially close this Forum my final vote of thanks goes to all of you who made the
effort to join us here in Istanbul this week ndash fellow participants exhibitors presenters and
keynote speakers Allow me once again to commend your dedication to the ballast water
management issue and the fight against the transfer of harmful aquatic organisms and
pathogens Your efforts your resourcefulness and your determination to find solutions to this
threat against the worldrsquos oceans and seas have shown what is possible to accomplish when
we all work together Let us keep up these efforts in the months to come so that we are ready
when the Convention enters into force
With that I would like to acknowledge all of you for your active participation in the RampD Forum
and the pre-conference workshops I look forward to seeing you at the next RampD Forum and I
wish you all a safe trip home
189
THE SCIENTIFIC AND TECHNOLOGICAL RESEARCH COUNCIL OF TURKEY
MARMARA RESEARCH CENTER
(TUBITAK - MRC)
TUBITAK-The Scientific and Technological Research Council of Turkey is the leading agency
for management funding and conduct of research in Turkey It was established in 1963 with a
mission to advance science and technology conduct research and support Turkish
researchers
It was established in 1963 with a mission to advance science and technology conduct
research and support Turkish researchers TUumlBİTAK is responsible for promoting
developing organizing conducting and coordinating research and development in line with
national targets and priorities
More than 1500 researchers work in 15 different research institutes of TUumlBİTAK where
contract research as well as targeted and nation-wide research is conducted
Marmara Research Center (MRC) was found in 1968 under the fold of TUBITAK and its
activities started in 1972 MRC has a proven record of supplying technical assistance to
industry and local government on many different levels Originally intended as a platform to
allow Turkish industry access to current technology and applications the Center has
expanded to a level where internationally accredited research and development is routunily
undertaken The accumulated knowledge and experience base together with the extensive
facilities available within the Center are made accessible to clients under one of several
possible research and collaboration schemes The multi-disciplinary nature of the Center
provides a breadth of coverage of scientific skill unmatched by many other oganizations
191
GloBallast Partnerships
Following the success of the original Global Ballast Water Management Project
known as lsquoGloBallastrsquo The International maritime Organization (IMO) has again
joined forces with the Global Environment Facility (GEF) the United Nations
Development Programme (UNDP) Member Governments and the shipping
industry to implement a five-year follow-up project to sustain the global
momentum in tackling the ballast water problem and to catalyze innovative global
partnerships to develop solutions
The main aim of GloBallast Partnerships (GBP) is to assist developing countries to reduce the
risk of aquatic bio-invasions mediated by shipsrsquo ballast water and sediments The project is
being implemented by UNDP and executed by IMO under the GEF International Waters
portfolio using a multicomponent multi-tiered approach involving global regional and
country-specific partners representing government industry and non-governmental
organizations (NGOs)
bull A global component managed through a Programme Coordination Unit at IMO in
London providing inter national coordination and information dissemination
including the development of tool - kits and guidelines and establishing a strong co-
operation with industry and NGOs
bull A regional component providing regional coordination and harmonization
information sharing training and capacity building in the application of ballast water
management tools and guidelines
bull A significant country component to initiate legal policy and institutional reforms to
address the issue and to implement the International Convention for the Control and
Management of Shipsrsquo Ballast Water and Sediments In fact 13 countries from 5
high priority regions are taking a lead partnering role focusing especially on legal
policy and institutional reform All told more than 70 countries in 14 regions across
the globe are directly or indirectly participating and benefiting from the Project
193
The International Maritime Organization (IMO)
The International Maritime Organization (IMO) is the specialized agency of the United Nations
with responsibility for ensuring that lives at sea are not put at risk and that the environment is
not polluted by international shipping The Convention establishing IMO was adopted in 1948
and IMO first met in 1959 IMOrsquos 168 member States use IMO to develop and maintain a
comprehensive regulatory framework for shipping IMO has adopted more than 50
Conventions covering safety environmental concerns legal matters technical co-operation
maritime security and the efficiency of shipping IMOrsquos main Conventions are applicable to
almost 100 of all merchant ships engaged in international trade
For more information about IMO please contact us or refer to our website below
International Maritime Organization
4 Albert Embankment
London SE1 7SR
United Kingdom
Tel +44 (0)20 7735 7611
Fax +44 (0)20 7587 3210
Email infoimoorg
Web wwwimoorg
195
Undersecretariat for Maritime Affairs
UMA-Turkish Prime Ministry Undersecretariat for Maritime Affairs is the maritime
administration that is responsible for establishing ballast water management issues for
Turkey

ii
A TUumlBİTAK MRC ENVIRONMENT INSTITUTE
PUBLICATION IN COLLABORATION WITH THE GEF-
UNDP-IMO GLOBALLAST PARTNERSHIPS PROGRAMME
TUumlBİTAK MRC
PO BOX 41470
KOCAELI-TURKEY
First published in Turkey in 2012
All papers Copyright copy TUumlBİTAK-MRC Publications 2012 The views expressed are those of
the authors and do not necessarily reflect the view or policy of TUumlBİTAK - MRC or the GEF-
UNDP-IMO GloBallast Partnerships Programme TUumlBİTAK-MRC Publications and the
Editors while exercising the greatest care in compiling this volume do not hold themselves
responsible for the consequences arising from any inaccuracies therein
All rights reserved Except for quotation of short passages for the purposes of criticism and
review no part of this publication may be reproduced stored in a retrieval system or
translated in any form or by any means electronic mechanical photocopying recording or
otherwise without the prior permission of the publisher
ISBN 978-975-403-730-2
Cover image provided by Onur Tan
English Edition by Stephanie Messina Dikeccedil
iii
CONTENTS
Acknowledgements v
Foreword vii
Introduction xi
TUumlBİTAK Marmara Research Center
Opening Addresses 1
IMO- Marine Environment Division
Forum program 7
SELECTED CONFERENCE PAPER
Limitations with respect to vital staining techniques 13 for use in treated ballast water
August D Tobiesen Anne-Marie Bomo Stephanie Delacroix Aina C Wennberg and Helge Liltved
Ecological risk of treated ballast water a mesocosm experiment 21
AC (Andrea) Sneekes NHBM (Klaas) Kaag and EM (Edwin) Foekema
Technology of shiprsquos ballast water treatment using middotOH 31 radicals based on IMO Guidelines
Mindong Bai Nahui Zhang Zhitao Zhang Yiping Tian Xiyao Bai
The forgotten fraction The importance of organisms 41
smaller than 10 microm when evaluating ballast water treatment systems
Isabel van der Star Viola Liebich Peter Paul Stehouwer
ERMA first BWTS an integrated and modular ballast water 51 treatment system Performance and compliance with IMO guidelines Efi Tsolaki Konstantinos Stampedakis Yannis Moulinos Nikos Kyritsis
Lab-Scale Chlorine Generation 67
Ceren Bilgin Guumlney Fatma Youmlnsel
A ballast discharge monitoring system for great lakes 83 relevant ships a method for researchers ship owners and agency officials
Allegra Cangelosi Tyler Schwerdt Travis Mangan Nicole Mays Kelsey Prihoda
iv
Sampling of ballast water for compliance control 109
Stephan Gollasch Matej David
Validation of a shipboard filer skid for sampling zoo plankton 115 from ballast water
Matthew First
Efforts to develop a ballast water detecting device 117 Goran Bakalar
A portable sensitive plankton viability assay for IMO 127 shipboard ballast water compliance testing
Nick Welschmeyer Brian Maurer
Finalized methodology for risk assessment of active 141 substances under procedure (G9) Jan Linders
Risk assessment for exemptions from BWM 151 the Intra-baltic HELCOM study
Matej David Stephan Gollasch Erkki Leppaumlkoski
Ballast Water Management in Turkey ndash an overview 157
Murat Korccedilak
Biological efficacy of electrolytic BWMs 171 (electro-cleentm system) during on board installation
Yong Seok Park Dong Hyun Shon Gwang Ho Lee Hyun Ju Moon Hyung Geun Jeon
Assessing of the Ballast Water Risk in Ceyhan Marine Terminal 177
Arzu Olgun Aslı Suha Doumlnertaş Cihangir Aydoumlner Yasemin Guumlmuumlşluumloğlu
Closing remarks 185
Mr Espinoza Ferrey Director MED IMO
Information about organizers 189
v
ACKNOWLEDGEMENTS
This publication contains a selection of presentations and papers the IMO - GloBallast Global
RampD Forum on Ballast Water Management ldquoCompliance Monitoring and Enforcement the Next
RampD Challengerdquo which was held in İstanbul Turkey on 26-28 October 2011
Special thanks are owed to the partners and sponsors who made this event possible in particular
IMarEST and ICS
Our very special thanks go to the Mr Jo Espinoza-Ferrey Director Marine Environment Division
IMO for their kind attention contribution welcoming addresses and his closing remarks to the
Forum
We would like to express our sincere gratitude to Dr Oumlzkan Poyraz Mr Oumlmer Tıktık and Mr
Murat Korccedilak from the Undersecretariat for Maritime Affairs (UMA) for all their valuable support
and taking part in the organization process of the Forum
Many thanks are also due to our colleagues for their hard work who supported the 2011 RampD
Forum from IMO in particular Mr Fredrik Haag Ms Aicha Cherif and Dr Joseacute Matheickal as well
as Dandu Pughiuc A special acknowledgement must go to the GloBallast Partnerships
Programme of the IMO for their initiative in recognizing the possibilities for this Forum towards
enhancing the momentum of the discussion on ballast water treatment and management systems
In particular we would like to thank the International Scientific Advisory Committee who aided into
selecting the topics and the papers for the Forum and of course we would also like to thank
every one of those thirty-five expert presenters for their addresses presentations and
interventions in the discussions as well as for their knowledgeable contributions of papers for
publication in these proceedings
We would like to express our heart-felt thanks to especially Dr Oumlzen Arlı Kuumlccediluumlkosmanoğlu
Emrah Ali Pekdemir İbrahim Tan and our friends in TUBITAK MRC Environment Institute for the
great job they achieved in all the relevant activities A special note of appreciation is also for
Stephanie Messina Dikeccedil for her outstanding efforts in the linguistic edit work
Arzu OLGUN Ahmet BABAN
TUumlBİTAK MARMARA RESEARCH CENTER
vii
FOREWORD
Global RampD Forum on Ballast Water Management ldquoCompliance Monitoring and Enforcement
the Next RampD Challengerdquo was held with the initiative of the GEF-UNDP-IMO Globallast
Partnerships Programme the TUumlBİTAK Marmara Research Center (TUBITAK- MRC) and
the Turkish Undersecreteriat for Maritime Affairs (UMA) The RampD Forum was held in
İstanbul Turkey on October 26 - 28 In conjunction with the Forum two different workshops
and conferences were held The Forum was attended by more than 130 participants
representing technology developers the maritime industry academia and the international
and regional agencies from around the world and was considered a major success by forum
participants
The third meeting of the Global Expert Forum on Ballast Water Test Facility Harmonization
was held on 24-25 October continuing their discussions and efforts to further harmonize the
approaches to testing and verifying ballast water treatment technologies The Forum was also
preceded by the 2nd IMO-IMarEST Shipbuildersrsquo Forum on Ballast Water Management on 25
October
The RampD Forum itself focused on ldquoCompliance Monitoring and Enforcement (CME) ndash the next
RampD issuerdquo and was opened by UMA IMO and TUBITAK The welcome speech on behalf
of IMO was delivered by Mr Jo Espinoza-Ferrey Director MED
The welcome remarks were followed by keynote speeches Ms Theresa Crossley Head of
Implementation European Maritime Safety Agency (EMSA) gave a keynote speech where
she highlighted the EU agenda for invasive alien species and EMSArsquos ballast water
programme and research in terms of compliance Mr Alfonso Castillero Director General
Merchant Marine Panama Maritime Authority delivered a powerful speech ensuring the
participants that Panama is committed to doing all it can as quickly as it can to address
marine biosecurity issues in ways which will safeguard the shipping industry interests and
deliver substantial net environmental benefit
viii
Over the three days of the Forum a breadth of topics were presented including the
experiences from testing of technologies for compliance Port State Control issues an
overview of current ballast water technologies and how these meet the compliance criteria
sampling and monitoring (including latest developments in rapid diagnostic tools) risk
assessments and related tools in the CME framework regional and developing country
perspectives on CME as well as the ship-ownersrsquo and shipbuildersrsquo perspectives
The busy agenda allowed almost every community to share their views and ideas on how to
meet the challenge but also their concerns and different perspectives The Forum also
illustrated the dedication of all those present from the shipping industry academia and
Administrations
There were very informative presentations followed by wide-ranging and active discussions
during both the plenary and panel sessions that also addressed issues such as the challenge
to meet the IMO Ballast Water Convention standards compliance and monitoring
A total of 35 technical papers and 8 posters were presented over the three days covering the
testing of the technologies for compliance port state control issues and experiences risk
assessments and related tools in the CME framework sampling and monitoring including
latest developments in rapid diagnostic tools performance of current technologies in meeting
the compliance criteria developing country perspective on CME and compliance for
alternative technologies
The Forum concluded with a Panel discussion highlighting the importance of the RampD efforts
now that the entry into force of the BWM Convention is imminent but also on the need for the
technologies to be validated for ship use and for the receiving environment to be closely
monitored The Forum was also informed that the next RampD Forum will take place in Republic
of Korea in October 2013 and that the next ICBWM (International Conference of Ballast
Water Management) will take place in Singapore in November 2012
ix
Over the course of the three days the significant progress made since the last RampD Forum
which was held in Malmouml Sweden in January 2010 was apparent For example in early
2010 there were 7 ballast water treatment systems having received their Type Approval
certificates At the time of the meeting in Turkey this had more than doubled (17 systems)
with a further 30-40 systems in different stages of development The theme of the Forum
taking a more in-depth look at the CME was thus very timely Even though challenges are
undoubtedly still there as the field of ballast water management is still developing the ever-
growing pool of knowledge and experiences around the world is an encouraging sign that the
global community is continuing to rise to the challenge determined to work together to
address the issue
Solutions that cater to the various needs of the shipping industry are being developed but
what is now more needed than ever is to share the growing amount of operational
experiences to overcome the remaining hurdles We therefore believe that conferences and
forums a such as the IMO-GloBallast RampD Forum will therefore continue to provide a crucial
platform for exchanging views end inspire constructive dialogue
The Organizing Committee
Dr Mustafa Tırıs Dr Arzu Olgun Dr Ahmet Baban Ms Oumlzen Arlı Kuumlccediluumlkosmanoğlu Dr Jose Matheickal
Dr Oumlzkan Poyraz Mr Oumlmer Tıktık Mr Murat Korcak Mr Fredrik Haag Ms Aicha Cherif
xi
INTRODUCTION
The increasing globalization of the world economy in recent decades has unavoidably
spurred international trade While this development has brought some favorable opportunities
around the globe it has caused some undesirable consequences In this sense one of the
areas in which international trade has raised concerns has been environmental sciences
While the debates on this issue include a multidimensionality based on different interest
groups within the field certain adverse effects emerged are obviously undeniable One of
these effects which needs immediate policy attention on a global base appears to be the
ballast water discharge of sea vessels
As well known maritime transportation constitutes a major part of international trade
particularly in terms of tonnage and hence is an inevitable means for transferring goods
However the sea vessels operating for this purpose throughout global waters do not only
transfer goods but also a variety of biological organisms including animals plants and
bacteria some of which deteriorate the aquatic ecosystem This unfavorable fact
unfortunately is led by the ballast water taken in by ships for stabilization purposes which is
discharged upon the loading of cargo Considering the huge amount of ballast water used by
the sea vessels due to the significant volume of maritime trade the danger posed for the
planet is certainly nontrivial
The main problem is that because the ballast water unintentionally transmits the species of a
certain region to another one the biological materials ending up alive at their new location
can act in an invasive manner to reproduce and establish a population Such behavior of
those alien organisms poses a threat for the native ones in terms of crowding-out or
destruction resulting in damage to the habitat they belong to
Various studies have shown that thousands of different species are carried in ballast tanks
which significantly threaten the biodiversity in the seas around the globe It is also underlined
in these studies that the rate as well as the extension of the bio-invasions continue to
increase affecting not only the marine environment but also the human health in an adverse
manner Hence the problems caused by invasive species de-ballasted into new national
xii
waters have been experienced by many countries to date including Turkey In this regard
the research has revealed that Turkish coasts host 400 non-native species a significant part
of which was brought by ships Among these one of the biggest damages known so far was
caused by the filter-feeding North American comb jelly Mnemiopsis leidyi that depleted a
considerable amount of native plankton stocks in the Black Sea generating a major economic
loss for the commercial fishery in the region
Therefore Turkey is quite familiar with and very conscious about the ballast water problem
and considers it one of the key environmental priorities to be handled both at national and
international levels as the solution lies at the heart of global cooperation That is why Turkey
has completed a national initiative to address the related threat by commissioning a one
million US Dollar project which has been conducted with collaboration between the
Undersecretariat for Maritime Affairs of Turkey (UMA) and the Scientific and Technological
Research Council of Turkey (TUBITAK) with the purpose of producing a synergy to develop
an operational ballast water management strategy and system in the country
Within the framework of the project an inventory of the maritime transport activities of the
Turkish coasts has been developed in the form of a database system in order to determine
the quantity and sources of the ballast water discharges at the Turkish ports In this
framework all these ports have been subjected to a risk assessment process using the
GloBallast Risk Assessment Methodology Furthermore a Geographical Information System
(GIS) as well as an Invasive Species Database have been developed during the project
period
So Turkey takes the issue seriously and keeps investing in the RampD activities in the field in
order to offer effective solutions to the problem In this regard we gladly hosted the Global
RampD Forum on Ballast Water Management in Istanbul in order to create a platform for
international participants to discuss the related subjects ranging from treatment technologies
to shipbuilding As expected it resulted in the following outcomes
xiii
Achieving close and fruitful collaboration among the scientists and administrators
Enhancing the awareness towards risks imposed by BW handling and transport
Providing the opportunity for the Turkish shipping sector to improve knowledge and
make assessment and projection for the existing conditions and future needs
Disseminating innovative methodologies and technologies for ballast water
monitoring and management
Adapting for the compliance of legislative issues and their relevant implementation
practices
Lastly it is important to note that Turkey has started the ratification procedure for the Ballast
Water Convention and hence it is believed that the successful results of the Global RampD
Forum on Ballast Water Management held in Istanbul would certainly have a positive impact
on relevant developments I am sure that this proceedings of the Forum will help disseminate
the research results on recent developments in the area of ballast water management and
benefit the scientists and researchers who try to bring solutions to the current issues
Prof Dr İbrahim Dinccediler (Acting) President of TUumlBİTAK MRC
1
Global RampD Forum on Ballast Water Management
ldquoCompliance Monitoring and Enforcement the Next RampD Challengerdquo
Istanbul Turkey
26-28 October 2011
Opening address by Mr Jo Espinoza-Ferrey
Director Marine Environment Division IMO
Welcome to Turkey
Dr Poyraz Director General of the Undersecretariat for Maritime Affairs
Dr Baban Acting Director of Environment Institute Marmara Research Center TUBITAK
Distinguished Panel members participants
Ladies and Gentlemen
It is a great pleasure to be with you here in Istanbul for this fourth Global Research and
Development Forum on Ballast Water Management
Dear friends The news of the devastating earthquake in Eastern Turkey has filled all of us with great
sadness even as we rejoice for the safe discovery of survivors and for the courage and
untiring determination of all those involved in the rescue operations
On behalf of the Member States of the International Maritime Organisation our Secretary-
General Mr Efthimios Mitropoulos and all of us in the Secretariat I wish to convey to the
Government and people of Turkey and especially to all those directly affected by the
earthquake our most sincere condolences and deep sympathy
As you may know IMO has arranged RampD conferences on Ballast Water Management
for almost a decade ndash in fact since 2002 The first two conferences focused on treatment
technologies Back then what has now grown into an industry and global market of its own
2
was just in its infancy and the RampD Fora held at IMO Headquarters were part of our strategy
to assist in the research and development efforts that were starting to grow around the world
The most recent and third RampD Forum was held in January 2010 hosted by the World
Maritime University in Malmouml Sweden That event focused on the emerging alternative
solutions to ballast water management During that wintery week in Malmouml participants were
introduced to solutions such as variable buoyancy concepts thermal systems applying
retrieved heat as well as single source systems to treat a variety of waste streams onboard
to mention but a few During the pre-conference workshop an open and constructive
discussion took place on how to prove equivalency between systems approved under the G8
and G9 Guidelines of the Convention and these new emerging ideas Also as a side-
meeting to the RampD Forum the worldrsquos test facilities for ballast water treatment systems met
for the first time to plant the first seeds for a global network on harmonization of testing
procedures
The third Forum emphatically demonstrated that the RampD community is ready to take on the
challenge of meeting the needs of the shipping industry when it comes to adapting to the
regulatory regime under the Ballast Water Management Convention Since then and
although it is only 18 months ago we have come even further and it is most pleasing to be
able to inform you that during the sixty-second session of IMOrsquos Marine Environment
Protection Committee which was held in July earlier this year the Committee endorsed a
procedure for approving lsquoother methodsrsquo of ballast water management in accordance with
regulation B-37 of the Convention This will certainly open the door for new methods and
concepts to prevent risks arising from the transfer of invasive species
In addition as of today 17 treatment systems have received type approval under the G8 or
G9 Guidelines which means that there are indeed a variety of technologies out there to meet
the demand from the shipping industry
3
And not least we now have 30 Parties to the Convention which actually means that the only
remaining hurdle for the Convention to enter into force is the tonnage criteria The current
contracting Parties represent 2644 of the gross tonnage of the worldrsquos merchant shipping
whereas 35 is required for the Convention to enter into force I therefore urge all of you in
a position to do so to promote the earliest possible ratification of the Convention by your
Governments so that the benefits to the environment that it was designed to deliver can be
attained expeditiously
So with this recent progress in mind what are the next challenges facing us Well as we get
closer to entry into force and countries prepare for implementation of the Convention it is
clear that there is a need to address the specific challenges of monitoring compliance with
and the enforcement of the Convention And in this context there is no doubt that the RampD
community will be playing a pivotal role This is exactly why we decided that the theme for this
yearrsquos RampD Forum should be ldquoCompliance Monitoring and Enforcement the next RampD
challenge and opportunityrdquo
The RampD Forum relay baton has now been taken over by the Republic of Turkey welcoming
us to and hosting this yearrsquos Forum in the beautiful historic and certainly maritime city of
Istanbul We are extremely grateful to our colleagues and friends in the Turkish Prime
Ministryrsquos Undersecretariat for Maritime Affairs and to TUBITAK the Scientific and
Technological Research Council of Turkey who have worked very hard over the last six
months or so to make this event possible And our thanks go also to the ICS and IMarEST for
their sponsorship of this weekrsquos activities
But even though the Forum starts today there have already been plenty of activities earlier
this week On Monday and yesterday the worldrsquos ballast water treatment test facilities
convened for their third meeting This is a unique and truly commendable effort with those
involved in the testing of treatment systems having recognized the need for a constructive
and continuing dialogue on this issue with a view to harmonize test procedures and
reporting Their aim is to set minimum testing standards and to strengthen cooperation and
4
exchange of information between the test facilities in order to improve the comparison of
testing and reporting of systems This will both increase the buyersrsquo confidence in the
products and have positive impacts on comparison of the systemsrsquo performance which will be
highly relevant for compliance monitoring and enforcement In their meeting over the last two
days representatives from Administrations and class societies were invited to discuss their
experiences and needs on issues such as reporting of test results The next step is to
formalise this network through the signing of a MoU
In addition to that activity the second IMO-IMarEST Shipbuildersrsquo Forum on Ballast Water
Management has also been held here at this hotel The intention of the Shipbuildersrsquo Forum
was to provide the latest information to shipbuilders and ship repair yards in particular on
those issues in which they will play a crucial role such as installation and retrofitting of ballast
water treatment systems This one-day Forum therefore saw presentations from ship
owners class societies vendors of systems IMO and IMarEST Furthermore it was an
opportunity for useful open dialogue among those that will be involved in the task of making
sure that the world fleet is ready for the Convention requirements when it enters into force
So the week has already gotten off to a flying start and we have a very busy programme for
the next three days We will have the opportunity to discuss issues such as testing for
compliance experiences with port State control the current state when it comes to ballast
water treatment technologies latest developments on sampling and monitoring and not least
the developing country perspective
Ladies and gentlemen
Before the detailed technical sessions start you will have the opportunity to listen to the views
of three keynote speakers - three extremely relevant perspectives on the Ballast Water
Management Convention delivered by Mr Dandu Pughiuc from IMO Ms Theresa Crossley
from the European Maritime Safety Agency (EMSA) and Mr Alfonso Castillero from the
Directorate of Merchant Marine in the Panama Maritime Administration Providing you with
5
views from the global regional and national levels I am sure that these three speakers will
give us an excellent backdrop for the presentations and discussions that follow
Fellow participants I certainly look forward to the debates and exchange of ideas and views
that lie ahead of us in the next three days and I am sure you do too
So on behalf of IMO and with renewed thanks to the Government of Turkey and TUBITAK
for hosting what promises to be a most stimulating event I hereby welcome you to the fourth
IMO-GloBallast RampD Forum on Ballast Water Management and I wish you a great
conference
Or as they say over here İstanbul`a hoşgeldiniz ve bu konferansa hoşgeldiniz
Thank you
7
FORUM PROGRAM
Tuesday 25 October
0830 - 0900 Registration
0900 ndash 0915 Welcoming remarks
UMA TUBITAK-MAM IMO-GloBallast and IMarEST
0915 ndash 0945 Introduction The regulatory framework - the Ballast Water Convention and its
implication for shipbuilders and repair yards
Jose Matheickal IMO-GloBallast
0945 ndash 1030 Keynote address Ship-owners Perspectives on Ballast Water Management
Options Experiences and concerns
William Nugent OSG
1030 ndash 1100 Coffee break
1100 ndash 1145 Ballast Water Treatment Technologies - Technical considerations experiences and
concerns in retrofitting and new-builds
Jad Mouawad DNV
1230 ndash 1400 Lunch break
1400 ndash 1445 BWM Technologies ndash Remaining scientific and technological challenges
David Wright IMarEST and Jim Mackey Hyde Marine
1445ndash 1530 Challenges of installing Ballast Water Treatment Systems on large vessels such as
tankers and in Explosion Zones
Leif Erik Caspersen OceanSaver AS
1530ndash 1600 Coffee break
1600ndash 1630 Class society perspectives on survey and certification
Jad Mouawad DNV
1630 ndash 1700 Discussion Do the current solutions address the industry needs and concerns
Opportunities and challenges ahead for shipyards and shipbuilders
Day 1 ndash Wednesday 26 October
Opening Session
0900-1000 Registration and refreshments
1000-1015 Welcome from the organizers
Undersecretariat for Maritime Affairs of Turkey TUBITAK-MAM and IMO-GloBallast
8
FORUM PROGRAM
1015-1030 Opening address
Jo Espinoza-Ferrey Director Marine Environment Division International Maritime
Organization (IMO)
Plenary keynote session
Moderator Jose Matheickal Chief Technical Adviser GloBallast Partnerships IMO
1030-1100 Keynote address
Dandu Pughiuc Head Biosafety Section IMO
1100-1130 Keynote address
Theresa Crossley Head Implementation Department European Maritime Safety
Agency
1130-1200 Keynote address
Alfonso Castillero Director General Directorate of Merchant Marine Panama
1200-1230 QampA with keynote speakers
1230-1400 Lunch break
1400-1530 Session 1 Testing of technologies for compliance
Moderator Mario N Tamburri MERC United States
Session keynote Testing of technologies and the emerging global network of test facilities including a
report from the 3rd Global Test Facility Forum
Sjur Tveite NIVA Chairman of the Global Network of Test Facilities Norway
Harmonisation of testing regimes ndash comparability of testing in tropical and temperate climates
Martin Andersen DHI Ballast Water Technology Innovation Centre Singapore
Improved procedures for sampling and analysis of disinfection by-products and toxicological
parameters of treated ballast water
Stephanie Delacroix NIVA Norway
Limitations with Respect to Vital Staining Techniques for Use in Treated Ballast Water
Anne Maria Bono NIVA Norway
Ecological risk of treated ballast water a mesocosm experiment
Andrea Snakes IMARES Netherlands
Technology of shiprsquos ballast water treatment using bullOH radicals based on IMO Guidelines
Mindong Bai Dalian Maritime University China
The importance of organisms smaller than 10 um
Isabel van der Star Viola Liebig and Peter Paul Stehouwer NIOZ Netherlands
Session 2 Port State Control issues and experiences
Moderator Murat Korccedilak UMA Turkey
Session keynote Key aspects of Port State Control under the BWM Convention
Raphael Baumler World Maritime University
9
FORUM PROGRAM
A Proposed Framework for Compliance Monitoring of Ballast Water Discharge Regulations
Mario N Tamburri MERC United States
The Occurrence of Pathogenic Bacteria in Some Shipsrsquo Ballast Water Coming from Various Marine
Regions to the Sea of Marmara Turkey
Guumllşen Altuğ Istanbul University Turkey
An Examination of the Practicalities of Compliance Monitoring and Enforcement
Jon Stewart International Maritime Technology Consultants United States
Day 2 ndash Thursday 27 October
0945-1030 Session 3 Overview of current ballast water technologies meeting the compliance
criteria
Moderator Allegra Cangelosi GSI United States
Session keynote Overview of current technologies
Graham Greensmith Lloydrsquos Register United Kingdom
Type approval of BW treatment systems ndash experiences
Jad Mouawad DNV Norway
ERMA FIRST ballast water treatment system an integrated and modular ballast water treatment
system Performance and compliance with IMO Guidelines
Efi Tsolaki ERMAFIRST ESK Engineering Solutions SA
Ballast Water Treatment Solution From Turkey Akballast TM
Buumllent İşmen AK Gemi Company Turkey
The second generation of Ballast water treatment systems
Leif Erik Caspersen OceanSaver AS Norway
Lab-Scale Chlorine Generation
Ceren Bilgin Guumlney Fatma Yonsel Department of Shipbuilding and Ocean Engineering Istanbul
Technical University Istanbul Turkey
Session 4 Sampling and monitoring including latest developments in rapid diagnostic tools
Moderator Jan Linders GESAMP BWWG Chair and Brian Elliot EMSA (TBC)
Session keynote Sampling aspects for CME under the BWM Convention
Brian Elliot EMSA
Great Ships Initiative Sampling Systems for Land- and Ship-based Ballast Water Treatment System
Performance Testing
Allegra Cangelosi GSI United States
Sampling of ballast water for compliance control and Possible tools for organism detection in ballast
water samples
Stephan Gollasch GoConsult Germany
10
FORUM PROGRAM Validation of a shipboard filer skid for sampling zoo plankton from ballast water
Matthew First SAIC Inc Naval Research Laboratory United States
Efforts to develop a ballast water detecting device
Goran Bakalar Maritime Consultancy Croatia
Evaluations of Total Residual Oxidant Technologies for use in Monitoring Ballast Water Treatment
System
Amy Zimmer Faust Maritime Environmental Resource Center University of Maryland United States
Updated Experiments using a portable imaging instrument as a rapid diagnostic tool for IMO Indicative
monitoring compliance for BWTS
Kent Peterson FlowCam United States
A portable sensitive plankton viability assay for IMO shipboard ballast water compliance testing
Nick Welschmeyer and Brian Maurer United States
Day 3 ndash Friday 28 October
0945-1030 Session 5 Risk assessments and related tools in the CME framework
Moderator Adnan Awad IOI
Session keynote The Turkish approach to Risk Assessments
Arzu Olgun Emrah Ali Pekdemir TUBITAK Turkey
Finalized methodology for risk assessment of active substances under procedure (G9)
Jan Linders National Institute for Public and Environment-Expert Centre for Substances Netherlands
Ballast water management related risk assessment ndash The intra-Baltic HELCOM study
Erkki Leppaumlkoski Akademi University Turku Finland
Session 6 Regional and developing country perspectives on CME
Fredrik Haag GloBallast Partnerships Marine Environment Division IMO
Session keynote The role ofexperiences with Port Biological Baseline Surveys in developing countries
Adnan Awad International Ocean Institute Southern Africa
Ballast Water Management in the Wider Caribbean Region Progress and Challenge
Andrew Wood RAC-REMPEITC-Carib
Ballast Water Management in Turkey ndash an overview
Murat Korcak Undersecretariat for Maritime Affairs of Turkey
Session 7 The ship-ownersrsquo and shipbuildersrsquo perspectives
Moderator Dandu Pughiuc IMO
Session keynote Technical issues for selection of a ballast water system for an Aframax tanker
Vayia Hatziyianni and Maria Sotiriou OSG
11
FORUM PROGRAM QampA session
1500-1600 Plenary session - Panel Discussion
Compliance and monitoring Are the current RampD efforts matching requirements of the Convention
Moderator Jose Matheickal IMOGloBallast
Closing remarks
Mr J Espinoza-Ferrey Director Marine Environment Division IMO and Undersecretariat for Maritime
Affairs of Turkey TUBITAK-MAM
Forum closes
POSTER PRESENTATIONS
Analysis Of Actıve Substance And Relevant Substance in Shiprsquos Ballast Water Management (BWM)
System
Ji Hyun Lee Young Keun Im Dong Yoon Kim Jin Hoon Do Jun Ho Park Sung Uk Lee Won Tae Cho
Effects of Fresh Water Electrolysis On Algal GrowthEunjoo Choi Sojung Jung Yongseok Park Myung
Hwan Do Kyung Soon Shin Kitate Rhie
Biological Efficacy of Electrolytic BWMs (Electro-Cleen Tm System) During on Board Installation
Yong Seok Park Dong Hyun Shon Gwang Ho Lee Hyun Ju Moon Hyung Geun Jeon
Harmful Algal Species in Anthropogenically Impacted Water of The Syrian Coastal Waters
Feirouz Darwich
Ballast Water Risk Assessment SystemndashAlien Species Module
Arzu Olgun Oumlzen Arlı Kuumlccediluumlkosmanoğlu Tolga Atalay Fatma Telli Karakoccedil
Vildan Tuumlfekccedili
Ballast Water Risk Assessment SystemndashBallast Water Reporting Module
Emrah Pekdemir Arzu Olgun Tolga Atalay Cihangir Aydoumlner
Assessing of the Ballast Water Risk and the Alien Species in Iskenderun Bay Turkey
Arzu Olgun Aslı Suha Doumlnertaş Cihangir Aydoumlner Yasemin Guumlmuumlşluumloğlu
Ballast Water Risk Assessment System ndash Risk Assessment and Route Analysis Module
Cihangir Aydoumlner Arzu Olgun Tolga Atalay Onur Akyol Emrah Pekdemir Oumlzen Arlı
12
13
BALLAST WATER MANAGEMENT SYSTEMS
Limitations with Respect to Vital Staining
Techniques for Use in Treated Ballast Water
August D Tobiesen1 Anne-Marie Bomo Stephanie Delacroix
Aina C Wennberg and Helge Liltved
Abstract
Staining cells in the ge10-50 microm size group in treated ballast water with the vital stain 5-
carboxyfluorescein diacetate acetoxymethyl ester (CFDA) has been used to detect viable cells In
intact viable cells the non-fluorescent CFDA will be taken up in the cytosol where it becomes
hydrolysed into fluorescence end products Viable cells can be identified and distinguished from dead
cells by studying the stained sample with an epifluorescence microscope Some limitations with this
method have been observed during full-scale land-based testing of UV treatment systems
Determination of viable cells in the 10-50 um size group using the CFDA method seems to
overestimate the number of viable cells compared to results based on plate counts and dilution
cultures the two latter techniques being a direct measurement of the cells ability to reproduce In an
attempt to investigate the consistency between the three methods (CFDA staining technique plate
counts and dilution culture) on UV-treated samples some preliminary laboratory-scale experiments
were carried out where the algae Tetraselmis suecica in seawater was treated with different UV
doses and viability in samples quantified using CFDA staining plate counts and dilution culture The
results were compared with a parallel study where Tetraselmis suecica was treated with ozone doses
in the range of 0 ndash 180 mg TROsl using the same three methods The results from the study with
ozone gave more consistant results between CFDA and the culture-based methods For UV-treated
water large deviations were observed at UV doses up to 600 mWscm2 At higher UV doses (ie up to
2400 mWscm2) consistency among the methods was evident However such high dosages are not
used for ballast water treatment
Based on these results one may conclude that staining techniques may overestimate viability in UV-
treated samples compared to cultivation methods Additionally staining procedures should be
amended to incorporate the time needed for UV treatment to manifest itself It may be suggested that
methods based on cell cultivation are more reliable with respect to the organisms ability to reproduce
and should be used for evaluation of long-term viability of algae in UV-treated water either alone or
complementary to staining methods for organisms that are not easily cultivated in the laboratory
Key words viable stain enumeration algae ballast water
1 Norwegian Institute for Water Research Gaustadalleen 21 0349 Oslo Norway
14
TOBIESEN BOMO DELACROIX WENNBERG AND LILTVED
Introduction
The introduction of invasive marine species into new environments by shipsrsquo ballast water has
been identified as having serious impacts on the marine ecology of the worldrsquos oceans The
International Convention for the Control and Management of Shipsrsquo Ballast Water amp
Sediments was adopted by the International Maritime Organization (IMO) in 2004 The IMO
convention sets discharge limits on densities of live organisms by size class of organisms
For instance for organisms in the size group ge10m and lt50 m discharge water should
contain less than 10 viable organisms per milliliter (lt10 cellsml) To comply with the
discharge limits by IMO this implies that the worldrsquos fleet must invest in approved technology
for treatment of their ballast water before discharge
Since the success of a treatment system and the ability of a ship to meet the ballast water
discharge standards are determined by the number of viable organisms in treated water
general methods are required that can be used to detect these living organisms at low
densities in treated water
Common methods for analyzing and quantifying organisms in the 10-50 microm range are
measuring chlorophyll culture dependent methods (dilution culture plate counts) ATP
assays flow cytometry and direct counts andor in combination with fluorescent vital stains
(Garvey et al 2007 Reavie et al 2010 Steinberg et al 2011a Steinberg et al 2011b)
Vital staining methods with different fluorescent stains (ie FDA CFDA CFDMA) either
alone or in combinations have been emphasized as suitable methods for detecting living
organisms in the 10-50 microm range in treated ballast water (Reavie et al 2010 Steinberg et
al 2011b) One fluorescent staining method for detecting viable cells in the ge10-50 microm size
group in ballast water is to incubate samples with 5-carboxyfluorescein diacetate
acetoxymethyl ester (CFDA) and study the stained cells with an epifluorescence microscope
(Ganassin et al 2000) In intact viable cells the non-fluorescent CFDA will be taken up in the
cytosol where it becomes hydrolysed into fluorescence end products Viable cells can be
identified and distinguished from dead cells as viable cells are a bright yellowgreen colour
while non-viable cells are pale green (heterotrophic cells) or pale green with red
autofluorescence of the chloroplast (photoautotrophs)
Since 2006 numerous ballast water management systems have been tested through land-
based testing at NIVArsquos (Norwegian Institute for Water Research) test facility for ballast water
management systems in Solbergstrand Norway Documentation of viable organisms in the
10-50 um size group are performed using the CFDA staining technique In addition standard
culture techniques such as dilution cultures and plate counts are always conducted as a
supplement to the CFDA staining technique However when performing land-based tests on
technologies that utilize UV irradiation the CFDA staining technique has been shown to
15
LIMITATIONS WITH RESPECT TO VITAL STAINING TECHNIQUES
overestimate the number of viable cells relative to complimentary methods used that are
based on regrowth (ie organism concentration in treated water being higher than the
discharge requirement (gt10 cellsml) and the results using the CFDA method deviating from
results based on plate counts and dilution cultures (cell concentration lt10 cellsml)) The
consequences of not fulfilling the discharge requirements can be disqualification of test
cycles possibly leading to non-approval of the treatment system by national administrations
and IMO
In an attempt to better understand the extent of these observations from land based testing
(ie to investigate the consistency of the three methods (CFDA staining technique plate
counts and dilution culture) on UV treated samples and to assess to what extent the UV dose
applied could impact the deviating results) some preliminary laboratory-scale experiments
were carried out where the algae Tetraselmis suecica in seawater was treated with different
UV doses and living cells were quantified using CFDA staining plate counts and dilution
culture As a comparison to UV treatment quantification of Tetraselmis suecica with the same
three methods was also conducted in ozone treated seawater
The algae Tetraselmis suecica from NIVAs algae culture collection was used as the test
organism in all laboratory experiments Tetraselmis suecica was grown autotrophically in
seawater growth media with added nutrients and harvested in the exponential phase Cell
density was determined using a Beckman Coulter ldquoMultisizer 3rdquo coulter counter In case of too
dense cell cultures the algae solution was mixed with 045m seawater (salinity gt 32 PSU)
Initial concentrations of algae in all experiments were 104 - 105 cellsml
Materials and Methods
Test organisms
The algae Tetraselmis suecica from NIVArsquos algae culture collection was used as the test
organism in all laboratory experiments Tetraselmis suecica was grown autotrophically in
seawater growth media with added nutrients and harvested in the exponential phase Cell
density was determined using a Beckman Coulter ldquoMultisizer 3rdquo coulter counter Where cell
cultures were too dense the algae solution was mixed with 045 m seawater (salinity gt 32
PSU) Initial concentrations of algae in all experiments were 104 - 105 cellsml
UV-irradiation
Algae solutions (15 ml) were added to Petri dishes and slowly stirred during UV irradiation
The UV lamp used was a 15 W (35 W of 254 nm UV output) low pressure germicidal lamp
(Philips Ltd Einhoven Netherlands) mounted in an apparatus which provided a collimated
16
TOBIESEN BOMO DELACROIX WENNBERG AND LILTVED
beam (Qualls and Johnson 1983) The UV dose defined as the product of average intensity
across the Petri dish and the exposure time was varied by varying the exposure time UV
doses ranging from 0 (control) to 2400 mWscm2 were applied in the experiment
Ozonation
Ozone was produced in an ozone generator (Wedeco Modular 8 HC) An ozone stock
solution (8 mgl TRO) was made by bubbling ozone produced by the ozone generator into a
bottle of 045m filtered seawater (32 PSU) Aliquots of this stock solution were diluted with
seawater and algae to achieve ozone doses of 0 (control) 24 60 120 and 180 mg TROsl
Ozone concentration was measured using the colorimethric DPD method (Hach method
8167) and ozone doses were defined as the product of measured TRO concentration (TRO
as mgl Cl2) in the ozonated seawater and algae mixture and contact time (two minutes)
After two minutes of contact time all samples were neutralized with natriumthiosulphate prior
to being analyzed
Determination of viable Tetraselmis suecica after treatment
Cultivation on agar plates
Samples were spread on a seawater agar growth medium and incubated in constant light for
3-7 days at 20 oC Colonies of Tetraselmis suecica were observed by viewing agar plates in a
stereo microscope at 160x magnification
Dilution culture method (after Throndsen 1978)
Sample volume of 1 ml was added to 9 ml of media (20 Z8 seawater media) After mixing
1 ml of this sample was further diluted with 9 ml The number of dilutions was set to cover the
expected cell density range in the original sample Three to five parallels were employed in
order to provide statistical significance of the estimated number Test tubes were incubated in
constant light for two weeks at 20ordmC After two weeks positive test tubes (ie tubes were
growth occurred) where counted Based on this the number of cells in the original sample
was calculated
CFDA staining (after Ganassin et al 2000)
The viability of the Tetraselmis suecica was determined by observing cells incubated with
CFDA Samples were inspected with an epifluorescence microscope using an excitation filter
of 485 nm and an emission filter of 530 nm In the epifluorescence microscope viable cells
were observable as bright yellowgreen cells while non-viable cells were pale green
(heterotrophic cells) or pale green with red autofluorescence of the chloroplast
(photoautotrophs) Cells were counted at 300x ndash 480x magnification
17
LIMITATIONS WITH RESPECT TO VITAL STAINING TECHNIQUES
UV treated samples were stored for 24 hours at 4ordmC in the dark before staining with CFDA
Ozonated samples were stained with CFDA on the same day as ozone treatment was
performed
Results and Discussion
Results from the study with ozone doses in the range of 0 ndash 180 mg TROsl showed that
enumeration of algae cells with the CFDA staining method was consistent with the culture
based methods (Figure 1)
Figure 1 Quantification of ozonated algae cells (Tetraselmis suecica) using plate
counts dilution culture and CFDA staining
Ozone is a strong oxidizing agent and will cause rapid damage to the cell membrane with
leakage of cellular constituents when the dose is high enough It was therefore expected
that it should be easier to distinguish between dead and live cells when enumeration with the
CFDA staining method and that the results based on CFDA staining should be consistent
with methods based on cell cultivation When using the same three methods for enumeration
of live algae in UV treated water significant deviations were observed for UV doses up to 600
mWscm2 (Figure 2) The vital staining method is based on cell activity which depends on a
non-damaged cell membrane and the presence of necessary enzymes As the principal effect
of UV irradiation is damage of the cellsrsquo DNA or RNA which in turn blocks replication of
nucleic acids and prevents cell multiplication the cell membrane and enzyme activity can be
intact for several hours or even days after treatment Such cells can still take up and
01
1
10
100
1000
10000
100000
0 40 80 120 160 200 240
Ozone dose (mg TROsl)
cfu
ml
01
1
10
100
1000
10000
100000
cell
sm
lPlate counts (cfuml) Serial dilution (cellsml) CFDA staining (cellsml)
18
TOBIESEN BOMO DELACROIX WENNBERG AND LILTVED
hydrolyse CFDA and may give false positive counts This is apparently the reason for the
deviating results as seen in Figure 2 At higher UV dosages (ie up to 2400 mWscm2)
consistency among the methods was more evident At the highest UV dose no living cells
could be detected neither with the culture dependent methods (all results below the detection
limit of the methods) nor with the CFDA staining method It should be noted however that
UV doses as high as 2400 mWscm2 are not used in ballast water treatment UV doses
necessary to inactivate marine organisms in the 10-50 um size group does not normally
exceed 300 mWscm2
Figure 2 Quantification of UV irradiated algae cells (Tetraselmis suecica) using
plate counts dilution culture and CFDA staining
The results from these preliminary experiments using the CFDA staining technique shows an
initial weak efficacy of UV treatment when cells are exposed to UV irradiation dosages that
do not immediately kill the cells We therefore conclude that the CFDA method will
overestimate the number of viable cells especially if the period following UV treatment before
staining with CFDA is short
Hence the methods based on cell cultivation should be regarded as more reliable with
respect to Tetraselmis suecica and should be used as complementary methods for the
evaluation of long-term viability of UV irradiated cells Experience from land-based testing at
NIVA have shown that the CFDA method and also the complementary methods based on
regrowth become more consistent if CFDA staining is delayed for some time after UV
treatment With awareness of the limitations with culture dependent methods in particular
01
1
10
100
1000
10000
100000
0 150 300 600 1200 2400
UV dose (mWscm2)
CF
Um
l
01
1
10
100
1000
10000
100000
cell
sm
lPlate counts (cfuml) Serial dilution (cellsml) CFDA (cellsml)
19
LIMITATIONS WITH RESPECT TO VITAL STAINING TECHNIQUES
the fact that culture media will only support the growth of some organisms and not the entire
plankton community underestimation of cell number is a consequence When estimating
viability in UV treated water it has therefore been decided to use all three methods (CFDA
staining plate counts and dilution culture) for quantification of organisms in the 10-50 microm size
group during land-based testing of UV ballast water treatment systems at NIVAs test facility
The problem addressed in this paper is limited to our experience with Tetraselmis suecica as
a test organism and should be further explored using natural organisms in the 10-50 um size
group
REFERENCES
Ganassin RC Schrimer K and Bols N (2000) Cell and Tissue culture In Ostrander GK (ed) The
laboratory fish Academic Press San Diego pp 631-651
Garvey M Moriceau B and Passow U (2007) Applicability of the FDA assay to determine the
viability of marine phytoplankton under different environmental conditions Marine Ecology Progress
Series 352 17-26
Reavie ED Cangelosi AA and Allinger LE (2010) Assessing ballast water treatments Evaluation
of viability methods for ambient freshwater microplankton assemblages Journal of Great Lakes
Research 36 540 ndash 547
Steinberg MK First MR Lemieux EJ Drake LA Nelson BN Kulis DM Anderson DM
Welschmeyer NA and PR Herring (2011a) Comparison of techniques used to count single-celled
viable phytoplankton Journal of Applied Phycology
Steinberg MK Lemieux EJ and Drake L (2011b) Determining the viability of marine protists using
a combination of vital fluorescent stains Marine Biology 158 1431 ndash 1437
Throndsen J (1978) The dilution-culture method In Sournia A (Ed) Phytoplankton manual
Unsesco Paris pp 218 ndash 224
21
BALLAST WATER MANAGEMENT SYSTEMS
Ecological risk of treated ballast water
a mesocosm experiment
AC (Andrea) Sneekes1 NHBM (Klaas) Kaag EM (Edwin) Foekema
Abstract
As a consequence of the IMO Ballast Water Convention in the near future large amounts of water
treated with an active substance will be discharged into harbours and coastal areas With regard to the
ecological risk assessment of active substances used in ballast water treatment systems mesocosms
may be applied Routinely mesocosms are applied as lsquohigher tier testsrsquo in the ecological risk
assessment of pesticides For ballast water testing adaptation of the test set-up is necessary as not a
small amount of a toxic substance is added but rather a significant volume of water is replaced
During spring 2011 such an experiment was conducted in 4-m3 outdoor marine mesocosms with
PERACLEAN Oceanreg as the active substance Three different treatment levels were created by
replacing 10 of the volume of test systems with treated ballast water aged for 1 hour (BW-d0) 24
hours (BW-d1) or 5 days (BW-d5) Two control systems did not receive any treatment At the same
time the toxicity of the ballast water was tested with standard laboratory bioassays confirming earlier
test results During the 69-day exposure period the water compartment was sampled weekly At the
end the test systems were drained and the bottom compartment was sampled
The results show that replacement of water without remaining active substances is not free from
effects However the level of toxic substances present in the treated water corresponded with the
degree of impact Effects seen in bioassays are not directly copied in mesocosms Results might be
affected by physical characteristics like pH oxygen DOC and nitrogen or phosphorus levels However
high risk indicated by the toxicity tests corresponded with high levels of disturbances in the ecosystem
Mesocosms can be used in higher tier assessment of whole effluents such as ballast water Even
when as much as 10 of the water volume is replaced by treated water treatment effects are obvious
Moreover clear recovery of some systems was observed within the test period enabling to assess the
No Observed Ecological Adverse Effects Concentration (NOEAEC) conform to De Jong et al (2008)
The mesocosms are a useful tool for assessment of treatments including the side effects in
discharged ballast water by integrating effects as well as recovery of multiple interacting species
Introduction
For ballast water treatment systems that use active substances there is a need to test their
system under IMO guideline G9 This guideline asks for estimating the ecological risk of the
1 IMARES Wageningen UR Dept Environment PO Box 57 1780AB Den Helder the Netherlands
22
SNEEKES KAAG FOEKEMA
active substance used in the BWMS [Ballast Water Management System] for the receiving
environment Toxicity tests the so-called bioassays need to be conducted to estimate the
ecotoxicological impact of the treatment on the environment A bioassay is a test in which an
organism is exposed to a series of concentrations of a substance or to whole effluents (WET-
testing) like discharged ballast water A batch of these tests including different trophic levels
of organisms like algae crustacean and fish are used to assess the risk of treated ballast
water in a harbor
However there is a large difference between the limited organisms used in bioassays when
compared to the vastness and complexity of a harbor not to mention the extensive variations
in the different harbors around the world Therefore results from these single species tests
must to be used with caution In the risk assessment this is done by using safety or
assessment factors (Table 1)
Table 1 Assessment factors for risk assessment of ballast water under IMO G9 as
presented by GESAMP in the 38th meeting
Assessment factor GESAMP 38th meeting (PNEC general)
10000 Lowest short-term L(E)C50 from 1-2 freshmarine species from one or two
trophic levels
1000 Lowest short-term L(E)C50 from 3 freshmarine species representing
three trophic levels
100 Lowest short-term L(E)C50 from 3 freshmarine species representing
three trophic levels + 2 additional marine species
100 1 chronic NOEC from freshmarine species but not algae
50 2 chronic NOEC from freshmarine species including algae representing
two trophic levels
10 3 chronic NOEC from freshmarine species including algae representing
three trophic levels
If limited information is available the uncertainty is higher and for translation to ecosystem
levels a higher safety factor is used As more information is gathered the safety factor can
be lowered Nonetheless as long as only single species tests are used and considered it is
difficult to translate the effects to an ecosystem where various populations interact
For (non-) agricultural biocides this problem was recognized and experimental ecosystems
(mesocosms) with multiple species have been developed These mesocosms allow the fate
and impact of a treatment on the ecosystem to be examined under longer-term controlled but
realistic (semi-natural) conditions In the legislation procedure of biocides mesocosms are
well accepted tools and data can overrule toxicity data derived from single species laboratory
23
ECOLOGICAL RISK OF TREATED BALLAST WATER
tests These mesocosm tests are all performed in stagnant fresh water systems and dosed
with an active substance More recently IMARES developed marine stagnant systems and
tested these systems with additions of substances Applicability for use with effluents like
ballast water discharge was not investigated yet The replacement of a portion of water may
in itself already cause multiple effects Therefore as part of the InterregIVb project called
ldquoNorth Sea Ballast Water Opportunityrdquo (NSBWO) the applicability of mesocosms for use in
whole effluent testing was investigated This pilot study was designed to try to answer two
research questions
- How can the effects caused by replacement of water and the effects of toxic
substances be discriminated
- How predictive are toxicity test results (ie bioassays) for the effects of treated
ballast water on ecosystems
Materials and Methods
The mesocosms that were used for this study were intended to mimic a shallow soft
sediment ecosystem as much as possible This type of ecosystem is common along the
whole European coast The mesocosms however are static whereas the ldquorealrdquo ecosystem is
characterised by a high rate of water refreshment It was decided however not to use flow-
through mesocosms for this test in order to allow a good determination of the fate of the
treatment In total eight tanks were selected for this pilot study Each circular tank had a
volume of 4 m3 The tanks were filled with a sediment layer and a water compartment Phyto-
and zooplankton were introduced with the test water at the start of the establishment phase
Lists of species representative for various taxonomic classes that are commonly present in
shallow soft sediment coastal ecosystems were introduced deliberately Sponges and
bivalves both use phytoplankton as their primary food resource For the bivalve species the
sediment dwelling cockle was selected Two gastropod species were introduced the small
mudsnail and the larger periwinkle Both species feed mainly on benthic algae but the
mudsnails live on the sediment surface while periwinkles prefer the solid substrate of the
mesocosm sides As a representative of the group of crustaceans larger than zooplankton
the mudshrimp was introduced This shrimp lives in the top layer of the sediment where it
feeds on organic material Deeply burrowed in the sediment the lugworm can be found in its
habitat in U-shaped burrows Lugworms are very important sediment bioturbators in many
shallow coastal ecosystems For stabilization of the ecosystems the water fraction was re-
circulated for one month This creates a stable community of pelagic invertebrates and micro-
flora as well as similar water quality conditions in all mesocosms at the start of the
application of the test substance (chlorophyll-a pH dissolved oxygen concentration salinity
and nutrient concentrations) Just before the start of the exposure phase each mesocosm
unit became static Within each system water circulation was created by continuous aeration
24
SNEEKES KAAG FOEKEMA
The salinity in the mesocosms was kept at the initial value 30plusmn2permil Evaporation losses were
replenished with demineralised water Each mesocosm was covered with a transparent lid to
minimise the influence of rainfall
Seawater was treated on several days to mimic different discharge and concentration
circumstances The following water treatment discharge scenarios were created 5days old
(BW-d5) 24 hours old (BW-d1) and freshly treated (BW-d0) Each treatment was dosed into
two mesocosms Two control tanks (Control) did not receive any ballast water Dosing into
the mesocosms was performed on the same day by replacing approximately 10 of the total
water volume The ballast water was treated with PERACLEAN Oceanreg provided by Evonik
Degussa GmbH This treatment consists of two main active substances ndash Peracetic acid
(PAA) and hydrogen peroxide (H2O2) To check the dosing concentrations the discharge
water was measured before and after dosage in the mesocosm tanks No H2O2 and PAA
could be measured for the control and BW-d5 H2O2 was still present in the BW-d1 and BW-
d0 treated water and about 10 could still be measured after dosing into the mesocosms
Hardly any PAA could be measured in BW-d1 and none was detected after dosing in the
mesocosms Only BW-d0 showed the presence of PAA The dosed mesocosms were
monitored for another 69 days to monitor the effects Extensive analyses were performed
during the exposure period These included water quality parameters like oxygen and pH but
also sampling of zoo- and phytoplankton communities After the deployment period the
systems were emptied and the sediment compartment was also sampled intensively
As results from the study were still being processed at the time of the presentation only
observations were presented Statistical analysis of the data had not been done
Results
Toxicity of the ballast water was tested at the start of the exposure in the mesocosm
experiment In total three bioassays were selected a bacteria test (ISO 2007) an algae test
(ISO 2006) and rotifer test (MicroBioTests Inc) Each bioassay tested all of the different
treated ballast waters and a sample of untreated ballast water The samples were diluted in a
concentration series according to the test procedures of each bioassay At 10 dilution the
expected effects of the treated ballast water samples in the mesocosms could be derived
(Figure 1) For the Control tanks and for the BW-d5 tanks no toxicity was found The algal
toxicity test showed inhibitory effects of approximately 40 for the BW-d1 No effects were
found for the bacteria and the rotifer test All three bioassays showed effects for the freshly
prepared ballast water (BW-d0) ranging from 100 inihibition for the bacteria to
approximately 60 effect for the algae and rotifers
25
ECOLOGICAL RISK OF TREATED BALLAST WATER
Figure 1 Results of the bioassays at 10 of the discharge ballast water samples Presented
are results from a bacterium an algae and a rotifer test
Figure 2 shows a selection of the results for the mesocosm study The line graphs present the
number of days on the x-axis before and after dosing For the bar graphs the treatment is
presented on the x-axis In all graphs the error bars are the ranges of the different
treatments For the line graphs the ranges of the control are accentuated with a green color
The biomass of the phytoplankton community is presented as total chlorophyll-a
concentration The before period is the stabilization time for the systems The graph shows
that the systems were following similar patterns After dosage a short stimulation is seen for
the five-day old ballast water (BW-d5) After about three weeks the pattern is similar to the
control again BW-d1 showed negative effects during the first ten days and stimulation effects
for about three to four weeks BW-d0 reduced during the first ten days and then remained
stimulated for about five weeks After six weeks all systems show very low concentrations of
chlorophyll which is normal for summer conditions Due to the very low concentrations it is
uncertain whether full recovery took place
The zooplankton community was sampled weekly and biweekly samples were selected for
analyses Calanoid copepods seem to show stimulation for BW-d5 and BW-d1 but not for
BW-d0 This effect is seen more often in mesocosm research and is often referred to as a
classic mesocosm result As a response to effects on other species a population is
stimulated until the dose becomes toxic Stimulation of the harpacticoid copepods is seen for
BW-d1 and BW-d0 BW-d5 follows the control system After 42 days the zooplankton
populations collapse in all systems
Bivalvia larvae produced by the introduced cockles were more numerous in BW-d1 and BW-
d0 when compared to the control system and BW-d5 After a short period the larvae settled
and disappeared from the water column However sampling the benthic community at the
end of the study confirmed the higher amounts of juvenile cockles in BW-d1 and BW-d0
Bacteria toxicity test10 of discharge samples
Control BW-d5 BW-d1 BW-d00
20
40
60
80
100
Treatment
inh
ibit
ion
(
)
Algal toxicity test10 of discharge samples
Control BW-d5 BW-d1 BW-d00
20
40
60
80
100
Treatment
inh
ibit
ion
(
)
Rotifer toxicity test10 of discharge samples
Control BW-d5 BW-d1 BW-d00
20
40
60
80
100
BW-d5
Control
BW-d1
BW-d0
Treatment
mo
rtality
(
)
26
SNEEKES KAAG FOEKEMA
Figure 2 Graphs of a selection of the ballast water mesocosm results Presented
are phytoplankton (chlorophyll-a) zooplankton (copepods and bivalvia)
amphipods (Corophium volutator and Microdeutopus gryllotalpa) and polychaeta
(Polydora ciliate)
Total Chlorophyll-a (microgl)
-42 -28 -14 0 14 28 42 56 70
5
10
15
20
daynr
Copepod (calanoid)
Daynr
co
un
t
0 14 28 42 56 70
500
1000
1500
2000
2500Control
BW-d5
BW-d1
BW-d0
Copepod (harpacticoid)
Daynr
co
un
t
0 14 28 42 56 70
500
1000
1500
Bivalvia
Daynr
co
un
t
0 14 28 42 56 70
500
1000
1500
Corophium volutator
Treatment
co
un
t
Control BW-d5 BW-d1 BW-d00
200
400
600Control
BW-d5
BW-d1
BW-d0
Microdeutopus gryllotalpa
Treatment
co
un
t
Control BW-d5 BW-d1 BW-d00
20
40
60
80
Polydora ciliata
Treatment
co
un
t
Control BW-d5 BW-d1 BW-d00
5
10
15
Cockle (juveniles)
Treatment
co
un
t
Control BW-d5 BW-d1 BW-d00
1000
2000
3000
4000
5000
27
ECOLOGICAL RISK OF TREATED BALLAST WATER
The population of Corophium volutator amphipods in the mesocosms seemed to be able to
cope with the stress of the dosing with BW-d5 and BW-d1 The population was reduced for
the mesocosms which were dosed with BW-d0 However another amphipod (Microdeutopus
gryllotalpa) showed up in the BW-d0 discharge and not in the other systems Still total
amphipod counts remained lower when compared to the other treatments
The polychaeta Polydora ciliata shows the classic mesocosm graph wherein the species
population compared to the control system is stimulated for BW-d5 inconclusive for BW-d1
and reduced for BW-d0
Conclusions
In Table 2 results are summarized by comparing the control situation with the three different
treated ballast waters If there was stimulation seen in the analysis for the treated water
compared to the control this is shown in green whereas red indicates negative effects and
yellow indicates that no clear effects were visible If the effects were clearly observable but
only for a short period this is shown as dashed The three toxicity tests are presented first
Even though no toxicity was found for BW-d5 the mesocosm study does reveal some effects
These effects can be a result of replacing the water and also a result ofphysical changes
caused by the treatment (eg pH oxygen) In toxicity tests the aim is to look at chemical
effects and not physical effects even though it is part of a treatment In a mesocosm study
and at discharge in a harbor the physical changes will be an important characteristic of the
effluent and thus have a potential effect One toxicity test revealed negative effects for BW-
d1 - the algae test The phytoplankton biomass however was stimulated in the mesocosm
study and not hampered This is opposite to what is expected to happen More parameters
seem to be stimulated by the treatment and only one has shown negative results It should
be recalled however that phytoplankton was seriously reduced the first ten days after
treatment All toxicity tests revealed negative effects for the treatment In the mesocosms
negative effects for many of the species were seen but stimulating effects were also seen
such as for the algae after the first drop the harpacticoid copepods and the large amounts of
cocklespat
It is concluded that replacement of water without remaining active substances is not free from
effects However the level of toxic substances present in the treated water corresponded with
the amount of effects Effects seen in bioassays are not directly copied in mesocosms
Results might be affected by physical characteristics like pH oxygen DOC NP However
high risk indicated by the toxicity tests corresponded with high level of disturbances of the
ecosystem Mesocosms can be used in higher tier assessment of whole effluents such as
ballast water Even when as much as 10 of the water volume is replaced by treated water
28
SNEEKES KAAG FOEKEMA
treatment effects are obvious Moreover clear recovery of some systems was observed
within the test period enabling to assess the No Observed Ecological Adverse Effects
Concentration (NOEAEC) conform to De Jong et al (2008) The mesocosms are a useful tool
for assessment of treatments including the side effects of ballast water discharge by
integrating effects as well as recovery of multiple interacting species
Table 2 Summary of a selection of results for the pilot ballast water mesocosm study
Presented is the effects for the control system versus each treatment for a list of tests
(toxicity test organism and water characteristics) including the type of output
(C=concentration N=numberscounts and G=growth) The effects are presented in
colour where Yellow=no clear effects Red=negative effects Green=stimulation effects
dashed=temporary effects
Type of test Control versus
BW-d5 BW-d1 BW-d0
Bacteria test -
Algae test -
Rotifer test -
Total Chlorophyll-a C
Copepod (calanoid) N
Copepod (harpacticoid) N
Bivalvia larvae N
Cockles (juveniles) N
Corophiumvolutator N
Microdeutopusgryllotalpa N
Polydora ciliate N
Halichondriapanicea G
Mytilusedulis G
Ctenodrilusserratus N
Cockles (adults) N
Littorinalittorea N
TOC C
DOC C
Acidity C
Oxygen C
Ortho-phosphate C
Oligochaeta sp N
Arenicola marina N
Ammonium C
29
ECOLOGICAL RISK OF TREATED BALLAST WATER
REFERENCES
De Jong FMW TCM Brock EM Foekema and P Leeuwangh (2008) Guidance for summarizing
and evaluating aquatic micro- and mesocosm studies A guidance document of the Dutch Platform for
the Assessment of Higher Tier Studies RIVM report 6015060092008
ISO (2006) International Standard Water quality - Marine algal growth inhibition test with Skeletonema
costatum and Phaeodactylum tricornutum Second Edition 2006-04-15 NEN-EN-ISO 102532006(E)
ISO (2007) International Standard Water quality - Determination of the inhibitory effect of water
samples on the light emission of Vibrio fischeri (Luminescent bacteria test) - Part 3 Method using
freeze-dried bacteria Second edition 2007-12-01 ISO 11348-32007(E)
MicroBioTests (sa) ROTOXKIT Mtrade Brachionus toxicity screening test for estuarine and marine
waters MicroBioTests Inc Belgium V071090
31
BALLAST WATER MANAGEMENT SYSTEMS
Technology of shiprsquos ballast water treatment using
middotOH radicals based on IMO Guidelines
Mindong Bai1 Nahui Zhang Zhitao Zhang Yiping Tian Xiyao Bai
Abstract
A new method of middotOH radicals is available for fast killing (within several seconds) of harmful aquatic
organisms and pathogens in the course of discharging a shiprsquos ballast water With the strong electric-
field discharge the O2 in air and H2O in a gaseous state are ionized and dissociated into a number of
activated particles such as O2+ O3 H2O+ and H2O2 which are injected into a portion of the ballast
water to form the dissolved middotOH and other active substances including O2macr HO2- HO3 O2+ H2O etc
In an middotOH treatment system of 10 th a series of experiments were completed As a result the D-2
ballast water discharge standard of IMO was satisfied and realized The contents of 45 kinds of
chemical substances such as bromated haloalkane haloacetic acid haloacetonitriles and halophenols
were under the test limit according as the Drinking Water Standard of World Health Organization
(WHO) The evaluated results showed that treated ballast water posed a low potential risk to the
aquatic environment and there was no unacceptable risk to human health
Key Words Ships ballast water strong electric-field discharge OH radicals IMO Guidelines D-2
discharge standard WHO drinking water standard no potential risk
1 Introduction
The introduction of invasive marine species into new environments by a shiprsquos ballast water
has been identified as one of the four greatest threats to the worldrsquos oceans Until today
about 500 different species are known to have been transported via ballast water Sixteen
kinds of invasive red tide algae introduced into China Sea by ballast water resulted in great
destruction to aquiculture As a result whole ecosystems are being changed and economic
losses of up to 10 billion USD is being caused each year Consequently IMO Regulation D-2
ballast water discharge standard is forced to require that the aquatic organism concentrations
in the discharge of ballast water should be below specified limits At the same time a ballast
water treatment system for producing and using chemical active substances such as middotOH
radicals ozonation chlorination is necessary to obtain Basic and Final Approvals G9 of IMO
As a result many technologies for the treatment of shipsrsquo ballast waters have been
developed such as filtration and ultraviolet radiation (UV) chlorination ozonation thermal
1 Environmental Engineering Institute Dalian Maritime University Dalian (116026) China
32
M BAI N ZHANG Z ZHANG TIAN AND XBAI
techniques electrolysis deoxygenation and so on None of these potential solutions is in
wide use however For example treatment systems combining UV with filtration have been
installed only on a small number of ships and it is not known whether any systems now
available will consistently and efficiently meet the discharge requirements of developing
regulations In addition the lamps of UV technology need periodic cleaning and are easily
broken So far no effective method is available for fast killing (within several seconds) of
harmful aquatic organisms and pathogens in the course of discharging a shiprsquos ballast water
Based on the G9 Guidance and D-2 ballast water discharge standard of IMO a new
treatment method for ballast water using middotOH radicals were presented In a 10 tmiddoth-1 (tonne
per hour) OH treatment system a series of experiments such as biological efficacy water
qualities chemical analysis and aquatic toxicity were completed
2 Strong electric-field discharge and formation of OH radicals
21 Strong Electric-Field Discharge
A physical method based on the strong electric-field discharge (SED) was applied to treat
ballast water The configuration of SED is shown in Figure 1 The strong discharge plasma
was filled in two micro-gaps (width=047mm) Two α-Al2O3 dielectric layers with a thickness
of 02mm dielectric constant of 10 and an insulation intensity of 350 kVcm were covered on
an Ag thin plate discharge electrode (180times90 mm2) The self-made power supply was applied
on the discharge electrodes with the following parameters peak voltage 7 kV frequency
104 kHz current pulse width and 5~10 ns With the dielectric layers (15) problems such as
restricted electric current uniform and unstable distribution of micro plasma bundle and the
power deposition were solved The micro discharge gap allows the electrons to be
accelerated resulting in increased numbers of high-energy electrons compared to the
conventional discharges at atmospheric pressure The electron density in the discharge gap
was high due to the applied high-frequency power supply
Figure 1 Photo of SED
The SED in micro-gap
The exposure time 1125 s
Discharge zone
Micro streamer
The exposure time 1micros
Discharge path Charge deposition
0
200
400
600
800
500
900
100
700
300
Relative ligh
t rad
iation
inten
sity
33
TECHNOLOGY OF SHIPrsquoS BALLAST WATER TREATMENT USING middotOH RADICALS
In order to obtain larger numbers of OH radicals the electron energy has to be higher than
the ionization potential of O2 and H2O (125eV and 126eV) and dissociation potential of O2
(84 eV) respectively With a method of strong electric-field discharge the electrons have an
average energy of 9 eV allowing many electrons to have a high enough energy to ionize and
dissociate O2 and H2O
22 Formation of OH Radicals
The plasma processes of middotOH formation are shown in Figure 2 (a) (b) and (c) In part (a) the
O2 molecules are ionized and dissociated into the oxygen activated particles of O2+ O(1D)
O(3P) etc In part (b) the H2O molecules are ionized into H2O+ and H3O+ and then form H2O2
In part (c) these active particles are injected into the GasLiquid dissolver by a high pressure
injector in which the middotOH radicals are efficiently produced
The dissolution of middotOH in ballast water involves very complicated chain reactions It is very
quickly converted into other activated molecules such as HO2- HO2 HO3 OH- O3OH+ O2
-
O3- O3 H2O2 and so on meanwhile rapidly killing the harmful microorganisms in a given
shiprsquos ballast water
Figure 2 Plasma process of OH formation
23 Active substance
The term ldquoactive substancerdquo means a substance that has a general or specific action on or
against harmful aquatic organisms and pathogens In our treatment system OH combined
O2
O
O2
O3-
H+
HO3
H2O
O2 H2O
H2O
H3O+
O2
+
OH
HO2-
H+H2O2
O2-
HO2
O2
H2O2
H2O+
H
e
e
H3O+
H2O
2e
e
H2O
H3O+
e
e
+
e
2e
H2O
O2
O2
H+
(a) (b) (c)
(2)
(1)
(3)
34
M BAI N ZHANG Z ZHANG TIAN AND XBAI
with other kinds of oxygen active substances such as HO2
macr O2macr HO3 O2
+H2O etc had
the most significant contributions with respect to killing harmful organisms due to their strong
oxidizing effects
In addition OH radicals react with bromide ions (Brmacr) in seawater to form hypobromous
acidhypobromite (HOBrOBrmacr) and bromamines Theoretically speaking however both
HOBrOBrmacr and bromamines have a certain germicidal effect on controlling bacteria algae
and macroscopic bio-fouling organisms during the storage period of treated ballast water
The concentration of total oxygen active substances is measured by TRO (total residual
oxidant) analyzer during the treatment The TRO refers to all of the oxidants which have the
ability to kill harmful aquatic organisms and pathogens
3 Experiment
31 Experimental System
The experimental system for ship ballast water treatment is shown in Figure 3 When
ballasting as a first step ballast water is filtered by an automatic self-cleaning filter for
removing the large particles and organisms of gt50 μm In the main pipe a part of ballast
water is pumped into middotOH equipment to produce large numbers of middotOH radicals and other
active substances including HO2macr O2
macr HO3 O2+H2O etc so that harmful organisms and
pathogens are rapidly killed in the course of conveying the shiprsquos ballast water This effluent is
then directed into the ballast tank for 5 days of testing When de-ballasting the filter and the
middotOH equipment are passed-by and the treated ballast water is to be neutralized at discharge
to ensure that the TRO is less than 02 mgL in any case There are three sampling points of
A B and C corresponding to the samples for control water treated water and treated water
with neutralization
Figure 3 Schematic diagram of middotOH ballast water treatment system
35
TECHNOLOGY OF SHIPrsquoS BALLAST WATER TREATMENT USING middotOH RADICALS
Two different salinity ballast waters ndash with high salinity (337 PSU) and low salinity (231 PSU)
ndash were used for OH killing experiments Water samples were collected from the ballast tank
0 2 and 5 days after OH treatment The flow velocity of ballast water in the main pipe was
15 ms and the flow rate measured by Model 8035 Burkert Flow meter (Burkert Co in
France) was 10 m3h The energy cost for the treatment of the shiprsquos ballast water was
30Whm3 without considering the energy cost of pumping
32 Test Methods
321 Biological test
Algae and bacteria The living bodies of algae were identified and counted using the
automatic Fluorescence Microscope (Olympus BX61) The bacteria were fast-counted using
Epics Altra II Flow Cytometry (Co Beckman Coulter) meanwhile the colony-forming unites
were calculated by plating the membrane filtered sample on ocean 2216E agar medium
322 Chemical analysis
The chemical analysis methods and corresponding analyzers are shown in Table 1 The
items of ballast water quality including pH Temperature DO Salinity Turbidity ORP were
measured using Multiparameter water quality sondes (YSI-6600 V2) The DOC and POC
were tested by Ligui TOC
Table 1 List of analytical methods used for each chemical tested
Item Test method Analyzer
TROTRC DPD Method UNICO7200 type Spectrophotometer
Bromate Ion Chromatographic Method ICS-1500 Ion chromatograph DIONEX
Trihalomethane Gas Chromatographic Method
7890A Gas chromatograph Agilent Haloacetic acids Gas Chromatographic Method
Haloacetonitriles Gas Chromatographic Method
Sodium thiosulfate Iodometric Method - The detection value of TRO is the amount of OH O2
macr O3 HOBrOBrmacr and bromamines And the detection value of TRC is the amount ofOH O2
macr O3 and HOBrOBrmacr
4 Experimental Results and Discussion
Both high and medium salinity sea water was used for analysis however the test results of
the high salinity sea water is only shown in the following section (Table 2 and Table 3)
41 OH killing experiment
For the OH killing experiment five kinds of algae and three kinds of bacteria were in the
system of the shiprsquos ballast water The dimensions of algae were in the range of 10~50 μm
Two group experiments were done for different algae contents of 123times104 cellsmL and
36
M BAI N ZHANG Z ZHANG TIAN AND XBAI
0508times104 cellsmL The concentrations of E coli I Enterococci and Heterotrophic bacteria
were about 13times104 12times104 and 38times104 cellMl respectively After OH treatment the algae
content of 123times104 cellsmL was decreased to 8 cellmL when the TRO was 186 mgL and
algae content of 0508times104 cellsmL was reduced to 9 cellsmL when the TRO was 141
mgL After both 2 days and 5 days of storage no living algae were detected in the ballast
tank At the same time no living bacteria were found in the ballast tank after either 0 days 2
days or 5 days of storage The results were tested by the Detecting Center of Xiamen
University with Accreditation of ISOIEC 17025 The results indicate that the D-2 ballast water
discharge standard of IMO was satisfied
Table 2 Experiment results of high salinity water
Item 0h (Day 0) 48h (Day 2) 120h (Day 5)
Control Treated Control Treated Control Treated
TRO (mgL) 0 141 0 021 0 0
Organism ge10 ~ 50 microm
(cellmL) 0508times104 9 2400 0 1000 0
Escherichia coli
(cfu100mL) 14times104 0 13times104 0 11times104 0
Intestinal Enterococci
(cfu100mL) 12times104 0 11times104 0 95times104 0
Heterotrophic bacteria
(cellmL) 39times104 0 33times104 0 29times104 0
TRO (mgL) 0 186 0 044 0 0
Organism ge10 ~ 50 microm
(cellmL) 1235times104 8 05times104 0 021times104 0
Escherichia coli
(cfu100mL) 13times104 0 11times104 0 10times104 0
Intestinal Enterococci
(cfu100mL) 12times104 0 10times104 0 78times104 0
Heterotrophic bacteria
(cellmL) 38times104 0 32times104 0 29times104 0
42 Water qualities
Water properties are shown in Table 3 Three basic water qualities including temperature
salinity and pH showed almost no change after OH treatment on Day 0 Day 2 and Day 5
respectively
The oxidation-reduction potential (ORP) increased three times with the injection of oxygen
active substances when TRO is 186 mgL but returned to the original value with the
neutralization of Na2S2O3 The ORP of 6836 mV after OH treatment decreased with the
decrease of TRO which decreased to 2626 mV on Day 2 and 2591 mV on Day 5 Dissolved
oxygen (DO) increased with the injection of TRO and decreased with the attenuation of TRO
37
TECHNOLOGY OF SHIPrsquoS BALLAST WATER TREATMENT USING middotOH RADICALS
However DO after 5 days of storage was still higher than that of the original value of 708
mgL Both total suspended solids (TSS) and turbidity decreased significantly at the intake of
the tanks due to the filtration
The addition of OH resulted in an immediate increase in the DOC in ballast water at the
intake of the tanks about from 252 to 531 mgL A possible explanation for these results is
that due to the sterilizing characteristics of the hydroxyl radical which can kill invasive
species in ballast water rapidly making the biological cells rupture and a large number of
cellular content overflow thus the DOC content increases initially By contrast the addition of
OH resulted in an immediate decrease of the POC in ballast water at the intake of the tanks
from about 205 to 001 mgL and then increased slowly to a final stable trend
Table 3 Water qualities (high salinity seawater)
Item
0 day 2 day 5 day
Control Treated Treated with neutralization
Treated Treated
TRO (mgL) ---- 186 ---- 044 001
Salinity (PSU) 337 336 339 338 336
Temperature (degC) 1273 1379 1359 1450 1442
pH 821 820 826 830 824
ORP (mV) 2291 6836 2294 2626 2591
DO (mgL) 708 798 957 900 830
TSS (mgL) 113 68 69 64 55
Turbidity (NTU) 290 199 222 210 20
DOC (mgL) 252 531 551 372 351
POC (mgL) 205 001 005 091 11
POC (particulate organic carbon) is estimated from total organic carbon (TOC)
Based on these results we can reach a conclusion that OH can purify water and decline the
contaminant levels
41 Chemical analysis
The potential by-products in the seawater treated by middotOH have been tested and analyzed
Chemical analysis results are given in Table 4
The results indicate that bromate was always below the MDL in all samples From the other
tested compounds four THMs (tribromomethane trichloromethane dibromochloromethane
and bromodichloromethane) all nine HAAs (monochloroacetic acid dichloroacetic acid
trichloroacetic acid monobromoacetic acid dibromoacetic acid tribromoacetic acid
38
M BAI N ZHANG Z ZHANG TIAN AND XBAI
bromochloroacetic acid bromodichloroacetic acid and dibromochloroacetic acid) were
detected The maximum concentration of bromoform and tribromoacetic acid which have
been detected in treated ballast water during the development of middotOH treatment were 682
microgL in high salinity water It is obvious that the formation of THMs and HAAs increased over
time initially and then decreased slightly (especially halogenated carbon) which can be
related to the degradation of TRO TRO degraded very rapidly under conditions tested In all
tests TRO completely degraded below 02 mgL (detection limit ppm) within less than hours
Then the degradation rate was slightly slower after 70 hours probably trended to be stable
Thus the formation of halogenated carbon increased in the presence of TRO whereas it
decreased with the decline of TRO over time It is assumed that the maximum concentration
of halogenated carbon would occur around 70 hours after OH treatment and then begin to
decrease slowly
Table 4 Data summary for chemical analysis (337 PSU)
Chemical name Unit MQL
Day 0 Day 2 Day 5
Control Treated Treated after neutralization
Treated Treated
TRO mgL 001 ND 241 ND 044 001
TRC mgL 001 ND 23 ND 042 ND
Bromate microgL 001 ND ND ND ND ND
Tribromomethane microgL 001 ND 425 412 626 487
Trichloromethane microgL 001 206 078 074 079 206
Dibromochloromethane microgL 001 ND 083 046 228 299
Bromodichloromethane microgL 002 038 088 014 016 0017
Monobromoacetic acid microgL 001 ND 261 248 145 188
Dibromoacetic acid microgL 002 291 603 413 176 122
Tribromoacetic acid microgL 002 107 578 502 56 108
Monochloroacetic acid microgL 001 ND 650 ND 162 225
Dichloroacetic acid microgL 001 227 223 217 067 ND
Trichloroacetic acid microgL 001 250 ND ND 078 091
Bromochloroacetic acid microgL 001 ND 603 ND ND ND
Bromodichloroacetic acid microgL 001 381 380 379 ND ND
Chlorodibromoacetic acid
microgL 001 ND ND ND ND ND
Dibromoacetonitrile microgL 001 ND ND ND ND ND
Sodium thiosulfate mgL 002 ND ND 08 ND ND
MDL method detection limit ND not detected
39
TECHNOLOGY OF SHIPrsquoS BALLAST WATER TREATMENT USING middotOH RADICALS
44 TRO decay
All TRO concentrations in the ballast tanks declined over time TRO levels reduced rapidly
during the first 24 hours of sampling (Figure 4) and then the rate of decay slowed after 48
hours The TRO declines below 02 mgL nearly 72 hours after storage
Our results suggested that a higher initial TRO concentration in ballast water would decay
more slowly than a lower initial TRO concentration Therefore increasing the initial TRO
would provide the disinfectant effect over a longer period of time This increased disinfection
period would not only be able to increase the effectiveness of treatment on those organisms
but would also inhibit the re-growth of organisms with rapid reproductive rates such as
bacteria
The test results indicated that the rate of TRO decay was dependent on the chemistry of the
ballast water Reasons for these differences could be due to the uncontrolled variables
among tests such as chemical compositions of the source water and non-selective oxidation
of organic matter Inorganic compounds including iron ammonia and others may also affect
residual oxidant decay
0 12 24 36 48 60 72 84 96 108 12000
02
04
06
08
10
12
14
16
18
20
22
24
26
TR
O C
on
cen
trat
ion
(m
gL
)
Elapsed time (hr)
25 ppm
15 ppm
20 ppm
Figure 4 TRO decay over a period of 120h for high salinity (measured as Cl2)
40
M BAI N ZHANG Z ZHANG TIAN AND XBAI
45 Toxicity Tests
According to the guidelines of the US EPA the algae growth inhibition test for high salinity
ballast water after middotOH treatment was performed
The definitive test was conducted with the 100 treated ballast water under laboratory
conditions During the 96-hour test period growth inhibition and other toxic signs were not
observed in the treated and control cultures The test results indicated that IrC50 (96hr)
IyC50 (96hr) and NOAEC (No Observed Adverse Effect Concentrations) to Platymonas
helgolandica were all greater than 100 treated ballast water
41
BALLAST WATER MANAGEMENT SYSTEMS
The forgotten fraction The importance of organisms
smaller than 10 microm when evaluating
ballast water treatment systems
Isabel van der Star1 Viola Liebich Peter Paul Stehouwer
Abstract
Aquatic organisms in the size class of 10 to 50 microm and larger than 50 microm are the main parameters
when qualifying ballast water treatment systems (BWTS) Organisms smaller than 10 microm in minimum
dimension are not taken into account when testing BWTS following the D-2 standard of the IMO This
size class includes bacteria phytoplankton and protozoa as micro-zooplankton species which can be
analysed conveniently by flow cytometry Results of numerous land-based tests showed that 90 of all
phytoplankton organisms were smaller than 10 microm in minimum dimension Besides a high numerical
abundance it is well known that many toxic phytoplankton species belong to this size fraction
Therefore the importance of this size class should be reconsidered when evaluating BWTS and
deserves to be taken into account in the requirements for certification of BWTS
Keywords ballast water convention D-2 standard minimum dimension harmful algal blooms flow-
cytometry plankton
1 Introduction
Biological invasions are facilitated by human actions One main activity contributing to
biological invasions is shipping ballast water (Carlton 1987 Wohnham et al 2001) Due to
ecological and economic damages caused by invasive species in the past (Ruiz et al 1997
Waite et al 2003 Gregg et al 2009) the International Maritime Organization (IMO)
implemented the Ballast Water Management Convention The Convention specifies in the D-2
standard the amount of viable organisms allowed in ballast water upon discharge
(Anonymous 2004) According to the BWM Convention the D-2 standard requires that
ballast water upon discharge should contain
- Less than 10 viable orgm3 ge 50 μm in minimum dimension
- Less than 10 viable orgml lt 50 μm and ge 10 μm in minimum dimension
1 Department of Biological Oceanography Royal Netherlands Institute for Sea Research POBox 59 NL-1790
AB Den Burg Texel The Netherlands Corresponding author ivanderstarmea-nlcom Questions referring to the ballast water project at NIOZ LouisPeperzaknioznl
42
STAR LIEBICH AND STEHOUWER
Indicator microbes at the following concentrations (cfu= colony forming units)
- Vibrio cholerae lt 1 cfu100ml
- Escherichia coli lt 250 cfu100ml
- Intestinal Enterococci lt100 cfu100ml
Besides some indicator microbes the D-2 standard does not include requirements of
organisms smaller than 10 μm in minimum dimension
2 Organisms lt10 μm Biology toxicity and high health risks
The size class smaller than 10 μm in minimum dimension comprises a great variety
phytoplankton micro-zooplankton protozoa bacteria and viruses The size classes as
defined in the D-2 standard refer to minimum dimension ie the widest dimension of the
smallest visible axis of the body excluding appendages (Miller et al 2011 Gollasch et al
2007)
Numerous marine species are on average below 10 μm in minimum dimension eg Pseudo-
nitzschia sp Nitzschia sp Skeletonema sp and Bodo sp Especially in elongated or needle
shaped diatom taxa like Pseudo-nitzschia and Nitzschia the minimum dimension can be
below 5 microm (transapical axis) while cell length can be more than 30 microm (apical axis) Besides
these there are also organisms around 10 μm in minimum dimension (eg Thalassiosira sp
Balanion sp and Tetraselmis sp) A third group is formed by organisms having a complex life
cycle including stages belonging to more than one size class An example for this is Pfiesteria
piscicida It shows a complex life cycle including transformation forms of flagellate amoebe
and cyst (Burkholder and Glasgow 1997) Size in this species depends on life stage and diet
It ranges between 5-450 μm
Resting stages and cysts are smaller than their vegetative cells and a lot are lt10 μm in
minimum dimension They easily survive transport in ballast water or in the sediment at the
bottom of ballast tanks
Hallegraeff and Bolch (1992) investigated the viability of phytoplankton cysts in sediment of a
ballast water tank Twenty cysts of 53 identified species showed viable regrowth in cultures
Among the surviving species numerous belonged to the group of toxic dinoflagellates
including Alexandrium catenella Alexandrium tamarense and Gymnodinium catenatum The
occurrence of toxin producing plankton species can result in negative effects since they can
be harmful already in low cell concentrations Also blooming phytoplankton species can be
harmful by causing anoxic conditions following their decay (eg Skeletonema sp
Thalassiosira sp and Phaeocystis sp)
43
THE IMPORTANCE OF ORGANISMS SMALLER THAN 10 microm
Toxicity of these harmful bloom forming species with an average cell size of less than 10 microm
affects other organisms in the ecosystem but it may also affect humans Humans can be
exposed through different ways like seafood consumption dermal contact (Knap et al 2002)
or by inhalation (Kirkpatrick et al 2004) Exposure can pose health risks including irritation of
skin eye and respiratory tract gastroenteritis and short term neurocognitive disorders (for
references see Sellner et al 2003 and Grattan et al 2001) Toxic species may become
invasive because this size class is not included in compliance testing of BWTS
The main part of invasive phytoplankton species found is larger than 10 microm in size eg
diatoms like Rhizosolenia indica and Coscinodiscus wailesii (Goacutemez and Souissi 2010
Nehring 1998) This might be due to their cell size which makes them easier to monitor by
microscopy which is the established standard method Data are scarce on invasive species
below 10 microm in minimum dimension Nehring (1998) reviewed studies discussing invasive
species and mentioned Prorocentrum triestinum ranging from 6-11microm in minimum dimension
Fifteen other invasive phytoplankton species in the North Sea reviewed in the same study are
bigger than 10 microm in minimum dimension However some of the larger cells form cysts
which are much smaller than their vegetative cells and can survive long periods in the dark
Therefore for numerous reasons the whole range of phytoplankton cell sizes should be
considered and not exclusively those larger than 10microm
3 Enumerating and size determination of phytoplankton with a cell size of lt10 μm
Flow cytometry (FCM) is used as analytical method for microorganisms (unicellular algae
protozoa bacteria and viruses) in aquatic ecosystems since the early 1980rsquos (eg Dubelaar
and Jonker 2000 Veldhuis and Kraay 2000 Vives-Rego et al 2000 Yentsch et al 1983
Troussellier et al 1993) It is a faster tool for quantifying microorganisms compared to
microscopic analysis especially for the smaller phytoplankton species where high numbers
can be found above 108 per litre (Veldhuis and Kraay 2000)
Quantitative analysis of phytoplankton smaller than 10 μm in minimum dimension can be
done by flow cytometry Guideline G8 does not require these measurements (Anonymous
2008) However the Royal Netherlands Institute for Sea Research (NIOZ) performs this
analysis from the beginning of land based testing of BWTS at their harbor (Texel The
Netherlands) For further information on this test facility for BWTS see Veldhuis et al (2006)
Data presented here come from control samples taken during testing of BWTS before any
treatment Analysis is done in triplicate Quantitative results of the last three years show that
phytoplankton smaller than 10 μm comprises 92 (SD= 6) of the total phytoplankton cells
found in control samples (Table 1) This research is based on a total of 85 samples and 255
measurements
44
STAR LIEBICH AND STEHOUWER
Table 1 Percentage of phytoplankton lt10 microm of total phytoplankton counts in control
samples during April till June from 2009 till 2011 analyzed by FCM
Year samples taken
analyzed samples
minimum
maximum average SD
2009 21 63 71 98 92 6
2010 40 120 76 99 92 5
2011 24 72 60 99 92 6
total 85 255 60 99 92 6
4 Cell viability and regrowth potential
To investigate the regrowth ability of phytoplankton after treatment of BWTS long-term
incubation experiments were performed Experiments were conducted based on normal
scheduled test runs according to the G8 guideline (Anonymous 2008) Results are compared
of two treatment systems The first treatment system includes a filter (20 microm mesh size) and
low-pressure UV-radiation (fixed wavelength of 254 nm) and the second treatment system
includes a filter (200 microm mesh size) hydrocyclone and electrolytic chlorination Systems
were tested from March till June 2010 and treated water was stored during five continuous
days Before discharge 10 litre samples were taken for incubation experiments Quantitative
analysis of phytoplankton was done every five days by flow cytometry (Coulter Epics XL-MCL
with a 488 nm argon laser Miami USA) Further details of incubation experiments can be
found in Stehouwer et al (2010)
After treatment with the UV system (Figure 1A-D) no regrowth of phytoplankton was found the
first five days After 10 to 15 days there is substantial regrowth especially of phytoplankton
lt10 microm Comparable tests with the electrolytic chlorination showed also regrowth (Figure 2A-
D) after 10 days of mainly phytoplankton lt10 microm although numbers were lower than the UV
system This was also found after 15 and 20 days while phytoplankton numbers further
increased especially phytoplankton lt10 microm For both treatment systems and during the
whole period larger numbers of phytoplankton lt10 microm were found compared with the size
class above 10 microm
5 Discussion and conclusion
The abundance of phytoplankton in different size classes is highly dependent on the growth
(primary production) and mortality due to grazing eg by zooplankton (Gieskes and Kraay
1975) and therefore seasonal dependent During spring and early summer phytoplankton
species with a minimum dimension of 10 microm are the main species found in the NIOZ harbor
(92 of all phytoplankton) These organisms also showed a large ability to regrow after
treatment by different BWTS although there was a lag period of up to 10 days When
45
THE IMPORTANCE OF ORGANISMS SMALLER THAN 10 microm
Figure 1 Phytoplankton counts by FCM chlorophyll (FL4log) against the size of the
phytoplankton (FSlog) at discharge after treatment including filter and UV at day A=0
B=5 C=10 and D=15The size class large is gt10microm
comparing systems filter together with UV treatment showed faster regrowth and higher
numbers compared to the system using filter hydrocyclone and electrolytic chlorination
Faster regrowth after UV treatment is unexpected due to the fact that water is treated twice by
an UV system namely before intake and before discharge However phytoplankton regrowth
after UV treatment is also found in other studies (Waite et al 2003 Stehouwer et al 2010
Sutherland et al 2001)
Determination of regrowing phytoplankton species was also done after UV treatment
Different phytoplankton species were found including Chaetoceros sp Skeletonema sp and
Thalassiosira sp in the lt10 microm and 10-50 microm size class (Liebich et al 2011) Results of this
FS LOG
FL4 L
OG
100
101
102
103
104
100
101
102
103
104
medium
small
large
FS LOG
FL4 L
OG
100
101
102
103
104
100
101
102
103
104
medium
small
large
FS LOG
FL4 L
OG
100
101
102
103
104
100
101
102
103
104
medium
small
large
FS LOG
FL4 L
OG
100
101
102
103
104
100
101
102
103
104
medium
small
large
A B
C D
46
STAR LIEBICH AND STEHOUWER
Figure 2 Phytoplankton counts by FCM (chlorophyllFL4log against the size of the
phytoplankton FSlog) at discharge after treatment including filter hydro cyclone and
electrolytic chlorination at day A= 0 B=5 C=10 and D=15 The size class large is gt10 microm
study suggest that only certain phytoplankton species are able to survive after treatment in a
ballast water tank Regrowth abilities of these survivors might be due to a broader
temperature tolerance high growth rates and the ability to form resting stages in their life
cycle These traits imply the potential of the species to become invasive once discharged
(Liebich et al 2011) Besides the well discussed phytoplankton lt10 microm it is known that this
size class includes various other groups of organisms like micro-zooplankton protozoa
bacteria and viruses In particular the smaller sized organisms possess a high growth rate
(Kagami and Urabe 2011) favoring their regrowth ability when discharged in recipient water
Due to toxic and harmful species in this size class successful invasion may result in negative
effects on ecosystems and may cause health risks
FS LOG
FL4 L
OG
100
101
102
103
104
100
101
102
103
104
medium
small
large
FS LOG
FL4 L
OG
100
101
102
103
104
100
101
102
103
104
medium
small
large
FS LOG
FL4 L
OG
100
101
102
103
104
100
101
102
103
104
medium
small
large
FS LOG
FL4 L
OG
100
101
102
103
104
100
101
102
103
104
medium
small
large
A B
C D
47
THE IMPORTANCE OF ORGANISMS SMALLER THAN 10 microm
The problem of invasive species in the oceans is still a huge issue to solve The IMO made
important progress by the Ballast Water Management Convention although it is not
implemented yet However when this convention becomes into force living organisms
smaller than 10 microm in minimum dimension will still be able to be discharged This is due to
the fact that these organisms are not mentioned in the D-2 standard except for certain
indicator microbes Invasiveness of this size class by ballast water transportation is possible
because they are not analyzed when testing BWTS following the G8 guideline (Anonymous
2008)
Besides the D-2 standard other standards are developed including the proposed ldquoCalifornian
standardrdquo and USCG Phase-2 standard which do mention bacteria and viruses No other
organisms smaller than 10 microm as phytoplankton micro-zooplankton and protozoa are
mentioned It is possible to quantify viruses and bacteria in marine and fresh water by flow
cytometry However it is questionable if it is needed to include viruses in any standard
because viruses are not regarded as living organisms Bacteria occur in high numbers in
surface water but also in drinking water bacteria numbers between 556times102 and 394times104
per ml have been found (Hoefel et al 2003) Therefore it might be impractical to have a high
standard for bacteria when testing BWTS It is more realistic to have high standards for
phytoplankton and zooplankton species below 10 microm in minimum dimension However when
it becomes possible to amend the D-2 standard after ratification it will be difficult to decide
how While this is still under debate it is clear that organisms below 10 microm in minimum
dimension are important and should be taken into account in the requirements for certification
of ballast water treatment systems
REFERENCES
Anonymous (2004) International Convention for the Control and Management of Shipsrsquo Ballast Water
and Sediments International Maritime Organization httpwwwimoorg
Anonymous (2008) Guidelines for approval of ballast water management systems
(G8)Annex3Resolution MEPC174(58) Annex Parts 123 and 4
Burkholder JM Glasgow HB (1997) Pfiesteria piscicida and other Pfiesteria-like dinoflagellates
Behavior impacts and environmental controls Limnol Oceanogr 42 1052-1075
Carlton JT (1987) Patterns of Transoceanic Marine Biological Invasions in the Pacific-Ocean
Bulletin of Marine Science 41452-465
Dubelaar GBJ Jonker RR (2000) Flowcytometry as a tool for the study of phytoplankton Sci
Mar 64135-156
Gieskes WWC and Kraay G (1975) The phytoplankton spring bloom in Dutch coastal waters of the
North Sea Neth J Sea Res 9166-196
48
STAR LIEBICH AND STEHOUWER
Gollasch S David M Voigt M Dragsund E Hewitt C and Fukuyo Y (2007) Critical review of
the IMO international convention on the management of shipsrsquoballast water and sediments Harmful
Algae 6585-600
Goacutemez F and Souissi S (2010) The diatoms Odontella sinensis Coscinodiscus wailessii and
Thalassiosira punctigera in the European Atlantic recent introductions or overlooked in the past
Fresenius Env Bull191424-1433
Grattan LM Oldbach D and Morris JG (2001) Human Health risks of exposure to Pfiesteria
Piscicida Bioscience 51853-858
Gregg MD Rigby G and Hallegraeff M (2009) Review of two decades of progress in the
development of management options for reducing or eradicating the phytoplankton zooplankton and
bacteria in ships ballast water Aquatic invasions 4521-565
Hallegraeff GM and Bolch CJ (1992) Transport of diatom and dinoflagellate resting spores in ships
ballast water implications for plankton biogeography and aquaculture J Plankton Res 141067-1084
Hoefel D Grooby WL Monis PT Andrews S and Saint CP (2003) Enumeration of water-borne
bacteria using viability assays and flow cytometry a comparison to culture-based techniques J of
Microbiol Meth 55585-597
Kagami M and Urabe J (2001) Phytoplankton growth rate as a function of cell size an experimental
test in Lake Biwa Limnology 2111ndash117
Kirkpatrick P Fleming LE Squicciarini D Backer LC Clark R Abraham W Benson J
Cheng YS Johnson D Pierce R Zaias J Bossart GD and Baden DG (2004) Literature
review of Florida red tide implications for human health effects Harmful Algae 399-115
Knap A Dewailly E Furgal C Galvin J Baden D Bowen RE Depledge M Dugua L
Fleming LE Ford T Moser F Owen R Suk WA and Uluata U (2002) Indicators of ocean
health and human health developing a research and monitoring framework Environ Health
Perspect110839-845
Liebich V Stehouwer PPand Veldhuis M (2011) Re-growth of potential invasive phytoplankton
following UV-based ballast water treatment Aquatic Invasions 7 published online doi
103391ai20127
Miller AW Frazier M Smith GE Perry ES Ruiz GMand Tamburri MN (2011) Enumerating
sparse organisms in shipsrsquo ballast water why counting to 10 is not so easy Environmental Science
and Technology 453539-3546
Nehring S (1998) Establishment of thermophilic phytoplankton species in the Nort Sea biological
indicators of climatic changes ICES J of Marine Sci 55818-823
Ruiz GM Carlton JT Grosholz ED and Hines AH (1997) Global invasions of marine and
estuarine habitats by non-indigenous species mechanisms extent and consequences American
Zoologist 37621ndash632
49
THE IMPORTANCE OF ORGANISMS SMALLER THAN 10 microm
Sellner KG Doucette GJand Kirkpatrick GJ (2003) Harmful algal blooms causes impacts and
detection J Ind Microbiol Biotechnol 30383-406
Stehouwer PP Fuhr F Veldhuis M (2010) A novel approach to determine ballast water vitality and
viability after treatment In Bellefontaine N Haag F Linden O Matheickal J (eds) (2010)
Proceedings of the IMO-WMU Research and Development Forum 2010 Malmouml Sweden 233-240
Sutherland TF Levings CD Elliott CC Hesse WW (2001) Effect of a ballast water treatment
system on survivorship of natural populations of marine plankton Mar Ecol Prog Ser 210139-148
Troussellier M Courties Cand Vaquer A (1993) Recent applications of flow cytometry in aquatic
microbial ecology Biol Cell 78111-121
Veldhuis MJW Fuhr F Boon JPand Ten Hallers-Tjabbers C (2006) Treatment of ballast water
How to test a system with a modular concept Environmental Technology 27909-921
Veldhuis MJW and Kraay GW (2000) Application of flow cytometry in marine phytoplankton
research current applications and future perspectives Scientia Marina 64121-134
Vives-Rego J Lebaron Pand Nebe-von Caron G (2000) Current and future applications of flow
cytometry in aquatic microbiology FEMS Microbiology reviews 24429-448
Waite TD Kazumi J Lane PVZ Farmer LL Smith SG Smith SL Hitchcock Gand Cap
TR (2003) Removal of natural populations of marine plankton by a large-scale ballast water
treatment system Marine Ecology-Progress Series 25851-63
Wonham MJ Walton WC Ruiz GM Frese AMand Galil BS (2001) Going to the source role
of the invasion pathway in determining potential invaders Marine Ecology-Progress Series 2151-12
Yentsch CM Horan PK Murhead K Dortch Q Haugen E Legendre L Murphy LS Perry
MJ Phinney DA Pomponi SA Spinrad RW Wood M Yentsch CSand Zahuranec BJ
(1983) Flow cytometry and cell sorting A technique for analysis and sorting of aquatic particles
Limnol Oceanogr 281275-1280
51
BALLAST WATER MANAGEMENT SYSTEMS
ERMA FIRST BWTS
An Integrated and Modular Ballast Water Treatment
System ndash Performance and Compliance with IMO Guidelines
Efi Tsolaki1 Konstantinos Stampedakis Yannis Moulinos Nikos Kyritsis
Abstract
The ERMA FIRST Ballast Water Treatment System (BWTS) produced by ERMA FIRST ESK SA
(Greece) is an integrated ballast water treatment system It consists of a combination of a mechanical
separation system and an electrolysis system The combination of an automatic back-flushing filter with
an advanced cyclonic separator ensures trouble-free operation as well as efficient removal of biota
and particles with a minimum diameter of 50 microns The separation stage is necessary for
conditioning the quality of ballast water before the electrolysis unit The electrolysis apparatus follows
the ballast water conditioning The unit utilizes special coated electrodes for the production of chlorine
as a disinfectant that ensures sufficient chlorine concentration even in low salinity waters The
blockage-free operation of the system its efficiency and the compliance with the Regulations D2 and
Guidelines regulated by the International Maritime Organization through land-based and shipboard
testing are demonstrated in this study It is established beyond doubt that the ERMA FIRST Ballast
Water Treatment System could be regarded as a fast and effective way for reducing the number of
viable organisms in ballast water of ships
Keywords ballast water electrolysis mechanical separation D2 standards risk assessment
1 Introduction
The introduction of invasive marine species into new environments by the discharge of a
shiprsquos ballast water the attachment of these species to a shiprsquos hull and via other vectors has
been identified as one of the four greatest treats to the worldrsquos oceans Shipping moves over
80 of the worldrsquos commodities and transfers approximately 3 to 10 billion tonnes of ballast
water internationally each year
Ballast water is essential to the safe and efficient operation of modern shipping providing
balance and stability to ships The translocation and release of ballast water causes
environmental economic and health threats that are concerns of governments maritime
environmental entities and public health organizations As shipping is probably the most
international industry the only effective way to address shipping-related issues is through a
standardized international system This has been one of the targets of IMO during the last 50
years of its existence IMO member States adopted a new ballast water Convention in
1 ERMA FIRST ESK ENGINEERING SOLUTIONS SA
52
TSOLAKI STAMPEDAKIS MOULINOS AND KYRITSIS
February 2004 The International Convention for the Control and Management of Shipsrsquo
Ballast Water and Sediments was adopted by a Diplomatic Conference at IMO in London on
Friday 13 February 2004 As of September 2011 the Convention had been ratified by 28
contracted states representing 2637 of world tonnage In order to attain the necessary
ratification of the Convention in the near future the urgent of approval of systems is more
important than ever The ERMA FIRST BWTS has been designed and developed by ERMA
FIRST ESK Engineering Solutions SA a Greek company established to produce a sound and
reliable ballast water treatment system
ERMA FIRSTrsquoS RampD department started operational research in 2006 for the development of
the ballast water treatment system exploring various aspects of the electrochemical
generation of sodium hypochlorite in relation to the biological efficacy required by the D2
performance standard of the Convention Laboratory testing was conducted that was aimed
at evaluating the efficacy of the whole process testing different concentrations of free active
chlorine on representative species of taxonomic groups that prevail in the fraction of less than
20 microm of filtered sea water In the bench-scale testing that followed issues such as dose
effectiveness were assessed to determine the optimum operational characteristics of the
system and the need for neutralization of residual products before discharge of treated ballast
water into the sea
In this study the operation of the system is demonstrated as well as its efficiency and the
compliance with the Regulations D2 and Guidelines regulated by the IMO through land-based
and shipboard testing
2 ERMA FIRST Ballast Water Treatment System Overview
The ERMA FIRST BWTS is an integrated autonomous and modular treatment system for
ballast water jointly developed by a group of scientists and engineers with extensive
experience in the design and production of equipment for ship-generated liquid waste
treatment
The treatment process includes two distinctive stages ndash a primary stage that enables the
separation of coarser suspended materials and relatively larger living organisms in ballast
water and a secondary stage in which electrolytic disinfection takes place to meet the
required biological efficacy standard for treated ballast water as stipulated in the Convention
At the primary stage of the process removal of material with diameters larger than 20 microm is
accomplished by means of an advanced cyclonic separator made from frictionless material
To prevent blocking of the separator from large particles that might pass though the sea
53
ERMA FIRST BWTSAN INTEGRATED AND MODULAR BALLAST WATER TREATMENT SYSTEM
chests and strainers of the vessel a 200 microm self-cleaning basket filter has been installed
prior to the separator
Electrolysis of ballast water to produce in situ free active chlorine up to10 mgL constitutes the
second stage of treatment that takes place during ballasting The products of this process
flow into the ballast tanks of the vessel so that the residual oxidants disinfect any harmful
organisms taken onboard Integral components of the system are the control and monitoring
equipment that ensure its proper operation as well as the neutralization process of treated
ballast water prior to its eventual discharge into the sea
The operational status of the system is continuously monitored at a central data logger
located on the central control panel of the system Data logging includes the operation status
of the system operation flow and temperature at the electrolytic cell pressure differences
across the self-cleaned filter and the cyclonic separator the operational status of the
neutralizing agent dosing pump as well as the chlorine level of the system The control panel
can be positioned into the cargo control room of the vessel
3 ERMA FIRST BWTS OPERATION
The ERMA FIRST BWTS is an autonomous fully automatic operational unit The system has
two different operational modes one during ballasting and one during the discharge of treated
ballast water (de-ballasting) The two operational modes are described in the following
paragraphs
Mode one Ballasting
During ballasting ballast water passes through the 200 microm pre-filter and then into the
cyclonic separator The underflow stream rich in sediments and coarse material from the
latter returns back into the sea via a drain line The overflow enters the electrolytic cell A flow
sensor installed upstream of the cell provides a signal to the cell through the PLC of the
system to apply a DC current to the electrodes in order to initiate the electrochemical process
and the production of the Active Substances A free chorine sensor (TRO sensor) located
downstream of the cell monitors the free chlorine concentration
The production rate of the Active Substances is continuously adjusted in accordance with the
ballast flow rate and the measurement of the free chlorine at the sensor Depending on the
flow rate and the free chlorine measurement the voltage at the cell changes in order to
maintain the pre-set free chorine concentration
The electrolytic cell of the system has been specifically designed to produce the identified
Active Substances at temperatures as low as 5oC and a water salinity gt 60 PSU The ability
54
TSOLAKI STAMPEDAKIS MOULINOS AND KYRITSIS
of the cell to produce free chlorine under such conditions is based on the special coating
material of its electrodes and also on its design that enables sufficient contact time of
chlorides in the water stream with the electrodes thus providing enough contact time to
convert into Active Substances
Figure 1 Operation mode during the ballasting
Similarly the electrolytic cell of the system can operate effectively in salinities above 32 PSU
due to the fact that water of such salinity results in high electrical resistance and thus the
PLC of the system will adjust the voltage at the electrodes in such manner to maintain the
production of free chlorine at the pre-set valuesThe whole unit is current-driven controlled by
the chlorine sensor arranging for the set concentration and current applied to the electrodes
resulting in a specific amount of active substance production By monitoring the operating
Amperes on the electrodes of the cell and adjusting the applied voltage the PLC of the
system ensures a constant production rate of Active Substances in an extended salinity and
55
ERMA FIRST BWTS AN INTEGRATED AND MODULAR BALLAST WATER TREATMENT SYSTEM
temperature range Note that the ballast water management system can be bypassed using
the appropriate valve arrangement (eg in cases of emergency)
Operation mode two Deballasting
During de-ballasting neutralization of the total residual oxidants takes place by adding an
aqueous sodium bisulfite solution (38 ww) At this mode the pre-filtering equipment the
cyclonic separator and the electrolytic cell of the system are bypassed with the exception of
the free chlorine sensor
For the efficient control of the neutralizing process during de-ballasting and the avoidance of
the surplus consumption of the neutralizing media the ERMA FIRST system is equipped with
an additional chlorine sensor The new chlorine sensor is of the same type as the two others
already equipped on the system and it is installed at the de-ballasting line prior the
neutralizing agent injection point The reading of this sensor drives the dosing rate of the
neutralizing pump The dosing rate of the neutralizing pump is based on the stoichiometry of
the neutralization reaction between the chlorine and sodium bisulfite
From the stoichiometry of the reaction for the neutralization of 1 mgL of chlorine 15-17
mgLi (Metcalf amp Eddy 2003) of sodium bisulfite (ie for the 10 mgL concentration of total
residual oxidants) and 17 mgL of NaHSO3 are required for effective neutralization According
to this stoichiometry and the readings of the free chlorine sensor installed upstream of the
dosing point a neutralizing pump is activated By using a safety margin of 10 the dosing
pump of the neutralizing agent should be set at a point to deliver 187 mgL sodium bisulfite
As recommended a discharge control point for TRO has been added to the system with the
fitting of a second sensor in the deballasting procedure that will ensure that the maximum
allowable discharge concentration (MADC) of 02 mgL (as Cl2) will not be exceeded The
third sensor of the system is installed on the far end point of the de-ballasting line after the
neutralization injection point but close to the discharge point This sensor confirms that the
chlorine concentration is well below the MADC In case that the total chlorine level at the
discharge will reach the maximum MADC of 02 mgL then the dosing rate of the pump of the
neutralization unit will increase in order to reduce the TRO to the recommended lowest
MADC A schematic diagram of the operation of the system during de-ballasting is illustrated
in figure 2
56
TSOLAKI STAMPEDAKIS MOULINOS AND KYRITSIS
Figure 2 Operation mode during deballasting
4 Efficacy of the ERMA FIRST BWMS
The land-based testing of the ERMA FIRST ballast water treatment system according to IMO
respective G8 and G9 Guidelines was successfully completed in July 2010 in the testing
facility of the Royal Netherlands Institute for Sea Research in the Netherlands demonstrating
the effectiveness of the system to comply with the D2 performance standard as well as its
reliability and environmental acceptability The Whole Effluent Toxicity Testing that was
conducted during the land-based testing proved that the discharge of neutralized treated
ballast water is not toxic as no toxic effects were observed to the organisms exposed
Compliance with the Regulations D2 and Guidelines The ERMA FIRST followed the appropriate procedure as indicated by the Guidelines in order
to obtain Basic Final and Type Approval for its ballast water treatment system ERMA FIRST
collaborated with the expert scientists from among the most knowledgeable in the field in
order to be competent in the market of ballast water systems
57
ERMA FIRST BWTS AN INTEGRATED AND MODULAR BALLAST WATER TREATMENT SYSTEM
At first Basic Approval was granted in the MEPC 62 (July 2011) as the Application for Basic
approval was recommended by 15th GESAMP meeting (December 2010) Application for
Final Approval was submitted to the Secretary of IMO to be evaluated in the 63rd MEPC
(March 2012)
Land-based tests were carried out at the Royal Netherlands Institute for Sea Research
(NIOZ) in the Texel Netherlands from March through July 2010 The system was a full-scale
commercially available system The hydraulic capacity of the system tested was 100 m3h
Shipboard tests on board MV COSCO GUANGZOOU (IMO No 9305570) a 9600 TEU
container vessel were carried out from January until June 2011 The system was modular of
hydraulic capacity 500 m3h
Land-based testing Land-based tests were carried out at the Royal Netherlands Institute for Sea Research
(NIOZ wwwnioznl) in the Texel Netherlands from March through July 2010 [3] The
system was a full-scale commercially available system The hydraulic capacity of the system
tested was 100 m3h (NIOZ 2011)
A summary of water parameters in the NIOZ test facility is presented in the Table 1 The
procedure was in conformance with Guidelines for approval of ballast water management
systems (G8)
Table 1 Summary of water parameters in the NIOZ test facility
Parameter Value
Temperature (degC) Variable
Salinity (PSU) 20-34
TSS (mgl) 5-400
POC (mgl) 5-20
DOC (mgl) 1-5
Organisms ge 50micromm3
10000-1000000
Organisms lt50 ge 10micromm3
100-100000
Heterotrophic bacteria ml
10000-10000000
(Source Report of Global expert workshop on harmonization of methodologies for test facilities of ballast water management systems (24-25 January 2010) World Maritime University Malmouml Sweden)
Physical and chemical analysis of treated ballast water
Sample handling and volumes were in accordance with G8 Guidelines Temperature pH
Dissolved Oxygen DOC TSSPOC were monitored prior during and after ERMA FIRST
58
TSOLAKI STAMPEDAKIS MOULINOS AND KYRITSIS
ballast water discharge Also chlorine decay was studied in-situ using samples from the
ballast tanks Chemical analyses for disinfection by-products of treated ballast water were
performed also during land-based testing by OMEGAM Laboratories Relevant chemicals
were measured for both low and high salinity test cycles at Day 1 and Day 5 of treatment
Total Residual Oxidants
During each test cycle the concentration of the active compound (Total Chlorine) was
measured as soon as possible after filling of the treated ballast water tank also at regular
intervals during the 5-day holding period and during discharge
Total Residual Oxidant (TRO) was measured as total chlorine using the Hach portable
spectrophotometer DR 2800 The device employs the DPD Method accepted for reporting
water analyses by the USEPA and is equivalent to USEPA method 3305 for wastewater and
Standard Method 4500-Cl G for drinking water The method had a detention limit of 002 mgL
as Cl2 Samples were collected from the ballast tanks immediately after the completion of
ballasting and afterwards every 24h from the ballast tank
Retention time was 120 h Neutralization occurred five days after ballasting during discharge
of the ERMA FIRST treated water TRO as chlorine was not detected post neutralization
procedure
Disinfection By-products
All samples were taken at discharge to ensure that the data represent full-scale employment
Samples indicated that trichloromethane was the only non-detectable THM (Trihalomethanes)
compound The following HAA (haloacetic acids) had measurable concentrations in treated
ballast water Monobromoacetic acid bromochloroacetic acid dibromoacetic acid
tribromoacetic acid and dibromochloroacetic acid Bromate was also detected once In low
salinity water the most predominant haloform was tribromomethane comprising more than
95 of the total trihalomethanes Dibromochloromethane and bromodichloromethane
constituted 2 and 3 respectively Trichloromethane was not detected The most
predominant haloacetic acid was dibromoacetic acid accounting for more than 83 of the
total haloacetic acids Tribromoacetic acid bromochloroacetic acid and monobromoacetic
acid constituted up to 12 3 and 2 respectively Monochloroacetic acid dichloroacetic
acid trichloroacetic acid dibromochloroacetic acid and bromodichloroacetic acid were not
detected
In high salinity water the most predominant haloform was tribromomethane accounting for
more than 98 of the total trihalomethanes Dibromochloromethane constituted 2 of the
total trihalomethanes Trichloromethane and bromodichloromethane were not detected The
59
ERMA FIRST BWTS AN INTEGRATED AND MODULAR BALLAST WATER TREATMENT SYSTEM
most predominant haloacetic acid was tribromoacetic acid accounting for more than 93 of
the total haloacetic acids Dibromochloroacetic acid and dibromoacetic acid constituted up to
1 and 6 respectively Monochloroacetic acid monobromoacetic acid dichloroacetic acid
trichloroacetic acid dibromochloroacetic acid and bromodichloroacetic acid were not
detected Bromate was only detected in high salinity test cycle on Day 5 Higher
concentrations of bromo haloacetic acids in seawater could be attributed to a high bromide
content of the seawater
Biological effectiveness
Sample handling and volumes were in accordance with G8 Guidelines Organisms larger than
50 microm were collected using modified Hydrobios net The effluent of the Hydrobios net was
collected and corresponded to the fraction of organisms 10 to 50 microm A 10 microm sieve was
used to filter a subsample from the effluent net in order to enumerate organisms less than 10
microm
The analyses of bacteria (total heterotrophic bacteria) and human pathogens (Intestinal
Enterococci and E coli) were carried out according to international standards NEN-EN-ISO
62221999 7899-2 9308-1 respectively
Table 2 Summary of Biological Efficiency of ERMA FIRST BWTS of Land-Based Testing in NIOZ
ERMA FIRST Treated ballast water
Organisms Run test
gt50 microm (numbersm3)
lt10 microm (numbersm3)
10-50 microm (numbersm3)
E coli (cfumL)
Enterococci (cfu100mL)
Total bacteria
(countsmL)
Comply with D2
standards I 197 262 103 lt01 lt1 187E+06 X
II 23 627 08 lt01 lt1 120E+05 radic
III 2 198 0 lt01 lt1 820E+04 radic
IV 17 56 0 lt01 lt1 153E+05 radic
V 27 413 0 lt01 lt1 166E+05 radic
VI 27 32 08 lt01 lt1 220E+05 radic
VII 0 16 0 lt01 lt1 209E+05 radic
VIII 03 08 0 lt01 lt1 188E+05 radic
IX 03 32 0 lt01 lt1 237E+05 radic
X 0 0 0 lt01 lt1 213E+05 radic
XI 0 63 08 lt01 lt1 222E+05 radic
All 10 test runs were effectively conducted according to the IMOrsquos G8 Guidelines During test
runs the numbers of viable organisms at discharge were at least one order of magnitude
60
TSOLAKI STAMPEDAKIS MOULINOS AND KYRITSIS
lower than the D2 Standard The residual number of organisms at discharge was well in
compliance with the D2 Standard
All detailed data are presented in the official NIOZ report (NIOZ Report 2011) and a
summary of the 11 run cycles of two conditions of ballast water are presented in Table 2 With
the exception of the first run all 10 subsequent runs were successful in complying with D2
standards
Ecotoxicity testing of treated ballast water land based testing
The toxicity of treated ballast water was evaluated at the laboratories of the Institute for
Marine Resources amp Ecosystem Studies ndash IMARES in Den Helder Netherlands [5]
Four bioassays were performed representing four different phyla of marine organisms the
marine diatom Phaeodactylum tricornutum the crustacean Artemia franciscana the rotifer
Brachyonus plicatilis and the fish larvae Solea solea (IMARES 2010)
Treated ballast water and neutralized treated ballast water were evaluated in two salinity
regimes in a concentration series that was made by diluting test water with untreated ballast
water Algal growth inhibition tests were carried out with water sampled directly after
treatment (T0) and storage for 1 day (T1) 2 days (T2) and 5 days (T5) respectively while the
tests for the other organisms were carried out following the storage of treated ballast water for
1 day (T1) and 5 days (T5)
Algae growth inhibition Phaeodactylum tricornutum
Algal growth inhibition by exposure to a sample is determined by the so-called algal growth
inhibition test according to ISO 10253 (2006) and OECD 201 (1984) procedures Exposure to
neutralized treated ballast water did not result in reduced growth of Phaeodactylum
tricornutum in most growth inhibition tests
Rotifer mortality test with Brachionus plicatilis
The test applied is commercially available as Testkit at MicroBiotest Innc Belgium under the
name ROTOXKIT M and performed according to the Standard Operational Procedure
provided by the manufacturer No mortality was observed in any of the rotifer tests with
exposure to neutralized treated ballast water
Crustacean mortality with Artemia franciscana
The Crustacean mortality test was performed in a multi-well testplate using instar II-III larvae
of the brine shrimp Artemia franciscana obtained as dried cysts from Microlan BV
Netherlands The test conformed with the Standard Operational Procedure for ARTOXKIT
61
ERMA FIRST BWTS AN INTEGRATED AND MODULAR BALLAST WATER TREATMENT SYSTEM
Mtrade (MicroBioTests Inc V100603) No mortality was observed in any of the crustacean tests
with exposure to neutralized treated ballast water
Fish mortality test with Solea solea
The fish mortality test protocol is based upon OECD-203 (1992) No mortality was observed
in any of the fish tests with exposure to neutralized treated ballast water
Shipboard testing
Shipboard testing of the system is being currently conducted onboard a 9600 TEU Greek-
flagged container vessel Cosco Guangzhou Until now three successful test cycles have
been conducted from January to August 2011 which are presented in Table 3 below ERMA
FIRST collaborated with GoConsult for the performance procedure of the shipboard testing
Table 3 Summary of Biological efficiency of ERMA FIRST BWTS of Shipboard Testing
ERMA FIRST Treated ballast water
Organisms
Run test
gt50 microm (numbersm3)
lt10 microm (numbersm3)
10-50 microm (numbersm3)
E coli (cfumL)
Enterococci (cfu100mL)
Vibrio cholerae
(countsmL)
Comply with D2
standards I 19 nd Nd Nd 2 nd radic
II 12 nd Nd Nd 53 nd radic
III 44 nd Nd Nd 37 nd radic
nd not detected
IMO Guideline G8 was followed and met during trial tests The D2 standard was met during
uptake and discharge procedures
Corrosion testing
ERMA FIRST contracted TNO to evaluate the corrosivity of the ERMA FIRST system
following the recently published GESAMP recommendations for corrosivity testing (MEPC
59216 Report of the 8th GESAMP meeting group) The aim of this study was to compare the
corrosivity of seawater treated with the ERMA FIRST BWTS relative to untreated seawater
The different corrosivity tests were performed on coated and uncoated samples according to
the above mentioned GESAMP recommendations [6] The project ended in the middle of
August of 2011 and the complete report will be submitted for the Type Approval procedure
(TNO 2010)
A 6-month corrosion testing project was carried out by TNO involving certain immersion tests
of coated and uncoated materials as well as electrochemical measurements summarized
below
62
TSOLAKI STAMPEDAKIS MOULINOS AND KYRITSIS
Crevice corrosion testing of stainless steel alloys AISI 316L and AISI 304 in treated
seawater and untreated seawater
Cyclic potentiodynamic polarization measurements to determine relative susceptibility
to localized corrosion (pitting and crevice corrosion) in treated seawater and untreated
seawater for the varying materials (ie Stainless steel alloy AISI 316L Stainless steel
alloy AISI 304 Low carbon steel ST 37 and CuNi 90-10)
Immersion corrosion testing for varying materials (ie Stainless steel alloy AISI 316L
Stainless steel alloy AISI 304 Low carbon steel ST 37 CuNi 90-10 and Rubber)
Determination of the resistance of intact and damaged coatings (which were applied
according to the standard specifications) to the effects of treated water and untreated
water and evaluation of the adhesion of coatings and the degree of blistering
Measurements of the electrochemical impedance spectroscopy of coatings
The medium in which the tests were performed was filtrated (50microm) natural seawater of
North Sea origin All tests were conducted in two separate media to enable the comparison of
corrosivity between treated and untreated seawater Both testing media (treated and
untreated sea water) were refreshed each working day The duration of the test was six
months
Figure 3 Corrosion on AISI 316 (top) and AISI 304L (bottom) materials in
untreated seawater (left) and treated seawater from the ERMA FIRST BWTS (right)
after 90 days
63
ERMA FIRST BWTS AN INTEGRATED AND MODULAR BALLAST WATER TREATMENT SYSTEM
Figure 4 Intact coated panels in untreated water for 90 days (left) and intact coated steel panels in treated water for 90 days (right)
Figure 5 Scratched coated panels in untreated water for 90 days (left) and scratched coated steel panels in treated water for 90 days (right)
For treated and untreated seawater electrochemical impedance spectroscopy measurements
were performed in two-fold after 0 1 7 and 21 days and 1 2 3 4 5 and 6 months of
immersion
64
TSOLAKI STAMPEDAKIS MOULINOS AND KYRITSIS
Figure 6 Development of coating resistance in treated seawater after 1 day 30
days 60 days and 90 days
Figure 7 Development of coating resistance in untreated seawater after 1 day 30
days 60 days and 90 days
The measurements taken after 90 days of immersion show that the value of coating
resistance is approximately 108 ohmcm2 Both treated and untreated seawater panels have
similar coating resistance This indicates that the protective properties of the
65
ERMA FIRST BWTS AN INTEGRATED AND MODULAR BALLAST WATER TREATMENT SYSTEM
coating in treated and untreated seawater meets the resistance commonly found in practice
for good protective coatings with this layer thickness
5 Discussion
The ERMA FIRST BWTS is an integrated autonomous and modular treatment system for
ballast water treatment The benefits offered from the pre-filtering and the cyclonic separation
towards the removal of coarse inorganic and organic material present in ballast water relate
to a lower disinfectant concentration demand which in turn results in less energy
consumption and less consumption of electrode coatings
The Land-Based Tests performed in the challenging Wadden Sea in NIOZ Texel The
Netherlands and the Shipboard Tests on board MV COSCO GUANGZHOU (IMO No
9305570) a 9600 TEU container vessel presented excellent results reaching discharge
limits far below the IMO D-2 revealing a prospective and promising performance even for the
stricter United States Certification requirements
Ecotoxicity testing demonstrated that the discharge of neutralized treated ballast water was
not toxic as no toxic effects were observed to the organisms exposed during the testing The
testing further confirmed the necessity of the neutralization of treated ballast water
Corrosion testing was performed according to GESAMP recommendations for corrosivity
testing (MEPC 59216 Report of the 8th GESAMP meeting group) With regard to the
evaluation of coatings the visual examination of all panels after 3 months of exposure
showed comparable results in treated and untreated water Specifically no deposits were
present on the coatings no degradation of coatings were observed and no blistering was
present while the damaged panels showed corrosion in a similar manner as in the untreated
scenario Corrosion rates of specimens will be available after the finalization of the report by
the TNO and will be available for the Type Approval procedure
Enforced by the above unique features ERMA FIRST is promptly coming one significant step
closer to the Final Approval and Type Approval process Lloyds Register Classification
Society who are further supervising shipboard Tests are currently performing the technical
appraisal of ERMA FIRST and will be in a position to officially issue the Type Approval on
behalf of Hellenic Flag in March 2012
REFERENCES
Metcalf and Eddy (2003) ISBN McGraw-Hill ScienceEngineeringMath 4th Edition
66
TSOLAKI STAMPEDAKIS MOULINOS AND KYRITSIS
MEPC 61211 Application for Basic Approval of the ERMA FIRST Ballast Water Management System
NIOZ (2011) Final Report of the Land based testing of ERMA FIRST Ballast Water treatment system
for type approval according to Regulation-D2 and the relevant IMO Guidelines
Report of Global expert workshop on harmonization of methodologies for test facilities of ballast water
management systems (24-25 January 2010) World Maritime University Malmouml Sweden
IMARES Report C09310 Toxicity test with ballast water from ERMA FIRST SA BWMS land based
tests August 2010
TNO (2011) Report Evaluation of the corrosivity of the ERMA FIRST BWTS according to GESAMP
Recommendations
67
BALLAST WATER MANAGEMENT SYSTEMS
Lab-Scale Chlorine Generation
Ceren Bilgin Guumlney1 Fatma Youmlnsel
Abstract
Chlorine disinfection is one of the most commonly considered techniques for ballast water treatment
The main areas of concern with respect to using chlorine disinfection for ballast water organisms are
the safety risk during handling and onboard storage of chlorine gas or HOCl solutions Electrochemical
generation of active chlorine onboard is a good alternative to eliminate these unfavorable features of
chlorine disinfection
A new hybrid ballast water treatment system has been developed within the project ldquoBaWaPla ndash
Sustainable Ballast Water Management Plantrdquo funded by the European Union under contract number
031529 This self-controlled system consists of filter systems UV and electrochemical technologies
The electrochemical component of BaWaPla produces active substances onboard through electrolysis
of seawater and eliminates the need to carry or store hazardous and corrosive chemicals
This study covers some of the laboratory-scale experiments conducted by Istanbul Technical
University for the best and optimal electrochemical cell design Five different electrochemical cells
were assessed for the BaWaPla system The cells were supplied from FumaTech GmbH Germany A
laboratory system was provided to Istanbul Technical University by the project partner LVPG GmbH
Germany This system was used for testing assumptions and proposals for the best and optimal cell
design The final cell design for the BaWaPla Pilot System was tested at Blyth England during the
period from July to September 2009
Keywords Ballast water treatment chlorine generation electrochemical cells
Nomenclature
A Amperage
ASW Substrate prepared with tap water
DI Substrate prepared with deionized water
mgL milligrams per liter
Sal Salinity
SW Substrate prepared with seawater
1 Introduction
Ballast water treatment has been widely studied throughout the last decade The studies have
focused on different technologies (Tsolaki and Diamadopoulos 2009 Abu-Khader et al
1 Istanbul Technical University Faculty of Naval Architecture and Ocean Engineering Department of Naval
Architecture and Marine Engineering
68
GUumlNEY AND YOumlNSEL
2011) Both chlorine disinfection and electrochemical systems are among those considered
techniques for ballast water treatment
Chlorine is a well known and widely used disinfectant around the world [Sawyer et al 1994
Hammer and Hammer Jr 2004] and it has also been proven to be effective for disinfection
of many ballast water organisms at different concentrations [Stocks 2004 Zhang et al
2004 Derek et al 2006] The main areas of concern with respect to the use of chlorine
disinfection for ballast water organisms is the safety risk during handling and onboard storage
of chlorine gas or HOCl solutions
On the other hand there are number of studies for using electrochemical systems for ballast
water treatment Some of these studies are focused on the direct electrolytic disinfection of
ballast water [Dang et al 2004 Kim et al 2006 Tsolaki et al 2010)] while others aim to
produce disinfectant to be used for treatment [Aliotta et al 2003 Lefler et al 2004
Matousek et al 2006]
In-situ electrochemical generation of chlorine onboard would have many advantages such as
eliminating storage and handling of chlorine gas or HOCl solutions [Kraft et al 1999
Jonnalagadda and Nadupalli 2004 Kerwick et al 2005] This technique depends on the
electrolysis of sodium chloride which is readily found in seawater
In electrochemical systems resultant disinfectant fluid can be affected by the design of the
electrochemical cell and the selection of material used to produce the permeable membrane
that separates the fluid paths as well as the electrical current applied to the electrodes The
choice of the materials used for coating the relevant electrodes must also be considered
This work has been conducted within the project ldquoBaWaPla ndash Sustainable Ballast Water
Management Plantrdquo funded by the European Union under the contract number 031529
which began 15 November 2006 and was finalized 15 May 2010 A new hybrid ballast water
treatment system was developed during the project This self-controlled system consists of
filter systems UV and electrochemical technologies The electrochemical component of
BaWaPla produces active substances onboard through electrolysis of seawater and
eliminates the requirement to carry or store hazardous and corrosive chemicals The portion
of the work presented herein covers some of the laboratory-scale experiments conducted by
Istanbul Technical University for the best and optimal electrochemical cell design In this
study five different electrochemical cells are assessed for the BaWaPla system The cells are
supplied from FumaTech GmbH Germany The variable parameters of the cell design are the
geometry and dimensions of the electrodes and the materials used for the electrodes and
their coatings
69
LAB-SCALE CHLORINE GENERATION
11 BACKGROUND
The electrolysis of sodium chloride is also referred as the chlor-alkali process As a result of
this process chlorine sodium hydroxide and hydrogen are formed simultaneously [Rajeshwar
and Ibanez 1996 Srinivasan 2006]
222 22 ClHNaOHOHNaCl ergyElectricEn (1)
Within the chlor-alkali process brine passes through the first chamber of the electrochemical
cell and the chloride ion (Cl-) is oxidized at the anode as
oeClCl 22 2 (2)
In the membrane cell the anode and cathode are separated by an ion-permeable membrane
in the center of the cell and this membrane allows only the liberated sodium ions (Na+) to
pass through to the second chamber The unreacted sodium chloride (NaCl) and other ions
cannot pass through the membrane
At the cathode hydrogen in water is reduced to hydrogen gas releasing hydroxide ions into
the solution (eq3) Simultaneously the chlorine gas that is formed by oxidation of Cl- reacts
with water in the first chamber Hypochlorous acid (HOCl) and hydrochloric acid are formed
(eq4) [Abdul-Wahab and Al-Wesbahi 2009]
OHHeOH o 222 22 (3)
HClHOClOHCl 22
(4)
On the other hand protolysis of HOCl yields to hypochlorite ion (OCl-) depending upon pH
and temperature
OClOHOHHOCl 32 (5)
83 1052][
]][[
HOCl
OClOHKa
at 20ordmC (6)
1
100
3
OH
KHOCl
a
(7)
70
GUumlNEY AND YOumlNSEL
pHOH 10][ 3
(8)
The product in the first compartment such as elemental chlorine (Cl2) hypochlorous acid
(HOCl) and hypochlorite ion constitute ldquofree available chlorinerdquo which is the first concept of
chlorine disinfection If there is ammonia in water chlorine reacts with ammonia and forms
chloramines (Hammer M J and Hammer MJJr 2004 Vijayaraghavan K et al 2004
Walter Jand Weber J R 1972) The chloramines are referred as ldquocombined available
chlorinerdquo which is the second concept of chlorine disinfection And finally the sum of free
available and combined available chlorine constitutes the ldquototal available chlorinerdquo in the
chlorine disinfection process
The disinfection effect of the combined available chlorine is dramatically less than the free
available chlorine For the disinfection of cysts of E hisytolica dichloramines (NHCl2) were
found to be 60 as efficient as HOCl and monochloramines (NH2Cl) were found to be 22
as efficient as HOCl under comparable conditions (Walter Jand Weber J R 1972)
Considering the contact time for a bactericidal effect 100 times more contact time is needed
for combined available chlorine compared to the same amount of free available chlorine
(Oğur et al 2004)
2 MATERIALS AND METHODS
21 EXPERIMENTAL DESIGN AND TEST SYSTEM
Figure 1 Test System
71
LAB-SCALE CHLORINE GENERATION
A laboratory system was provided to Istanbul Technical University by one of the Project
partners LVPG GmbH Germany This system was used for various test assumptions and
proposals for the best and optimal cell design Employing electrolysis techniques to produce
disinfectants saline waterseawater is introduced into an electrochemical cell in the heart of
the test system Electrochemical reaction within the cell results in the production of highly
effective ldquoHypochlorous acid-richrdquo disinfectant The disinfectant produced with the regular
current direction is called AnoFluid whereas the disinfectant produced with the reverse
current direction is called CathoFluid
22 Electrochemical Cells
In this study five different electrochemical cells are assessed for the BaWaPla system The
cells are been supplied from FumaTech GmbH Germany The cells are referred as ldquostandard
cell FTEC 100 FTEC 500 EC 100 Nr 201 EC 100 Nr 240rdquoThe variable parameters of the
cell design are the geometry and dimensions of the electrodes and the materials used for the
electrodes and their coatings1 (Table 1)
Table 1 Electrochemical cell specifications
1 The cells are supplied from FumaTech GmbH The Constructional and The technical details about the cells
depend on the personal communications correspondences and unpublished documents during the BaWaPla Project
Standard FTEC 100 FTEC 500 EC 100Nr 201
EC 100Nr
240
Dim
en
sio
n Anode 88x42 mm 88x42 mm 175x175mm 88x42 mm 88x42 mm
Cathode 88x42 mm 88x42 mm 175x175mm 88x42 mm 88x42 mm
Ge
om
ety
Anode Expanded grid Compact
planar
Compact
planar
Special Special
Cathode Expanded grid Expanded
grid
Expanded
grid
Special Special
Mat
eri
al
Anode Mixed metal
oxide
Mixed
metal
oxide
Mixed metal
oxide
Special coating
with a polarity
reversal finish
Special
coating with
a polarity
reversal
finish
Cathode Stainless Steel Stainless
Steel
Stainless
Steel
Special coating Special
coating
Membrane Fabric reinforced perfluorinated cation exchange membrane as separator
between catholyte and anolyte compartment
72
GUumlNEY AND YOumlNSEL
23 Water for the Experiments
For the experiments different types of substrates were used as outlined below
DI To produce disinfectant for the preliminary experiments with the Standard Cell deionised
water and saturated saline solution were used
ASW To avoid any uncontrolled effects of natural seawater artificial seawater prepared with
tap water and salt was used as test media for the preliminary investigations of cell types
FTEC 100 FTEC 500 EC 100 Nr201 and EC 100 Nr240
SW Further experiments were carried out with seawater collected from the Bosphorus at
Yenikoumly (Spermil~18)
24 Measured Parameters and Instruments
Total chlorine and free available chlorine were the main parameters investigated with respect
to the effectiveness of disinfectants They were measured by a Hach DR 2000
Spectrophotometer using the DPD method Redox potential pH temperature salinity and
conductivity were also measured as control parameters The equipment used for the
laboratory measurements are given within Table 2
Table 2 Parameters and instruments
Parameter Instrument
Redox Potential Hach Sension1 pH mV Meter
pH WTW 720 InoLabseries - pH Meter
Temperature WTW 720 InoLabseries - pH Meter
Salinity WTW LF 196 ndashMicroprocessor Conductivity Meter
Conductivity WTW LF 196 ndashMicroprocessor Conductivity Meter
Chlorine (Total and Free Available) Hach DR 2000- DPD method
3 Results and Discussions
The experimental procedures varied for each electrochemical cell based on the different
design parameters of the cells and the phase reached with the previous cell
Standard cell experiments were carried out with three different substrate salinities (9permil 20permil
35permil) under three different current stresses (8A 12A 16A) AnoFluid was produced with a
flow rate of 100 Lh and the samples were taken at the 10th minute of production
The results show that the effectiveness of AnoFluid increases with salinity and current as
expected due to principles of the electrochemical cells (Khelifa et al 2004) However it
should be noted that the change is not linear with the control parameters (Figure 2) The
results obtained with similar salinities reveal the irregularity of chlorine content change with
the current
73
LAB-SCALE CHLORINE GENERATION
Figure 2 Effect of salinity and current
On the other hand the temperature of the produced AnoFluid changed between 225-23ordmC
while pH values were distributed between 30 and 35 The calculations reveal that more than
9999 of free available chlorine is in the form of hypochlorous acid (HOCl)
Several sets of tests are carried out to develop specifications for regular operation with FTEC
100 The system was found to be stable at currents above 10 A and salinity above 10permil
(Figure 3) Therefore basically two different salinities (20permil 30permil) were tested with two
different currents (10 A and 16 A) under three different AnoFluid production rates (50 Lh
60Lh 75Lh) Artificial seawater was used as substrate AnoFluid production lasted 120
minutes and the values given in Figure 4 were derived from the samples taken at the end of
the production
Figure 3 Operation tests with FTEC 100 (Youmlnsel and Bilgin Guumlney 2010)
y = 1766ln(x) + 18226 Rsup2 = 08567
y = 58829ln(x) - 47376 Rsup2 = 09969
y = 57055e00556x Rsup2 = 09372
0
50
100
150
200
0 4 8 12 16 20 24 28
Chlo
rine
Tota
l [m
gL
]
Current [A]
Sal 9permil
Sal 20permil
Sal 35permil
0
2
4
6
8
10
12
0 30 60 90 120 150
Curr
ent [A
]
Duration [min]
Salinity 10permil Salinity 20permil
74
GUumlNEY AND YOumlNSEL
The results of FTEC 100 confirm the results of standard cell as the chlorine content rises with
current and salinity However these experiments also show the importance of the production
rate the higher chlorine contents were obtained with lower AnoFluid flow rates (Figure 4)
Figure 4 Effect of flow rate
Experiments with FTEC 500 were carried out under a 100 Lh flowrate with four different
maximum current settings (30A 40A 50A 60A) AnoFluid production lasted 10 minutes to
avoid heat excess on the cell Both artificial seawater (Sal 20permil) and natural seawater (Sal
~18permil) were used as substrates The numbers in the legends of related figures refer to the
number of experiment with the relevant substrate
Figure 5 Effect of substrate on current
0
50
100
150
200
250
300
50 55 60 65 70 75
Chlo
rine
Tota
l [m
gL
]
Flow rate [Lsa]
Sal20permil Current 10A Sal20permil Current 16A Sal30permil Current 10A
0
10
20
30
40
50
60
70
10 20 30 40 50 60 70
Obta
ined C
urr
ent
[A]
Maximum Setting [A]
SW1 SW2 ASW1 ASW2
75
LAB-SCALE CHLORINE GENERATION
The results underline that the properties of the substrate that go under the electrochemical
process have direct effect on the AnoFluid content Figure 5 shows the obtained current
values versus maximum current settings with each substrate The currents with natural
seawater generally lie below 30A even when the maximum setting reaches to 60 A whereas
with artificial seawater obtained and set values coincide This fact is also reflected in the
chlorine contents (Figure 6 and 7)
Figure 6 Effect of substrate on total chlorine
Figure 7 Effect of substrate on free available chlorine
Total and free available chlorine contents rise with rising currents with artificial seawater
However chlorine contents form groups around certain values as the currents cannot go
beyond 30A with natural seawater The maximum chlorine content of the AnoFluid produced
0
100
200
300
400
500
600
700
10 30 50 70
Chlo
rine
Tota
l [m
gL]
Current [A]
SW 1
SW 2
ASW 1
ASW 2
0
50
100
150
200
250
300
350
400
450
500
10 30 50 70
Chlo
rine
Fre
e [m
gL]
Current [A]
SW 1
SW 2
ASW 1
76
GUumlNEY AND YOumlNSEL
with natural seawater stays below the minimum chlorine content of the AnoFluid produced
with artificial seawater (Total chlorine332 mgL Free available chlorine 212 mgL)
Seawater contains a wide range of salts at various concentrations and combinations (Riley amp
Skirrow 1976) Our formerly published studies have shown that the chlorine figures decrease
as the Ca2+ and Mg2+ concentrations of the substrate increase to the typical seawater levels
and the accumulation of these ions on electrodes and membranes leads to a dramatic loss in
the AnoFluid quality over time (Bilgin Guney and Yonsel 2009) Additionally coastal
seawater may also contain high levels of ammonia (Yonsel et al 2000) and the ammonia
content of the intake ballast water has a direct effect on the seawater generated disinfectant
As the active chlorine produced at the electrode reacts rapidly with ammonia in the reaction
zone chloramines are formed The formation of chloramines causes a decrease in both total
and free available chlorine concentrations of the electrochemically produced disinfectant
(Bilgin Guumlney and Youmlnsel 2011) The difference between total and free available chlorine
contents of the produced AnoFluid indicates the presence of ammonia in the used seawater
The results of the tests show the need for the cells to have the ability to work with reverse
polarity onboard This necessity leads to new cell designs and consequently EC 100 Nr 201
and EC 100 Nr 240 were supplied from FumaTech GmbH The new electrode types were
designed to be seawater resistant which means resistant against typical seawater salt
contents The cells have electrodes equipped with polarity reversal finish which has an
additional protective layer between the coating metal and glossier electrode surface This
protective layer allows for reverse current direction such that self-cleaning of the cell can be
maintained simultaneously with the production of disinfectant The disinfectant produced in
this manner is referred to as CathoFluid to distinguish it from the disinfectant produced with
the regular current direction
The disinfectant production with EC 100 Nr 201 and EC 100 Nr 240 lasted 90 minutes for
each direction The samples of artificial seawater (Sal 20permil) and natural seawater (Sal
~18permil) were used as substrates The values given in Figure 8 and Figure 9 were derived from
the samples taken at the end of the production The numbers in the legends of related figures
refer to the number of the experiment with the relevant substrate
When using artificial seawater EC 100 Nr 240 shows better performance for both AnoFluid
and CathoFluid (Figure 8) The chlorine content of AnoFluid with artificial seawater was
generally greater than 150 mgL and for CathoFluid chlorine content was greater than 50
mgL even exceeding 150 mgL in some cases On the other hand the chlorine figures was
far less (lt50 mgL) when natural seawater was used as the substrate
77
LAB-SCALE CHLORINE GENERATION
Figure 8 Disinfectant produced with EC 100 Nr240
Figure 9 Disinfectant produced with EC 100 Nr201
EC 100 Nr 201 had much better performance when producing AnoFluid with natural
seawater (Figure 9) The chlorine content of AnoFluid was greater than 100 mgL throughout
the production But this cell did not have the same performance for CathoFluid The chlorine
content of CathoFluid was below 16 mgL in all cases
4 Conclusions
The overall results show that the best chlorine figures were achieved with FTEC 500 under
comparable conditions Considering the only exception between FTEC 100 and FTEC 500
was the electrode dimensions enlargement of other cells would also lead to this
consequence The best chlorine figures for AnoFluid with natural seawater were achieved
with EC 100 Nr 201 even though chlorine figures were far less for CathoFluid independent of
0
50
100
150
200
0 15 30 45 60 75 90 Chlo
rine
Tota
l [m
gL
]
Duration [min]
Anofluid ASW1
Anofluid SW1
Anofluid SW2
0
20
40
60
80
100
120
140
0 15 30 45 60 75 90
Chlo
rine
Tota
l [m
gL
]
Duration [min]
An fluid ASW1 Anofluid ASW2 Anofluid SW1
Anofluid SW2
Cathofluid ASW1 Cathofluid ASW2
78
GUumlNEY AND YOumlNSEL
dimensions Since the main objective is producing the best disinfectant using natural
seawater EC 100 Nr 201 is considered the best cell among the five in terms of cell design
Taking into consideration these laboratory results FumaTech GmbH optimised new cells for
BaWaPla These cells have the electrode dimensions like those of FTEC 500 and the
material used for electrodes and their coatings are similar to EC 100 Nr 201 The cells have
a capacity of 500 Lh disinfectant production and they have the ability to be operated with
reverse polarity such that a self-cleaning process can take place simultaneously with
disinfectant production Such cells will present substantial advantages considering the
operations onboard Six of these cells were employed within the land-based pilot BaWaPla
system at Blyth-England during the period from July to September 2009 (Figure 10) Under
optimal operation conditions the electrochemical module of the BaWaPla system had the
capability to provide 3-35mgL of active chlorine to the test tank which was capable of
disinfecting the organisms to IMO levels under operational conditions (ie seawater
properties organism load) (Carney et al 2009)
Figure 10 BaWaPla Pilot System Blyth-England (2009)
79
LAB-SCALE CHLORINE GENERATION
Acknowledgments
Authors thank all of the partners of ldquoBaWaPla ndash Sustainable Ballast Water Management
Plantrdquo Project funded by the European Union under contract number 031529 for their
support particularly Mr Michael Laverty and Mr Frank Voigtlaender from LVPG International
for providing the electrolyzing generator
REFERENCES
Abdul-Wahab SA and MA Al-Wesbahi (2009) Brine Management Substituting Chlorine with On-Site
produced sodium hypochlorite for Emvironmentally Improved Desalination Processes Water Resouce
Management 23 2437-2454
Abu-Khader MM Badran O and M Attarakihet (2011) Ballast water treatment technologies
hydrocyclonic a viable option Clean Techn Environ Policy (2011) 13403ndash413
Aliotta J Rogerson A Campbell CB and M Yonge (2003) Ballast water treatment by electro-
ionization In Raaymakers S (Ed) 2003 1st International Ballast Water Treatment RampD Symposium
IMO London 26ndash27 March 2001 Symposium Proceedings GloBallast Monograph Series No5 IMO
London p 61-69
Bilgin Guumlney C and F Yonsel (2009) Onboard electrochemically generation of disinfectant for ballast
water treatment 13th Congress of Intl Maritime Assoc of Mediterranean IMAM 2009 İstanbul 12-15
Ekim 2009
Bilgin Guumlney C and F Yonsel (2011) Effects of ammonia on electrochemical chlorine generation for
ballast water treatment Proceedings International Conference on Ocean Offshore and Arctic
Engineering OMAE 2011 June 19-24 Rotterdam
Carney KJ Delany J Mesbahi E Pazouki K Rajarajan N and K Emami (2009) Biological
technical and operational assessment and recommendations for systemrsquos operational optimisation
BaWaPla Deliverable 53 Draft
Dang K Yin P Sun P Xiao J and Y Song (2004) Application study of ballast water treatment bt
electrolyzing seawater In Matheickal JT Raaymakers S (Eds) 2004 2nd International Ballast
Water Treatment RampD Symposium IMO London 21ndash23 July 2003 Symposium Proceedings
GloBallast Monograph Series No15 IMO London p 103-110
Derek KG Duggan IC and HJ MacIsaac (2006) Can sodium hypochlorite reduce the risk of
species introductions from diapausing invertebrate eggs in non-ballast ships Marine Pollution
Bulletin 52 689-695
Hammer MJ MJ Hammer Jr (2004) Water and Wastewater Technology Fifth Edition Prentice-
Hall Inc 2004 New Jersey ABD
80
GUumlNEY AND YOumlNSEL Jonnalagadda SB and S Nadupalli (2004) Effluent tretment using electrochemically bleached seawater-oxidative degradation of pollutants Talanta 64 18-22 Yonsel F et al (2000) İstinye deresinin İstanbul Boğazırsquona taşıdığı kirlilik IV Ulusal Kimya
Muumlhendiliği Kongresi 4-7 Eyluumll Istanbul
Kerwick MI Reddy SM Chamberlain AHL and DM Holt (2005) Electrochemical disinfection an
environmentally acceptable method of drinking water disinfection Electrochimica Acta 50 5270-5277
Khelifa A Moulay S Hannane F Benslimene S and M Hecini (2004) Application of experimental
design method to study the performance of electrochlorination cells Desalination 160 91-98
Kim E Shin K Kang JH Pak D Lee KP Lee IS and K Rhie (2006) Consideration on the
environmental acceptability and biological effectiveness of the electrochemical disinfection system for
balast water management Oceans 2006- Asia Pacific Conference Singapore 16-19 May
Kraft A Stadelmann M Blaschke M Kreysig D Sandt B Schroumlder and F Rennau J (1999a)
Electrochemical water disinfection Part 1 Hypochlorite production from very dilute chloride solutions
Journal of Applied Electrochemistry 29 861-868
Leffler C E Rogerson A Paul W Germaine G Elliot M Antonelli V Grubs S Campbell C Beall G and A Salamone (2004) Electro-sanitization of ballast water In Matheickal JT Raaymakers S (Eds) 2004 2nd International Ballast Water Treatment RampD Symposium IMO London 21ndash23 July 2003 Symposium Proceedings GloBallast Monograph Series No15 IMO London p 111-120 Matousek R C Hill DW Herwig RP Cordell JR Nielsen BC Ferm NC Lawrence DC and
JC Perrins (2006) Electrolytic sodium hypochlorite system for treatment of ballast water Journal of
Ship Production 22 No3 160-171
Oğur R Tekbaş OumlF and M Hasde (2004) Klorlama Rehberi (İccedilme ve Kullanma Sularının
Klorlanması) Guumllhane Askeri Tıp Akademisi Halk Sağlığı Anabilim Dalı Ankara
Rajeshwar K and JG Ibanez (1997) Environmental Electrochemistry Fundamentals and Applications
in Pollution Abatement Academic Press California
Sawyer C N McCarty PL Parkin and GF (1994) Chemistry for Environmental Engineering
Fourth edition McGraw-Hill series in water resources and environmental engineering New York
Srinivasan S (2006) Fuel Cells From Fundamental to applications Springer Science+Business
Media New York ABD
Stocks D T OrsquoReilly M and W McCracken (2004a) Treatment of ballast water in the NOBOB ship
using heat In Matheickal JT Raaymakers S (Eds) 2004 2nd International Ballast Water
81
LAB-SCALE CHLORINE GENERATION Treatment RampD Symposium IMO London 21ndash23 July 2003 Symposium Proceedings GloBallast
Monograph Series No15 IMO London p 80-87
Tsolaki E and E Diamadopoulos (2009) Technologies for ballast water treatment A review J Chem
Technol Biotechnol 2010 85 19ndash32
Tsolaki E Pitta P and E Diamadopoulos (2010) Electrochemical disinfection of simulated balast
water using Artemi salina as indicator Journal of Chemical Engineering 156 305-312
Vijayaraghavan K Ramanujam TK and N Balasubramanian (1999) In situ hypochlorous acid
generation for the treatment of syntan wastewater Waste Management 19319-323
Weber Jr JW 1972 Physichochemical Process for Water Quality Control Wiley-Interscience Series
of Texts and Monographs
Youmlnsel F Bilgin C and C Guumllşen (2000) İstinye Deresinin İstanbul Boğazına Taşıdığı Kirlilik
UKMK-IV Bildiri Kitabı 2 Cilt S 769-774 4-7 Eyluumll 2000 İstanbul Uumlniversitesi Avcılar-İstanbul ISBN
975-404-615-8
Youmlnsel F and C Bilgin Guumlney (2010) Electrochemical chlorine generation applications for ballast
water treatment International Conference on ship design and operation for environmental
Sustainability 10 - 11 March 2010 RINA Hq London UK Bildiriler kitabı sayfa 95-103 ISBN 978-1-
905040-69-8
Zhang S Yang CD Gong W Wang Q Xiao J Zhang H and Q Wang (2004) Effects of the
chlorination treatment for ballast water In Matheickal JT Raaymakers S (Eds) 2004 2nd
International Ballast Water
Treatment RampD Symposium IMO London 21ndash23 July 2003 Symposium Proceedings GloBallast
Monograph Series No15 IMO London p 148-157
83
BALLAST WATER MANAGEMENT SYSTEMS
A Ballast Discharge Monitoring System for Great Lakes Relevant Ships A Method for Researchers
Ship Owners and Agency Officials
Allegra Cangelosi1 Tyler Schwerdt Travis Mangan Nicole Mays Kelsey Prihoda
Abstract
The Great Ships Initiative (GSI) is a collaborative project led by the Northeast-Midwest Institute
devoted to ending the problem of ship-mediated invasive species in the Great Lakes-St Lawrence
Seaway System and globally In support of that goal GSI has established superlative freshwater
ballast treatment evaluation capabilities at three scalesmdashbench land-based and onboard ship GSI
testing takes place at the scale appropriate to the treatmentrsquos state of development The goal is to help
meritorious BWTSs progress as rapidly as possible toward an approval-ready and market-ready
condition through supplying rigorous status testing or certification testing of biological efficacy
GSI developed and tested onboard five ships a ship discharge monitoring method to share with
regulatory authorities ship owners and researchers The method details an approach for collecting and
analyzing representative samples of living organisms in ballast discharge from Great Lakes-relevant
ships Specifically the method describes a feasible practicable and cost-efficient approach for
retrieving quantitative samples from ships to determine live organism densities in three size classes of
organisms (equal to or greater than 50 micrometers in minimum dimension less than 50 micrometers
and equal to or greater than 10 micrometers in minimum dimension and less than 10 micrometers in
minimum dimension) water quality parameters and whole effluent toxicity tests
GSI designed the ship discharge monitoring method for planned ship discharge monitoring exercises
(the method would not be suitable to surprise spot checks) As such the method is highly applicable to
a wide range of quantitative ballast treatment performance research and validation including type
approval testing and planned treatment performance monitoring events post approval Any application
of the method to regulatory purposes however would require close review and revisions of method
specifics per specific regulatory guidelines
Key Words Great Ships Initiative Great Lakes Ballast Water Ballast Discharge Ship Discharge
Monitoring Shipboard Tests Ballast Water Treatment Systems Ballast Water Samples
Introduction
The objective of this paper is to document a Great Ships Initiative (GSI) ship discharge
monitoring method which GSI developed to prepare regulatory authorities ship owners and
1 Northeast-Midwest Institute
84
CANGELOSI SCHWERDT MANGAN MAYS AND PRIHODA
researchers for collecting and analyzing representative samples of living organisms in ballast
discharge from Great Lakes-relevant ships Specifically the GSI method allows monitoring
entities to retrieve quantitative samples from ships to determine live organism densities in
three size classes of organisms (equal to or greater than 50 micrometers in minimum
dimension less than 50 micrometers and equal to or greater than 10 micrometers in minimum
dimension and less than 10 micrometers in minimum dimension) water quality parameters
and whole effluent toxicity tests Methods associated with sample analysis were not part of
the scope of the project GSI has already developed Standard Operating Procedures for
these analyses which can be downloaded from GSIrsquos website (wwwgreatshipsinitiativeorg)
It is important to note that the method described here is preliminary and subject to revision
over time GSI will periodically update the method and repost new versions on its website
GSI designed the ship discharge monitoring method reported here for planned ship discharge
monitoring exercises (the method would not be suitable to surprise spot checks) As such the
method detailed in this paper is highly applicable to a wide range of quantitative ballast
treatment performance research and validation including type approval testing and planned
treatment performance monitoring events post approval Any application of the method to
regulatory purposes however would require close review and revisions of method specifics
per particular regulatory guidelines
This paper
Presents an overview of the GSI ship discharge sampling approach
Describes details of the sample and return port installations necessary for this
sampling approach to be used on Great Lakes-relevant ships
Details the set-up and break-down processes for implementing this approach for a
sampling event and
Provides a discussion of the feasibility of the methods including their strengths and
weaknesses based on GSI trials in the field
Background on the Great Ships Initiative (GSI)
GSI is a collaborative project led by the Northeast-Midwest Institute (NEMWI) devoted to
ending the problem of ship-mediated invasive species in the Great Lakes-St Lawrence
Seaway System and globally NEMWI is a Washington DC-based non-profit and non-
partisan research organization dedicated to the economic vitality environmental quality and
regional equity of Northeast and Midwest states In support of that goal NEMWI has
established through GSI a superlative freshwater ballast treatment evaluation capabilities at
three scalesmdashbench land-based and onboard ship GSI research is carried out
85
A BALLAST DISCHARGE MONITORING SYSTEM
collaboratively with contracting entities including the University of Wisconsin-Superior (UW-
S) AMI Consulting Engineers Broadreach Services and the University of Minnesota-Duluth
(UM-D)
GSI testing takes place at the scale appropriate to the treatmentrsquos state of development The
goal is to help meritorious BWTSs progress as rapidly as possible toward an approval-ready
and market-ready condition through supplying rigorous status testing or certification testing of
biological efficacy To assure relevancy of test output GSI test protocols generally are as
consistent with the International Maritime Organization (IMO) Convention for the Control and
Management of Ships Ballast Water and Sediments Convention (IMO 2004) and federal and
state requirements as practicable For example United States Environmental Protection
Agency (USEPA) Environmental Technology Verification (ETV) Program testing is performed
consistent with ETV protocols (eg NSF International 2010)
A GSI Advisory Committee is comprised of top-level officials of key stakeholder groups and
provides direct input on GSI award decisions program direction finances and fund-raising
The GSI Advisory Committee which meets three times a year includes elected leadership
environmental organizations port directors and federal officials from the United States and
Canada and industry representatives
GSIrsquos Quality Management Plan (GSI 2011) outlines the activities that GSI uses to ensure
that personnel have the necessary education qualifications and experience needed to
effectively carry out their specific roles and responsibilities within the project
Background on GSI Ship Discharge Monitoring Project
GSI received funding from the Legislative Citizenrsquos Commission on Minnesota Resources
(LCCMR) the Maritime Administration and the Great Lakes Protection Fund to design install
and test a ship-based ballast discharge sampling approach on the range of commercial cargo
ships which ply the Great Lakes The primary goal of this GSI project was to inform ship
owners researchers and regulators about effective and efficient methods for carrying out
ballast discharge monitoring on Great Lakes ships A secondary goal was to initiate the
installation of effective sampling ports on Great Lakes-relevant ships for BWTS testing and
monitoring
GSI developed a proposed sampling approach which included permanent sample port flange
installation guidelines consistent with those of the IMO (IMO 2004) and the USEPA ETV
Program (NSF International 2010) portable sampling system equipment and methods for
shipboard use and portable sample analysis equipment and methods for port-side use
86
CANGELOSI SCHWERDT MANGAN MAYS AND PRIHODA
GSI personnel visited a range of ships to identify optimal locations for sample port flanges
given a set of the project criteria (see Methods) Sample locations that had the potential to
meet most or all of these criteria were identified and photographed during the ship visit and
later modeled using computational fluid dynamics (CFD) to determine which location would
deliver the most representative sample
GSI in consultation with the ship owner then selected the best location based on the
inspection information and the ships were then outfitted with sample flanges GSI visited the
ships to trial and review the GSI sampling approach in real-world applications This paper
provides the method and lessons learned from this project activity The sample ports will stay
in place for possible future use in research and compliance monitoring Data gathered on
living organisms in ballast discharge sampled through this project will be provided to the State
of Minnesota and published on GSIrsquos website (wwwgreatshipsinitiativeorg)
Sampling Approach Overview
GSI designed the sampling approach described here to be applicable to a range of test
applications It employs simultaneous in-line and continuous collection of large and small
quantities of sample water from subject ballast water discharge to estimate live organism
densities and types in and water quality characteristics of that discharge The method is
adaptable to a wide range of sampling intensities and ships with diverse ballast line diameters
and ballast system types
It is important to note that hardware and personnel alone will not deliver useful sampling
exercises The sampling team must also have a robust and valid test plan and standard
operating procedures (SOPs) to accompany any ship sampling exercise The test plan will
describe the objectives of the test the hypotheses the experimental design the analytical
methods and quality control and quality assurance (QAQC) procedures for the work The
SOPs will detail specific methods The GSI website (wwwgreatshipsinitiativeorg) includes
test reports on ship-based ballast treatment research providing examples of these
documents
Details of the sampling approach are provided in subsequent sections Fundamentally the
process involves
Prior installation of two permanent 4-inch diameter blind flanges in a strategically
selected segment of the shiprsquos ballast line (detailed below) and insertion of a
temporary sampling pitot in one such flange
87
A BALLAST DISCHARGE MONITORING SYSTEM
Space and services on the ship to support sample collection (detailed below)
A port-based set-up sampling and ballast team of four people and nearby analytical
space and equipment (detailed below) and
A time window affording 45 minutes to one hour for sampling system set-up and 45
minutes to one hour for its break-down in addition to the selected sampling period
duration
Figure 1 Schematic of the GSI Ship Discharge Sampling System and
Component Parts
Figure 1 illustrates the GSI sampling system lay out In summary the installation of the blind
flangesmdasha relatively minor permanent change to the ship costing less than $5000mdashis
completed according to strict location guidelines well before sampling is to occur At the time
of or just prior to the sampling event an elbow-shaped sampling pitot is installed in the
upstream flange to deliver flow to the sampling system For zooplankton sampling (ie
organisms equal to or greater than 50 micrometers in minimum dimension) sample flow from
88
CANGELOSI SCHWERDT MANGAN MAYS AND PRIHODA
the discharge line is pumped from the sampling pitot at a known flow rate through a plastic
line equipped with a flow meter into a 35 micron plankton net that is suspended in a 50 gallon
tub with a level transmitter and a bottom discharge flange The fraction of the ballast line flow
pumped through the sample port should remain constant throughout the sampling process
This ratio is monitored using an in-line magnetic flux flow meter on the sample line and a
portable ultrasonic flow meter mounted to the ships ballast piping A second pump draws
spent sample water from the 50 gallon tub through plastic line to the return flange in the
ballast line for discharge overboard with other ballast water The water level in the tub is
maintained at near full as the net filters the plankton into a bottom cod-end A small side
stream of the sample water flow (pre-plankton net) is directed into a carboy for whole water
samples which can be used to assess water quality protists (ie organisms less than 50
micrometers and equal to or greater than 10 micrometers in minimum dimension) bacteria
(ie organisms less than 10 micrometers in minimum dimension) and effluent toxicity Grab
samples can be extracted from the line (ie hose) feeding into the nets or through a
dedicated side port off the main sample line which can be opened and closed Sample
analysis can take place on-ship but is easiest to arrange off-ship
METHODOLOGY
Sample PortsReturn Ports
GSI installed sample ports and return ports as 4 ldquo150 ANSI flanges with blinds GSI
employed stainless steel bent elbow style pitots (Figure 2) installed so that the opening faces
into the flow at the center of the pipe
GSI first determined the target sample volume per unit ballast discharge based on
experimental design criteria Then it assured the internal diameter of the pitot opening was
large enough to guarantee that sample water pumped through the pitot was able to provide
the target volume but at a subisokinetic flow velocity that ranges between 44-25 of the
discharge flow velocity of the ship An isokinetic flow rate occurs within a pitot when the
sample water flow velocity is the same as discharge line flow velocity
A subisokinetic velocity means there is a slower flow velocity in the pitot than in the line being
sampled Consistent with recommendations by the United States Coast Guard (USCG) to
maintain a pitot inlet of 15-20 times the isokinetic diameter (USCG 2008) GSI assumes that
subisokinetic flow helps prevent organism damage by edge interactions with pitot inlet and
walls Assuming most ballast systems are designed for a flow rate of around 10 feetsecond
the pitot sizes required to collect a range of volume of sample water per hour are shown in
Table 1
89
A BALLAST DISCHARGE MONITORING SYSTEM
Figure 2 Diagram of Elbow Pitot for Ballast Discharge Sampling
Table 1 Relationship of Sample Pitot Diameter to Sample Water Flow Rate
Sample Pitot Flow Rate at 10 ftsec Ranging From 15 - 20 Times The Isokinetic Diameter
Diameter (in)
34
1
1 14
1 12
2
2 12
3
3 12
4
Flow (GalHr)
3594 - 2022
5 978 ndash 363
10661 - 5997
14687 - 8261
24542 - 13805
35225 - 19814
54897 - 30879
73869 - 41551
95552 - 53748
Flow (M3Hr)
14 - 08
23 - 13
4 - 23
56 - 31
93 - 52
133 - 75
208 - 117
28 - 157
362 - 203
90
CANGELOSI SCHWERDT MANGAN MAYS AND PRIHODA
Step-by-Step Approach to Pitot Diameter Selection
1 Determine Test Plan Sample VolumeRate requirements (eg the test plan requires
60 m3 in 2 hours or 30 m3hr)
2 Assure the pump is capable of that flow rate
3 Consult with the ship engineer to determine ship ballast discharge flow rate (usually
around 10 ftsec but not always)
4 Select a pitot diameter that assures the flow velocity is in the subisokinetic range of
44 - 25 ballast discharge flow rate If they ballast at 10 ftsec Table 1 can be used
(eg For a desired flow rate of 30 m3hr per Table 1 a 125 pitot can be used since
it has a valid range of 40-23 m3hr)
Criteria for Sample Port Location
The location of the sample port is critical to its ability to deliver representative samples of live
organisms in ballast discharge Both fluid dynamic properties of a location physical access
and safety considerations come into play
Table 2 GSI Criteria for Sample Port Location in a Ship Ballast System
Criteria Reason
Single location services all tanks equally
A single sample point means fewer flanges are needed and less sampling effort is required
Long length of straight pipe preceding the sample port
Long lengths of straight pipe create a ldquofully developedrdquo flow characteristic assuring water is well-mixed at the point of sampling and samples are representative of the discharge
Locations as close to overboard as possible
Samples collected closer to discharge will more closely represent the quality of water entering the receiving system
A suitable adjacent area for sample processing suitable for technician occupancy and with accessible light and power supply
A sample port alone wonrsquot deliver a good sample Technicians must be able to work in proximity to it to collect and process samples
Necessary clearances to install the sample pitot
The sample team or ship personnel must be able to install and remove the pitot without damaging other equipment
Piping that can be isolated Piping around the sample location must be isolated so that the sample equipment can be safely installed or removed
No explosion or other hazards Explosive environments require special equipment to assure safety of the ship crew and sampling team
91
A BALLAST DISCHARGE MONITORING SYSTEM
A suitable location for a return flow port is somewhat simpler as the flow mechanics of the
return location are unimportant but locating it a minimum of two pipe diameters downstream
of the sample port assures that it in no way interferes with the sample port fluid dynamics
GSI uses the criteria detailed in Table 2 to guide selection of sample port location
Sample Pitot Locations in Ballast Systems Found on Great Lakes-Relevant Ships
Types
A ballast system comprises the pump sea chests and piping associated with moving ballast
water on and off the ship Most ships have two ballast systems mirrored along the centerline
of the ship one system services the port side tanks and the other the starboard tanks Thus
most ships require a minimum of two sample points for monitoring ballast discharge Ballast
systems associated with ships in service on the Great Lakes can be quite different from each
other as will the best location for a sample point given the criteria noted in Table 2 During
GSI ship inspections three fundamentally different types of ballast systems were identified
Distributed Manifold Ballast System (Figure 3) in a distributed manifold system a
single pump or pair of pumps is installed in the engine room with ballast main(s)
traveling the length of the ship Branches off the main service each tank Flow in or
out of the tank is controlled by manual or actuated valves at the ballast tank This
ballast system design typically had straight lengths of pipe suitable for sampling
locations in the ship tunnel
Figure 3 Schematic of Distributed Manifold Ballast System Design
Centralized Manifold Ballast System (Figure 4) this ballast system style is similar to
a distributed manifold except each ballast tank has an individual line leading back to
92
CANGELOSI SCHWERDT MANGAN MAYS AND PRIHODA
the engine room the lines combine prior to the pump All the ballast system valves
are located together in the engine room
Figure 4 Schematic of Centralized Manifold Ballast System Design
Multiple Independent Ballast Systems (Figure 5) Ships with multiple independent ballast
systems have no common piping between ballast tanks Every ballast tank on the ship has a
separate sea chest ballast pump and piping This style of ballast system is rare within and
outside the Great Lakes
Figure 5 Schematic of Multiple Independent Ballast System Design
93
A BALLAST DISCHARGE MONITORING SYSTEM
Power Requirements
Power requirements for sample collection systems should be kept to a minimum The GSI
sampling system runs off of two 13 amp 120 volt circuits at 60 hertz Although it has been
easy to find this supply on US and Canadian ships it becomes more difficult with foreign
vessels that operate with different electrical standards
Pitot Custody
The GSI team prefers to provide the pitot to the ship master for installation into the flange
sometime within a week or two prior to the shiprsquos arrival at the port at which sampling is
scheduled After the sample visit the ship crew returns the pitot to the GSI sample team GSI
does not install sample pitots permanently in the ships in order to assure that bio-fouling
inside of the pitot does not bias sampling outcomes and to assure that structural defects of
the pitot will not endanger ship operations If necessary GSI can install the pitot on the day of
sampling but this approach expends limited time available for set-up and sample collection
processing and analysis
GSI recommends that pitots be owned by the testing agency and loaned to the ship being
evaluated Upon pitot return after a sampling event the GSI team inspects the pitot for any
damage Having the pitot belong to the sample team also puts the responsibility of
maintaining a specialized piece of equipment in the hands of those that will need to operate it
The research team can then size the pitot aperture to deliver the desired flow to discharge
ratio (ie volume of sample water per unit volume of ballast discharge)
Step-By-Step Process for Sample Port Commissioning
In summary steps employed by GSI to identify and install sample ports on ships are as
follows
1 Pre-Installation Ship Inspection A ship inspection is conducted to identify and
document features of sample locations with potential to meet most or all of the relevant
criteria Also possible locations for a return flow port downstream of the sample port
and sample processing are assessed and identified at this time
2 CFD Models A qualified engineering firm models potentially suitable locations using
computational fluid dynamics (CFD) to determine which locations in fact provide well-
mixed samples of ballast discharge (ie have fully developed flow or are closest to fully
developed flow)
3 Installation Design to Ship Owner Once a location is determined by the sample
inspection team the location is submitted to the ship owner for approval and class
society review
94
CANGELOSI SCHWERDT MANGAN MAYS AND PRIHODA
4 Flange Installation Once the ship owner and class society agree to the design the
ports can be installed with blind flanges
5 Pitot Installation Prior to a sampling event the blind flange is removed and replaced
with a sample pitot of an appropriate size
Equipment Set up and Tear Down
GSI selected sampling equipment for its reliability and portability All of the equipment and
components of the process described here are no greater than 45 lbs in weight GSI includes
spare parts for critical components in case of component failure during sampling Set up and
tear-down of the sampling system consumes approximately one and one-half (15) hours
each by two technicians
SAMPLING SYSTEM COMPONENTS
The following components comprised GSIrsquos sampling system
Sample Pitot and Sample and Return Port Flange
Function A section of pipe sized to allow water to be collected from the center of the ballast
line
GSI Specific Equipment
Manufacturer Custom designed and manufactured
Model Custom
Description A 90 degree elbow mounted on a 4rdquo 304L stainless steel sample port blind
flange The sample pitot is made from 1-14rdquo sch 40 304L stainless steel pipe There is a 1-
14rdquo full port ball valve with plug installed on the outlet of both to prevent leaking The pitot
aperture is sized to deliver 15-2 times isokinetic flow from the line being sampled The return
flange is a board flange with threaded nipple welded to match the size of the pitot
See Figure 6 for an installation example
Figure 6 Sample Pitot and Sample and Return Port Flange
95
A BALLAST DISCHARGE MONITORING SYSTEM
Electrical Cabinet
Function Monitor and control the system logic
GSI Specific Equipment
Manufacturer Rockwell Automation
Model Custom
Description Contains the PLC motor drives and other necessary components see Figure 7
Figure 7 Electrical Cabinet
Ultrasonic Flow Meter9
Description Monitors the ballast discharge flow rate from the exterior of the ballast
discharge pipe
GSI Specific Equipment
Manufacturer Fuji Electronics
Model FSC wFSD410B1 transmitters
Description See Figures 8 and 9
Figure 8 Ultrasonic Flow Meter Figure 9 Flow Meter Transducer
9 GSI team determined that this approach to monitoring the ballast discharge flow rate was not sufficiently reliable and flexible
across ships to warrant continued use Instead ideally ballast treatment systems should be installed with magnetic flow meters In the worse -case scenario indirect methods of determining ballast discharge flow using tank level changes should be used
96
CANGELOSI SCHWERDT MANGAN MAYS AND PRIHODA
Figure 10 Sample Flow Meter
Figure 11 Tub Level Transducer
Figure 12 Sample Pump
Magnetic Flow Meter
Function Monitors the flow rate of water
being sampled by the sampling system
GSI Specific Equipment
Manufacturer Yamatake
Model MTG18A
Description Two Wire electromagnetic in-
line flow meter see Figure 10
Tub Level Transducer
Function Monitors the level of the water in
the tub
GSI Specific Equipment
Manufacturer Ametek DrexelBrook
Model 750 Series Well Watcher Submersible
Level Transmitter
Description See Figure 11
Sample Pump and Return Pump
Function Sample pumps water from shiprsquos
ballast lines to sample tub and return pumps
back into the ballast line
GSI Specific Equipment
Motor Dayton 1TRZ6
Pump Jabsco 777-9001
Coupling Lovejoy AL095 amp 68514471706
Description Flexible impeller pumps
custom aluminum frame See Figure 12
97
A BALLAST DISCHARGE MONITORING SYSTEM
Sample Tub
Function Provides a reservoir for the sampling net with inlet and outlet
GSI Specific Equipment
Manufacturer RubberMaid
Model 32 Gallon Heavy Duty trash can
Description Bulkhead fitting with a valve on the bottom as a water outlet and an adjustable
riser to hold the sample nets See Figure 13
Figure 13 Sample Tub
Laptop
Description Provides the interface for running the Ballast Sampling Program and data
logging
GSI Specific Equipment
Manufacturer Panasonic Semi-Rugged Toughbook
Model CF-52
Description The Toughbook provides some splash resistance and fall protection as well as
dust protection that is above what a typical laptop would provide It also provides access to
equipment manuals troubleshooting guides and other useful information while in the field
See Figure 14
98
CANGELOSI SCHWERDT MANGAN MAYS AND PRIHODA
Figure 14 Laptop
Whole Water Sampling Apparatus Function For small volume collection that is representative of an individual sample period GSI Specific Equipment Manufacturer Key Instruments (flow meter) Model 5079K53 Description Known as the ldquoSeep Samplerrdquo the apparatus consists of a PVC T section on
the 1rdquo hose (with PVC union fittings) from the collection pitot to the sampling tub (Figure 1) A
frac12rdquo brass fitting was used to connect the rotometer (flowmeter) to the PVC section A brass
fitting on the outlet of the rotometer connects to a small PVC hose (18rdquo) leading into a
carboy A pinch clamp on the small tubing provides flow control See Figure 15
Figure 15 Seep Sampler
99
A BALLAST DISCHARGE MONITORING SYSTEM
Human Machine Interface (HMI) Software The GSI shipboard sample equipment is controlled using FactoryTalk Historian ME
FactoryTalk is a brand of HMI software that includes graphical representation (see Figure 16)
Any HMI software used to control sampling equipment should include the following abilities
1 Control of pump actives through PLC loops
2 Ability to set sample pump as a percent of ballast line flow
3 Data Logging and live data display and
4 Fault and warning notifications
Figure 16 Sample Screen Image from GSI HMI Software
100
CANGELOSI SCHWERDT MANGAN MAYS AND PRIHODA
Sample Gear
Sample gear included the following items Plankton Net and Cod-End Manufacturer Sea-Gear Corporation Model 9000 (30cm 31 35 micrometer mesh) Description Zooplankton samples are collected by concentrating the sample volume
through a 35 micrometer mesh plankton net (ie 50 micrometers on the diagonal) into a 1
Liter cod-end for analysis A minimum of one plankton net is required per sample The
plankton nets used by GSI during shipboard sampling were purchased from Sea-Gear
Corporation of Melbourne Florida (Figure 17)
Figure 17 Plankton Net (35 micrometers) with Attached 1 Liter Cod-End
Sample Collection Containers Carboy 20 Liter Manufacturer ULine Model S12768 Description High-density polyethylene (HDPE) containers for time-integrated sample
collection the type and quantity of which are dependent on the test plan For example the
time-integrated ldquoseeprdquo sample is collected using a 19 liter HDPE carboy (one per replicate
101
A BALLAST DISCHARGE MONITORING SYSTEM
Figure 18) For collection of whole effluent two time-integrated ldquoseeprdquo samples are collected
one for whole water samples and one for whole effluent toxicity testing From one time-
integrate sample total suspended solids and percent transmittance subsamples as well as
whole water for analysis of protists are collected using HDPE sample bottles (Figure 18)
Organic carbon samples (ie non-purgeable organic carbon and dissolved organic carbon)
are collected using 125 mL glass sample bottles prepared by soaking in Micro-90reg
Concentrated Cleaning Solution (Figure 18) Microbial samples (a minimum of three
subsamples per carboy) are collected using sterile 1 liter polypropylene bottles (not pictured)
Extra sample containers should be carried aboard
Figure 18 Sample Collection Containers used for Shipboard Sampling Events
Transport Coolers and Ice Packs Description To ensure sample integrity proper sample holding and transport is of the
upmost importance Following sample collection sample bottles are immediately placed into
small sample transport coolers (Figure 19) and are kept cold until they are delivered to the
sample analysis personnel by using a minimum of two ice packs per cooler (Figure 19)
YSI Multiparameter Water Quality Sonde with Data Display and Logging System
Manufacturer YSI Incorporated (Yellow Springs Ohio)
Model YSI 6-Series Model 6600 V2-4 Sonde and YSI 650MDS Data Logging System
102
CANGELOSI SCHWERDT MANGAN MAYS AND PRIHODA
Description Water quality parameters are measured from the time-integrated sample using
a YSI Multiparameter Water Quality Sonde (Figure 20) It is recommended that two Sondes
be brought onboard in case one of the Sondes is not functioning correctly The 6600 V2-4
Sonde (Figure 20) was used by GSI and included sensors to measure the following
parameters specific conductivity salinity pH temperature dissolved oxgen (concentration
and percent saturation) turbidity and total chlorophyll The measured values are displayed
using the YSI 650 MDS data logger (Figure 21)
Figure 19 Small Sample Transport Cooler with Samples and Ice Packs
Figure 20 (left)YSI 6-Series Multiparameter Water Quality Sonde (YSI 6600 V2-4)
Figure 21 (right) YSI 650 MDS Data Logging System
103
A BALLAST DISCHARGE MONITORING SYSTEM
Standard Operating Procedures Test Plan Datasheets and Laboratory Notebooks
Description A copy of the Test Plan as well as the sample collection SOPs must be
brought on board during the sampling event and must be readily accessible to the sample
collection team The appropriate datasheets will be identified in the Test Plan and extra
datasheets should be brought onboard along with extra pens (indelible ink only) Data may
also be recorded in laboratory notebooks although pre-printed datasheets are preferred due
to the increased efficiency of data recording
Personal Protective Gear and Dress
The equipment listed below is the recommended and in most cases the required protective
gear for personnel involved with the shipboard ballast sampling and operation of the
equipment The requirements of the vessels or the facilities through which the vessels are
accessed may vary and the sample team is expected to follow safety procedures required of
the dock or ship including Occupational Safety and Health Administration (OSHA)
requirements
Hardhat
Steel toe boots
Safety Glasses
Hearing Protection (ear plugs or muffs or in some cases both may be advisable)
Flashlight or headlamp
Work Gloves
Work Clothing ndash work clothing should cover arms and legs and fit in a manner
as to not create a safety hazard Jewelry (including rings) is not recommended
and on many facilities not allowed
Transportation Worker Identification Card (TWIC) ndash Some facilities require for
access
Equipment Set Up and Tear-Down
Equipment loading and unloading to and from the ship should be as swift as possible to
minimize disruption to ship operations and to avoid the possibility of needing to re-route entry
during the loading Two to four people can effectively accomplish set up and tear-down within
45 minutes to one hour for each operation It is advisable to have one member of the set-up
104
CANGELOSI SCHWERDT MANGAN MAYS AND PRIHODA
team assigned to sonic flow meter set up while the others bring the rest of the gear to the
sampling location since flow meter set up can be time consuming It is important to make sure
that hose unions have the rubber grommet installed and that all connections are proper and
snug Equipment should be laid out with consideration to
Keeping walkways clear of wires and other equipment
Keeping wires and hoses neat using wire ties to secure hoses and wiring out of the
way and
Planning for good work flow
Once all of the hoses are installed the valves may be opened on the sample and return ports
and at the pumps and sample tub With the software program in manual mode the pump
rotation should be verified by powering the pump motor for a few seconds while someone
checks for rotation If the pump does not turn the motor should be disconnected from the
electrical cabinet and the guard removed to allow the pump to be manually turned over
several times This usually should require a ldquoLockoutTagoutrdquo procedure The guard should
then be reinstalled and the pump rechecked
During equipment tear-down the sample port and return port valves must first be closed and
the plugs secured GSIrsquos Ballast Sampling System is designed to automatically empty the
sample tub at the conclusion of a test Depending on the amount of water left in the sample
tub it may be best to place the control program into manual mode and completely drain the
sample tub of water tilting the sample tub to get the water into the drain The sample lines
must also be manually emptied into the sample tub
Other tasks are
Packing the pump for removal
Removing the hoses from the sample pitots via unions
Shutting the valve on the return port to prevent any flow that may otherwise push
back through the return pump
Backing up the data log file separately from the laptop
Packing and removing from the vessel the remainder of the hose wiring and
equipment
Conducting a final visual check to assure that all equipment and personal items have
been removed and
Ensuring that both the Sample and Return port valves are fully closed and the plugs
firmly installed
105
A BALLAST DISCHARGE MONITORING SYSTEM
Discussion
Overall the sampling approaches and supporting equipment detailed in this paper performed
well during GSIrsquos ship visits GSI successfully loaded set up and operated the sampling
method described here within a feasible time window and ldquoleft no tracerdquo upon departing the
ship except for the pitot flange which was removed later by the ship crew
The costs of carrying out a sampling event using this method (excluding scientific supplies
associated with sample analysis) are detailed in Table 3
Table 3 GSI Costs Per Sampling Event
One-Time
Costs
Cost Factor TimeCost
Ship Inspection $1500
Installation of flanges in a ship $2000-$5000
Reuseable Operational Equipment $45000
Biological Sampling Equipment
$500-$2000
depending on Test
Plan
Set up and Tear Down of Sampling Equipment 15 ndash 2 hrs (total)
assuming 2-3 staff
Per Sampling
Event Costs
Sample Collection Staff Time TBD depending on
Test Plan
Staff Travel TBD depending on
Test Plan
Equipment Performance
Sampling operational equipment performed as expected with the following exceptions
The Ultra-Sonic Flow Meter on the shipsrsquo ballast discharge line performed
inconsistently and unreliably jeopardizing the extent to which representativeness of the
sample can be proven It is important to sample a constant fraction of the ballast line flow
through using an in-line magnetic flux flow meter on the sample line and a portable ultrasonic
flow meter mounted to the ships ballast piping If one of these monitors is inconsistent there
is no direct means to assure that the sample volume and the flow volumes are proportional
throughout the sampling process Without this information it becomes difficult to translate
106
CANGELOSI SCHWERDT MANGAN MAYS AND PRIHODA
organisms per unit volume in the sample to organisms per unit volume in the ballast
discharge
The ultrasonic flow meter was also difficult to mount properly It is highly recommended that
ship owners and authorities encourage treatment system developers to include flow meters in
their systems that have a proven in-situ performance to within 3 It is also recommended to
have a standardized output connection so that the sample team can make use of that flow
meter to facilitate the constant percent sampling necessary for a representative sample
It was necessary to tune up the PLC Control Loop Because the sampling equipment is
used on a number of different ships each having different arrangements flow rates and
pressures sometimes it is necessary to fine-tune the automation of the sample system to
prevent unstable rates or oscillating rates of the sample flow It is recommended that the PLC
control loop parameters be available (ie the Gain Reset and Rate)
The 32 Gallon heavy duty tub (sample collection barrel) though strong and light was
awkward to bring aboard Attaching backpack straps in the future may remedy this
Delivery of the 19 liter carboys for effluent toxicity testing was improved by placing each
carboy inside a frame backpack for navigation from the sampling location to the dock
Recommendations
Key lessons learned in terms of sample event planning and staffing were
Scheduling of the sampling event is subject to changes in weather ship equipment and
port schedules Even when the ship has docked the schedule is still subject to change
Depending on each ship and each cargo load the ballasting and deballasting operation
varies and may start and stop at various times (ie 6 hours of sampling may actually take 12
hours) Fresh sampling and analysis personnel are essential to quality data It is
recommended that sampling and analysis crew shifts of 24 hours be in place to address
schedule contingencies
Equipment set-up and break-down is easier when shared among several team
members Initially the engineers were more familiar with the equipment set up As more
sampling events took place all personnel became familiar with the set up and break-down
and could therefore provide more support and assistance in those areas
107
CANGELOSI SCHWERDT MANGAN MAYS AND PRIHODA
The ship pumping schedule is subject to variation making ldquobeginning middle and
endrdquo grab samples difficult to plan The ballast pump (or pumps) move water at a rate that
may be faster than the loading of cargo resulting in starting and stopping of the pump (and
therefore sampling) As a result determining three sets of discrete grab samples spaced
approximately near the beginning middle and end proves difficult One hour samples seemed
to work for all parties (ie each sample was one hour of collection) The test plan should
require that a certain volume duration or number of tanks of ballast water discharge be
sampled instead
Have a dedicated handling and sample transport person This additional person allows
maximum support aboard the ship and efficient delivery of the samples This person could
also return the previous samplesrsquo cooler and ice packs to ship personnel eliminating the need
to carry multiple transport equipment aboard the ship
Conclusions
The operational method for sampling ship discharge described in this paper is a feasible and
cost-effective approach which can yield representative samples for a range of experimental
objectives It appears to be applicable to most ships which ply the Great Lakes The costs of
the exercise are dominated by a one-time investment in operational equipment Installation of
sample ports on ships is a relatively minor one-time expense Costs of deployment of the
sampling team and sample analysis are largely dictated by the test plan under consideration
as well as the number of schedule changes associated with the ship visit
Acknowledgements
The GSI team wishes to thank the Legislative Commission on Minnesota Resources the
United States Department of Transportation Maritime Administration and the Great Lakes
Protection Fund for financial support for the work leading to the development of this
Guidebook We are indebted to the technical teams at the Navy Research Laboratory and
Work Groups of the International Maritime Organization Maritime Environment Protection
Committee for initial guidelines for effective sampling from ships Most of all the GSI project
benefited from the participation and assistance of the ship owners and their capable Officers
and Crew Members involved in the GSI effort to develop and test these methods Specifically
we thank the owners operators officers and crew of the Niagara Saguenay MV Tim S
Dool MV Indiana Harbor Edwin H Gott Str Herbert C Jackson MV James R Barker MV
Hon James L Oberstar Federal Hunter and Isolda
108
A BALLAST DISCHARGE MONITORING SYSTEM
REFERENCES
GSI (2011) Great Ships Initiative (GSI) Quality Management Plan Northeast-Midwest Institute
Washington DC
IMO (2004) International Convention for the Control and Management of Ships Ballast Water and
Sediments As adopted by consensus at a Diplomatic Conference at IMO London England February
13 2004
NSF International (September 2010) Generic Protocol for the Verification of Ballast Water Treatment
Technology Version 51 EPA600R-10146 Produced for the USEPA Environmental Technology
Verification Program in Conjunction with US Coast Guard Environmental Standards Division and US
Naval Research Laboratory Center for Corrosion Science and Engineering NSF International Ann
Arbor Michigan
United States Coast Guard (2008) Analysis of Ballast Water Sampling Port Designs Using
Computational Fluid Dynamics United States Coast Guard Research and Development Center
Report No CG-D-01-08 February 2008
GSI Team Members
PRINCIPAL INVESTIGATOR
Allegra Cangelosi NEMWI
RESEARCH TEAM
Euan Reavie PhD NRRI UMD Deanna Regan LSRI UWS Donald Reid Consultant Elaine Ruzycki NRRI UMD Heidi Saillard LSRI UWS Heidi Schaefer LSRI UWS Tyler Schwerdt AMI Engineering Tyler Snetting AMI Engineering Matthew TenEyck LSRI UWS
Lisa Allinger NRRI UMD Mary Balcer PhD LSRI UWS Lana Fanberg LSRI UWS Debra Fobbe LSRI UWS Steve Hagedorn LSRI UWS Travis Mangan NEMWI Nicole Mays NEMWI Christine Polkinghorne LSRI UWS Kelsey Prihoda LSRI UWS
109
BALLAST WATER MANAGEMENT SYSTEMS
Sampling of Ballast Water for Compliance Control
Stephan Gollasch1 Matej David2
Abstract
Ballast water sampling is an important option to assess the compliance with ballast water management
requirements Organism diversity and behaviour are triggering complexity in ballast water sampling As
a result different sampling strategies may be required to obtain a representative sample of ballast
water discharge The authors conducted two sampling studies onboard commercial vessels to study
differences in the application of different sampling methods This paper summarises the
recommendations for how to obtain a representative sample of the whole ballast water discharge as
required by the International Convention on the Management of Ships Ballast Water and Sediments
2004
Key Words maritime transport ballast water management convention sampling for compliance
Introduction
The International Maritime Organization (IMO) the United Nations body to address shipping
noted the problems caused by species movements with ballast water and tasked its Marine
Environment Protection Committee (MEPC) specifically the Ballast Water Working Group
(BWWG) to draft an instrument to take care of this problem As a result of many years of
negotiations at IMO the International Convention on the Management of Shipsrsquo Ballast Water
and Sediments (BWM Convention) was adopted in 2004 (IMO 2004) The BWM Convention
introduces two different protective approaches which will sequentially be implemented after
the BWM Convention enters into force
1) The Ballast Water Exchange Standard (outlined in Regulation D-1 of the BWM
Convention) requiring ships to exchange a minimum of 95 ballast water volume
and
2) The Ballast Water Performance Standard (outlined in Regulation D-2 of the BWM
Convention)
The latter standard limits the number of viable organisms in the ballast water discharged as
shown below
1 GoConsult Grosse Brunnenstr 61 22763 Hamburg Germany sgollaschaolcom 2 University of Ljubljana Faculty of Maritime Studies and Transport Pot pomorščakov 4 SI 6320 Portorož
Slovenia
110
GOLLASCH DAVID
Regulation D-2 Ballast Water Performance Standard
1 Ships conducting Ballast Water Management in accordance with this regulation shall
discharge less than 10 viable organisms per cubic metre greater than or equal to 50
micrometres in minimum dimension and less than 10 viable organisms per millilitre
less than 50 micrometres in minimum dimension and greater than or equal to 10
micrometres in minimum dimension and discharge of the indicator microbes shall not
exceed the specified concentrations described in paragraph 2
2 Indicator microbes as a human health standard shall include
1 Toxicogenic Vibrio cholerae (O1 and O139) with less than 1 colony forming
unit (cfu) per 100 millilitres or less than 1 cfu per 1 gram (wet weight)
zooplankton samples
2 Escherichia coli less than 250 cfu per 100 millilitres
3 Intestinal Enterococci less than 100 cfu per 100 milliliters
Sampling ballast water of vessels to assess compliance with ballast water management
requirements is very specific and includes sampling the biology of ballast water (eg David
and Perkovič 2004 David et al 2007) and the sample collection process should by no
means influence such an assessment It is possible to over or under-sample the real
organism concentrations because of various potential errors (Gollasch et al 2007) As the
sampling process represents additional stress for organisms they may be damaged during
the process and the underestimation may result in false compliance as such sampling
representativeness becomes a key issue (Gollasch amp David 2009 2010)
To overcome this the BWWG of IMO developed a sampling guideline (ie Guidelines for
Ballast Water Sampling (G2) (IMO MEPC 2008)) to provide sampling guidance However
some key aspects were not addressed such as the sampling frequency the minimum water
volume to be sampled and the number of samples to be taken
An IMO correspondence group on ballast water sampling was established to deal with these
issues It is expected that at the next meeting of the Bulk Liquid and Gases Sub-committee in
early 2012 the correspondence group will present their findings
The authors were recently involved in two studies which aimed to recommend how to take
representative samples of ballast water (Gollasch amp David 2009 2010) During both studies
several different options to sample the ballast water of vessels were practically tested
onboard commercial vessels The method comparison included short-time sequential
samples versus samples taken over the entire ballast water pumping time Results from these
111
SAMPLING OF BALLAST WATER
studies suggest possible sampling strategies to obtain a representative sample of the whole
ballast water discharge
BWS Methods for Compliance Monitoring
The results show that different approaches in the sampling process influence the results
regarding organism concentrations The organisms in the discharge are affected in different
ways therefore the selection of the ldquowrongrdquo sampling approach may influence the compliance
control result The organism concentrations in the ballast water discharge may therefore be
underestimated and a ldquofaultyrdquo ballast water treatment system (BWTS) could be recognised
as compliant Conversely organism concentrations may be overestimated and a BWTS
complying with the D-2 Standard may fail in compliance tests
It should be noted that a certain level of pragmatism is required during on-board ballast water
compliance control sampling especially when larger volumes of water need to be sampled
This is especially relevant when sampling for organisms above 50 micron in minimum
dimension and attempts should be made to avoid negatively impairing organism survival
during the sampling process Compliance control sampling teams are unlikely to have large
water collection tanks (gt1000 litres) available during the sampling event and will probably
need to work with nets to concentrate the sample during the sampling procedure
During the two studies the authors have undertaken it was observed that the sampling
duration (ie length of the sampling process) timing (ie which point in time during the
discharge that the sampling is conducted) the number of samples and the sampled water
quantity are the main factors which influence the results regarding organism concentrations
Recommended sampling duration
The results show that mainly zooplankton organisms above 50 microns in minimum
dimension are negatively affected by longer sampling times As these are the main
component of the organisms in the group gt50 micron longer sampling times result in an
underestimation of the viable organism concentration for this group in the discharge
Recommended sampling timing and number of samples
The results show that organism patchiness occurs in ballast tanks so that the organism
concentrations vary considerably during the discharge The highest variability was recognized
in samples at the beginning or at the end of the discharge Therefore it is recommended that
the sampling is conducted randomly anytime in the middle of the discharge with more than
one sequential sample being taken
112
GOLLASCH DAVID
Recommended sample quantity
In this study sequential sampling was conducted every 5 minutes for up to almost 2 hours
To obtain the most representative results it is recommended that
for the organisms greater than 50 microns less than 500 liters may be filtered and
concentrated not to extend the sampling time
for the organisms greater than 10 microns and less than 50 microns a continuous
drip sample totaling approximately 5 liters should be taken
for bacteria a sample of approximately 1 liter should be taken as a continuous drip
sample
Sampling logistics feasibility
Different types sizes and cargo profiles of vessels trigger very different ballast water
discharge profiles and times Ballast water discharge may be conducted ldquoat oncerdquo or ldquoin
sequencerdquo lasting from approximately one hour up to several days depending on the length
of the cargo operation It is important to take this factor into account as it is difficult to
imagine that the PSC officer andor sampling team would stay on-board the vessel for several
days
Conclusions
If different sampling approaches are used by different PSC around the EU it may occur that a
vessel is sampled and determined to be in compliance in one port but not in another This
would be an unacceptable situation
Both studies have shown that different sampling approaches result in different organism
concentrations The sequential trials showed different numbers of organisms in the samples
taken in the beginning middle and end of the pumping event but no consistent trend could
be identified
Considering the above recommendations on representative sampling sampling of at least
two random samples is feasible and relatively easy while sampling over the entire time of the
ballast water discharge would be quite difficult especially if long sampling times are required
over several days or during night
Therefore a harmonised sampling approach seems essential to provide consistent
compliance tests
SAMPLING OF BALLAST WATER
Acknowledgements
The first study was undertaken 2009 and was funded by the Federal Maritime and
Hydrographic Agency Hamburg Germany The second study was conducted in 2010 funded
by the European Maritime Safety Agency (EMSA) Lisbon Portugal We would like to thank
the vessel crews for their outstanding support to enable the sampling events Further our
grateful thanks are expressed to the treatment system vendors Resource Ballast
Technologies ltd (Cape Town South Africa) Mahle Industriefiltration GmbH (Hamburg
Germany) and Aquaworx ATC GmbH (Munich Germany) as well as Wilhelmsen Ships
Equipment (Norway Poland) without their support the sampling voyages would not have
been possible
REFERENCES
David M amp M Perkovič (2004) Ballast water sampling as a critical component of biological invasions
risk management Marine Pollution Bulletin 49 313ndash318
David M Gollasch S Cabrini M Perkovič M Bošnjak D amp D Virgilio (2007) Results from the First
Ballast Water Sampling Study in the Mediterranean Sea - the Port of Koper Study Marine Pollution
Bulletin 54(1) 53-65
David M amp S Gollasch (2008) EU Shipping in the Dawn of Managing the Ballast Water Issue Mar
Pollut Bull vol 56 no 12 1966-1972
Gollasch S amp M David (2009) Results of an on-board ballast water sampling study and initial
considerations how to take representative samples for compliance control with the D-2 Standard of the
Ballast Water Management Convention Submitted by Germany to IMO Sub-committee Bulk Liquid
and Gases as BLG 14INF6 11 pp (Study funded by The German Federal Maritime and Hydrographic
Agency Hamburg (BSH))
Gollasch S David M Voigt M Dragsund E Hewitt C and Y Fukuyo (2007) Critical review of
the IMO International Convention on the Management of Shipsrsquo Ballast Water and Sediments Harmful
algae iss 4 vol 6 585-600
Gollasch S amp M David (2010) Testing Sample Representativeness of a Ballast Water Discharge and
developing methods for Indicative Analysis Report for Tender Ndeg EMSANEG092010 European
Maritime Safety Agency (EMSA) Lisbon Portugal 124 pp
IMO (2004) International Convention for the Control and Management of Shipsrsquo Ballast Water and
Sediments International Maritime Organization 36 pp
IMO MEPC (2008) Guidelines for Ballast Water Sampling (G2) International Maritime Organization
London 14 pp
115
BALLAST WATER MANAGEMENT SYSTEMS
Validation of a Shipboard filer skid
for Sampling Zooplankton from Ballast Water
Matthew First1 Edward J Lemieux2 Cameron S Moser3 Timothy P Wier3 Jonathan F
Grant4 Stephanie H Robbins Wamsley1 Scott C Riley1 Mia K Steinberg5
Lisa A Drake6
Abstract
Proposed US and international performance standards for shipsrsquo ballast water allow for very low
concentrations of live organisms The limit for organisms ge 50 microm in minimum dimension (nominally
zooplankton) is lt10 living organisms m-3 Large volumes of water (ie several m3 to 10s of m3) must be
sampled to estimate zooplankton concentrations with suitable statistical confidence Traditional
sampling devices (eg plankton nets) are not well suited for use aboard ships as nets are unwieldy
and difficult to manage in the available small spaces and the water filtered through plankton nets must
be managed in the limited spaces of the commercial shipboard environment To sample relatively large
volumes from ballast discharges in a manner compatible with the shipboard environment a novel
shipboard filter skid (SFS) consisting of two stainless steel housings each containing a filter bag was
constructed for use with closed fluidic systems such as shipboard piping
Keywords zooplankton sampling shipboard
Objectives
The objective of this study was to validate the efficacy of a prototype SFS for capturing living
zooplankton at a land-based ballast water facility Validation of the SFS included examining
the retention efficiency of zooplankton proxies (microbeads) assessing the potential toxicity
of filter skid materials and comparing zooplankton samples collected with SFS to those
collected with a plankton net at two sample volumes (5 and 10m3) Capture efficiency (CE)
defined here as concentration of zooplankton in the SFS relative to the plankton net was the
metric used to evaluate the SFS The overall goal of this work was to determine if the SFS
could capture zooplankton efficiently without introducing high rates of zooplankton loss or
mortality and thus be used as a substitute for plankton nets
1 SAIC Inc Naval Research Laboratory Key West FL 2 Naval Research Laboratory Code 6130 Washington DC 3 EXCET Inc Naval Research Laboratory Key West FL 4 Battenkill Technologies Manchester Center VT 5 Naval Surface Warfare Center Carderock Division West Bethesda MD 6 Naval Research Laboratory Code 6136 Key West FL
116
FIRST LEMIEUX MOSER WIER GRANT WAMSLEY RILEY STEINBERG DRAKE
Results
Microbead recovery in filter bags was gt89 and 100 for microbeads of 50microm and 150microm
diameters respectively Exposure to the sealant used to seal the filter bagsrsquo seams and the
stainless steel materials of the housings did not lead to mortality in two zooplankton species
Overall CE was higher in the SFS than in the plankton net 108plusmn66 (mean plusmn SD n=6) The
SFS provided higher capture efficiency of zooplankton in trials using 5m3 sample volumes
(CE=147 plusmn 74 n=3) whereas CE was lower in trials using 10m3 sample volumes (69plusmn28
n=3) In trials with low CE ciliates approximately 50 microm in minimum dimension were poorly
retained by the SFS relative to the plankton net Mortality in both the filter skid and the
plankton net was low (lt4)
Conclusions
The data presented here show that at lower sample volumes (ie 5m3) the SFS was a valid
substitute for a plankton net for concentrating living zooplankton from ballast water systems
Future work should be done to validate the SFS aboard a vessel where the flow rates and
system pressure may fluctuate throughout the course of the sampling event Additionally the
SFS should be validated in freshwater environments to verify that high CE of the filter skid is
applicable to freshwater zooplankton communities which may be dominated by soft-bodied
organisms
117
BALLAST WATER MANAGEMENT SYSTEMS
Efforts to Develop a Ballast Water Detecting Device
Goran Bakalar B Sc1
Abstract
Research of ballast water treatment devices does not address the research of repairs for these devices
and the research of the permanent quality of such machinery There is a need for a follow-up system
In this research it analysed what technology is sufficient to support development of the ballast water
bio-invasive organism detection There are static and dynamic detecting efforts and challenges Two
methods were considered as good examples for each of them static and dynamic detection are
possible Methods of detection involving the DNA method are not reliable as dynamic detecting
methods Characteristics of the DNA method are described in this paper Another method with some
existing devices is already in use as another form of detection Spectroscopy and cytometry have been
explained as well Products that use this methodology were listed and the functionality of the system
has been explained The use itself and reasons for it were researched in this paper and the
conclusions are discussed
Key words Ballast water treatment devices on the ships professional service and repairs detection
methods DNA cytometry bio-invasive organisms scientific research using inducting method
Introduction
International law led to Convention of Ballast Water Management (BWM) 2004 The
Convention requires that certified inspectors do their best to avoid not needed stoppage
caused by potentional sampling of all of the ships (p12) In other words attention is usually
given to respect the contracts of transportation rather than protect the seasThe inspector
can give an order to a designated institution or certified laboratory to take samples and to
analyse ballast water that any crew intends to discharge into the sea This inspection in a
laboratory includes analyses to find whether microorganisms exist in ballast water and to
determine salinity and the kind of salt in such a way as to determine is the source of the
ballast water If the analyses find no microorganisms or any other reason that would prevent
ballast water discharge all the expenses would be paid by the Ministry that the inspector
represents Those expenses are very large and could even cause loss of the cargo in next
port of call There is a need for cheaper and faster inspections New technologies could help
lead to such solutions
1 Maritime consultancy Put Radosevca 52 21000 Split Croatia
email GoranBakalarxnethr
118
BAKALAR
Another reason why we need other solutions is weather conditions on the ships and among
the crew members Experience has shown problems with the repairs that occur on the ships
There is a large difference between the correction of damage in the cargo tanks and in the
ballast water tanks on ships A good example is correction of the pittings in cargo tanks after
the cargo of sulfur acid has been discharged and the tanks cleaned The repair of the heating
coils that exist in cargo tanks (one of the ways to hold liquid cargo at a consistent
temperature) would be much more difficult if it were necessary in ballast water tanks Another
example is to derust and correct by welding a constructional problem in ballast or cargo
tanks when needed The basic difference is in the height of the tanks mdash cargo tanks are
three to ten metres high and ballast tanks are a half meter up to 15 metres tall To do any
repair or welding job in that height is extremely difficult The same problem could happen with
any possible repair of a ballast water treatment device or welded holders of that device Any
equipment that exists in the salt water is in constant exposure to elements that cause
damage A ships movement in storms combined with salt exposure results in a very big risk
for damage or improper functionality of any device heating coils or other methods of ballast
water treatment in the ballast water tanks Heating coils become loose over time and the fluid
in the heating system may leak and contaminate ballast water Oil is usually used as the
heating fluid in heating coils It would be impossible to find from the location of the heating coil
fluid leaks if the ballast inspector found the contamination Even if the hole was found there
are measures and the law that requires how and where it is allowed to repair such damage
One of the solutions to control whether a ballast water devicesystem is actually functioning
properly is to give opportunity to new technologies
Detection Methods
The detection of algae and other bio-invasive organisms in ballast water is important It is
necessary to avoid expenses that could be incurred by wrongful inspectors decisions and
there is an obligation to protect the nature The crew and the ship owners take the
responsibility of ballast water treatment onboard the ships The experience of using other
monitoring devices (even not fixed in the salt water) (for example oil discharge monitor) has
resulted in various overworks by crew members The most popular one is to bypass the oil
discharge monitor in the monitoring system onboard the ships It is expected that crew
members all over the world will invent ways to bypass improperly functioning devices and in
the above mentioned case ballast water treatment To evaluate good or improper funtioning
of ballast water treatment systems onboard a ship requires a good method to detect bio-
invasive algae and other microorganisms Good methods are dynamic methods A good
method that could detect unwanted microorganisms needs to be dynamic and able to scan
extremely quickly It is also necessary to format data analyse that data and process large
data files Advantages of silico-imaging or scanning are the high acquisition rate of up to 1000
119
EFFORTS TO DEVELOP A BALLAST WATER DETECTING DEVICE
scans per second through a USB interface the suitability of the data format for standard flow
cytometer data analysis and fast processing of large data files
DNA Detection Method
DNA analysis led to a new way to answer old questions in science The DNA analysis method
is an initiation to cytometry analyses DNA analyses are done in a laboratory and sometimes
it requires days to inspect some objects of detection DNA taxonomy is based on the analysis
of small segments of genomas Group of nucleotides of each alga is a different barcode that
exists in different algae Those barcodes filed in a database are used to identify all algae of
the world The following example shows that the time for DNA detection in that case was
shortened to three hours
A technique used for detecting Raphidophycean a bloom-forming genus of algae was
developed using a specific DNA probe The design of the probe was based on a sequence
polymorphism within the small subunit ribosomal DNA (rDNA) gene of a strain by using
fluorescence polarization analysis and the BIAcore 2000 biosensor which utilized surface
plasmon resonance The specific sequence for Heterosigma carterae was determined by
sequence data analysis One pair of polymerase chain reaction probes was designed for use
in making the identification Heterosigma carterae rDNA was amplified by using a fluoroscein
isothiocyanate-labeled or biotin-labeled oligonucleotide probe the amplified rDNA was
selectively detected as an intensive change via analysis or as a resonance-unit change
Although total time for final detection after sampling was within 3 hours specific rDNA could
be detected within 10 minutes through these detection methods [1]
Cytometry Detection Method
The power of the flow cytometric analysis principle is that the cells are passing a laser beam
one-by-one at high speed and their individual light scattering and fluorescence properties are
recorded to form an optical fingerprint for each cell This separates the flow cytometric
method from bulk methods for fluorescence spectra andor size spectra for bulk volumes of
water where it is much harder to discriminate between the contributions of the various groups
in the water since the readings are collected for all particles at once Flow cytometry allows
easy recognition of the different groups in the sample and quantification of their abundance
as well as their optical properties (size pigment) - even the detection of a few rare cells from
within a high number of cells from a blooming species
History
The first impedance-based flow cytometry device using the Coulter principle was disclosed
in US Patent 2656508 issued in 1953 to Wallace H Coulter The first fluorescence-based
flow cytometry device (ICP 11) was developed in 1968 by Wolfgang Goumlhde from the
120
BAKALAR
Figure 1 Some scans of flow cytometry technology [ 2 ]
University of Muumlnster and first commercialized in 196869 by German developer and
manufacturer Partec through Phywe AG in Goumlttingen At that time absorption methods were
still widely favored by other scientists over fluorescence methods Soon after flow cytometry
instruments were developed including the Cytofluorograph (1971) from BioPhysics Systems
Inc (later Ortho Diagnostics) the PAS 8000 (1973) from Partec the first FACS instrument
from Becton Dickinson (1974) the ICP 22 (1975) from PartecPhywe and the Epics from
Coulter (197778)
The original name of the flow cytometry technology was pulse cytophotometry Only 20
years later in 1988 at the Conference of the American Engineering Foundation in Pensacola
Florida the name was changed to flow cytometry a term that quickly became popular
Principle of flow cytometry
A beam of light (usually laser light) of a single wavelength is directed onto a
hydrodynamically-focused stream of fluid A number of detectors are aimed at the point where
the stream passes through the light beam one in line with the light beam (Forward Scatter or
FSC) several perpendicular to it (Side Scatter or SSC) and one or more fluorescent
detectors Each suspended particle from 02 to 150 micrometers passing through the beam
121
EFFORTS TO DEVELOP A BALLAST WATER DETECTING DEVICE
scatters the ray and fluorescent chemicals found in the particle or attached to the particle
may be excited into emitting light at a longer wavelength than the light source This
combination of scattered and fluorescent light is picked up by the detectors and by analysing
fluctuations in brightness at each detector (one for each fluorescent emission peak) it is then
possible to derive various types of information about the physical and chemical structure of
each individual particle FSC correlates with the cell volume and SSC depends on the inner
complexity of the particle (ie shape of the nucleus the amount and type of cytoplasmic
granules or the membrane roughness) [3]
Flow cytometers
Modern flow cytometers are able to analyze several thousand particles every second in real
time and can actively separate and isolate particles having specified properties A flow
cytometer is similar to a microscope except that instead of producing an image of the cell
flow cytometry offers high-throughput (for a large number of cells) automated quantification
of set parameters To analyze solid tissues a single-cell suspension must first be prepared
A flow cytometer has five main components
a flow cell - liquid stream (sheath fluid) which carries and aligns the cells so that they pass single file through the light beam for sensing
a measuring system - commonly used are measurement of impedance (or conductivity)
and optical systems - lamps (mercury xenon) high-power water-cooled lasers (argon
krypton dye laser) low-power air-cooled lasers diode lasers (blue green red violet)
resulting in light signals
a detector and Analogue-to-Digital Conversion (ADC) system - which generates FSC
and SSC as well as fluorescence signals from light into electrical signals that can be
processed by a computer
an amplification system - linear or logarithmic
a computer for analysis of the signals [3]
The process of collecting data from samples using the flow cytometer is termed acquisition
Acquisition is mediated by a computer physically connected to the flow cytometer and the
software which handles the digital interface with the cytometer The software is capable of
adjusting parameters (ie voltage compensation etc) for the sample being tested and also
assists in displaying initial sample information while acquiring sample data to insure that
parameters are set correctly Early flow cytometers were in general experimental devices
but technological advances have enabled widespread applications for use in a variety of both
clinical and research purposes Due to these developments a considerable market for
122
BAKALAR
instrumentation analysis software as well as the reagents used in acquisition such as
fluorescently-labeled antibodies has developed
Modern instruments usually have multiple lasers and fluorescence detectors The current
record for a commercial instrument is four lasers and 18 fluorescence detectors Increasing
the number of lasers and detectors allows for multiple antibody labeling and can more
precisely identify a target population by their phenotypic markers Certain instruments can
even take digital images of individual cells allowing for the analysis of fluorescent signal
location within or on the surface of a cell
Data analysis
The data generated by flow-cytometers can be plotted in a single dimension (to produce a
histogram) in two-dimensional dot plots or even in three dimensions The regions on these
plots can be sequentially separated based on fluorescence intensity by creating a series of
subset extractions termed gates Specific gating protocols exist for diagnostic and clinical
purposes especially in relation to hematology The plots are often made on logarithmic
scales Because different fluorescent dyes emission spectra overlap signals at the detectors
have to be compensated electronically as well as computationally Data accumulated using
the flow cytometer can be analyzed using software Once the data are collected there is no
need to stay connected to the flow cytometer For this reason analysis is most often done on
a separate computer This is especially necessary in core facilities where usage of these
machines is in high demand
Fluorescence-activated cell sorting
Fluorescence-activated cell sorting (FACS) is a specialized type of flow cytometry It provides
a method for sorting a heterogeneous mixture of biological cells into two or more containers
one cell at a time based upon the specific light scattering and fluorescent characteristics of
each cell It is a useful scientific instrument as it provides fast objective and quantitative
recording of fluorescent signals from individual cells as well as physical separation of cells of
particular interest
The cell suspension is entrained in the center of a narrow rapidly flowing stream of liquid
The flow is arranged so that there is a large separation between cells relative to their
diameter A vibrating mechanism causes the stream of cells to break into individual droplets
The system is adjusted so that there is a low probability of more than one cell per droplet
Just before the stream breaks into droplets the flow passes through a fluorescence
measuring station where the fluorescent character of interest of each cell is measured An
electrical charging ring is placed just at the point where the stream breaks into droplets A
123
EFFORTS TO DEVELOP A BALLAST WATER DETECTING DEVICE
charge is placed on the ring based on the immediately prior fluorescence intensity
measurement and the opposite charge is trapped on the droplet as it breaks from the stream
The charged droplets then fall through an electrostatic deflection system that diverts droplets
into containers based upon their charge In some systems the charge is applied directly to
the stream and the droplet breaking off retains charge of the same sign as the stream The
stream is then returned to neutral after the droplet breaks off [ 4 ]
Applications
The technology has applications in a number of fields including molecular biology pathology
immunology plant biology and marine biology It has broad application in medicine
(especially in transplantation hematology tumor immunology and chemotherapy genetics
and sperm sorting for sex preselection) In marine biology the auto-fluorescent properties of
photosynthetic plankton can be exploited by flow cytometry in order to characterise
abundance and community structure In protein engineering flow cytometry is used in
conjunction with yeast display and bacterial display to identify cell surface-displayed protein
variants with desired properties It is also used to determine ploidy of grass carp fry [5]
Particle scanning
Traditional flow cytometers analyze thousands of cells per second acquiring basic total
fluorescence and light scattering per cell This is proportional to particle size and pigment
content
In the cytosense instruments the signals from all the detectors are not only digitized
continuously they are also stored for each particle Since the particles flow through the laser
focus in a stretched-out manner these digital profiles are actually length scans of the particle
representing the distribution of its body parts along its length axis with regard to the their light
scattering and fluorescing properties This fluid driven laser scanning of individual particles is
called silico-imaging and uses the normal flow cytometer setup combined with special data
grabber boards The optional curvature sensor adds a two-dimensional component to the
silico-images using a laser beam polarization setup only available on flow cytometers
Advantages of silico-imaging or scanning is the high acquisition rate of up to 1000 scans per
second through a USB interface and the suitability of the data format for standard flow
cytometer data analysis and fast processing of large data files Libraries of these fingerprints
allow the automatic classification and enumeration of groups and species from many data
sets as well as online warning for target (algae) species
124
BAKALAR
Cytobuoy
CytoBuoy instruments use silico-imaging as the basic data format data-extensive but highly
informative optical fingerprints obtained by fluid-driven laser scanning of individual particles
Libraries of these fingerprints allow the automatic classification and enumeration of groups
and species from large data sets as well as online warning for targeted harmful algae
species
Figure 2 Principle of screening and filing data of harmful algae [ 5 ]
To be able to take the instrument and put it inunder water the flow cytometer was completely
redesigned to be significantly smaller and modular The basic instrument which is a scanning
flow cytometer which can hold two lasers and up to ten optical detectors in a 30x45cm
cylinder of only 15KGs The instrument is fully computer programmable with the possibility to
read the data files over the internet if needed The same instrument can be placed in a
moored buoy or a high pressure submersible housing which makes it possible to do field
measurements on actual live samples (without filtering - fixatives - transportation - waiting)
anywhere and at anytime
Applications of the cytobuoy are screening of phytoplankton cultures natural samples
detection of rare species population dynamics research general phytoplankton monitoring
assessment of biodiversity bio-indicators harmful algal blooms grazing (micro)zooplankton
protection of aquaculture bathing water resource water lake restoration alarm for
herbicides invasive species control and bio-effect monitoring marine optics and lake or sea
truth for remote sensing
Conclusions
An instrument is required that combines a high level of information content and a high level of
frequency in sampling times andor space (coverage) Dynamic ecosystems require sampling
at critical scales the temporal andor spatial scales at which data must be collected in order
125
EFFORTS TO DEVELOP A BALLAST WATER DETECTING DEVICE
to resolve patterns and processes (including early warning) In practice this means the flow
cytometer could be fixed on ships underwater and on moorings and should allow a high level
of autonomous operation combined with high speed and high throughput
Figure 3 Buoy equipped for flow cytometry detection [ 5 ]
Ballast water inspectors can inspect ballast water but it is not necessary That is in
accordance with Ballast Water Convention Inspectorate has to pay stoppage expenses if the
analyses were negative A fast analysis method combined with increased fines would
diminish any possibility of non-compliant work
The fast and quantitative diagnostic capabilities of the flow cytometers may be of great help
for the fast screening of ballast water by generating countings and accurate size spectra for
sediment particles phytoplankton and other groups of particles This can be used to monitor
the efficiency of selected treatment schemes for organisms or even serve as a feedback
mechanism to actively control treatment performance [6]
126
BAKALAR
REFERENCES
1 httpwwwspringerlinkcomcontent5wr78nck7m01vheu
2 httpenwikipediaorgwikiFilePicoplancton_cytometriejpg
3 httpenwikipediaorgwikiFlow_cytometry
4 wwwcytobuoycom
5 httpwwwcytobuoycomapplicationsaquaticsciencephp
6 httpwwwcytobuoycomproductscytobuoy_flow_cytometerphp
127
BALLAST WATER MANAGEMENT SYSTEMS
A Portable Sensitive Plankton Viability Assay
for IMO Shipboard Ballast Water Compliance Testing
Nick Welschmeyer1 Brian Maurer
Abstract
One of the most difficult aspects of implementing ballast water regulatory compliance is field
verification testing of ballast treatment systems to validate proper biological inactivation efficacy
Whether tests are to be carried out by regulatory personnel as an enforcement tool or by ship crew
members as a process verification tool a rapid simple accurate test that can be performed onboard
ship with a minimum amount of effort is needed
A rapid method for estimating living planktonic biomass based on the quantitative enzymatic
transformation of fluorescein diacetate (FDA) into its fluorescent product fluorescein has been
developed for use in ballast water compliance testing FDA has been utilized as a cell-specific tag for
cellular viability for almost five decades (Rotman and Papermaster 1966) and is now a recommended
procedure in US EPAETV ballast water testing protocol However the technique has been criticized
often for the apparent cellular efflux of fluorescein which results in rapid optical fading of fluorescently
labeled lsquolivingrsquo cells We completed a flow cytometric analysis of the time-based cell-specific
fluorescent labeling properties of FDA in phytoplankton clearly identifying the rapid influxefflux kinetics
of its fluorescent product Simultaneous temporal measurements of the extracellular medium revealed
a linear quantitative increase in bulk fluid fluorescence that can be used as a sensitive analytical
estimate of lsquolivingrsquo biomass That is the production rate of extracellular fluorescein is quantitatively
proportional to total living biomass in contrast killed cells produce no fluorescent product Assay
conditions including quantitative temperature effects specific incubation buffers (that prevent abiotic
conversion of FDA to fluorescein) and reaction termination techniques were developed Tests can be
completed in less than one hour with portable equipment (hand-held battery-operated fluorometer)
and modest technical training if desired samples can be terminated and stored for analysis at a later
time
The assay reagents were developed specifically to minimize lsquofalse positivesrsquo and to allow accurate
assay of ballast water ranging in salinity from 0-35 PSU The resultingmbulk fluorescence assay
provides estimates of living biomass with sensitivity comparable to ATP analyses without many of the
drawbacks associated with ATP testing The sensitivity is such that the regulated ballast water
organism size class 10-50 microm (100 mL sample) can be tested for lsquogross exceedancersquo compliance
1 Moss Landing Marine Laboratories Moss Landing California 95039 USA and Golden Bear Facility (GBF)
California Maritime Academy Vallejo California 94590 USA
email welschmeyermlmlcalstateedu
128
WELSCHMEYER AND MAURER
criteria in less than 15 minutes When executed with larger volumes (1 L) at elevated temperatures
(30 C) and longer incubations (2h) the method can detect living biomass at levels lower than current
IMO regulatory tolerance levels for example less than 10 live cellsmL (10 microm equivalent spherical
diameter) The FDA bulk viability assay was executed successfully onboard the training ship Golden
Bear (California Maritime Academy) in real-time ballast tests in Busan S Korea Kobe Japan Guam
USA and San Francisco Bay USA
This method has the potential to solve the problems currently associated with compliance and process
control testing carried out onboard ship The speed sensitivity simplicity and economics of the new
method will make it a useful tool for those interested in verifying the function of ballast water treatment
systems
1 Introduction
The discharge of shipsrsquo ballast water is considered the primary vector in the spread of aquatic
invasive species The maritime industry and international federal and state agencies have
made significant efforts to foster the development of commercial ballast treatment systems
that will remove or inactivate planktonic organisms from ballast water for the purpose of
abating the aquatic invasive species problem Unfortunately existing regulations such as
IMO D-2 require exhaustive analytical procedures to verify biological inactivation efficiency of
treatment systems relative to regulatory performance standards The labor time and
workforce required to fully substantiate successful adherence to ballast performance
standards precludes such exhaustive tests for routine ship inspections
At this time there is a need for a simple rapid analysis of plankton viability for the purpose of
ballast treatment verification through Port State Control either at the dock or onboard ship
Moreover such a method should be available to shipsrsquo crews so that non-technical personnel
can easily verify ballast treatment performance during routine shipboard ballasting operations
A rapid portable viability assay is described here that provides single-step analytical
determination of ballast compliance in less than one hour The method breaks from the
conventional tedious determination of numeric live counts (microscopycytometry) and utilizes
a bulk quantitative fluorescence determination of total viable biomass based on the universal
enzymatic conversion of fluorescein diacetate (FDA) to its fluorescent product fluorescein
2 Fluorescein Diacetate as Bulk Indicator of Viable Biomass
FDA has a long history of use as a visual marker for cell-specific determination of viability
(Rotman and Papermaster 1966) FDA is a non-fluorescent compound which when
hydrolyzed by biological enzyme activity yields fluorescein a highly fluorescent compound
that clearly marks lsquoliversquo cells with optically-induced green fluorescent emission (Figure 1)
129
A PORTABLE SENSITIVE PLANKTON VIABILITY ASSAY
Figure 1 Simplified summary of the use of fluorescein diacetate (FDA) as a tag
for viable organism metabolism esterase activity is present in all living
organisms and is rapidly lost upon cell death
FDA cell-specific viability analysis is commonly quantified by numeric counts made either by
epifluorescence microscopy or flow cytometry (Dorsey et al 1989 Brussaard et al 2001
Garvey et al 2007) It should be understood however that the FDA technique is not a
staining procedure per se (eg the reaction product fluorescein) is not chemically bound to
specific targets within the cell FDA and fluorescein readily pass diffusively through cell
membranes making the loading of FDA into the interior of cell tissue a simple task in aqueous
cellular suspensions Unfortunately the subsequent efflux of fluorescein out of the cellrsquos
interior results in rapid fading of the optical cellular signature FDA cell-specific viability
assays have been criticized often for this apparent inconvenience which requires immediate
numerical analysis and offers no opportunity for storage of samples for later analysis (Garvey
et al 2007) As a result chemical variants of FDA utilizing larger molecular moieties of
fluorescein such as chloro-methoxy fluorescein diacetate (CMFDA) and Calcein AM
(Invitrogen Inc) have been developed these larger molecules extend the period of optical
recognition
In contrast to the classic internal cell-specific application of FDA in viability assays described
above a few reports have described the use of FDA as a bulk indicator of viable cell biomass
in this case based on simple fluorometric analysis of the extracellular bulk fluid in which the
cellular material is suspended This procedure has been described for use with soil samples
130
WELSCHMEYER AND MAURER
leaf litter and industrial cell slurries (Breeuwer et al 1995) Generally the bulk approaches
have enjoyed limited application due to a) well known non-biological conversion of FDA into
fluorescein in the extracellular media (Clarke et al 2001) and 2) uncertainties in the relation
between fluorescein production and viable biomass concentrations per se (Breeuwer et al
1995)
In the present work we re-examine the extra-cellular bulk analysis of FDA-derived fluorescein
for the purpose of quantitatively and rapidly determining viable biomass of ballast water
organisms We have converted the FDA methodology into a bulk assay that yields simple
cuvet-based fluorometric readings this is ideal for ballast water testing Reagent mixtures
were developed to accommodate the wide range of salinities that can characterize ballast
water organisms (eg 0-35 PSU) Reagents were developed to prevent non-biological
conversion of FDA to fluorescein thus reducing the possibility of a lsquofalse-positiversquo indication of
viable cells The protocol was optimized to yield the highest sensitivity in the shortest period
of time Our plan was to devise a relatively fool-proof method that can be executed reliably in
the field with minimum technical training yet still provide the sensitivity to detect undesirable
living planktonic biomass in ballast water at low levels commensurate with ballast water
performance standards
3 Methodology
Biological samples Both cultured phytoplankton and natural plankton assemblages were
used to generate FDA viability response and to determine the cellular densities required to
elicit adequate analytical sensitivity Phytoplankton cultures were obtained from collections
that have been maintained by Drs GJ Smith and N Welschmeyer for years at Moss
Landing Marine Laboratories The cultures were grown in F2 enriched seawater (marine
organisms) or enriched freshwater media (Algo-Gro Carolina Biological Inc) in temperature
controlled incubators with 12h12h darklight cycles under fluorescent irradiance (18degC)
Cultures were also maintained on a north-facing windowsill at room temperature subject to
seasonal changes in day length Natural plankton were sampled from Moss Landing Harbor
a shallow turbid marine harbor environment and also from open water in Monterey Bay CA
accessed through cruises aboard the research vessel POINT SUR
Instrumentation A high sensitivity Spex Fluoromax 2 spectrofluorometer was used determine
excitationemission spectral characteristics of FDA derived fluorescein The same instrument
was used in non-scanning mode at optimized excitationemission wavelengths to provide the
most sensitive fluorescence response when biological samples were diluted to their weakest
concentrations (eg less than IMO D-2 performance concentrations for organisms 10-50 μm
in size) At our request a Turner Designs hand-held battery-operated fluorometer
131
A PORTABLE SENSITIVE PLANKTON VIABILITY ASSAY
(Aquafluortrade) was modified by the manufacturer to yield optimized response sensitivity to
aqueous solutions of fluorescein This includes a change in LED excitation source exem
filters and circuit board power characteristics this resulted in a portable fluorescein
fluorometer that was roughly fifteen-fold more sensitive to fluorescein than the standard off-
the-shelf configuration
Cellular densities of cultured phytoplankton were measured by flow cytometry on either a
Becton Dickinson FACScan cytometer or an Accuri C-6 cytometer each calibrated for flow
rates using BD Accumax calibration beads Organism size characteristics were determined
microscopically on a Zeiss Standard epifluorescence microscope
Reagents All reagents used in this study were obtained from readily available chemical
sources however specific mixtures treatments and concentrations remain proprietary
Briefly an aqueous incubation buffer with organic modifiers was developed that 1) promotes
FDA enzymatic hydrolysis by all single-celled organisms regardless of the original salinity of
their natural waters (0-35 PSU) and 2) prevents undesired non-biological degradation of
FDA to fluorescein in the absence of viable biota a problem which yields high blanks and
false detection of viable cells FDA in DMSO was administered in 10 μL quantities to yield
final FDA concentrations in incubation buffers of 10 μM Generally organisms were harvested
onto appropriate filters the filters were incubated in the appropriate buffer and fluorescence
was determined in the incubation fluid after removal of the filter and gentle mixing
4 Results
Intracellular and Extracellular Fluorescence Derived From FDA
Time-based studies were initiated to define the time scales and fate of fluorescence derived
from FDA-labeling of live phytoplankton cells Flow cytometry was used to quantify the
intensity of intracellular fluorescence that accumulates (and fades) after FDA inoculation At
least 2000 cells were analyzed at each time-point to capture individual cellular levels of
green fluorescence over the course of approximately one hour The population mean
fluorescence was computed for each time-point yielding the temporal changes in average
fluorescencecell (Figure 2) Parallel measurements of the same sample were made
simultaneously over the same time period in a conventional cuvet-based fluorometer (Spex
Fluoromax 2) so that total fluorescence of the suspension could be monitored At the end of
the observation period the cells were removed by centrifugation and the extracellular fluid
was measured for fluorescence
The results in Figure 2 give an example of the FDA labeling characteristics generally found
for all samples analyzed The intracellular fluorescence rose quickly after FDA inoculation
132
WELSCHMEYER AND MAURER
and for the diatom Thalassiosira sp peaked at approximately 5 minutes (Figure 2) There
was a slow but continuous drop in fluorescencecell that eventually approached the initial
time-zero level of fluorescence All species tested showed the same trend with maximum
fluorescence found somewhere between 4-20 minutes Interestingly even though the cellular
fluorescence was adequately bright for cytometric detection the total fluorescence of the
algal suspension was dominated entirely by extracellular fluorescence That is removal of the
cells by centrifugation resulted in less than 1 reduction in the measured fluorescence of the
fluid in the cuvet
As seen in Figure 2 the resultant extracellular fluid fluorescence rose linearly over the time
course of the experiment The results suggested that a predictable analytical production rate
of fluorescein was evident in each experiment (eg the live cells exhibit a constant rate of
fluorescein production) and at the FDA final concentrations used here (10 μM) the
extracellular fluid fluorescence could be predicted over the course of at least one hour in this
experiment and over two hours in corroborative experiments
Figure 2 Time series of FDA derived fluorescence measured intracellularly (w
flow cytometry) and extracellularly (w conventional cuvet fluorometry) with living
suspensions of the diatom Thalassiosira sp Note that the fluorescence
response of both instruments are not directly comparable (relative units)
133
A PORTABLE SENSITIVE PLANKTON VIABILITY ASSAY
FDA-derived fluorescence as a function of lsquoliversquo biomass
Experiments were conducted to test the fluorescence response of cell suspensions to relative
biomass loading under conditions of constant incubation conditions (eg identical
temperature FDA concentration and incubation time) The biomass levels were controlled by
quantitative volumetric filtration of sample suspensions (cultures or natural seawater) onto
filters of appropriate pore size As shown in Figure 3 under equivalent FDA substrate
concentrations the production of fluorescein was proportional to loaded biomass Figure 3
shows experimental results for laboratory algal cultures and natural samples from Moss
Landing Harbor CA which were size-fractionated into the lt10 μm and 10-50 μm size classes
A linear relationship between fluorescein production and viable biomass was clearly evident
the FDA response of natural plankton communities could be assessed with filtration of as little
as 100 mL The biomass-dependent yield of FDA-derived fluorescence has been observed
for all experiments to date and constitutes the fundamental quantitative premise of the
analytical method described here
Figure 3 FDA-derived fluorescence as a function biomass Relative biomass loading was
controlled by quantitative volumetric filtration on appropriate pore size filters lt10um
fractions captured on GFF filters nylon 10 and 50um filters were cut from sheets of
Nitex screen
134
WELSCHMEYER AND MAURER
Figure 3 cont
FDA response in live and dead organisms
Side-by-side samples of live and dead organisms killed by a variety of methods commonly
utilized in ballast water treatment technology but reduced to bench-scale operation were
analyzed using the bulk FDA incubation technique In each case the original sample of algal
culture was split into two aliquots the untreated sample was measured for lsquoliversquo FDA
response the remaining treated sample was subjected to the kill-process and analyzed within
one hour of the treatment (ie a nominal 24 hour hold time as in ballast treatment protocol
was not utilized) The results in Fig 4 show that all kill factors produced significant
depressions in FDA response relative to the corresponding live aliquot at times by as much
as 2 orders of magnitude (Fig 4)
Figure 4 FDA bulk viability response in live phytoplankton relative to lsquokilledrsquo treatment
samples Method of kill is listed for each sample pair untreated (lsquoliversquo) sample responses
were normalized to 10 for comparison The Ratio of live fluorescence to dead
fluorescence is noted for each logical pair of samples
135
A PORTABLE SENSITIVE PLANKTON VIABILITY ASSAY
Temperature effects on FDA response
The enzymatic hydrolysis of FDA to fluorescein is expected to be temperature dependent due
to the catalytic enzyme activity of the living biological systems that are being tested The
temperature effect was quantified using three temperature controlled water baths set at 10
20 and 30degC The incubators were used to incubate replicate aliquots of the prasinophyte
Tetraselmis sp aliquots were identical in volume and derived from the same culture
originally grown at 20degC Figure 5 shows the resulting linear Arrhenius plot with a calculated
Q10 of 205 (eg a 10degC increase in temperature yields a two-fold increase in fluorescence
signal all other factors held constant)
Figure 5 Standard Arrhenius plot (inverse temperature (Kelvin) vs natural
logarithm of reaction response) showing expected temperature-dependent
linearity with a Q10 of 205
Simplified rapid execution of the bulk FDA viability assay
Our overall objective was to develop a rapid portable and sensitive viability assay for
quantitative ballast water testing Given the results summarized above we combined a series
of steps summarized in Figures 6 and 7 to yield an example protocol that stresses
experimental simplicity for use onboard ship For instance Figure 6 shows the convenient
preparation of samples when only the 10-50 μm size class is tested In this case small
sample volumes (lt500 mL) can be pre-screened through 50 μm mesh and gravity-filtered
136
WELSCHMEYER AND MAURER
Figure 6 Example operation of FDA bulk viability assay for 10-50 μM organisms
(see text)
onto a 10 μm final filter (eliminating the need for vacuum filtration) The nylon 10 μm filter
yields minimum seawater retention (a cause of high blanks) and produces a final cuvet
solution with no filter pulp (eg optical clarity) filtrationcentrifugation is not required for clean
fluorescence readings Figure 7 shows the use of hypochlorite as a logical lsquokilled blankrsquo We
found that a 15 minute exposure of sample water to 60ppm hypochlorite produces a killed
sample that captures all the appropriate features of an analytical blank that is the killed blank
cuvet contains the organisms sample filter incubation reagent and FDA thus mimicking the
sample cuvet exactly Figure 7 shows that with a high-sensitivity fluorometer a 100 mL
sample after 15 minutes of incubation produces a signalblank reading of approximately 30
Thus as an example of a possible rapid test strategy a treated ballast water sample might be
judged to be in lsquogross exceedancersquo of regulations on the basis of its signal relative to a killed
blank
From rapid compliance assay to full-scale treatment testing
The results presented above have focused on rapid simple compliance testing It should be
clear however that with appropriate choices in filters sample volumes and FDA incubation
conditions the rapid method can be expanded into a full scale test Figure 8 shows results
recently acquired on TS Golden Bear (Golden Bear Facility Calif (GBF)) while completing
137
A PORTABLE SENSITIVE PLANKTON VIABILITY ASSAY full-scale shipboard testing of the Balpure electrochlorinationfiltration treatment system (now
Type Approved) in Kobe Japan
Figure 7 Rapid FDA bulk viability assay comparing lsquoliversquo harbor water to
complementary blank samples killed with reagent grade hypochlorite Signal to noise
is evaluated as signalblank based on observed fluorescence (see text) A
successfully-treated ballast water sample of equivalent volume would expected to
produce a signal at or near the killed blank level the resultant SN could be used as
an indicator of gross exceedance relative to ballast performance standards
Figure 8 The rapid FDA bulk viability assay applied to all regulated organism size
classes during full-scale shipboard ballast treatment testing in Kobe Japan aboard
TS Golden Bear (see text)
138
WELSCHMEYER AND MAURER
Samples were collected in integrated continuous fashion during all three ballasting cycles
(uptake control and treatment) each cycle yielded triplicate integrated samples collected
over a two hour period Samples were size fractionated appropriately again in triplicate
processed with FDA and incubated for two hours at room temperature The fluorescence
responses were normalized to the volume filtered and plotted as a function of regulatory size
fractions (lt10 10-50 and gt50 μm) for each of the ballast cycles (Figure 8) Note not
surprisingly that the largest viable biomass levels are contained in the microbial size fraction
lt10 μm Most importantly the FDA bulk viability assay demonstrated that all regulated size
classes showed remarkable inactivationremoval by the ballast water treatment system
(treatment data are plotted in the figure though the responses were so low that they are
hidden within the x-axis) This finding was corroborated by all the labor-intensive numeric
counting procedures required for successful full-scale IMO testing made at the same time
Thus the entire suite of regulated organisms was tested using a single methodology the bulk
FDA assay the full exercise (filtration incubation and instrument measurement) could be
completed in three hours
5 Discussion
A rapid bulk viability assay based on FDA is introduced here The method utilizes concepts
outlined in the original cell-specific application of FDA as a viability tag but here the lsquoleakyrsquo
nature of FDA is exploited to yield a simple cuvet-based fluorescence assay that produces a
signal that is directly proportional to living biomass Thus tedious numerical counting is
eliminated Side-by-side comparisons (data not shown) showed the FDA response to be
comparable in sensitivity to ATP analyses (boiling Tris extraction Karl 1993) the FDA
method however is significantly simpler The magnitude of the FDA fluorescent signal can
be controlled by 1) volume filtered 2) incubation temperature and 3) incubation time The
nature of the sample can also be controlled by choice of filter pore size For the purpose of
speed and simplicity we focused on the 10-50 μm size class Organisms in this size class
can be measured with adequate sensitivity using conveniently small volumes (lt500 mL)
furthermore because the pore size of the capture filter (10 μm) is relatively coarse sample
processing procedures are streamlined analysis time is reduced optical interference is
minimized and instrumentation is minimal The resulting portable method can easily be
executed onboard ship with relatively little technical training and no formal laboratory
provisions
The purpose of this paper was to introduce the bulk FDA viability assay as a promising
indirect measurement for ballast water compliance testing A discussion of the quantitative
analytical aspect of the bulk FDA measurement per se and its exact relation to specific
ballast regulations is beyond the scope of this paper Briefly however it is clear that this new
rapid method based on viable biomass response will need correlations to regulatory
139
A PORTABLE SENSITIVE PLANKTON VIABILITY ASSAY
numerical limits (eg IMO D-2 USCG P-1) That work is underway now with empirical
confirmation of fluorescein mass production rates (traceable to NIST standards) and their
expected relations to lab-reared organisms of known cell size (Coulter-measured equivalent
spherical diameter) A relation of fluorescein produced per biovolume living organism under
standard incubation conditions will allow us to estimate the equivalent numeric density of
living cells of any size given a simple measurement of FDA-derived fluorescein production
This will set the appropriate scales and error limits for rational ballast water compliance
testing relative to extant ballast water performance standards The convenience and
sensitivity of the FDA bulk viability measurement may raise the question of whether current
numeric standards are logistically the most appropriate regulatory metric for ballast water
management
REFERENCES
Rotman B and B W Papermaster (1966) Membrane properties of living mammalian cells as studied
by enzymatic hydrolysis of fluorogenic esters Proc Nat Acad Sci 55 134-141
Breeuwer P J L Drocourt N Bunschoten M H Zwietering F M Rombouts and T Abee (1995)
Characterization of uptake and hydrolysis of fluorescein diacetate and carboxyfluorescein diacetate by
intracellular esterases in Saccharomyces cerevisiae which result in accumulation of fluorescent
product Appl Environ Microbiol 61 1614-1619
Brussaard CPD D Marie R Thyrhaug and G Bratbak (2001) Flow cytometric analysis of
phytoplankton viability following viral infection Aquatic Microbial Ecology 26157-166
Clarke JM MR Gillings N Altavilla and AJ Beattie (2001) Potential problems with fluorescein
diacetate assays of cell viability when testing natural products for antimicrobial activity J
Microbiological Methods 46261-267 15
Dobroski N C Scianni D Gehringer and M Falkner (2009) Assessment of the efficacy availability
and environmental impacts of ballast water treatment systems for use in California waters Prepared for
the California State Legislature California State Lands Commission 173p
Dorsey J C M Yentsch S Mayo and C McKenna (1989) Rapid analytical technique for the
assessment of cell metabolic activity in marine microalgae Cytometry 10 622-628
Garvey M B Moriceau and U Passow (2007) Applicability of the FDA assay to determine the
viability of marine phytoplankton under different environmental conditions Mar Ecol Prog Ser 352
17-26
Karl D M (1993) Total microbial biomass estimation derived from the measurement of particulate
adenosine-5-triphosphate In P F Kemp B F Sherr E B Sherr and J J Cole (Eds) Current
methods in aquatic microbial ecology pp 359-368 Lewis Publishers Boca Raton Florida
141
BALLAST WATER MANAGEMENT SYSTEMS
(Finalized) Methodology for Risk Assessment of
Active Substances under Procedure (G9)
Jan Linders1
Abstract
After some years of experience and the more recent knowledge on the submission of Ballast Water
Management Systems (BWMS) the GESAMP-Ballast Water Working Group (GESAMP-BWWG) has
further developed its methodology to evaluate the BWMS to avoid unreasonable risks for the
environment human health and for the shipsrsquo safety The latest proposals on the methodology have
been established in so-called stock-taking workshops These proposals will be sent to the joint Group
of Experts on the Scientific Aspects of Marine Protection (GESAMP) and to the Marine Environmental
Protection Committee for adoption at their next meetings After its adoption the methodology will be
used in the evaluation process of BWMS in the future The methodology is considered to be a living
document that will be updated if necessary and will be based on developments of the submission of
BWMS within the framework of the Ballast Water Management Convention Models have been
developed for the estimation of the Predicted Environmental Concentrations (PEC) in the marine
environment The model is called MAMPEC-BW 30 and is especially developed for ballast water
although originally crafted for antifouling products The new model will be used for the estimation of
potential effects on humans and the environment This paper deals with the final proposals in the
development of the methodology and will focus on risk assessment The purpose is the protection of
the worldrsquos oceans and coastal areas from bio-invasion ensuring at the same time that ballast water
management practices used to comply with the Convention do not cause greater harm that they
prevent
1 Introduction
In 2004 the Ballast Water Management Convention (BWMC) was adopted which would
oblige ships to treat their ballast water preventing the discharge of ballast water containing
harmful organisms that could cause bio-invasion in the area of discharge Treatment of
ballast water can be carried out using certain chemicals Therefore a guideline (G9) became
part of the BWMC regulating that the discharge of treated ballast water using chemicals
should occur without any harmful effects to the ship its crew humans and the environment
1 Chairman of GESAMP-BWWG P Pieckweg 8 NL-3828 PR Hoogland The Netherlands
Tel +31334554567 e-mail Janfamilielindersnl
142
LINDERS
To provide advice on the effects of ballast water management systems (BWMS) using active
substances with respect to these subjects at risk a technical group (the GESAMP-BWWG)
was established After about five years of experience this working group has further
developed its methodology on the conduct of work to prepare advice to the Marine
Environmental Protection Committee (MEPC) taking into account the knowledge gained
evaluating approximately 60 BWMS The proposed methodology addressed in this document
focuses on the exposure of aquatic organisms
2 Evaluation of BWMs
The GESAMP-BWWG evaluates the BWMS with respect to several topics 1) the risk of
discharge of ballast water to the receiving environment (aquatic organisms) 2) the risk to the
people that work with ballast water management systems because of their profession (crew
and port state control) 3) the risk to the public at large that may recreate in waters or eat
contaminated seafood harvested where ships discharge ballast water and 4) risks to the ship
itself (eg corrosion)
The process of risk assessment for chemicals is well developed As many countries have to
make decisions about the registration of chemicals intended for the control of harmful pests
and diseases (eg pesticides and biocides) and also as they must make decisions about
putting industrial chemicals on the market the risk assessment management tool is used
The basic principles of this process are also adopted by the GESAMP-BWWG to evaluate the
risks of discharge ballast water The applicant provides a dossier to the regulating authorities
in this case to IMO and MEPC containing information on the substance and its use
including data on the identity (physic-chemical properties) the fate and behavior (sorption
and degradation) and potential toxic effects (human toxicology and ecotoxicology) First the
data are evaluated with respect to quality and whether the data are generated using generally
accepted methods (eg OECD-guidelines) Only scientifically justified data are accepted for
further use in the risk assessment Some data are used for the estimation of potential
concentrations in the environment mdash the environmental exposure assessment The final
result of this evaluation is the predicted environmental concentrations (PEC) Often use is
made of mathematical models to describe the behavior of the substance in the environment
based on typical information such as the octanol water partition coefficient the sorption
capacity to soil or sediment and the abiotic or biotic degradation potential of the substance
(eg half-life in water or soil) In the hazard assessment the effect data are used for the
estimation of safe levels of the substance in the environment or for humans The (eco)toxicity
data include acute and chronic endpoints Using safety factors to account for required safety
and uncertainty in the data a safe level is estimated resulting in a predicted no-effect
concentration (PNEC) for the environment or a derived no-effect level (DNEL) for human
143
(FINALIZED) METHODOLOGY FOR RISK ASSESSMENT OF ACTIVE SUBSTANCES
exposure Finally the results of the exposure assessment and the hazard assessment are
compared to each other using a risk characterization ratio (RCR) The value of the CRC
defines whether or not a potential risk may be expected for the topic under consideration In
the case that risk cannot be excluded a further in-depth assessment may be needed
3 Risk Assessment Tools for BWMs
In order to perform the approach outlined in Section 2 the GESAMP-BWWG has developed a
methodology on the conduct of work The proposed methodology has been forwarded to
MEPC for comments suggestions and adoption The focus of the new methodology has been
on 1) the development of a database for the most commonly occurring disinfection
byproducts (DBP) generated during the BWMS operation 2) the model development and
scenario description to calculate the PEC in a standardized harbor environment and 3) the
definition and analysis of the unit operations for crew and port state control in the handling of
BWMS
31 Database
Especially if electrolysis of seawater is the main disinfection process which is the case in the
majority of the BWMS currently evaluated a huge number of DBP may be formed of which
trihalomethanes (THM) and haloacetic acids (HAA) are the most important A list of 18 DBP
have been prepared that contain those occurring most frequently and in the highest
concentrations The physico-chemical properties and the fate and effect data have been
incorporated in the database for further use in the risk assessment
The database serves two primary goals 1) to ensure that for all substances included in the
database the same physic-chemical data and effect data are used in the risk assessment for
these substances independent of the BWMS in which they occur (providing consistency
between the substances and systems evaluated) and 2) the main DBP currently identified in
BWMS happen to be quite well-known rather simple organic compounds For many of them
risk assessments have been carried out by other institutions including those in the USA and
EU but also by non-governmental gremia like WHO Therefore the GESAMP-BWWG and
IMO face the submission of data in manifold as each applicant will provide the data available
in public literature on for instance the substance bromoform Once a substance has been
included in the database no publicly available data will no longer need to be submitted with
the dossier for Basic and Final Approval
The currently proposed list of DBP contains the substances as indicated in Table 1
The waiving of data is restricted to information on these substances that may be found in
scientific literature and in risk assessment documents carried out by national or international
144
LINDERS
bodies that generally also have carried out an evaluation of the quality of the data based on
established criteria like standard test guidelines (OECD) GLP etc It should be recognized
that data required for the functioning of the BWMS like the whole effluent toxicity (WET) test
and the chemical analysis of treated ballast water can never be waived and are exempted
from this waiving process
Table 1 DBP in database
Substance Substance
1 sodium bromate 10 dibromoacetic acid
2 potassium bromate 11 tribromoacetic acid
3 Bromoform 12 monochloroacetic acid
4 Chloroform 13 dichloroacetic acid
5 dibromochloromethane 14 trichloroacetic acid
6 dichlorobromomethane 15 bromochloroacetic acid
7 sodium hypochlorite 16 monochloroamine
8 sodium thiosulphate 17 trichloropropane
9 monobromoacetic acid 18 dibromoacetonitrile
32 MAMPEC
As the model to be used for the calculation of the PEC the GESAMP-BWWG adopted the
MAMPEC-model as the most suitable model currently available In the model a specific
scenario has been defined describing the harbor environment and an emission scenario for
the discharge of ballast water In the harbor scenario the most relevant parameters are
defined as pH temperature particulate organic matter dimensions of the port and exchange
volume with the surroundings The harbor scenario is given in Table 2 where the relevant
parameters that define the harbor are presented including the exchange volume with the
shipping lane or the open sea
The emission scenario defines the amount of ballast water discharged each day A value of
E+5 m3d was chosen as a representative worst case discharge of ballast water in the
recipient environment The multiplication of the discharged ballast water and the measured
concentration of a substance in the discharged ballast water as given in the dossier of the
applicant yields the total load of the substance in the recipient harbor
145
(FINALIZED) METHODOLOGY FOR RISK ASSESSMENT OF ACTIVE SUBSTANCES
The result of the MAMPEC calculation is the yearly average and median concentration of the
substance under consideration its maximum minimum and its 95th-percentile As a worst-
case situation the maximum value is currently used for the evaluation The MAMPEC-BW
version 30 has been specifically developed for the GESAMP-BWWG For the human
exposure scenario the MAMPEC results may be used as well for the estimation of the
exposure to the general public
Table 2 Standard harbor scenario
Parameter Value Unit Parameter Value Unit
Tidal period 1241 m3
Width y1 1000 m
Tidal difference 15 m Width y2 500 m
Tidal density
difference
04 kg m-3
Depth 15 m
Water level change 0 m Mouth width x3 1000 m
Flow velocity 1 m s-1
Latitude 50 NH
SPM concentration 35 mg L-1
Depth mixed sediment
layer
02 m
POC concentration 1 mg L-1
Sediment density 1000 kg m-3
DOC concentration 2 mg L-1
Degradation rate om 0 d-1
Chlorophyll 3 microg L-1
Net sedimentation
velocity
1 m d
-1
Salinity 34 psu Fraction om in sediment 2852E2 -
Temperature 15 ordmC Depth in harbor entrance 15 m
pH 8 -
Exchange area harbor
mouth
15000 m
2
Length x1 5000 m Tidal exchange 2432E7 m3
Length x2 5000 m Tidal exchange 3243
34 The Near Sea Scenario
The Group considered that also for the area around the ship where the actual discharge
takes place a situation of higher risk may occur Therefore a near sea scenario has been
defined as well taking an additional dilution factor of 5 into account for the short-term
exposure of aquatic species The following equation gives the calculation of the exposure
concentration for aquatic organisms and general public in the near sea situation
146
LINDERS
where
Cmax = the maximum concentration due to near sea exposure (microgL)
Cbw = the concentration in the ballast water (microgL)
S = dilution factor the proposed default value is 5
Cmean = the calculated mean concentration with MAMPEC (microgL)
The general public may be exposed by oral intake dermal uptake and inhalation of
discharged ballast water during swimming in contaminated areas and additionally oral
exposure takes place during consumption of fish caught in these contaminated areas
35 Assessment Factors
Whilst in the area of exposure a Predicted Environmental Concentration (PEC) is needed to
perform the risk assessment and a Predicted No-Effect Concentration (PNEC) is needed in
the area of effects of substances in the environment The derived PNEC-value is defined as
the concentration to which an ecosystem may be exposed without negative effects to the
populations of organisms in the ecosystem To establish a meaningful PNEC that is
comparable with the PEC it should be derived based on sound scientific principles Several
methods have been described in the scientific literature and the method adopted by
GESAMP-BWWG has been based on the principles used by USEPA and EU in their risk
assessment reports Based on the amount and quality of the data of a specific substance an
overall assessment factor is assigned
The value of the assessment factor depends on the type of effect acute or chronic For
environmental effects no effects on the individual organism are considered only the potential
effects on the population are considered relevant In the case of DBP and the evaluation of
BWMS the Group decided that the relevance of sediment toxicity was not significant as all
DBP considered have a low lipophilicity and therefore do not adsorb to the sediment
Toxicity for sediment organisms was considered unlikely If the Group came across
substances with high lipophilicity also a risk assessment would be needed and standard
assessment techniques should be used Normally for a hazard evaluation for aquatic
organisms a set of three toxicity tests would be required for algae crustaceans and fish both
for acute and chronic toxicity Even for the well-known DBP a complete set of toxicity data is
often not available To arrive at a PNEC based on a complete or incomplete data set the
table of assessment factors is used as given in table 3
147
(FINALIZED) METHODOLOGY FOR RISK ASSESSMENT OF ACTIVE SUBSTANCES
Table 3 Assessment factors
Data set Assessment factor
PNEC general PNEC near sea
Lowest short-term L(E)C50 from freshwater or marine species representing one or two trophic levels
10000 1000
Lowest short-term L(E)C50 from three freshwater or marine species representing three trophic levels
1000 100
Lowest short-term L(E)C50 from three freshwater or marine species representing three trophic levels + at least two short-term L(E)C50 from additional marine taxonomic groups
100 10
Lowest chronic NOEC from one freshwater or marine species representing one trophic level but not including micro-algae
100 -
Lowest chronic NOEC from two freshwater or marine species representing two trophic levels which may include micro-algae
50 -
Lowest chronic NOEC from three freshwater or marine species representing three trophic levels which may include micro-algae
10 -
36 Human Exposure Scenario
For the estimation of the risk to the crew and port state control MAMPEC is not suitable as
exposure may take place during handling of the chemicals used in the BWMS or during
operation of the BWMS The possibilities of exposure are defined in the unit operations
involved in the BWMS These unit operations have to be defined for each individual BWMS
as the specific circumstances may change from one system to another The number of
exposure events and the amount occurring have been estimated for a worst-case and a
realistic case As an example for human exposure sampling of ballast water tanks may result
in dermal and inhalation exposure at a frequency of 2 hours per day and 5 days per week for
acute exposure and an additional assumption of 45 weeks per year would represent chronic
exposure
148
LINDERS
4 Conclusions
The methodology of GESAMP-BWWG has been further developed during a series of three
stock-taking workshops to which additional experts have been invited on specific topics like
the model development and the human exposure scenario development The Group
considered the current methodology quite complete and more or less in place Therefore the
time has arrived to request partiesrsquo suggestions and criticism on the proposals The
methodology should be considered a living document to which new information may be added
or items changed if scientific developments indicate the need In addition the methodology
has to be tested in practice Changes have been performed taking into account current
experience and knowledge which is based on the major use of disinfection by electrolysis of
seawater and the production of DBP If other substances are proposed as active substances
changes or other concepts must be developed and used to perform an acceptable risk
assessment for those cases Nevertheless the main principles of risk assessment exposure
assessment hazard assessment and risk characterization will be kept as the basic
keystones
Potential areas for further development of the methodology may include the evaluation of key
model parameters like the tidal exchange volume of water in the harbor the temperature in
the harbor in relation to the temperature at which degradation of the substance has been
determined and a correction factor that may be needed to account for temperature
differences An important area of research could be the necessity for a second or higher tier
assessment in the event that the worst-case scenario leads to unacceptable risk Also the
occurrence of many other possible DBP should be further assessed Literature sources have
shown that over 600 different substances have been analyzed in all kinds of disinfection
processes It remains to be seen whether applicants have to search more thoroughly for more
DBP Finally the potential exposure to substances showing carcinogenicity mutagenicity and
reproductive toxicity (so-called CMR-substances) should be further analyzed as some of the
DBP have such classifications
To answer the questions posed in these potential areas of concern stock-taking workshops
will be held on a yearly basis and successively the group will discuss possible solutions with
invited experts in the field The final aim of controlling the world-wide spread of invasive
aquatic species may require additional scientific input to gain more insight in the area of
ballast water management and advance the protection of the worldrsquos oceans and coastal
areas from bio-invasion at the same time ensuring that ballast water management practices
used to comply with the Convention do not cause greater harm that they prevent
149
(FINALIZED) METHODOLOGY FOR RISK ASSESSMENT OF ACTIVE SUBSTANCES
Acknowledgment
The author wishes to acknowledge the input of the GESAMP-BWWG and of all the invited
experts who contributed to the current status of the methodology on the evaluation of the
environmental and human risk assessment of ballast water discharges
150
151
BALLAST WATER MANAGEMENT SYSTEMS
Risk Assessment for Exemptions from
Ballast Water Management ndash The Intra-Baltic HELCOM Study
Matej David12 Stephan Gollasch3 Erkki Leppaumlkoski4
Abstract
This study focuses on intra-Baltic shipping for exemptions from ballast water management
requirements based on risk assessment (RA) As a basic framework the HELCOM Guidance to
distinguish between unacceptable high risk scenarios and acceptable low risk scenarios and the IMO
G7 Guideline were used RA methods were selected considering these documents After studying
shipping profiles in the Baltic Sea possible RA applications were studied on four different routes The
current lack of information regarding alien and cryptogenic species as well as human pathogens
present in port areas of the ballast water donor and recipient points were found as most limiting factors
to conduct a RA This study may be of particular interest for regional seas for example the Black and
Baltic Seas share some RA-relevant features such as intensive shipping inside the area and different
salinities throughout the sea
Key Words maritime transport ballast water management exemptions risk assessment
Introduction
The International Convention for the Management and Control of Ballast Water and
Sediments (BWM Convention) was adopted by the IMO in February 2004 to set global
standards on ballast water management (BWM) requirements (Gollasch et al 2007) The
BWM Convention introduces the selective BWM approach with Article 42 which allows to
adapt BWM measures to local conditions based on risk assessment (RA) In light of
exemptions from BWM requirements these can be given on the basis of Regulation A-4
(IMO 2004) Clearly to enable a port state to introduce such a selective approach an
appropriate RA is essential and necessary Globally agreed procedures for granting
exemptions are described in the IMO Guidelines for Risk Assessment under Regulation A-4
of the BWM Convention (IMO G7 Guideline) (IMO MEPC 2007)
1 University of Ljubljana Faculty of Maritime Studies and Transport Pot pomorščakov 4 SI-6320 Portorož
Slovenia 2 corresponding author e-mail address matejdavidfppuni-ljsi
3 GoConsult Grosse Brunnenstr 61 DE-22763 Hamburg Germany 4 Aringbo Akademi University Environmental and Marine Biology FI-20520 Turku Finland
152
DAVID GOLLASCH AND LEPPAumlKOSKI
HELCOM went further and prepared and adopted a Baltic Sea specific guidance for RA-
based exemptions the Guidance to distinguish between unacceptable high risk scenarios
and acceptable low risk scenarios ndash a risk of spreading of alien species by ships on Intra-
Baltic voyages (HELCOM RA Guidance 2010) This study focussed on testing the possible
application of the HELCOM RA Guidance for intra-Baltic shipping (the Kattegat included)
considering also the IMO G7 Guideline In general environmental issues in shipping should
be dealt with at a global scale however the implementation may occur through regional
agreements to consider local specifics (David and Gollasch 2008)
Risk Assessment Methods for Exemptions from BWM
The IMO G7 Guideline specifies three basic RA methods ldquoenvironmental matchingrdquo
ldquospecies-specificrdquo and ldquospecies biogeographicalrdquo The risk estimation on the assessment of
environmental matching between the areas of ballast water origin and discharge considers
salinity and temperature as surrogates for the assessment of the speciesrsquo capability of
survival in the new environment Speciesrsquo biogeographical risk assessment identifies
overlapping species in the donor and recipient ports and biogeographical regions and these
are direct indications of the similarity of environmental conditions The risk identification in the
species-specific approach is focused on the assessment of the potential invasiveness of each
species and anticipations of the harm that it could cause in the new environment
The risk assessment based upon an environmental match was found applicable considering
water salinity as key feature in this approach Temperature was also considered as a risk
assessment quantifying factor in the environmental match approach but it was agreed that
this is of lesser reliability to identify low risk scenarios The salinity is believed to be a
relatively solid indicator for species compatibility and survival in a new environment and on
the other hand this information is easily available for ballast water source and discharge
areas Acceptable risk is assessed should the salinity between ballast water donor and
recipient ports be freshwater (lt 05 PSU) to marine (gt 30 PSU) Such a salinity difference
does not occur for intra-Baltic shipping and therefore this environmental match approach
alone cannot be applied as a RA concept A new approach (ie the combination of
environmental match with species-specific considerations) was developed
In terms of the application of the species-specific approach the target species approach
was selected Target species need to be selected out of all alien cryptogenic and harmful
native species present in the Baltic Sea area Selection criteria to be used are set in the IMO
G7 Guideline
Further should both the ballast water donor and recipient regions have the same target
species but occurring in much different abundance a low risk indication needs to be
153
RISK ASSESSMENT FOR EXEMPTIONS FROM BWM
evaluated on a case-by-case basis Basically it would not be acceptable to transfer
unmanaged ballast water if a target species would occur in much higher abundance in any of
the donor ports than in the recipient port
Plants and animals native as well as non-native have the theoretical potential to spread
naturally from a donor to a recipient port without being assisted by any man-related vectors
It was recognized that this is species-specific and that the risk could be acceptable only if all
target species of concern could easily and naturally spread from the donor to the recipient
port
It was also considered that a coastal state may introduce a control or eradication program
for certain most unwanted species in their waters The further introduction of any such
species to the ballast water recipient area would not be acceptable
For the combined environmental and species-specific approach it was agreed that it
may be still acceptable when ballast water is moved between freshwater ports and brackish
ports with salinities higher than 18 PSU in which case a species-specific approach would be
also required especially considering the species that have known salinity tolerance higher
than lt05 PSU and gt18 PSU Should such species occur in only one of the considered donor
ports a low risk cannot be assumed
The species biogeographical risk assessment was found not applicable as the ballast water
movements considered here are not undertaken between different biogeographical regions
IMO Guideline G7 further states a species-specific risk assessment may be best suited to
situations where the assessment can be conducted on a limited number of harmful species
within a biogeographic region
In terms of vector factors the relevance of species survival during a voyage ballast water
discharge quantities and frequencies were considered As all intra-Baltic voyages are
relatively short (from hours to a couple of days) it was assumed that if one species is
present in the ballast water donor port it will survive the voyage and will be discharged viable
with ballast water in the recipient port The quantity of ballast water discharge is also one
of the factors related to the level of risk
However considering that also a small number of harmful organisms present in the
discharged ballast water may cause critical consequences this RA considers unacceptable
discharge of any quantity of ballast water if it contains target species not yet present in the
recipient port More frequent ballast water discharges from one donor port may increase the
154
DAVID GOLLASCH AND LEPPAumlKOSKI
risk however one ballast water discharge may already be sufficient to introduce a species
hence is not acceptable
The RA methods and principles for granting exemptions from BWM in intra-Baltic shipping are
organised in a flowchart and presented in
Figure 1
RA FOR INTRA-BALTIC SHIPPING
Data quality
- Is quality of data for RA good
enough
Yes ndash conduct RA
No ndash raquoHigh risklaquo
Environmental matching RA
- Salinity difference of donor port(s) and
recipient environment
Low ndash proceed to Species specific RA
lt05 ndash gt18 PSU = proceed to Combined RA
lt05 ndash gt30 PSU = raquoLow risklaquo
Species-specific RA
-Is there any target species that could not
easily naturally spread from donor to
recipient port
- Is there any target species in any of the
donor port(s) in higher abundance than in
the recipient port
- Is the target species in the recipient port
under a control or eradiaction program
Yes ndash raquoHigh risklaquo
No ndash raquoLow risklaquo
Combined RA
- Is there any high salinity tolerant
target species in any of the donor
port(s)
Yes ndash raquoHigh risklaquo
No ndash raquoLow risklaquo
Decision
- Low risk = Exemption granted
- High risk = Exemption not granted
Figure 1 Risk assessment (RA) methods and principles for granting exemptions
from ballast water management in intra-Baltic shipping
155
RISK ASSESSMENT FOR EXEMPTIONS FROM BWM
RA APPLICATION TEST
Based on studying shipping profiles in the Baltic Sea the following shipping routes were
selected
o St Petersburg (RU) ndash Gothenburg (SE)
o Klaipeda (LT) ndash Kiel (DE) and
o Kiel (DE) ndash Gothenburg (SE)
The routes recognized show frequent shipping pattern and represent different distances and
environmental conditions
Another route was selected for risk assessment with one donor port outside the Baltic region
o Terneuzen (NL) ndash Moumlnsterarings (SE) ndash Karlshamn (SE)
When starting the target species selection process it became clear that essentially needed
data (ie on already introduced alien species in the Baltic Sea ports cryptogenic species and
harmful native species) are missing to undertake such an assessment The most
comprehensive data on alien species was recognised to be the HELCOM MONAS list
(HELCOM 2009) Target species could still be identified from the data available but having in
mind also the precautionary approach it was recognised that vessels could not be exempted
based on RA conducted on such limited data Further assessments of the possible natural
spread and abundance comparison of target species as well as the presence of human
pathogens in the donor ports were not enabled due to the lack of data
Conclusions
RA for granting exemptions from BWM results in vessels continuing to operate on the
assessed route without conducting any ballast water management effort The RA is focused
on the identification of acceptable or non-acceptable ballast water discharges from donor
ports on a certain route This makes it clear that for such RA it is crucial to have reliable data
about port and surrounding environments in terms of biology as well as salinity
Nevertheless the study resulted in an agreement on the methods and principles to be used in
RA for exemptions in intra-Baltic shipping which can be applied when reliable data become
available Data for such RA would need to be obtained with port baseline surveys and
monitoring programmes using best available scientific knowledge and methods
156
DAVID GOLLASCH AND LEPPAumlKOSKI
Acknowledgements
The authors would like to express their grateful thanks to HELCOM for funding this study The
research has received co-funding from the European Communityrsquos Seventh Framework
Programme (FP72007-2013) under Grant Agreement No 266445 for the project Vectors of
Change in Oceans and Seas Marine Life Impact on Economic Sectors (VECTORS) where
David and Gollasch participate
REREFENCES
David M and S Gollasch (2008) EU shipping in the dawn of managing the ballast water issue Mar
Pollut Bull 56 1966-1972
Gollasch S David M Voigt M Dragsund E Hewitt C and Y Fukuyo (2007) Critical review of the IMO
International Convention on the Management of Shipsrsquo Ballast Water and Sediments Harmful Algae 6
585-600
HELCOM (2009) Monitoring and assessment of alien species according to the international
regulations HELCOM MONAS 122009 Doc 74 26 pp
HELCOM (2010) Guidance to distinguish between unacceptable high risk scenarios and acceptable
low risk scenarios ndash a risk of spreading of alien species by ships on Intra-Baltic voyages
(wwwhelcomfistcfilesshippingHELCOM20Guidance20on20risk20voyages20July202010
pdf)
IMO (2004) International Convention for the Control and Management of Shipsrsquo Ballast Water and
Sediments International Maritime Organization 36 pp
IMO MEPC (2007) Guidelines for Risk Assessment under Regulation A-4 of the BWM Convention
(G7) International Maritime Organization Resolution MEPC162(56) 16 pp
157
BALLAST WATER MANAGEMENT SYSTEMS
Ballast Water Management in Turkey ndash an overview
Murat Korccedilak1
Abstract
The Turkish coasts are one of the most vulnerable coasts because of the intensive maritime traffic
Currently there are 23 million tons of ballast water discharged to Turkish coastal waters annually
Further 66 different invasive species are carried by ships to Turkish coasts of which 19 of them can
be categorized as harmful organisms In particular three major alien and invasive species ndash namely
Mnemiopsis leidyii from the North Atlantic Rapana venosa from the Japan Sea and Beroe ovata from
the North Atlantic ndash were transferred to the Black Sea where they collapsed the entire fish stock and
caused significant economic loss to the region
The Turkish Undersecretariat for Maritime Affairs initiated an in-depth study on 26 July 2006 entitled
Project on Control and Management of Harmful Organisms Transferred by Ballast Waterrdquo The project
was undertaken by the Scientific and Technological Research Council of Turkey (TUBITAK) Marmara
Research Centrersquos (MRCrsquos) Environment Institute (EI) The project also aimed to produce a synergy
between these two public bodies to develop an operational ballast water management strategy and
system in Turkey
Within the framework of the project an inventory of the shipping activities along Turkish coasts was
developed in the form of a database system in order to quantify the amount of ballast water discharges
in Turkish ports and to define the sources of the ballast water An electronic reporting system was used
for this purpose All of the Turkish ports were subjected to a risk assessment process using the
GloBallast Risk Assessment Method Also a Geographical Information System (GIS) and an invasive
species database were produced during the project All these activities also contributed towards
Turkeyrsquos participation in the GloBallast project in which Turkey is a Lead Partnering Country (LPC) for
the Mediterranean region Turkey has also hosted a number of regional meetings such as ldquoTraining on
Port Biological Baseline Surveyrdquo and ldquoWorkshop on Legal Implementation of the BWM Conventionrdquo as
well as regional BWM strategy development meetings
This paper contains the details of the Turkish national ballast water management project and also
gives information of the national system of Turkey and future planned activities
1 Undersecretariat for Maritime Affairs of TURKEY
158
KORCcedilAK
Introduction
The Turkish National Ballast Water Management Project is defined in two main sections The
first section was conducted between 2006-2008 and the second section was conducted
between 2010-2011 The first section of the project (2006-2008) consists of 13 different work
packages These are
1 Inventory Study
a Shipping traffic data for a 5-year period
b Ballast water discharge and uptake amounts
c Ballast water origins and transportation patterns
d Impacts of invasive species to Turkish Coasts
e Determination of sensitive coastline areas
2 Trend Analysis
a Next 10 yearsrsquo approximation for maritime traffic
b Next 10 yearsrsquo approximation for ballast water discharge amounts
3 Risk analysis
a Determination of the risks for Turkish ports with Globallast Risk
Assessment Methodology
b Determination of the risks for Turkish ports with HELCOM Risk Assessment
Methodology
4 Establishment of Geographical Information System
5 Defining the ballast water management models
a Ballast water exchange probabilities within Turkish Territorial Areas
b Defining the roles of the stakeholders on ballast water management
c Defining the ballast water management strategy for Turkey
6 Reporting the pros and cons of signing the Ballast Water Management Convention
7 Preparing the national draft legislations
8 Defining the procedure on compliance and enforcement
9 Defining the roles of public bodies private sectors and NGOrsquos on ballast water
management
10 Defining the relevant technical infrastructure and supply chains
11 Preparing training material
12 Preparing an invasive species database
13 Establishing procedures for sediment reception facilities The second section of the project (2010-2011) consists of 5 different work plans These are
1- Ballast Water Risk Assessment Software
2- Ballast Water Exchange Route Analysis Software
3- Preparing a Port Environment Parameters Database
4- Revision of the Invasive Species Database
159
BALLAST WATER MANAGEMENT IN TURKEY ndash AN OVERVIEW
5- Revision of the Ballast Water Reporting Form Database
ACHIEVEMENTS FROM THE PROJECT
Inventory Study
The time period for the inventory study was 5 years All of the data were collected between
2002 and 2006 The amount of ballast water discharge and uptake were defined with respect
to ship transportation data Also the origins and transportation patterns were defined
available literature was scanned and the known impacts of the invasive species to Turkish
coasts were defined The sensitive coastline areas were defined with respect to current
legislation
Figure 1 Ballast water discharged into the Turkish
It was determined that 23 million tons of ballast water are discharged into Turkish coastal
waters annually Most of the ballast water is discharged to four hot spots in Izmit Iskenderun
Izmir and Istanbul bays
Ballast Water Reporting Form System
Ballast water reporting is a voluntary implementation However in Turkey a web-based
reporting form system was established and defined as mandatory The agents of the ships fill
in the form via the internet and after the approval of the harbor masters the ship is allowed to
arrive or depart the port
160
KORCcedilAK
Figure 2 Ballast Water Reporting Form System coasts (Ballast Water Management Project
2008)
Trend Analysis
The maritime transport data and ballast water discharge amounts were studied with a
statistical interpolation method and the amounts of ballast water discharged for 2016 was
estimated for all ports
Figure 3 Ballast water discharge trend analysis
Marmara Ege Denizi Akdeniz Karadeniz
45
23 25
7
41
18
35
6
2002-2006 2016
161
BALLAST WATER MANAGEMENT IN TURKEY ndash AN OVERVIEW
Risk Assessment Study
All of the Turkish ports were categorized with two different methods namely the Globallast
Risk Assessment Method and the Developed Baltic Risk Assessment Approach Also a
target invasive species list was prepared for Turkish Coasts
Figure 4 Risk Assessment coasts (Ballast Water Management Project 2008)
Ballast water risk assessment methods define the risk of donor ports with respect to
discharge port as low medium high and very high In the figure 4 the risk categorization of
donor ports to Ceyhan Port (discharge port) is shown
Geographical Information System
All of the data collected and all of the results achieved during the project were used to build a
geographical information system (Figre 5) This system is a decision support tool for the
implementation of the Ballast Water Management Convention
Route analysis
All the suitable sea areas are defined with respect to Ballast Water Management
Conventionrsquos ballast water exchange criteriarsquos The routes are identified by using ship type
162
KORCcedilAK
GT of ship and average speed By using that analysis all the routes are classified as suitable
or not suitable for exchange (Figure 6)
Figure 5 GIS System coasts (Ballast Water Management Project 2008)
Figure 6 Route analysis (Ballast Water Management Project 2008)
163
BALLAST WATER MANAGEMENT IN TURKEY ndash AN OVERVIEW
Invasive Species Data Base
The literature on reported invasive aquatic organisms was studied Relevant properties of this
invasive species were collected in a database system This database can be accessed from
the internet The users can conduct searches according to the name or habitat of the invasive
species
Figure 7 Invasive Species Database
SECOND SECTION (2010-2011)
Risk Assessment Software
This is a Geographical Information System based software which can calculate the risk
between ports for ballast water transportation with GloBallast BWRA-Methodology
The Globallast Risk Assessment methodology is a complex system which uses different
calculation software and computer databases It is a system that you can use to calculate the
risk for ports for only a defined time period For another time period you have to make
calculations from the beginning by using different calculation methods one by one
164
KORCcedilAK
Ballast Water Reporting Form
bull Scientific publicationsbull Port publications bull Climate databasesbull National tide-tablesbull Satellite images (google
earth)bull NOAA (National
Oceanographic Data Center)bull Lloydrsquos- Ports and Terminals
Guide
C1 - ballast water discharge frequency
C2 - ballast water discharge volume
R1 ndash tank volume
R2 -voyage time
Port Environmental Database for C3
Background data for Risk Assessment Data sources
Risk species database for C4
or
Shipping records
bull Scientific publications
bull Port baseline surveys
bull Invasive species databases worlwide
Ballast Water Risk Assessement System
BW Reporting Form Database
Figure 8 Risk Assessment Data Resources
In our software all calculation methods are modified to work together automatically and give
results for different time periods instantaneously This is a perfect tool for the port state
investigation officers to use as a decision support tool for defining the most appropriate ship
to be investigated
This tool was produced to be used on port state investigations and also it is a useful decision
support tool for Turkey on deciding exchangetreatment exemptions for ships with respect to
the Ballast Water Management Convention
There are four different kind of coefficients have to be calculated with respect to the
methodology Also there are two different risk reduction factors that have to be calculated
These coefficients are related to the frequency of ballast water discharge (C1) amount of
ballast water discharge (C2) Environmental similarity (C3) and information on known invasive
species (C4)
There are six different parameters that are calculated by using 3 different database systems
All databases and the risk assessment software are working via the webThis makes the
system available from all over the world The databases are the BW Reporting Form
Database Port Environmental Database and Risk Species Database
165
BALLAST WATER MANAGEMENT IN TURKEY ndash AN OVERVIEW
Deniz Ulaştırması Genel Muumlduumlrluumlğuuml
Figure 9 Screen image of the risk assessment software
The second section of the software reports the ballast water reporting forms and all
information about the shipping traffic for Turkish ports On the third section you run the risk
assessment software
Risk assessment software reports the risk evaluation of the ports with respect to the other
donor ports You first choose which port you need to assess the risk The system
automatically gives information about the risk amounts of all possible donor ports
As shown in the figure 10 the risk assessment for the İzmit port was conducted (plotted with
a big white spot) the red plotted ports are the high risk ports and the green plotted ports are
low risk ports Also the system gives a report for a risk assessment and all parameters can
be investigated from risk report
166
KORCcedilAK
Figure 10 Screen image of the risk assessment
Route Analysis
Route analysis is one of the important components of the risk assessment system It reports if
a ship is available to make a ballast water exchange with respect to its route
The user only inputs the last port of call and the arrival port from Turkey The system
automatically takes the properties of the ship such as ballast water amount and the tonnage
and the type of the ship Afterwards the system draws the most probable route for the ship
and calculates the distance and available places to make an exchange At the end the
system calculates the exchange duration and gives a result regarding whether this ship can
make and exchange during this voyage or not
This system is also a perfect tool for port state control officers as a decision support tool
THE TURKISH BALLAST WATER MANAGEMENT SYSTEM
The ratification process of the Ballast Water Convention in Turkey is nearly finalized All the
sub-commissions in the parliament approved the convention Turkey will be a party of the
convention after the approval of the parliament
167
BALLAST WATER MANAGEMENT IN TURKEY ndash AN OVERVIEW
Figure 11 Route Analysis
The national draft legislations are ready and awaiting the ratification process of the
convention After the ratification of the convention the draft legislation will put into force
immediately
There is a pilot implementation that was carried out during this ratification period in order to
test the capabilities of the Turkish port state control officers on ballast water Management
inspections The Botaş Harbor Master was chosen for this pilot implementation because of its
intensive maritime traffic This area is the oil loading terminal for the Baku-Tbilisi-Ceyhan
pipeline All of the ships calling Ceyhan are coming under full ballast conditions and discharge
their ballast water into this terminal area
The main idea of this pilot implementation is to force the ships to make exchanges and try to
inspect them We ordered all ships calling this port to make an exchange before entering the
port in suitable places with respect to the Ballast Water Convention If the ship did not or
could not make the exchange the ship was surveyed and BW samples were taken After the
analysis of the samples if an invasive species was determined to be present an exchange
will be a ldquoshouldrdquo for this route All of the other ships coming from that route would not be
allowed to enter the port without exchange After this pilot implementation we realized that
the training of the port state control officials is one of the most important concerns of ballast
168
KORCcedilAK
water management system It is a complicated process and training dramatically affects the
success
As the maritime authority of Turkey we can easily say that after the two phases of the
national ballast water management project Turkey is ready to implement all of the aspects of
the Ballast Water Management Convention
Especially in the second phase of the national project a decision support tool was prepared
which we can use for
bull Deciding to allow or not to allow the ship to enter a port bull Chosing the highest risk ship for inspection bull Defining the port rules about Ballast Water Management bull Evaluating the probability of ballast water exchange of a ship bull Deciding about exemptions for a ship and bull Collecting statistical data for scientific studies
Turkey is also a Leading Partnership Country for the Mediterranean Region with Croatia
through the GloBallast Partnership Project Some of the main activities of the project were
held in Turkey These activities included the Port Baseline Survey Workshop (21-24 October
2008) Legal Training (2-3 December 2009) and the Second Regional Task Force Meeting
(1-3 June 2010)
Turkey executes the Chairmanship of the Regional Task Force and plays an important role in
the preparation of the Regional Ballast Water Management Strategy This document was
approved by the contracting parties of the Barcelona Convention and put in force
Figure 13 Blue Book
Turkey also published a report
called ldquoBlue Book about the
Ballast Water Management
Activities in Turkeyrdquo The Blue
Book contains three reports which
are the National Ballast Water
Management Strategy for Turkey
Ballast Water Status Assessment
Report for Turkey and Economic
Assessments for Ballast Water
Management in Turkey
169
BALLAST WATER MANAGEMENT IN TURKEY ndash AN OVERVIEW
Future plans of Turkey include the successful implementation of the Ballast water
Management Convention Within this context we will implement all of the activities defined in
National Strategy seriously and enact and enforce the national legislation as soon as
possible
REFERENCES
Hilliard Rob Clarke C Stevens C Polglaze J and C THayes (2003) Ballast Water Risk Assessment (Activity 31) User Guide (v14) GEFUNDPIMO Global Ballast Water Management Programme (GloBallast) for the BWRA Database GIS System
Leppaumlkoski E and S Gollasch Risk Assessment of Ballast Water Mediated Species Introductions ndasha
Baltic Sea Approach 2006
Olgun A Avaz G Doumlnertaş A S Aydoumlner C Bozkaya Ş Pekdemir E A Murat S Oral N
Başar E Feyzioğlu M and et al(2009) The Control and Management of Harmful Aquatic Organisms
Transported by Ballast Water Project Report TUBITAK-Marmara Research Center-Environment
Institute CcedilE0910
Olgun A Aydoumlner C and T Atalay (2011) Development of Ballast Water Risk Assessment Software
Project TUBITAK-Marmara Research Center-Environment Institute
171
BALLAST WATER MANAGEMENT SYSTEMS
Biological Efficacy of Electrolytic BWMS
(Electro-Cleen Tm System) During Onboard Installation
Yong Seok Park Dong Hyun Shon1 Gwang Ho Lee Hyun Ju Moon
Hyung Geun Jeon
Abstract
An electrolytic ballast water treatment system (Electo-CleenTM System ECS) which obtained a type
approval in December 2009 was continuously evaluated to ensure its biological efficacy during
onboard installation in newly built vessels Thirteen shipboard tests were performed to determine the
biological efficacy of the system The evaluations were carried out in the major ship building yards in
Korea and Japan between June 2009 and December 2010
Keywords 2004 BWM Convention Electo-CleenTM System Shipboard test biological efficacy D-2
standard Total Residual Oxidant
1 Introduction
Since the International Maritime Organization (IMO) adopted the 2004 BWM Convention (lsquothe
International Convention for the Control and Management of Shipsrsquo Ballast Water and
Sedimentsrsquo) to prevent risks induced by transfer of non-indigenous organisms and pathogens
14 systems on the market have been type-approved under G8 as of May 2011 (Lloyds
Register 2011) Currently over 40 ballast water technologies are expected to obtain type
approval soon These commercially available systems or system that are going to be
commercially available soon need to be evaluated to ensure they always meet the
requirements of the IMO D-2 regulation This study focused on the biological efficacy of an
electrolytic ballast water treatment system (Electo-CleenTM System ECS) which obtained a
type approval by the Korean authority in December 2009 The system was evaluated 13
times during shipboard installation to confirm that the D-2 standards were met between June
2009 and December 2010
2 Materials and Methods
Shipboard tests were carried out to evaluate the viability of organisms specified by D-2
standards after the treatment A volume of 1 m3 of water samples was netted for organisms
over 50microm (mesh size 32microm) Organisms between 10 microm and 50 microm were collected using a
net which has a mesh size of 5microm A volume of 10 L of water samples were netted for
1 RampD Division Techcross Inc 25-1 Kwanam-ri Inju-myun Asan Chung Nam 336-833 S Korea
172
PARK SHON LEE MOON AND JEON
organisms between 10 microm and 50 microm All samples were collected in triplicate Triplicate
bacterial samples of Escherichia coli Enterococci and Vibrio cholera were collected using 1L
sterilized bottles
Viable organisms larger than 50 microm (mainly zooplankton) were determined based on the
appendages movement under a stereomicroscope Organisms were considered to be
ldquoviablerdquo if they were actively moving or exhibited an escape behavior when probed with a fine
needle If no activity or movement of any kind was observed after the additional sticking with
a fine needle organisms were considered to be ldquodeadrdquo The viability was confined to the
unimpaired body of zooplankton
Viable organisms between 10 microm and 50 microm (mainly phytoplankton) were assessed using
light microscopy and epifluorescence microscopy Sliding or its own original movement was
considered as an indication of viable organisms The emission of chlorophyll-induced red
color (autofluorescence) was also determined as an indicative signal of cell viability
(Pouneva 1997) A working stock solution of FDA (5 mgmL) was prepared by diluting the
primary DMSO solution 100 times with chilled distilled water (50 μgmL) The solution was
mixed during preparation to prevent the precipitation and kept cold in the dark Each sample
was stained by adding 33 μl of the working solution to a 1 mL sample (end concentration 17
μg mLndash1 FDA) (Gervey et al 2007) Stained samples were kept in a cool and dark place for a
minimum of 10 minutes prior to enumeration The fraction of FDA-stained cells (viability) was
determined under an epifluorescence microscope at 100X to 200X magnification depending
on cell size Organisms which emitted green-fluorescence and red-fluorescence were
counted under blue light excitation (wavelengths 450 to 500 nm) as viable organisms
Escherichia coli was evaluated by filtrating 10mL of sample water onto the 02 microm membrane
filter Filters were placed on the top of E coli Coliform and Coliform Count Plates (3MTM
Petrifilm plate) The Petrifilm plates were incubated for 24 hrs at 35degC The blue to red-blue
colonies associated with entrapped gas in the Petrifilm EC plate was considered as E coli
Vibrio cholerae (serotypes O1 and O139) was evaluated by filtrating 5 to 10 mL of sample
water onto the 02microm membrane filter Filters were placed on the TCBS (Bisulfate Citrate Bile
Sucrose) agar Pre-treated TCBS agar plates were incubated for 24 hrs at 35degC The green
colored CFU was considered as Vibrio parahaemolyticus The yellow colored CFU was
isolated into nutrient agar and incubated for 24 hrs at 35degC If the cultivated CFU showed
purple color it was considered to be positive If the incubated CFU was determined as
positive API20E test was carried out
173
BIOLOGICAL EFFICACY OF ELECTROLYTIC BWMS (Electro-Cleen TM System)
Enterococci was evaluated by filtrating 20 ~ 40 mL of sample water onto the 02 microm
membrane filter Filters were placed on the Intestinal Enterococci agar plate The pre-treated
agar plates were incubated for 48 hrs at 35degC The pink to brown coloured CFU with a
diameter of 05 to 2 mm was considered to be Enterococci
3 Results
Shipboard tests for biological efficacy were performed to evaluate the D-2 criteria There were
13 shipboard tests for biological efficacy of the equipment (Table 1)
Table 1 Shipboard evaluation for ECS during installation water qualities and operational
condition
Date
Installation
No
pH
Salinity
(PSU)
Temperature
(Cdeg)
TRO
concentration
(mg L-1)
Unit
installation
Water
flow
(m3
hr-1)
Ship
Yard
Jun509 S1 82 306 238 60 ECS300A X 2 600 A
Sep1509 S2 84 344 235 71 ECS300A X 2 620 B
Sep1709 S3 81 345 233 65 ECS300A X 2 580 A
Oct2309 S4 80 362 182 83 ECS300A X 1 150 C
Nov2009 S5 83 290 138 78 ECS300A X 2 500 A
Dec1709 S6 82 317 102 83 ECS300A X 2 480 B
Mar1210 S7 84 328 165 67 ECS300A X 2 630 A
July0810 S8 82 356 241 89 ECS300A X 2 580 A
Aug1310 S9 85 343 253 85 ECS300A X 2 550 A
Oct1310 S10 81 321 174 89 ECS300A X 2 610 A
Dec0910 S11 80 343 149 72 ECS600A X 1 620 C
Dec2410 S12
(APT) 82 345 121 81 ECS600A X 1 550 D
Dec2710 S13
(BWT) 82 343 123 84 ECS600A X 8 5100 D
ECS300A Treatment Rated Capacity 300 m3 h-1 ECS600A Treatment Rated Capacity 600 m3 h-1
APT After Peak Tank BWT Ballast Water Tank
The water temperature ranged between 102 degC and 253 degC while the range of pH was from
77 and 85 during the study The salinity range was between 290 PSU and 362 PSU The
early installations of 10 vessels were equipped with single or multiple units which have a
treatment rated capacity (TRC) of 300 m3 h-1 Shipsrsquo installation numbers of these vessels
were S1 S2 S3 S4 S5 S6 S7 S8 S9 and S10 The remaining three tests were carried out
with units which have a TRC of 600 m3 h-1 (S11 S12 APT S13 BWT) (Table 1)
174
PARK SHON LEE MOON AND JEON
The sufficient biological efficacy to comply with D-2 standard was found if the total residual
oxidant (TRO) was maintained between 60 mg L-1 to 89 mg L-1 (Table 1 and Table 2) The
population density of untreated sample larger than 50 microm was higher than 86 X 102 inds m-3
(S6) during all evaluations while that of untreated sample reached to 62 X 104 inds m-3 on
August 13 2010 during the evaluation of S9 (Table 2) The population densities of treated
sample larger than 50 microm were always less than 2 inds m-3 (S1 S3) The cell densities of
organism between 10 microm and 50 microm showed that the highest population density of untreated
sample reached to 20 X 102 cells mL-1 on December 27 2010 during the evaluation of S13
BWT The cell densities of viable organisms between 10 microm and 50 microm in treated sample
were maintained below 2 cells mL-1 (Table 2)
Table 2 Biological efficacy of ECS mean values of triplicate analysis
SD Standard deviation
Installation No
Samples
Test Items (D-2 Criteria)
gt50um 10-50um Ecoli Enterococcus Vibrio cholerae
inds m-3 cells mL-1 CFU 100mL-1 CFU 100mL-1 CFU 100mL-1
S1
Treatment 2 1 0 0 0
SD 2 0 0 0 0
Control 6080 12 0 0 0
SD 1990 1 0 0 0
S2
Treatment 0 0 0 0 0
SD 0 0 0 0 0
Control 9533 2 0 0 0
SD 1384 1 0 0 0
S3
Treatment 2 2 0 0 0
SD 2 1 0 0 0
Control 11897 20 0 0 0
SD 2411 7 0 0 0
S4
Treatment 1 0 0 0 0
SD 2 0 0 0 0
Control 2167 165 0 0 0
SD 430 8 0 0 0
S5
Treatment 0 0 0 0 0
SD 0 0 0 0 0
Control 2255 26 1 0 0
SD 400 4 1 0 0
S6
Treatment 0 0 0 0 0
SD 0 0 0 1 0
Control 863 39 0 0 0
SD 58 11 0 1 0
S7
Treatment 0 0 0 0 0
SD 0 0 0 0 0
Control 39330 17 100 65 0
SD 8048 4 20 22 0
S8
Treatment 0 0 0 0 0
SD 0 0 0 0 0
Control 5105 106 0 0 0
SD 2151 19 0 0 0
175
BIOLOGICAL EFFICACY OF ELECTROLYTIC BWMS (Electro-Cleen TM System)
Installation No
Samples
Test Items (D-2 Criteria)
gt50um 10-50um Ecoli Enterococcus Vibrio cholerae
inds m-3 cells mL-1 CFU 100mL-1 CFU 100mL-1 CFU 100mL-1
S9
Treatment 0 0 0 0 0
SD 0 0 0 0 0
Control 62435 156 8100 0 0
SD 3728 31 2022 0 0
S10
Treatment 1 0 0 0 0
SD 1 0 0 1 0
Control 2378 23 47770 919 0
SD 362 3 3233 341 0
S11
Treatment 0 0 0 0 0
SD 0 0 0 0 0
Control 2546 13 100 1 0
SD 283 4 100 1 0
S12 (APT)
Treatment 0 0 0 0 0
SD 0 0 0 0 0
Control 1317 96 0 23 0
SD 147 5 0 4 0
S13 (BWT)
Treatment 0 0 0 0 0
SD 0 0 0 0 0
Control 1253 197 0 4 0
SD 47 25 0 4 0
The results of bacterial analysis showed that no countable CFU was found in treated samples
except during the evaluation of S10 for enterococcus on October 13 2010 (SD = 1) (Table
2) The viable E coli collected from untreated samples reached over 47 X 104 CFU 100 mL-1
on October 13 2010 (S10) while the density of viable enteroccous was 92 X 102 CFU 100
mL-1 There were no viable V cholerae for both untreated and treated water samples during
evaluations
4 Discussion
All 13 shipboard evaluations for biological efficacy satisfied D-2 standard under various water
conditions when TRO concentration was over 60 mg L-1 The dominant group of organisms
bigger than 50 microm was barnacle larvae during the installation of S9 while copepoda
dominated during the installation of S3 and S7 Diatom predominated organisms between 10
microm and 50 microm during the installation of S4 and S13 However dinoflagellate dominated
during the installation of S9
REFERENCES
Garvey M B Moriceau and Passow U (2007) Applicability of the FDA assay to determine the
viability of marine phytoplankton under different environmental conditions Marine Ecology Progress
Series 352 17-26
176
PARK SHON LEE MOON AND JEON
Lloyds Register (2011) Ballast water treatment technology current status London June
Pouneva I (1997) Evaluation of algal culture viability and physiological state by fluorescent
microscopic methods Bulg J Plant Physiol 23(1-2) 67-76
177
BALLAST WATER MANAGEMENT SYSTEMS
Assessing of the Ballast Water Risk in Ceyhan Marine Terminal
Arzu Olgun1 Aslı Suumlha Doumlnertaş Cihangir Aydoumlner Yasemin Guumlmuumlşluumloğlu2
Abstract
Shiprsquos ballast water and sediments serve as a main vector in the transportation and spreading of
planktonic organisms toxic dinoflagellates bacteria and other unicellular organisms A proportion of
these species are capable of causing serious harm to native biodiversity industries and human health
Ceyhan Marine Terminal (CMT) which is located on the N-NW coast of the Gulf of Iskenderun
(Eastern Mediterranean Sea in Turkey) is an export terminal which transports crude oil from the Azeri
Caspian Sea to the world market via tankers With the starting of tanker traffic in Ceyhan Marine
Terminal in June-2006 the volume of the discharged ballast water from various seas of the world into
the CMT and the possibility of the introduction of invasive species to İskenderun Bay have increased
significantly And this site has been the most risky zone of Turkey coasts in the scope of ship-borne
species introduction
The main aim of this study is to assess the ballast water risk of the tankers on Iskenderun Bay
(Turkey) The relative overall risk (ROR) posed by each BW source port to CMT has been identified by
using four-year shipping traffic data and Ballast Water Reporting Form System data According to data
obtained from the Ballast Water Reporting Forms and the shipping traffic records 45551876 tonnes
of BW were discharged to CMT between 4June2006 and 02June2010 (annual average 11300000
tonnes) from 1126 visits In the BWRA 20 ports from the 133 source ports have been identified as
ldquohighrdquo risk ports 17 ports have been identified as ldquohighestrdquo risk ports also
Keywords Ballast Water Risk Analysis Invasive species Iskenderun Bay Turkey
Introduction
The Mediterranean Sea as an enclosed sea is particularly vulnerable to ship-associated
impacts due to a high-volume of shipping routes long history of use and sensitive shallow
and deep-sea habitats One of the major threats to marine biodiversity changes in the
Mediterranean Sea is biological invasion It is well known that the opening of the Suez Canal
(19th Century) has led to the introduction of hundreds of species of Indo-Pacific and
Erythraean origin which have established permanent populations particularly in the eastern
Mediterranean (Levantine Basin) According to recent scientific study reports approximately
1 TUumlBİTAK Marmara Research Center ndash Environment Institute Gebze Kocaeli TURKEY 2 Baku-Tbilisi Ceyhan Pipeline Company Environment Department Ankara TURKEY
178
OLGUN DOumlNERTAŞ AYDOumlNER GUumlMUumlŞLUumlOĞLU
400 non-native species were reported along the Turkish coast 331 of these alien species
were recorded from East Mediterranean sea coasts and 56 of 331 species are ship-borne
species (Ccedilınar et al 2011)
Ceyhan Marine Terminal (CMT) which is located on the N-NW coast of the Gulf of Iskenderun
is one of the major oil export ports of Eastern Mediterranean and the port area is also
susceptible to invasion of ship-borne organisms With the starting of tanker traffic in June -
2006 this site has been the highest risk area of Turkey coasts because of ship-borne species
introduction
Under Regulation A-4 of the Ballast Water Convention parties may grant exemptions to
ballast water management requirements of the ships which only operate between specified
ports or locations Vessels may hence be exempt from applying any measures as long as it
can be documented that the risk of introduction is low or acceptable The IMO Guidelines for
Risk Assessment under Regulation A-4 of the BWM Convention (G7) provide advice and
information regarding risk assessment principles methods and procedures for granting
exemptions
In this study was undertaken a ballast water risk assessment (BWRA) study according to the
IMO ndash GloBallast BWRA methodology for tanker movements between ports of tanker origin
(source ports) and Ceyhan Marine Terminal (CMT) port to determine the risk of biological
contamination between the ports for last 4- year period (June2006ndashJune2010) The
discharged ballast water amount into the İskenderun Bay and their origins was also
determined
Methodology
IMO Globallast BWRA methodology was used during the BWRA studies for CMT The BWRA
Database software was developed by GloBallast project team to provide a lsquofirst-passrsquo risk
assessment for training demonstration and evaluation purposes The database employed the
BW discharge port environmental matching and bioregion species distributionthreat data to
calculate as objectively as possible the relative risk of a harmful species introduction to a
port site as posed by discharges of BW and associated organisms that were ballasted at
each of its identified source ports [1]
The database calculates the ROR (Relative Overall Risk of a potentially harmful introduction
for all source ports that have C1-C4 coefficients and R1-R2 risk reduction factors The ROR
value for each source port represents a proportion of the threat posed to the receiver port as
result of its contemporary trading pattern Figure 1 and Figure 2 show schematic of the
GloBallast BWRA System and the Risk Coefficients respectively
179
ASSESSING OF THE BALLAST WATER RISK IN CEYHAN MARINE TERMINAL
Figure 1 Schematic of the GloBallast BWRA System [1]
The formula for calculating the relative overall risk (ROR) posed by a source port is
ROR = (C1 + [C2 x R1] + C3 + [C4 x R2]) 4
The shipping data used in the CMT-BWRA study was provided by BOTAŞ International
Limited (BIL) Designated Operator for BTC and from the Ballast Water Reporting Form
(BWRF) system between the dates 4 June 2006 ndash 04 June 2010
Environmental Similarity Analysis and Port Environmental Data (C3)
The more a BW receiver port is environmentally similar to a BW source port the greater the
change that organisms discharged with the imported BW can tolerate their new environment
and maintain sufficient numbers to grow reproduce and develop a viable population
Comparing port to port environmental similarities provides a relative measure of the risk of
organismrsquos survival establishment and potential spread The environmental distances
between the receiver port and the source port are determined using a multivariate method in
the Primer package Table 3 shows environmental parameters used for determining the
environmental similarities (C3) between two ports Totally 133 source ports were analysed to
180
OLGUN DOumlNERTAŞ AYDOumlNER GUumlMUumlŞLUumlOĞLU
identify their environmental similarities with Ceyhan Marine Terminal by using Primer
program
Figure 2 Risk Coefficients
Risk species and NIS Data for C4 Calculation
One of the BWRA objectives was to identify lsquohigh-riskrsquo species that may be transferred to
receiver port The Access database was therefore provided with tables for storing the names
distribution and other information on risk species For the purposes of the BWRA and its lsquofirst-
passrsquo risk assessment a risk species was considered to be any introduced cryptogenic or
native species that might pose a threat if transferred from a source port to a receiver port The
database manages the bioregional locations and status of each entered species using the
same bioregions displayed on the GIS world map Bioregion map provided by the Australian
Centre for Research on Introduced Marine Pests (CRIMP)
Frequency of ships discharging
BW from each Source Port
Amount discharged from each
source port
Similarity between the receiving
port and all source port
Percentage of all available risk
species in each source port
Ballast Water Storage Time
(Voyage duration)
Tank Volume
(C1) Percentage of all BW tank
discharges
(C2) Percentage of total BW volume
dischaged
(C3) Environmental matching
coefficient
(C4) Coefficient of risk species threat
(R2) Risk reduction factor for long
voyages time
(R1) Risk reduction factor for small
tank volume
181
ASSESSING OF THE BALLAST WATER RISK IN CEYHAN MARINE TERMINAL
Table 1 Port Environmental Parameters used by the Environmental Similarity Analysis
No Name Variable Type
1 Port type Categorical
2 Mean water temperature during warmest season (oC) Scalable
3 Maximum water temperature at warmest time of year (oC) ldquo
4 Mean water temperature during coolest season (oC) ldquo
5 Minimum water temperature at coolest time of year (oC) ldquo
6 Mean day-time air temperature recorded in warmest season (oC) ldquo
7 Maximum day-time air temperature recorded in warmest season (oC) ldquo
8 Mean night-time air temperature recorded in coolest season(oC) ldquo
9 Minimum night-time air temperature recorded in coolest season (oC) ldquo
10 Mean water salinity during wettest period of the year (ppt) ldquo
11 Lowest water salinity at wettest time of the year (ppt) ldquo
12 Mean water salinity during driest period of year (ppt) ldquo
13 Maximum water salinity at driest time of year (ppt) ldquo
14 Mean spring tidal range (metres) ldquo
15 Mean neap tidal Range (metres) ldquo
16 Total rainfall during driest 6 months (millimetres) ldquo
17 Total rainfall during wettest 6 months (millimetres) ldquo
18 Fewest months accounting for 75 of total annual rainfall Integer
19 Distance to nearest river mouth (kilometres) - negative value if upstream Scalable
20 Catchment size of nearest river with significant flow (square kilometres) ldquo
Logarithmic habitat-distance category - from closest BW discharge site to nearest
21 Smooth artificial wall Categorical
22 Rocky artificial wall ldquo
23 Wooden pilings ldquo
24 High tide salt marsh saline flats ldquo
25 Sand beach ldquo
26 Stony beach ldquo
27 Low tide mud flat ldquo
28 Mangroves ldquo
29 Natural rocky shore or cliff ldquo
30 Subtidal firm sands ldquo
31 Subtidal soft mud ldquo
32 Seagrass meadow ldquo
33 Rocky reef or pavement ldquo
34 Coral reef (carbonate framework) ldquo
Results
According to data obtained from the Ballast Water Reporting Forms and the shipping traffic
records 45551876 tonnes of BW were discharged to CMT between 4June2006 and
02June2010 (annual average 11300000 tonnes) from 1126 visits The majority of the BW
volume discharged to CMT area was from the Mediterranean Sea (69) which was followed
182
OLGUN DOumlNERTAŞ AYDOumlNER GUumlMUumlŞLUumlOĞLU
by North East Atlantic (11) North West Atlantic (10) and Indo-Pacific Ocean (6) The
highest BW discharge volume belongs to the Western Mediterranean Sea with ~ 14061894
tonnes (Figure 3)
Figure 3 Proportion of BW volume discharges according to the seas in the Iskenderun
Gulf (June 2006 ndash June 2010)
Risk Assessment Results
From the 1126 visit records in the database it was identified 17 of the 133 source ports as
representing the ldquohighestrdquo risk group (in terms of their BW source frequency volume
environmental similarity and assigned risk species) These ports which all were
Mediterranean provided the top 1971 of the total ROR with individual values in the 023-
019 range (Table 4) The highest risk port was led by Haifa (ROR = 023) followed by
Ashkelon with the same risk values (ROR = 023) The other highest risk ports are
AugustaPriolo Trieste Sidi Kerir Tartous and Porto Foxi (Sarroch) with 022 risk values Fos
Sur Mer Santa Panagia and Banias with 021 risk values Savona Aliaga and Porto Vecchio
with 020 risk values and Piraeus Milazzo Bizerte and Skaramanga with 019 risk values 6
ports from highest risk ports were from MED-III and MED-II bioregions in the West
Mediterranean 5 ports were from the same bioregion (MED-V) with CMT Other 6 ports were
from Mid Mediterranean
183
ASSESSING OF THE BALLAST WATER RISK IN CEYHAN MARINE TERMINAL
20 ports have been detected as high risk ports 14 ports from 20 ldquohighrdquo risk ports (1967)
were also in the Mediterranean Their ROR values are between 019 and 017 6 non-
Mediterranean ports Leixoes (France-North East Atlantic ROR 018) Cadiz and Huelva
(Spain- North East Atlantic ROR 017) and Sines (Portugal- North East Atlantic) from NEA-V
bioregion and Mohammedia (Morocco-North East Atlantic ROR 017) from WA-I bioregion
and Yosu (Korea- North West Pacific ROR 017) from NWP-3a bioregion were identified in
the high risk category
Figure 4 GIS world map outputs showing the location and categories of relative
overall risk (ROR) of the BW source ports identified for CMT
The number of BW source ports in the ldquomediumrdquo ldquolowrdquo and ldquolowestrdquo risk categories were 23
28 and 45 respectively 14 ports from 23 ldquomediumrdquo risk ports were from Mediterranean Their
ROR values are between 017 and 014 Also 3 ports from North East Atlantic 1 port from
North East Pacific 2 ports from North West Pacific and 3 ports from Indian Ocean were other
ports in the medium risk category
The 73 source ports in the ldquolowrdquo (28) and ldquolowestrdquo (45 ROR 012-02) risk categories were
generally a mixture of cool and very warm water ports plus riverbrackish ports with a wide
distribution The source port with the lowest ROR value (002) was New Orleans from United
184
OLGUN DOumlNERTAŞ AYDOumlNER GUumlMUumlŞLUumlOĞLU
States (Table 9) New Orleans is located near the river and its salinity is 0 Becancour
Quebec from Canada was also in the lowest risk categories (ROR=003) This port is also
located near the river and its salinity is 0 Most of the other lowest risk ports are also located
near the river or in the estuary The water salinity of the CMT is generally around 039
Organisms in the lower saline brackish water or fresh water taken onboard during BW
operations will not likely survive when being discharged in higher saline waters The species
introduction risk is also minimal Results from the BWRA for the CMT are shown on Figure 4
Acknowledgements
This study is a part of the project ldquoCeyhan Marine Terminal Ballast Water Risk Assessmentrdquo
conducted by TUBITAK MRC Environment Institute and supported by Baku-Tbilisi Ceyhan
Pipeline Company
REFERENCES
1 Hilliard Rob Clarke C Stevens C Polglaze J and C THayes (2003) Ballast Water Risk Assessment (Activity 31) User Guide (v14) GEFUNDPIMO Global Ballast Water Management Programme (GloBallast) for the BWRA Database GIS System
2 Olgun A Avaz G Doumlnertaş A S Aydoumlner C Bozkaya Ş Pekdemir E A Murat S Oral N
Başar E Feyzioğlu M and et al(2009) The Control and Management of Harmful Aquatic
Organisms Transported by Ballast Water Project Report TUBITAK-Marmara Research Center-
Environment Institute CcedilE0910
3 Olgun A AvazG Bozkaya Ş Aydoumlner C ve A Doumlnertaş ldquoCeyhan Marine Terminal Ballast Water Risk Assessment-3 and potential Invasive Species in İskenderun Bayrdquo Project Report CcedilE1048 15092010
185
BALLAST WATER MANAGEMENT SYSTEMS
Global RampD Forum on Ballast Water Management
ldquoCompliance monitoring and enforcement the next RampD Challengerdquo
Istanbul Turkey
26-28October 2011
Closing remarks by Mr Jo Espinoza-Ferrey
Director Marine Environment Division IMO
Colleagues and friends
Ladies and Gentlemen
As we conclude this fourth IMO-GloBallast RampD Forum on Ballast Water Management we
can look back at a very successful event designed to let us all take stock of where we are
today in terms of our capacity to monitor and enforce compliance with the Ballast Water
Management Convention and if the current RampD efforts are sufficient and also in alignment
with what is needed
It has been a very busy week with activities spanning the entire ballast water management
field The test facilities met first and came ever closer to the signing of an MOU on the
establishment of the GloBalTestNet Through their commitment to improve and harmonize the
testing and reporting of ballast water treatment technologies the worldrsquos test facilities are
showing leadership and vision and we should all encourage them to continue their efforts
towards a global network which will be extremely valuable not only to the test facilities
themselves but also to those who will buy the systems as well as the wider ballast water
management community
Next we had the Shipbuildersrsquo Forum This was an opportunity for dialogue among a wide
range of stakeholders and I hope this exchange of ideas continues long after this weekrsquos
activities The future entry into force of the Convention puts great responsibility on the ship
186
owners shipbuilders and ship repair yards and dialogue amongst them will be crucial in
meeting the deadlines for installation and retrofitting of technologies onboard ships
Over the last three days the RampD Forum itself saw cutting-edge presentations and
challenging discussions We have heard about technical and regulatory aspects of
compliance monitoring and enforcement and various ideas on how to meet the challenge In
addition we were able to appreciate the progress that has been made in the continuous
development of ballast water treatment systems
I am sure that the stimulating discussions and cooperative spirit of this week will continue
even after we have reluctantly left the beautiful city of Istanbul and returned to our respective
countries We have all learnt a great deal both in terms of developing solutions to treat
ballast water but also when it comes to testing verifying and monitoring compliance with the
Convention
This Forum in the series of IMO-GloBallast RampD conferences on Ballast Water Management
also illustrated another important fact that continuous innovation and collaborative RampD
efforts have been and will continue to be instrumental to the success of the global efforts to
address marine biosafety issues in general and ballast water issues specifically It has
therefore been very encouraging to see that all of you ndash representing the majority of the
worldrsquos expertise on Ballast Water Management from the shipping industry academia and
Administrations ndash chose to come to Istanbul for this our Forum your Forum This is a great
vote of confidence for our joint determination to meet the challenges ahead of us and it
shows what we can accomplish in the maritime sector when we work together towards a
common goal
This RampD Forum could not have come at a better time IMO has been actively seeking a
solution to the ballast water issue since the late 1980s mdash first through the adoption of
voluntary guidelines and later through the adoption of the Convention in February 2004 As
you know we have already met the requirements for the Conventionrsquos entry into force when it
comes to the number of contracting Parties I sincerely hope it will not be long until we also
187
meet the tonnage criteria 35 of the worldrsquos merchant tonnage after which the Convention
will enter into force within twelve months
But regardless of when that happens this will not be an end-point The work of IMO continues
through our committees and sub-committees our Integrated Technical Cooperation
Programme the Biosafety Section of the Secretariat itself as well as the GloBallast
Programme and the Global Industry Alliance A Convention is a living instrument and we will
continue to work with our Member States intergovernmental and non-governmental
organizations and all our other partners to ensure that the transfer of invasive alien species
through the pathway of ships is reduced and ultimately eliminated In this respect you may
know that the Organization is also pursuing the other vector for transferring invasive species
by ships ndash hull fouling In fact as a first but significant step the latest meeting of the Marine
Environment Protection Committee held at IMO in July this year adopted the 2011
Guidelines for the control and management of ships biofouling to minimize the transfer of
invasive aquatic species
Ladies and Gentlemen allow me to conclude by thanking those that have been involved in
the lead up to and coordination of this very busy week of activities and I know that you are
many Preparations for the various activities started almost a year ago and since then a
number of people in several organisations have worked together to make sure that it came to
fruition
First and foremost allow me to thank our hosts the Government of the Republic of Turkey
for having the vision to embrace this extremely important and timely Forum I would in
particular single out the Turkish Prime Ministryrsquos Undersecretariat for Maritime Affairs and the
Scientific and Technological Research Council of Turkey for the coordination of all of the
events for making all the logistical arrangements and for their very generous hospitality In
this regard special mention should be made of Mr Murat Korccedilak from the Undersecretariat
for Maritime Affairs and Dr Arzu Olgun and Dr Oumlzen Arlı from TUBITAK for their
outstanding and relentless dedication during the preparations Thank you very much and our
188
thanks go also to all of your colleagues who have been involved in the preparations for this
week
I would also like to thank our other partners in this weekrsquos events mdash the International
Chamber of Shipping and the Institute for Marine Engineering Science and Technology for
their support during the organization and promotion of these activities
I cannot close without thanking my colleagues in the Marine Environment Division of IMO for
their hard work ndash the GloBallast Partnerships Project Coordination Unit with Jose Matheickal
Fredrik Haag and AichaCherif as well as DanduPughiuc and the Biosafety Section I know
that they have been working on the preparations for this weekrsquos activities for a long time and
I am sure that they are extremely pleased to see the excellent fruit of all this work during this
highly successful week
Ladies and Gentlemen
As I now officially close this Forum my final vote of thanks goes to all of you who made the
effort to join us here in Istanbul this week ndash fellow participants exhibitors presenters and
keynote speakers Allow me once again to commend your dedication to the ballast water
management issue and the fight against the transfer of harmful aquatic organisms and
pathogens Your efforts your resourcefulness and your determination to find solutions to this
threat against the worldrsquos oceans and seas have shown what is possible to accomplish when
we all work together Let us keep up these efforts in the months to come so that we are ready
when the Convention enters into force
With that I would like to acknowledge all of you for your active participation in the RampD Forum
and the pre-conference workshops I look forward to seeing you at the next RampD Forum and I
wish you all a safe trip home
189
THE SCIENTIFIC AND TECHNOLOGICAL RESEARCH COUNCIL OF TURKEY
MARMARA RESEARCH CENTER
(TUBITAK - MRC)
TUBITAK-The Scientific and Technological Research Council of Turkey is the leading agency
for management funding and conduct of research in Turkey It was established in 1963 with a
mission to advance science and technology conduct research and support Turkish
researchers
It was established in 1963 with a mission to advance science and technology conduct
research and support Turkish researchers TUumlBİTAK is responsible for promoting
developing organizing conducting and coordinating research and development in line with
national targets and priorities
More than 1500 researchers work in 15 different research institutes of TUumlBİTAK where
contract research as well as targeted and nation-wide research is conducted
Marmara Research Center (MRC) was found in 1968 under the fold of TUBITAK and its
activities started in 1972 MRC has a proven record of supplying technical assistance to
industry and local government on many different levels Originally intended as a platform to
allow Turkish industry access to current technology and applications the Center has
expanded to a level where internationally accredited research and development is routunily
undertaken The accumulated knowledge and experience base together with the extensive
facilities available within the Center are made accessible to clients under one of several
possible research and collaboration schemes The multi-disciplinary nature of the Center
provides a breadth of coverage of scientific skill unmatched by many other oganizations
191
GloBallast Partnerships
Following the success of the original Global Ballast Water Management Project
known as lsquoGloBallastrsquo The International maritime Organization (IMO) has again
joined forces with the Global Environment Facility (GEF) the United Nations
Development Programme (UNDP) Member Governments and the shipping
industry to implement a five-year follow-up project to sustain the global
momentum in tackling the ballast water problem and to catalyze innovative global
partnerships to develop solutions
The main aim of GloBallast Partnerships (GBP) is to assist developing countries to reduce the
risk of aquatic bio-invasions mediated by shipsrsquo ballast water and sediments The project is
being implemented by UNDP and executed by IMO under the GEF International Waters
portfolio using a multicomponent multi-tiered approach involving global regional and
country-specific partners representing government industry and non-governmental
organizations (NGOs)
bull A global component managed through a Programme Coordination Unit at IMO in
London providing inter national coordination and information dissemination
including the development of tool - kits and guidelines and establishing a strong co-
operation with industry and NGOs
bull A regional component providing regional coordination and harmonization
information sharing training and capacity building in the application of ballast water
management tools and guidelines
bull A significant country component to initiate legal policy and institutional reforms to
address the issue and to implement the International Convention for the Control and
Management of Shipsrsquo Ballast Water and Sediments In fact 13 countries from 5
high priority regions are taking a lead partnering role focusing especially on legal
policy and institutional reform All told more than 70 countries in 14 regions across
the globe are directly or indirectly participating and benefiting from the Project
193
The International Maritime Organization (IMO)
The International Maritime Organization (IMO) is the specialized agency of the United Nations
with responsibility for ensuring that lives at sea are not put at risk and that the environment is
not polluted by international shipping The Convention establishing IMO was adopted in 1948
and IMO first met in 1959 IMOrsquos 168 member States use IMO to develop and maintain a
comprehensive regulatory framework for shipping IMO has adopted more than 50
Conventions covering safety environmental concerns legal matters technical co-operation
maritime security and the efficiency of shipping IMOrsquos main Conventions are applicable to
almost 100 of all merchant ships engaged in international trade
For more information about IMO please contact us or refer to our website below
International Maritime Organization
4 Albert Embankment
London SE1 7SR
United Kingdom
Tel +44 (0)20 7735 7611
Fax +44 (0)20 7587 3210
Email infoimoorg
Web wwwimoorg
195
Undersecretariat for Maritime Affairs
UMA-Turkish Prime Ministry Undersecretariat for Maritime Affairs is the maritime
administration that is responsible for establishing ballast water management issues for
Turkey