Embed Size (px)
Citation preview

Chateau the Bali (Ungasan) Resort Development Project
Feasibility Review Report
2009.8.17
Strictly Private and Confidential
Stric
tlyPr
iva
tea
nd
Co
nfid
en
tial

Samil PricewaterhouseCoopers is the Korean member firm of PricewaterhouseCoopers. “PricewaterhouseCoopers” refers to the
network of member firms of PricewaterhouseCoopers International Limited, each of which is a separate and independent legalentity.
www.samil.comLS Yongsan Tower191 Hangangno 2-ga, Yongsan-guSeoul 140-702, KOREA(Yongsan P.O. Box 266, 140-600)
A member firm of
SAMIL : FG0-09-
TO : PT. Chateau The Bali
Re: Feasibility Review Report August 17, 2009
In accordance with our engagement letter dated June 2009, Samil PricewaterhouseCoopers
have attached our report on the feasibility review of Chateau The Bali project. For this feasibility
study, we have reviewed profitability of the cash flow for the project.
Future cash flows are estimated based on the company’s business plan. We do not provide any
assurance on the results of this estimation. Our work was performed in limited time and based
primarily on information provided by the Company. We accept no responsibility for accuracy of
the information we used. Actual results can be different from shown in this report as
circumstances do not occur as expected.
We make no representation regarding the sufficiency of our work either for purposes for which
this report has been requested or for any other purpose. The sufficiency of the work we
performed is solely the responsibility of the Company. Had we been requested to perform
additional work, additional matters might have come to our attention that would have been
reported to you.
This report is solely for your use in connection with internal decision making with the Chateau
The Bali Pool Villa Resort Development Project, and it is not to be used for any other purpose or
to be copied or distributed or otherwise made available or referred to, in whole or in part, to any
other party without our prior written consent. We do not accept any liability or responsibility to
any third party to whom our report is shown or into whose hands it may come (Except for the
related third party, set out in our engagement).
[DC2]

Should you require clarification of any of the matters contained in our report, please contact
CPA & Partner Seo, Jun-sub (TEL: 02- 709-0758).
Sincerely yours,
Samil PricewaterhouseCoopers
Strictly Private and Confidential
1
[DC2]
Table of Content
Page
Ⅰ. Work Scope & Limitation···················································································2
Ⅱ. Project Status·····································································································3
1. Project Overview ···················································································································3
2. Project Site ··························································································································12
3. SWOT Analysis····················································································································13
4. Developer of the Project ······································································································15
5. Appraised Value of the Related Land/Building of the Project··············································16
6. Presale Plan ························································································································17
Ⅲ. Market Status and Outlook ··············································································26
1. Indonesia’s Economy ··········································································································26
2. Tourism Status of Bali ··········································································································28
3. Analysis of Similar Resorts ··································································································31
Ⅳ. Income & Cash Flow Analysis·········································································35
1. Presale Estimation···············································································································35
2. Estimation of Revenue from Room Sales ···········································································37
3. Estimation of Operating Expense························································································40
4. Operating Cash Flow Estimation·························································································45
5. Cumulative Cash Flow Projection ·······················································································49
Ⅴ. Risk Factors and Solutions for the Project ····················································52

Strictly Private and Confidential
2
[DC2]
Ⅰ. Work Scope & Limitation
This review was performed based primarily on information provided by the Company and the
disclosed data from international and local research institutions, including securities
companies. We were not engaged to test the accuracy or reasonableness of the data we used,
and we do not accept responsibility for such information. Moreover, we do not accept any
responsibility of inaccurate valuation results caused from inaccurate data.
We performed this review based on the agreed upon procedures with the disclosed information
from international and local research institutions, including securities companies, governments,
and the historical data of the Company. Please note that the estimation performed in this report
is based on the assumptions. Because events and circumstances frequently do not occur as
expected, there might be differences between predicted and actual results, and those
differences may be material. Also, please note that our report is dependent on the continuing
validity of the assumptions on which it is based.
Valuation is solely performed based on the information of the Company, the target company
information from the Company, and disclosed information from the local and international
financial and research institutions. Moreover, as of the date that the review was performed, the
hotel and pool villa resort development project has NOT been executed, and this review was
performed based on the assumption that the project will take place as it has been planned.
Please note that if there are any changes in the business plan, the estimated values can be
materially different from the ones in this report.
This report is solely for your use in connection with internal decision making, and it is not to be
used for any other purpose or to be copied or distributed or otherwise made available or
referred to, in whole or in part, to any other party without our prior written consent. We do not
accept any liability or responsibility to any third party to whom our report is shown or into whose
hands it may come (Except for the related third party, set out in our engagement).

Strictly Private and Confidential
3
[DC2]
Ⅱ. Project Status
1. Project Overview
The resort will be constructed and presold with the goal of becoming the most luxurious pool
villa resort in Bali with Therapy-oriented Spa and 96 units of high-end private pool villas.
The resort will be comprised of various facilities, including Therapy Spa, Business Centers,
Restaurants, a Putting Ground, and an Aqua Gym. The resort will be the first therapy spa-
oriented resort in Indonesia
General overview of the project is as follows.
[Table] Project Overview
Type Content
Location Jl. Pura Masuka Tunjung Br. Kertha Lestari Kuta Selatan Badung, Bali, 80363
Indonesia(20 minutes from Denpasar airport, 30 minites from Kuta
downtown)
Total Area 78,540㎡
Rooms - 96 Units of Therapy Spa-oriented Private Pool Villa
Type Room Type Number of Units
1 BED 45 Units
2 BED 7 Units
3 BED 42 UnitsPOOL VILLA
4 BED 2 Units
Total 96 Units
Other
Facilities
Business Center, Restaurant, Therapy Spa, Mega size Pool, Kids Pool,
Promenade, Putting Ground, Medical facilities, Aqua Gym, Private Beach,
Tennis Court, Wine Cave, Bar, Private Pool, and Private Sauna
Note - Grand Opening in Oct. 2009
- Pre-opening(Preparation of Grand Opening) in Aug. 2009
[Source] The Company’s Business Plan
Strictly Private and Confidential
4
[DC2]
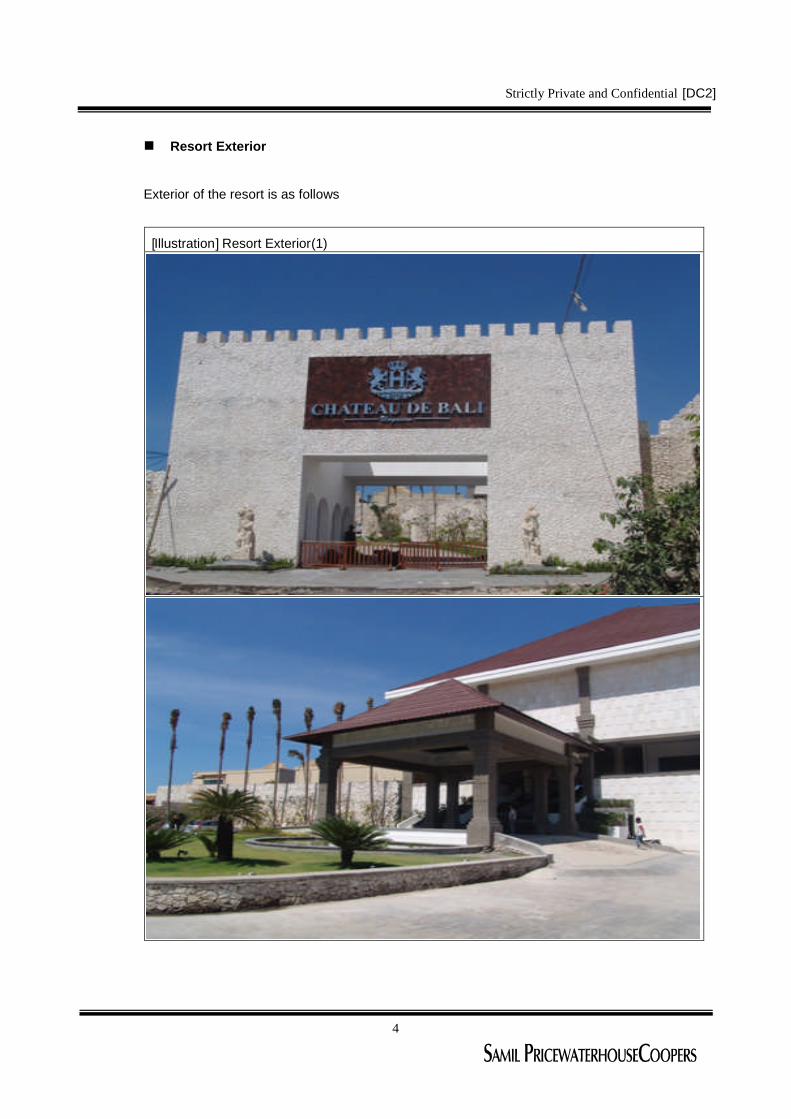
Resort Exterior
Exterior of the resort is as follows
[Illustration] Resort Exterior(1)

Strictly Private and Confidential
5
[DC2]
[Illustration] Resort Exterior(2)

Strictly Private and Confidential
6
[DC2]
[Illustration] Resort Exterior(3)

Strictly Private and Confidential
7
[DC2]
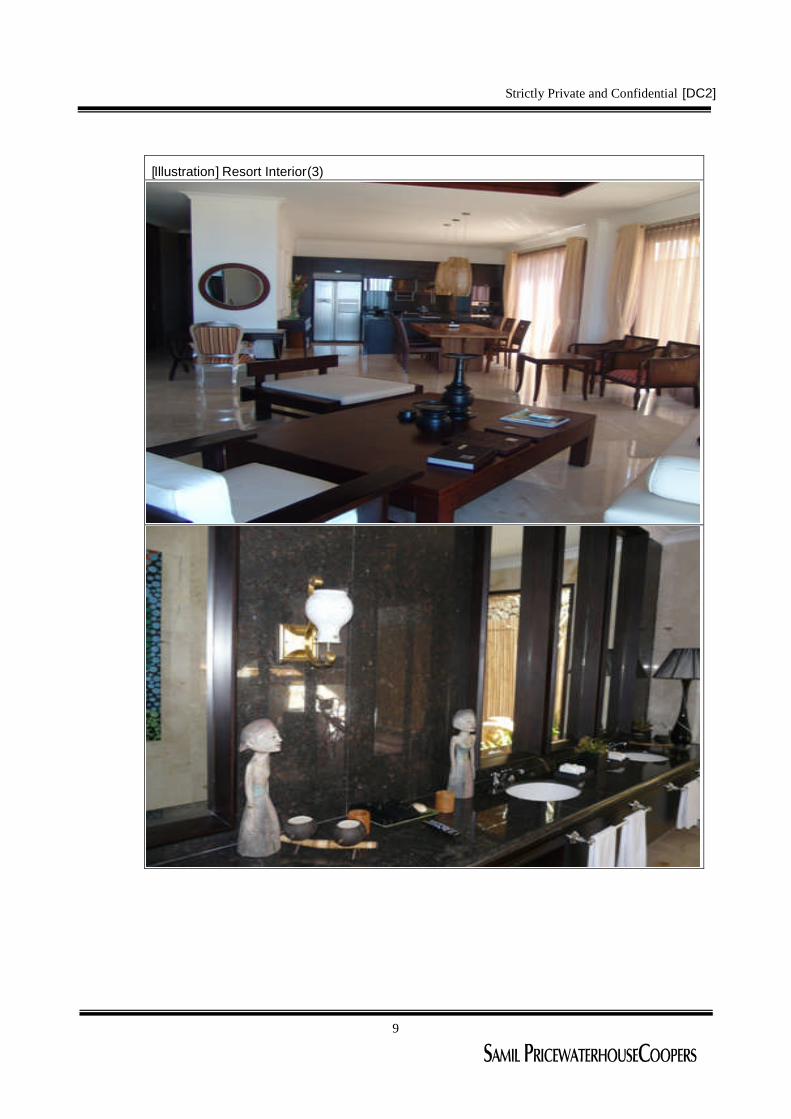
Resort Interior
Interior of the resort is as follows
[Illustration] Resort Interior(1)

Strictly Private and Confidential
8
[DC2]
[Illustration] Resort Interior(2)
Strictly Private and Confidential
9
[DC2]
[Illustration] Resort Interior(3)

Strictly Private and Confidential
10
[DC2]
Unit Exterior
Exterior of the unit is as follows.
[Illustration] Unit Exterior(1)

Strictly Private and Confidential
11
[DC2]
[Illustration] Unit Exterior(2)

Strictly Private and Confidential
12
[DC2]
2. Project Site
Bali, where the project site is located, is called as ‘The Last World of God’(aka. The Paradise
of Earth) as it possesses intact nature, and it is located south of Java Sea, north of Indian
Ocean, and is on the boarder of Lombok.
The area of Bali is 563,286km, and the population of 3.15 million resides (mostly working in
tourism and farming industry) in the island. Bali has the best weather for young people who
enjoy marine sports and old generation who prefer relaxation as it has both dry and raining
seasons and has relatively small amount of annual rainfall. Indonesian government developed
and is still developing the whole island as the tourists’site, and recently various types of villas
are developed. Moreover, almost all airlines from the world travel to Bali island, providing easy
accessibility for all generation from everywhere.
Site Analysis
The project site (Ungasan) is located in the southern Bali and is about 20 minutes away from
Denpasar Airport, and has easy accessibility (20 minutes) from Kuta downtown.
As Ungasan possesses beautiful sceneries, world-class resorts, such as Karma and Banyan
Tree, are developing their resorts in this region. Moreover, Bali is constructing a circular road
and the value of the real estate in the area continues to increase, making this area as the best
investment option.
Furthermore, as all villa units are constructed at the sea level of 70m and 1.26 km away from
the Indian Ocean in a staircase form, beautiful sea and sceneries can be experienced.

Strictly Private and Confidential
13
[DC2]
Geographical location for the project is as follows.
[Illustration] Project Site
3. SWOT Analysis
SWOT Analysis of the Project Site is as follows.
Strengths
The Biggest in Size + The Most Luxurious Facility + The Best Service
As the resort is managed by Korean, it can satisfy the needs of Korean Customers
Possesses the Know-How of managing Pool Villa as Dreamland Pool Villa resort was and
still is managing by the same management
The region is famous for new luxurious pool villa complex (Chateau the Bali, Karma,
Banyan Tree, etc)
Weaknesses
Low Brand Recognition as it is relative new
Too many hotels in Bali
Instability of the real estate market in Indonesia
Opportunities

Strictly Private and Confidential
14
[DC2]
Bali is considered as one of the Best Resting Place
Increased demand of high-end pool villas
Rapidly increasing pool villa demands from Korean tourists
Continuous interests from Japanese and Australia tourists
Increased number of Korean flights to Bali
Stricter restriction of Hotels in Bali (Higher Barrier of Entry in Hotel Industry)
Threats
Lack of Pool Villa awareness in Korea
Low Hotel rate from old and less luxurious hotels
Reduced number of tourists due to the economy
The Company plans to take following actions to minimize the effects from its Weaknesses and
Threats from the SWOT analysis.
Action Plan for Weaknesses
Introduce well-known brands
Appoint global marketing & presale agencies
Contract Long term lease with the condition of transferring the land ownership when it is
allowed to foreigner
Action Plan for Threats
Plans to expand the target market from Korea to worldwide
Plans to target high-end market
Develop luxurious facilities and its operating programs
Strictly Private and Confidential
15
[DC2]
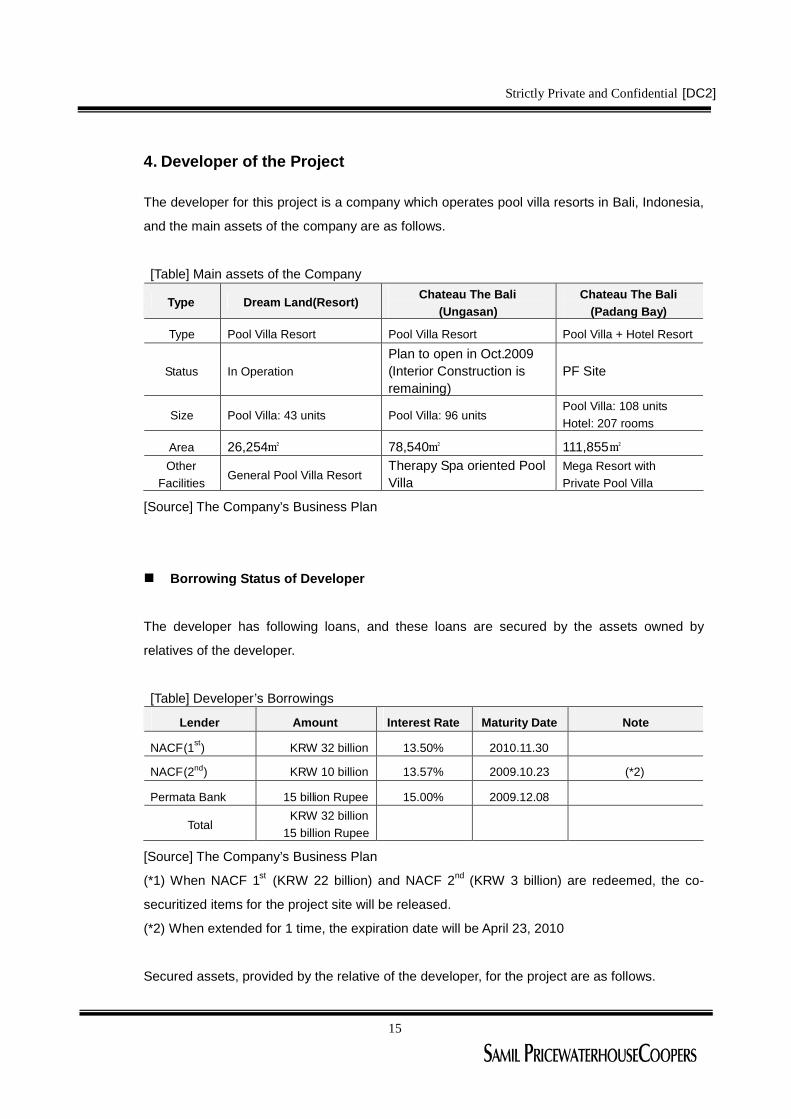
4. Developer of the Project
The developer for this project is a company which operates pool villa resorts in Bali, Indonesia,
and the main assets of the company are as follows.
[Table] Main assets of the Company
Type Dream Land(Resort)Chateau The Bali
(Ungasan)Chateau The Bali
(Padang Bay)
Type Pool Villa Resort Pool Villa Resort Pool Villa + Hotel Resort
Status In OperationPlan to open in Oct.2009(Interior Construction isremaining)
PF Site
Size Pool Villa: 43 units Pool Villa: 96 unitsPool Villa: 108 unitsHotel: 207 rooms
Area 26,254㎡ 78,540㎡ 111,855㎡Other
FacilitiesGeneral Pool Villa Resort
Therapy Spa oriented PoolVilla
Mega Resort withPrivate Pool Villa
[Source] The Company’s Business Plan
Borrowing Status of Developer
The developer has following loans, and these loans are secured by the assets owned by
relatives of the developer.
[Table] Developer’s Borrowings
Lender Amount Interest Rate Maturity Date Note
NACF(1st) KRW 32 billion 13.50% 2010.11.30
NACF(2nd) KRW 10 billion 13.57% 2009.10.23 (*2)
Permata Bank 15 billion Rupee 15.00% 2009.12.08
TotalKRW 32 billion
15 billion Rupee
[Source] The Company’s Business Plan
(*1) When NACF 1st (KRW 22 billion) and NACF 2nd (KRW 3 billion) are redeemed, the co-
securitized items for the project site will be released.
(*2) When extended for 1 time, the expiration date will be April 23, 2010
Secured assets, provided by the relative of the developer, for the project are as follows.

Strictly Private and Confidential
16
[DC2]
[Table] Secured AssetsSecured Assets Provider(*1) Borrowing
AmountLender Note
Project Site(Padang Bay)
Nyoman Sedana 6 lots
Furniture Factory 1 PT. SEAWON CorpRelated Party with
Developer
Furniture Factory 2 PT. Korin Istana CorpRelated Party with
Developer
Other Land(Ungasan)
Nyoman Sedana
KRW 32 billion NACF
7 lots
Dreamland (Resort)Kadek Eraniti and 2others KRW 10 billion NACF
Land (Nusa Dua) Kadek Eraniti 4 lots
Land (Dreamland) Nyoman Sedana 1 lots
Land (Ungasan) Nyoman Sedana
15 billion RupeePermata
Bank2 lots
[Source] The Company’s Business Plan
(*) All secured assets are owned by the developer’s wife and relatives.
5. Appraised Value of the Related Land/Building of the Project
The appraised values of the assets of the Company for this project are as follows.
[Table] Appraised Value (in thousands of USD, except otherwise noted)
Secured Asset AppraisalDate
AppraisedValue
Appraiser Note
2008-09-10 24,000 hari utomo & rekanLoan from Bank for
IPODreamlandResort
2009-04-07KRW 25
billionKaram DongkukAppraiser
When fundingNACF1st fund 10 bil(Request Financial
Lender)
2009-04-16 74,568 CBRE/KJPP YUHALWhen Sold to
Geecoinc(Request to Buyer)
2009-05-00 70,000Mirae & SaehanAppraiser
"Chateau The Bali(Ungasan)
2008-09-10 82,000 hari utomo & rekanLoan from Bank for
IPO
Project Site(Padang Bay)
2009-06-26 39,203(*1) hari utomo & rekan "
Strictly Private and Confidential
17
[DC2]
(Source) Appraisal Report from Appraiser
(*1) The median value of the exchange rate of 2009.5.31 by the central bank of Indonesia was
applied (Selling Rate: 10,392 rupee/USD, Buying Rate: 10,288 rupee/USD, Median Rate:
10,340 rupee/USD).
.
6. Presale Plan
1) Presale Plan
Except for the hotel, all rooms, including Pool Villa, will be presold to Koreans and foreign
investors, and the detail presale plan is as follows.
Presale Plan: Koreans
Presale agency contract will be signed with Geecoinc, a foreign-oriented real estate agency in
Korea, and it will perform marketing activities, including advertisings, presentations, and
conferences, targeting VVIP in Korea.
Presale Plan: Foreign Investors
The presale plan will be prepared based on the nations.
Indonesia: Plans to collaborate with Exotiq, an Indonesian agency, targeting wealthy
Indonesians and foreigners who reside in Indonesia
Japan: Plans to proceed the presale by collaborating with local travel and real estate
agencies in Osaka and Nagoya
Russia & Kazakhstan, etc: Plans to proceed the presale by allocating units to Absolte, a
Kazakhstan agency, and Bali Villa Bella, a Russian agency
Singapore & Hong Kong, etc: Plans to proceed the presale by signing sales contract with
Savills, a Singapore agency, and Midland, a Hong Kong agency, targeting wealthy
individuals in Southeast Asia and Europe

Strictly Private and Confidential
18
[DC2]
[Table] Presale County & Agency
Country Presale Agency
Korea Geecoinc
Indonesia Exotiq
Japan Travel & Real Estate Agencies in Osaka &Nagoya
CIS – Kazakhstan, etc Absolute
Russia Bali Villa Bella
Singapore Savills
Foreign
Hong Kong Midland
(Source) The Company’s Business Plan
2) Presale Value
The Pool Villa will be presold at the following rates.
[Table] Expected Presale Value of Pool Villa by Room type (in USD)Size
Room TypeLand Building(*1)
# of UnitPresaleValue
PresaleAmount
4 Bedroom 1,400.00㎡ 865.76㎡ 1 3,420,000 3,420,000
1,050.00㎡ 678.21㎡ 1 2,680,000 2,680,000
4 Bedroom - Subtotal 2 6,100,000
3 Bedroom 810.00㎡ 522.61㎡ 8 1,980,000 15,840,000
690.00㎡ 522.61㎡ 6 1,830,000 10,980,000
600.00㎡ 473.66㎡ 22 1,580,000 34,760,000
440.00㎡ 323.94㎡ 2 1,180,000 2,360,000
420.00㎡ 322.38㎡ 3 1,080,000 3,240,000
400.00㎡ 307.53㎡ 1 1,030,000 1,030,000
3 Bedroom – Subtotal 42 68,210,000
2 Bedroom 400.00㎡ 307.53㎡ 7 990,000 6,930,000
2 Bedroom – Subtotal 7 6,930,000
1 Bedroom 280.00㎡ 183.12㎡ 34 550,000 18,700,000
266.00㎡ 183.12㎡ 11 530,000 5,830,000
1 Bedroom – Subtotal 45 24,530,000
Total 96 105,770,000

Strictly Private and Confidential
19
[DC2]
(Source) The Company’s Business Plan
(*1) Areas of other facilities are included in the building size in accordance with Indonesian
regulation.
The presale values for Chateau The Bali (Ungasan) are little lower than the similar resorts in
the market. However, as the location and facilities of the Chateau The Bali (Ungasan) is more
advanced and better than the ones nearby, it is reasonable to believe that the units can be
presold at the value that the Company provided.
Above presale value can be compared with competitors’ in near site as follows. C151 3
Bedroom was sold at USD 550,000 in 2006, and it was traded at USD 700,000 in 2008.
Moreover, two units of One Bedroom and one unit of Two Bedroom in Chateau The Bali
(Ungasan) were presold at USD 550,000 and USD 750,000 in 2008, respectively. Presale of
these units to Korean investors was suspended as exchange rate fluctuation was extreme in
the 2H of 2008.
3) Presale Value Comparison with Similar Facilities
Banyan Tree
The presale value per land area of Banyan Tree is 35%~98% higher than the Chateau the Bali,
and the presale value per constructed area (㎡) is 74%~124% higher than the Chateau the Bali.
[Table] Banyan Tree Presale Value
Area(㎡) Presale Valueper ㎡ (US$)
PresalePeriod Type
Land Building
PresaleValue(US$) Land Building
1 Bed 403㎡ 239㎡ 1,236,568 3,068 5,174
2 Bed 565㎡ 315㎡ 1,886,909 3,340 5,9902007.02
3 Bed 1,200㎡ 680㎡ 4,333,333 3,611 6,373
1 Bed 403㎡ 239㎡ 1,593,500 3,954 6,667
2 Bed 565㎡ 315㎡ 2,121,000 3,754 6,7332009.08
3 Bed 1,200㎡ 680㎡ 4,600,000 3,833 6,765

Strictly Private and Confidential
20
[DC2]
Karma Kandara
Karma Kandara is partially operating (still in construction phase), and they do not have 1 Bed
and 2 Bed units. Also, Karma Kandara does not disclose presale information on 4 Bed
(Construction area: 358㎡) and 5 Bed(Construction area 822㎡) units.
[Table] Karma Kandara Presale Value
Area(㎡) Presale Valueper ㎡ (US$)
PresalePeriod Type
Land Building
PresaleValue(US$) Land Building
2007.02 3 Bed - 328㎡ 907,000 - 2,765
2009.08 3 Bed - 328㎡ 1,200,000 - 3,659
LivBali
The presale value per land area of LivBali is 35%~41% lower than the Chateau the Bali, and
the presale value per constructed area (㎡) is 24%~54% lower than the Chateau the Bali.
[Table] LivBali Presale Value
Area(㎡)Presale Valueper ㎡ (US$)Presale
PeriodType
Land Building
PresaleValue(US$) Land Building
1 Bed 270㎡ 257㎡ 350,000 1,296 1,362
2 Bed 353㎡ 218㎡ 530,000 1,501 2,4312009.09
3 Bed 435㎡ 305㎡ 670,000 1,540 2,197
Rama Chandra Villa
The presale value per land area of Rama Chandra Villa is 14%~138% higher than the Chateau
the Bali, and the presale value per constructed area (㎡) is 97% higher than the Chateau the
Bali.

Strictly Private and Confidential
21
[DC2]
[Table] Rama Chandra Villa Value
Area(㎡) Presale Valueper ㎡ (US$)
PresalePeriod Type
Land Building
PresaleValue(US$) Land Building
2 Bed 390㎡ 368㎡ 1,100,000 2,821 2,989
3 Bed 566㎡ 419㎡ 2,850,000 5,035 6,802NA
4 Bed 591㎡ 527㎡ 3,500,000 5,922 6,641
4) Presale Condition
Presale Condition for the Pool Villa is as follows.
[Table] Presale Condition
Type Presale Condition
Location Ungasan, Bali
Opening Date Oct. 2009
Construction 92% Completed
Payment Schedule for
Presale
Signing : USD 5,000
Contract date: 30% / Within one month from signing date
1st installment : 30% / Within one month from contract date
2nd installment : 30% / Within one month from 1st installment
Remaining : 10% / Within one month from 2nd installment
Operating Profit
Distribution Condition
8% of designated profit for 2 years
Distributes 40% of profits from Room Sales
21 days free accommodation for a year (Apply to Dreamland
and Padang Bay Resort)
Owner Ship Type One of below three options
HGM(PMA)
SHM(nominee)
Long term lease(Maximum period: 80 years)
* Ownership will be transferred when owning the land by foreigners
is allowed.
Maintenance Fee $25 x Villa unit ㎡ (Year) -> Water & Electricity included
Note 96unit are planed to be presold / Presale Completed: 3unit (3%)
(Source) The Company’s Business Plan

Strictly Private and Confidential
22
[DC2]
Presale condition comparison with similar facilities in near site is as follows.
Banyan Tree
[Table] Banyan Tree Presale Condition
Type Presale Condition
Location Ungasan, Bali
Opening Date Nov. 2009
Construction 90% Completed, Pavement and Interior remaining
Started construction in Feb. 2007
Payment Schedule for
Presale
Signing : USD 10,000
Contract : 30% / Within one month from signing date
1st Installment : 30% / Within one month from contract date
2nd Installment : 30% / Within one month from 1st installment
Remaining : 10% / Within one month from 2nd installment
* If paid in full when contracting, the signing will be returned
Operating Profit
Distribution Condition
8% of designated profit for 2 years
Distributes 40% of profits from Room Sales
21 days free accommodation for a year (Apply to all Banyan
Tree resort)
Ownership Type One of below three options
HGB(PMA)
SHM(nominee)
Long term lease(50yrs)
Maintenance Fee Maintenance fee : X
sink fund: $2 x Villa Building Area(Monthly)
Note 50units out of 73 units are planned to be presold / Presale
completed: 30unit (60%)
(Source) Presale Catalog of Banyan Tree

Strictly Private and Confidential
23
[DC2]
Karma Kandara
[Table] Karma Kandara Presale Condition
Type Presale Condition
Location Ungasan, Bali
Opening Date March 2008
Construction In Operation (20units are in construction: 85% completed)
Payment Schedule for
Presale
Signing : USD 10,000
Contract : 30% / Within one month from signing date
1st Installment : 30% / Within one month from contract date
2nd Installment : 30% / Within one month from 1st installment
Remaining : 10% / Within one month from 2nd installment
Operating Profit
Distribution Condition
5% of designated profit for 2 years
Distributes 40% of profits from Room Sales
28 days free accommodation for a year (Apply to all Karma
resorts)
Ownership Type One of below three options
HGB(PMA)
SHM(nominee)
Long term lease(50yrs)
Maintenance Fee Maintenance fee : USD 7,600 (Year)
Note 45 out of 46 units are presold 45unit (97%)
(Source) Presale Catalog of Karma Kandara

Strictly Private and Confidential
24
[DC2]
LivBali
[Table] LivBali Presale Condition
Type Presale Condition
Location Jimbaran, Bali
Opening Date Dec 2009
Construction 80% completed
Payment Schedule for
Presale
Signing : USD 6,000
Contract : 30% / Within one month from signing date
1st Installment : 30% / When construction is 30% completed
2nd Installment : 30% / When construction is 60% completed
Remaining : 10% / When construction is completed
Operating Profit
Distribution Condition
Distributes 40% of profits from Room Sales
21 days free accommodation for a year
Ownership Type One of below three options
HGB(PMA)
SHM(nominee)
Long term lease(50yrs)
Maintenance Fee Maintenance fee : USD 4,000 (Year)
Note 23 out of 28 units are presold (82%)
(Source) Presale Catalog of LivBali

Strictly Private and Confidential
25
[DC2]
Rama Chandra Villa
[Table] Rama Chandra Villa Presale Condition
Type Presale Condition
Location Ungasan, Bali
Opening Date TBD
Construction -
Payment Schedule for
Presale
Signing: USD 10,000
Contract : 30% / When Contracted
1st Installment : 20% / 2 month from the contract date and when
30% construction is completed
2nd Installment : 20% / Within 2 month from the 1st installment
and when 50% construction is completed
3rd Installment: 20% / Within 2 month from the 2nd installment
and when 70% construction is completed
4th Installment : 7% / When Construction is completed and when
move in
Remaining : 3% / Within 12 months from move in date
Operating Profit
Distribution Condition
Distributes 40% of profits from Room Sales
Ownership Type One of below three options
HGB(PMA)
SHM(nominee)
Long term lease(50yrs)
Maintenance Fee -
Note 23 out of 40 units are presold (58%)
(Source) Presale Catalog of Rama Chandra Villa
Strictly Private and Confidential
26
[DC2]
Ⅲ. Market Status and Outlook
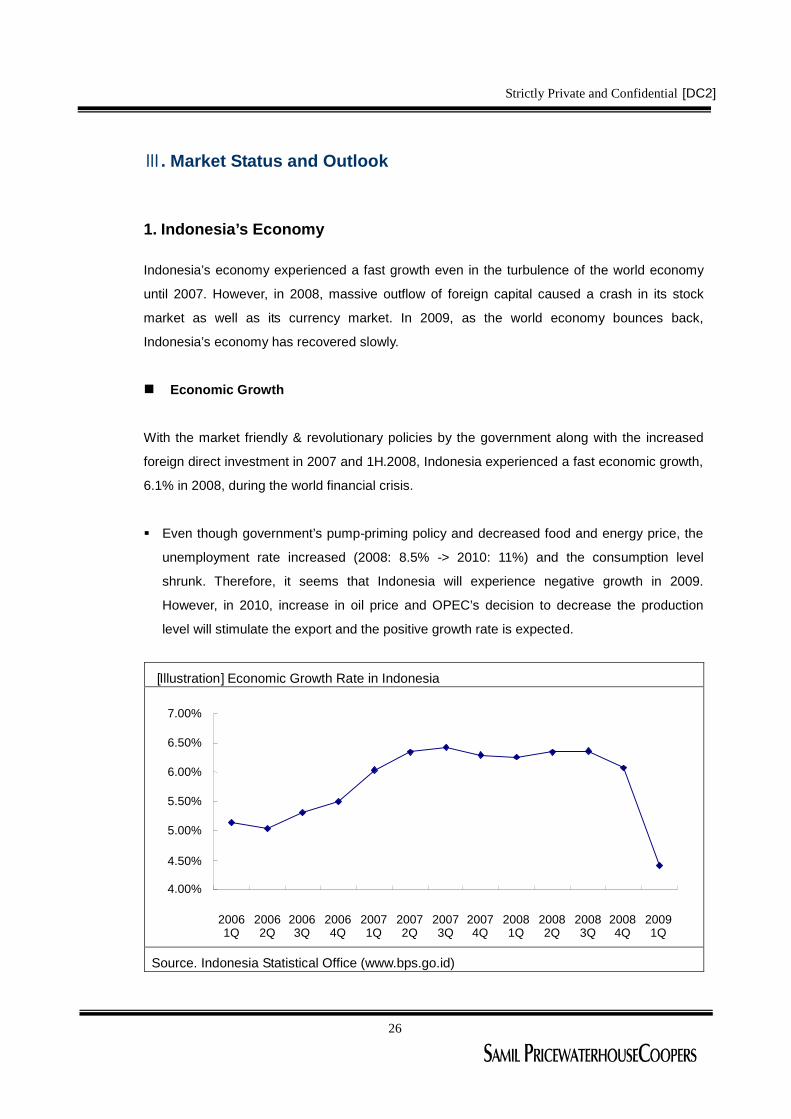
1. Indonesia’s Economy
Indonesia’s economy experienced a fast growth even in the turbulence of the world economy
until 2007. However, in 2008, massive outflow of foreign capital caused a crash in its stock
market as well as its currency market. In 2009, as the world economy bounces back,
Indonesia’s economy has recovered slowly.
Economic Growth
With the market friendly & revolutionary policies by the government along with the increased
foreign direct investment in 2007 and 1H.2008, Indonesia experienced a fast economic growth,
6.1% in 2008, during the world financial crisis.
Even though government’s pump-priming policy and decreased food and energy price, the
unemployment rate increased (2008: 8.5% -> 2010: 11%) and the consumption level
shrunk. Therefore, it seems that Indonesia will experience negative growth in 2009.
However, in 2010, increase in oil price and OPEC’s decision to decrease the production
level will stimulate the export and the positive growth rate is expected.
[Illustration] Economic Growth Rate in Indonesia
Source. Indonesia Statistical Office (www.bps.go.id)
4.00%
4.50%
5.00%
5.50%
6.00%
6.50%
7.00%
20061Q
20062Q
20063Q
20064Q
20071Q
20072Q
20073Q
20074Q
20081Q
20082Q
20083Q
20084Q
20091Q

Strictly Private and Confidential
27
[DC2]
Interest
BI(Bank Indonesia), the central bank of Indonesia, lowered its interest rate since November,
2008 from 9.5% to 7.25% in May, 2009. This indicates BI’s confidence in reaching the inflation
goal of 5~7% and its intention to improve liquidity.
Indonesia focuses on the economic growth rather than controlling inflation. Therefore, further
decrease in interest rate is expected.
[Illustration] Changes in Interest rate in Indonesia
Source. Central Bank of Indonesia (www.bi.go.id)
Inflation
As price of raw materials, such as grocery, oil, and mineral, skyrocketed, the consumer price
level rose to 10.1, 60% increase from the prior year. The consumer price level is expected to
decrease as the international raw material prices and domestic consumption rates are
decreasing.
As international oil price decreases, government decreased the support for oil related
goods. In April, the annual average CPI was 6%, the lowest for the past 16 months.
As Rupee is appreciated since mid 2008, the increased price of imported goods is
expected, which will lead to the inflation.
6.00%
7.00%
8.00%
9.00%
10.00%
1 2 3 4 5 6 7 8 9 10 11 12 1 2 3 4 5 6
2008 2009
Strictly Private and Confidential
28
[DC2]
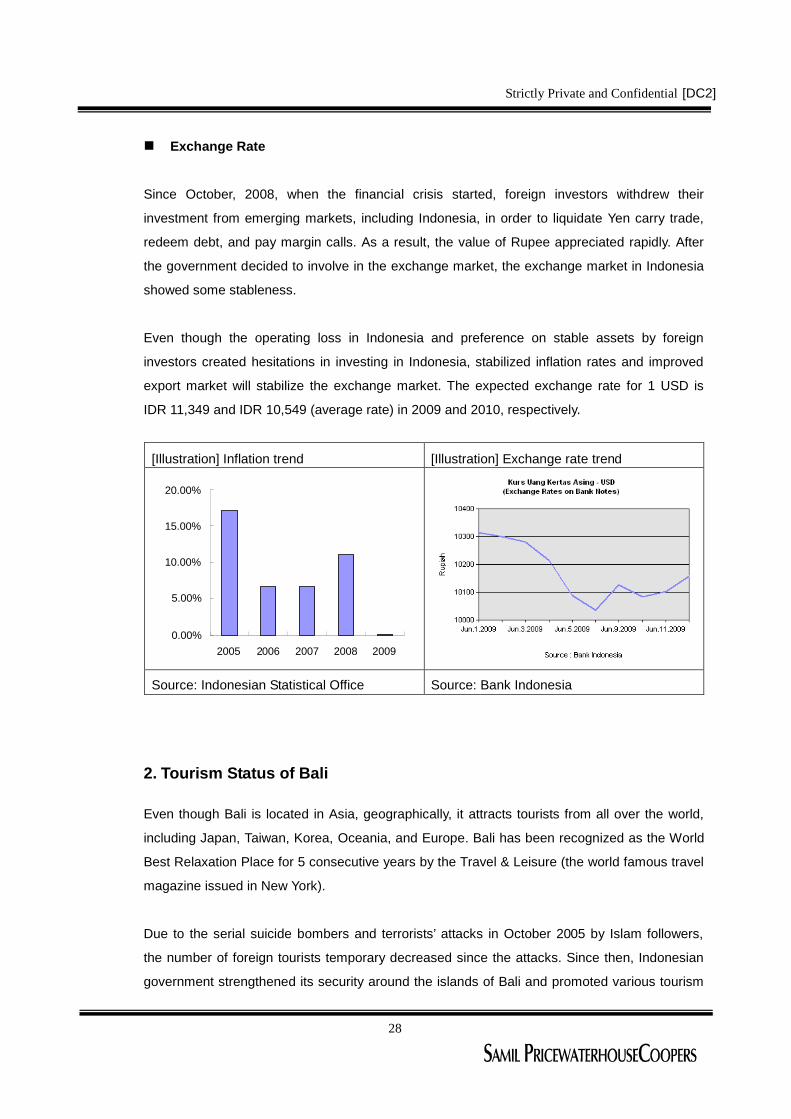
Exchange Rate
Since October, 2008, when the financial crisis started, foreign investors withdrew their
investment from emerging markets, including Indonesia, in order to liquidate Yen carry trade,
redeem debt, and pay margin calls. As a result, the value of Rupee appreciated rapidly. After
the government decided to involve in the exchange market, the exchange market in Indonesia
showed some stableness.
Even though the operating loss in Indonesia and preference on stable assets by foreign
investors created hesitations in investing in Indonesia, stabilized inflation rates and improved
export market will stabilize the exchange market. The expected exchange rate for 1 USD is
IDR 11,349 and IDR 10,549 (average rate) in 2009 and 2010, respectively.
[Illustration] Inflation trend [Illustration] Exchange rate trend
Source: Indonesian Statistical Office Source: Bank Indonesia
2. Tourism Status of Bali
Even though Bali is located in Asia, geographically, it attracts tourists from all over the world,
including Japan, Taiwan, Korea, Oceania, and Europe. Bali has been recognized as the World
Best Relaxation Place for 5 consecutive years by the Travel & Leisure (the world famous travel
magazine issued in New York).
Due to the serial suicide bombers and terrorists’attacks in October 2005 by Islam followers,
the number of foreign tourists temporary decreased since the attacks. Since then, Indonesian
government strengthened its security around the islands of Bali and promoted various tourism
0.00%
5.00%
10.00%
15.00%
20.00%
2005 2006 2007 2008 2009

Strictly Private and Confidential
29
[DC2]
programs, and these efforts led to continuous increase in number of tourists.
In April, 2009, Bali hosted the most foreign tourists in its history with 178,879 visitors, 21.94%
increased number compare to April, 2008 (147,515 individuals). Cumulated foreign visitors until
April, 2009, is 645,061, increasing 8.15% from prior period (596,469).
[Illustration] Foreign Tourist Arrivals to Bali
Source: www.balidiscovery.com
Analyzing visitors by nations, tourists from Australia ranked 1st in 2009, followed by Japan.
During the first four months of 2009, total 102,179 visitors from Australia toured Bali, increasing
30.08% compare to 2008. On the other side, for Japanese tourists, the increased rate compare
to prior year was only 7.45%, giving up the number one ranking to Australia.
For Korea, it was maintaining its ranking, 3rd, for a long period, however, the number of tourists
in 2009 decreased by 5.62% compared to prior period, and the ranking fell to 5th. Also, for
Taiwan, the ranking fell to 7th in 2009, after maintaining its ranking at 4th for a long period.
Tourists Increased Nations
The nations that sent more tourists to Bali than the past during the first four months of 2009 are
as follows: Australia (+30.08%), China (+54.03), Malaysia (+37.70%). Russia (+4.75%),
Netherlands (+0.42%), France (+25.32%).
-
50,000
100,000
150,000
200,000
Jan Feb Mar Apr
2009
2008

Strictly Private and Confidential
30
[DC2]
Tourists Decreased Nations
The nations that sent less tourists to Bali than the past during the first four months of 2009 are
as follows: Japan (-7.45%), Thailand (-23.24%), Korea (-5.62%), USA (-1.80%), Germany(-
11.66%), England (-6.50%).
[ Illustration] Top Bali Markets Jan-Apr 2008 vs 2009
Source. www.balidiscovery.com
Average stay length for foreign visitors who travel Bali is about 3.75 days. Statistically,
domestic tourists travel longer than foreign visitors as tourists from Indonesia stay at Bali for
around 4.29 days.
Visitors from Indonesia usually stay longer period at Badung, Gianyar and Denpasar regions,
and foreign tourists stay longer period at Tabanan, Karangasem and Buleleng regions than
domestic travelers.
Stay length of the tourists is directly related to the hotel occupancy rates. In March, 2009, the
hotel occupancy rate was 57.72%, which has been increased from the prior month (50.99%).
The hotels in Denpasar region has the better occupancy rates than the average with 62.49%,
whereas, the occupancy rate for the hotels in Karangasem region was only 34.35%.
As per balidiscovery.com, the number of foreign tourists in March, 2009, was 161,169,
increased by 4.7% from prior period. In April 2009, the number of foreign tourists increased by
21.94% with 178,879 individuals, indicating the increasing trend of the foreign visitors.
-
20,000
40,000
60,000
80,000
100,000
120,000
140,000
JapanAustralia
ThailandKorea
ChinaMalaysia
RussiaNetherlands
FranceUSA
GermanyEngland
2008
2009

Strictly Private and Confidential
31
[DC2]
3. Analysis of Similar Resorts
The resort will be developed on the land of 78,540㎡ with therapy-oriented Spa and 96 units of
private pool villa. This development is considered as the mega project in Bali..
This resort is expected to compete with mega brand villas, such as Banyan Tree and Karma,
as well as smaller villas. As per the company’s official, this resort has relative lower brand
recognition and costumer loyalty, but its easy accesilibility (30 minutes from airport, near
central tourism area, near golf course), will attract tourists. Also, Banyan Tree Pool Villa and
Karma Pool Villa are located near site and it possesses beautiful scenery as it is located on the
cliff side. Furthermore, the rate of this resort, which is relatively lower than famous branded
resorts and its know-how in managing Dreamland and Blue Ocean Bali Resort will help
obtaining competitiveness.
Following is the information of the Pool Villa & Hotel located in near the project site.
Karma Kandara
Karma Pool Villa is a famous brand pool villa, and its chain villas are located throughout
Southeast Asia. It is especially popular and famous to European countries, but with its
outstanding and unique facilities, it will soon gain interests from Korean. Karma Kandara is as
good as the most luxurious villas in Bali, such as Bvlgari, Ritz Carton and Four Seasons. As it
has the private beaches and pools for kids along with many unique facilities, it is considered as
the best place for family trip and honeymoon.
[Table] Karma Kandara Room Rate (in USD)
Room Type Size Rate(*1) Note
One-Bedroom Pool Residence - 605
Two-Bedroom Pool Residence - 776
Three-Bedroom Pool Residence - 984
Four-Bedroom Pool Residence - 1,390
Cliff Front Residence - 3,852
Grand Cliff Front Residence - 7,000
[Source] The Company’s Business Plan

Strictly Private and Confidential
32
[DC2]
(*1) Rate: Low Season Rate (Taxes and service fees are excluded)
Bvlgari
The resort, located 20 minutes from the airport, is comprised of 59 villas and other supporting
facilities. This resort is famous for its modernized and Baliness architect design, along with its
luxurious Bvlgari antique materials.
[Table] Bvlgari Room Rate (in USD)
Room Type Size Rate(*1) Note
Ocean-View One-Bedroom 250-300㎡ 1,300
Ocean-Cliff One-Bedroom 250-300㎡ 1,550
Two_Bedroom - 1,950
Bvlgari Villa(Three-Bedroom) 1,300㎡ 8,000
Premier Ocean-View One-Bedroom 250-300㎡ 1,450
[Source] The Company’s Business Plan
(*1) Rate: Regular Season Rate (Taxes and service fees are excluded)
Amankila
This Aman branded resort is famous for 3 step sea-faced swimming pool, and it is considered
as the one of the most beautiful resort in the world. This resort is comprised of 35 pool villa
units. The wide windows along with unique room design provide romantic atmosphere for
couples and families.
[Table] Amankila Room Rate (in USD)
Room Type Size Rate(*1) Note
Garden Suite(One-Bedroom) - 850
Ocean Suite - -
Pool Suite(One-Bedroom) - 1,350
Kilasari Suite(One-Bedroom) - 1,800
Indrakila Suite(One-Bedroom) - 2,100
Amankila Suite(Two-Bedroom) - 3,100
[Source] The Company’s Business Plan

Strictly Private and Confidential
33
[DC2]
(*1) Rate: Regular Season Rate (Taxes and service fees are excluded)
The Beverly Hills Bali
This luxurious resort, opened in September 2006 with 25 pool villa units and co-operated by
Bvlgari and Marriot, is famous for its Bvlgari materials in its design. Its famous spa is built with
lumbers, which is over 200 years old from Java islands.
[Table] The Beverly Hills Bali Room Rate (in USD)
Room Type Size Rate(*1) Note
One-Bedroom Villa 400㎡ 499
Two-Bedroom Villa 600㎡ 700
[Source] The Company’s Business Plan
(*1) Rate: Regular Season Rate (Taxes and service fees are excluded)
Ocean Blue Hotel Bali
The constructor of this project constructed this pool villa resort, and it is now operated by
Korean management. It is located 10 minutes from the airport and comprised of 141 pool villa
units.
[Table] Ocean Blue Hotel Bali Room Rate (in USD)
Room Type Size Rate(*1) Note
Grand Deluxe One-Bedroom - 600
Imperial Two-Bedroom - 900
[Source] The Company’s Business Plan
(*1) Rate: Regular Season Rate (Taxes and service fees are excluded)
The Dreamland Luxury Villas & Spa
Dreamland is co-established by Korean developer, who pursued in lumber processing industry
in Indonesia since 2000 (Developer of this project), and Guno & Company from Japan. Each of
the 40 villas, which was built in the forest of 40,000 pyeong (~12,000㎡), possesses unique

Strictly Private and Confidential
34
[DC2]
characteristics and attributes, combined with traditional Bali style with modernized design.
[Table] Dreamland Room Rate (in USD)
Room Type Size Rate(*1) Note
One-Bedroom Suite 210㎡ 460
Two-Bedroom Ocean Suite 270㎡ 700
Three-Bedroom Family Mansion 1,000㎡ 900
[Source] The Company’s Business Plan
(*1) Rate: Low Season Rate (Taxes and service fees are excluded)
(*2) This villa is operated by the developer of this project.
Strictly Private and Confidential
35
[DC2]
.Ⅳ Income & Cash Flow Analysis
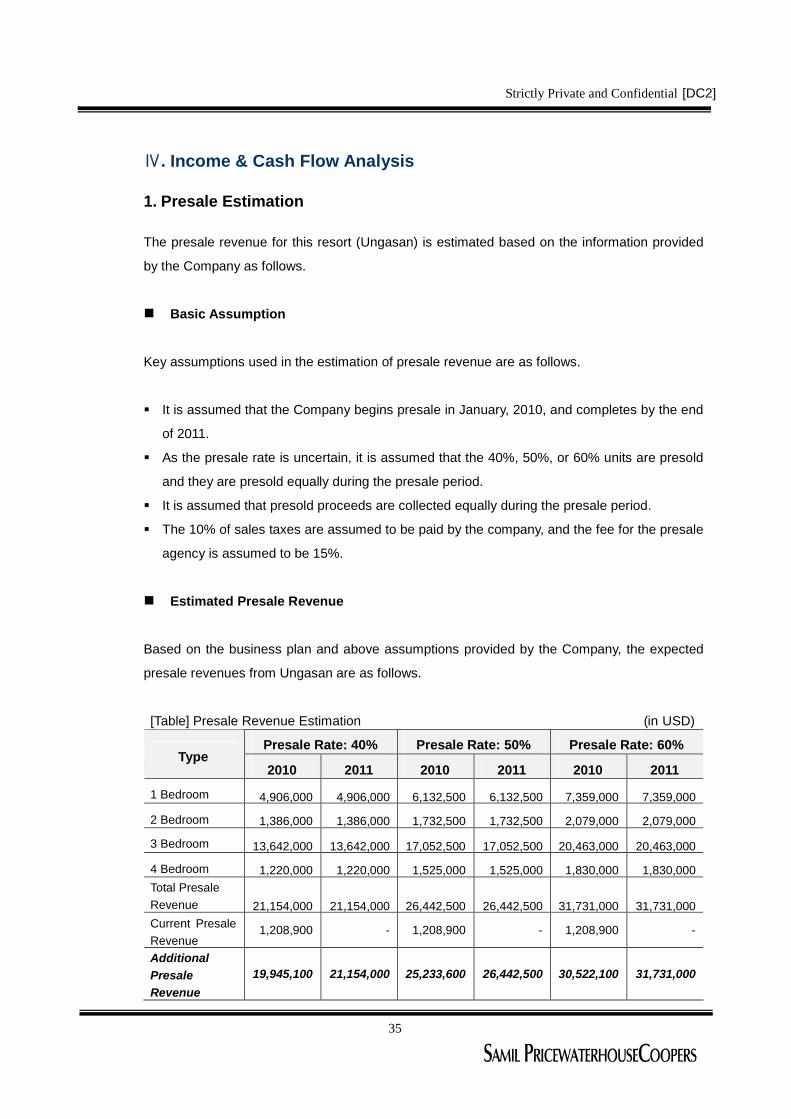
1. Presale Estimation
The presale revenue for this resort (Ungasan) is estimated based on the information provided
by the Company as follows.
Basic Assumption
Key assumptions used in the estimation of presale revenue are as follows.
It is assumed that the Company begins presale in January, 2010, and completes by the end
of 2011.
As the presale rate is uncertain, it is assumed that the 40%, 50%, or 60% units are presold
and they are presold equally during the presale period.
It is assumed that presold proceeds are collected equally during the presale period.
The 10% of sales taxes are assumed to be paid by the company, and the fee for the presale
agency is assumed to be 15%.
Estimated Presale Revenue
Based on the business plan and above assumptions provided by the Company, the expected
presale revenues from Ungasan are as follows.
[Table] Presale Revenue Estimation (in USD)
Presale Rate: 40% Presale Rate: 50% Presale Rate: 60%Type
2010 2011 2010 2011 2010 2011
1 Bedroom 4,906,000 4,906,000 6,132,500 6,132,500 7,359,000 7,359,000
2 Bedroom 1,386,000 1,386,000 1,732,500 1,732,500 2,079,000 2,079,000
3 Bedroom 13,642,000 13,642,000 17,052,500 17,052,500 20,463,000 20,463,000
4 Bedroom 1,220,000 1,220,000 1,525,000 1,525,000 1,830,000 1,830,000Total PresaleRevenue 21,154,000 21,154,000 26,442,500 26,442,500 31,731,000 31,731,000Current PresaleRevenue
1,208,900 - 1,208,900 - 1,208,900 -
AdditionalPresaleRevenue
19,945,100 21,154,000 25,233,600 26,442,500 30,522,100 31,731,000

Strictly Private and Confidential
36
[DC2]
Sales Taxes 1,994,510 2,115,400 2,523,360 2,644,250 3,052,210 3,173,100
Agency Fee 2,991,765 3,173,100 3,785,040 3,966,375 4,578,315 4,759,650Net PresaleRevenue
14,958,825 15,865,500 18,925,200 19,831,875 22,891,575 23,798,250
Review on Presale Value
The presale unit price provided by the Company is as follows.
[Table] Pool Villa Presale Value by Room Type (in USD)
SizeType Room Type # of Units
Land Building(*1)
Presale
Value
1 1,400.00㎡ 865.76㎡ 3,420,0004 Bedroom
1 1,050.00㎡ 678.21㎡ 2,680,000
8 810.00㎡ 522.61㎡ 1,980,000
6 690.00㎡ 522.61㎡ 1,830,000
22 600.00㎡ 473.66㎡ 1,580,000
2 440.00㎡ 323.94㎡ 1,180,000
3 420.00㎡ 322.38㎡ 1,080,000
3 Bedroom
1 400.00㎡ 307.53㎡ 1,030,000
2 Bedroom 7 400.00㎡ 307.53㎡ 990,000
34 280.00㎡ 183.12㎡ 550,000
Pool Villa
1 Bedroom11 266.00㎡ 183.12㎡ 530,000
(Source) The Company’s Business Plan
(*1) Areas of other facilities are included in the building size in accordance with Indonesian
regulation.
The presale values for Chateau The Bali (Ungasan) are little lower than the similar resorts in
the market. However, as the location and facilities of the Chateau The Bali (Ungasan) is more
advanced and better than the ones nearby, it is reasonable to believe that the units can be
presold at the value that the Company provided. Therefore, the unit presale value provided by
the Company was used in the estimation of the presale revenue.
Strictly Private and Confidential
37
[DC2]
Review on Presale Rate
When the global financial market recovers, the presale rate is expected to return to the
historical rates. However, as presale rate is highly sensitive to the presale price, quality of
facilities, and external economical factors, we concluded that it is difficult to estimate the
presale rate. Therefore, we estimated the presale revenue by applying the presale rates of
40%, 50%, and 60%. This estimation does not provide any assurance that the presale rate will
be higher than the ones that are used in the estimation.
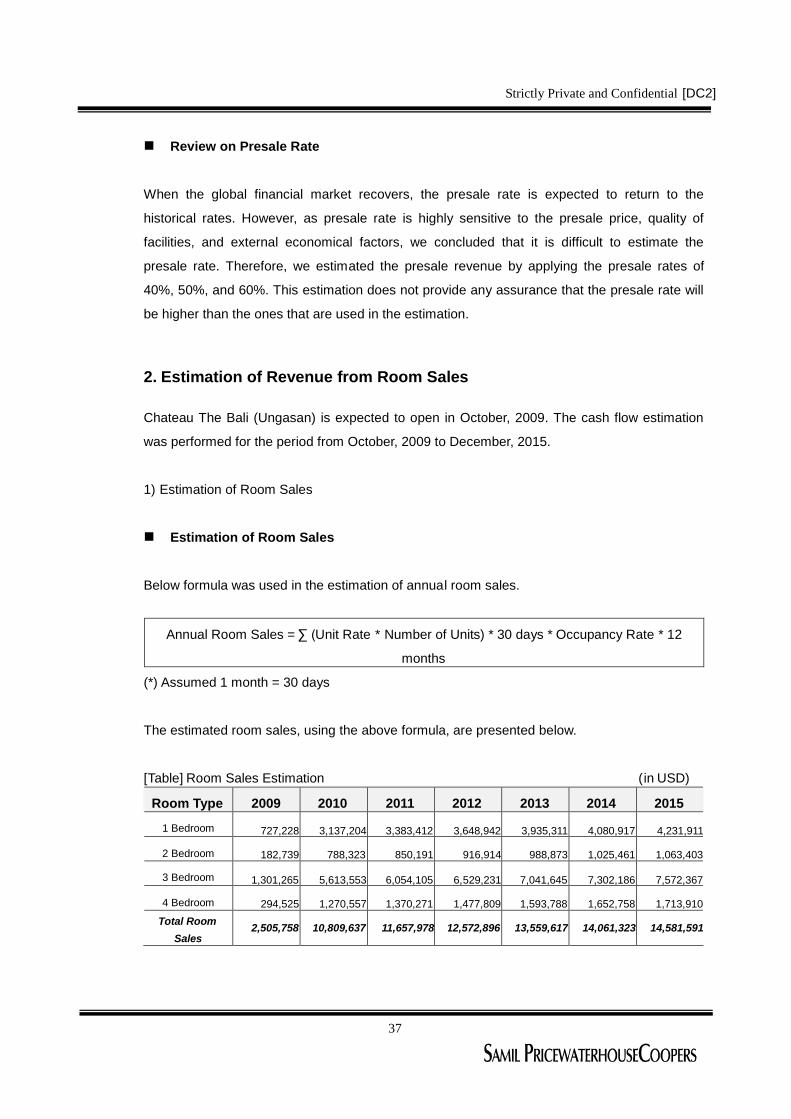
2. Estimation of Revenue from Room Sales
Chateau The Bali (Ungasan) is expected to open in October, 2009. The cash flow estimation
was performed for the period from October, 2009 to December, 2015.
1) Estimation of Room Sales
Estimation of Room Sales
Below formula was used in the estimation of annual room sales.
Annual Room Sales = ∑ (Unit Rate * Number of Units) * 30 days * Occupancy Rate * 12
months
(*) Assumed 1 month = 30 days
The estimated room sales, using the above formula, are presented below.
[Table] Room Sales Estimation (in USD)
Room Type 2009 2010 2011 2012 2013 2014 2015
1 Bedroom 727,228 3,137,204 3,383,412 3,648,942 3,935,311 4,080,917 4,231,911
2 Bedroom 182,739 788,323 850,191 916,914 988,873 1,025,461 1,063,403
3 Bedroom 1,301,265 5,613,553 6,054,105 6,529,231 7,041,645 7,302,186 7,572,367
4 Bedroom 294,525 1,270,557 1,370,271 1,477,809 1,593,788 1,652,758 1,713,910
Total Room
Sales2,505,758 10,809,637 11,657,978 12,572,896 13,559,617 14,061,323 14,581,591

Strictly Private and Confidential
38
[DC2]
Number of Units & Room Rates by Room Type
The data provided by the Company was used in this feasibility study, and the provided number
of units and room rates are as follows.
[Table] Number of Unit & Price by Room Type (in USD)
Type Room Type Size # of Unit Room Rate(*1)
1 Bedroom 183㎡ 45 650
2 Bedroom 308㎡ 7 1,050
3 Bedroom 308 ~ 523㎡ 42 1,800Pool Villa
4 Bedroom 678 ~ 866㎡ 2 11,000
(Source) The Company’s Business Plan
(*1) Published Rate
Direct comparison of room rate to the competitors is not reasonable as the room rate is highly
dependent on occupancy rate and geographical conditions, such as location and natural
environment of the resort. Considering many factors, such as the published rate and the lack of
brand recognition, only 50% of the room rate provided by the company was applied in the
estimation of room sales.
Occupancy Rate
The data provided by the Company was used to perform the feasibility study of the Chateau
The Bali (Ungasan), and the provided room occupancy rates are as follows. Room occupancy
rates provided by the company are relative lower than similar resorts in the market, including
Dreamland.
[Table] Expected Occupancy rate for the project
Type Room Type Size # of Unit OccupancyRate
1 Bedroom 183㎡ 45 65%
2 Bedroom 308㎡ 7 65%
3 Bedroom 308 ~ 523㎡ 42 45%Pool Villa
4 Bedroom 678 ~ 866㎡ 2 35%
(Source) The Company’s Business Plan

Strictly Private and Confidential
39
[DC2]
Even though the expected occupancy rates provided by the company are lower than the similar
resorts’occupancy rates, the rates were adjusted in this feasibility study, considering the lack of
brand recognition and other factors. We assumed the provided occupancy rate will be reached
in 5 years, and the growth rate was calculated based on the average growth rates of similar
resorts in 2002~2007 period (4%).
Changes in the Revenue after 1st year
In the estimation of revenue after 1st year, different room occupancy rates and room rates are
used. Other than these factors, we assumed there are no other changes.
For room occupancy rate, we used 51%, which was provided by the company at the first time,
and applied the average growth rate of 4%, which is the growth rate of similar resorts in 2002-
2007 period. Other than these changes, we assumed there are no other changes. As a result,
the occupancy rate of 2015 for this project is expected to be lower than the similar resorts’
occupancy rates in 2007.
[Table] Expected Room Occupancy Trend
Room Type 2009 2010 2011 2012 2013 2014 2015
1 Bedroom 55.3% 57.5% 59.8% 62.1% 64.6% 64.6% 64.6%
2 Bedroom 55.3% 57.5% 59.8% 62.1% 64.6% 64.6% 64.6%
3 Bedroom 38.3% 39.8% 41.4% 43.0% 44.7% 44.7% 44.7%
4 Bedroom 29.8% 30.9% 32.2% 33.5% 34.8% 34.8% 34.8%
(Source) The Company’s Business Plan
We assumed that the inflation rate in 2010 will remain the same for the estimated period. 3.7%
of inflation rate in 2010 was applied in the estimation of the room rate. It was noted that similar
resorts in Bali adjust their room rates annually.
[Table] Expected Room Rate Trend
Room Type 2009 2010 2011 2012 2013 2014 2015
1 Bedroom 325 337 349 362 376 390 404
2 Bedroom 525 544 565 585 607 630 653
3 Bedroom 900 933 968 1,004 1,041 1,079 1,119
4 Bedroom 5,500 5,704 5,915 6,133 6,360 6,596 6,840

Strictly Private and Confidential
40
[DC2]
(Source) The Company’s Business Plan
2) Estimation of Revenues from Food & Beverage (F&B) and Others
Revenues from F&B and Others are estimated based on the proportion of these revenues at
Dreamland resort for the last 2 years.
[Table] Dreamland Revenue Composition
Type Revenue fromRoom
Revenue from F&B Revenue fromOthers
Revenue 63.5% 26.0% 10.5%
(Source) The Company’s Business Plan
(*) Revenue from Others includes revenue from telephone, business center, spa, and health
related fees.
Estimated Revenues from F&B and Others
Estimated revenues from F&B and Others based on the proportion of Dreamland revenue are
as follows.
[Table] Estimated Revenues from F&B and Others (in USD)
Type 2009 2010 2011 2012 2013 2014 2015Revenue from
Room 2,505,758 10,809,637 11,657,978 12,572,896 13,559,617 14,061,323 14,581,591
Revenue fromF&B 651,497 2,810,506 3,031,074 3,268,953 3,525,500 3,655,944 3,791,214
Revenue fromOthers 263,105 1,135,012 1,224,088 1,320,154 1,423,760 1,476,439 1,531,067
Total 3,420,359 14,755,155 15,913,140 17,162,003 18,508,877 19,193,705 19,903,872
3. Estimation of Operating Expense
Operating expenses are estimated based on the operating expense of Dreamland resort.
Expenses unrelated to F&B and Others revenues are included in the cost of room sales.
1) Estimation of Cost of Room Sales

Strictly Private and Confidential
41
[DC2]
Cost of Room Sales at Dreamland
Average room sales costs at Dreamland for the last 2 years are as follows.
[Table] Cost of Room Sales at Dreamland
Type Rate NoteLabor & Labor-related Expense 6.00%
General Admin Expense 9.45%
Marketing Expense 5.51%
Maintenance Expense 7.87%
Utility Expense 17.32%
Other Selling Expense 10.00%
Fixed Cost 9.92%
(Source) The Company’s Business Plan
Estimated Cost of Room Sales
Estimated costs of room sales based on the Dreamland cost of room sales are as follows.
[Table] Estimated Cost of Room Sales (in USD)
Type 2009 2010 2011 2012 2013 2014 2015Room SalesRevenue 2,505,758 10,809,637 11,657,978 12,572,896 13,559,617 14,061,323 14,581,591
Labor & Labor-related Expense 150,345 648,578 699,479 754,374 813,577 843,679 874,895
General AdminExpense 236,765 1,021,384 1,101,542 1,187,991 1,281,224 1,328,630 1,377,789
MarketingExpense 138,113 595,807 642,566 692,995 747,381 775,034 803,710
MaintenanceExpense 197,304 851,153 917,952 989,992 1,067,687 1,107,191 1,148,158
Utility Expense 434,068 1,872,537 2,019,493 2,177,983 2,348,911 2,435,821 2,525,947
Other SellingExpense 250,576 1,080,964 1,165,798 1,257,290 1,355,962 1,406,132 1,458,159
Fixed Cost 248,603 248,603 248,603 248,603 248,603 248,603 248,603
Total Cost ofRoom Sales 1,655,774 6,319,026 6,795,432 7,309,227 7,863,345 8,145,091 8,437,261
Cost rate ofRoom Sales 66.08% 58.46% 58.29% 58.13% 57.99% 57.93% 57.86%

Strictly Private and Confidential
42
[DC2]
2) Estimation of Cost of F&B
Cost of F&B at Dreamland
Average F&B costs at Dreamland for the last 2 years are as follows.
[Table] Cost of F&B at Dreamland
Type Rate Note
Ingredient expense 30.00%
Labor & Labor-related expense 12.00%
Other expense 10.00%
Cost rate of F&B revenue 52.00%
(Source) The Company’s Business Plan
Estimated Cost of F&B
Estimated costs of F&B based on the Dreamland cost of F&B are as follows.
[Table] Estimated Cost of F&B (in USD)
Type 2009 2010 2011 2012 2013 2014 2015
F&B revenue 651,497 2,810,506 3,031,074 3,268,953 3,525,500 3,655,944 3,791,214
Ingredientexpense 195,449 843,152 909,322 980,686 1,057,650 1,096,783 1,137,364
Labor & Labor-related expense 78,180 337,261 363,729 392,274 423,060 438,713 454,946
Other expense 65,150 281,051 303,107 326,895 352,550 365,594 379,121
Total Cost ofF&B 338,778 1,461,463 1,576,159 1,699,856 1,833,260 1,901,091 1,971,431
Cost rate ofF&B revenue 52.00% 52.00% 52.00% 52.00% 52.00% 52.00% 52.00%
3) Estimation of Cost of Other Revenue
Cost of Other Revenue at Dreamland
Average Other Revenue costs at Dreamland for the last 2 years are as follows.

Strictly Private and Confidential
43
[DC2]
[Table] Cost of Other Revenue at Dreamland
Type Rate Note
Raw Material Expense 17.62%
Labor & Labor-related Expense 17.71%
Other Expense 13.33%
Cost rate of Other revenue 48.67%
(Source) The Company’s Business Plan
Estimated Cost of Other Revenue
Estimated costs of Other revenue based on the Dreamland cost of Other revenue are as
follows.
[Table] Estimated Cost of Other Revenue (in USD)
Type 2009 2010 2011 2012 2013 2014 2015
Other revenue 263,105 1,135,012 1,224,088 1,320,154 1,423,760 1,476,439 1,531,067
Raw MaterialExpense 46,357 199,979 215,673 232,599 250,853 260,135 269,760
Labor & Labor-related Expense 46,607 201,059 216,838 233,856 252,209 261,541 271,218
Other Expense 35,081 151,336 163,213 176,021 189,836 196,860 204,143
Total Cost ofOther revenue 128,044 552,373 595,724 642,476 692,898 718,535 745,121
Cost rate ofOther revenue 48.67% 48.67% 48.67% 48.67% 48.67% 48.67% 48.67%

Strictly Private and Confidential
44
[DC2]
4) Estimated Operating Expense
[Table] Estimated Operating Expense (in USD)
Type 2009 2010 2011 2012 2013 2014 2015
Total Revenue 3,420,359 14,755,155 15,913,140 17,162,003 18,508,877 19,193,705 19,903,872
Cost of Roomsales 1,655,774 6,319,026 6,795,432 7,309,227 7,863,345 8,145,091 8,437,261
Cost of F&Brevenue 338,778 1,461,463 1,576,159 1,699,856 1,833,260 1,901,091 1,971,431
Cost of Otherrevenue 128,044 552,373 595,724 642,476 692,898 718,535 745,121
Total COGS 2,122,597 8,332,862 8,967,315 9,651,559 10,389,503 10,764,716 11,153,813
Cost Rate 62.06% 56.47% 56.35% 56.24% 56.13% 56.08% 56.04%
Strictly Private and Confidential
45
[DC2]
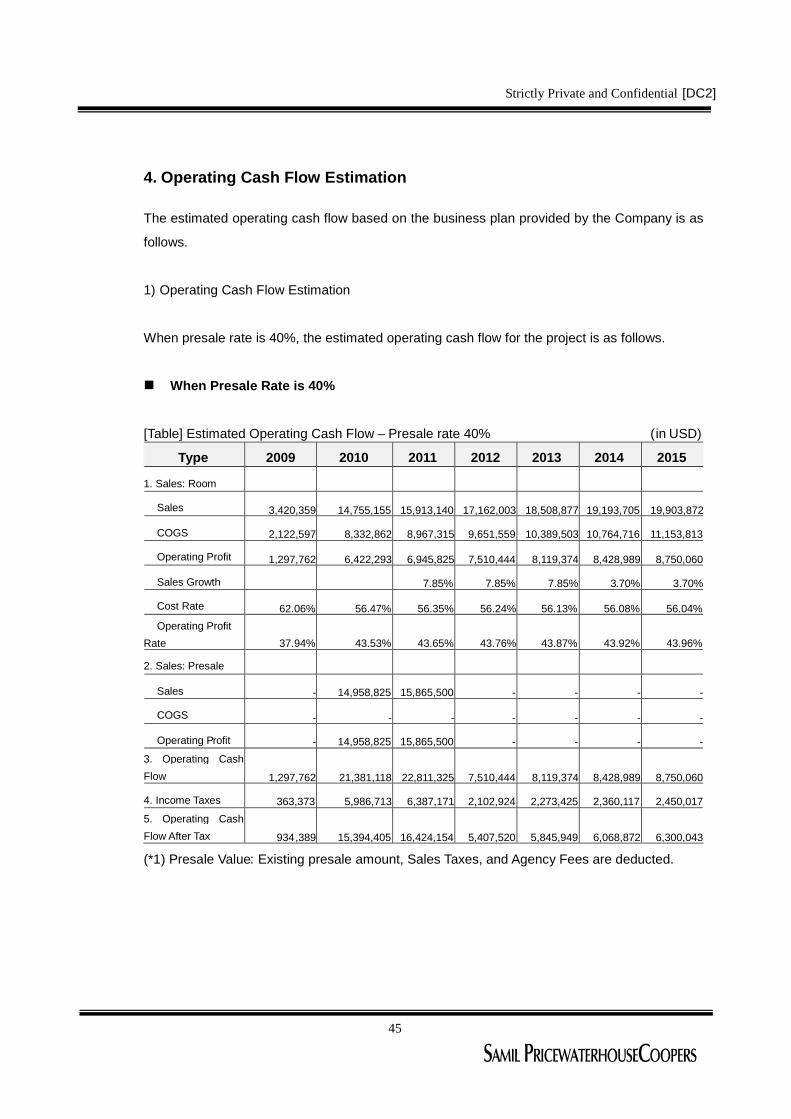
4. Operating Cash Flow Estimation
The estimated operating cash flow based on the business plan provided by the Company is as
follows.
1) Operating Cash Flow Estimation
When presale rate is 40%, the estimated operating cash flow for the project is as follows.
When Presale Rate is 40%
[Table] Estimated Operating Cash Flow – Presale rate 40% (in USD)
Type 2009 2010 2011 2012 2013 2014 2015
1. Sales: Room
Sales 3,420,359 14,755,155 15,913,140 17,162,003 18,508,877 19,193,705 19,903,872
COGS 2,122,597 8,332,862 8,967,315 9,651,559 10,389,503 10,764,716 11,153,813
Operating Profit 1,297,762 6,422,293 6,945,825 7,510,444 8,119,374 8,428,989 8,750,060
Sales Growth 7.85% 7.85% 7.85% 3.70% 3.70%
Cost Rate 62.06% 56.47% 56.35% 56.24% 56.13% 56.08% 56.04%
Operating Profit
Rate 37.94% 43.53% 43.65% 43.76% 43.87% 43.92% 43.96%
2. Sales: Presale
Sales - 14,958,825 15,865,500 - - - -
COGS - - - - - - -
Operating Profit - 14,958,825 15,865,500 - - - -
3. Operating Cash
Flow 1,297,762 21,381,118 22,811,325 7,510,444 8,119,374 8,428,989 8,750,060
4. Income Taxes 363,373 5,986,713 6,387,171 2,102,924 2,273,425 2,360,117 2,450,017
5. Operating Cash
Flow After Tax 934,389 15,394,405 16,424,154 5,407,520 5,845,949 6,068,872 6,300,043
(*1) Presale Value: Existing presale amount, Sales Taxes, and Agency Fees are deducted.
Strictly Private and Confidential
46
[DC2]
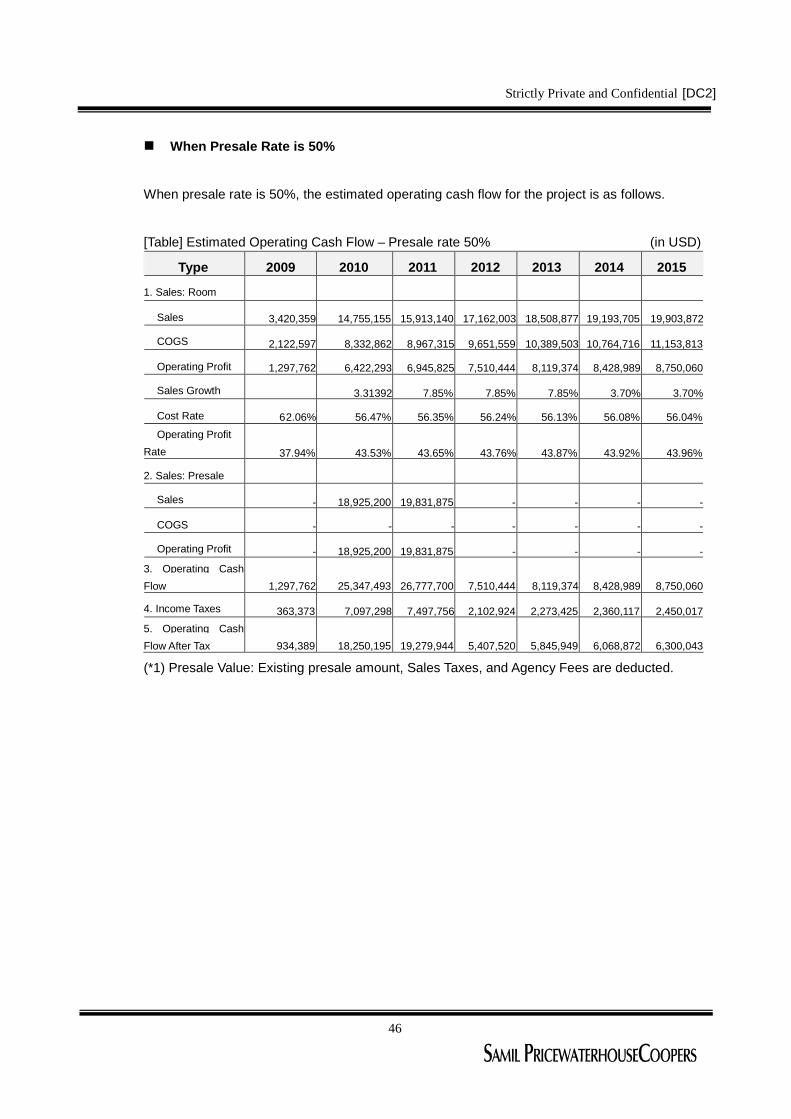
When Presale Rate is 50%
When presale rate is 50%, the estimated operating cash flow for the project is as follows.
[Table] Estimated Operating Cash Flow – Presale rate 50% (in USD)
Type 2009 2010 2011 2012 2013 2014 2015
1. Sales: Room
Sales 3,420,359 14,755,155 15,913,140 17,162,003 18,508,877 19,193,705 19,903,872
COGS 2,122,597 8,332,862 8,967,315 9,651,559 10,389,503 10,764,716 11,153,813
Operating Profit 1,297,762 6,422,293 6,945,825 7,510,444 8,119,374 8,428,989 8,750,060
Sales Growth 3.31392 7.85% 7.85% 7.85% 3.70% 3.70%
Cost Rate 62.06% 56.47% 56.35% 56.24% 56.13% 56.08% 56.04%
Operating Profit
Rate 37.94% 43.53% 43.65% 43.76% 43.87% 43.92% 43.96%
2. Sales: Presale
Sales - 18,925,200 19,831,875 - - - -
COGS - - - - - - -
Operating Profit - 18,925,200 19,831,875 - - - -
3. Operating Cash
Flow 1,297,762 25,347,493 26,777,700 7,510,444 8,119,374 8,428,989 8,750,060
4. Income Taxes 363,373 7,097,298 7,497,756 2,102,924 2,273,425 2,360,117 2,450,017
5. Operating Cash
Flow After Tax 934,389 18,250,195 19,279,944 5,407,520 5,845,949 6,068,872 6,300,043
(*1) Presale Value: Existing presale amount, Sales Taxes, and Agency Fees are deducted.

Strictly Private and Confidential
47
[DC2]
When Presale Rate is 60%
When presale rate is 60%, the estimated operating cash flow for the project is as follows.
[Table] Estimated Operating Cash Flow – Presale rate 60% (in USD)
Type 2009 2010 2011 2012 2013 2014 2015
1. Sales: Room
Sales 3,420,359 14,755,155 15,913,140 17,162,003 18,508,877 19,193,705 19,903,872
COGS 2,122,597 8,332,862 8,967,315 9,651,559 10,389,503 10,764,716 11,153,813
Operating Profit 1,297,762 6,422,293 6,945,825 7,510,444 8,119,374 8,428,989 8,750,060
Sales Growth 3.31392 7.85% 7.85% 7.85% 3.70% 3.70%
Cost Rate 62.06% 56.47% 56.35% 56.24% 56.13% 56.08% 56.04%
Operating Profit
Rate 37.94% 43.53% 43.65% 43.76% 43.87% 43.92% 43.96%
2. Sales: Presale
Sales - 22,891,575 23,798,250 - - - -
COGS - - - - - - -
Operating Profit - 22,891,575 23,798,250 - - - -
3. Operating Cash
Flow 1,297,762 29,313,868 30,744,075 7,510,444 8,119,374 8,428,989 8,750,060
4. Income Taxes 363,373 8,207,883 8,608,341 2,102,924 2,273,425 2,360,117 2,450,017
5. Operating Cash
Flow After Tax 934,389 21,105,985 22,135,734 5,407,520 5,845,949 6,068,872 6,300,043
(*1) Presale Value: Existing presale amount, Sales Taxes, and Agency Fees are deducted.
Strictly Private and Confidential
48
[DC2]
2) Income Tax Estimation
Income Tax rates, provided by the Company, in Indonesia are as follows.
[Table] Indonesia Income Tax Rates
Tax RatesIncome
Prior to 2008 After 2009 (*1)
Below or Equal to 50,000,000 Rupee 10%
Exceed 50,000,000 Rupee & Below or Equal
to 100,000,000 Rupee15%
Exceed 100,000,000 Rupee 30%
28%
(Source) The Company’s Business Plan
The income taxes are estimated with the assumption that there are no changes in taxable
income and income tax rates, and the currency rate of USD 1: 10,340 Rupee was applied.
(Selling Rate: 10,392 rupee/USD, Buying Rate: 10,288 rupee/USD, Median Rate: 10,340
rupee/USD). Further, the losses incur in the early stage of the project is assumed to be carried
forward to be deducted.

Strictly Private and Confidential
49
[DC2]
5. Cumulative Cash Flow Projection
The cumulative cash flow projection based on the estimated operating cash flow is as follows.
When the presale rate is 40%
The Company plans to distribute 8% of the presale amount for the first 2 years, and then plans
to distribute 40% of net operating profit. The estimated distributable dividends are estimated as
below.
[Table] Dividend Estimation – Presale Rate: 40% (in USD)
Type 2009 2010 2011 2012 2013 2014 2015
Presale Revenue - 21,154,000 21,154,000
Operating Profit, Net
of Tax 934,389 21,105,985 22,135,734 5,407,520 5,845,949 6,068,872 6,300,043
Dividend Rate(*) 8% 8% 40% 40% 40% 40%
Dividend Amount 846,160 2,538,480 865,203 935,352 971,020 1,008,007
Available cumulative cash flow based on the operating cash flow of Chateau the Bali
(Ungasan) is estimated as below.
[Table] Cumulative Cash Flow Estimation – Presale Rate: 40% (in USD)
Type 2009 2010 2011 2012 2013 2014 2015Operating Cash
Flow, Net of Tax 934,389 15,394,405 16,424,154 5,407,520 5,845,949 6,068,872 6,300,043
Dividends - 846,160 2,538,480 865,203 935,352 971,020 1,008,007
Net Cash Flow (*) 934,389 14,548,245 13,885,674 4,542,316 4,910,597 5,097,852 5,292,036
Cumulative Cash
Flow 934,389 15,482,634 29,368,308 33,910,624 38,821,222 43,919,074 49,211,110
(*) As funding method is not confirmed, financing cost and reserve capital for operating are not
considered in the estimation.
Strictly Private and Confidential
50
[DC2]
When the presale rate is 50%
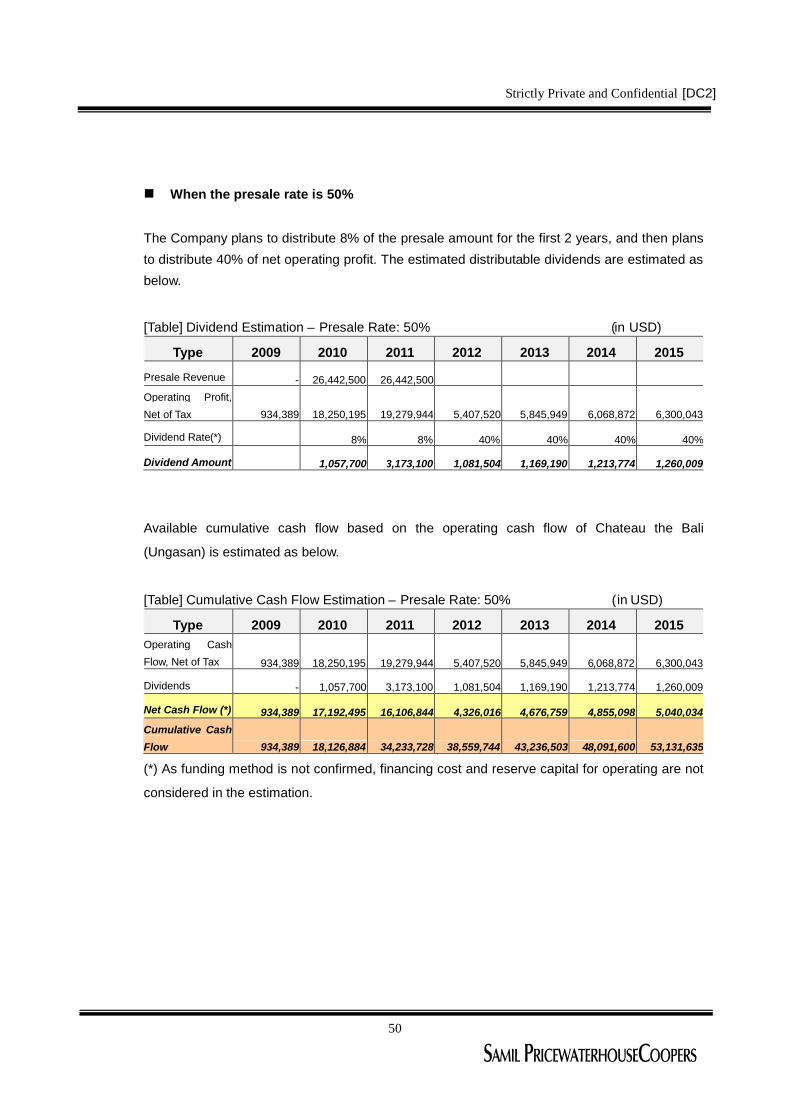
The Company plans to distribute 8% of the presale amount for the first 2 years, and then plans
to distribute 40% of net operating profit. The estimated distributable dividends are estimated as
below.
[Table] Dividend Estimation – Presale Rate: 50% (in USD)
Type 2009 2010 2011 2012 2013 2014 2015
Presale Revenue - 26,442,500 26,442,500
Operating Profit,
Net of Tax 934,389 18,250,195 19,279,944 5,407,520 5,845,949 6,068,872 6,300,043
Dividend Rate(*) 8% 8% 40% 40% 40% 40%
Dividend Amount 1,057,700 3,173,100 1,081,504 1,169,190 1,213,774 1,260,009
Available cumulative cash flow based on the operating cash flow of Chateau the Bali
(Ungasan) is estimated as below.
[Table] Cumulative Cash Flow Estimation – Presale Rate: 50% (in USD)
Type 2009 2010 2011 2012 2013 2014 2015Operating Cash
Flow, Net of Tax 934,389 18,250,195 19,279,944 5,407,520 5,845,949 6,068,872 6,300,043
Dividends - 1,057,700 3,173,100 1,081,504 1,169,190 1,213,774 1,260,009
Net Cash Flow (*) 934,389 17,192,495 16,106,844 4,326,016 4,676,759 4,855,098 5,040,034
Cumulative Cash
Flow 934,389 18,126,884 34,233,728 38,559,744 43,236,503 48,091,600 53,131,635
(*) As funding method is not confirmed, financing cost and reserve capital for operating are not
considered in the estimation.

Strictly Private and Confidential
51
[DC2]
When the presale rate is 60%
The Company plans to distribute 8% of the presale amount for the first 2 years, and then plans
to distribute 40% of net operating profit. The estimated distributable dividends are estimated as
below.
[Table] Dividend Estimation – Presale Rate: 60% (in USD)
Type 2009 2010 2011 2012 2013 2014 2015
Presale Revenue - 31,731,000 31,731,000
Operating Profit,
Net of Tax 934,389 18,250,195 19,279,944 5,407,520 5,845,949 6,068,872 6,300,043
Dividend Rate(*) 8% 8% 40% 40% 40% 40%
Dividend Amount 1,269,240 3,807,720 1,297,805 1,403,028 1,456,529 1,512,010
Available cumulative cash flow based on the operating cash flow of Chateau the Bali
(Ungasan) is estimated as below.
Table] Cumulative Cash Flow Estimation – Presale Rate: 60% (in USD)
Type 2009 2010 2011 2012 2013 2014 2015Operating Cash
Flow, Net of Tax 934,389 21,105,985 22,135,734 5,407,520 5,845,949 6,068,872 6,300,043
Dividends - 1,269,240 3,807,720 1,297,805 1,403,028 1,456,529 1,512,010
Net Cash Flow (*) 934,389 19,836,745 18,328,014 4,109,715 4,442,921 4,612,343 4,788,033
Cumulative Cash
Flow 934,389 20,771,134 39,099,148 43,208,863 47,651,784 52,264,127 57,052,160
(*) As funding method is not confirmed, financing cost and reserve capital for operating are not
considered in the estimation.
Strictly Private and Confidential
52
[DC2]
Ⅴ. Risk Factors and Solutions for the Project
Risk factors and solutions for the risks are as follows.
Laws and Regulation Risk
< Risk > In accordance with Indonesia regulation, foreigners cannot own land in Indonesia
< Solution>
As the CEO of the developer transferred the ownership of the land to his relatives, no risk
regarding land acquisition exists.
Managing Risk
< Risk > Low brand recognition might lead to unfavorable operating results
< Solution >
The developer has 5 years of experience in operating pool villa resort in Bali. Moreover, by
recruiting the general manager who has experience in working for five star hotels for more
than 20 years, the operating risk is minimized.
Presale Risk
< Risk > Risk of not selling (pre-sale) enough villas
< Solution >
The Company plans to construct and presale the most luxurious resorts.
The Company plans to contract with global presale agencies in the world to enhance the
presale rates by utilizing the Global Network.
Exchange Rate Risk
< Risk > Fluctuation risk in Indonesian currency
< Solution >
As Rupee continues to depreciate, gains on currency translation is expected when the

Strictly Private and Confidential
53
[DC2]
borrowed fund is redeemed.
Country Risk
< Risk > Possible Terrorist’s Attacks in Bali
< Solution >
As Indonesian government provides more secured policies after the terrorist’s attack in
October, 2005, another terrorist’s attack seems unlikely.


![Hotel & Branded Residences BALI - [Primary] …country-clone.htl-web.com/files/2017/02/Bali-Hotel... · E-commerce providers including Traveloka, Pegipegi and Blibli report ... Hotel](https://img.dokumen.tips/doc/110x75/5aebc7e87f8b9ae5318e22a2/hotel-branded-residences-bali-primary-country-clonehtl-webcomfiles201702bali-hotele-commerce.jpg)