Embed Size (px)
Citation preview

Balancing the Commitment to Lean and Quality in Government
If your computer does not have speakers, please dial in at:1-646-307-1001
Access Code: 165-549-397

Introduction
Everyone is in favor of efficiency and effectiveness in government, and it is generally recognized that Lean and Quality Improvement efforts are best practices for bringing that about. But managers everywhere experience a crowded arena of management issues for their attention, and are not sure how to bring one more initiative onto their crowded daily management agenda.

Process Management often ignored!
• Managers get lost in a forest of details and tasks, and communicating about incidents and issues.
• Taking charge to respond to lapses.• Evaluating people and assessing
whether they are stars or laggers, and what to do about them.

What else should a manager do?Process management defines the incremental activities that transform an input to a valuable output for an end-user or customer.
Process is the “atomic particle” of work unit management, and the act of standardizing that process to get a uniform output is a
basic activity of process management. 4
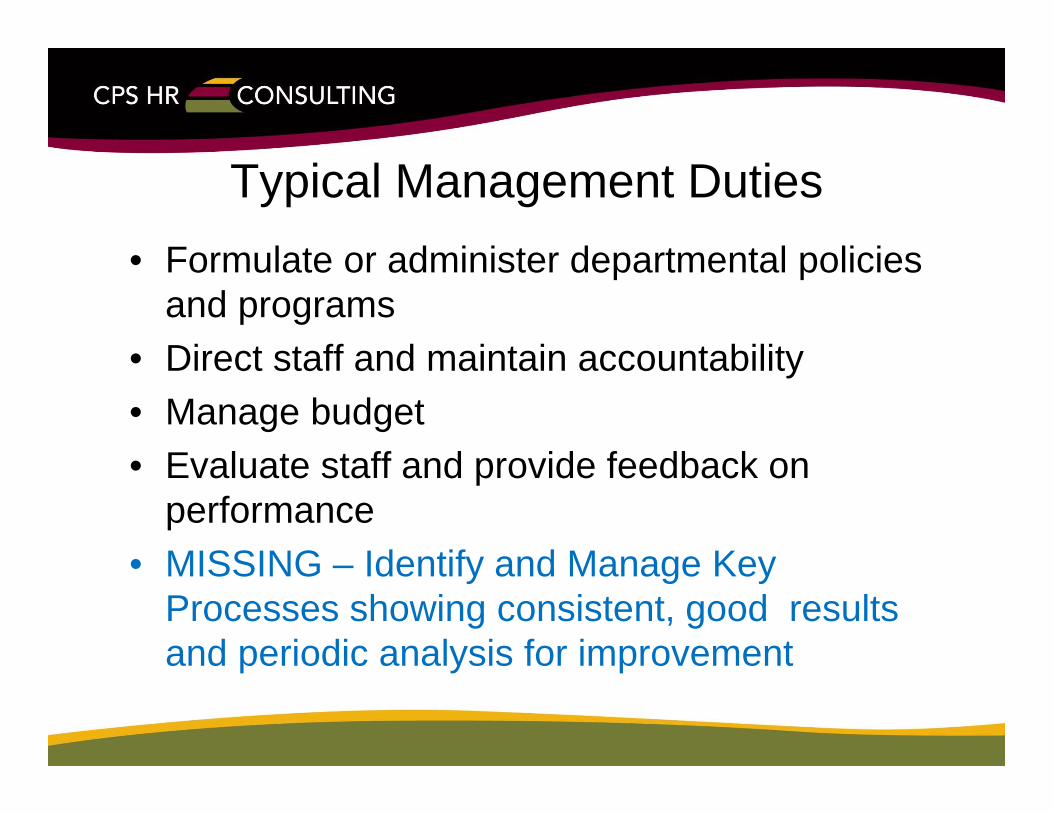
Typical Management Duties• Formulate or administer departmental policies
and programs• Direct staff and maintain accountability • Manage budget • Evaluate staff and provide feedback on
performance• MISSING – Identify and Manage Key
Processes showing consistent, good results and periodic analysis for improvement

Why should we?• Estimates are that process non-value add
and waste comprises from 80-95% of all process resource cost.
• “Approximately 30 to 50 percent of the cost in a service organization is caused by costs related to slow speed or performing rework to satisfy customer needs.”
- Lean Six Sigma for Service, Michael L. George, McGraw Hill, 2003.

Key LEAN Process Measures• Most important are:
– Process Time (The time it takes to actually complete the work) versus Lead Time (Elapsed time, both at a work station and for the process)
– Complete and Accurate: The percent of time that each transaction was able to be processed without clarification, correction, or return.
• Analysis of either and both will red flag primary areas for improvement
7
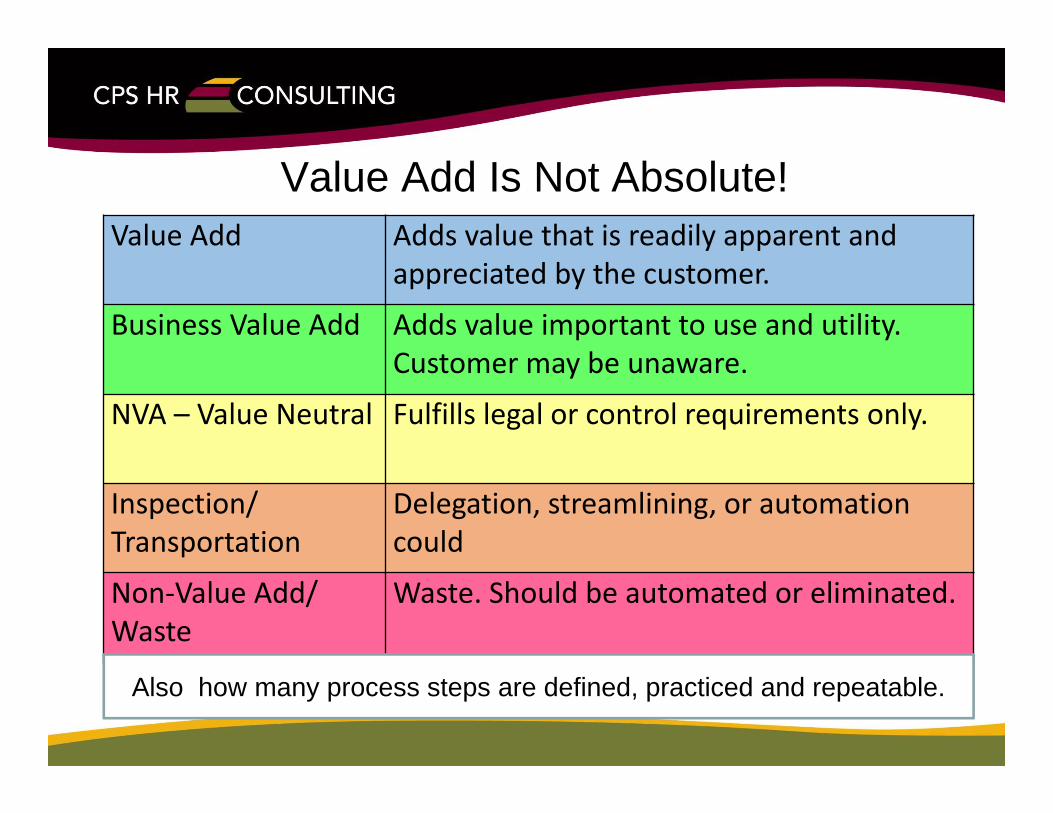
Value Add Is Not Absolute!Value Add Adds value that is readily apparent and
appreciated by the customer.
Business Value Add Adds value important to use and utility. Customer may be unaware.
NVA – Value Neutral Fulfills legal or control requirements only.
Inspection/ Transportation
Delegation, streamlining, or automation could
Non‐Value Add/ Waste
Waste. Should be automated or eliminated.
Also how many process steps are defined, practiced and repeatable.
Typical Focus Areas of Process Improvement
• Waste• Time in process/ flow• Variation• Workplace environment• Supply management
9
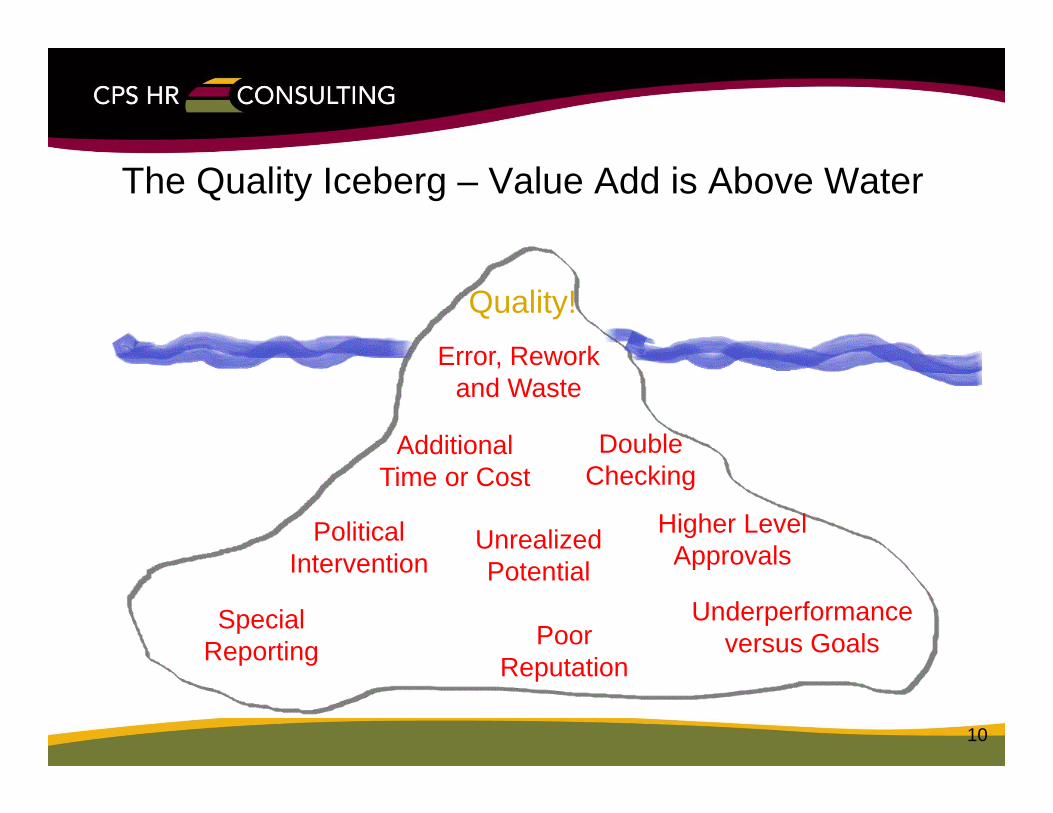
The Quality Iceberg – Value Add is Above Water
10
Quality!
Underperformance versus Goals
Political Intervention
Poor Reputation
Additional Time or Cost
Unrealized Potential
Special Reporting
Error, Rework and Waste
Higher Level Approvals
Double Checking
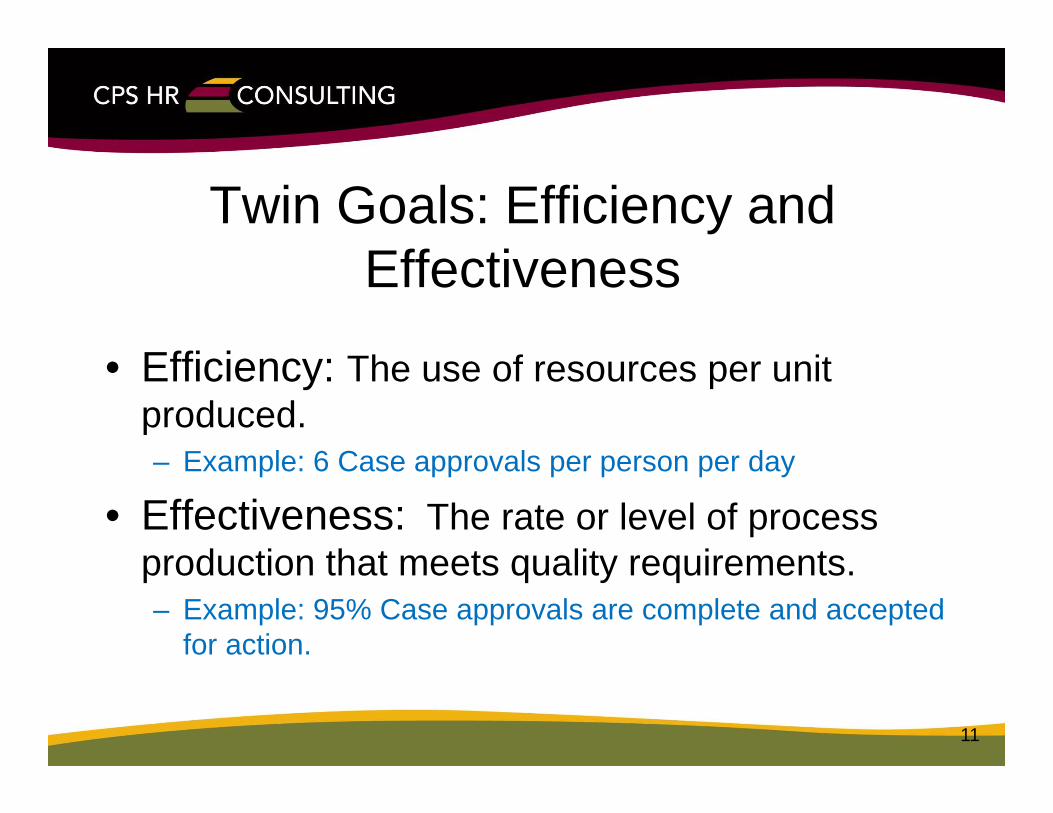
Twin Goals: Efficiency and Effectiveness
• Efficiency: The use of resources per unit produced.– Example: 6 Case approvals per person per day
• Effectiveness: The rate or level of process production that meets quality requirements.– Example: 95% Case approvals are complete and accepted
for action.
11
12
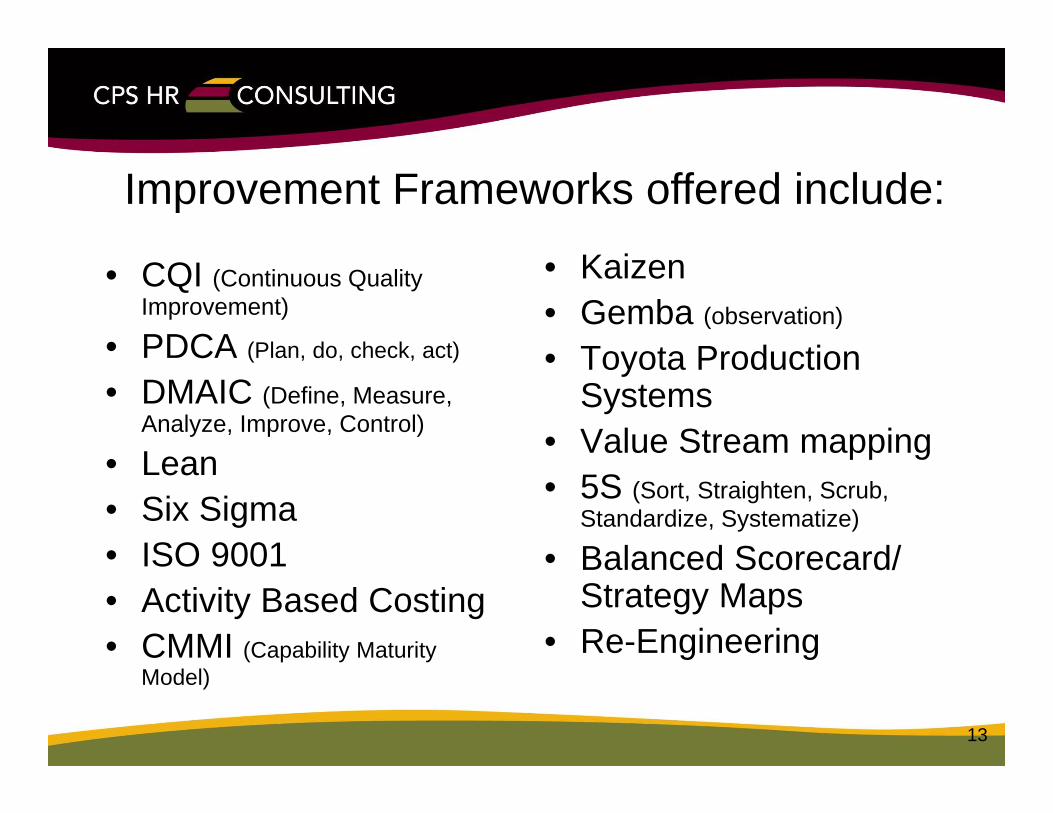
• CQI (Continuous Quality Improvement)
• PDCA (Plan, do, check, act)
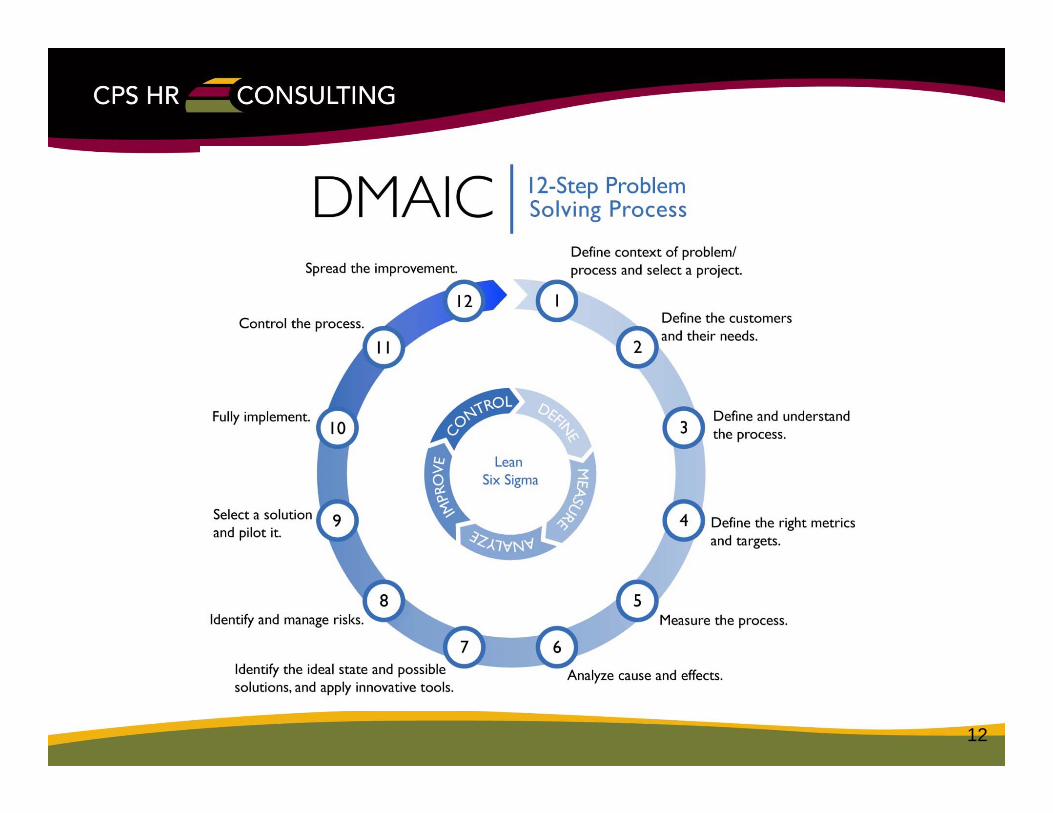
• DMAIC (Define, Measure, Analyze, Improve, Control)
• Lean• Six Sigma• ISO 9001• Activity Based Costing• CMMI (Capability Maturity
Model)
• Kaizen• Gemba (observation)
• Toyota Production Systems
• Value Stream mapping• 5S (Sort, Straighten, Scrub,
Standardize, Systematize)
• Balanced Scorecard/ Strategy Maps
• Re-Engineering
13
Improvement Frameworks offered include:
Most Applicable ‘Rules’ of Lean
• Focuses on identification of waste• On maximizing process velocity• Analyzing process flow and delay times• Separation of value-added from non-value
added work• Structured Problem Solving
14

Quality in State Government Survey results
• Estimated 20% of all state agencies now have formal Lean Quality Improvement programs in place. Could be as low as 14%.
• Quality in government initiatives have a short life-cycle, and most do not survive more than three to five years.
• Average duration of all reported statewide quality efforts was about two years, with 29% reporting being in place for less than one year.
• Efforts are often initiated by a single executive leader in government, and do not survive changes in political administration .
• Quality efforts are voluntary and only encouraged and supported by statewide offices where they exist.
• Only 45% of respondents believed that their commitment to quality efforts would be good for their own future career advancement.
• Just under half (45%) of respondents said they had case studies or documented results from process improvement teams
15
But most problem solving models miss stabilization and management
• Models assume cycle of continuous improvement, which not all organizations will support
• Continuous Improvement focus tends to make quality efforts event based and ‘celebrity’ focused
• Models do not assume process stabilization and management, which is much more important
16
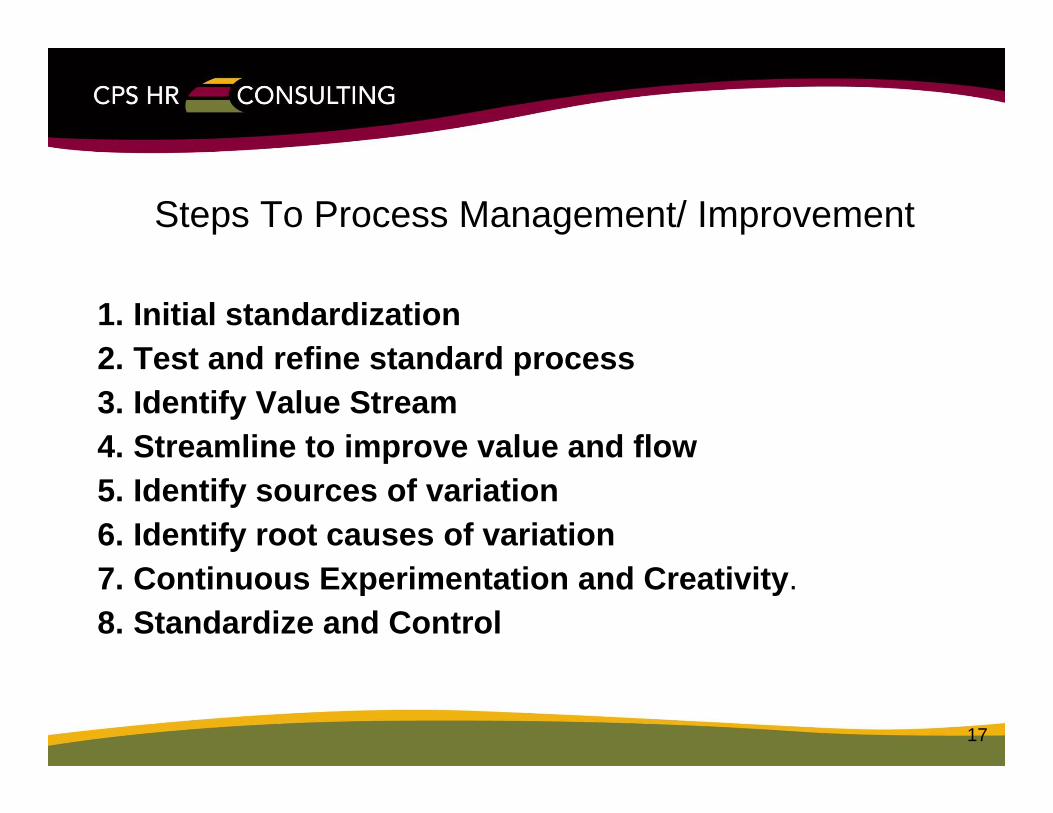
Steps To Process Management/ Improvement
1. Initial standardization2. Test and refine standard process3. Identify Value Stream4. Streamline to improve value and flow5. Identify sources of variation6. Identify root causes of variation7. Continuous Experimentation and Creativity. 8. Standardize and Control
17
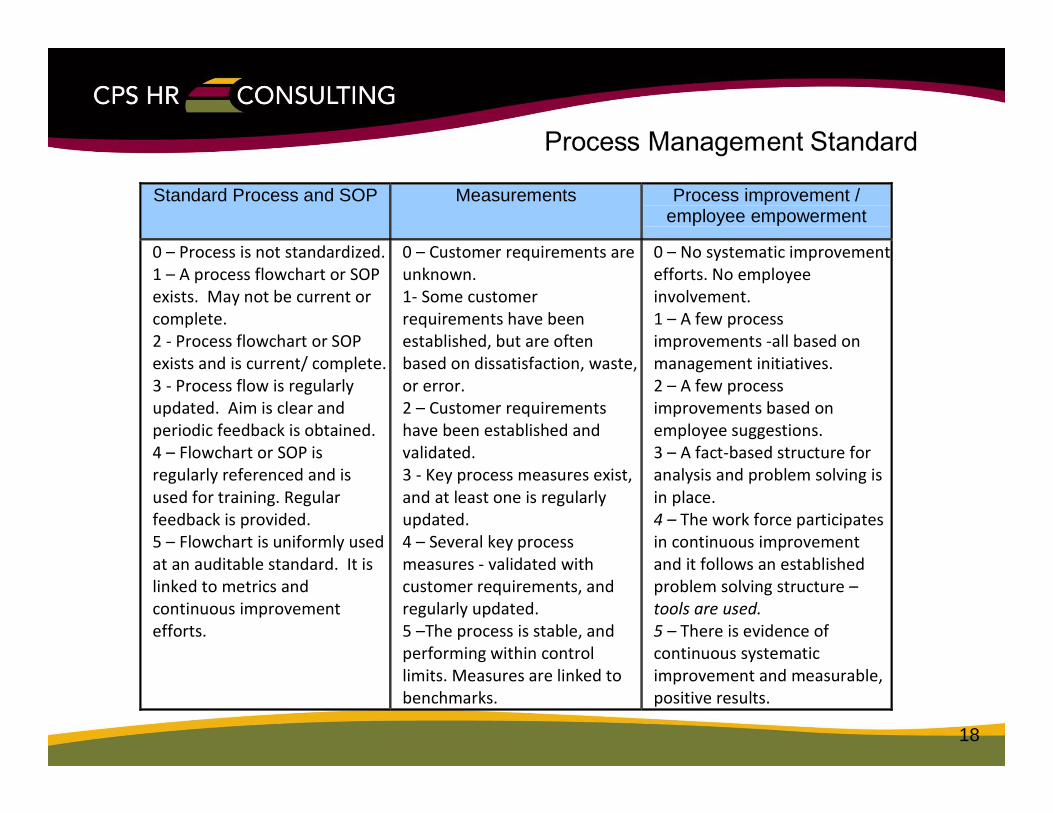
Standard Process and SOP Measurements Process improvement / employee empowerment
0 – Process is not standardized.1 – A process flowchart or SOP exists. May not be current or complete. 2 ‐ Process flowchart or SOP exists and is current/ complete. 3 ‐ Process flow is regularly updated. Aim is clear and periodic feedback is obtained. 4 – Flowchart or SOP is regularly referenced and is used for training. Regular feedback is provided. 5 – Flowchart is uniformly used at an auditable standard. It is linked to metrics and continuous improvement efforts.
0 – Customer requirements are unknown. 1‐ Some customer requirements have been established, but are often based on dissatisfaction, waste, or error. 2 – Customer requirements have been established and validated. 3 ‐ Key process measures exist, and at least one is regularly updated. 4 – Several key process measures ‐ validated with customer requirements, and regularly updated. 5 –The process is stable, and performing within control limits. Measures are linked to benchmarks.
0 – No systematic improvement efforts. No employee involvement. 1 – A few process improvements ‐all based on management initiatives. 2 – A few process improvements based on employee suggestions. 3 – A fact‐based structure for analysis and problem solving is in place. 4 – The work force participates in continuous improvement and it follows an established problem solving structure – tools are used. 5 – There is evidence of continuous systematic improvement and measurable, positive results.
18
Process Maturity Standard
• Process – Is it standardized and repeatable, known and up-to-date.
• Measures – Capture one or more validated requirement. Acceptable, tracked and stable.
• Record of analysis and improvement with employee engagement.

Can Score the Overall Efficiency and Effectiveness of ALL Department Processes
90 35 45 7565 95 80 10075 95 85 4525 60 65 5565 70 90 8070 80 65 50
Overall Organization 69.2
Division 1 Division 3 Division 4Division 2
20
Quality Standards for Highly Effective Government
21

Process Improvement uses discretionary time: This means …
• It is important not to over-commit• Ensure that results are achieved• Ensure that results are documented• Publicize achievements
22
Team-based improvement should be operational, logical, and holistic
• It begins with documentation of a key process, its requirements, and current problems
• It is supported by clear task and decision definition, often developed by “subject matter experts” – the people who work in the process including its, management, customers and suppliers
• Often need management support for implementation.
23

Defining the “context” implies:
• Team and charter• Problem statement and description of
the problem• Cost of (lost) quality• Record of analysis• Storyboard at the end
24

Why use teams?
• For complex problems.• Where working level people interact with
each other across departmental boundaries.• Where knowledge sharing is part of the
solution.• Where tracking and process ownership is
imperative.
25
Process Improvement as a Project -Not a Decision!
• “Most business-people treat decision making as an event – a discrete choice that takes place at a single point in time…(but that view) overlook(s) larger social and organizational contexts, which ultimately determine the success of any decision.”
• “Decision making is not an event. It’s a process that unfolds over weeks, months, or even years; one that is replete with personal nuances and institutional history… one that requires support at all levels of the organization when it comes time for execution.”– What you don’t know about making decisions, by David Garvin and
Michael Roberto, Harvard Business Review, Sept. 2001.

Test and Clarify is the realm of teams
• Processes are organizational artifacts• They are built over time by multiple parties• Changes in process steps can therefore
have secondary impacts all over the place!• Given that risk is the bane of government
leaders everywhere, its no wonder that process improvement is feared, and that it can often use an Executive Sponsor.
27
Why can’t a manager decide what to do without a team?
• “Most business-people treat decision making as an event – a discrete choice that takes place at a single point in time…(but that view) overlook(s) larger social and organizational contexts, which ultimately determine the success of any decision.”
• “Decision making is not an event. It’s a process that unfolds over weeks, months, or even years; one that is replete with personal nuances and institutional history… one that requires support at all levels of the organization when it comes time for execution.”– What you don’t know about making decisions, by David Garvin and
Michael Roberto, Harvard Business Review, Sept. 2001.
28
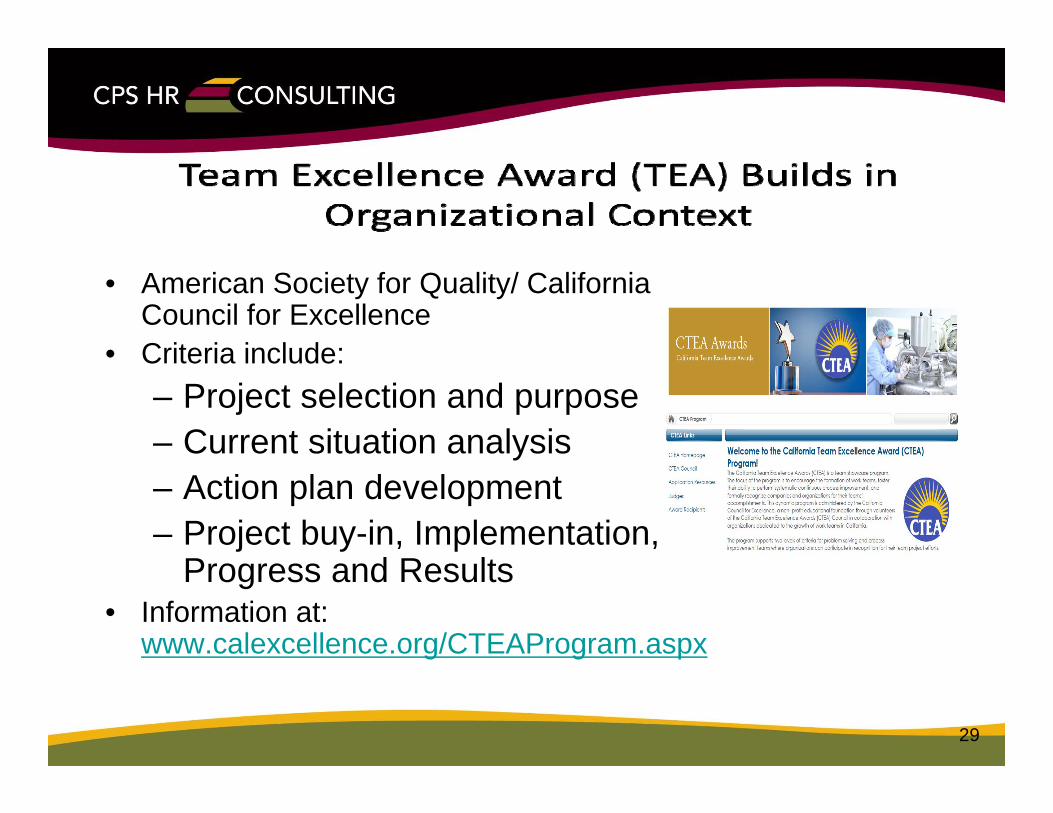
• American Society for Quality/ California Council for Excellence
• Criteria include:– Project selection and purpose– Current situation analysis– Action plan development– Project buy-in, Implementation,
Progress and Results• Information at:
www.calexcellence.org/CTEAProgram.aspx
29