Embed Size (px)
Citation preview
Abstract—Applying multi-applications to Network-on-Chip
(NoC) communication structure has been receiving increasing
attention recently. In this paper, we present a multi-application
mapping algorithm for 3D NoC, which target to balance on-chip
latency. Besides, we propose an accurate analytical delay model
based on M/G/1 queuing model, which can be used to optimize
performance and verify the constraint of delay in terms of flow
level. In order to verify the efficiency of our proposed approach,
several sets of multi-application benchmarks are evaluated.
Simulation results show that the proposed algorithm reduces the
maximum average latency by 18.32% and the standard
deviation of latency by 15.57%.
Index Terms—3D Network-on-Chip, M/G/1 queuing model,
multi-application mapping
I. INTRODUCTION
ith the advance of semi-conductor technologies, the
amount of IP cores integrated on one chip continue to
increase, which means that the challenge of communication is
serious than ever. Network-on-Chip (NoC) has been
introduced as a promising communication mechanism to
provide high bandwidth and performance [1]. Meanwhile, the
advent and increasing viability of 3D Integrated circuits make
it possible to move from 2D NoC to 3D NoC [2]. 3D NoC has
been adopted as a communication centric paradigm to address
the interconnect issues in a many-core system.
Application mapping is one of the effective ways to
optimize on-chip network performance, which is exercised at
the early stage of the NoC based many-core system design.
Large numbers of researches [3-5] have been done for
mapping applications onto NoC architectures. In [3], Hu et al.
presented a branch and bound algorithm which maps the tasks
of an application to NoC nodes such that the total
communication energy consumption is minimized under
specified performance constraints. A NAMP algorithm is
proposed to map IP cores onto the NoC architecture under the
Manuscript received July 10, 2015. This work is supported by the Natural
Science Foundation of China under Grant 61106018 and 61376025, the
Industry-academic Joint Technological Innovations Fund Project of Jiangsu
under Grant BY2013003-11. Gui Feng, the College of Electrical and Information Engineering, Nanjing
University of Aeronautics and Astronautics(NUAA), Nanjing 210016,
China (email:[email protected])
Fen Ge, the College of Electrical and Information Engineering, NUAA,
Nanjing 210016, China (email: [email protected]).
Ning Wu, the College of Electrical and Information Engineering, NUAA,
Nanjing 210016, China (e-mail: [email protected]).
bandwidth constraint with the aim of minimizing
communication delay [4]. Tang et al. proposed a two-step
genetic algorithm and the related software for mapping
applications on a fixed NoC architecture [5].
However, all these above typical approaches focus on the
mapping of a single application. With the number of on-chip
cores increasing, a single application could not make full use
of the resources on one chip. To be cost effective, several
different applications are often integrated on the same chip
and executed in parallel. Several multi-application mapping
methods are also proposed. Murali et al. presented a method
to map multiple use-cases onto the NoC architecture with the
constraints of each use-cases satisfied [6]. However, this
method may suffer time overhead incurred by reconfiguring
the NoC and loading new applications. Multi-objective
adaptive immune algorithm(M2AIA) is proposed to
minimize latency and power consumption [7]. In another
approach called Incremental approach (INC) [8], it mainly
takes two steps: the region selection and the task allocation.
INC deals with multi-applications in sequentially, which may
lead to unfairness for resources between applications. Besides,
all these approaches do not apply to 3D NoC.
Moreover, there are another two important issues for
multi-application mapping, which the above approaches do
not consider. One issue is that multi applications running in
parallel on the same chip often have different and strict
latency requirements. Simply taking the number of hops as the
metrics of the packet latency [9] can not satisfy the
performance evaluation requirements in the system design,
which means an accurate analytical delay model is needed in
this case. Another issue is that packet latency deviation is a
critical metric for systems to provide quality-of-service
guarantees [10]. Hence, not only the overall network latency
should be reduced, the multi-application mapping should also
balance the average packet latency experienced by different
applications.
To address the issues presented above, in this paper, we
propose a multi-application mapping framework for 3D NoC
utilizing an accurate analytical delay model based on M/G/1
queuing model, which target to balance latency among
multi-applications. The rest of the paper is organized as
follows: Section II describes the M/G/1 delay model and
problem definition. Section III presents our delay-aware
mapping framework based on genetic algorithm.
Experimental results are demonstrated in section IV and
finally we conclude our work in section V.
Balancing 3D Network-on-Chip Latency in
Multi-Application Mapping based on M/G/1
Delay Model
Gui Feng, Fen Ge, and Ning Wu
W
Proceedings of the World Congress on Engineering and Computer Science 2015 Vol I WCECS 2015, October 21-23, 2015, San Francisco, USA
ISBN: 978-988-19253-6-7 ISSN: 2078-0958 (Print); ISSN: 2078-0966 (Online)
WCECS 2015
II. PROBLEM FORMULATION AND DEFINITIONS
A. 3D NoC architecture model
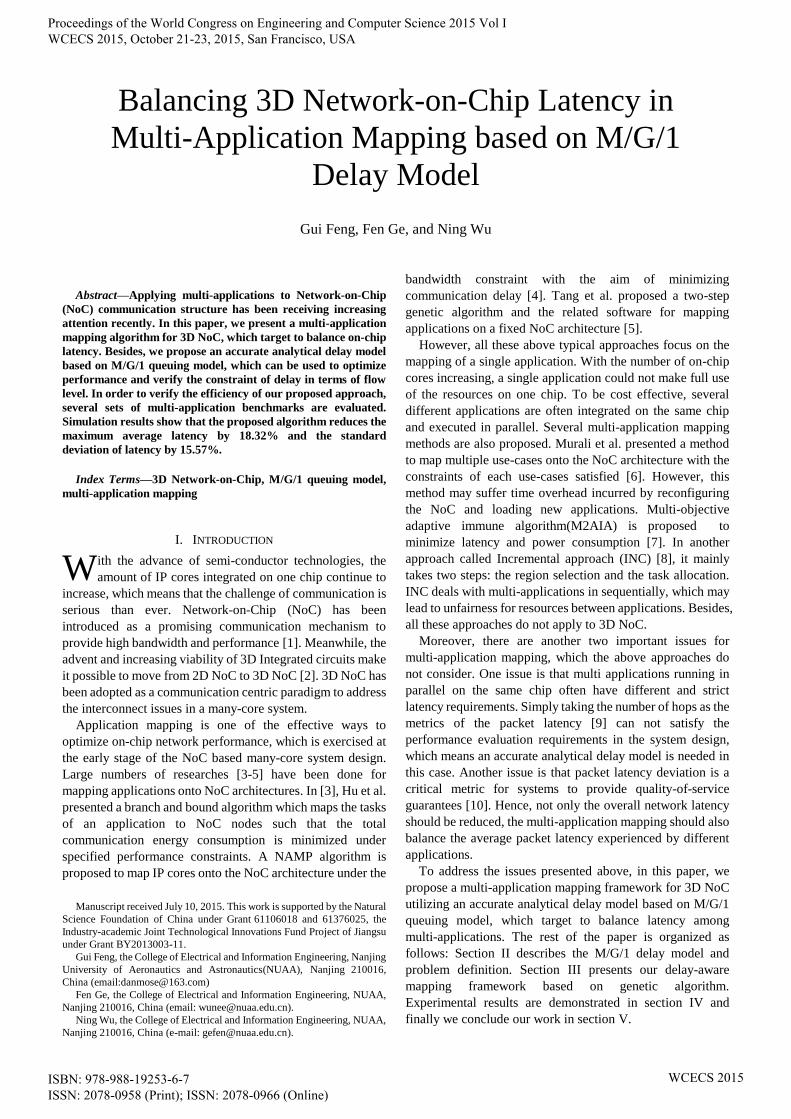
3D Mesh based NoC architecture is shown in Fig.1(a). In
3D NoC, IP cores are distributed on different 2D layers.
Various layers are stacked on top of each other with direct
vertical interconnects. The structure of a single node is
depicted in Fig.1(b). Every node contains an intellectual
property (IP) core and a router with input channels and output
channels. Each IP core performs its own computational,
storage or I/O processing functionality, and is equipped with a
network interface (NI). NI translates data between IP cores
and routers by packeting/unpacketing data packets and also
manages the packet injection process.
0IP0
1IP1
2 IP2 3IP3
4IP4 5
IP5
6IP6 7 IP7
IP
NI
LC
Crossbar
Switch
Routing&
Arbitration
LC LCRouter
Input C
han
nels
Outp
ut C
han
nels
Injection
channel
Ejection
channel
LC
LC
LC
LC
LC
LC
LC
LC
LC
LC
LC
(a) A 3D Mesh based architecture (b) A node structure of 3D NoC
Fig. 1. A 3D Mesh based NoC architecture and a node structure in this
architecture
The router is the key component of NoC, which is
responsible for routing data packets on the on-chip network,
thus it has a great influence on the network latency. For 3D
NoC architecture, the router should have seven input/output
ports in seven directions (East(E), South(S), West(W),
North(N), Up(U), Down(D), Local(L)). And it comprises the
following major modules.
Buffer. This is a finite FIFO buffer for storing packets in
transmission. In the model shown in Fig.1(b), a buffer is
associated with each input physical channel and each output
physical channel. Usually, a buffer takes virtual channels to
improve performance. In our work, each port of the router is
equipped with six virtual channels, which equals to six
possible directions from the adjacent router.
Link controller(LC). The flow of packets across the
physical channel between adjacent routers is implemented by
the link controller. The link controllers on either side of a
channel coordinate to transfer flits.
Crossbar switch. This module is responsible for
connecting input channels to output channels.
Routing and arbitration unit. This module implements the
routing algorithms, selects the output channel for an incoming
packet, and accordingly sets the crossbar switch. In this paper,
we take deterministic routing algorithm.
B. M/G/1 delay model
According to the M/G/1 queuing model that is widely used
in the network performance analysis, the delay analytical
model we proposed for 3D NoC is based on the following
assumptions:
(1) Each node in the network sending packets is independent
of each other, and the arrival rate of the packets obeys the
Poisson distribution.
(2) The network uses wormhole switching technology and
XYZ routing algorithm.
(3) The length of the packet is fixed as M, and the width of the
input buffer in the router is equal to the width of a flit.
(4) The length of input buffer for each virtual channel in the
router is fixed to be F flits (1<<F<M).
(5) The local port of the router has infinite input buffer, which
means it can deal with the data packets as fast as possible.
A specific application mapped on the NoC architecture
usually consists of multiple data flows which realize the
packets transmission from the source node to the destination
node through on-chip network. The average network delay
can be obtained by calculating the average delay of all the
data flows in the application, which can be computed as
follows:
, ,
1 1 1
1 1( ( 1) )
j j j j
m m d
N Li b x y z dir b Si
i i j
T T T d B T M Wm m
(1)
where m is the number of the data flows. TLi denotes
transmission delay of packets in a flow in NoC. Tb represents
the time of a flit passing through a router with non-blocking.
, ,j j j jx y z dirB is the block delay of a header flit that is blocked in
the input buffer of the router j in the dir direction. The
coordinates of the router is given by (x,y,z). dir represents the
forward direction in a router, e.g. East(E), South(S), West(W),
North(N), Up(U), Down(D) and Local(L). SiW is the waiting
time of a head flit that is blocked in the source node.
TABLE I
PARAMETERS AND NOTATIONS IN ANALYTICAL MODEL
Parameters Explanation
m Number of the date flows
TLi Transmission delay of packets in a date flow in NoC
Tb Time of a flit travel through a router with non-blocking
Bxj,yj,zj,dirj Block delay of a header flit that is blocked in the input
buffer of the dir direction at the router j
d Hops of a packet transmitting from the source node to the
destination node
x,y,z,dir Block probability of a packet that is blocked in the dir
direction of the buffer at (x,y,z).
x,y,z,dir Average waiting time of a packet being blocked in the
buffer
Tix,y,z,dir Average service time of a packet
fij Probability of the packets transmitting from the i direction
to the j direction the router
ij Arrival rate of packets in the input channel of the dir
direction
j,k,l Packet injection rate of the node (j,k,l)
d(j,k,l)(j’,k’,l’) Probability of sending packets from node(j,k,l) to node
(j’,k’,l’)
R(j,k,l,j’,k’,l’,
x,y,z,dir)
Routing function
Px,y,z,dir’ Probability of buffer being occupied at (x,y,z)
x,y,z,dir->L Congestion probability of the data packet transmitting
from the input buffer of dir direction to the local port
T0 Service time of the network interface at the destination
node
Ai Number of the following routers that will affect the
average service time
Px,y,z,dir Probability of the virtual channel being occupied
v Number of virtual channels
dir,x,y,z,dir’ Arrival rate of the data packet from the dir direction of the
upstream router to the dir’ direction of the local router
TR Delay of the transmit network
x,y,z,L Arrival rate of the packet from the source node to the
transmit network
Proceedings of the World Congress on Engineering and Computer Science 2015 Vol I WCECS 2015, October 21-23, 2015, San Francisco, USA
ISBN: 978-988-19253-6-7 ISSN: 2078-0958 (Print); ISSN: 2078-0966 (Online)
WCECS 2015
From (1), it is clear to see that the key to calculate the
average network delay in the application mapping is to attain
the values of , ,j j j jx y z dirB and SiW . All the parameters and
their explanation used in our proposed analytical model are
summarized in Table I.
(1) Calculate , , ,x y z dirB
The block delay of a header flit that is blocked in the input
buffer of the dir direction at the router (x,y,z) can be
calculated as follows:
, , , , , , , , ,x y z dir x y z dir x y z dirB (2)
where , , ,x y z dir denotes the block probability of a packet
being blocked in the buffer. , , ,x y z dir is the average waiting
time of a packet being blocked in the buffer.
In order to calculate, , ,x y z dir , we need to calculate the
transmit matrix F represented by:
0
0
0
0
0
0
0
NE NS NW NU ND NL
EN ES EW EU ED EL
SN SE SW SU SD SL
WN WE WS WU WD WL
UN UE US UW UD UL
DN DE DS DW DU DL
LN LE LS LW LU LD
f f f f f f
f f f f f f
f f f f f f
F f f f f f f
f f f f f f
f f f f f f
f f f f f f
(3)
In (3), ijf is the probability of the packets transmitting
from the i direction to the j direction of the router, which can
be calculated as follows:
ijij
ij
j
f
(4)
where ij is the arrival rate of the packets in the dir direction
of the input channel.
, , , , , ( , , )( ', ', ')
, , ', ', '
( , , , ', ', ' , , , )x y z dir j k l j k l j k l
j k l j k l
d R j k l j k l x y z dir
(5)
where ( , , , ', ', ' , , , )R j k l j k l x y z dir is the routing function.
When the source node sends the data packet to the destination
node using the input channel of the dir direction in the router
(x,y,z), the function is set to be 1, else to be 0. As we take the
XYZ routing algorithm, it is easy to get the packet arrival rate
of each input channel in a router. Take the dir=E as an
example to calculate the blocking probability, that is:
, , , , 1, , , 1, , , , 1,
, , 1, 1, , , , , ,
x y z E EN x y z S ES x y z N EU x y z D
ED x y z U EW x y z W EL x y z E L
f P f P f P
f P f P f
(6)
where Px,y,z,dir’ represents the probability of the buffer being
occupied in the dir’ direction at the router(x,y,z), which will be
discussed in detail in the following. , , ,x y z dir L is the
congestion probability of the data packet transmitting from
the input buffer of the dir direction to the local port at the
router (x,y,z). When the congestion happens, the local port
should service for transmission from other directions. Hence,
it can be drawn that:
, , , ' '
', ' '
x y z dir L dir L dir L
dir dir dir dir
(7)
The average waiting time of a packet being blocked in the
buffer , , ,x y z dir can be drawn from the M/G/1 queuing model:
2
, , , , , ,
, , , 2
, , , , , , , , ,
( )1
2(1 )
x y z dir x y z dir b
x y z dir
x y z dir x y z dir x y z dir
Ti M T
Ti Ti
(8)
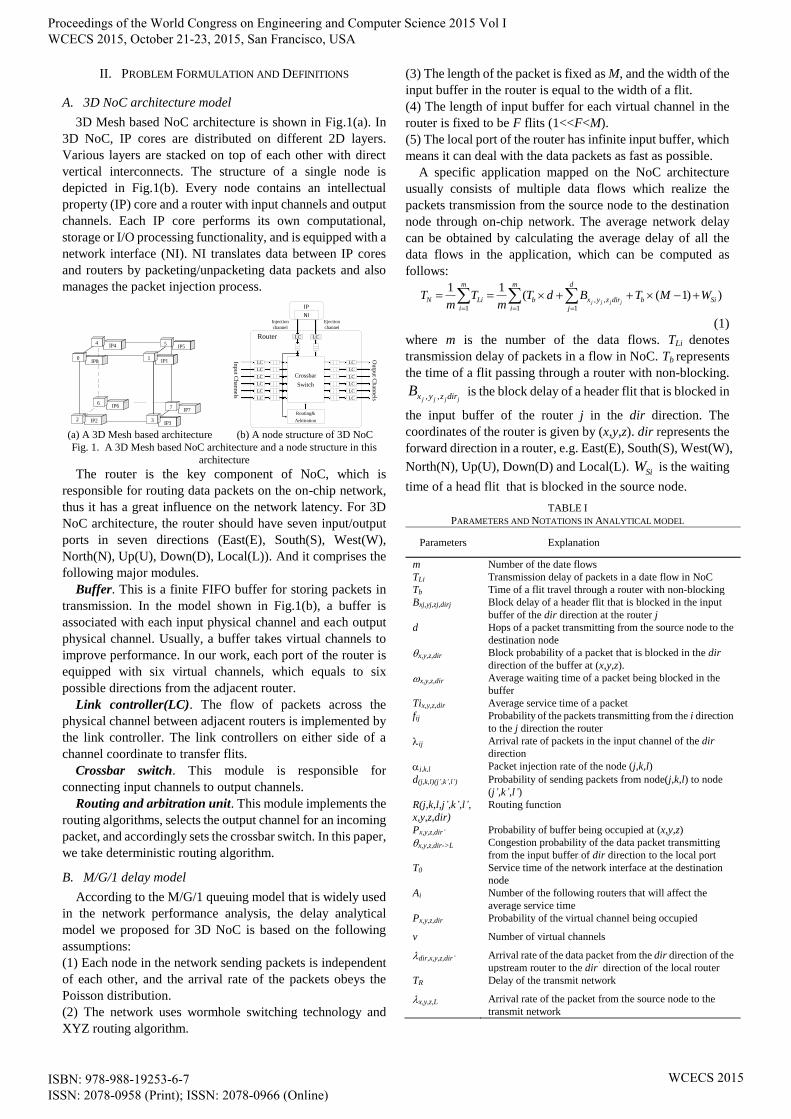
In this study, we consider the wormhole switching with
XYZ routing algorithm. A packet consisted of multiple flits is
dispersed on multiple links. The elapsed time of packets in
one link, which starts from the header flit entering this link to
the last load flit leaving the link.
Fig. 2. Packet transmission with wormhole switching
One example of packet transmission with wormhole
switching is shown in Fig.2, which presents the transmission
process of a packet from router 6 to router 1. It assumes that
the destination node is router 1, and the packet has 6 flits. In
Fig.2(a), when the whole packet leaves the router 4, the
header flit do not arrive the destination node, thus, only router
5 and router 3 will affect their average service time.
Meanwhile, in Fig.2(b), when the packets have not leave
router 2, the header flit has entered into the destination node.
Hence, the following routers will affect its service time. From
these, we can get the average service time of the ith
router
backward from the destination node along the transmission
path: 1
1,2,3,...
0{
i
b j
i j i Ai
b
M T B iT
iM T
(9)
where 0T is the service time of the network interface at the
destination node. iA is the number of the following routers
that will affect the average service time, which can be
calculated as follows:
[ / ] 1 [ / ]
1{i
M F d i M FA
d i else
(10)
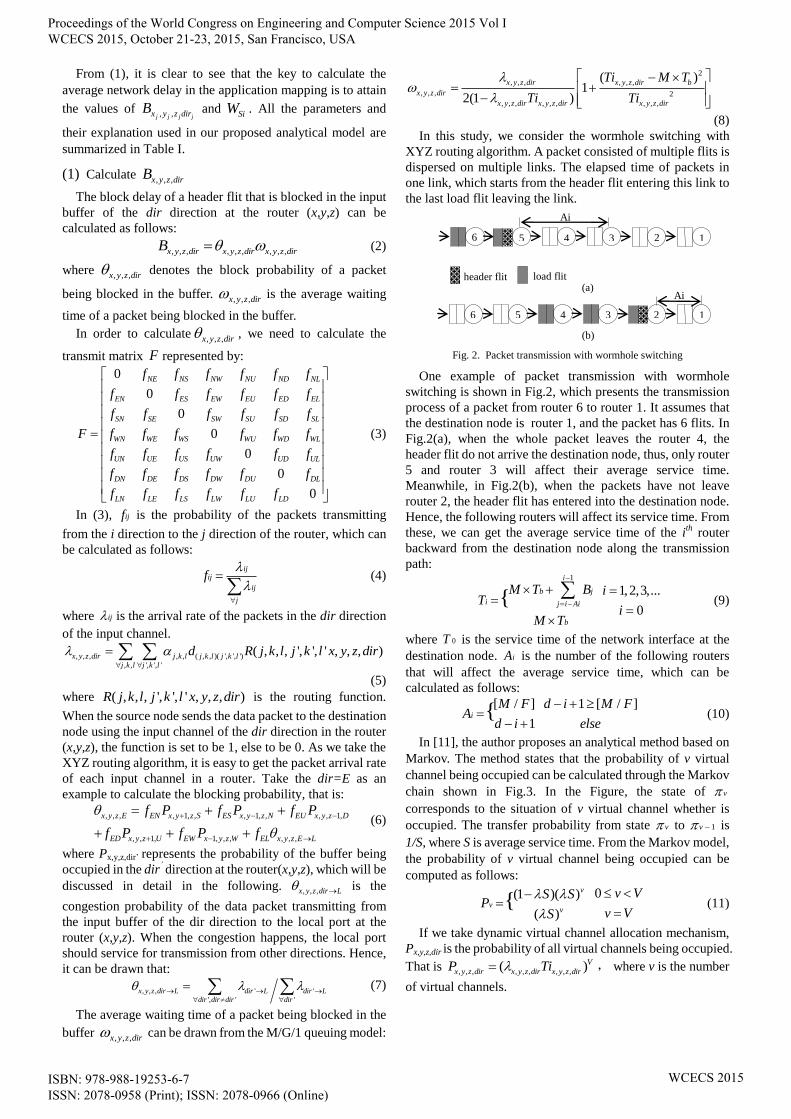
In [11], the author proposes an analytical method based on
Markov. The method states that the probability of v virtual
channel being occupied can be calculated through the Markov
chain shown in Fig.3. In the Figure, the state of v
corresponds to the situation of v virtual channel whether is
occupied. The transfer probability from state v to 1v is
1/S, where S is average service time. From the Markov model,
the probability of v virtual channel being occupied can be
computed as follows:
0(1 )( )
( ){
v
vv
v VS SP
v VS
(11)
If we take dynamic virtual channel allocation mechanism,
Px,y,z,dir is the probability of all virtual channels being occupied.
That is , , , , , , , , ,( )V
x y z dir x y z dir x y z dirP Ti , where v is the number
of virtual channels.
header flit load flit (a)
(b)
6
6
5
5
4
4
3
3
2
2
1
1
Ai
Ai
Proceedings of the World Congress on Engineering and Computer Science 2015 Vol I WCECS 2015, October 21-23, 2015, San Francisco, USA
ISBN: 978-988-19253-6-7 ISSN: 2078-0958 (Print); ISSN: 2078-0966 (Online)
WCECS 2015

Fig.3. Markov chain for calculating the occupied probability of virtual
channels
In our work, the virtual channel allocation mechanism of
our router is fixed, which is shown in Fig.4. For the west of
router B as an input, it may receive data from the South, West,
North, Up, Down and Local six directions of router A. Then
the six virtual channels of router B are fixed assigned to the
six input directions from router A. When there is a written
request from north port of router A to the west of router B and
if the corresponding virtual channel of the north input port of
router A is occupied, the request will not be answered.
Therefore, when we calculate the probability of buffer
whether is occupied, we just need to consider its
corresponding virtual channel, that is
, , , , , , , , , ,( )x y z dir dir x y z dir x y z dirP Ti , where , , , ,dir x y z dir is the
arrival rate of the data packet from the dir direction of the
upstream router to the dir’ direction of the local router.
Crossbar
switch
East in
pu
t
po
rt
N
Local
inpu
t
S
W
Router A
N
Local
inpu
t
S
W
E
Router B
West in
pu
t
po
rt
E
North input
port
South
input port
Dow
n input
port
Up input port
U
D
South
input port
East in
pu
t
po
rt
North input
port
Dow
n
input port
D
Up input
portUFlow
Crossbar
switch
Fig. 4. Virtual channel allocation mechanism
(2) Calculate SiW
Calculating SiW is similar to calculate the average waiting
time , , ,x y z dir . Taking the buffer of the network interface at
the source node as the M/G/1 queuing model, the waiting time
of a header flit that is blocked in the source node can be
calculated by: 2
, , ,
2
, , ,
( )1
2(1 )
x y z L R bSi
x y z L R R
T M TW
T T
(12)
where TR is the delay of the transmit network, , , ,x y z L is the
packet arrival rate from the source node to the network.
C. Problem formulation
Mapping problem has a great influence on overall system
performance, and it is one of the effective ways to improve
performance. In this paper, we present a multi-application
mapping algorithm for 3D NoC. To formulate this problem,
we present some definitions and assumptions.
Definition1 A Core Communication Graph is a digraph
denoted by CCG(C, A). Each vertex ci∈C represents an IP
core, and each edge ai,j∈A represents the communication
from IP ci to IP cj. The weight of the edge, denoted by bi,j,
represents the total volume of the communication.
Definition2 A NoC architecture graph is a digraph
denoted by NAG(R, P). Each vertex ri∈R represents a
resource node in the architecture, and each edge denoted as pi,j
∈P represents the communication path from resource node ri
to rj.
In order to solve the multi-application mapping, we adopt
the combination of the CCGs of each application in order to
generate a synthetic CCG, used as an entry of the optimization
process. The new CCG is called of Worst-Case
CCG(WC-CCG). And the combination rules are as follows:
when IP cores in two applications share the same functionality,
the IP cores are retained as only one IP core. The
corresponding communication volume via this IP core can be
calculated as ( , ) ( ) ( ) ( ) ( )b p q b p P a b q P q , where b(p),
b(q) is the communication volume in the two applications and
P(p), P(q) is the probability that the IP cores are executed.
Besides, WC-CCG selects the tightest communication
requirements across all the applications. The WC-CCG is then
used for the mapping process. Fig.5 shows an example of the
generation of a WC-CCG that executes 2 applications. Each
application is described by CCG. Application 1 shares IP1,
IP2 and IP3 with application2. IP4 is reserved as the unique
IP core in applicaiton2. WC-CCG is characterized with the
tightest requirement for latency(cycles) of application1 and
application2.
IP1 IP2
IP3
6 cycles
<5 c
ycl
es
CCG application1
IP1 IP2
IP3 IP4
<4 cycles
<12 c
ycl
es
CCG application2
IP1 IP2
IP3 IP4
<4 cycles
<5 c
ycl
es
Worst case CCG(WC-CCG)
7 cycles
7 cycles
Fig. 5. Example of WC-CCG generation
When WC-CCG is generated, we can handle
multi-application as a single application. In order to optimize
latency, the optimal goal is minimizing the sum of latency for
multi-applications, which can be calculated as
1
( )n
sum N
k
L T k
(13)
In this paper, we intend to achieve the balance of latency
among multi-applications. However, balancing packet
latencies among applications is often conflict with minimizing
overall packet latency of all applications. Therefore, we use
the metric of average packet latency of the applications as the
objective function to take into account both balanced and
reduced latency aspects. The problem of multi-application
mapping for 3D NoC can be formulated as follows:
Given a set of CCG(C, A) and NAG(R, P)
Find a mapping function map() from CCG(C,A) to
NAG(R,P),which minimizes:
min{ 1
( )n
N
kavg
T k
Ln
} (14)
Such that:
… v-1 v
1/s 1/s 1/s 1/s 1/s
Proceedings of the World Congress on Engineering and Computer Science 2015 Vol I WCECS 2015, October 21-23, 2015, San Francisco, USA
ISBN: 978-988-19253-6-7 ISSN: 2078-0958 (Print); ISSN: 2078-0966 (Online)
WCECS 2015

i fT T (15)
where L is the average latency of multi-applications and n is
the number of applications. Tf is the delay constraint of flow
in an application. Hence, the goal of our proposed algorithm
that maps CCG(C, A) to NAG(R, P) is to find a mapping
according to equation(14), and satisfy performance constraint
as equation (15) .
III. MULTI-APPLICATION MAPPING ALGORITHM
In this paper, we propose a multi-application mapping
algorithm for 3D NoC based on M/G/1 queuing model, which
intend to achieve latency balance among multi-application.
The overview of the proposed approach is shown in Fig.6,
which mainly has three phases.
Get delay of a flow
Get average delay
of an application
Get average delay of
multi-application
- core communication
graph
- delay requirement
- topology
- buffer size
- routing algorithm
- switching method
WC-CCG generation
M/G/1 analytical
model
Phase 1
Phase 2
Phase 3
feedback
S1
S2
S3
Application Architecture
Mapping
GA Tool
Fig. 6. Multi-application mapping algorithm flow
In the first phase, we generate the WC-CCG for a set of
multi-application, according to the delay requirements. The
synthesis in detail is discussed in Part C of section II. In our
paper, the delay requirement can be satisfied in flow level.
In the second phase, GA tool is taken to explore solution
space. Firstly, we generate an initial population of n
chromosome, which consists of many randomly generated IP
core placements. Each chromosome is encoded into integer
strings, with its length equal to the number of vertices in a
CCG. Secondly, the fitness of each chromosome is evaluated
and delay constraint is verified. The fitness function and delay
constraint are given by (14) and (15) separately, which will be
calculated in the following phase. Then, a new population is
created by applying three operators similar to the natural
selection operators – selection, crossover and mutation.
In the last phase, we calculate average delay utilizing M/G/1 queuing model. Three steps are executed sequentially in this phase:
Step1: The delay of a flow is computed using equation(6),
(8), (2) and (12). Then, we verify whether the delay
requirement is satisfied and feedback the result to phase2. If
the delay requirement is not satisfied, the fitness is set to be
zero.
Step2:The average delay of a single application is
calculated by iterating Step1.
Step3:In this step, we calculate the average delay of
multi-application utilizing the results from Step2.
As a result, the average delay of multi-application is
obtained. And GA explores the optimal mapping utilizing the
results of M/G/1 delay model.
IV. EXPERIMENTAL RESULTS
In this section, we present the experimental results obtained
by executing the proposed approach on various multimedia
benchmark applications. We generate three sets of
benchmarks by TGFF[12] and each application in the sets is
different, where the amount of data transferred from the
source node to the destination node is randomly distributed.
The application set information and the size of 3D Mesh NoC
architecture are summarized in Table II. For simplification,
the size of each IP core is assumed to be the same. TABLE II
GRAPH CHARACTERISTICS
Application Set Graph ID IP cores CCGs NoC
X×Y×Z
G1
T1 8
2
2×3×2 T2 6
T3 4
G2
T4 12
3
3×3×2 T5 8
T6 6
T7 4
G3
T8 20
3
3×4×3 T9 12
T10 8
T11 4
To verify the efficiency of the proposed mapping algorithm,
we compare the results generated by our proposed method
against random mapping. Besides, in order to evaluate the
effect of latency balancing of the proposed approach, we
compare two conditions one take equation (14) as the optimal
goal, while the other take equation (13). Both of them are
executed utilizing M/G/1 and GA tool. We denote the former
by GA+M/G/1_avg, and the later by GA+M/G/1_sum.
Mapping results are evaluated in NoC simulator Nirgam[13]
and Orion[14].
(a)Power consumption comparison on overall system
(b)Latency comparison on overall system
Fig. 7. The performance comparison on overall system
Proceedings of the World Congress on Engineering and Computer Science 2015 Vol I WCECS 2015, October 21-23, 2015, San Francisco, USA
ISBN: 978-988-19253-6-7 ISSN: 2078-0958 (Print); ISSN: 2078-0966 (Online)
WCECS 2015

In Fig.7(a), we show a comparison of overall system on
power consumption using three sets of benchmarks. From the
figure, it can be seen that both cases of optimizing sum latency
and average latency show better results than random mapping.
which save power consumption 21.43% and 17.62%
respectively. From Fig.7(b), we can see that taking the sum of
latency as objective function saves 22.36% latency on
average, while taking the average latency as the objection
function saves 17.10% latency on average.
(a)Power consumption comparison for each application
(b)Latency comparison for each application
Fig. 8. The performance comparison for each application
In Fig.8, we show a comparison of power consumption and
latency for each single application in different sets.
GA+M/G/1_avg saves 16.93% and 18.32% than random
mapping on power consumption and latency respectively.
While GA+M/G/1_sum saves 12.92% and 12.20% than
random mapping on power consumption and latency
respectively. From the results, we can see that
GA+M/G/1_sum has better performance on overall system.
The application has higher IP cores tend to be optimized
greater than other applications in the same set. However, this
may lead to unfairness for applications in the same set. Our
proposed method is to take the average latency as the target
goal, which can alleviate this difference and improves
performance for individual application. TABLE III
DELAY DEVIATION COMPARISON
Approach G1 G2 G3
GA+M/G/1 _avg 4.32 0.17 3.26
GA+M/G/1 _sum 5.48 1.92 18.75
random 2.71 0.77 4.54
Furthermore, we compare the deviation of the latency for
multi-applications in different sets. And the results are
summarized in Table III. It is obvious that our proposed
method save 64.98% and 15.57% than the other two cases on
average. For set G1, when the number of IP cores is small, the
deviation of latency for three cases is narrowly matched.
When the number of IP cores increase, GA+M/G/1_avg
shows better results than GA+M/G/1_sum, which prove our
proposed method is an effective to achieve latency balance
among multi-applications.
V. CONCLUSION
In this paper, we propose a multi-application mapping
framework for 3D NoC utilizing an accurate analytical delay
model based on M/G/1 queuing model, which target to
balance latency among multi-applications. And GA algorithm
is taken to solve the multi-application NoC mapping problem.
We applied our approach on several multi-applications
benchmarks. Simulation results show that the proposed
algorithm is able to save the maximum average latency by
18.32% and the deviation of latency by 15.57%, which prove
our proposed method is an effective to achieve latency
balance among multi-applications.
REFERENCES
[1] A. Hemani, A. Jantsch, S. Kumar, et al., “Network on chip: An
architecture for billion transistor era,” Proceeding of the IEEE
NorChip Conference, 31, 2000.
[2] S. Im and K. Banerjee, “Full chip thermal analysis of planar (2-D) and
vertically integrated (3-D) high performance Ics,” Electron Devices
Meeting, IEDM'00. Technical Digest. International. IEEE,
p.727-730. 2000.
[3] J. Hu and R. Marculescu, “Energy-aware mapping for tile-based NoC
architectures under performance constraints,” Proc. of Asia and South
Pacific Design Automation Conference, Kitakyushu, Japan,
p.233-239. 2003.
[4] S. Murali and G. De Micheli, “Bandwidth-constrained mapping of
cores onto NoC architectures,” in Proc. of IEEE/ACM Design,
Automation and Test in Europe Conference, Paris, France, pp.
896-901, 2004.
[5] T. Lei and S. Kumar, “A two-step genetic algorithm for mapping task
graphs to network on chip architecture,” in Proc. of Euromicro
Symposium on Digital System Design, Belek-Antalya, Turkey, 2003,
pp. 180-187.
[6] Murali S. “Mapping and configuration methods for multi-use-case
networks on chips”. Conference on Design Automation. IEEE,
2006,pp.146--151.
[7] Sepulveda J, Strum M, Chau W J, et al. “A multi-objective approach
for multi-application NoC mapping,” IEEE Second Latin American
Symposium on Circuits & Systems, 2011,pp.1 - 4.
[8] C.-L. Chou, U. Y. Ogras, and R. Marculescu, “Energy- and
Performance-Aware Incremental Mapping for Networks on Chip
With Multiple Voltage Levels,” IEEE Transactions on
Computer-Aided Design of Integrated Circuits and Systems, vol. 27,
no. 10, pp. 1866–1879, Oct. 2008.
[9] Pavlidis, Vasilis F., and E. G. Friedman. "3-D Topologies for
Networks-on-Chip," IEEE Transactions on Very Large Scale
Integration Systems15.10(2007), pp.1081-1090.
[10] Zhu D, Chen L, Yue S, et al. “Balancing On-Chip Network Latency in
Multi-application Mapping for Chip-Multiprocessors,” 2014 IEEE
International Parallel & Distributed Processing Symposium (IPDPS).
IEEE Computer Society, 2014, pp.872-881.
[11] W.J. Dally, “Virtual channel flow control,” IEEE Trans. Parallel
Distrib. Systems 3(2),1992, pp.194–205.
[12] R.P.Dick, D.L.Rhodes, and W.Wolf, “TGFF:Task Graphs For Free,”
In Proceeding of International Workshop on Hardware/Software
Codesign,1988.
[13] Lavina Jain, “NIRGAM Manual. A Simulator for NoC Interconnect
Routing and Application Modeling,” 2007.
[14] A.B.Kahng, B.Li, L.S.Peh, and K. Samadi, “ORION2.0: A power area
simulator for interconnection networks,” IEEE Trans. Very Large
Scale Integr.(VLSI) Syst.,vol.20, pp.191-196,2012.
Proceedings of the World Congress on Engineering and Computer Science 2015 Vol I WCECS 2015, October 21-23, 2015, San Francisco, USA
ISBN: 978-988-19253-6-7 ISSN: 2078-0958 (Print); ISSN: 2078-0966 (Online)
WCECS 2015