Embed Size (px)
Citation preview
7/27/2019 Balance Ratios j 200
http://slidepdf.com/reader/full/balance-ratios-j-200 1/18
Balance Sheet Ratios
Roger Betz, Sherrill Nott and
Gerald Schwab
Day 2
1:00 p.m. to 1:30 p.m.
7/27/2019 Balance Ratios j 200
http://slidepdf.com/reader/full/balance-ratios-j-200 2/18
Ratios
Defined:
• One number divided by another to express
a relationship• You already know ratios like
– Tons hay per acre
– Bu. corn per acre
– Pigs per litter
– Milk sold per cow, etc.
• The above illustrates production ratios
7/27/2019 Balance Ratios j 200
http://slidepdf.com/reader/full/balance-ratios-j-200 3/18
Ratios
Be Selective• Now is the time to become familiar
with f inancial ratios
• Select ratios that help focus attentionon the most critical areas.
• Ratio analysis can be done on
–
Historical – Current
– Projected information

7/27/2019 Balance Ratios j 200
http://slidepdf.com/reader/full/balance-ratios-j-200 4/18
Balance Sheet
Discussion questions
Judgments are made based on balance
sheets.
• What is a “good” balance sheet?
• What is a “good” financial situation?
7/27/2019 Balance Ratios j 200
http://slidepdf.com/reader/full/balance-ratios-j-200 5/18
Balance Sheet Analysis
To remember. . .
• Basic equations
Assets = Debt + Equity
Assets minus debts = equity
Assets - equity = debt
7/27/2019 Balance Ratios j 200
http://slidepdf.com/reader/full/balance-ratios-j-200 6/18
Balance Sheet Ratio Analysis
FINPACK Balance Sheet (Schedule W)
Will now define the ratios FINPACKprints out (must be important!)
Your balance sheet may or may nothave a number for all the ratiosdiscussed.
7/27/2019 Balance Ratios j 200
http://slidepdf.com/reader/full/balance-ratios-j-200 7/18
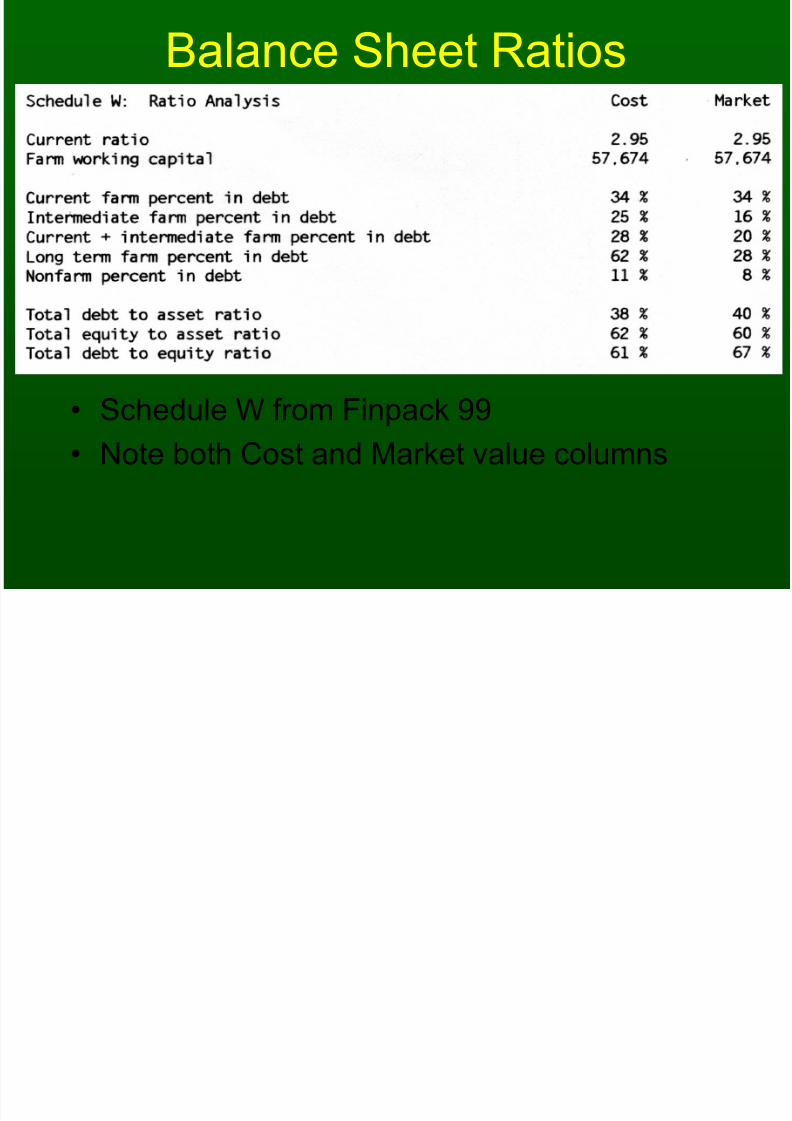
Balance Sheet Ratios
•Schedule W from Finpack 99
• Note both Cost and Market value columns
7/27/2019 Balance Ratios j 200
http://slidepdf.com/reader/full/balance-ratios-j-200 8/18
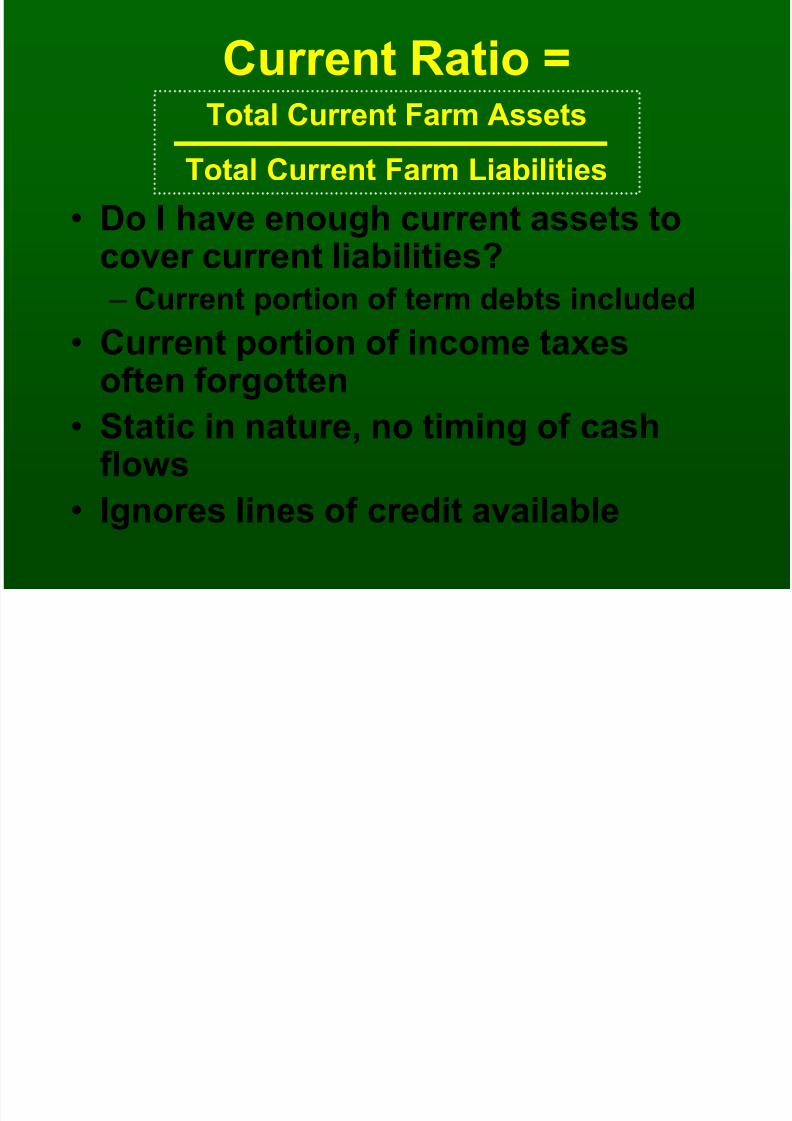
Current Ratio =
• Do I have enough current assets tocover current liabilities?
– Current portion of term debts included
• Current portion of income taxesoften forgotten
• Static in nature, no timing of cashflows
• Ignores lines of credit available
Total Current Farm Assets
Total Current Farm Liabilities
7/27/2019 Balance Ratios j 200
http://slidepdf.com/reader/full/balance-ratios-j-200 9/18
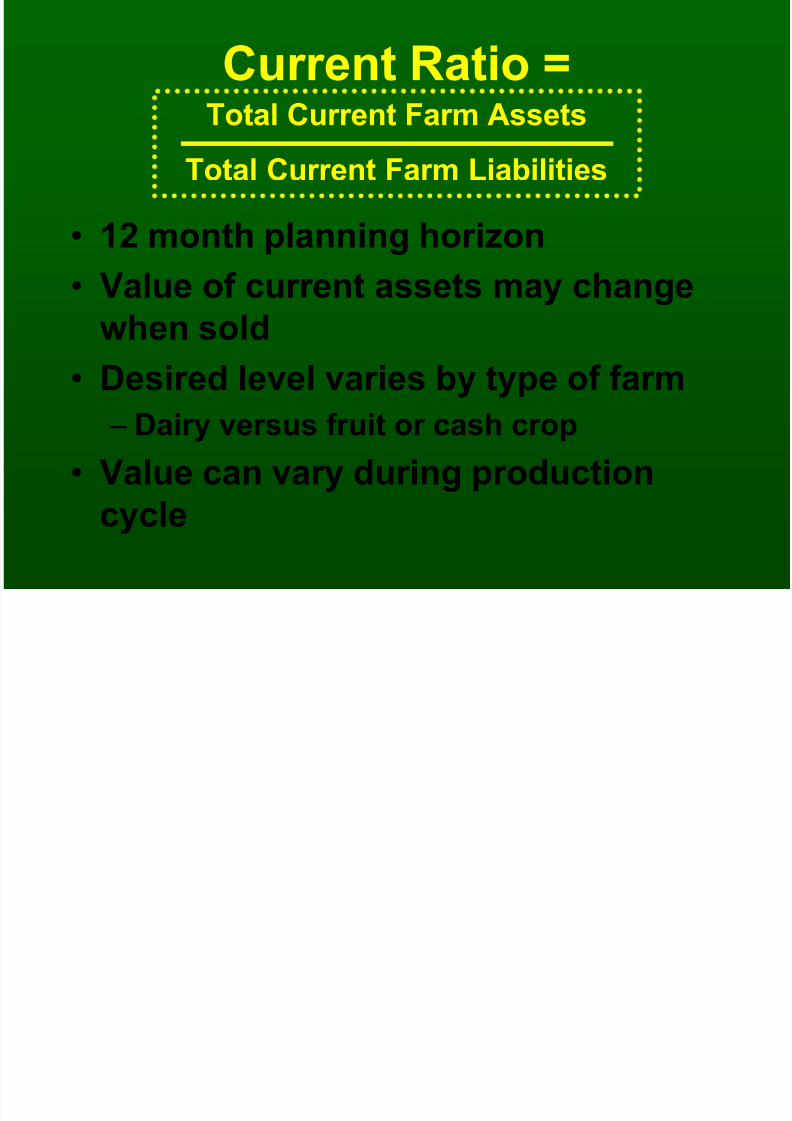
Current Ratio =
• 12 month planning horizon
• Value of current assets may changewhen sold
• Desired level varies by type of farm
– Dairy versus fruit or cash crop
• Value can vary during production
cycle
Total Current Farm Assets
Total Current Farm Liabilities
7/27/2019 Balance Ratios j 200
http://slidepdf.com/reader/full/balance-ratios-j-200 10/18
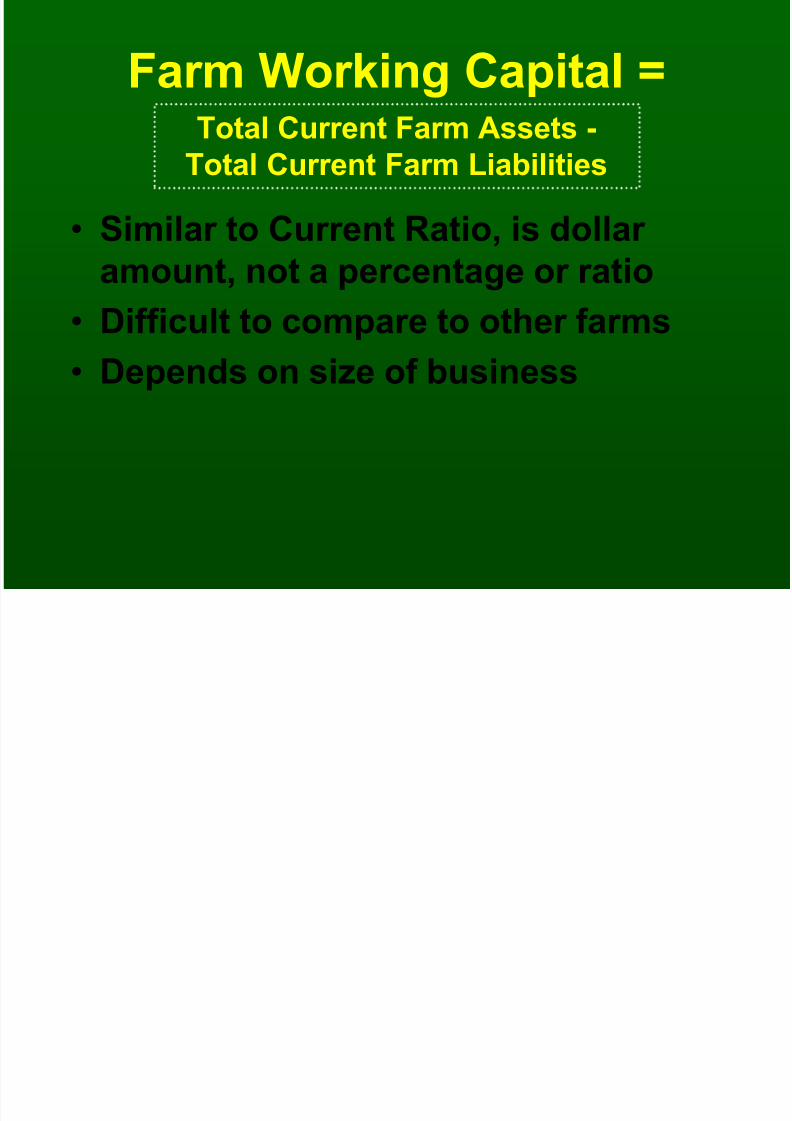
Farm Working Capital =
• Similar to Current Ratio, is dollar
amount, not a percentage or ratio• Difficult to compare to other farms
• Depends on size of business
Total Current Farm Assets -Total Current Farm Liabilities
7/27/2019 Balance Ratios j 200
http://slidepdf.com/reader/full/balance-ratios-j-200 11/18
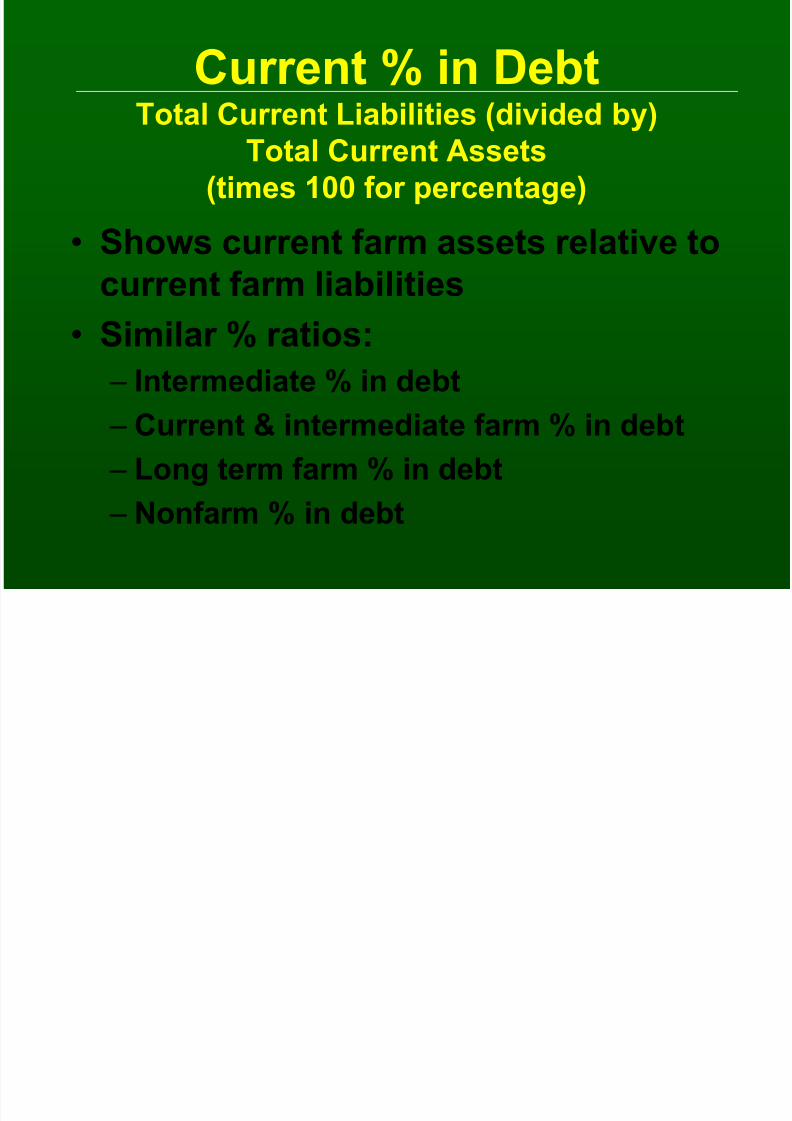
Current % in DebtTotal Current Liabilities (divided by)
Total Current Assets
(times 100 for percentage)
• Shows current farm assets relative to
current farm liabilities
• Similar % ratios:
– Intermediate % in debt
– Current & intermediate farm % in debt
– Long term farm % in debt
– Nonfarm % in debt

7/27/2019 Balance Ratios j 200
http://slidepdf.com/reader/full/balance-ratios-j-200 12/18
Debt to Asset RatioTotal Farm Liabilities (divided by)
Total Farm Assets
• What % of my business assets do I owe tocreditors
•
Measures financial position or solvency of the business
• Creditors claim against the business
• Measure risk exposure - “ability to take
hits” – a higher ratio indicates higher risk, don’t hit
• Should include deferred taxes if usingmarket value versus cost basis
7/27/2019 Balance Ratios j 200
http://slidepdf.com/reader/full/balance-ratios-j-200 13/18
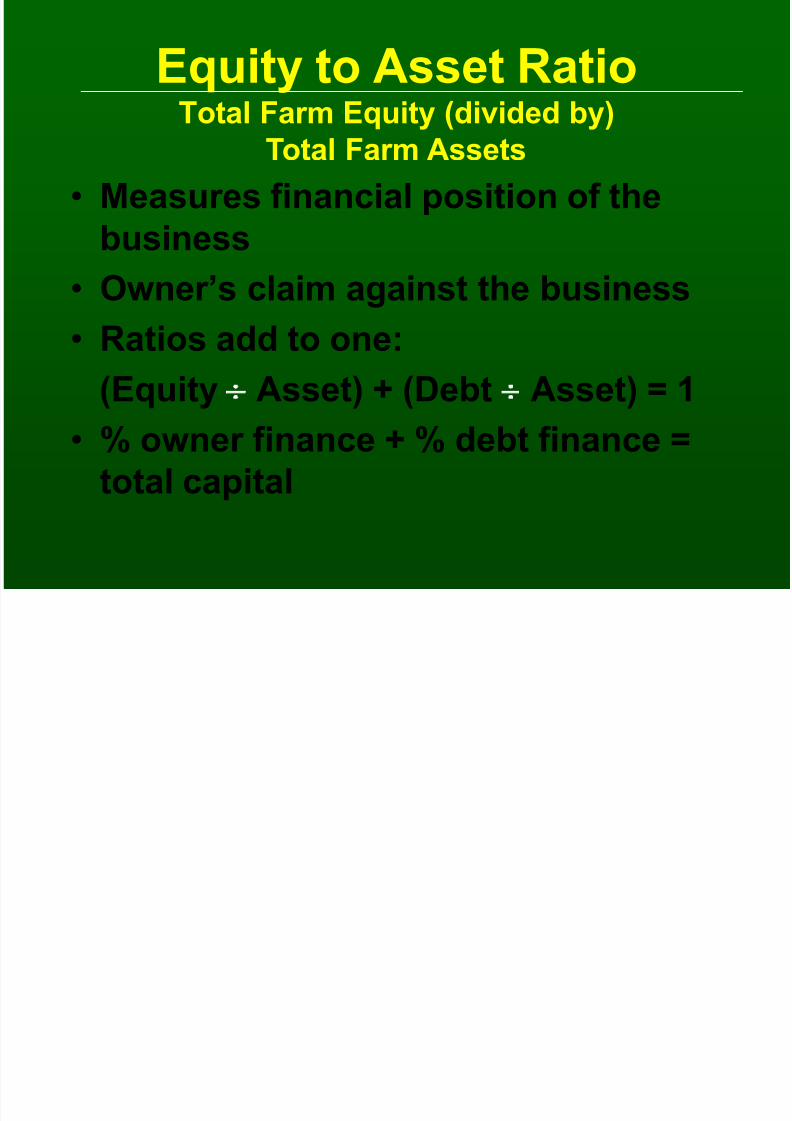
Equity to Asset RatioTotal Farm Equity (divided by)
Total Farm Assets
• Measures financial position of the
business
• Owner’s claim against the business
• Ratios add to one:
(Equity Asset) + (Debt Asset) = 1
• % owner finance + % debt finance =
total capital
7/27/2019 Balance Ratios j 200
http://slidepdf.com/reader/full/balance-ratios-j-200 14/18
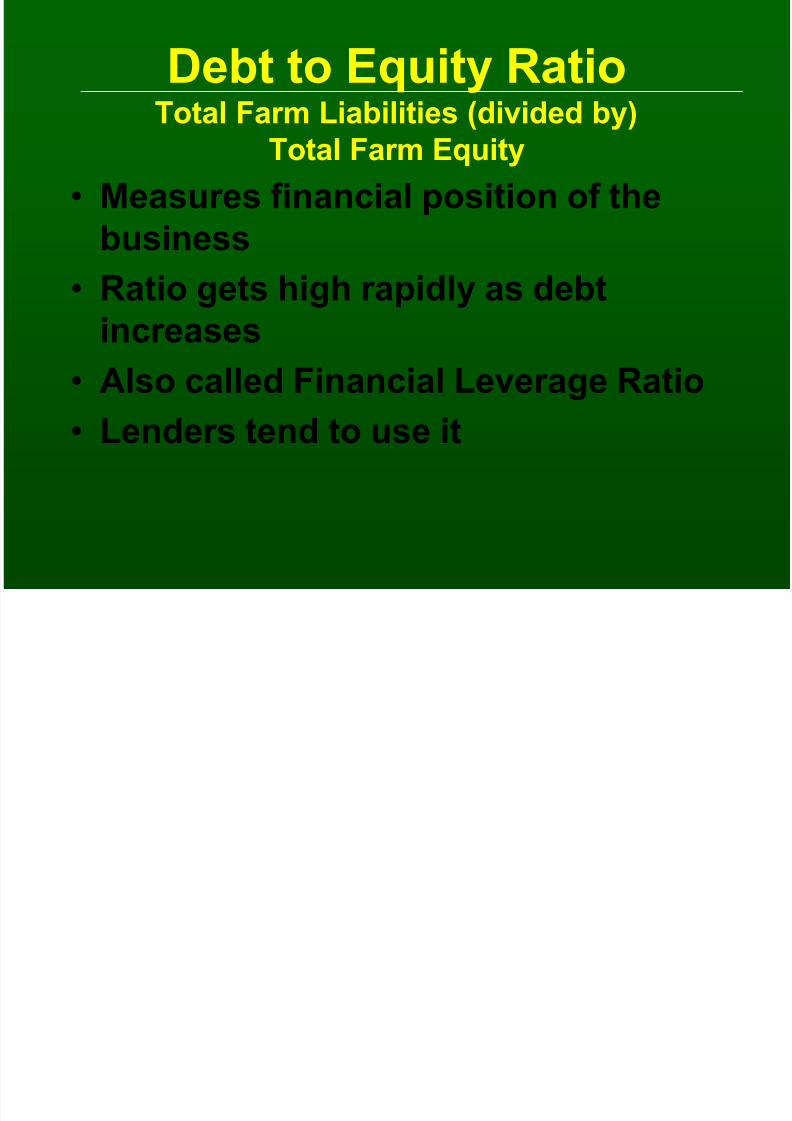
Debt to Equity RatioTotal Farm Liabilities (divided by)
Total Farm Equity
• Measures financial position of the
business
• Ratio gets high rapidly as debtincreases
• Also called Financial Leverage Ratio
• Lenders tend to use it
7/27/2019 Balance Ratios j 200
http://slidepdf.com/reader/full/balance-ratios-j-200 15/18
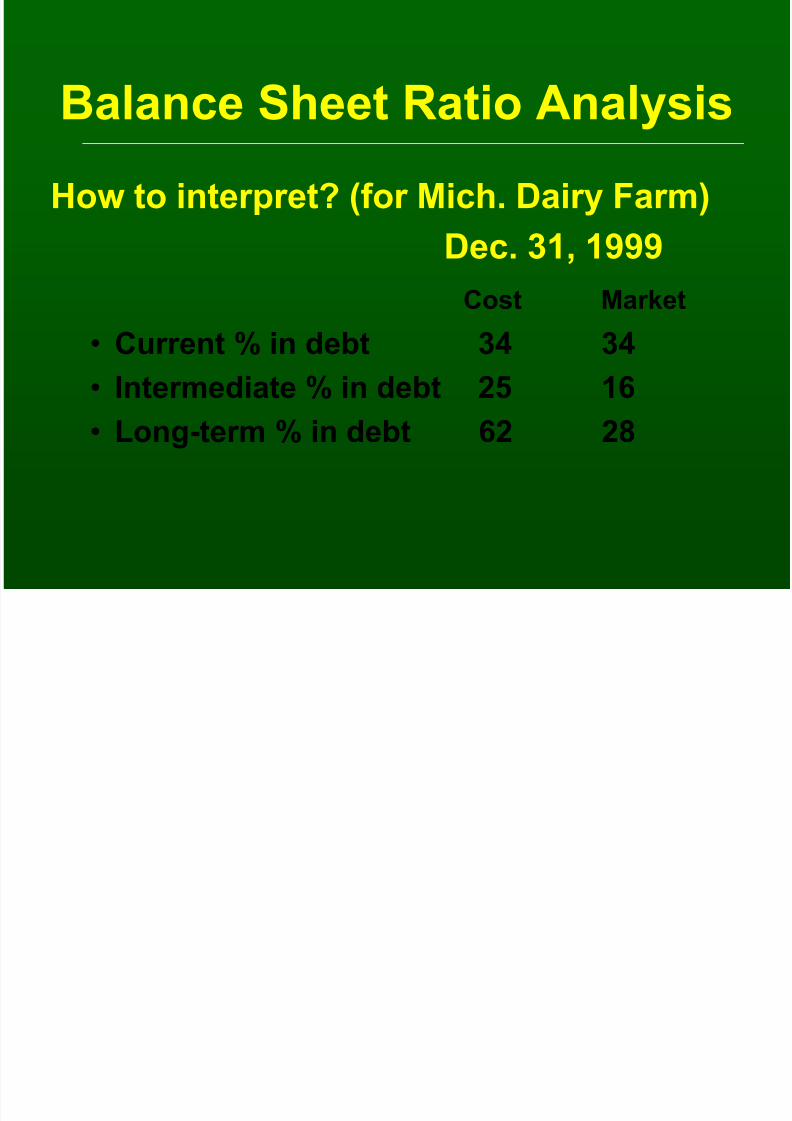
Balance Sheet Ratio Analysis
How to interpret? (for Mich. Dairy Farm)
Dec. 31, 1999
Cost Market
• Current % in debt 34 34
• Intermediate % in debt 25 16
• Long-term % in debt 62 28
7/27/2019 Balance Ratios j 200
http://slidepdf.com/reader/full/balance-ratios-j-200 16/18
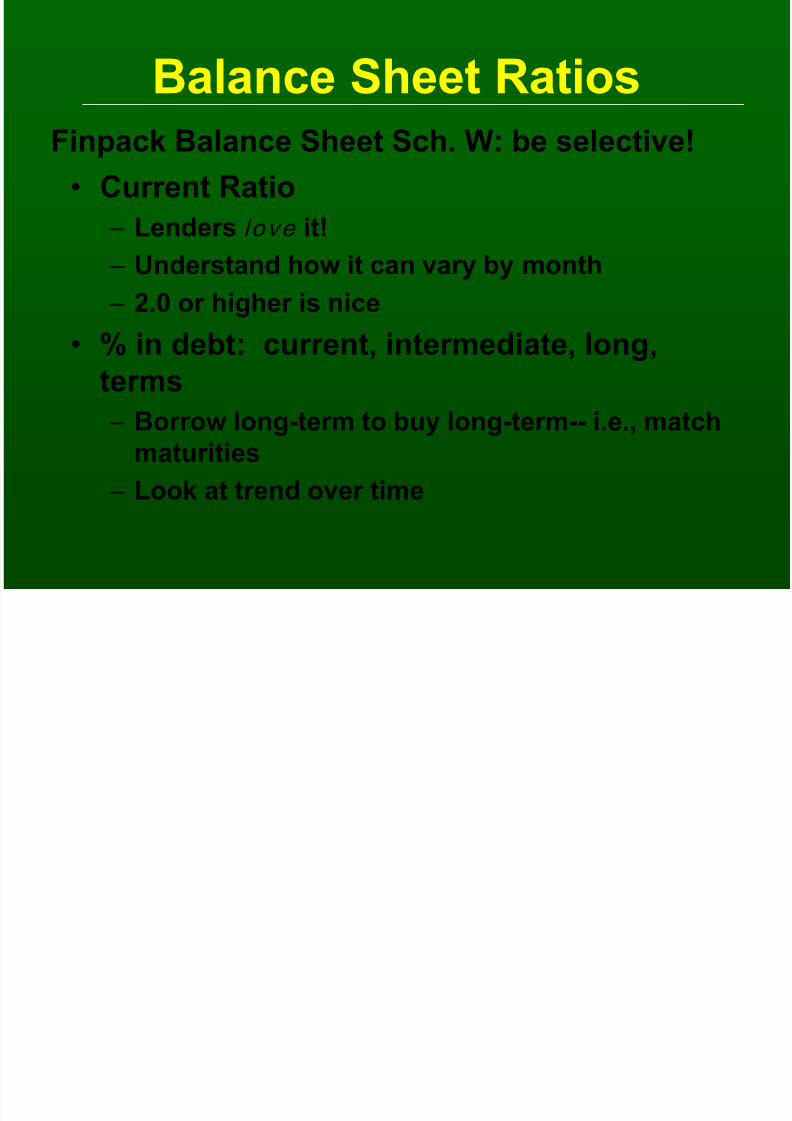
Balance Sheet Ratios
Finpack Balance Sheet Sch. W: be selective!• Current Ratio
– Lenders love it!
–
Understand how it can vary by month – 2.0 or higher is nice
• % in debt: current, intermediate, long,
terms
– Borrow long-term to buy long-term-- i.e., matchmaturities
– Look at trend over time
7/27/2019 Balance Ratios j 200
http://slidepdf.com/reader/full/balance-ratios-j-200 17/18
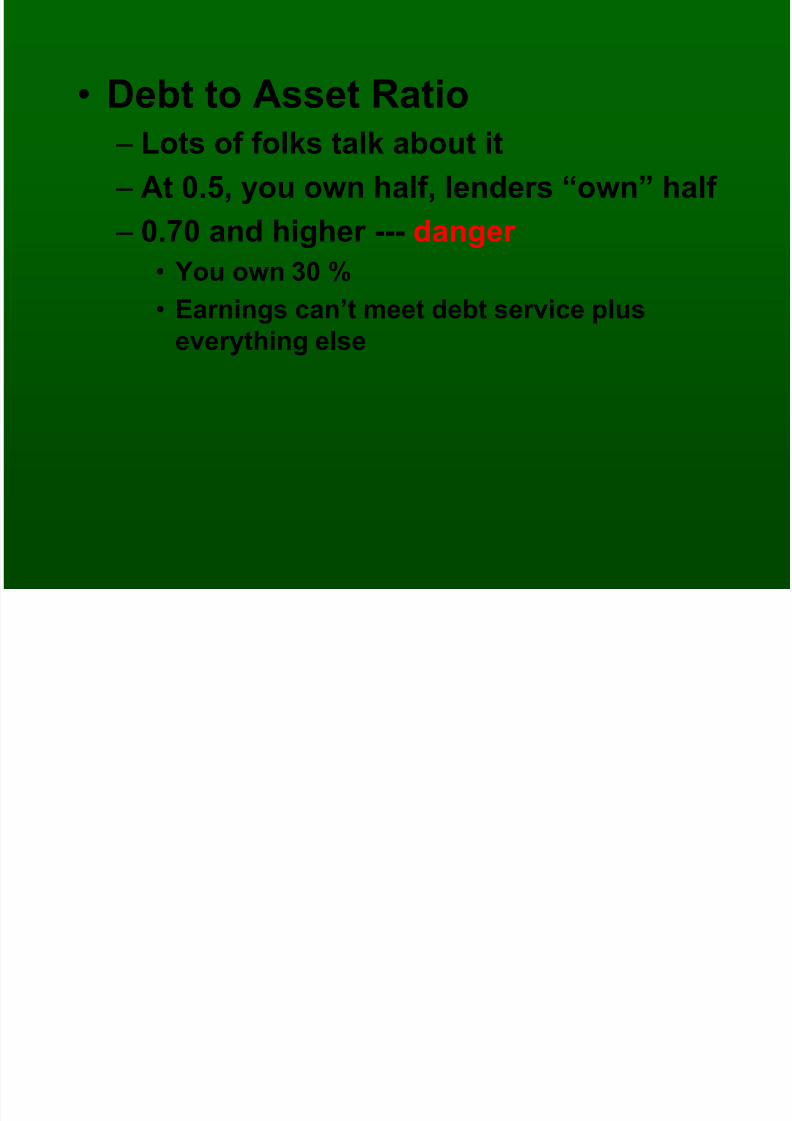
• Debt to Asset Ratio
– Lots of folks talk about it – At 0.5, you own half, lenders “own” half
– 0.70 and higher --- danger
•
You own 30 %• Earnings can’t meet debt service plus
everything else
7/27/2019 Balance Ratios j 200
http://slidepdf.com/reader/full/balance-ratios-j-200 18/18
What’s Next?
• Examine the case study farm balance
sheet
• Quality check and interpret your balance sheet.