Embed Size (px)
Citation preview
BALAJI INSTITUTE OF
I.T AND MANAGEMENT,
KADAPA
INVESTMENT AND PORTFOLIO MANAGEMENT (17E00312)
ICET CODE: BIMK SECOND INTERNAL
ALSO DOWLOAD AT http://www.bimkadapa.in/materials.html
Name of the Faculty: S. BASHA
Units covered: 1st,2nd,3rd, 4th,& 5th Units
E-Mail:[email protected]

IPM- Finance Specialization FINACE & MARKETING –FINANCE &HR
UNIT-1 INVESTMENT| BALAJI INST OF IT AND MANAGEMENT 1
(17E00312) INVESTMENT AND PORTFOLIO MANAGEMENT
(Elective III)
Objective: The objective of the course is to provide students an understanding of working of
capital markets and management of portfolios of stocks. The pre-requisite for the course is
Financial Accounting and Analysis and Financial Management.
* Standard discounting and statistical tables to be allowed in the examinations.
1. Investment:Introduction to stock markets -objectives, Process of Investment,
Investment and speculation.
2. Fundamental Analysis & Technical Analysis: Framework of Fundamental analysis-
Economic analysis, Industry analysis-Industry Life cycle - Company analysis,
Fundamental Analysis Vs Technical Analysis - Dow Theory.
3. Measurement of Risk and Return: Revenue Return and Capital appreciation,
holding period –Calculation of expected return, Risk factors, risk classification –
systematic risk – unsystematic risk – standard deviation – variance– Beta .
4. Valuation of Securities: Types of Securities - Approaches of valuation – Bond
valuation – Preference share Valuation – Common stock Valuation.
5. Portfolio Management: Process of Portfolio Management, Modern Portfolio –
Portfolio models – Markowitz model – Sharpe single index model, Capital Asset
Pricing Models.
Text Books:
Investment Management,V.K.Balla, S.Chand Company Ltd
Security Analysis and Portfolio Management ,PunithavathyPandian, Vikas
References:
Investment Analysis and portfolio management, Chandra, Tata McGraw Hill .
Secuerity Analysis Portfolio Management, Ranganatham&Madhumathi, Pearson
Education.
Security Analysis and Portfolio Management, SudhindraBhat, excel.
Security analysis and portfolio management, Avadani, Himalaya publishers.
Investment analysis portfolio management, Frank Reilly & Brown, Cengage.
Investment Management, Preethi Singh, Himalaya Publishing House, Mumbai..
Investment, Bodie, McGraw Hill Book Company.
Investment Management ,Hiriyappa ,New Age Publications
IPM- Finance Specialization FINACE & MARKETING –FINANCE &HR
UNIT-1 INVESTMENT| BALAJI INST OF IT AND MANAGEMENT 2
UNIT-1
INVESTMENT
1. INVESTMENT: Investment is action (or) process of investing money for
profit.
Example: equity shares, preference share and debentures etc.
DEFINITION OF INVESTMENT
“An investment is the purchase of goods that are not consumed today but are
used in the future to create wealth”.
“An investment is a commitment of funds make in the expectation of some
positive rate of return”.
According to oxford dictionary “investment is defined as the action or process
of investment money for profit”.
1.1 INTRODUCTION TO STOCK MARKET (OR) STOCKEXCHANGE:
Stock market is a place where securities are bought and sold. Example –
Bombay stock exchange
The origin of the stock exchange in India started half of 19th century.
After the American Civil War 1860 - 1861 the number of brokers
dealing with shares is increased.
The brokers organized an informal Association in Mumbai named “The
native stock and share brokers Association” in 1875.
Increased transactions in trade and Commerce during the first and
Second World War result in an increase in the stock exchange
transactions.
Stock exchanges where established in different countries like Chennai,
Delhi, Nagpur, Kanpur, Hyderabad and Bangalore.
Securities and contract Regulation Act 1956 gave powers to the central
government to regulate the stock exchanges.
IPM- Finance Specialization FINACE & MARKETING –FINANCE &HR
UNIT-1 INVESTMENT| BALAJI INST OF IT AND MANAGEMENT 3
The stock exchange in Mumbai, Kolkata, Chennai, Ahmadabad, Delhi,
Hyderabad and Indore recognized by the securities and contract
regulations Act 1956.
The Bangalore stock exchange was recognized in 1963.
At present we have 23 stock exchanges and twenty one of them had
hardware and software.
Till 20th century floor trading took place in all the stock exchange
In the floor trading system the trade takes place through only outcry
system trading posts are assigned for different securities when buy and
sell activities of securities took place.
This system needs a face to face contact among the traders.
The trading where not transparent and the system, favored the brokers
rather than the investors.
The setting up of National Stock Exchange (NSE) and over the counter
Exchange of India (OCTCEI) with the screen based trading facility
resulted in more and more stock exchange turning towards the computer
based trading.
Bombay Stock Exchange introduced the screen based trading system in
1995 which is known as Bombay online trading system (BOLT).
Bombay stock exchange and national stock exchange being the largest
stock exchange in India. Two markets in Stock exchange
A. Primary market
Funds may be raised through issue of fresh shared at par or
premium preference shares, debentures or global depository
receipts.
Stock available for the first time one offered through new issue
market.
The issuer may be a new company or an existing company.
IPM- Finance Specialization FINACE & MARKETING –FINANCE &HR
UNIT-1 INVESTMENT| BALAJI INST OF IT AND MANAGEMENT 4
B. Secondary market
The secondary market deals with outstanding or existing
company shares or securities are traded.
In this secondary market the inventors can sell and buy equity
shares.
Debt instruments like bonds and debentures and also trade in the
stock market.
1.2. INVESTMENT OBJECTIVES
I. The main objective of investment is to increase at the rate of return
and reduce the risk.
II. other objectives like
1) Safety
2) Liquidity
3) Return
4) Hedge against inflation
5) tax benefit
6) Risk
1) Safety: The selected investment should be under the legal and regulatory
Framework. Every investor before investing his money he looked into
safety for his/her investment.
2) Liquidity: Other objectives of investment are liquidity. Liquidity means
easily converted into cash marketability of the investment provides
liquidity to the investment. The liquidity depends upon the marketing and
trading facility.
3) Return: Every investor another objective is excess of investment.
Investor always expects a good rate of return from their investment.
IPM- Finance Specialization FINACE & MARKETING –FINANCE &HR
UNIT-1 INVESTMENT| BALAJI INST OF IT AND MANAGEMENT 5
4) Hedge against inflation: Since there is inflation in almost all the
economy the rate of return should ensure a cover against the inflation.
The returns rate should be higher than the rate of inflation.
5) Tax benefit: Tax benefit is on one of important objective of the investor
this allows investor to reduce it taxable amount this is a Economics bonus
which applies to certain investment that are by statute, tax reduced
6) Risk: Risk of hold securities is related with the probability of actual
returns becoming less than the expected returns. The risk is just an as
important as measuring its expected rate of return because minimizing
risk and maximizing the rate of return are interrelated objectives in the
investment
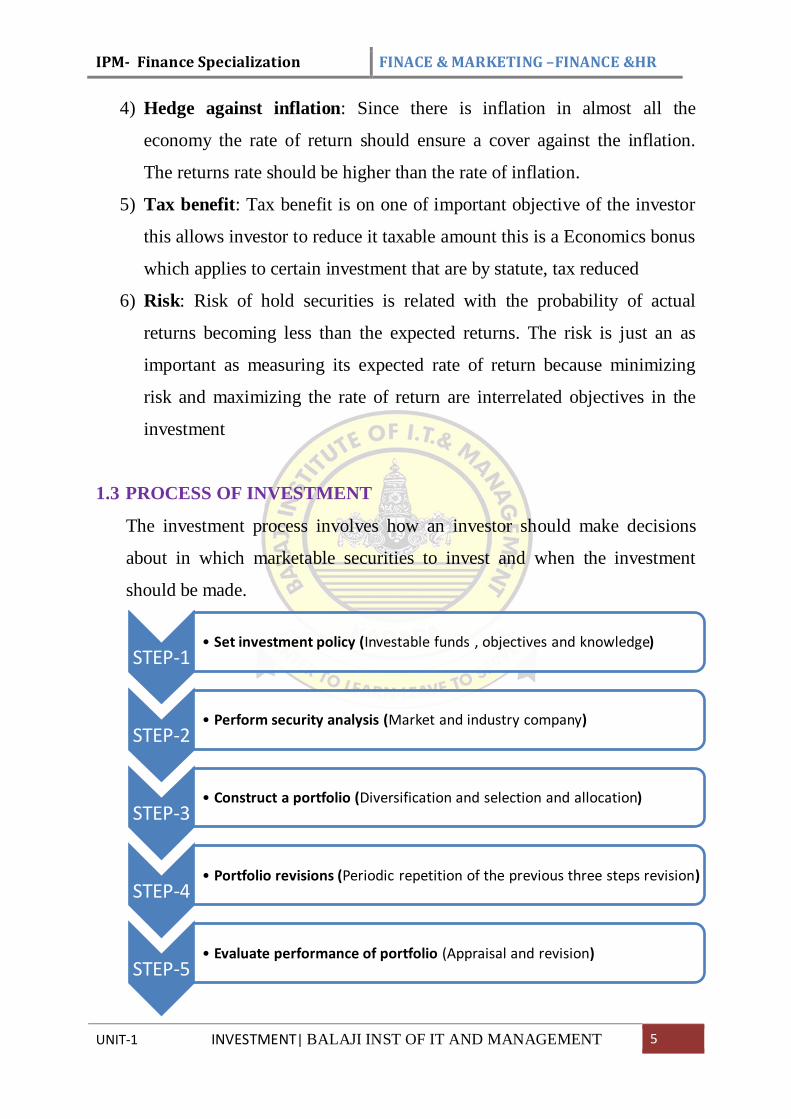
1.3 PROCESS OF INVESTMENT
The investment process involves how an investor should make decisions
about in which marketable securities to invest and when the investment
should be made.
STEP-1• Set investment policy (Investable funds , objectives and knowledge)
STEP-2• Perform security analysis (Market and industry company)
STEP-3• Construct a portfolio (Diversification and selection and allocation)
STEP-4• Portfolio revisions (Periodic repetition of the previous three steps revision)
STEP-5• Evaluate performance of portfolio (Appraisal and revision)
IPM- Finance Specialization FINACE & MARKETING –FINANCE &HR
UNIT-1 INVESTMENT| BALAJI INST OF IT AND MANAGEMENT 6
1. STEP-1.Set investment policy: It is a combination of investor’s
philosophy and planning. It expresses the investor’s attitudes towards
important of investment management issues. A comprehensive investment
policy should address the following issues.
MISSION STATEMENT
RISK TOLERANCE
INVESTMENT OBJECTIVES
POLICY ASSET MIX (allocation of finds to broad asset classes
such as stocks and bonds.
ACTIVE MANAGEMENT
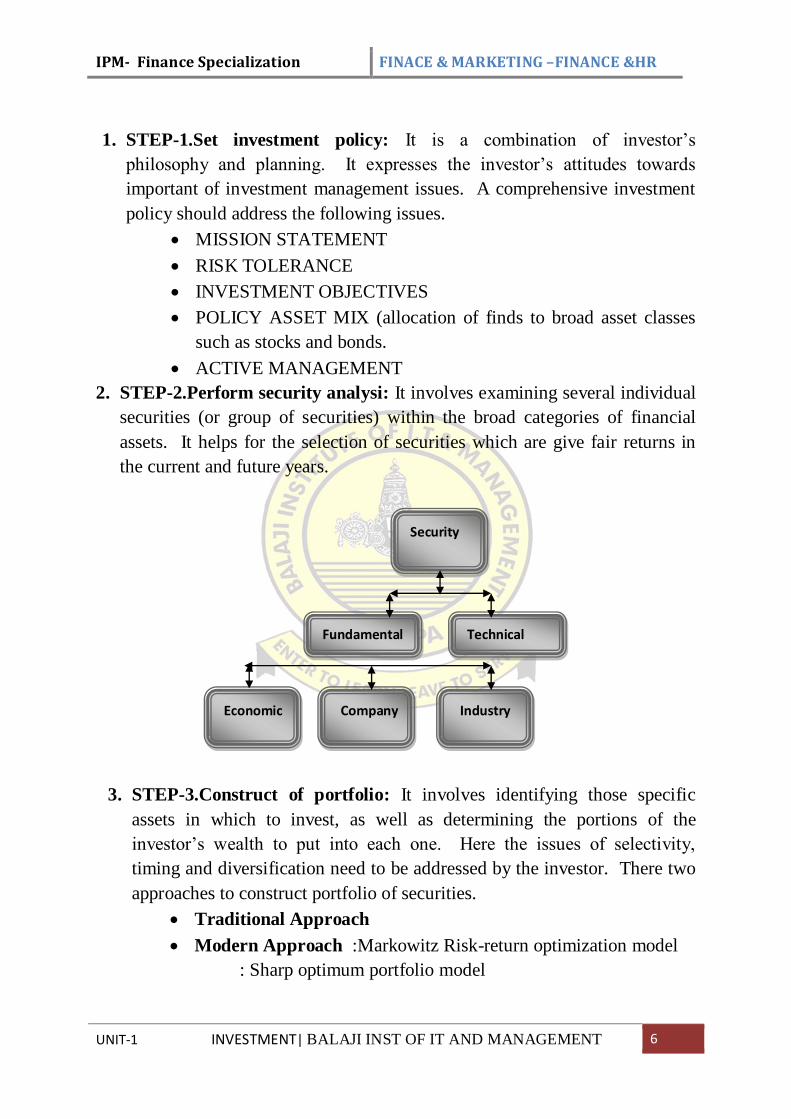
2. STEP-2.Perform security analysi: It involves examining several individual
securities (or group of securities) within the broad categories of financial
assets. It helps for the selection of securities which are give fair returns in
the current and future years.
3. STEP-3.Construct of portfolio: It involves identifying those specific
assets in which to invest, as well as determining the portions of the
investor’s wealth to put into each one. Here the issues of selectivity,
timing and diversification need to be addressed by the investor. There two
approaches to construct portfolio of securities.
Traditional Approach
Modern Approach :Markowitz Risk-return optimization model
: Sharp optimum portfolio model
Company
Analysis
Security
Analysis
Fundamental Technical
Economic
Analysis
Industry
Analysis
IPM- Finance Specialization FINACE & MARKETING –FINANCE &HR
UNIT-1 INVESTMENT| BALAJI INST OF IT AND MANAGEMENT 7
4. STEP-4 Portfolio revisions: It helps for liquidating the unattractive
securities and acquiring the new stars from the market. It involves periodic
repetition of the previous three steps of the investment policy by setting new
investment policy, security analysis afresh, and reallocation of cash for the
new portfolio.
Formula Plans are to ease the problem of timing and minimize the
emotions involved in investment.
1. To minimize loss but not to increase profits.
2. In formula plans the portfolio investment involve two
types
Aggressive Portfolio
Conservative Portfolio
3. Formula plans classified into four types.
Constant Rupee Plan
Constant Ratio Plan
Variable Ratio Plan
Rupee Cost Averaging Plan
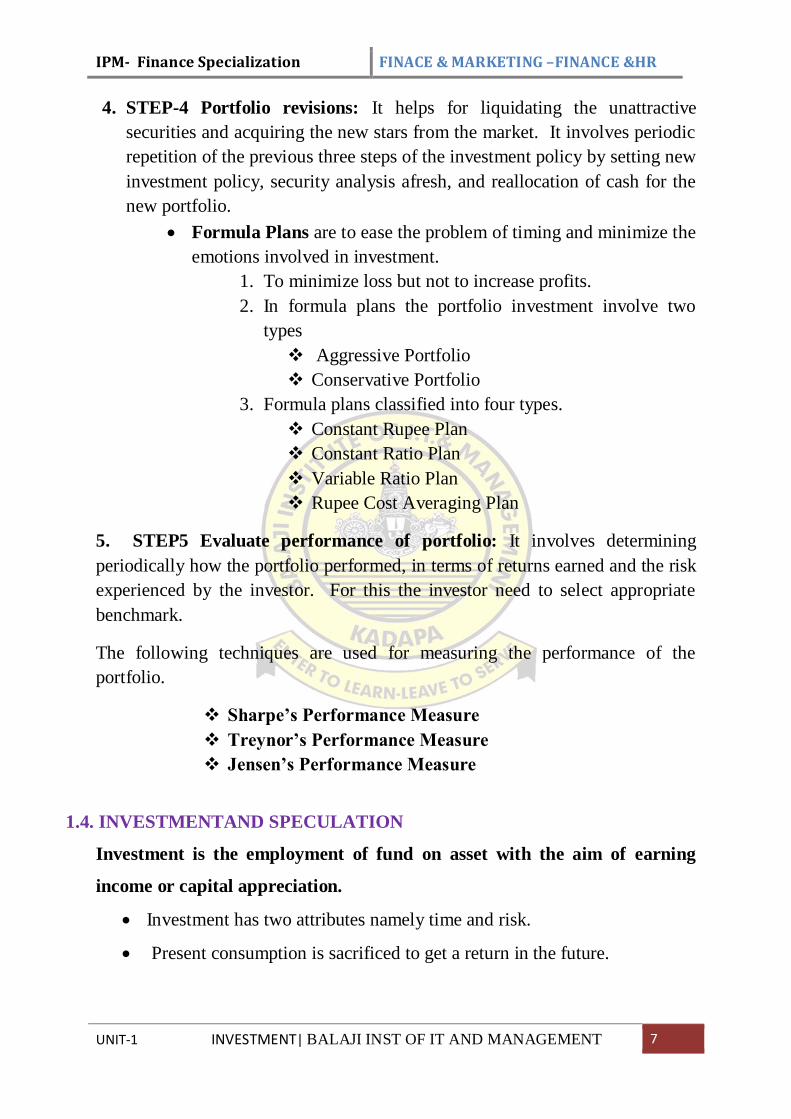
5. STEP5 Evaluate performance of portfolio: It involves determining
periodically how the portfolio performed, in terms of returns earned and the risk
experienced by the investor. For this the investor need to select appropriate
benchmark.
The following techniques are used for measuring the performance of the
portfolio.
Sharpe’s Performance Measure
Treynor’s Performance Measure
Jensen’s Performance Measure
1.4. INVESTMENTAND SPECULATION
Investment is the employment of fund on asset with the aim of earning
income or capital appreciation.
Investment has two attributes namely time and risk.
Present consumption is sacrificed to get a return in the future.
IPM- Finance Specialization FINACE & MARKETING –FINANCE &HR
UNIT-1 INVESTMENT| BALAJI INST OF IT AND MANAGEMENT 8
The sacrifice that has to be borne his certain but the return in the future
May be uncertain.
To The Economist in investment is the net addition made to the nation’s
capital stock that consists of goods and services that are used in the
production process.
Financial investment is the allocation of money to asset that is expected
to return same given over a period of time.
Speculation means taking up the business risk in the hope of getting short
term gain
Speculation essentially involves buying and selling activities with the
expectation of getting profit from the price fluctuations.
Purchasing securities with the low price and selling with high price is
termed as speculator.
The speculator is more interested in the market action and its price
movement.
The investor would try to match the risk and return
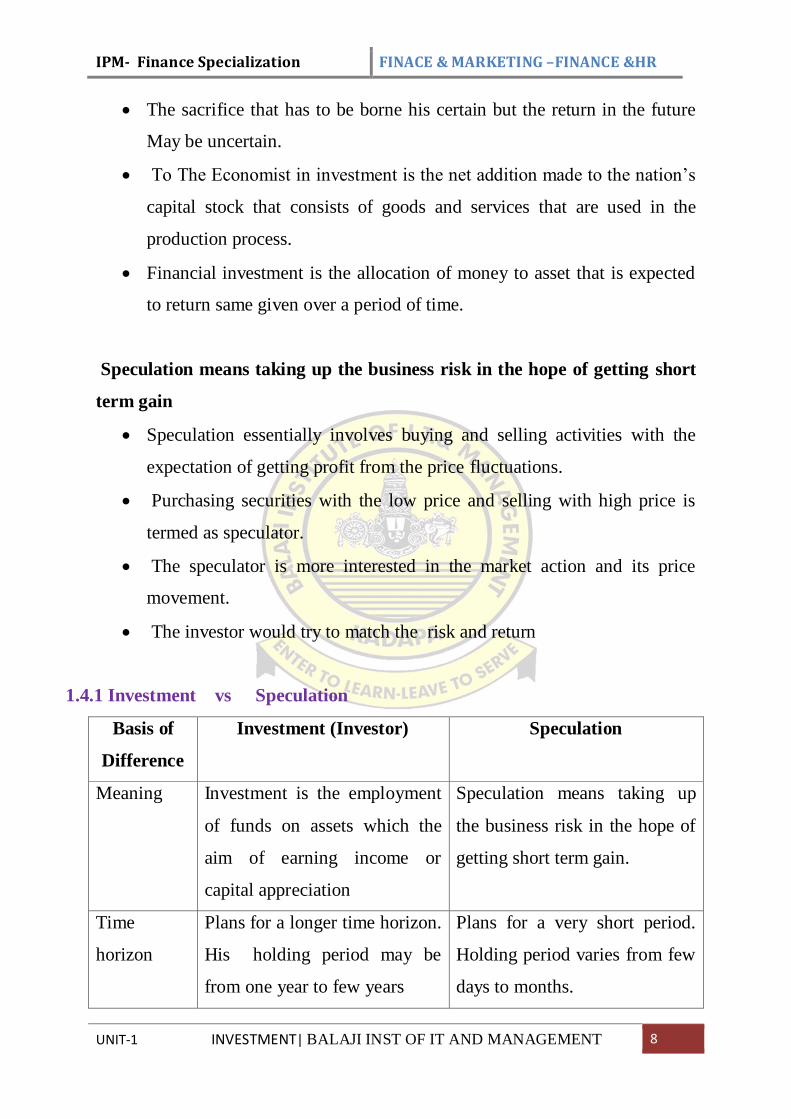
1.4.1 Investment vs Speculation
Basis of
Difference
Investment (Investor) Speculation
Meaning Investment is the employment
of funds on assets which the
aim of earning income or
capital appreciation
Speculation means taking up
the business risk in the hope of
getting short term gain.
Time
horizon
Plans for a longer time horizon.
His holding period may be
from one year to few years
Plans for a very short period.
Holding period varies from few
days to months.
IPM- Finance Specialization FINACE & MARKETING –FINANCE &HR
UNIT-1 INVESTMENT| BALAJI INST OF IT AND MANAGEMENT 9
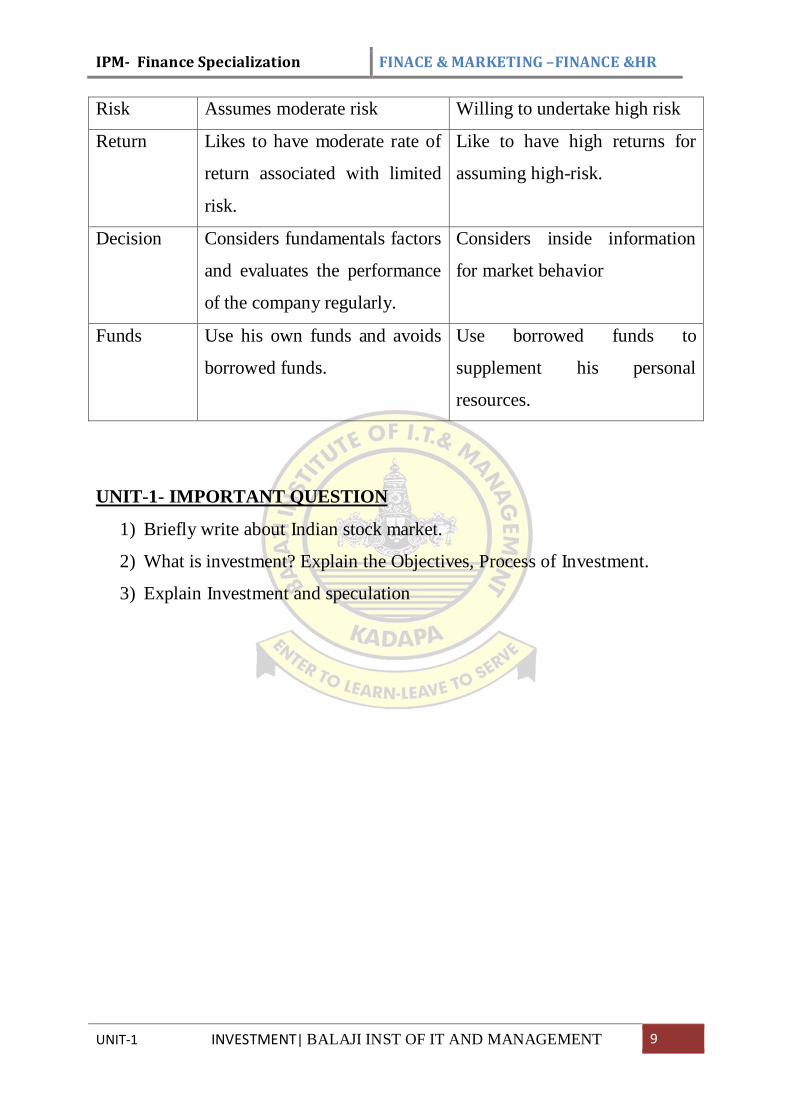
Risk Assumes moderate risk Willing to undertake high risk
Return Likes to have moderate rate of
return associated with limited
risk.
Like to have high returns for
assuming high-risk.
Decision Considers fundamentals factors
and evaluates the performance
of the company regularly.
Considers inside information
for market behavior
Funds Use his own funds and avoids
borrowed funds.
Use borrowed funds to
supplement his personal
resources.
UNIT-1- IMPORTANT QUESTION
1) Briefly write about Indian stock market.
2) What is investment? Explain the Objectives, Process of Investment.
3) Explain Investment and speculation
(17E00312) INVESTMENT AND PORTFOLIO MANAGEMENT
(Elective III)
Objective: The objective of the course is to provide students an understanding of working
of capital markets and management of portfolios of stocks. The pre-requisite for the course
is Financial Accounting and Analysis and Financial Management.
* Standard discounting and statistical tables to be allowed in the examinations.
1. Investment: Introduction to stock markets -objectives, Process of Investment,
Investment and speculation.
2. Fundamental Analysis & Technical Analysis: Framework of Fundamental
analysis-Economic analysis, Industry analysis-Industry Life cycle - Company
analysis, Fundamental Analysis Vs Technical Analysis - Dow Theory.
3. Measurement of Risk and Return: Revenue Return and Capital appreciation,
holding period –Calculation of expected return, Risk factors, risk classification –
systematic risk – unsystematic risk – standard deviation – variance– Beta .
4. Valuation of Securities: Types of Securities - Approaches of valuation – Bond
valuation – Preference share Valuation – Common stock Valuation.
5. Portfolio Management: Process of Portfolio Management, Modern Portfolio –
Portfolio models – Markowitz model – Sharpe single index model, Capital Asset
Pricing Models.
Text Books:
Investment Management,V.K.Balla, S.Chand Company Ltd
Security Analysis and Portfolio Management ,PunithavathyPandian, Vikas
References:
Investment Analysis and portfolio management, Chandra, Tata McGraw Hill .
Secuerity Analysis Portfolio Management, Ranganatham&Madhumathi, Pearson
Education.
Security Analysis and Portfolio Management, SudhindraBhat, excel.
Security analysis and portfolio management, Avadani, Himalaya publishers.
Investment analysis portfolio management, Frank Reilly & Brown, Cengage.
Investment Management, Preethi Singh, Himalaya Publishing House, Mumbai..
Investment, Bodie, McGraw Hill Book Company.
Investment Management ,Hiriyappa ,New Age Publications
IPM- Finance Specialization FINACE & MARKETING –FINANCE & HR
UNIT-2 FUNDAMENTAL & TECHNICAL ANALYSIS | BALAJI INST OF IT AND MANAGEMENT 1
UNIT-2
FUNDAMENTAL ANALYSIS & TECHNICAL ANALYSIS
2.1 FRAMEWORK OF FUNDAMENTAL ANALYSIS: The intrinsic
value of an equity share depends on a multitude of factors. The earning of the
company the growth rate and the risk exposure of the company has a direct
bearing on the price of the share.
Fundamental analysis consists of
A. Economic analysis
B. Industry analysis
C. Company analysis
2.1.A . ECONOMIC ANALYSIS: The level of economic activity has an
impact on investment in many ways. If the economy grows rapidly, the
industry can also be expected to show Rapid growth and vice versa. The
economics analysis is essential to understand the behavior of the stock prices
the economic analysis factors for as follows
a) Gross Domestic Product (GDP): GDP indicate the rate of growth of
the economy. GDP represents the aggregate value of the goods and
services produced in the economy. The higher growth rate are more
favorable to the stock market.
b) Savings and investments: It is obvious that growth requires
investment which in turn requires substantial amount of domestic
savings. The saving the Savings and investment patterns of public
affect the stocks to a great extent.
c) Inflation: High rate of inflation is harmful to the stock market.
Inflation means increasing of share prices.
d) Interest rates: the interest rate affects the cost of Financing to the
firms. A decrease in interest rate implies lower cost of finance for
firms and profitability.
e) Budget: The budget draft provides an elaborate account of the
government revenues and expenditure. A deficit budget may affect the
IPM- Finance Specialization FINACE & MARKETING –FINANCE & HR
UNIT-2 FUNDAMENTAL & TECHNICAL ANALYSIS | BALAJI INST OF IT AND MANAGEMENT 2
cost of production. Supplies budget may results in deflation. Hence
balanced budget is highly favorable to the stock markets.
f) Tax structure: The tax structure also influence the stock market low
tax structure will give a scope to increase to investment in stock
market.
g) The balance of payment: The balance of payment is a measure of the
strength of rupee on external account receipts-payments is the balance
of payment receipts are more payments are less than the balance of
payment is in surplus. Surplus balance of payment is a positive effect
on the stock market.
h) Monsoon and Agriculture: Agriculture is also directly and indirectly
affects the stock market because some Industries like sugar, cotton,
Textiles and food depends on monsoon and Agriculture.
i) Infrastructure facilities: Infrastructure facilities are essential for the
growth of industries and Agricultural sector. This will impact on stock
market.
2.1. B INDUSTRY ANALYSIS: After conducting Economic analysis look
into various industries. Industry is a group of firms that have similar the
technological of productions and produce similar products. Analyzing
different industries is call industry analysis.
2.1.B.1 KEY CHARACTERISTICS/ FACTORS OF INDUSTRY
ANALYSIS:
1. Past sales and earnings: to analyze industry past sales and earnings
will help us to forecast the future of the industry.
2. Permanence: if the analyst feels the technology used in the particular
industry is having the long future the investment will give more
returns.
3. Government attitude towards industry: This analysis helps the
investor to know the government is positive or negative towards the

IPM- Finance Specialization FINACE & MARKETING –FINANCE & HR
UNIT-2 FUNDAMENTAL & TECHNICAL ANALYSIS | BALAJI INST OF IT AND MANAGEMENT 3
particular Industry. If the government is favorable about industry than
the goods return in the future.
4. Labour conditions: labour conditions are also important to the
investors to know the industry future.
5. Competitive conditions: the industry competitive conditions is
healthy than it is good sign for profits visa versa.
6. Product differentiation advantages: That selected industry producing
unique product that particular industry have more demand.
7. SWOT analysis: every investor has to analysis that the internal
strength and weakness. External opportunities and threats of the
industry
8. Industries share price relative Industry: Industry share price and
earning also influence the investors to purchase or sale of shares
2.1.B.2 CLASSIFICATION BY BUSINESS CYCLE/INDUSTRY
CLASSIFICATION:
1. Growth industries: These industries grow consistently and its growth and
its growth may exceed the average growth of the economy.
High rate of earnings
Wider expansion of business
By considering technological changes
By considering 20th industry: - 1) Automobile industry 2) Aero
plane industry
1940’s Photography industry
1950’s Color television industry, Computers industry
1960’s Pharmaceutical industry, Communication
2000’s Software industry
Present cellular industry, Genetic engineering and
Environmental Management.
IPM- Finance Specialization FINACE & MARKETING –FINANCE & HR
UNIT-2 FUNDAMENTAL & TECHNICAL ANALYSIS | BALAJI INST OF IT AND MANAGEMENT 4
2. Cyclical Industries: These industries mostly likely the benefit from a
period of economic prosperity and most likely suffers from economic
recession.
Ex: Fridges, Washing machines and Seasonal products.
3. Defensive Industries: These industries specify the movement of the
business cycle. Defensive industries often contain firms whose securities on
investor might hold for income. Food and shelter are the basic requirements
of humanity. These types of industries we can consider as defensive
industries.
4. Cyclical Growth Industries: These industries pass both characteristics of
cyclical growth industries. Ex: Automobile industries; because these industry
experiences period of stagnation, decline but they grow tremendously
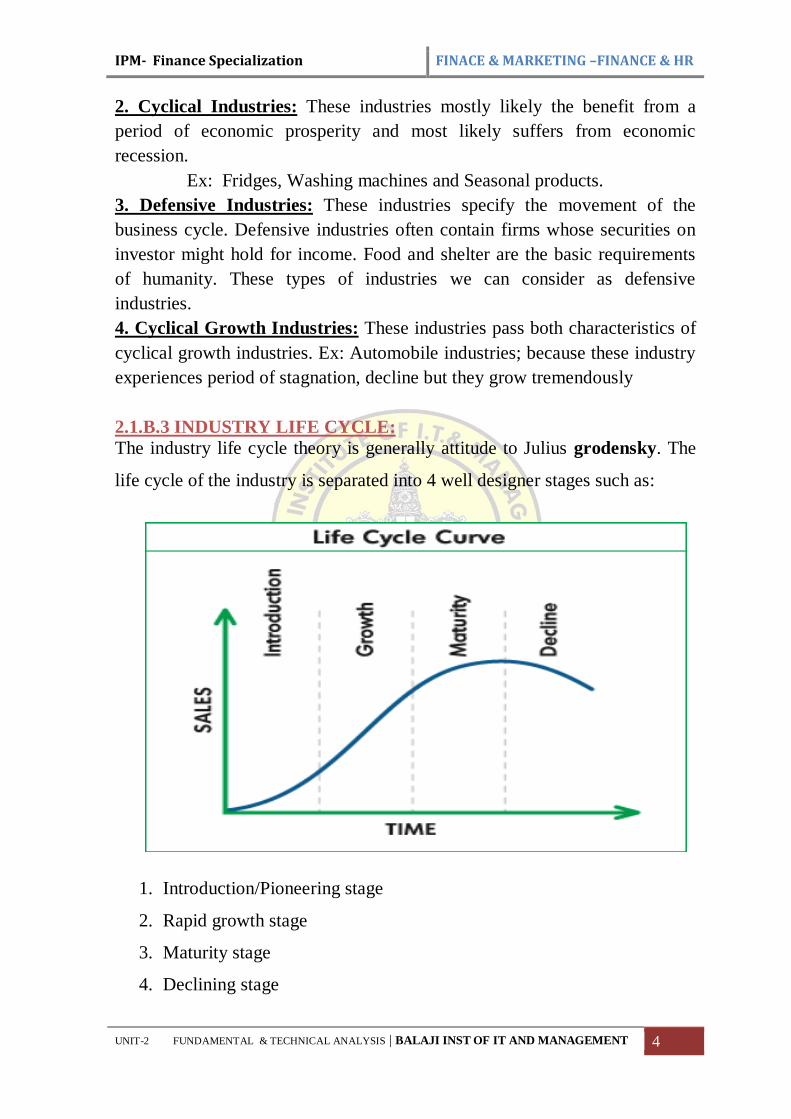
2.1.B.3 INDUSTRY LIFE CYCLE:
The industry life cycle theory is generally attitude to Julius grodensky. The
life cycle of the industry is separated into 4 well designer stages such as:
1. Introduction/Pioneering stage
2. Rapid growth stage
3. Maturity stage
4. Declining stage
IPM- Finance Specialization FINACE & MARKETING –FINANCE & HR
UNIT-2 FUNDAMENTAL & TECHNICAL ANALYSIS | BALAJI INST OF IT AND MANAGEMENT 5
1. Introduction/Pioneering stage: In this stage the demand of the product is
low. Company tries to develop branded name and image in this stage it is
difficult to select company is because the survival rate is unknown.
Example: Genetic engineering
2. Growth stage: this stage starts with the appearance of surviving firms
from the pioneering stage in this stage companies is growth strongly in
market share and financial performance. This will create domain for company
sharing.
Example: Software Industry
3. Maturity stage: In this stage is the growth rate tense to Moderate and the
rate of the growth would be more or less equal to the industrial growth rate or
the Gross Domestic Product growth rates. Sales may be increasing at a slower
rate. Indicates labour cost enhancing in technology and stationery demands.
4. Declining stage: In the stage demand for the particular product and the
earning of the companies in the industry decline. Nowadays very few
customers using black and white TV. Innovation of new product and change
in customer preference lead to this stage it is better to avoid investing in the
share of the low growth Industries even in the Boom period.
2.1.C COMPANY ANALYSIS: After analyzing economic and industry
analysis investor look into company analysis. Analyzing company condition
is called company analysis. For earning profits investors apply a simple and
common sense decision rule of maximization. That is:
Buy the share at a low price
Sell the share at a high price
The above decision rule is very simple to understand, but difficult to apply
in actual price. For this investor need to knowhow to find out whether the
price of a company’s share is low or high?What is the benchmark used to
compare the price of the share?
IPM- Finance Specialization FINACE & MARKETING –FINANCE & HR
UNIT-2 FUNDAMENTAL & TECHNICAL ANALYSIS | BALAJI INST OF IT AND MANAGEMENT 6
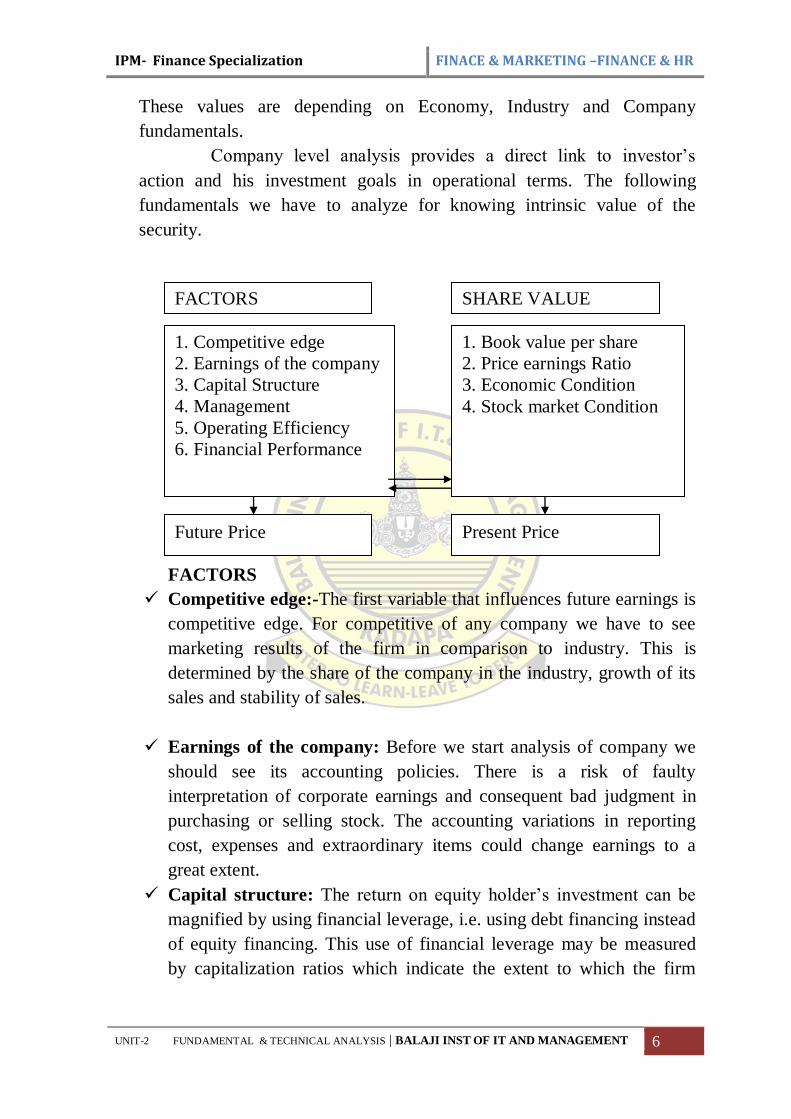
These values are depending on Economy, Industry and Company
fundamentals.
Company level analysis provides a direct link to investor’s
action and his investment goals in operational terms. The following
fundamentals we have to analyze for knowing intrinsic value of the
security.
FACTORS
Competitive edge:-The first variable that influences future earnings is
competitive edge. For competitive of any company we have to see
marketing results of the firm in comparison to industry. This is
determined by the share of the company in the industry, growth of its
sales and stability of sales.
Earnings of the company: Before we start analysis of company we
should see its accounting policies. There is a risk of faulty
interpretation of corporate earnings and consequent bad judgment in
purchasing or selling stock. The accounting variations in reporting
cost, expenses and extraordinary items could change earnings to a
great extent.
Capital structure: The return on equity holder’s investment can be
magnified by using financial leverage, i.e. using debt financing instead
of equity financing. This use of financial leverage may be measured
by capitalization ratios which indicate the extent to which the firm
1. Competitive edge
2. Earnings of the company
3. Capital Structure
4. Management
5. Operating Efficiency
6. Financial Performance
1. Book value per share
2. Price earnings Ratio
3. Economic Condition
4. Stock market Condition
FACTORS SHARE VALUE
Future Price Present Price
IPM- Finance Specialization FINACE & MARKETING –FINANCE & HR
UNIT-2 FUNDAMENTAL & TECHNICAL ANALYSIS | BALAJI INST OF IT AND MANAGEMENT 7
finances its assets by use of debt or preference shares. These ratios are
also referred as debt ratios.
Management: Some experts believe that the quality of a company’s
management may be single most important influence on its future
profitability and overall success. The analysts can evaluate
management by getting information on some specific questions such
as listed below.
i. What is the age and experience characteristic of management?
ii. How effective is the company’s strategic planning?
iii. Has company developed and followed a sound marketing strategy?
Operating efficiency: The operating efficiency and the earnings of
the company are directly influenced by the company’s operating
characteristics. A company that is constantly expanding its physical
facilities and continues to operate at full capacity is more likely to
produce profits and earnings in future.
Financial performance: The analyst has to analyze financial
statements for knowing financial strengths and weaknesses of the
company; which helpful for identifying intrinsic value of the security.
The following tools are to be used for analyzing financial strengths
and weaknesses of the company. i.e Ratio analysis, Comparative
analysis, Common size analysis, Trend analysis, Funds flow analysis,
Cash flow analysis, Break even analysis.
SHARE VALUE:
Book value per share: It determine the amount available to
shareholders after paying all business liabilities , preference dividend
etc.,
𝐵𝑜𝑜𝑘 𝑣𝑎𝑙𝑢𝑒 𝑝𝑒𝑟 𝑠ℎ𝑎𝑟𝑒 =𝑒𝑞𝑢𝑖𝑡𝑦 𝑠ℎ𝑎𝑟𝑒 𝑐𝑎𝑝𝑖𝑡𝑎𝑙 + 𝑟𝑒𝑠𝑒𝑟𝑣𝑒𝑠
𝑛𝑢𝑚𝑏𝑒𝑟 𝑜𝑓 𝑜𝑢𝑡𝑠𝑡𝑎𝑛𝑑𝑖𝑛𝑔 𝑠ℎ𝑎𝑟𝑒𝑠
This value is higher than the Par value; it is healthy sign to the
company. At this time company issue bonus shares.
IPM- Finance Specialization FINACE & MARKETING –FINANCE & HR
UNIT-2 FUNDAMENTAL & TECHNICAL ANALYSIS | BALAJI INST OF IT AND MANAGEMENT 8
Price Earnings Ratio:
It is the most financial parameter to know the value of security.
It represents how many times the company’s future earnings is
willing to offer the shareholders.
It is the multiplying factor that the market willing to offer to the
company future earnings.
𝑃
𝐸𝑅𝑎𝑡𝑖𝑜 =
𝑀𝑎𝑟ℎ𝑒𝑡 𝑝𝑟𝑖𝑐𝑒 𝑝𝑒𝑟 𝑠ℎ𝑎𝑟𝑒
𝐸𝑎𝑟𝑛𝑖𝑛𝑔𝑠 𝑝𝑒𝑟 𝑠ℎ𝑎𝑟𝑒
If Current P/E Ratio> Expected P/E Ratio then the stock is
overpriced. It means stock price reached peak position because in the
future the stock price may falls down. It is suggested to investor to
sell the security.
If Current P/E Ratio< Expected P/E Ratio then the stock is
underpriced. It in the future the stock will increase. It is suggested to
investor to buy the security.
If Current P/E Ratio= Expected P/E Ratio then the stock is correctly
priced. It means there is no change in the future share price.
Economic conditions: A country's economic conditions are influenced
by numerous macroeconomic and microeconomic factors, including
monetary and fiscal policy, the state of the global economy,
unemployment levels, productivity, exchange rates, inflation and many
others.
Stock market conditions: Stock market condition is also consider in
company analysis
The above all factors will provide information to the investor for forecasting
the future price of the security. The following factors will provide
information to the analyst for knowing present price of the security and to
confirm the future price changes.
IPM- Finance Specialization FINACE & MARKETING –FINANCE & HR
UNIT-2 FUNDAMENTAL & TECHNICAL ANALYSIS | BALAJI INST OF IT AND MANAGEMENT 9
2.2. TECHNICAL ANALYSIS
Meaning: It is the process of identifying trend reversal at the earliest to
formulate the buying and selling strategy
Technical analysis is a method of evaluating securities by analyzing the
statistics generated by marketing activities: such as fast price and volume.
Technical analysis does not attempt to measure a securities in intrinsic
values but instead use charts and other tools to identify pattern that can
suggest future Activity.
Technical analysis takes a completely different approach; it doesn't care
one bit about the "value" of a company or a commodity. Technicians
(sometimes called chartists) are only interested in the price movements in
the market.
Technical analysis attempts to understand the emotions in the market by
studying the market itself, as opposed to its components.
Technical analysis really just studies supply and demand in a market in
an attempt to determine what direction, or trend, will continue in the
future.
Technical analysis is a method of evaluating securities by analyzing the
statistics generated by market activity, such as past prices and volume.
Technical analysts do not attempt to measure a security's intrinsic value,
but instead use charts and other tools to identify patterns that can suggest
future activity.
2.2.1 ASSUMPTION
The market value of the scrip is determined by the interaction of
supply and demand.
The market discounts everything.
The market always moves in trend.
Any layman knows the fact that history repeats itself.
IPM- Finance Specialization FINACE & MARKETING –FINANCE & HR
UNIT-2 FUNDAMENTAL & TECHNICAL ANALYSIS | BALAJI INST OF IT AND MANAGEMENT 10
2.2.2 HISTORY OF TECHNOLOGICAL ANALYSIS:
The technical analysis is based on the doctrine in given by Charles H Dow
in 1884 in the wall Street Journal. he wrote a series of articles in the Wall
Street Journal.
A.J. NELSON, a close friend of Charles Dow formalized the dow theory
of economic forecasting the analysts used charts of individual stocks and
moving averages in the early 1920’s later on with the aid of calculators and
computer sophisticated techniques come into vogue.
2.2.3 TECHNICAL TOOLS:
Generally used technical tools for Dow theory, volume of trending, short
selling odd lot trading bars and line charts, moving average and oscillators.
2.2.4 THE USE OF TREND
One of the most important concepts in technical analysis is that of trend.
A trend is really nothing more than the general direction in which a
security or market is headed.
In any given chart, you will probably notice that prices do not tend to
move in a straight line in any direction, but rather in a series of high
and low.
In technical analysis, it is the movement of the high and low that
constitutes a trend.
There are three types of trend:
Uptrend: When each successive peak and trough is higher, it's
referred to as an upward trend.
Downtrend: If the peaks and troughs are getting lower, it's a
downtrend.
Sideways/Horizontal Trend: When there is little movement up
or down in the peaks and troughs, it's a sideways or horizontal
trend.
Along with these three trend directions based on trend lengths
A trend of any direction can be classified:
• Long-term trend,
IPM- Finance Specialization FINACE & MARKETING –FINANCE & HR
UNIT-2 FUNDAMENTAL & TECHNICAL ANALYSIS | BALAJI INST OF IT AND MANAGEMENT 11
• Intermediate trend
• Short-term trend.
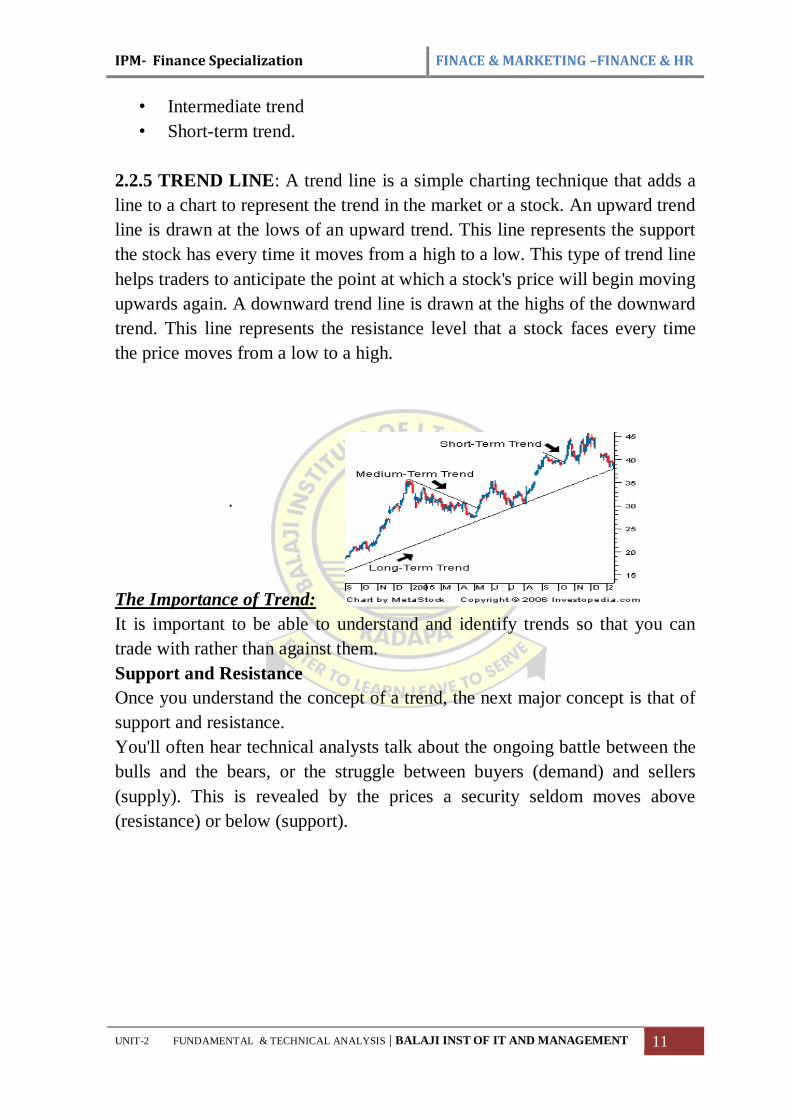
2.2.5 TREND LINE: A trend line is a simple charting technique that adds a
line to a chart to represent the trend in the market or a stock. An upward trend
line is drawn at the lows of an upward trend. This line represents the support
the stock has every time it moves from a high to a low. This type of trend line
helps traders to anticipate the point at which a stock's price will begin moving
upwards again. A downward trend line is drawn at the highs of the downward
trend. This line represents the resistance level that a stock faces every time
the price moves from a low to a high.
.
The Importance of Trend:
It is important to be able to understand and identify trends so that you can
trade with rather than against them.
Support and Resistance
Once you understand the concept of a trend, the next major concept is that of
support and resistance.
You'll often hear technical analysts talk about the ongoing battle between the
bulls and the bears, or the struggle between buyers (demand) and sellers
(supply). This is revealed by the prices a security seldom moves above
(resistance) or below (support).
IPM- Finance Specialization FINACE & MARKETING –FINANCE & HR
UNIT-2 FUNDAMENTAL & TECHNICAL ANALYSIS | BALAJI INST OF IT AND MANAGEMENT 12
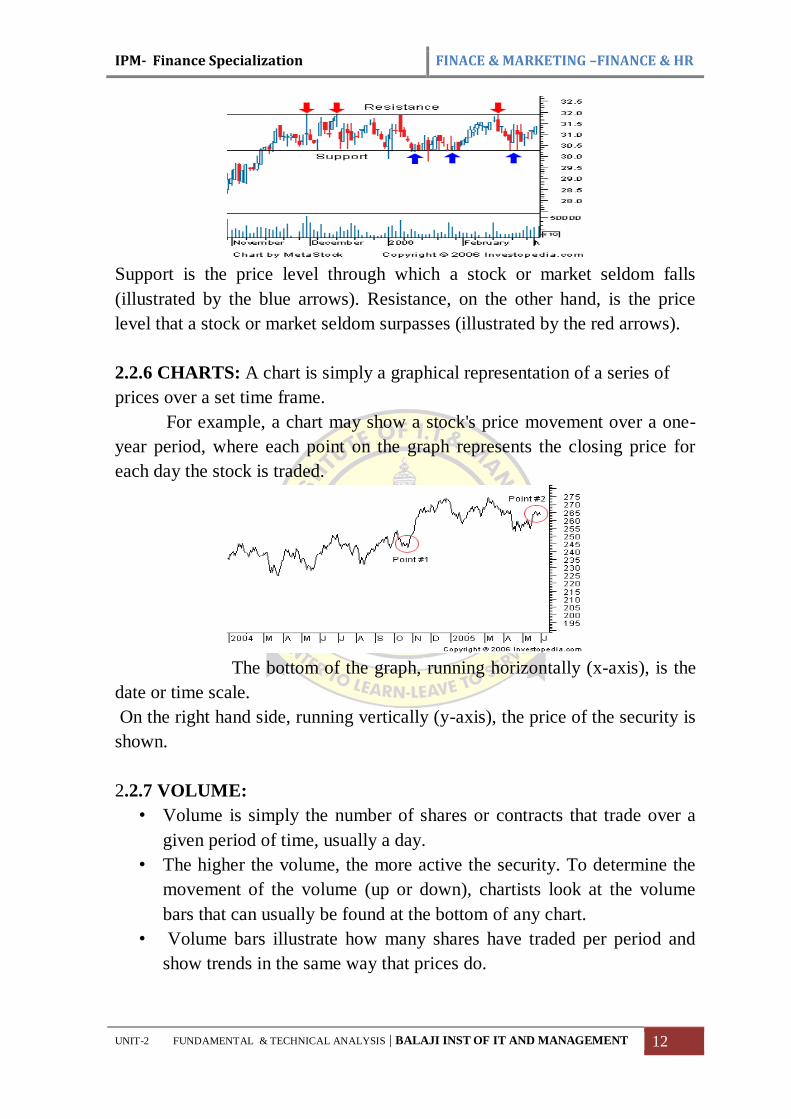
Support is the price level through which a stock or market seldom falls
(illustrated by the blue arrows). Resistance, on the other hand, is the price
level that a stock or market seldom surpasses (illustrated by the red arrows).
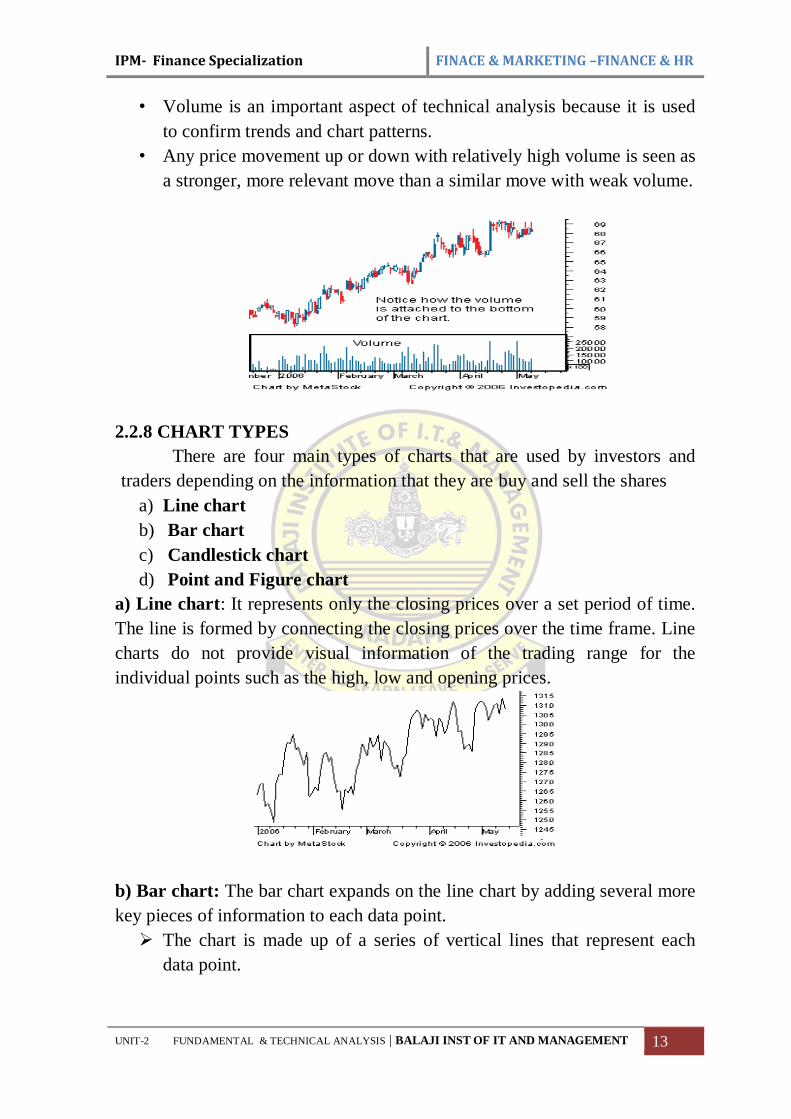
2.2.6 CHARTS: A chart is simply a graphical representation of a series of
prices over a set time frame.
For example, a chart may show a stock's price movement over a one-
year period, where each point on the graph represents the closing price for
each day the stock is traded.
The bottom of the graph, running horizontally (x-axis), is the
date or time scale.
On the right hand side, running vertically (y-axis), the price of the security is
shown.
2.2.7 VOLUME:
• Volume is simply the number of shares or contracts that trade over a
given period of time, usually a day.
• The higher the volume, the more active the security. To determine the
movement of the volume (up or down), chartists look at the volume
bars that can usually be found at the bottom of any chart.
• Volume bars illustrate how many shares have traded per period and
show trends in the same way that prices do.
IPM- Finance Specialization FINACE & MARKETING –FINANCE & HR
UNIT-2 FUNDAMENTAL & TECHNICAL ANALYSIS | BALAJI INST OF IT AND MANAGEMENT 13
• Volume is an important aspect of technical analysis because it is used
to confirm trends and chart patterns.
• Any price movement up or down with relatively high volume is seen as
a stronger, more relevant move than a similar move with weak volume.
2.2.8 CHART TYPES
There are four main types of charts that are used by investors and
traders depending on the information that they are buy and sell the shares
a) Line chart
b) Bar chart
c) Candlestick chart
d) Point and Figure chart
a) Line chart: It represents only the closing prices over a set period of time.
The line is formed by connecting the closing prices over the time frame. Line
charts do not provide visual information of the trading range for the
individual points such as the high, low and opening prices.
b) Bar chart: The bar chart expands on the line chart by adding several more
key pieces of information to each data point.
The chart is made up of a series of vertical lines that represent each
data point.
IPM- Finance Specialization FINACE & MARKETING –FINANCE & HR
UNIT-2 FUNDAMENTAL & TECHNICAL ANALYSIS | BALAJI INST OF IT AND MANAGEMENT 14
This vertical line represents the high and low for the trading period,
along with the closing price.
The close and open are represented on the vertical line by a horizontal
dash. The opening price on a bar chart is illustrated by the dash that is
located on the left side of the vertical bar. Conversely, the close is
represented by the dash on the right.
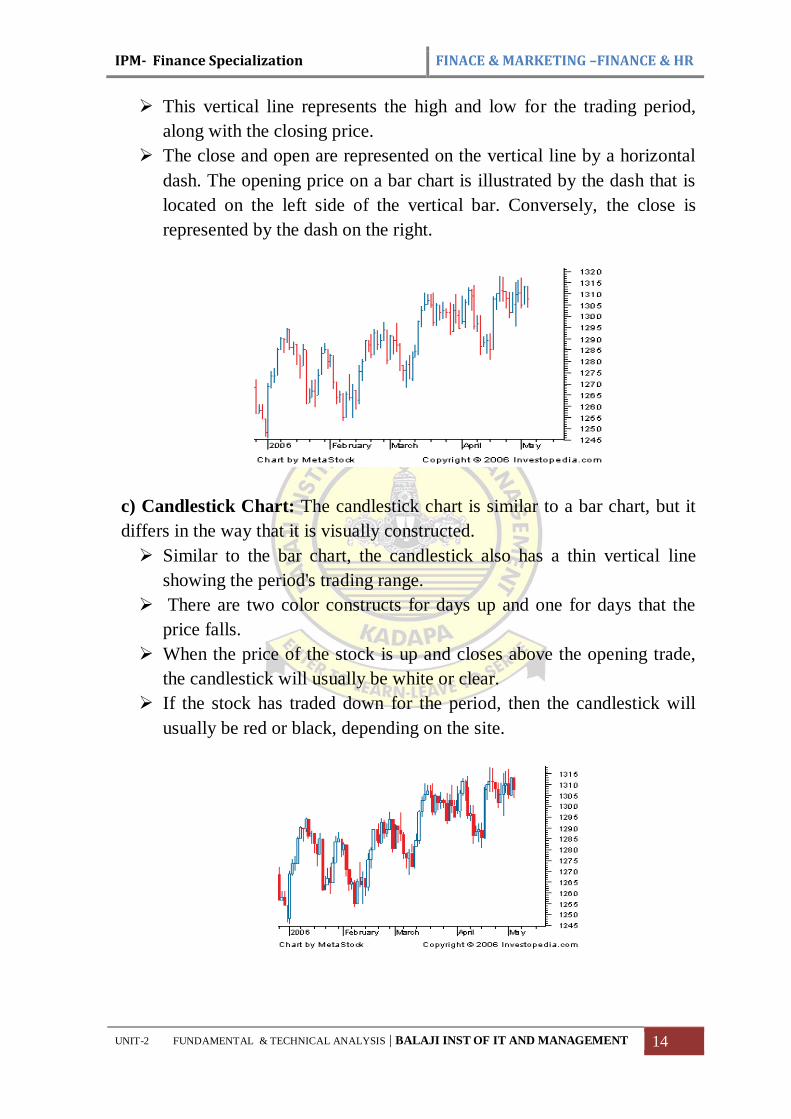
c) Candlestick Chart: The candlestick chart is similar to a bar chart, but it
differs in the way that it is visually constructed.
Similar to the bar chart, the candlestick also has a thin vertical line
showing the period's trading range.
There are two color constructs for days up and one for days that the
price falls.
When the price of the stock is up and closes above the opening trade,
the candlestick will usually be white or clear.
If the stock has traded down for the period, then the candlestick will
usually be red or black, depending on the site.
IPM- Finance Specialization FINACE & MARKETING –FINANCE & HR
UNIT-2 FUNDAMENTAL & TECHNICAL ANALYSIS | BALAJI INST OF IT AND MANAGEMENT 15
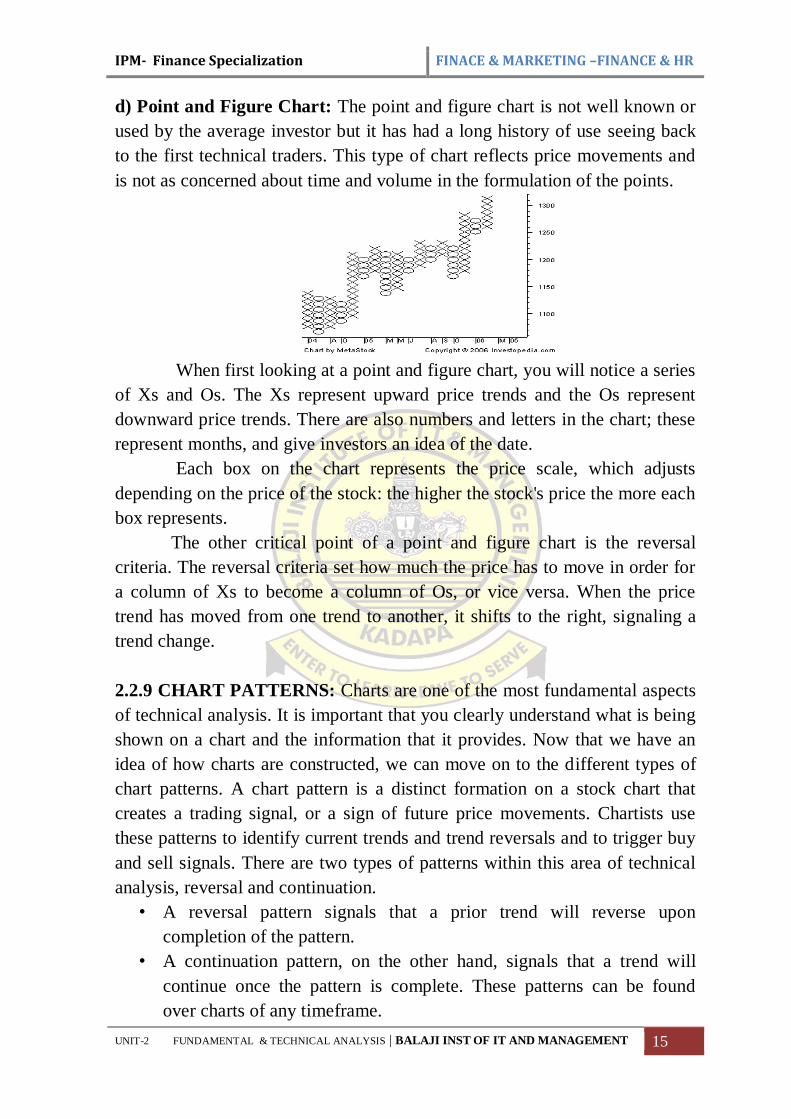
d) Point and Figure Chart: The point and figure chart is not well known or
used by the average investor but it has had a long history of use seeing back
to the first technical traders. This type of chart reflects price movements and
is not as concerned about time and volume in the formulation of the points.
When first looking at a point and figure chart, you will notice a series
of Xs and Os. The Xs represent upward price trends and the Os represent
downward price trends. There are also numbers and letters in the chart; these
represent months, and give investors an idea of the date.
Each box on the chart represents the price scale, which adjusts
depending on the price of the stock: the higher the stock's price the more each
box represents.
The other critical point of a point and figure chart is the reversal
criteria. The reversal criteria set how much the price has to move in order for
a column of Xs to become a column of Os, or vice versa. When the price
trend has moved from one trend to another, it shifts to the right, signaling a
trend change.
2.2.9 CHART PATTERNS: Charts are one of the most fundamental aspects
of technical analysis. It is important that you clearly understand what is being
shown on a chart and the information that it provides. Now that we have an
idea of how charts are constructed, we can move on to the different types of
chart patterns. A chart pattern is a distinct formation on a stock chart that
creates a trading signal, or a sign of future price movements. Chartists use
these patterns to identify current trends and trend reversals and to trigger buy
and sell signals. There are two types of patterns within this area of technical
analysis, reversal and continuation.
• A reversal pattern signals that a prior trend will reverse upon
completion of the pattern.
• A continuation pattern, on the other hand, signals that a trend will
continue once the pattern is complete. These patterns can be found
over charts of any timeframe.
IPM- Finance Specialization FINACE & MARKETING –FINANCE & HR
UNIT-2 FUNDAMENTAL & TECHNICAL ANALYSIS | BALAJI INST OF IT AND MANAGEMENT 16
We will review some of the more popular chart patterns:
Head and Shoulders &inverse head and shoulders
Cup and Handle
Double Tops and Bottoms
Triangles
Flag and Pennant
Wedge
Triple Tops and Bottoms
Rounding Bottom
Fundamental analysis and technical analysis, the major schools of thought
when it comes to approaching the markets, are at opposite ends of the
spectrum. Both methods are used for researching and forecasting future
trends in stock prices, and like any investment strategy or philosophy, both
have their advocates and adversaries.
2.3 TECHNICAL ANALYSIS VS FUNDAMENTAL ANALYSIS
Fundamental analysis is a method of evaluating securities by
attempting to measure the intrinsic value of a stock. Fundamental
analysts study everything from the overall economy and industry
conditions to the financial condition and management of companies.
Earnings, expenses, assets and liabilities are all important
characteristics to fundamental analysts.
Technical analysis differs from fundamental analysis in that the stock's
price and volume are the only inputs. The core assumption is that all
known fundamentals are factored into price; thus, there is no need to
pay close attention to them. Technical analysts do not attempt to
measure a security's intrinsic value, but instead use stock charts to
identify patterns and trends that suggest what a stock will do in the
future.
The most popular forms of technical analysis are simple moving
averages, support and resistance, trend lines and momentum-based
indicators.
Simple moving averages are indicators that help assess the stock's
trend by averaging the daily price over a fixed time period. Buy and
sell signals are generated when a shorter duration moving average
crosses a longer duration one.
IPM- Finance Specialization FINACE & MARKETING –FINANCE & HR
UNIT-2 FUNDAMENTAL & TECHNICAL ANALYSIS | BALAJI INST OF IT AND MANAGEMENT 17
Support and resistance utilize price history. Support is defined as areas
where buyers have stepped in before, while resistance consists of the
areas where sellers have impeded price advance. Practitioners look to
buy at support and sell at resistance.
Trend lines are similar to support and resistance, as they give defined
entry and exit points. However, they differ in that they are projections
based on how the stock has traded in the past. They are often utilized
for stocks moving to new highs or new lows where there is no price
history.
Basis of
difference Fundamental Analysis Technical Analysis
Definition
Calculates stock value using
economic factors, known as
fundamentals.
Uses price movement of security
to predict future price movements
Data gathered
from Financial statements Charts
Stock bought When price falls below intrinsic
value
When trader believes they can sell
it on for a higher price
Time horizon Long-term approach Short-term approach
Function Investing Trade
Concepts used Return on Equity (ROE) and
Return on Assets (ROA) Dow Theory, Price Data
Vision looks backward as well as
forward looks backward
1.4 DOW THEORY
The Dow Theory is an approach to trading developed by Charles H. Dow
who, with Edward Jones and Charles Bergstresser, founded Dow Jones &
Company, Inc. and developed the Dow Jones Industrial Average (DJIA).
Dow fleshed out the theory in a series of editorials in the Wall Street
Journal, which he co-founded.

IPM- Finance Specialization FINACE & MARKETING –FINANCE & HR
UNIT-2 FUNDAMENTAL & TECHNICAL ANALYSIS | BALAJI INST OF IT AND MANAGEMENT 18
Before we can get into the specifics of Dow theory trend analysis, we
need to understand trends. First, it's important to note that while the
market tends to move in a general direction, or trend, it doesn't do so in a
straight line. The market will rally up to a high (peak) and then sell off to
a low (trough), but will generally move in one direction. (For related
reading, see Peak-and-Trough Analysis.)
Figure 1: an uptrend
An upward trend is broken up into several rallies, where each rally has a high
and a low. For a market to be considered in an uptrend, each peak in the rally
must reach a higher level than the previous rally's peak, and each low in the
rally must be higher than the previous rally's low.
A downward trend is broken up into several sell-offs, in which each sell-off
also has a high and a low. To be considered a downtrend in Dow terms, each
new low in the sell-off must be lower than the previous sell-offs low and the
peak in the sell-off must be lower than the peak in the previous sell-off. (For
more, see: Technical Analysis: The Use of Trend)
Figure 2: a downtrend
Now that we understand how Dow Theory defines a trend, we can look at the
finer points of trend analysis.Dow theory identifies three trends within the
market: primary, secondary and minor. A primary trend is the largest trend
lasting for more than a year, while a secondary trend is an intermediate trend
IPM- Finance Specialization FINACE & MARKETING –FINANCE & HR
UNIT-2 FUNDAMENTAL & TECHNICAL ANALYSIS | BALAJI INST OF IT AND MANAGEMENT 19
that lasts three weeks to three months and is often associated with a
movement against the primary trend. Finally, the minor trend often lasts less
than three weeks and is associated with the movements in the intermediate
trend.
a) Primary Trend
In Dow Theory, the primary trend is the major trend of the market, which
makes it the most important one to determine. This is because the overriding
trend is the one that affects the movements in stock prices. The primary trend
will also impact the secondary and minor trends within the market. (For
related reading, see Short-, Intermediate- and Long-Term Trends.)
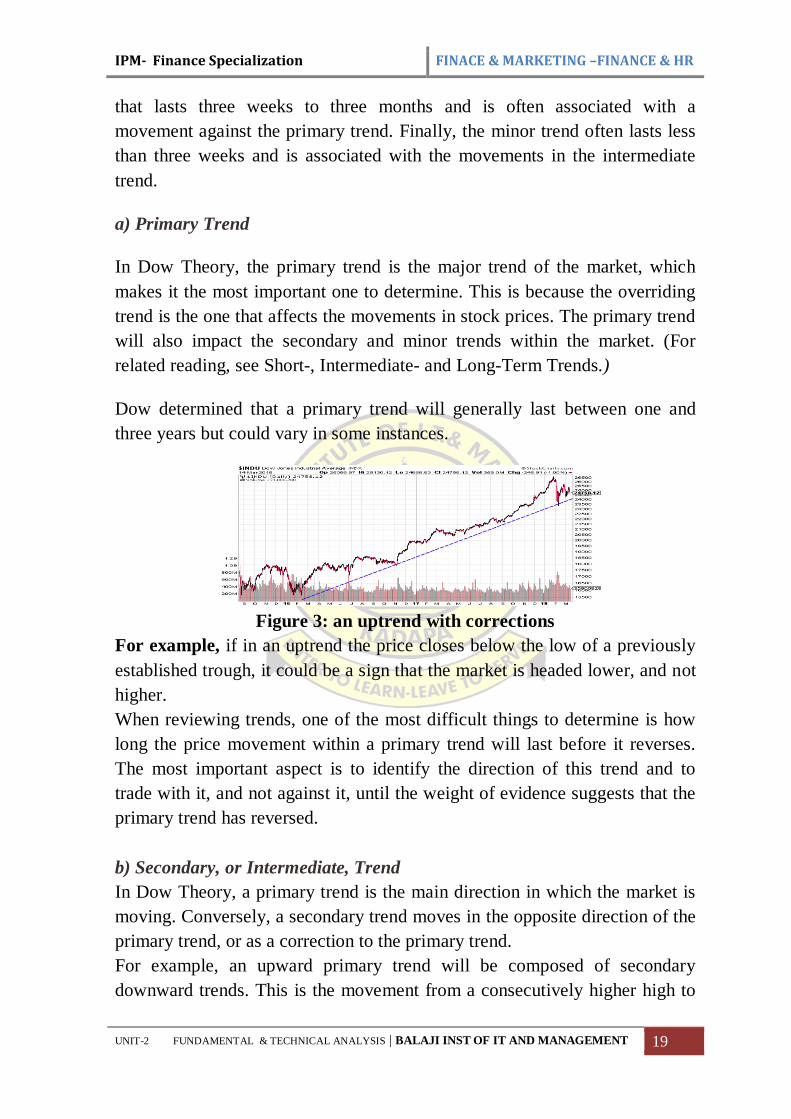
Dow determined that a primary trend will generally last between one and
three years but could vary in some instances.
Figure 3: an uptrend with corrections
For example, if in an uptrend the price closes below the low of a previously
established trough, it could be a sign that the market is headed lower, and not
higher.
When reviewing trends, one of the most difficult things to determine is how
long the price movement within a primary trend will last before it reverses.
The most important aspect is to identify the direction of this trend and to
trade with it, and not against it, until the weight of evidence suggests that the
primary trend has reversed.
b) Secondary, or Intermediate, Trend
In Dow Theory, a primary trend is the main direction in which the market is
moving. Conversely, a secondary trend moves in the opposite direction of the
primary trend, or as a correction to the primary trend.
For example, an upward primary trend will be composed of secondary
downward trends. This is the movement from a consecutively higher high to
IPM- Finance Specialization FINACE & MARKETING –FINANCE & HR
UNIT-2 FUNDAMENTAL & TECHNICAL ANALYSIS | BALAJI INST OF IT AND MANAGEMENT 20
a consecutively lower high. In a primary downward trend the secondary trend
will be an upward move, or a rally. This is the movement from a
consecutively lower low to a consecutively higher low.
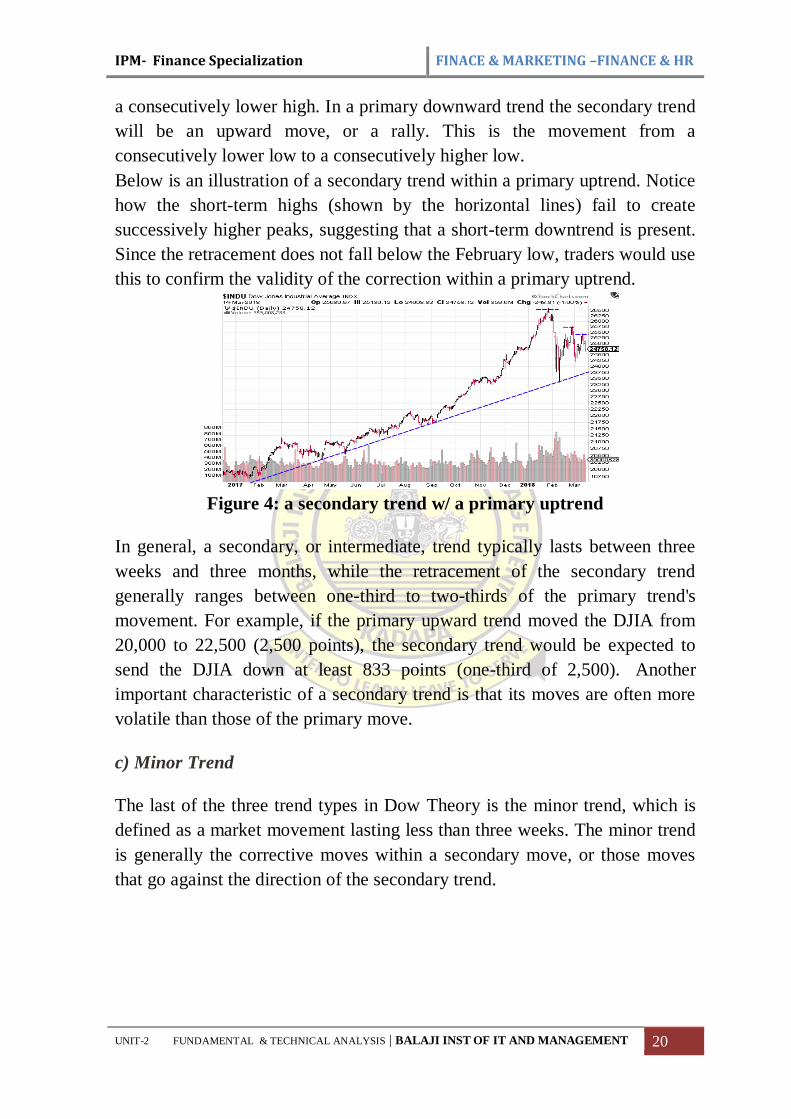
Below is an illustration of a secondary trend within a primary uptrend. Notice
how the short-term highs (shown by the horizontal lines) fail to create
successively higher peaks, suggesting that a short-term downtrend is present.
Since the retracement does not fall below the February low, traders would use
this to confirm the validity of the correction within a primary uptrend.
Figure 4: a secondary trend w/ a primary uptrend
In general, a secondary, or intermediate, trend typically lasts between three
weeks and three months, while the retracement of the secondary trend
generally ranges between one-third to two-thirds of the primary trend's
movement. For example, if the primary upward trend moved the DJIA from
20,000 to 22,500 (2,500 points), the secondary trend would be expected to
send the DJIA down at least 833 points (one-third of 2,500). Another
important characteristic of a secondary trend is that its moves are often more
volatile than those of the primary move.
c) Minor Trend
The last of the three trend types in Dow Theory is the minor trend, which is
defined as a market movement lasting less than three weeks. The minor trend
is generally the corrective moves within a secondary move, or those moves
that go against the direction of the secondary trend.
IPM- Finance Specialization FINACE & MARKETING –FINANCE & HR
UNIT-2 FUNDAMENTAL & TECHNICAL ANALYSIS | BALAJI INST OF IT AND MANAGEMENT 21
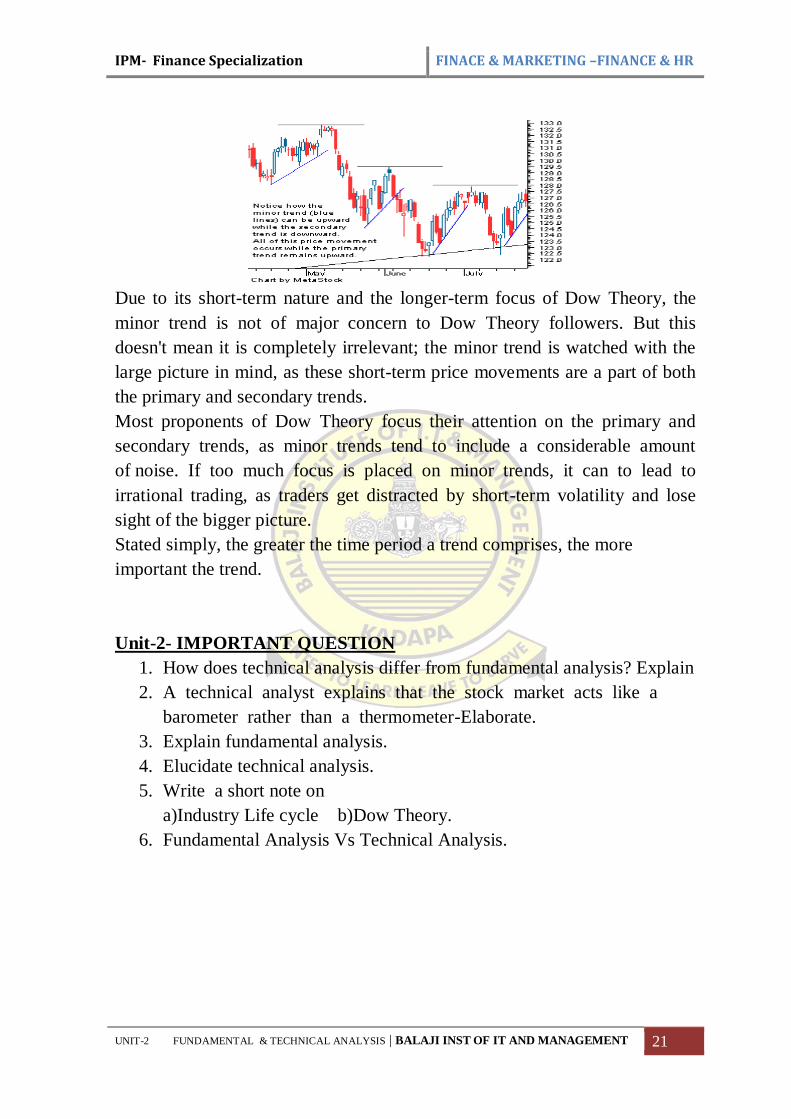
Due to its short-term nature and the longer-term focus of Dow Theory, the
minor trend is not of major concern to Dow Theory followers. But this
doesn't mean it is completely irrelevant; the minor trend is watched with the
large picture in mind, as these short-term price movements are a part of both
the primary and secondary trends.
Most proponents of Dow Theory focus their attention on the primary and
secondary trends, as minor trends tend to include a considerable amount
of noise. If too much focus is placed on minor trends, it can to lead to
irrational trading, as traders get distracted by short-term volatility and lose
sight of the bigger picture.
Stated simply, the greater the time period a trend comprises, the more
important the trend.
Unit-2- IMPORTANT QUESTION
1. How does technical analysis differ from fundamental analysis? Explain
2. A technical analyst explains that the stock market acts like a
barometer rather than a thermometer-Elaborate.
3. Explain fundamental analysis.
4. Elucidate technical analysis.
5. Write a short note on
a)Industry Life cycle b)Dow Theory.
6. Fundamental Analysis Vs Technical Analysis.
IPM- Finance Specialization FINACE & MARKETING –FINANCE & HR
UNIT-3 Measurement of Risk and Return | BALAJI INST OF IT AND MANAGEMENT 1
(17E00312) INVESTMENT AND PORTFOLIO MANAGEMENT
(Elective III)
Objective: The objective of the course is to provide students an understanding of working
of capital markets and management of portfolios of stocks. The pre-requisite for the course
is Financial Accounting and Analysis and Financial Management.
* Standard discounting and statistical tables to be allowed in the examinations.
1. Investment:Introduction to stock markets -objectives, Process of Investment,
Investment and speculation.
2. Fundamental Analysis & Technical Analysis: Framework of Fundamental
analysis-Economic analysis, Industry analysis-Industry Life cycle - Company
analysis, Fundamental Analysis Vs Technical Analysis - Dow Theory.
3. Measurement of Risk and Return: Revenue Return and Capital appreciation,
holding period –Calculation of expected return, Risk factors, risk classification –
systematic risk – unsystematic risk – standard deviation – variance– Beta .
4. Valuation of Securities: Types of Securities - Approaches of valuation – Bond
valuation – Preference share Valuation – Common stock Valuation.
5. Portfolio Management: Process of Portfolio Management, Modern Portfolio –
Portfolio models – Markowitz model – Sharpe single index model, Capital Asset
Pricing Models.
Text Books:
Investment Management,V.K.Balla, S.Chand Company Ltd
Security Analysis and Portfolio Management ,PunithavathyPandian, Vikas
References:
Investment Analysis and portfolio management, Chandra, Tata McGraw Hill .
Secuerity Analysis Portfolio Management, Ranganatham&Madhumathi, Pearson
Education.
Security Analysis and Portfolio Management, SudhindraBhat, excel.
Security analysis and portfolio management, Avadani, Himalaya publishers.
Investment analysis portfolio management, Frank Reilly & Brown, Cengage.
Investment Management, Preethi Singh, Himalaya Publishing House, Mumbai..
Investment, Bodie, McGraw Hill Book Company.
Investment Management ,Hiriyappa ,New Age Publications
IPM- Finance Specialization FINACE & MARKETING –FINANCE & HR
UNIT-3 Measurement of Risk and Return | BALAJI INST OF IT AND MANAGEMENT 2
UNIT-3
MEASUREMENT OF RISK AND RETURN
3.1 REVENUE RETURN-RETURN ON REVENUE
Revenue Return orReturn on revenue (ROR)is a measure of company
profitability that is calculated by dividing net income by revenue. A business
can increase ROR by increasing profit with a change in sales mix or by
cutting expenses. ROR also has an impact on a firm’s earnings per share
(EPS), and analysts use ROR to make investment decisions.
Return on revenue uses net income, which is calculated as revenues minus
expenses. The calculation includes both expenses paid in cash and non-cash
expenses, such as depreciation. The net income calculation includes all of the
business activities of the company, which includes day-to-day operations and
unusual items, such as the sale of a building. Revenue, on the other hand,
represents sales, and the balance is reduced by sales discounts and other
deductions, such as sales returns and allowances
Examples of Sales Mix
A company can improve its ROR by increasing its net income. Changing the
sales mix can increase net income. The sales mix is the proportion of each
product a business sells, relative to total sales. Each product sold may deliver
a different level of profit. Businesses measure the profit generated using
profit margin (net income/sales). By shifting company sales to products that
provide a higher profit margin, a business can increase net income and
improve ROR.
Assume, for example, that a sporting goods store sells an $80 baseball glove
that generates a $16 profit and a $200 baseball bat that produces a $20 profit.
While the bat generates more revenue, the glove produces a 20% profit ($16 /
$80), and the bat only earns a 10% profit ($20 / $200). By shifting the store's
sales and marketing effort to baseball gloves, the business can earn more net
income per dollar of sales, which increases ROR.
IPM- Finance Specialization FINACE & MARKETING –FINANCE & HR
UNIT-3 Measurement of Risk and Return | BALAJI INST OF IT AND MANAGEMENT 3
3.2 CAPITAL APPRECIATION
Capital appreciation is a rise in the value of an asset based on a rise in market
price. It occurs when the asset invested commands a higher price in the
market than an investor originally paid for the asset. The capital appreciation
portion of the investment includes all of the market value exceeding the
original investment or cost basis.
Capital appreciation is an increase in the price or value of assets. It may refer
to appreciation of company stocks or bonds held by an investor, an increase
in land valuation, or other upward revaluation of fixed assets.
Capital appreciation may occur passively and gradually, without the investor
taking any action. It is distinguished from a capital gain which is the profit
achieved by selling an asset. Capital appreciation may or may not be shown
in financial statements; if it is shown, by revaluation of the asset, the increase
is said to be "recognized". Once the asset is sold, the appreciation since the
date of initially buying the asset becomes a "realized" gain.
When the term is used in reference to stock valuation, capital appreciation is
the goal of an investor seeking long term growth. It is growth in the principal
amount invested, but not necessarily an increase in the current income from
the asset.
In the context of investment in a mutual fund, capital appreciation refers to a
rise in the value of the securities in a portfolio which contributes to the
growth in net asset value. A capital appreciation fund is a fund for which it is
its primary goal, and accordingly invests in growth stocks
Capital appreciation is one of the two main sources of investment returns,
with the others being dividend or interest income. The combination of capital
appreciation with dividend or interest returns is referred to as total return.
Capital appreciation can occur for many different reasons in different markets
and asset classes. It can also occur with financial assets such as stocks or with
real assets such as real estate.
IPM- Finance Specialization FINACE & MARKETING –FINANCE & HR
UNIT-3 Measurement of Risk and Return | BALAJI INST OF IT AND MANAGEMENT 4
Example of Capital Appreciation
An investor purchases a stock for $10 and the stock pays an annual dividend
of $1, equating to a dividend yield of 10%. A year later, the stock is trading at
$15 per share and the investor has received the dividend of $1. The investor
has a return of $5 from capital appreciation as the price of the stock went
from the purchase price or cost basis of $10 to a current market value of $15;
in percentage terms, the stock price increase led to a return from capital
appreciation of 50%. The dividend income return is $1, equating to a return
of 10% in line with the original dividend yield. The return from capital
appreciation combined with the return from the dividend leads to a total
return on the stock of $6 or 60%.
3.2.1 CAUSES OF CAPITAL APPRECIATION
The value of assets can increase for several reasons. There can be a general
trend for asset values to increase including macroeconomics factors such as
strong GDP growth or Federal Reserve policy such as lowering interest rates.
On a more granular level, a stock price can increase because the underlying
company is growing faster than analysts expect, or the value of a house can
increase because of proximity to new developments such as schools or
shopping centres.
3.3 HOLDING PERIOD
A holding period is the amount of time the investment is held by an investor
or the period between the purchase and sale of a security. In a long position,
the holding period refers to the time between an asset's purchase and its sale.
In a short options position, the holding period is the time between when a
short seller buys back the securities and when the security is delivered to the
lender to close the short position.
The holding period of an investment is used to determine the taxing of capital
gains or losses. A long-term holding period is one year or more with no
expiration. Any investments that have a holding of less than one year will be
short-term holds. The payment of dividends into an account will also have a
holding period.
IPM- Finance Specialization FINACE & MARKETING –FINANCE & HR
UNIT-3 Measurement of Risk and Return | BALAJI INST OF IT AND MANAGEMENT 5
3.3.1 CALCULATING A HOLDING PERIOD
Starting on the day after the security's acquisition and continuing until the
day of its disposal or sale, the holding period determines tax implications. For
example, Sarah bought 100 shares of stock on Jan. 2, 2016. When
determining her holding period, she begins counting on Jan. 3, 2016. The
third day of each month after those counts as the start of a new month,
regardless of how many days each month contains.
If Sarah sold her stock on December 23, 2016, she would realize a short-term
capital gain or capital loss because her holding period is less than one year. If
she sells her stock on Jan. 3, 2017, she would realize a long-term capital gain
or loss because her holding period is more than one year.
3.3.2 DIFFERENT RULES DEFINING HOLDING PERIODS
When receiving a gift of appreciated stock or other security, the
determination of the recipient’s cost basis is by using the donor’s basis. Also,
the recipient’s holding period includes the length of the donor’s holding
period. This continuation of holding is called “tacking on” because the
recipient’s holding period adds value to the donor’s holding period. In cases
where the recipient’s basis is determined by the fair market value of the
security, such as a gift of stock that decreased in value, the recipient’s
holding period starts on the day after receiving the gift.
When an investor receives a stock dividend, the holding period for the new
shares, or portions of a new share, is the same as for the old shares. Meeting
the minimum holding period is the primary requirement for dividends to be
designated as qualified. For common stock, the holding must exceed 60 days
throughout the 120-day period, which begins 60 days before the ex-dividend
date. Preferred stock must have a holding period of at least 90 days during the
180-day period that begins 90 days before the stock's ex-dividend date.
Holding also applies when receiving new stock in a company spun off from
the original company in which the investor purchased stock. For example,
Paul purchased 100 shares of stock in April 2015. In June 2016, the company
declared a two-for-one stock split. Paul then had 200 shares of company
stock with the same holding period, starting with the date of purchase in April
2015.
IPM- Finance Specialization FINACE & MARKETING –FINANCE & HR
UNIT-3 Measurement of Risk and Return | BALAJI INST OF IT AND MANAGEMENT 6
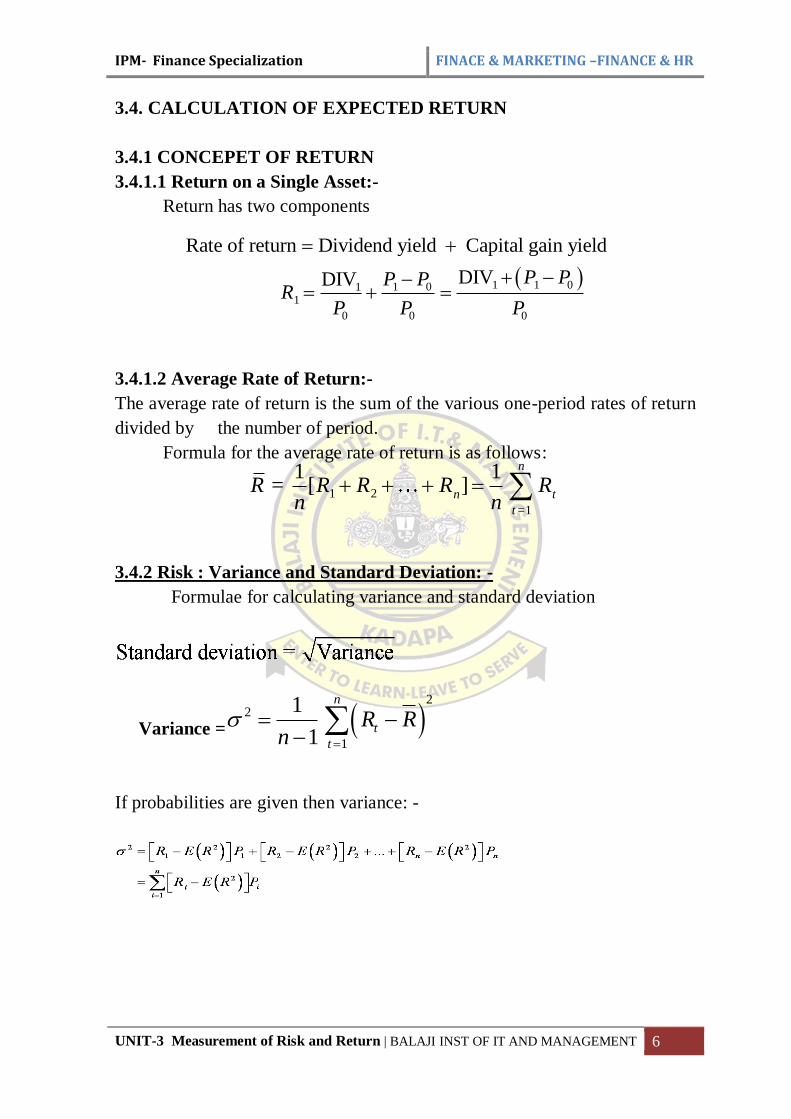
3.4. CALCULATION OF EXPECTED RETURN
3.4.1 CONCEPET OF RETURN
3.4.1.1 Return on a Single Asset:-
Return has two components
3.4.1.2 Average Rate of Return:-
The average rate of return is the sum of the various one-period rates of return
divided by the number of period.
Formula for the average rate of return is as follows:
3.4.2 Risk : Variance and Standard Deviation: -
Formulae for calculating variance and standard deviation
Variance =
If probabilities are given then variance: -
1 1 01 011
0 0 0
Rate of return Dividend yield Capital gain yield
DIVDIV
P PP PR
P P P
1 2
=1
1 1 = [ ]
n
n t
t
R R R R Rn n
2
2
1
1
1
n
t
t
R Rn
IPM- Finance Specialization FINACE & MARKETING –FINANCE & HR
UNIT-3 Measurement of Risk and Return | BALAJI INST OF IT AND MANAGEMENT 7
3.5. RISK FACTORS A. Business Risk: - The risk of doing business in a particular industry or
environment is called business risk.
# Fluctuations in operating income
# Arise due to external & internal business factors
B. Financial Risk: -
# associated with the capital structure of the firm
# Variability of the income to the equity
A. BUSINESS RISK
Business risk is that portion of the unsystematic risk caused by the operating environment
of the business. Business risk arises from the inability of a firm to maintain its competitive
edge and the growth or stability of the earnings. Variation that occurs in the operating
environment is reflected on the operating income and expected dividends. The variation in
the expected operating income indicates the business risk.
For example take Anu and Vinu companies. In Anu company, operating income could
grow as much as 15 per cent and as low as 7 per cent. In Vinu Company, the operating
income can be either 12 per cent or 9 per cent. When both the companies are compared,
Anu company's business risk is higher because of its high variability in operating income
compared to Vinu company. Thus, business risk is concerned with the difference between
revenue and earnings before interest and tax. Business risk can be divided into external
business is and internal business risk.
a)Internal Business Risk
Internal business risk is associated with the operational efficiency of the firm. The
operational efficiency differs from company to company. The efficiency of operation is
reflected on the company's achievement of its pre-set goals: and the fulfillment of the
promises to its inventors.
(1) Fluctuations in the sales the sales level has to be maintained. It is common in
business to lose customers abruptly because of -competition. Loss of customers will
lead to a loss in operational income. Hence, the company has to build a wide
customer base through various distribution channels. Diversified sales force may help
to tide over this problem.
(2)Research and development (R&D) Sometimes the product may go out of style or
become obsolescent. It is the management, who has to overcome the problem of obsolescence
by concentrating on the in-house research and development program.
For example, if Maruti Udyog has to survive the competition, it has to keep its Research
and Development section active and introduce consumer oriented technological changes in
the automobile sector. This is often carried out by introducing sleekness, seating comfort
and break efficiency in their automobiles. New products have to be produced to replace the
IPM- Finance Specialization FINACE & MARKETING –FINANCE & HR
UNIT-3 Measurement of Risk and Return | BALAJI INST OF IT AND MANAGEMENT 8
old one. Short sighted cutting of R and D budget would reduce the operational efficiency
of any firm.
(3) Personnel management The personnel management of the company also contributes to
the operational efficiency of the firm. Frequent strikes and lock outs result in loss of
production and high fixed capital cost. The labour productivity also would suffer. The risk
of labour management is present in all the firms.
(4) Fixed cost The cost components also generate internal risk if the fixed cost is higher in
the cost component. During the period of recession or low demand for product, the company
cannot reduce the fixed cost. At the same time in the boom period also the fixed factor
cannot vary immediately. Thus, the high fixed cost component in a firm would become a
burden to the firm.
(5) Single product The internal business risk is higher in the case of firm producing a single
product. The fall in the demand for a single product would be fatal for the firm. Further,
some products are more vulnerable to the business cycle while sonic products resist and
grow against the tide. Hence, the company has to diversify the products if it has to face the
competition and the business cycle successfully. Take for instance, Hindustan Lever Ltd.,
which is producing a wide range of consumer cosmetics is thriving successfully in the
business. Even in diversification, diversifying the product in the unknown path of the
company may lead to an internal risk. Unwieldy diversification is as dangerous as
producing a single good.
B) EXTERNAL RISK
External risk is the result of operating conditions imposed on the firm by circumstances beyond
its control. The external environments in which it operates exert some pressure on the firm. The
external factors are social and regulatory factors, monetary and fiscal policies of the government,
business cycle and the general economic environment within which a firm or an industry
operates. A government policy that favors a particular industry could result in the rise in the
stock price of the particular industry. For instance, the Indian sugar and fertilizer industry
depend much on external factors.
1. Social and regulatory factors Harsh regulatory climate and legislation against the
environmental degradation may impair the profitability of the industry. Price control,
volume control, import/export control and environment control reduce the profitability of the
firm. This risk is more in industries related to public utility sectors such as telecom,
banking and transportation.
2. Political risk Political risk arises out of the change in the government policy. With a
change in the ruling party, the policy also changes. When Sri. Manmohan Singh was the
finance minister, liberalization policy was introduced. During the Bharathiya Janata
government, even though efforts are taken to augment the foreign investment, more stress is
given to Swdeshi. Political risk arises mainly in the case of foreign investment.
3. Business cycle: The fluctuations of the business cycle lead to fluctuations in the
earnings of the company. Recession in the economy leads to a drop in the output of many
IPM- Finance Specialization FINACE & MARKETING –FINANCE & HR
UNIT-3 Measurement of Risk and Return | BALAJI INST OF IT AND MANAGEMENT 9
industries. Steel and white consumer goods industries tend to move in tandem with the
business cycle. During the boom period, there would be hectic demand for steel products and
white consumer goods. But at the same time, they would be hit much during the recession
period. At present, the information technology industry has resisted the business cycle and
moved counter cyclically during the recession period. The effects of the business cycle
vary from one company to another. Sometimes, companies with inadequate capital and
consumer base may be forced to close down. In some other case, there may be a fail in the
profit and the growth rate may decline. This risk factor is external to the corporate bodies
and they may not be able to control it.
B.FINANCIAL RISK It refers to the variability of the income to the equity capital due to the debt capital. Financial
risk in a company is associated with the capital structure of the company. Capital structure of the
company consists of equity funds and borrowed funds. The presence of debt and preference
capital results in a commitment of
paying interest or pre fixed rate of dividend. The residual income alone would be available to
the equity holders. The interest payment affects the payments that are due to the equity
investors. The debt financing increases the variability of the returns to the common stock holders
and affects their expectations regarding the return. The use of debt with the owned funds to
increase the return to the shareholders is known as financial leverage.
Debt financing enables the corporate to have funds at a low cost and financial leverage to the
shareholders. As long as the earnings of a company are higher than the cost of borrowed funds,
shareholders' earnings are increased. At the same time when the earnings are low, it may lead to
bankruptcy to equity holders.
3.6. RISK CLASSIFICATION (OR) TYPES OF RISK The investment risk is categorized into two. They are
Total Risk= Systematic+ Unsystematic
Total Risk= Market Risk+ specific Risk
Total Risk= Uncontrollable + Controllable
Total Risk= External Risk + Internal Risk
3.6.1 SYSTEMATIC RISK: Systematic risk arises on account of the economy-wide
uncertainties and the tendency of individual securities to move together with changes in
IPM- Finance Specialization FINACE & MARKETING –FINANCE & HR
UNIT-3 Measurement of Risk and Return | BALAJI INST OF IT AND MANAGEMENT 10
the market. This part of risk cannot be reduced through diversification. It is also known as
market risk.
3.6.1.1 Types of Systematic Risk
1) Market Risk: The variability in a security’s returns resulting from fluctuations in
the aggregate market is known as market risk. All securities are exposed to market
risk including recessions, wars, structural changes in the economy, tax law changes
and even changes in consumer preferences. Market risk is sometimes
synonymously with systematic risk.
2) Interest Rate Risk: The variability in a security’s returns resulting from changes
in the level of interest rates is referred to as interest rate risk. Such changes
generally affect securities inversely; i.e., other things being equal, security prices
move inversely to interest rates. The reason for this movement is tied up with the
valuation of securities. Interest rate risk affects bonds more directly than common
stocks and is a major risk that all bondholders face. As interest rates change, bond
prices change in the opposite direction.
3) Purchasing Power Risk: A factor affecting all securities is purchasing power risk,
also known as inflation risk. This is the possibility that the purchasing power of
invested dollars will decline. With uncertain inflation, the real (inflation - adjusted)
return involves risk even if the nominal return is safe (e.g., a treasury bond). This
risk is related to interest rate risk, since interest rates generally rise as inflation
increases, because lenders demand additional inflation premiums to compensate
for the loss of purchasing power.
4) Regulation Risk: Some investments can be relatively attractive to other
investments because of certain regulations o tax laws that give them an advantage
of some of kind. Municipal bonds, for example, pay interest that is exempt from
local, state and federal taxation. As a result of that special tax exemption,
municipals can price bonds to yield a lower interest rate since the net after – tax
yield may still make them attractive to investors.
a. The risk of regulatory change that adversely affect the structure of an
investment is a real danger.
5) Bull - Bear Market Risk: This risk arises from the variability in the market
returns resulting from alternating bull and bear market forces. When security index
rises fairly consistently from a low point, called a trough, over a period of time,
this upward trend is called a bull market. The bull market ends when the market
index reaches a peak and starts a down ward trend. The period during which the
market declines to the next trough is called a bear market.
6) International Risk: It includes the following risks.
Exchange Rate Risk: all investors who invest internationally in today’s
increasingly global investment arena face the prospect of uncertainty in the
returns after they convert the foreign gains back to their own currency,un
like the past, when most US investors ignored international investing
IPM- Finance Specialization FINACE & MARKETING –FINANCE & HR
UNIT-3 Measurement of Risk and Return | BALAJI INST OF IT AND MANAGEMENT 11
alternatives, invertors today must recognize and understand exchange rate
risk, which can be defined as the variability in returns on securities caused
by currency fluctuations exchange rate risk is sometimes called currency
risk.
Country Risk: Country risk, also referred to as political risk. It arises from
the exploitation of a politically weak group for the benefit of politically
strong group. Now a day’s the FDI’s are becomes very famous because of
globalization.
Liquidity Risk: it is associated with the particular secondary market in
which a security trade. An investment can be bought or sold quickly and
without and without significant price concession is considered liquid. The
more uncertainty about the time element and the price concession, the
greater the liquidity risks. A Treasury bill has little or no liquidity risk,
where as a small OTC stock may have substantial liquidity risk.
3.6.1.1.1 FACTORS WHICH INFLUENCE SYSTEMATIC RISK:
Government Policies
Inflation
Interest Rates
Foreign Exchange Fluctuations
Political changes
Economic Conditions
3.6.2. UN – SYSTEMATIC RISK: Unsystematic risk arises from the unique
uncertainties of individual securities. It is also called unique risk. Unsystematic risk can be
totally reduced through diversification.
As already mentioned, unsystematic risk is unique and peculiar to a firm or an industry.
Unsystematic risk stems from managerial inefficiency, technological change in the
production process, availability of raw material, changes in the consumer preference,
end labour problems. The nature and magnitude of the above mentioned factors differ
from industry to industry, and company to company. They have to be analyzed
separately for each industry and firm. The changes in the consumer preference affect the
consumer products like television sets, washing. Machines, refrigerators, etc. more than
they affect the iron and steel industry. Technological changes affect the information
technology industry more than that of consumer product industry. Thus, it differs from
industry to industry. Financial leverage of the companies that is debt-equity portion of the
companies differs from each other. The nature and mode of raising finance and paying
back the loans, involve a risk element. All these factors form the unsystematic risk and
contribute a portion in the total variability of the return. Broadly, unsystematic risk can
be classified into:
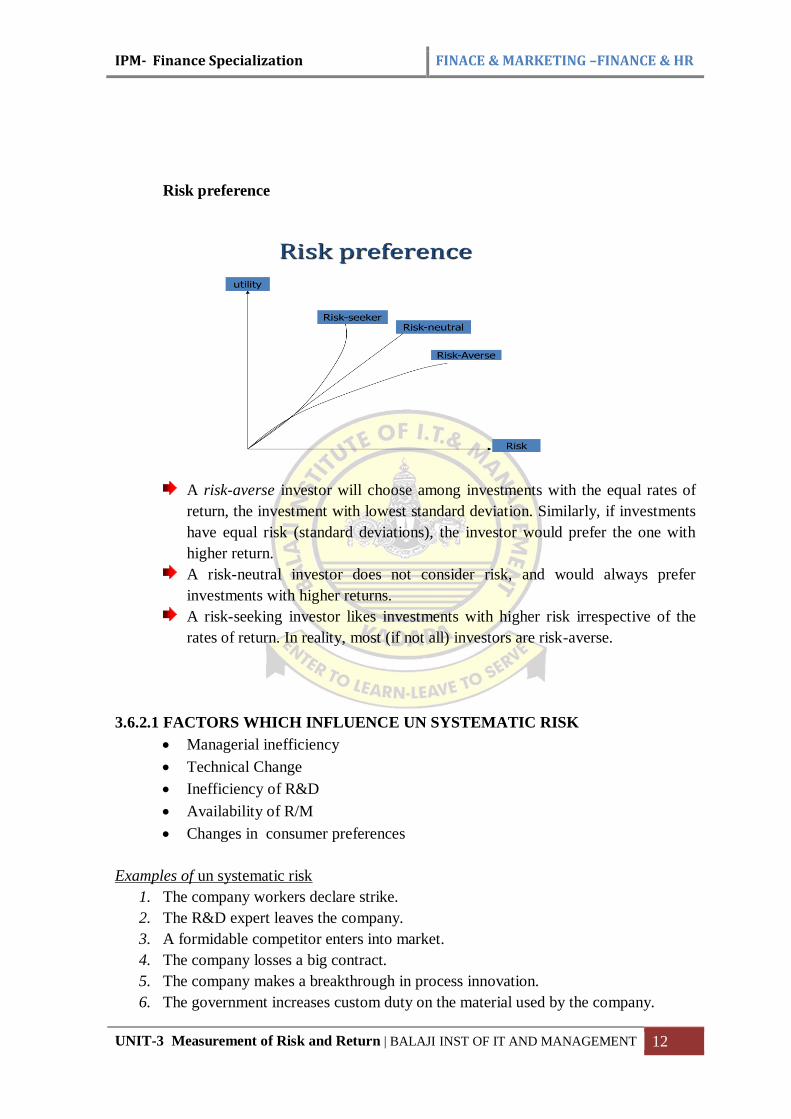
IPM- Finance Specialization FINACE & MARKETING –FINANCE & HR
UNIT-3 Measurement of Risk and Return | BALAJI INST OF IT AND MANAGEMENT 12
Risk preference
A risk-averse investor will choose among investments with the equal rates of
return, the investment with lowest standard deviation. Similarly, if investments
have equal risk (standard deviations), the investor would prefer the one with
higher return.
A risk-neutral investor does not consider risk, and would always prefer
investments with higher returns.
A risk-seeking investor likes investments with higher risk irrespective of the
rates of return. In reality, most (if not all) investors are risk-averse.
3.6.2.1 FACTORS WHICH INFLUENCE UN SYSTEMATIC RISK
Managerial inefficiency
Technical Change
Inefficiency of R&D
Availability of R/M
Changes in consumer preferences
Examples of un systematic risk
1. The company workers declare strike.
2. The R&D expert leaves the company.
3. A formidable competitor enters into market.
4. The company losses a big contract.
5. The company makes a breakthrough in process innovation.
6. The government increases custom duty on the material used by the company.
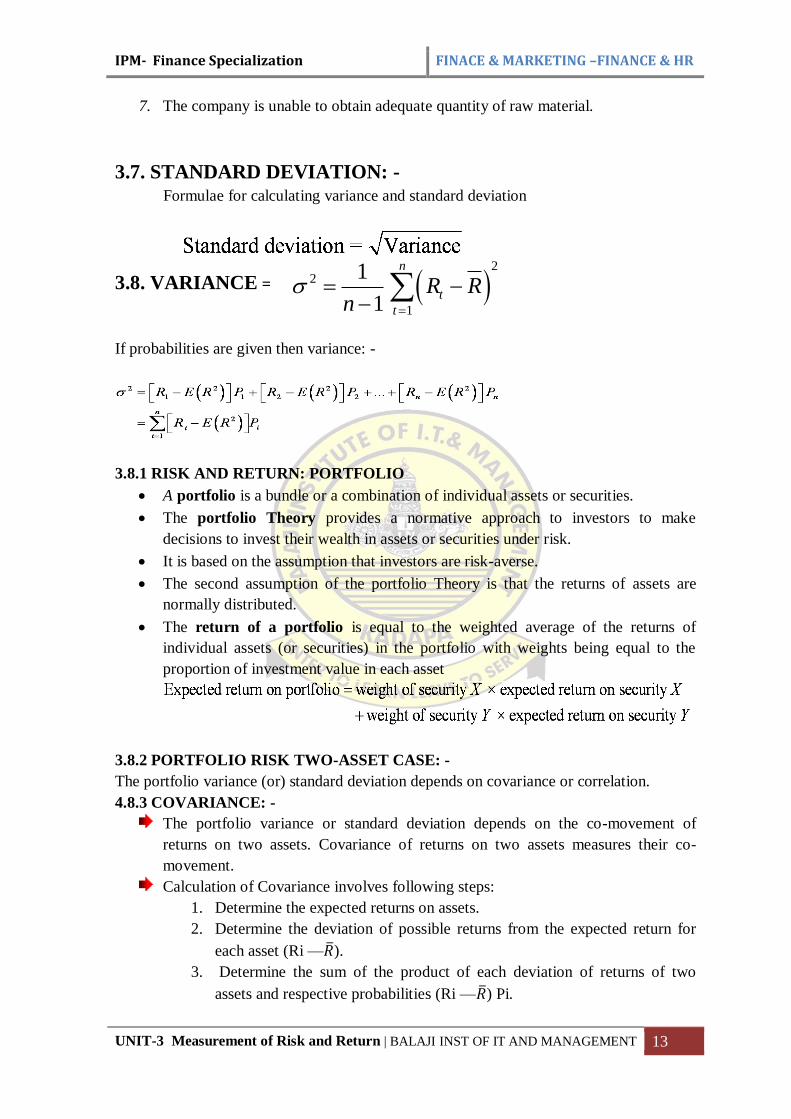
IPM- Finance Specialization FINACE & MARKETING –FINANCE & HR
UNIT-3 Measurement of Risk and Return | BALAJI INST OF IT AND MANAGEMENT 13
7. The company is unable to obtain adequate quantity of raw material.
3.7. STANDARD DEVIATION: - Formulae for calculating variance and standard deviation
3.8. VARIANCE =
If probabilities are given then variance: -
3.8.1 RISK AND RETURN: PORTFOLIO
A portfolio is a bundle or a combination of individual assets or securities.
The portfolio Theory provides a normative approach to investors to make
decisions to invest their wealth in assets or securities under risk.
It is based on the assumption that investors are risk-averse.
The second assumption of the portfolio Theory is that the returns of assets are
normally distributed.
The return of a portfolio is equal to the weighted average of the returns of
individual assets (or securities) in the portfolio with weights being equal to the
proportion of investment value in each asset
3.8.2 PORTFOLIO RISK TWO-ASSET CASE: -
The portfolio variance (or) standard deviation depends on covariance or correlation.
4.8.3 COVARIANCE: -
The portfolio variance or standard deviation depends on the co-movement of
returns on two assets. Covariance of returns on two assets measures their co-
movement.
Calculation of Covariance involves following steps:
1. Determine the expected returns on assets.
2. Determine the deviation of possible returns from the expected return for
each asset (Ri —�̅�).
3. Determine the sum of the product of each deviation of returns of two
assets and respective probabilities (Ri —�̅�) Pi.
2
2
1
1
1
n
t
t
R Rn
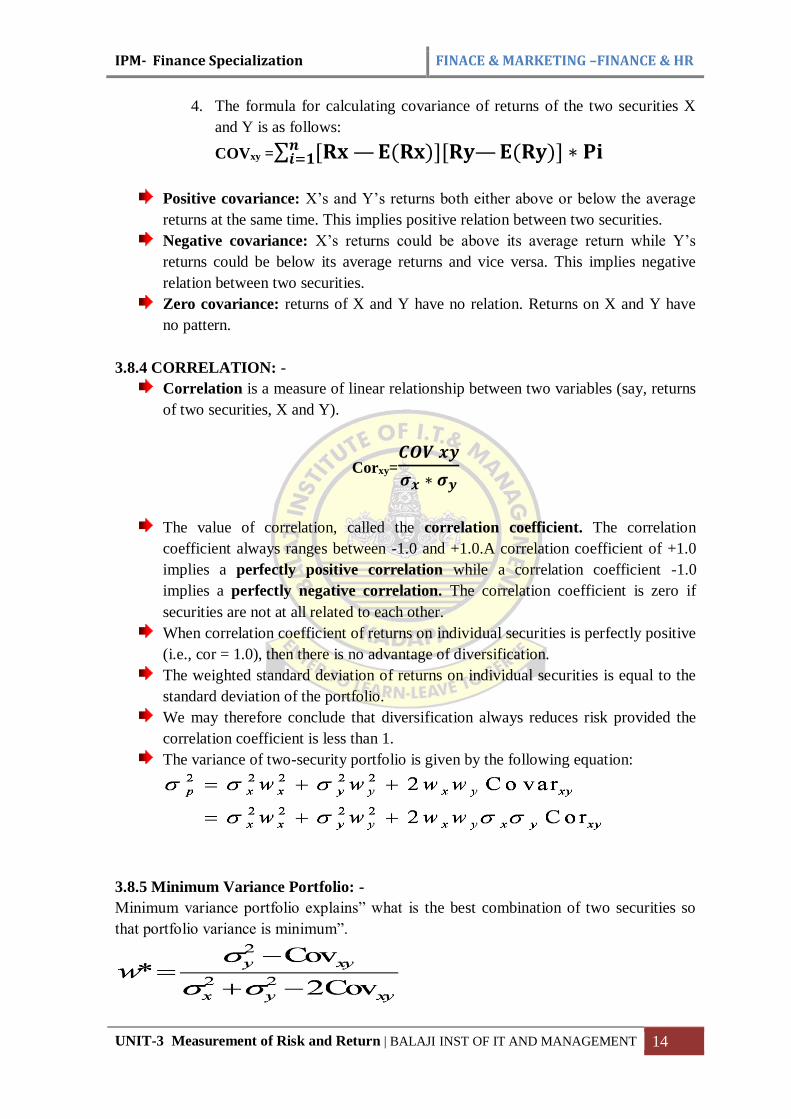
IPM- Finance Specialization FINACE & MARKETING –FINANCE & HR
UNIT-3 Measurement of Risk and Return | BALAJI INST OF IT AND MANAGEMENT 14
4. The formula for calculating covariance of returns of the two securities X
and Y is as follows:
COVxy =∑ [𝐑𝐱 — 𝐄(𝐑𝐱)][𝐑𝐲— 𝐄(𝐑𝐲)] ∗ 𝐏𝐢𝒏𝒊=𝟏
Positive covariance: X’s and Y’s returns both either above or below the average
returns at the same time. This implies positive relation between two securities.
Negative covariance: X’s returns could be above its average return while Y’s
returns could be below its average returns and vice versa. This implies negative
relation between two securities.
Zero covariance: returns of X and Y have no relation. Returns on X and Y have
no pattern.
3.8.4 CORRELATION: -
Correlation is a measure of linear relationship between two variables (say, returns
of two securities, X and Y).
Corxy=𝑪𝑶𝑽 𝒙𝒚
𝝈𝒙 ∗ 𝝈𝒚
The value of correlation, called the correlation coefficient. The correlation
coefficient always ranges between -1.0 and +1.0.A correlation coefficient of +1.0
implies a perfectly positive correlation while a correlation coefficient -1.0
implies a perfectly negative correlation. The correlation coefficient is zero if
securities are not at all related to each other.
When correlation coefficient of returns on individual securities is perfectly positive
(i.e., cor = 1.0), then there is no advantage of diversification.
The weighted standard deviation of returns on individual securities is equal to the
standard deviation of the portfolio.
We may therefore conclude that diversification always reduces risk provided the
correlation coefficient is less than 1.
The variance of two-security portfolio is given by the following equation:
3.8.5 Minimum Variance Portfolio: -
Minimum variance portfolio explains” what is the best combination of two securities so
that portfolio variance is minimum”.
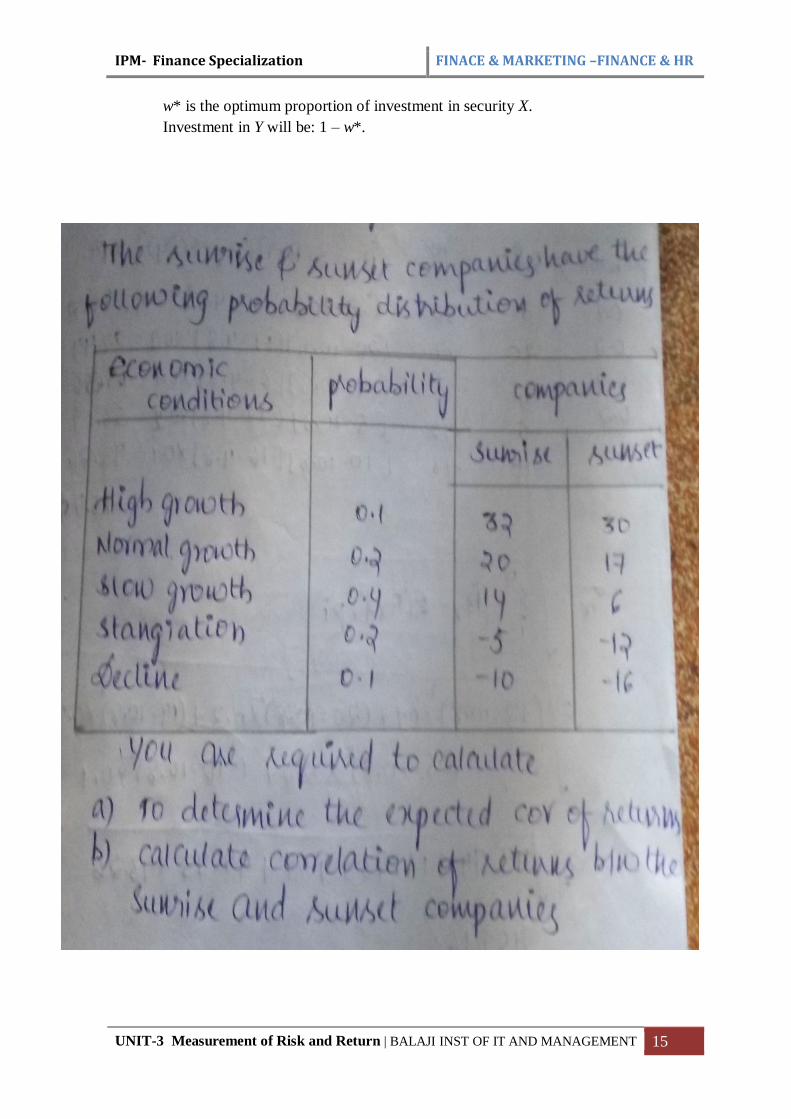
IPM- Finance Specialization FINACE & MARKETING –FINANCE & HR
UNIT-3 Measurement of Risk and Return | BALAJI INST OF IT AND MANAGEMENT 15
w* is the optimum proportion of investment in security X.
Investment in Y will be: 1 – w*.
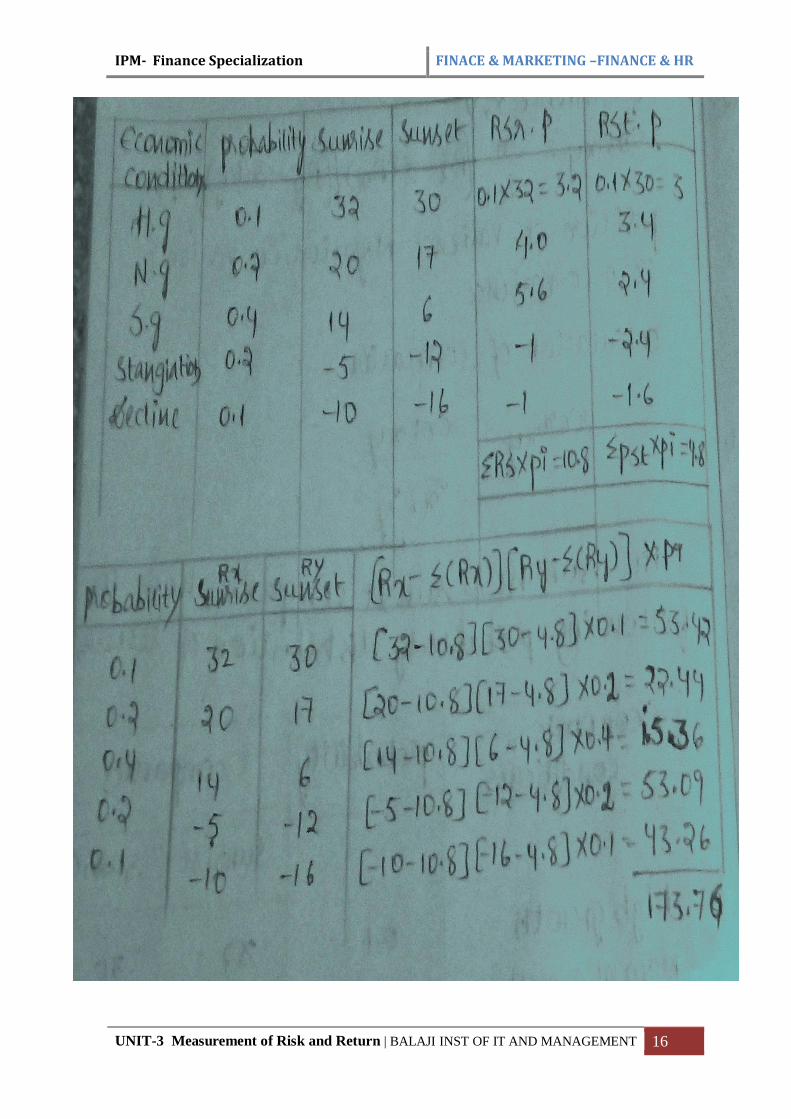
IPM- Finance Specialization FINACE & MARKETING –FINANCE & HR
UNIT-3 Measurement of Risk and Return | BALAJI INST OF IT AND MANAGEMENT 16

IPM- Finance Specialization FINACE & MARKETING –FINANCE & HR
UNIT-3 Measurement of Risk and Return | BALAJI INST OF IT AND MANAGEMENT 17

IPM- Finance Specialization FINACE & MARKETING –FINANCE & HR
UNIT-3 Measurement of Risk and Return | BALAJI INST OF IT AND MANAGEMENT 18

IPM- Finance Specialization FINACE & MARKETING –FINANCE & HR
UNIT-3 Measurement of Risk and Return | BALAJI INST OF IT AND MANAGEMENT 19
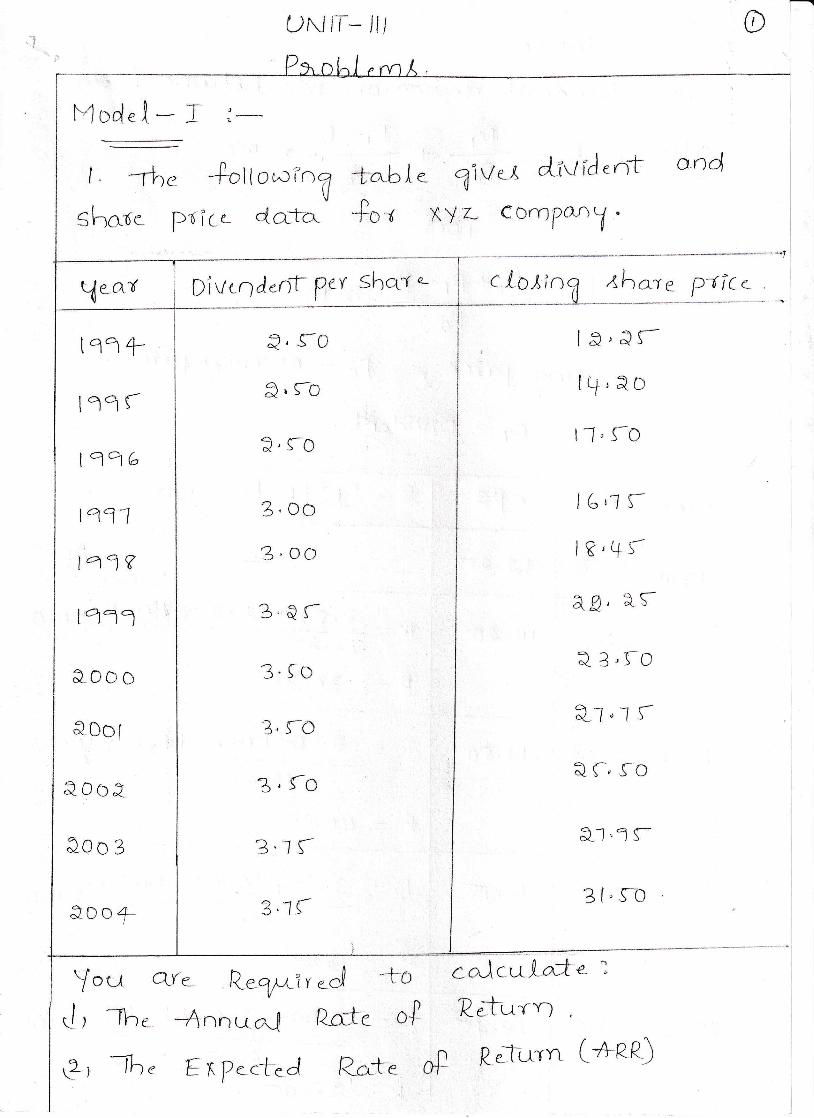
trN tT- lt/
l'1 od..[ -_--
| " rtu -Potl ouc ?oqU
Share pdice da-fa.
qive,t d;uiJ 'rrtXY L Corn P^,1 .
tl--
andrfa"b I e
4o=r
You Q(e- Jt.7,tiy e-A
J, -The *4nnut-o,{ Ro*e
Pr *h" FnPectd R-efe
t.l-o,kio dhar e p-tf c <
I &,artq,aD
IJ,TO
I6,'7 5-
Itr,+S-
ag, er
a 3,rO
Q-l ,rr
Qr,s_0
al '1r
3l,ro
-fo cal c*Lo;te :Patrrn
R.--t-urn (,l-R"R.)
DivLQ d."rf V,ev she-Y'
Q, s-0
a, ro
?, fo
3. o0
3"oo
3.& r
3.fo
3" ro
?. fo
?.-7 r
3"1r
lalrt19 r
l77C
tq11
l'q7 3
l'qa1
aooo
aoOl
aooe
fl"Oo3
&D0 +-
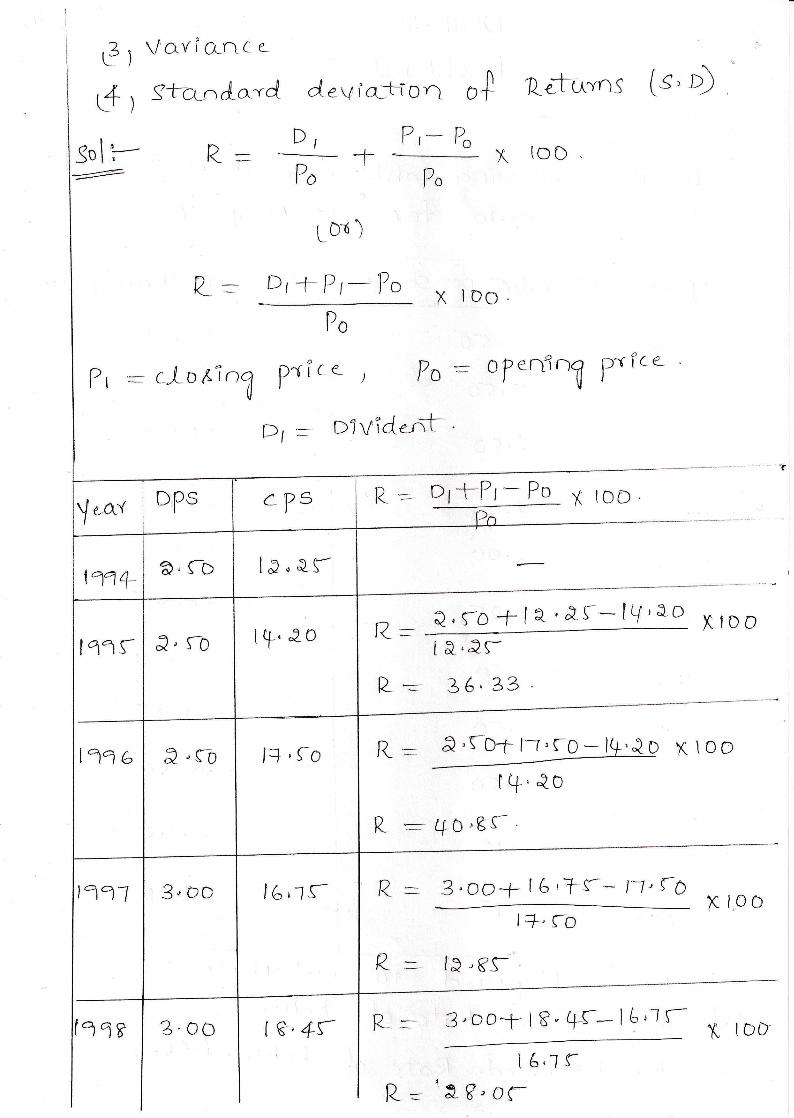
trtal
sol-':=-?
Vaviornc.
Stq-n d-ard- d.v ia-.tton u.N
R- Dr *F -7r*?o xPo Po
Latuvns [.' ,)
{oo
LDl )
L = Dr-f-?r-Pa X loo-Po
?r - c)-ofin1 P^rice )po : opeffnn pxflca
D1 : DiV?d€rTf "
c7s ost-Pt - Po x rDD.
Q.s-o+la-',?f-lq'aoI a,ar
3 6. 33
R _ &,FDtl-r'rD-lg""tDlq-,40
R- : Q0,gf
'?la1 R:- 3.aO+ [6,](-* /f ,{6r+,ro
R- :- l& ,8-f-'
3,o0*r18"+r-l6',lr-- tI 6,-7 r
R= tef,0(-
rz*
L--
K l0o
K l.oo
Iq-.eo&, rolq")r
la1 b ll ,fo&,c-o
16,-lS-3. Do
?7s 3.oo I e,4r IDD
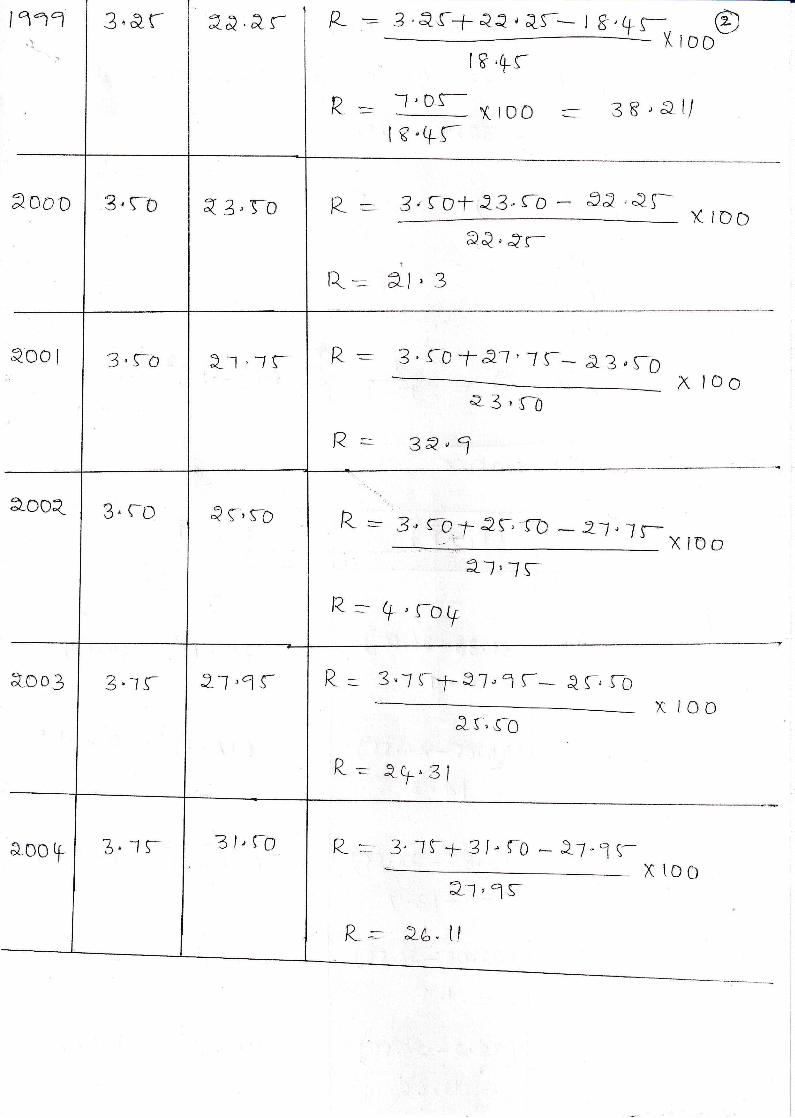
lala')
3"&. r 2& .&. r B_: str,_^@I iDD
[tr,Fr
R: ]'o's-KtDO = 38,e1/I 8"+r
2ooo 3,F-o { 3, 3-o R = 3'5-ot-"2-3'Co.- 5i''2f-- XIoD
aQ.Jr?
R-- 7l'3
aoo I 3.S--o 2-r,f r R: x loo93,r0
R = 3p,?
aooa 3, f-D Q r,sD R, =. 3" f-O.t 2S-,"1D - 2l , f, f.- X ID o
el,lrI'rog
&-oo3
aoo I
3"rr ul,3r R :]:f er.1 r- &r, rD
R:aq,=,:
xtoo
R= 3.tS-J-31'f0*)l-1rZl " 1s-
[,- )6.tl
3.*1 r 3 l, l--6
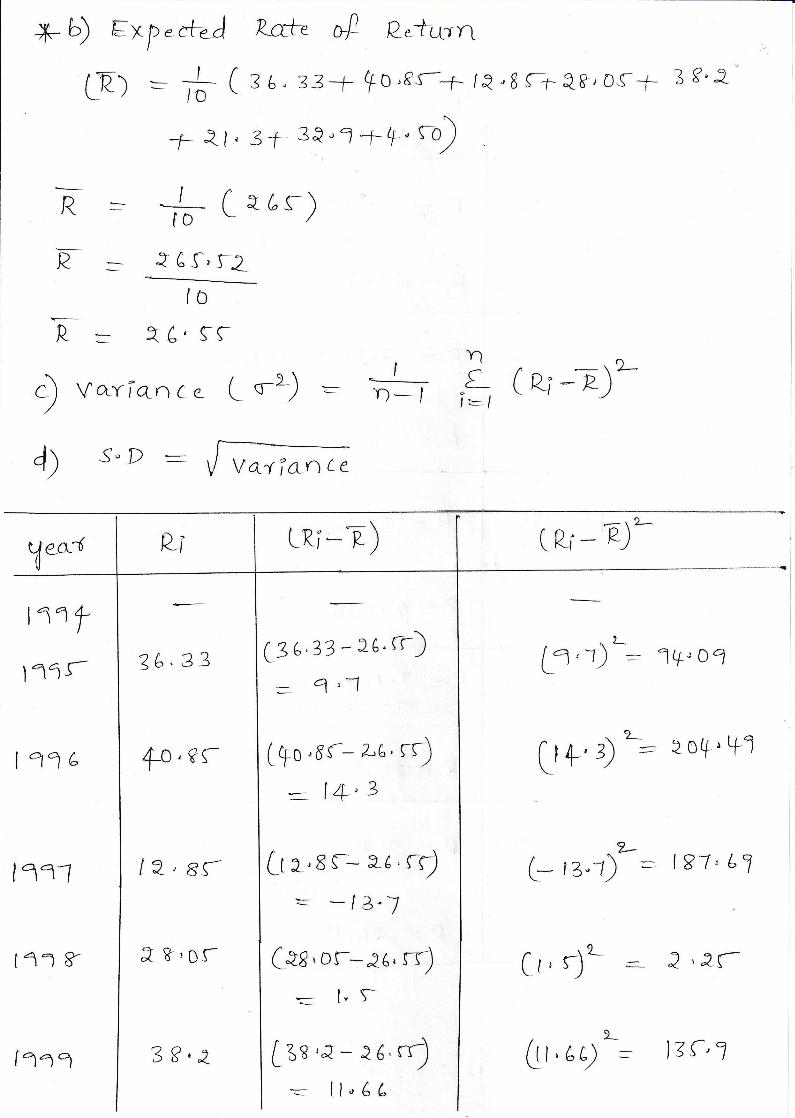
.p b) trxp .cr.A 2-a+e .t P.tq^1n
to
= X6'fr
Vavio.nce L o-2-)
s"D ::-_v arf an te
Li LRi -
Ltrl - # ( s a, z3-f +0,8s--5 IQ, I s--r Q-8, os--ts 3 s' 2
-tsi.l.3l-3&'?-t-+'r|
= -l ( e6s-\fo \- /
= a 6 _r,rz
R
E-
R
,
4)
Ynon
t1t y
IalJ- 2L,33
.-r2-*P)
-r 2-
(R"- P)
.2_
[=,r) _
o'-[- rz"1) -
19, o?
I g-l' L7
i '2r-
E)
L3 6.33 - 26" rr): n'1
Icto ,6'(^- la, rf:_ l+,3
Ir2 0t|' P1
^2_+'3) :la1 L +o,rr
tal tr e r,Dr
lazl [7,gr Lr 2,8 s- ze 'r): -lz"j
Ces, os--ea, rr): ["5-
9_
=rlaa 39,2 Ltn rp - i6,rr (t,utS lz{,1
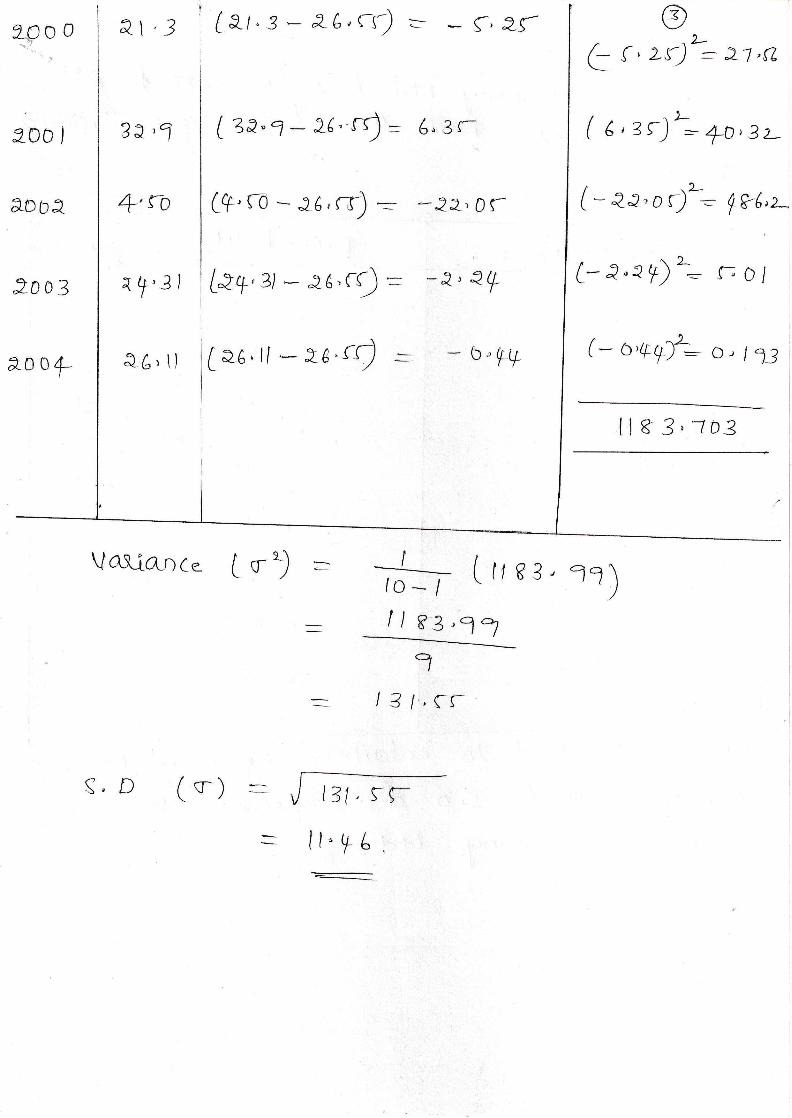
a\ ,3 [at,3-_ e-L,t\) -- -r,z{ryooi
_ "L-C f ,z{) =-2i'(l
( e ,zr)\ +r,3tr -2-( - aJ,0 ()-: f ?(,-
s00 I3t,?
aDbe +'{o
2Da3 { ?,3 I
aoo+ a6' U
(2a.1- z(.'r, = 6.,8r_
-2e, 0 r
[prp,3/ * Jd,c$ =
I aa . ll * zs-t{) =
*e'ar (-a.ep)? r.o/
- b"yv (* o '++)'> o, / a3
llr 3,103
Vaf,ia-n ce. t o- ") = *=, ( t*:' =7)
I I tr3, a-7a
lS li,g*r
(. D (*)r-J t3t, rrlt" P 6
-
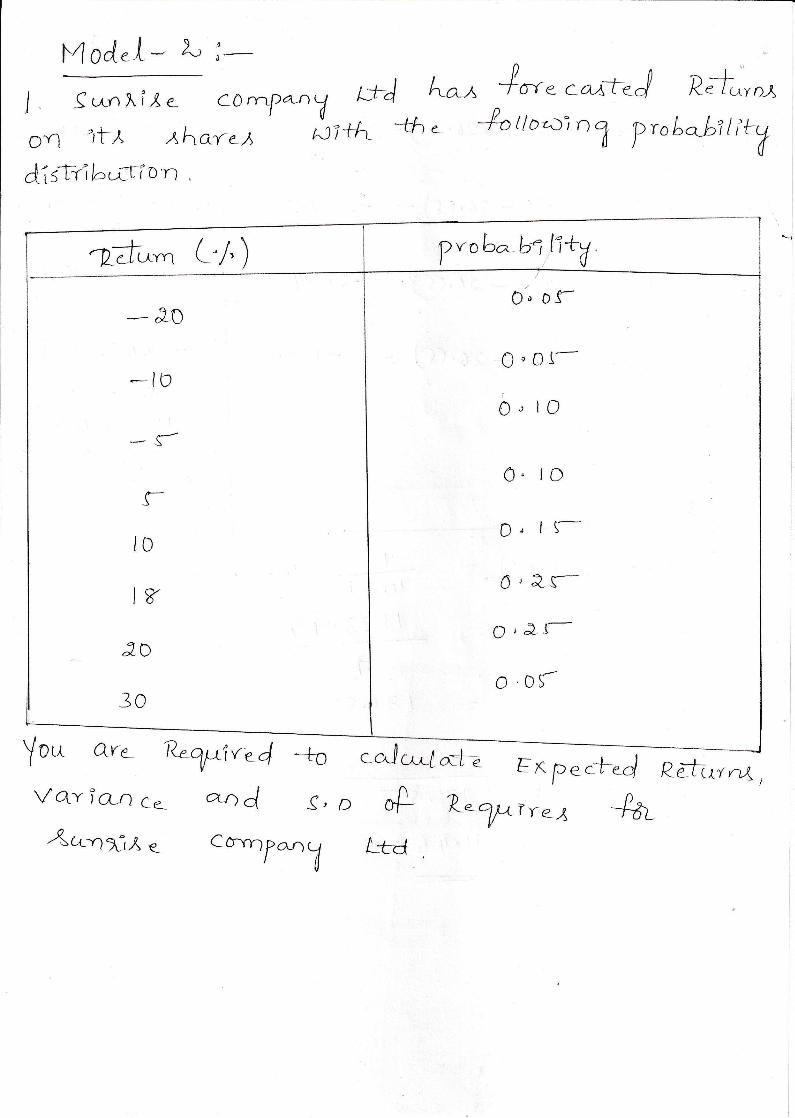
Yod,.L*Li- n n ,
I -C r,tn L i X e- co rn{>a,nrtr U-l ko,t *{*u t"ikJ Pttu"n-x
Dn 1f L ,r,har.,r b+f, -th . -!" tlotti n 7 PrrLoLi tiLV
d'tiT{,b,ffion
-L**n L"/'') pnob^-b: l1*V.
- "20
O' o3-
o ,01,-
eo tO"-to
<\
rt0
IY
d\)
30
0, lD
D,l\-
0 , &-s-
g t 2{-
o.or
Yo,^ Qu.e- %11-rfn.4 -to G Eo p ".*d R-{t-u"rd,v qy i an 1- ^-n d (,, D .P- L"_.ll4rreA +fu,(rrnliX
" C6-"nf-y A:L<j
,
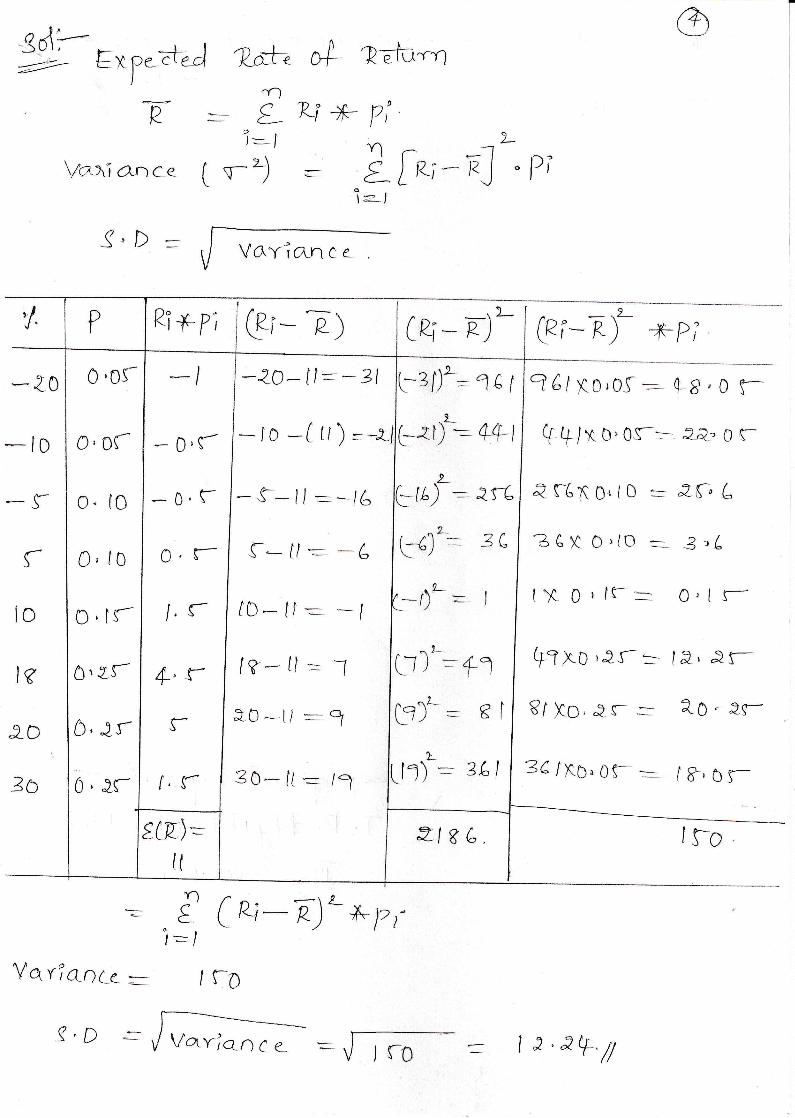
o-rSs\-=--+'
trxp.zt-.J edz ?ah.1
-DN_
VoX a.nce
Ri
t !-') - q
l=-,
.7T\l',-/ =- |u t/ VaYio.llce
V
rPin (- ---t8-LRi-
')aJ
9
"Pr
0'of
0, 0r
o. t0
0,10
0,[r0'Z5-
0,Jr
b' rr
- 0,s-
-6,F
0,r
/"r
+, {'rr.r
*20- ll: - 3l
-iD -(u )=
-S--ll:1L(_-- t/ * -/s ({ \3
C0- ll: ---/
lt-- Il : -1
e0-t/:?
30- l[ : /?
L:la) -'are
b4'= 3 L
n\L_- I
-t) t
^r_tl) - +7
L?)': 8l1_
13) : zLl
z[)':1e I
2_
-{r) - 4{l-20
-ID--J
{
lo
Ri +- P; (er- T) CP.i - tr) -
zt gL
^ _.2_tr- R) +P;qCl f,o,oT - FB,o f-++/K b'or-- z&- o r
Q(-AND*lD =. "zf,A
?6K0r(o a- 3,L
tX0,lf-.- 0'ls-
ftro,JJ-= l&'&s-
Bf fo, &$- : ?-o - p.r
ze lKb" of,- :_ I &, o r
I S-o
ls
l-D
3a
( rz; --P)' u l, ,'
I $-oY qv? qo(e =-
HS,D - /Vatriqnci-_ : I r,eV. l/

i) E = -t+(-o,r-)*t-o,r)+o,{-*Ll,r_f *.r+c1' l'f
- nY e:>av ed L r-tr 1 '| v l',T, 714rt r'-l; f.rctvi f,q MBA
(
I ) (ern ts")
l? - ll:-.-
UNIT-3 IMPORTANT QUESTIONS
1. Write a short note on:
a) Revenue Return
b) Capital appreciation,
c) holding period,
2. Explain Risk factors
3. Elucidate risk classification (or) types of Risk
Problems:
Calculation of expected return, standard deviation, variance and Beta
(17E00312) INVESTMENT AND PORTFOLIO MANAGEMENT
(Elective III)
Objective: The objective of the course is to provide students an understanding of working of
capital markets and management of portfolios of stocks. The pre-requisite for the course is
Financial Accounting and Analysis and Financial Management.
* Standard discounting and statistical tables to be allowed in the examinations.
1. Investment: Introduction to stock markets -objectives, Process of Investment,
Investment and speculation.
2. Fundamental Analysis & Technical Analysis: Framework of Fundamental analysis-
Economic analysis, Industry analysis-Industry Life cycle - Company analysis,
Fundamental Analysis Vs Technical Analysis - Dow Theory.
3. Measurement of Risk and Return: Revenue Return and Capital appreciation,
holding period –Calculation of expected return, Risk factors, risk classification –
systematic risk – unsystematic risk – standard deviation – variance– Beta .
4. Valuation of Securities: Types of Securities - Approaches of valuation – Bond
valuation – Preference share Valuation – Common stock Valuation.
5. Portfolio Management: Process of Portfolio Management, Modern Portfolio –
Portfolio models – Markowitz model – Sharpe single index model, Capital Asset
Pricing Models.
Text Books:
Investment Management,V.K.Balla, S.Chand Company Ltd
Security Analysis and Portfolio Management ,PunithavathyPandian, Vikas
References:
Investment Analysis and portfolio management, Chandra, Tata McGraw Hill .
Secuerity Analysis Portfolio Management, Ranganatham&Madhumathi, Pearson
Education.
Security Analysis and Portfolio Management, SudhindraBhat, excel.
Security analysis and portfolio management, Avadani, Himalaya publishers.
Investment analysis portfolio management, Frank Reilly & Brown, Cengage.
Investment Management, Preethi Singh, Himalaya Publishing House, Mumbai..
Investment, Bodie, McGraw Hill Book Company.
Investment Management ,Hiriyappa ,New Age Publications
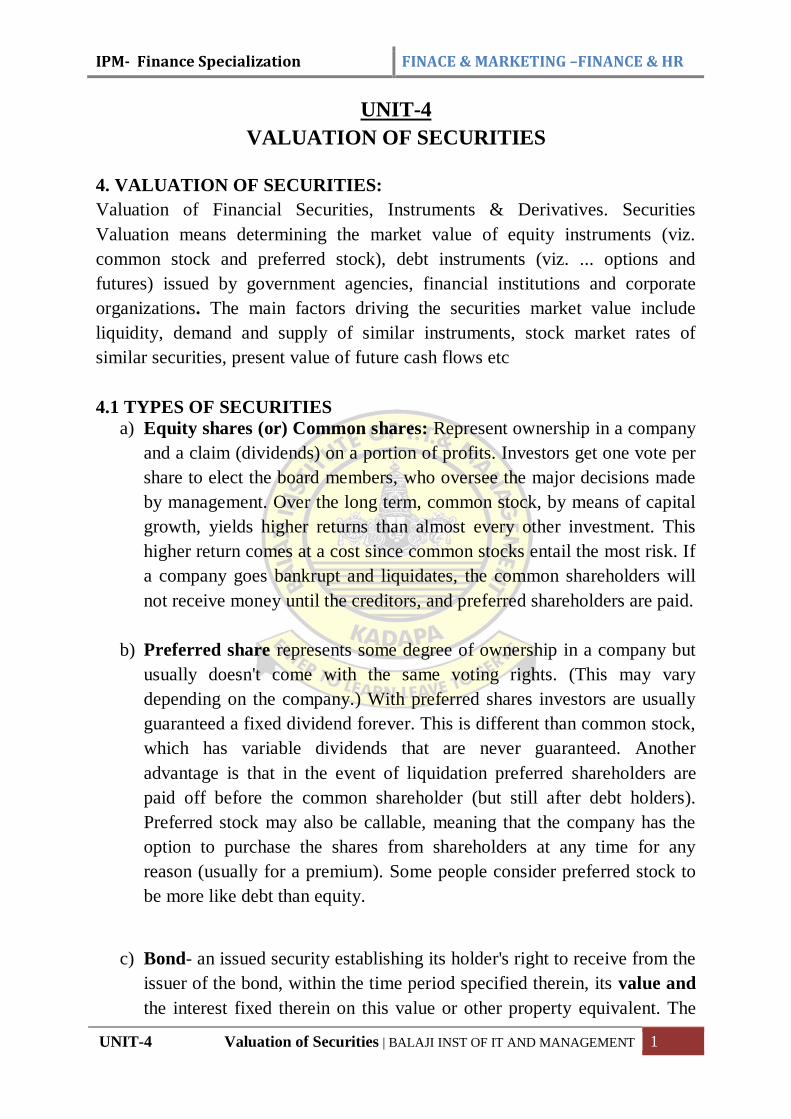
IPM- Finance Specialization FINACE & MARKETING –FINANCE & HR
UNIT-4 Valuation of Securities | BALAJI INST OF IT AND MANAGEMENT 1
UNIT-4
VALUATION OF SECURITIES
4. VALUATION OF SECURITIES:
Valuation of Financial Securities, Instruments & Derivatives. Securities
Valuation means determining the market value of equity instruments (viz.
common stock and preferred stock), debt instruments (viz. ... options and
futures) issued by government agencies, financial institutions and corporate
organizations. The main factors driving the securities market value include
liquidity, demand and supply of similar instruments, stock market rates of
similar securities, present value of future cash flows etc
4.1 TYPES OF SECURITIES
a) Equity shares (or) Common shares: Represent ownership in a company
and a claim (dividends) on a portion of profits. Investors get one vote per
share to elect the board members, who oversee the major decisions made
by management. Over the long term, common stock, by means of capital
growth, yields higher returns than almost every other investment. This
higher return comes at a cost since common stocks entail the most risk. If
a company goes bankrupt and liquidates, the common shareholders will
not receive money until the creditors, and preferred shareholders are paid.
b) Preferred share represents some degree of ownership in a company but
usually doesn't come with the same voting rights. (This may vary
depending on the company.) With preferred shares investors are usually
guaranteed a fixed dividend forever. This is different than common stock,
which has variable dividends that are never guaranteed. Another
advantage is that in the event of liquidation preferred shareholders are
paid off before the common shareholder (but still after debt holders).
Preferred stock may also be callable, meaning that the company has the
option to purchase the shares from shareholders at any time for any
reason (usually for a premium). Some people consider preferred stock to
be more like debt than equity.
c) Bond- an issued security establishing its holder's right to receive from the
issuer of the bond, within the time period specified therein, its value and
the interest fixed therein on this value or other property equivalent. The

IPM- Finance Specialization FINACE & MARKETING –FINANCE & HR
UNIT-4 Valuation of Securities | BALAJI INST OF IT AND MANAGEMENT 2
bond may provide for other property rights of its holder, where this is not
contrary to legislation.
d) Debentures: A debenture is a type of debt instrument that is not secured
by physical assets or collateral. Debentures are backed only by the
general creditworthiness and reputation of the issuer. Both corporations
and governments frequently issue this type of bond to secure capital. Like
other types of bonds, debentures are documented in an indenture.
e) Units of mutual funds: An investment programme funded by
shareholders that trade in diversified holdings and is professionally
managed. A mutual fund is a professionally managed investment fund
that pools money from many investors to purchase securities. These
investors may be retail or institutional in nature. Mutual funds have
advantages and disadvantages compared to direct investing in individual
securities.
4.2 APPROACHES OF VALUATION
4.2.1 Bond valuation
4.2.2 Preference share Valuation
4.2.3 Common stock Valuation.
4.2.1. BOND VALUATION
Bond valuation: In finance, a bond is an instrument of indebtedness of the
bond issuer to the holders. The most common types of bonds include
municipal bonds and corporate bonds. The bond is a debt security, under
which the issuer owes the holders a debt and (depending on the terms of the
bond) is obliged to pay them interest (the coupon) or to repay the principal at a
later date, termed the maturity date. Interest is usually payable at fixed
intervals (semiannual, annual, and sometimes monthly). Very often the bond is
negotiable, that is, the ownership of the instrument can be transferred in the
secondary market. This means that once the transfer agents at the bank
medallion stamp the bond, it is highly liquid on the secondary market.
IPM- Finance Specialization FINACE & MARKETING –FINANCE & HR
UNIT-4 Valuation of Securities | BALAJI INST OF IT AND MANAGEMENT 3
4.2.1.1 FEATURES OF BOND
1) Principal: Nominal, principal, par, or face amount is the amount on
which the issuer pays interest, and which, most commonly, has to be
repaid at the end of the term. Some structured bonds can have a
redemption amount which is different from the face amount and can be
linked to the performance of particular assets.
2) Maturity: The issuer has to repay the nominal amount on the maturity
date. As long as all due payments have been made, the issuer has no
further obligations to the bond holders after the maturity date. The length
of time until the maturity date is often referred to as the term or tenure or
maturity of a bond. The maturity can be any length of time, although debt
securities with a term of less than one year are generally designated
money market instruments rather than bonds. Most bonds have a term of
up to 30 years. Some bonds have been issued with terms of 50 years or
more, and historically there have been some issues with no maturity date
(irredeemable). In the market for United States Treasury securities, there
are three categories of bond maturities:
o Short term (bills): maturities between one and five years;
o Medium term (notes): maturities between six and twelve years;
o Long term (bonds): maturities longer than twelve years.
3) Coupon: The coupon is the interest rate that the issuer pays to the holder.
Usually this rate is fixed throughout the life of the bond. It can also vary
with a money market index, such as LIBOR, or it can be even more
exotic. The name "coupon" arose because in the past, paper bond
certificates were issued which had coupons attached to them, one for each
interest payment. On the due dates the bondholder would hand in the
coupon to a bank in exchange for the interest payment. Interest can be
paid at different frequencies: generally semi-annual, i.e. every 6 months,
or annual. Bond issued by the Dutch East India Company in 1623
4) Yield: The yield is the rate of return received from investing in the bond.
It usually refers either to The current yield, or running yield, which is
simply the annual interest payment divided by the current market price of
the bond (often the clean price).The yield to maturity, or redemption
yield, which is a more useful measure of the return of the bond. This
IPM- Finance Specialization FINACE & MARKETING –FINANCE & HR
UNIT-4 Valuation of Securities | BALAJI INST OF IT AND MANAGEMENT 4
takes into account the current market price, and the amount and timing of
all remaining coupon payments and of the repayment due on maturity. It
is equivalent to the internal rate of return of a bond.
5) Credit quality: The quality of the issue refers to the probability that the
bondholders will receive the amounts promised at the due dates. This will
depend on a wide range of factors. High-yield bonds are bonds that are
rated below investment grade by the credit rating agencies. As these
bonds are riskier than investment grade bonds, investors expect to earn a
higher yield. These bonds are also called junk bonds.
6) Market price: The market price of a tradable bond will be influenced,
amongst other factors, by the amounts, currency and timing of the interest
payments and capital repayment due, the quality of the bond, and the
available redemption yield of other comparable bonds which can be
traded in the markets. The price can be quoted as clean or dirty. "Dirty"
includes the present value of all future cash flows, including accrued
interest, and is most often used in Europe. "Clean" does not include
accrued interest, and is most often used.
4.2.1.2 TYPES OF BONDS
1) Government Bonds: Government can be issued by national
governments as well as lower levels of government. At the national or
federal level, these government bonds are known as “sovereign” debt, and
are backed by the ability of a nation to tax its citizens and to print
currency.
2) bonds: Municipal, also known as "munis" are bonds issued by state or
local governments or by government agencies. These bonds are typically
riskier than national government bonds; cities don't go bankrupt that
often, but it can happen (for example in Detroit and Stockton, CA). The
major advantage to munis for investors is that the returns are free from
federal tax, and furthermore, state and local governments will often
consider their debt non-taxable for residents, thus making some municipal
IPM- Finance Specialization FINACE & MARKETING –FINANCE & HR
UNIT-4 Valuation of Securities | BALAJI INST OF IT AND MANAGEMENT 5
bonds completely tax free, sometimes called triple-tax free. Because of
these tax savings, the yield on a muni is usually lower than that of an
equivalent taxable bond. Depending on your personal situation, a muni
can be a great investment on an after-tax basis.
3) Corporate Bonds: The other major issuers of bonds are corporations,
and corporate bonds make up a large portion of the overall bond market.
Large corporations have a great deal of flexibility as to how much debt
they can issue: the limit is generally whatever the market will bear. A
corporate bond is considered short-term corporate when the maturity is
less than five years; intermediate is five to 12 years, and long-term is over
12 years.
4) Convertible bonds: Convertible bonds are debt issued by corporations
that give the bondholder the option to convert the bonds into shares of
common stock at a later date. The rate at which investors can convert
bonds into stocks, that is, the number of shares an investor gets for each
bond, is determined by a metric called the conversion rate. The
conversion rate may be fixed or change over time depending on the terms
of the offering.
5) Callable bonds: Callable bonds are bonds that can be redeemed by the
issuer at some point prior to its maturity. If interest rates have declined
since the company first issued the bond, the company is likely to want to
refinance this debt at a lower rate of interest. In this case, the company
calls its current bonds and reissues them at a lower rate of interest.
Callable bonds typically have a higher interest rate to account for this
added risk to investors. When homeowners refinance a mortgage, they are
calling in their older debt for a new loan at better rates.
6) Corporate Bonds: A company can issue bonds just as it can issue stock.
Large corporations have a lot of flexibility as to how much debt they can

IPM- Finance Specialization FINACE & MARKETING –FINANCE & HR
UNIT-4 Valuation of Securities | BALAJI INST OF IT AND MANAGEMENT 6
issue: the limit is whatever the market will bear. Generally, a short-term
corporate bond has a maturity of less than five years, intermediate is five
to 12 years and long term is more than 12 years.
7) Term Bonds: Term are bonds from the same issue that share the same
maturity dates. Term bonds that have a call feature can be redeemed at an
earlier date than the other issued bonds. A call feature, or call provision,
is an agreement that bond issuers make with buyers. This agreement is
called an "indenture," which is the schedule and the price of redemptions,
plus the maturity dates.
8) Fixed rate bonds have a coupon that remains constant throughout the life
of the bond. A variation is stepped-coupon bonds, whose coupon
increases during the life of the bond.
9) Zero-coupon bonds: Zero-coupon bonds (zeros) pay no regular interest.
They are issued at a substantial discount to par value, so that the interest
is effectively rolled up to maturity (and usually taxed as such). The
bondholder receives the full principal amount on the redemption date. An
example of zero coupon bonds is Series E savings bonds issued by the
U.S. government.
10) High-yield bonds: High-yield bonds (junk bonds) are bonds that are
rated below investment grade by the credit rating agencies. As these
bonds are riskier than investment grade bonds, investors expect to earn a
higher yield.
11) Convertible bonds: Convertible bonds let a bondholder exchange a
bond to a number of shares of the issuer's common stock. These are
known as hybrid securities, because they combine equity and debt
features.
12) Exchangeable bonds: Exchangeable bonds allows for exchange to
shares of a corporation other than the issuer.

IPM- Finance Specialization FINACE & MARKETING –FINANCE & HR
UNIT-4 Valuation of Securities | BALAJI INST OF IT AND MANAGEMENT 7
13) Bonds: Bearer is an official certificate issued without a named holder. In
other words, the person who has the paper certificate can claim the value
of the bond. Often they are registered by a number to prevent
counterfeiting, but may be traded like cash. Bearer bonds are very risky
because they can be lost or stolen.
14) Registered bonds: Registered bond is a bond whose ownership (and any
subsequent purchaser) is recorded by the issuer, or by a transfer agent. It
is the alternative to a Bearer bond. Interest payments and the principal
upon maturity are sent to the registered owner.
15) Social impact bonds: Social impact bonds are an agreement for public
sector entities to pay back private investors after meeting verified
improved social outcome goals that result in public sector savings from
innovative social program pilot projects.
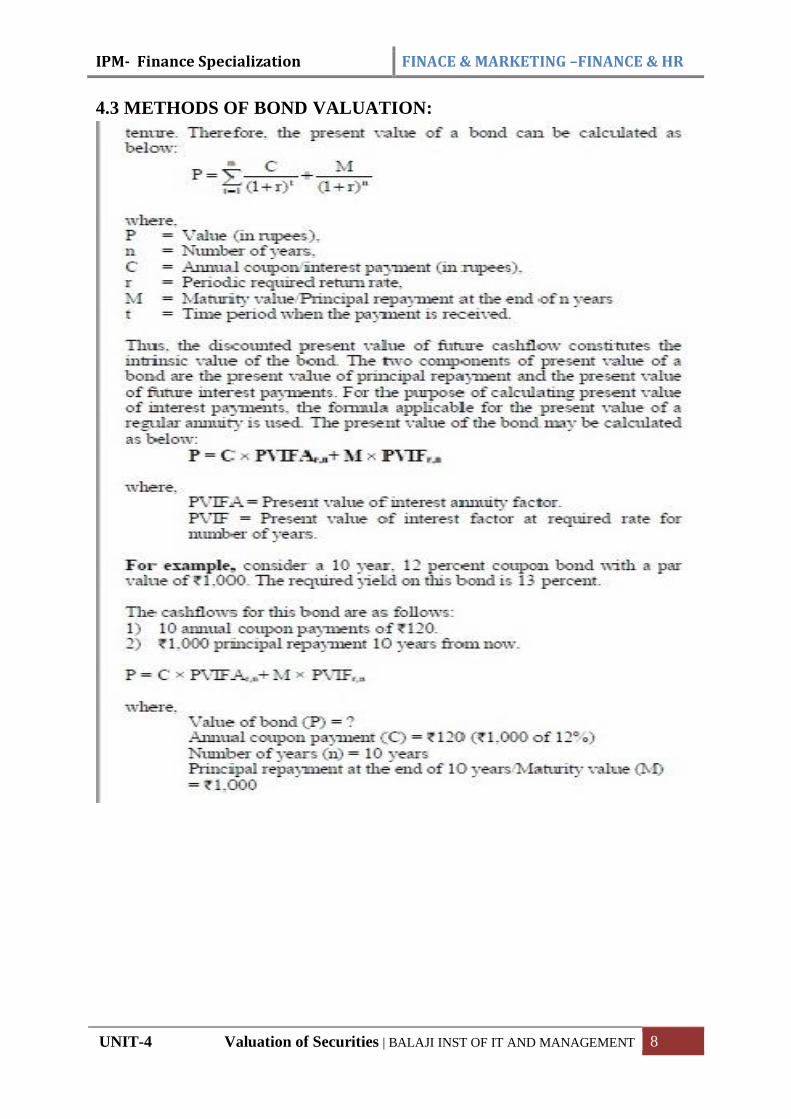
IPM- Finance Specialization FINACE & MARKETING –FINANCE & HR
UNIT-4 Valuation of Securities | BALAJI INST OF IT AND MANAGEMENT 8
4.3 METHODS OF BOND VALUATION:
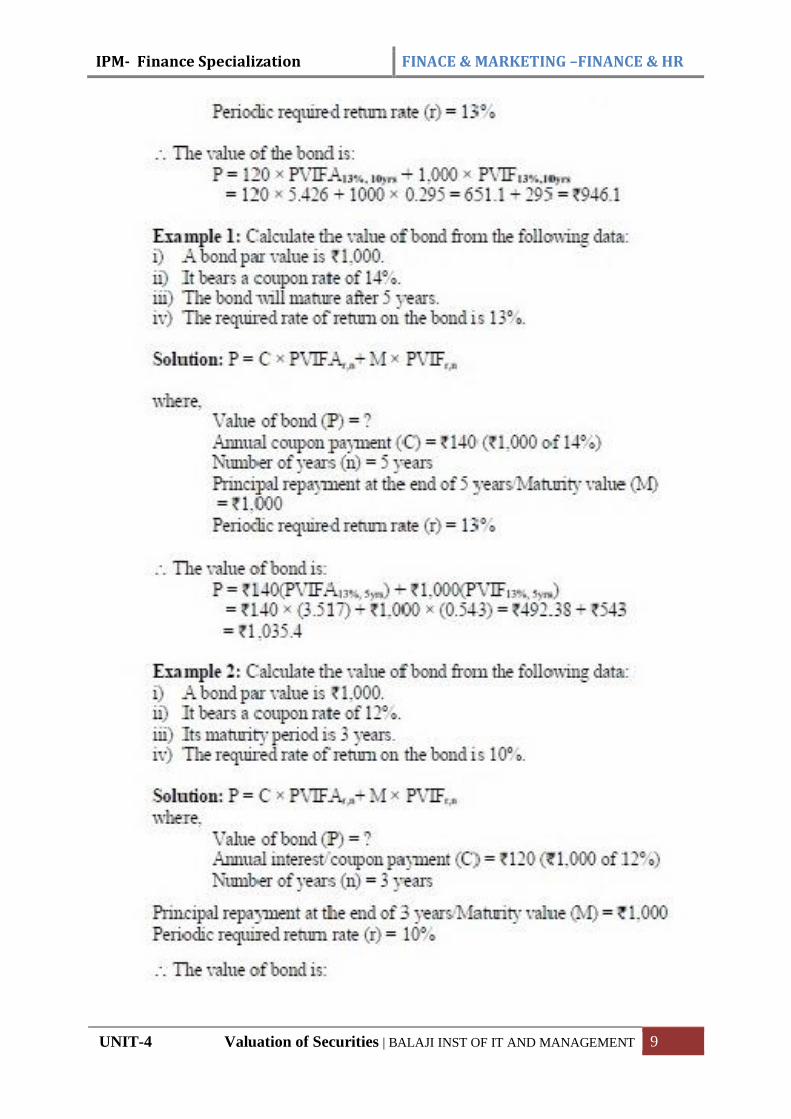
IPM- Finance Specialization FINACE & MARKETING –FINANCE & HR
UNIT-4 Valuation of Securities | BALAJI INST OF IT AND MANAGEMENT 9
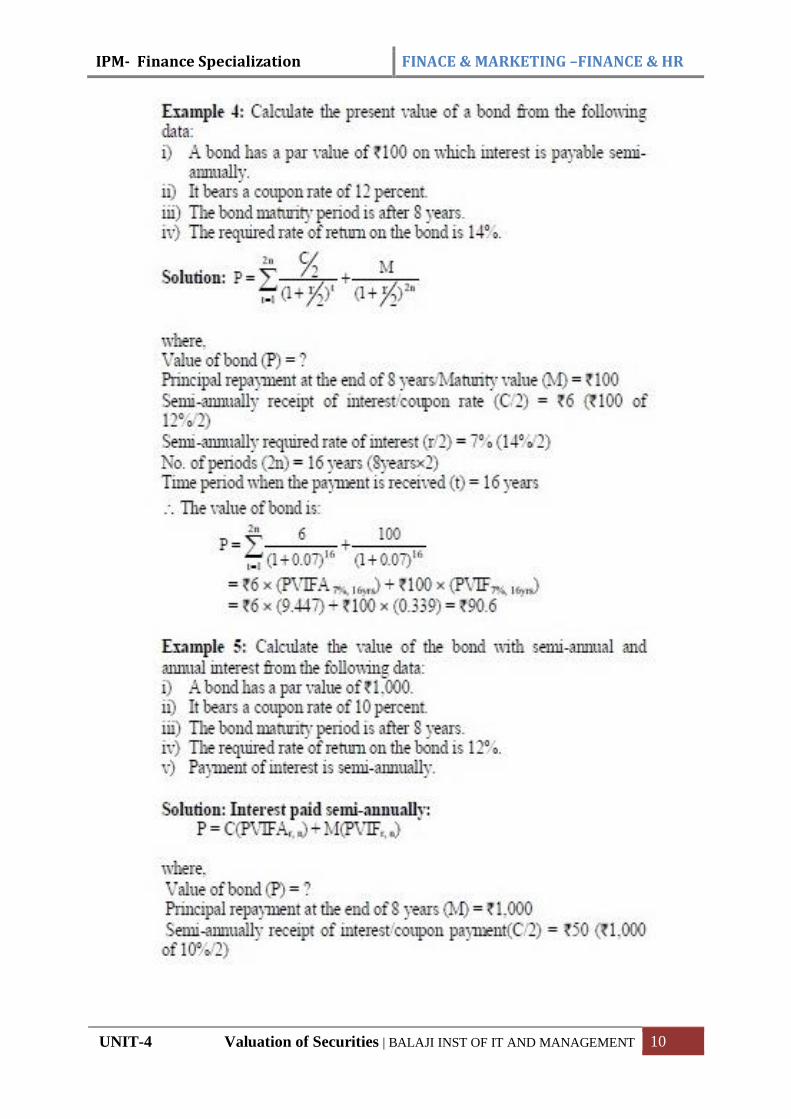
IPM- Finance Specialization FINACE & MARKETING –FINANCE & HR
UNIT-4 Valuation of Securities | BALAJI INST OF IT AND MANAGEMENT 10
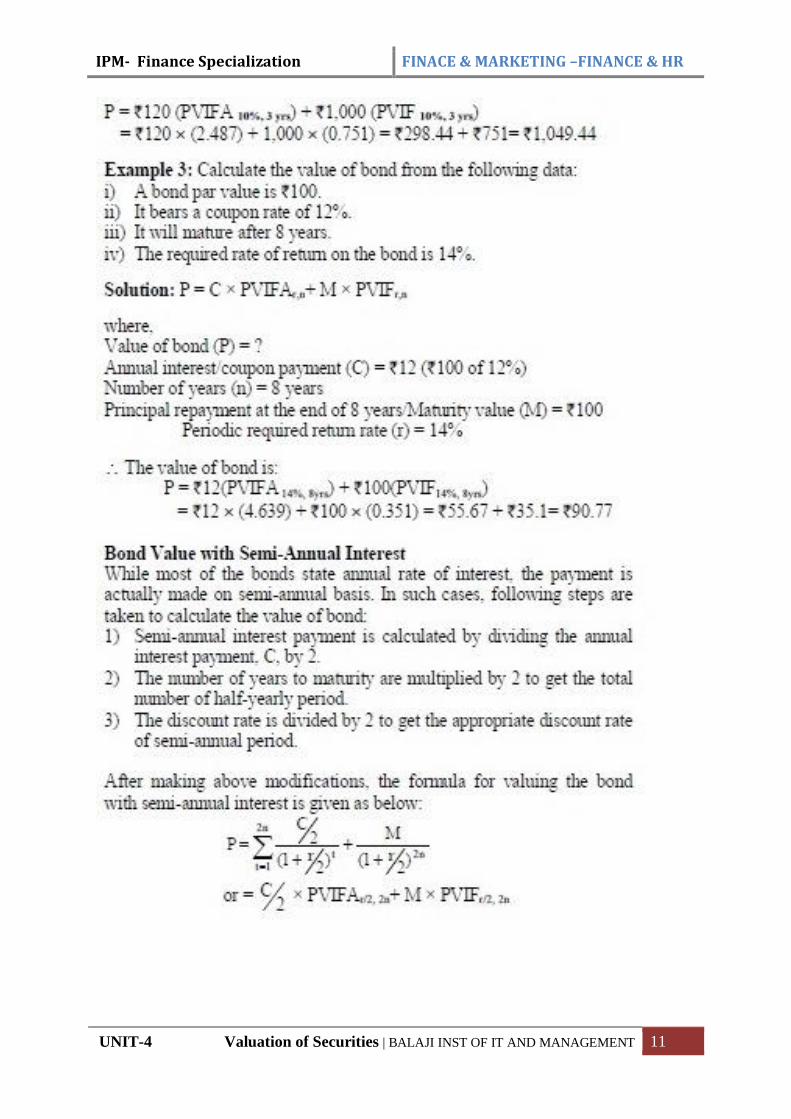
IPM- Finance Specialization FINACE & MARKETING –FINANCE & HR
UNIT-4 Valuation of Securities | BALAJI INST OF IT AND MANAGEMENT 11
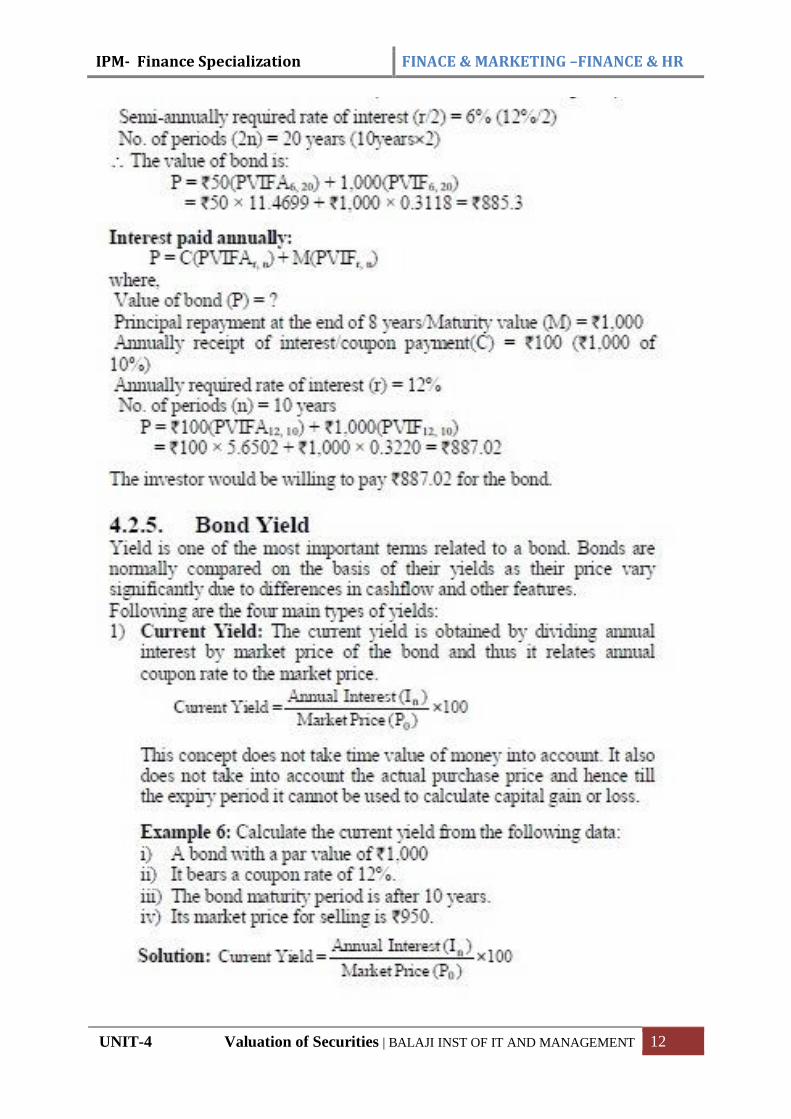
IPM- Finance Specialization FINACE & MARKETING –FINANCE & HR
UNIT-4 Valuation of Securities | BALAJI INST OF IT AND MANAGEMENT 12
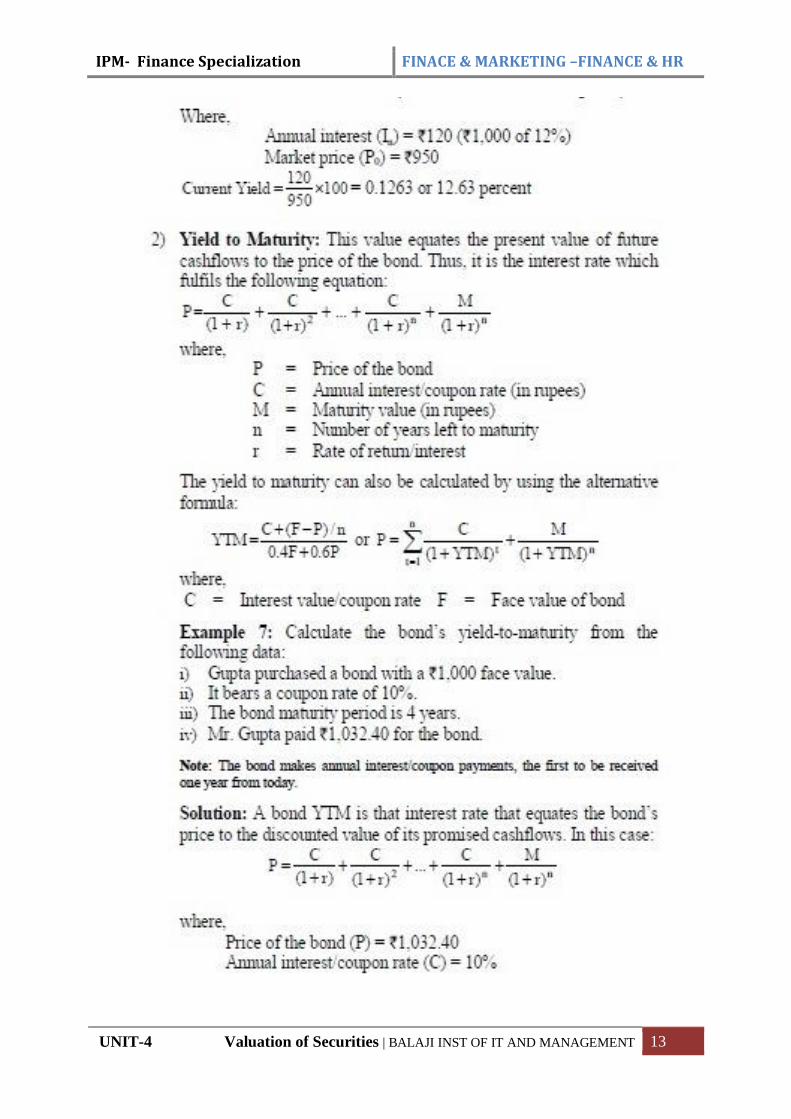
IPM- Finance Specialization FINACE & MARKETING –FINANCE & HR
UNIT-4 Valuation of Securities | BALAJI INST OF IT AND MANAGEMENT 13
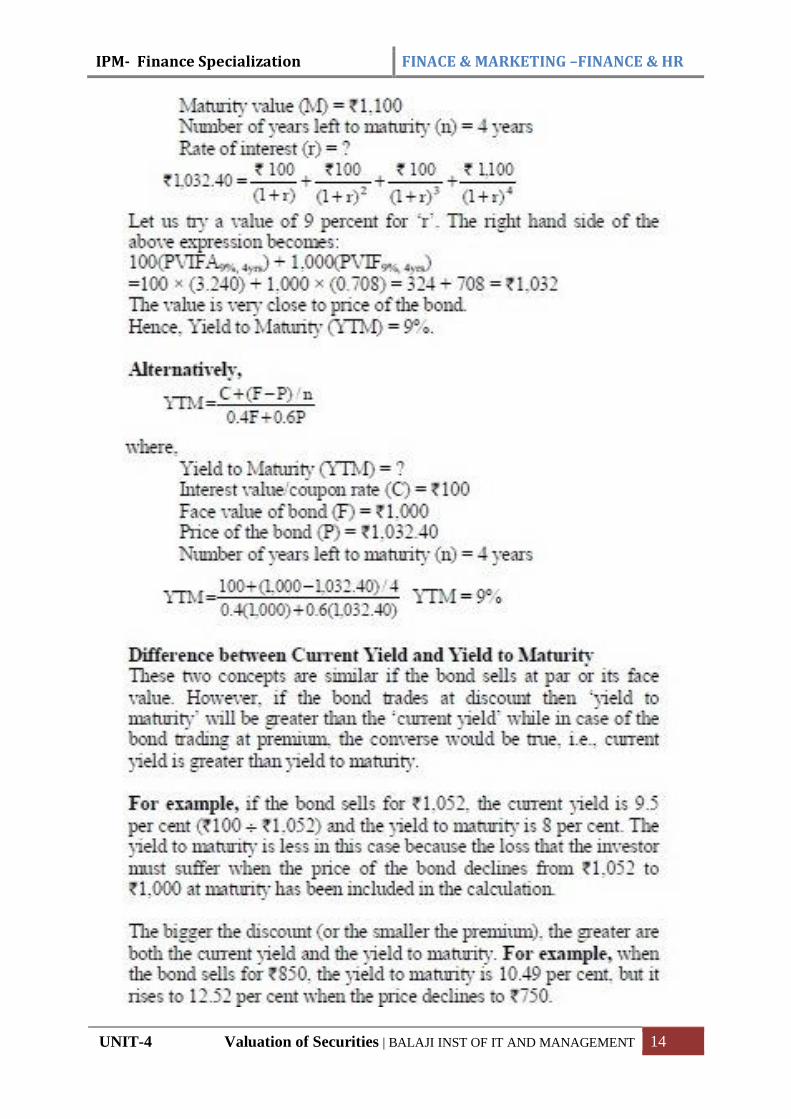
IPM- Finance Specialization FINACE & MARKETING –FINANCE & HR
UNIT-4 Valuation of Securities | BALAJI INST OF IT AND MANAGEMENT 14
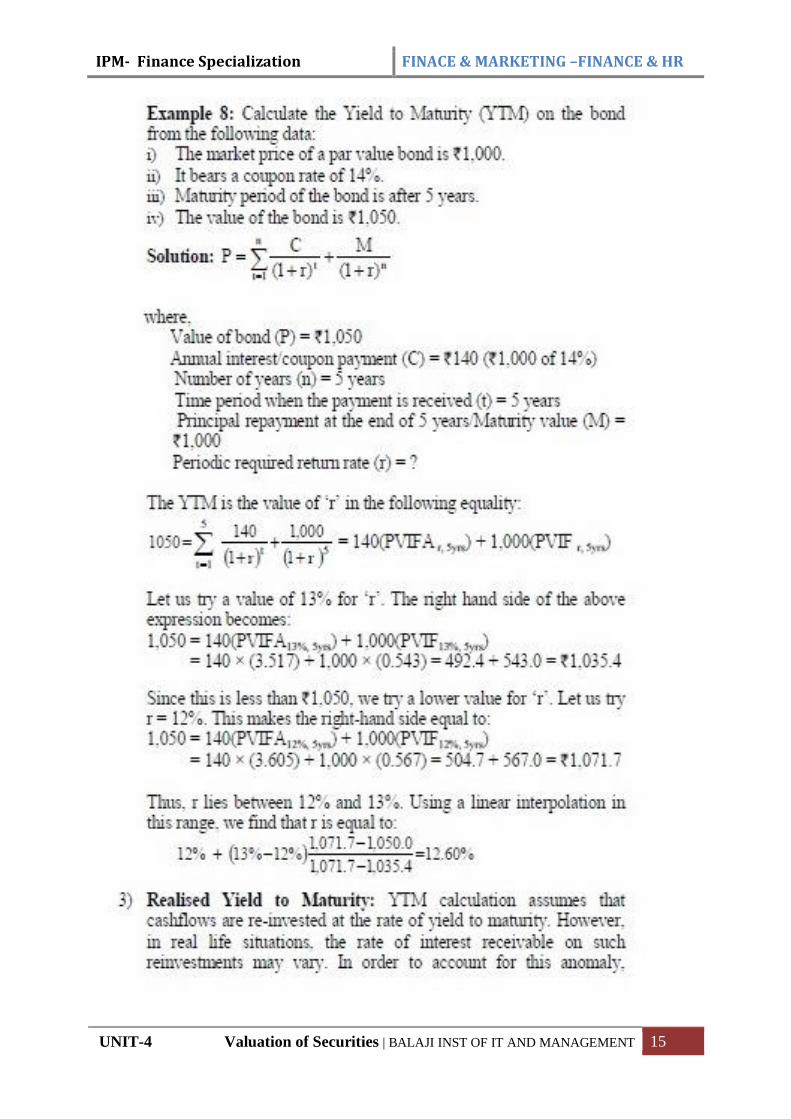
IPM- Finance Specialization FINACE & MARKETING –FINANCE & HR
UNIT-4 Valuation of Securities | BALAJI INST OF IT AND MANAGEMENT 15
IPM- Finance Specialization FINACE & MARKETING –FINANCE & HR
UNIT-4 Valuation of Securities | BALAJI INST OF IT AND MANAGEMENT 16
4.2.2 PREFERENCE SHARE VALUATION
Preference shares are one of the important sources of hybrid financing. It is a
hybrid security because it has some features of equity shares as well as some
features of debentures. The holders of preference shares enjoy the
preferential rights with regard to receiving of dividend and getting back of
capital in case the company winds-up.
4.2.2.1 FEATURES OF PREFERENCE SHARES:
1. Preference shares are long-term source of finance.
2. The dividend payable on preference shares is generally higher than
debenture interest.
3. Preference shareholders get fixed rate of dividend irrespective of the
volume of profit.
4. It is known as hybrid security because it also bears some characteristics
of debentures.
5. Preference dividend is not tax deductible expenditure.
6. Preference shareholders do not have any voting rights.
7. Preference shareholders have the preferential right for repayment of
capital in case of winding up of The Company.
8. Preference shareholders also enjoy preferential right to receive dividend.
4.2.2.2 ADVANTAGES OF PREFERENCE SHARES:
a. The earnings per share of existing preference shareholders are not diluted if
fresh preference shares are issued.
IPM- Finance Specialization FINACE & MARKETING –FINANCE & HR
UNIT-4 Valuation of Securities | BALAJI INST OF IT AND MANAGEMENT 17
b. Issue of preference shares increases the earnings of equity shareholders, i.e.
it has a leveraging benefit.
c. Preference shareholders do not have any voting rights and hence do not
affect the decision making of the company.
d. Preference dividend is payable only if there is profit.
4.2.2.3 DISADVANTAGES OF PREFERENCE SHARES:
a. Preference dividend is not tax deductible and hence it is costlier than a
debenture.
b. In case of cumulative preference share, arrear dividend is payable when
the company earns profit, which creates a huge financial burden on the
company.
c. Redemption of preference share again creates financial burden and erodes
the capital base of the company.
d. Preference shareholders get dividend at a constant rate and it will not
increase even if the company earns a huge profit, which makes this form
of finance less attractive.
e. Preference shareholders do not enjoy the voting rights and hence their fate
is decided by the equity shareholders.
4.2.2.4 DIFFERENT TYPES OF PREFERENCE SHARES:
Preference share may be classified under following categories:
i. According to Redeem ability:
Redeemable Preference Shares: Redeemable preference shares are those
shares which are redeemed or repaid after the expiry of a stipulated period. As
per The Companies (Amendment) Act, 1988, a company can issue redeemable
preference shares which are redeemable within 10 years from the date of issue.
IPM- Finance Specialization FINACE & MARKETING –FINANCE & HR
UNIT-4 Valuation of Securities | BALAJI INST OF IT AND MANAGEMENT 18
Irredeemable Preference Shares: Irredeemable preference shares are those
shares which are not redeemed before a stipulated period. It does not have a
specific maturity date. Such shares are redeemed at the time of liquidation of the
company. As per The Companies (Amendment) Act, 1988, a company at
present cannot issue irredeemable preference shares.
ii. According to Right of Receiving Dividend:
a. Cumulative Preference Shares: Preference dividend is payable if the
company earns adequate profit. However, cumulative preference shares carry
additional features which allow the preference shareholders to claim unpaid
dividends of the years in which dividend could not be paid due to insufficient
profit.
b. Non-cumulative Preference Shares: The holders of non-cumulative
preference shares will get preference dividend if the company earns sufficient
profit but they do not have the right to claim unpaid dividend which could not
be paid due to insufficient profit.
iii. According to Participation:
a. Participating Preference Shares: Participating preference shareholders are
entitled to share the surplus profit of the company in addition to preference
dividend. Surplus profit is calculated by deducting preference dividend and
equity dividend from the distributable profit. They are also entitled to
participate in the surplus assets of the company.
b. Non-participating Preference Shares: Non-participating preference
shareholders are not entitled to share surplus profit and surplus assets like
participating preference shareholders.
iv. According to Convertibility:
a. Convertible Preference Shares: The holders of convertible preference
shares are given an option to convert whole or part of their holding into equity
shares after a specific period of time.
IPM- Finance Specialization FINACE & MARKETING –FINANCE & HR
UNIT-4 Valuation of Securities | BALAJI INST OF IT AND MANAGEMENT 19
b. Non-convertible Preference Shares: The holders of non-convertible
preference shares do not have the option to convert their holding into equity
shares i.e. they remain as preference share till their redemption.
4.2.2.5 METHODS PREFERENCE SHARE VALUATION
1. Value of Preference Shares
2. Yield on Preference Shares
3. Common Stock Valuation
4. Present Value Approach
5. One Year Holding Period
6. Multiple Years Holding Period
7. Constant Growth or Zero Growth Dividends
8. Growth in Dividends’ Normal Growth
1. Value of Preference Shares: Preference shares give a fixed rate of dividend
but without a maturity date. Preference shares are usually perpetuities but
sometimes they do have maturity dates also.
The value of a preference share as a perpetuity is calculated thus:
V = Value of Preference Share
D = Annual Dividend per Preference Share
i = Discount Rate on Preference Shares
V = D/i
A company sold its preference shares @ Rs. 50 last year. The discount rate at
that time was 8%. The company pays an annual dividend of Rs. 4. The type of
Preference Share is currently yielding 6%. What is the value of the company’s
Preference Shares?
V = 4/.06 = 66.67
2. Yield on Preference Shares: The yield on Preference Shares is calculated in
the following manner: D
IPM- Finance Specialization FINACE & MARKETING –FINANCE & HR
UNIT-4 Valuation of Securities | BALAJI INST OF IT AND MANAGEMENT 20
i = D/V
... If current price of a preference share is Rs. 60 and annual dividend is Rs. 4,
what is the yield on Preference Shares?
i = D/V = 4/60 = 6.67%
3. Common Stock Valuation: The valuation of Bonds and Preference Shares
showed that the rate of dividend and interest is constant and reasonably certain.
Bonds represent constant income flows with a finite measurable life and
preference stocks have constant return on their shares. The valuation of
common stocks is comparatively more difficult.
The difficulty arises because of two factors:
(1) The amount of dividend and timing of cash flows expected by investors are
uncertain.
(2) The earnings and dividends on common shares are generally expected to
grow. Valuation of shares based on dividends and earnings.
4. Present Value Approach: The value of a common stock at any moment in
time can be thought of as the discounted value of a series of uncertain future
dividends that may grow or decline at varying rates overtime — The Basic
Valuation Model.
5. One Year Holding Period: Common Stock Valuation is easiest to start with
when the expected holding period is one year. To the investor, the rewards from
a common stock consist of dividends plus any change in price during the
holding period.
Example 3:
An investor buys a share at the beginning of the year for Rs. 100. He holds the
stock for one year. Rs. 5/- in dividends is collected and the share is sold for Rs.
130/-. The rate of return achieved is the composite of dividend yield and change
in price (capital gains yield).
g= =
IPM- Finance Specialization FINACE & MARKETING –FINANCE & HR
UNIT-4 Valuation of Securities | BALAJI INST OF IT AND MANAGEMENT 21
g= =br-(1)
The total rate of return achieved is .05 + 3 = .35 or 35%.
The same may be expressed in present values:
P0 = +
D1 = Dividend to be received at the end of year one.
ke = Investor’s required rate of return or discount.
PI = Selling Price at the end of year one.
P0 = Selling price today.
Therefore, Rs. 100 = +
At what price must we be able to sell the stock at the end of one year (if the
purchase price is Rs. 100 and the dividend is Rs. 5/-) in order to attain a rate of
return of 40%?
Rs=100 = +
100=3.57+0.7 P1
96.43=0.7 P1
P1=
= 137.7(selling price)
6. Multiple Years Holding Period:
Suppose the buyer who purchases the share P holds it for 3 years and then sells.
…….Equation
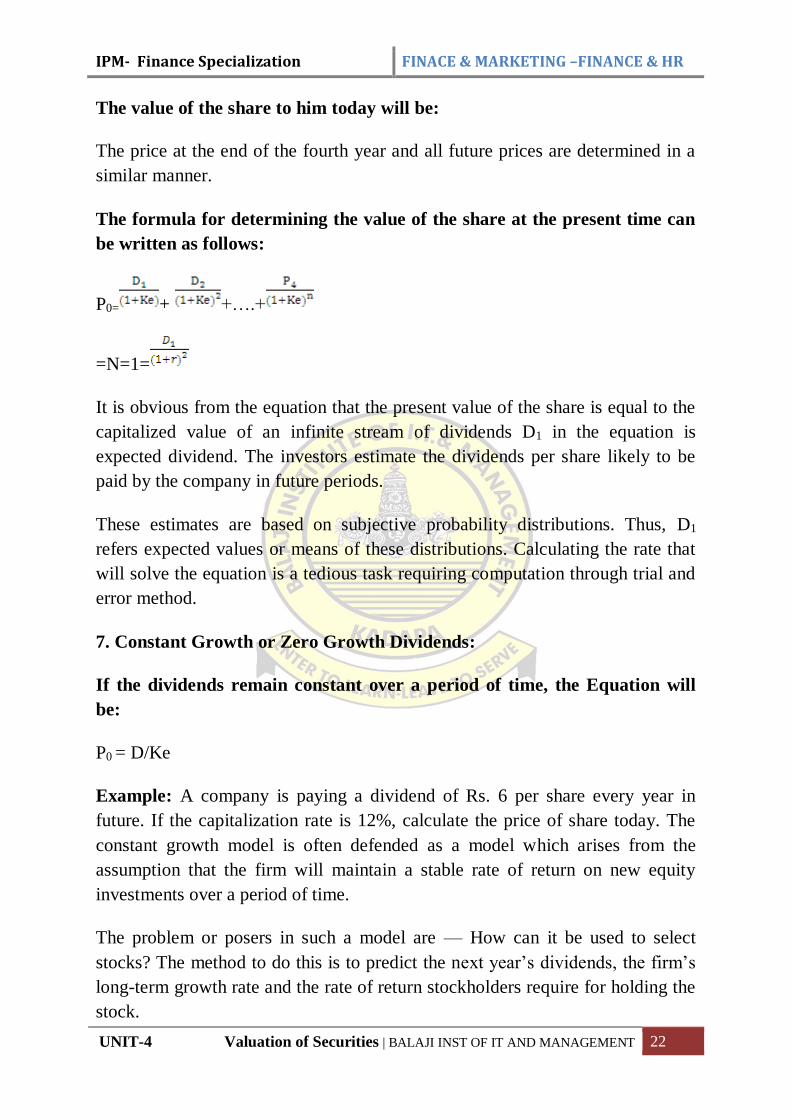
IPM- Finance Specialization FINACE & MARKETING –FINANCE & HR
UNIT-4 Valuation of Securities | BALAJI INST OF IT AND MANAGEMENT 22
The value of the share to him today will be:
The price at the end of the fourth year and all future prices are determined in a
similar manner.
The formula for determining the value of the share at the present time can
be written as follows:
P0= + +….+
=N=1=
It is obvious from the equation that the present value of the share is equal to the
capitalized value of an infinite stream of dividends D1 in the equation is
expected dividend. The investors estimate the dividends per share likely to be
paid by the company in future periods.
These estimates are based on subjective probability distributions. Thus, D1
refers expected values or means of these distributions. Calculating the rate that
will solve the equation is a tedious task requiring computation through trial and
error method.
7. Constant Growth or Zero Growth Dividends:
If the dividends remain constant over a period of time, the Equation will
be:
P0 = D/Ke
Example: A company is paying a dividend of Rs. 6 per share every year in
future. If the capitalization rate is 12%, calculate the price of share today. The
constant growth model is often defended as a model which arises from the
assumption that the firm will maintain a stable rate of return on new equity
investments over a period of time.
The problem or posers in such a model are — How can it be used to select
stocks? The method to do this is to predict the next year’s dividends, the firm’s
long-term growth rate and the rate of return stockholders require for holding the
stock.
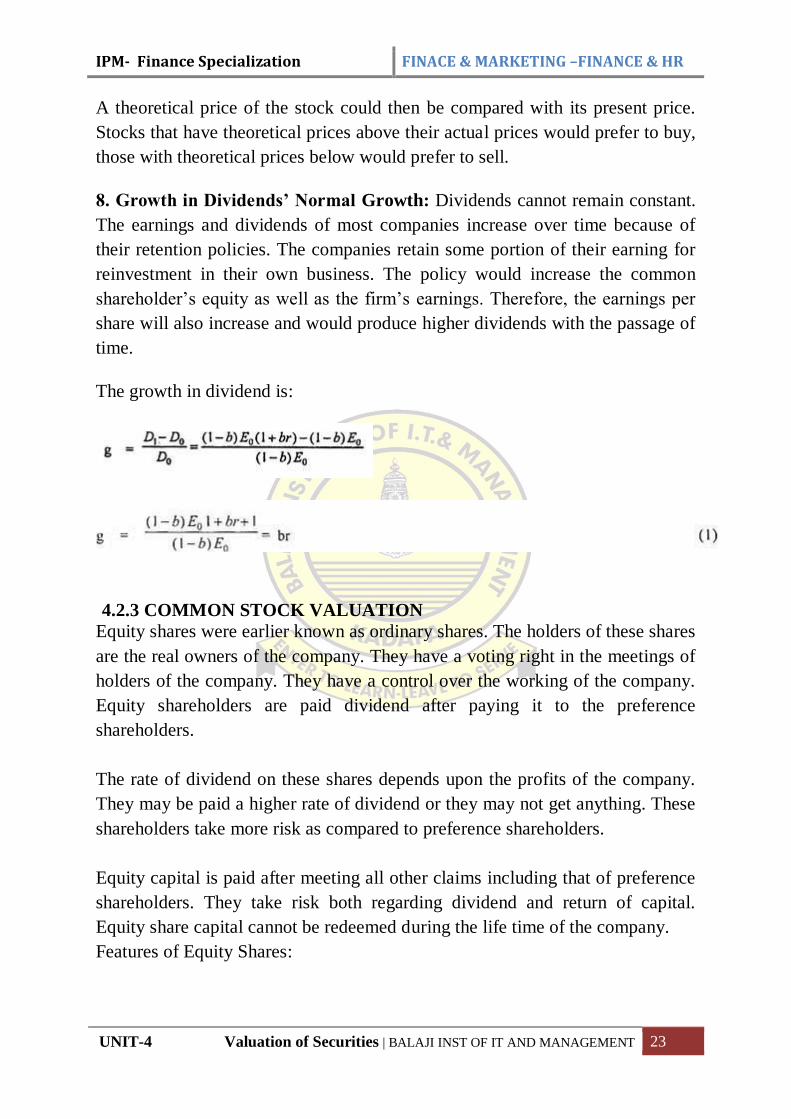
IPM- Finance Specialization FINACE & MARKETING –FINANCE & HR
UNIT-4 Valuation of Securities | BALAJI INST OF IT AND MANAGEMENT 23
A theoretical price of the stock could then be compared with its present price.
Stocks that have theoretical prices above their actual prices would prefer to buy,
those with theoretical prices below would prefer to sell.
8. Growth in Dividends’ Normal Growth: Dividends cannot remain constant.
The earnings and dividends of most companies increase over time because of
their retention policies. The companies retain some portion of their earning for
reinvestment in their own business. The policy would increase the common
shareholder’s equity as well as the firm’s earnings. Therefore, the earnings per
share will also increase and would produce higher dividends with the passage of
time.
The growth in dividend is:
4.2.3 COMMON STOCK VALUATION
Equity shares were earlier known as ordinary shares. The holders of these shares
are the real owners of the company. They have a voting right in the meetings of
holders of the company. They have a control over the working of the company.
Equity shareholders are paid dividend after paying it to the preference
shareholders.
The rate of dividend on these shares depends upon the profits of the company.
They may be paid a higher rate of dividend or they may not get anything. These
shareholders take more risk as compared to preference shareholders.
Equity capital is paid after meeting all other claims including that of preference
shareholders. They take risk both regarding dividend and return of capital.
Equity share capital cannot be redeemed during the life time of the company.
Features of Equity Shares:
IPM- Finance Specialization FINACE & MARKETING –FINANCE & HR
UNIT-4 Valuation of Securities | BALAJI INST OF IT AND MANAGEMENT 24
4.2.3.1 FEATURES OF EQUITY SHARES:
1) Equity share capital remains permanently with the company. It is returned
only when the company is wound up.
2) Equity shareholders have voting rights and elect the management of the
company.
3) The rate of dividend on equity capital depends upon the availability of
surplus funds. There is no fixed rate of dividend on equity capital.
4.2.3.2 ADVANTAGES OF EQUITY SHARES:
1) Equity shares do not create any obligation to pay a fixed rate of dividend.
2) Equity shares can be issued without creating any charge over the assets of
the company.
3) It is a permanent source of capital and the company has to repay it except
under liquidation.
4) Equity shareholders are the real owners of the company who have the
voting rights.
5) In case of profits, equity shareholders are the real gainers by way of
increased dividends and appreciation in the value of shares.
4.2.3.4 DISADVANTAGES OF EQUITY SHARES:
1. If only equity shares are issued, the company cannot take the advantage of
trading on equity.
2. As equity capital cannot be redeemed, there is a danger of over
capitalization.
3. Equity shareholders can put obstacles for management by manipulation and
organizing themselves.
4. During prosperous periods higher dividends have to be paid leading to
increase in the value of shares in the market and it leads to speculation.
5. Investors who desire to invest in safe securities with a fixed income have no
attraction for such shares.
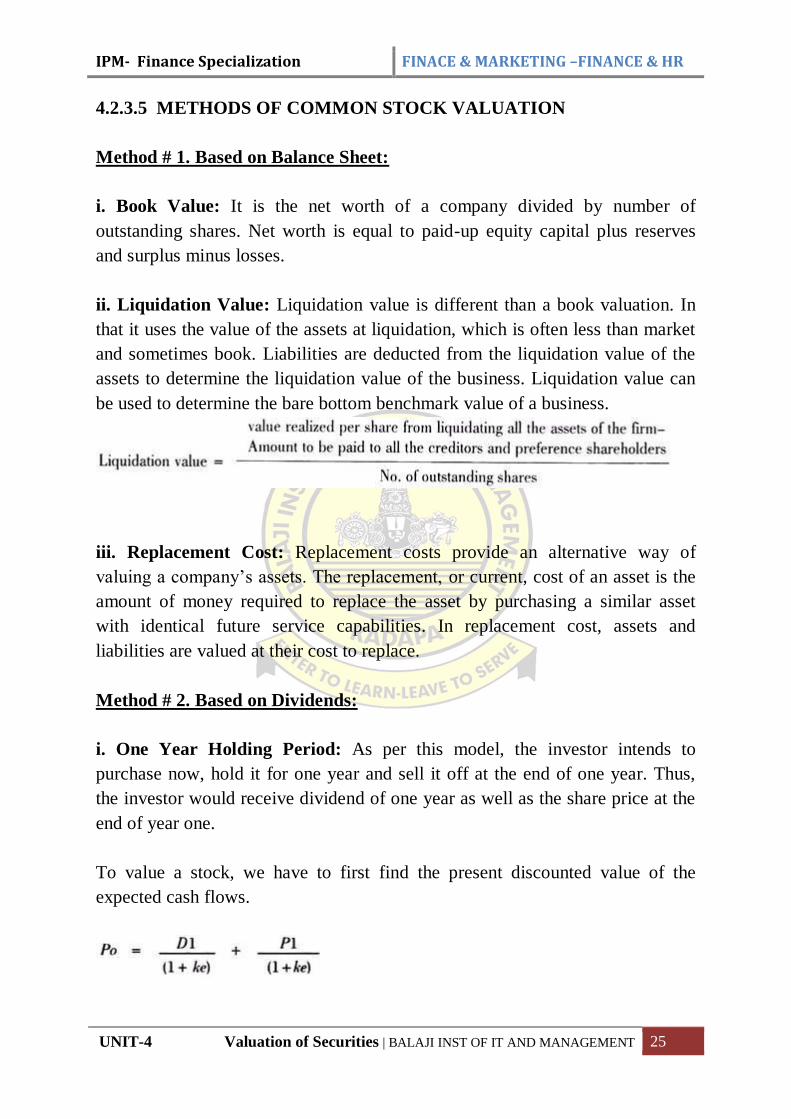
IPM- Finance Specialization FINACE & MARKETING –FINANCE & HR
UNIT-4 Valuation of Securities | BALAJI INST OF IT AND MANAGEMENT 25
4.2.3.5 METHODS OF COMMON STOCK VALUATION
Method # 1. Based on Balance Sheet:
i. Book Value: It is the net worth of a company divided by number of
outstanding shares. Net worth is equal to paid-up equity capital plus reserves
and surplus minus losses.
ii. Liquidation Value: Liquidation value is different than a book valuation. In
that it uses the value of the assets at liquidation, which is often less than market
and sometimes book. Liabilities are deducted from the liquidation value of the
assets to determine the liquidation value of the business. Liquidation value can
be used to determine the bare bottom benchmark value of a business.
iii. Replacement Cost: Replacement costs provide an alternative way of
valuing a company’s assets. The replacement, or current, cost of an asset is the
amount of money required to replace the asset by purchasing a similar asset
with identical future service capabilities. In replacement cost, assets and
liabilities are valued at their cost to replace.
Method # 2. Based on Dividends:
i. One Year Holding Period: As per this model, the investor intends to
purchase now, hold it for one year and sell it off at the end of one year. Thus,
the investor would receive dividend of one year as well as the share price at the
end of year one.
To value a stock, we have to first find the present discounted value of the
expected cash flows.
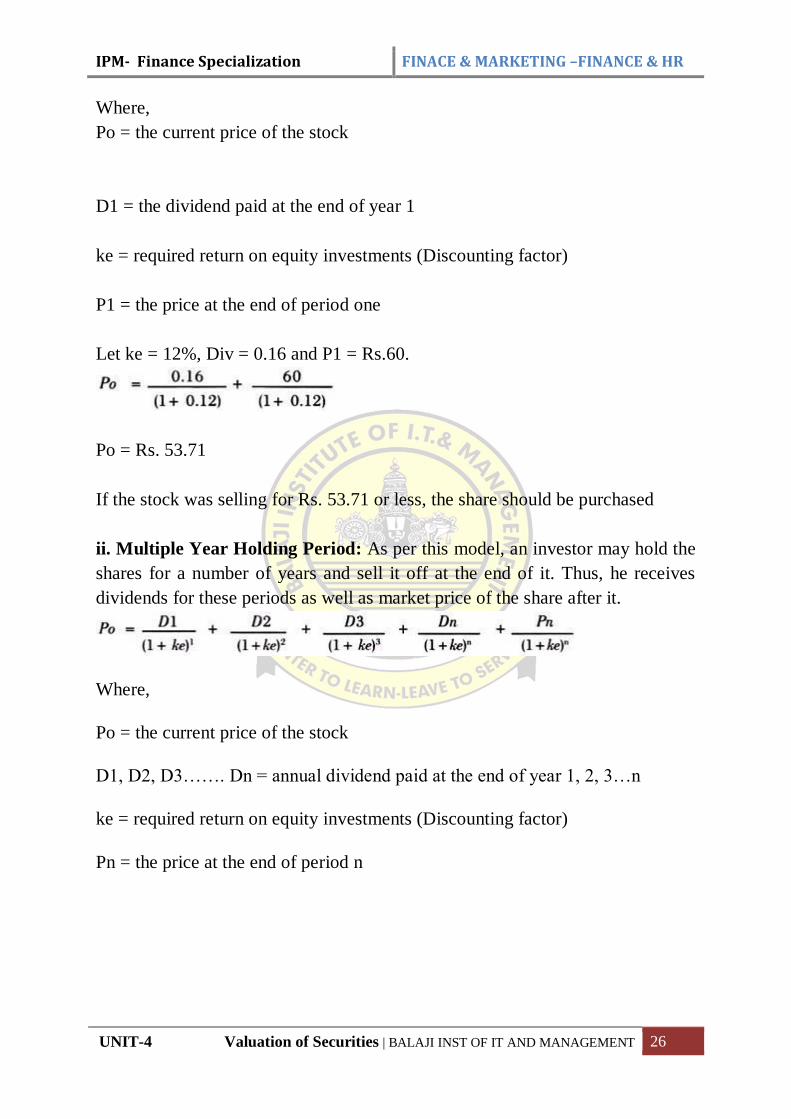
IPM- Finance Specialization FINACE & MARKETING –FINANCE & HR
UNIT-4 Valuation of Securities | BALAJI INST OF IT AND MANAGEMENT 26
Where,
Po = the current price of the stock
D1 = the dividend paid at the end of year 1
ke = required return on equity investments (Discounting factor)
P1 = the price at the end of period one
Let ke = 12%, Div = 0.16 and P1 = Rs.60.
Po = Rs. 53.71
If the stock was selling for Rs. 53.71 or less, the share should be purchased
ii. Multiple Year Holding Period: As per this model, an investor may hold the
shares for a number of years and sell it off at the end of it. Thus, he receives
dividends for these periods as well as market price of the share after it.
Where,
Po = the current price of the stock
D1, D2, D3……. Dn = annual dividend paid at the end of year 1, 2, 3…n
ke = required return on equity investments (Discounting factor)
Pn = the price at the end of period n
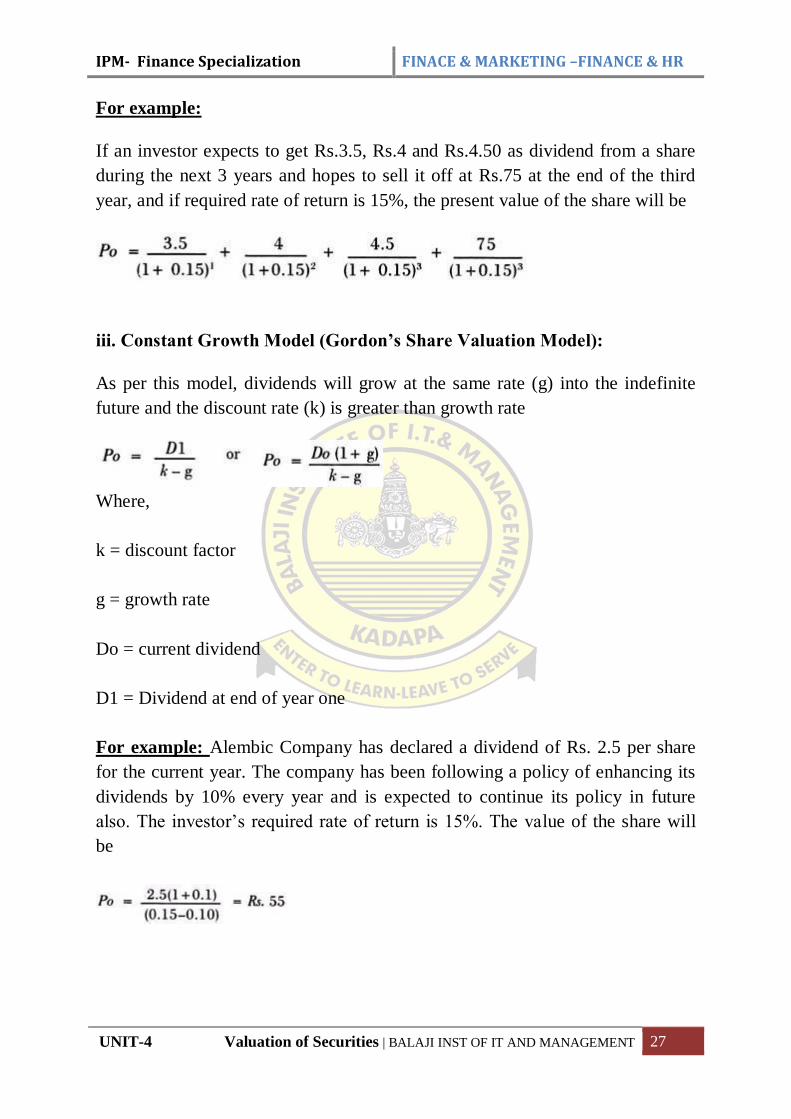
IPM- Finance Specialization FINACE & MARKETING –FINANCE & HR
UNIT-4 Valuation of Securities | BALAJI INST OF IT AND MANAGEMENT 27
For example:
If an investor expects to get Rs.3.5, Rs.4 and Rs.4.50 as dividend from a share
during the next 3 years and hopes to sell it off at Rs.75 at the end of the third
year, and if required rate of return is 15%, the present value of the share will be
iii. Constant Growth Model (Gordon’s Share Valuation Model):
As per this model, dividends will grow at the same rate (g) into the indefinite
future and the discount rate (k) is greater than growth rate
Where,
k = discount factor
g = growth rate
Do = current dividend
D1 = Dividend at end of year one
For example: Alembic Company has declared a dividend of Rs. 2.5 per share
for the current year. The company has been following a policy of enhancing its
dividends by 10% every year and is expected to continue its policy in future
also. The investor’s required rate of return is 15%. The value of the share will
be
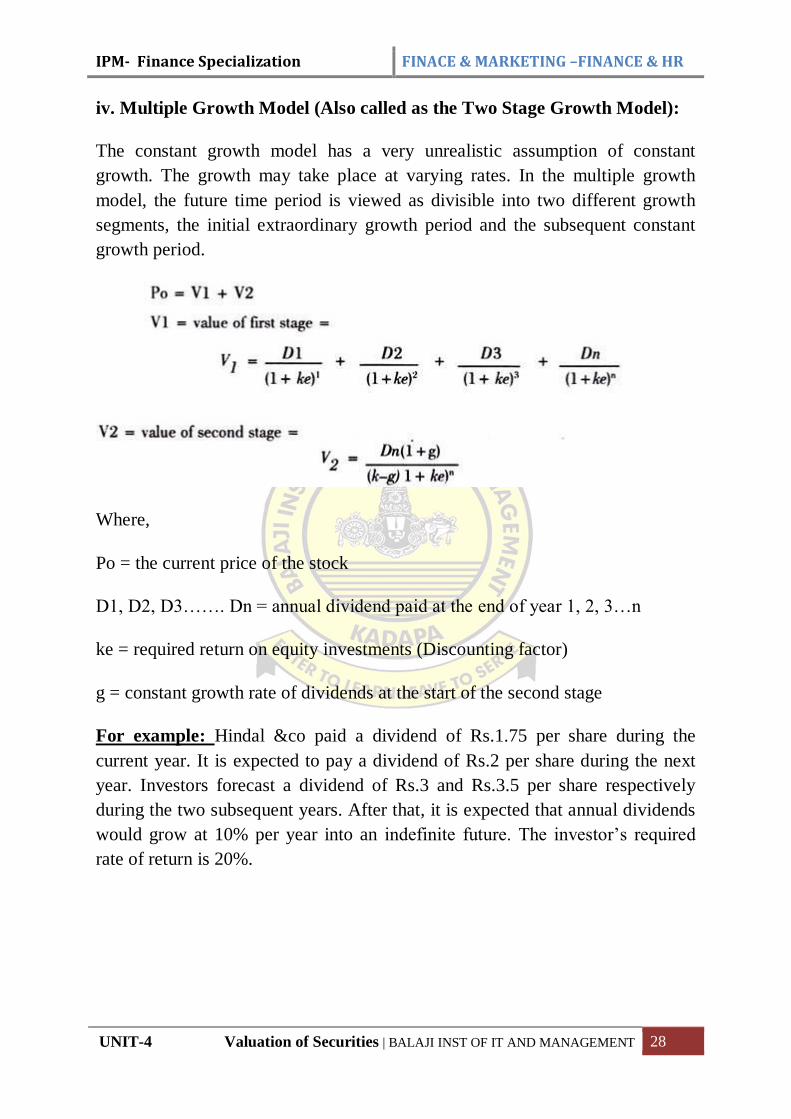
IPM- Finance Specialization FINACE & MARKETING –FINANCE & HR
UNIT-4 Valuation of Securities | BALAJI INST OF IT AND MANAGEMENT 28
iv. Multiple Growth Model (Also called as the Two Stage Growth Model):
The constant growth model has a very unrealistic assumption of constant
growth. The growth may take place at varying rates. In the multiple growth
model, the future time period is viewed as divisible into two different growth
segments, the initial extraordinary growth period and the subsequent constant
growth period.
Where,
Po = the current price of the stock
D1, D2, D3……. Dn = annual dividend paid at the end of year 1, 2, 3…n
ke = required return on equity investments (Discounting factor)
g = constant growth rate of dividends at the start of the second stage
For example: Hindal &co paid a dividend of Rs.1.75 per share during the
current year. It is expected to pay a dividend of Rs.2 per share during the next
year. Investors forecast a dividend of Rs.3 and Rs.3.5 per share respectively
during the two subsequent years. After that, it is expected that annual dividends
would grow at 10% per year into an indefinite future. The investor’s required
rate of return is 20%.
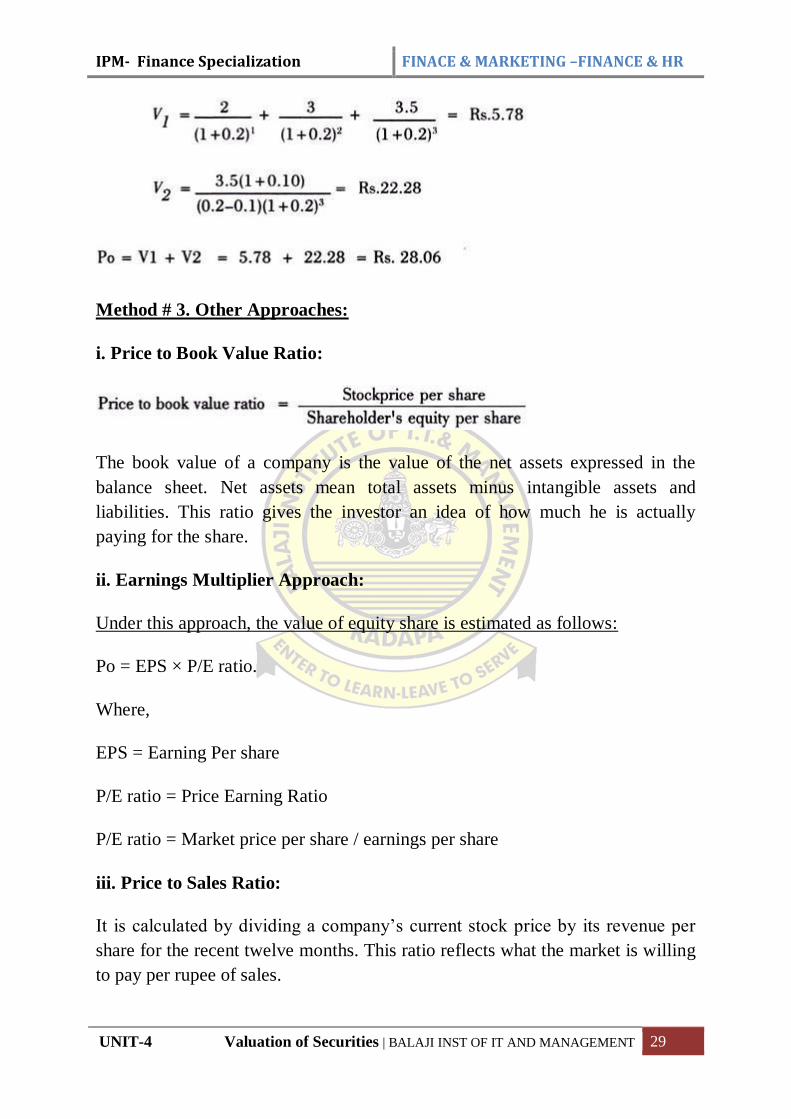
IPM- Finance Specialization FINACE & MARKETING –FINANCE & HR
UNIT-4 Valuation of Securities | BALAJI INST OF IT AND MANAGEMENT 29
Method # 3. Other Approaches:
i. Price to Book Value Ratio:
The book value of a company is the value of the net assets expressed in the
balance sheet. Net assets mean total assets minus intangible assets and
liabilities. This ratio gives the investor an idea of how much he is actually
paying for the share.
ii. Earnings Multiplier Approach:
Under this approach, the value of equity share is estimated as follows:
Po = EPS × P/E ratio.
Where,
EPS = Earning Per share
P/E ratio = Price Earning Ratio
P/E ratio = Market price per share / earnings per share
iii. Price to Sales Ratio:
It is calculated by dividing a company’s current stock price by its revenue per
share for the recent twelve months. This ratio reflects what the market is willing
to pay per rupee of sales.
IPM- Finance Specialization FINACE & MARKETING –FINANCE & HR
UNIT-4 Valuation of Securities | BALAJI INST OF IT AND MANAGEMENT 30
iv. Market Value Method:
This method is used only in case of listed companies, since they have a market
value.
Market value of a company = No. of shares outstanding × market price per
share
UNIT-4 –IMPORTANT QUESTIONS
1) Briefly explain Approaches of valuation
2) Elucidate features and types of Bond valuation
3) Explain types of Preference share Valuation
4) Elucidate features and types of Common (equity) stock Valuation
Problems: Bond, Preference, Common stock Valuation
(17E00312) INVESTMENT AND PORTFOLIO MANAGEMENT
(Elective III)
Objective: The objective of the course is to provide students an understanding of working of capital
markets and management of portfolios of stocks. The pre-requisite for the course is Financial Accounting
and Analysis and Financial Management.
* Standard discounting and statistical tables to be allowed in the examinations.
1. Investment: Introduction to stock markets -objectives, Process of Investment, Investment and
speculation.
2. Fundamental Analysis & Technical Analysis: Framework of Fundamental analysis-Economic
analysis, Industry analysis-Industry Life cycle - Company analysis, Fundamental Analysis Vs
Technical Analysis - Dow Theory.
3. Measurement of Risk and Return: Revenue Return and Capital appreciation, holding period –
Calculation of expected return, Risk factors, risk classification – systematic risk – unsystematic
risk – standard deviation – variance– Beta .
4. Valuation of Securities: Types of Securities - Approaches of valuation – Bond valuation –
Preference share Valuation – Common stock Valuation.
5. Portfolio Management: Process of Portfolio Management, Modern Portfolio – Portfolio models –
Markowitz model – Sharpe single index model, Capital Asset Pricing Models.
Text Books:
Investment Management,V.K.Balla, S.Chand Company Ltd
Security Analysis and Portfolio Management ,Punithavathy Pandian, Vikas
References:
Investment Analysis and portfolio management, Chandra, Tata McGraw Hill .
Secuerity Analysis Portfolio Management, Ranganatham&Madhumathi, Pearson
Education.
Security Analysis and Portfolio Management, Sudhindra Bhat, excel.
Security analysis and portfolio management, Avadani, Himalaya publishers.
Investment analysis portfolio management, Frank Reilly & Brown, Cengage.
Investment Management, Preethi Singh, Himalaya Publishing House, Mumbai..
Investment, Bodie, McGraw Hill Book Company.
Investment Management ,Hiriyappa ,New Age Publications
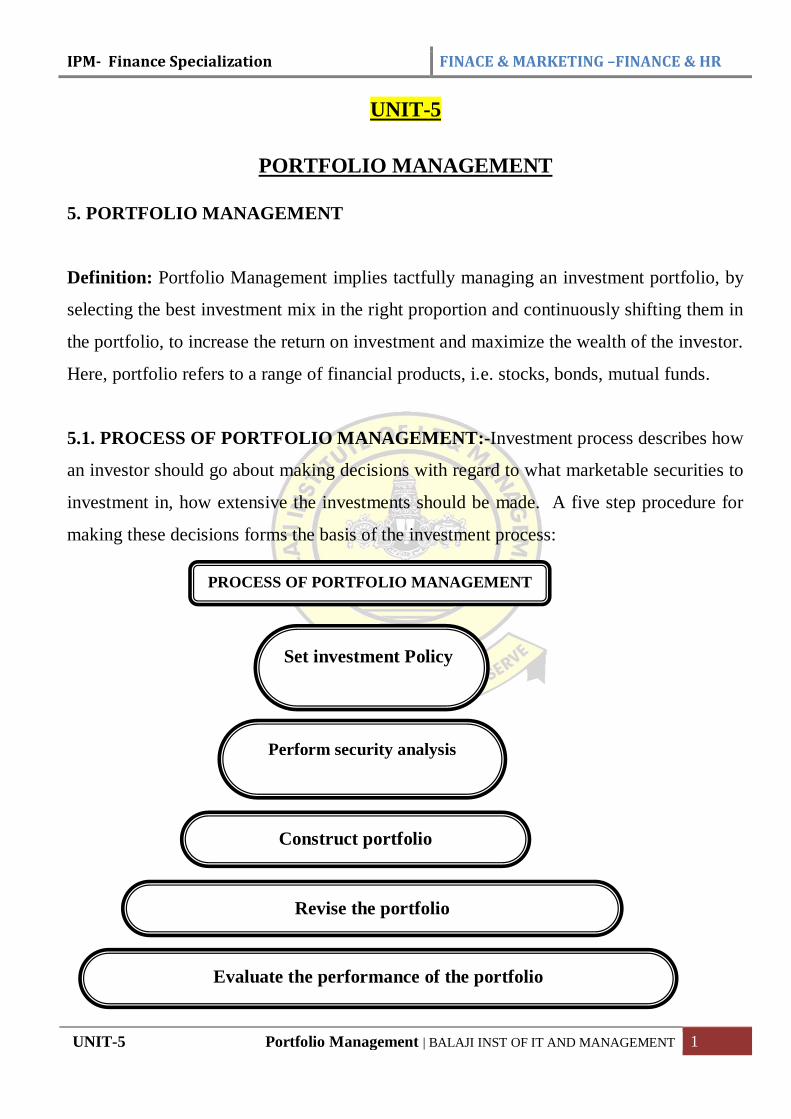
IPM- Finance Specialization FINACE & MARKETING –FINANCE & HR
UNIT-5 Portfolio Management | BALAJI INST OF IT AND MANAGEMENT 1
UNIT-5
PORTFOLIO MANAGEMENT
5. PORTFOLIO MANAGEMENT
Definition: Portfolio Management implies tactfully managing an investment portfolio, by
selecting the best investment mix in the right proportion and continuously shifting them in
the portfolio, to increase the return on investment and maximize the wealth of the investor.
Here, portfolio refers to a range of financial products, i.e. stocks, bonds, mutual funds.
5.1. PROCESS OF PORTFOLIO MANAGEMENT:-Investment process describes how
an investor should go about making decisions with regard to what marketable securities to
investment in, how extensive the investments should be made. A five step procedure for
making these decisions forms the basis of the investment process:
PROCESS OF PORTFOLIO MANAGEMENT
Set investment Policy
Perform security analysis
Construct portfolio
Revise the portfolio
Evaluate the performance of the portfolio
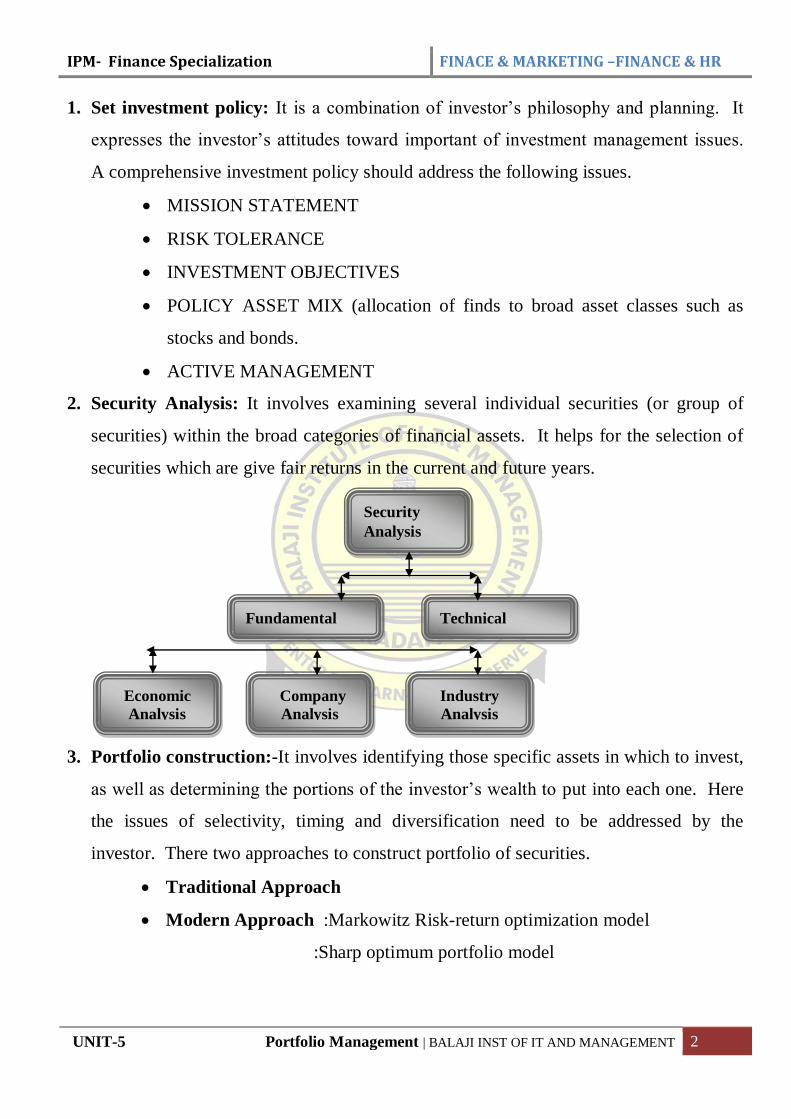
IPM- Finance Specialization FINACE & MARKETING –FINANCE & HR
UNIT-5 Portfolio Management | BALAJI INST OF IT AND MANAGEMENT 2
1. Set investment policy: It is a combination of investor’s philosophy and planning. It
expresses the investor’s attitudes toward important of investment management issues.
A comprehensive investment policy should address the following issues.
MISSION STATEMENT
RISK TOLERANCE
INVESTMENT OBJECTIVES
POLICY ASSET MIX (allocation of finds to broad asset classes such as
stocks and bonds.
ACTIVE MANAGEMENT
2. Security Analysis: It involves examining several individual securities (or group of
securities) within the broad categories of financial assets. It helps for the selection of
securities which are give fair returns in the current and future years.
3. Portfolio construction:-It involves identifying those specific assets in which to invest,
as well as determining the portions of the investor’s wealth to put into each one. Here
the issues of selectivity, timing and diversification need to be addressed by the
investor. There two approaches to construct portfolio of securities.
Traditional Approach
Modern Approach :Markowitz Risk-return optimization model
:Sharp optimum portfolio model
Company
Analysis
Security
Analysis
Fundamental Technical
Economic
Analysis
Industry
Analysis
IPM- Finance Specialization FINACE & MARKETING –FINANCE & HR
UNIT-5 Portfolio Management | BALAJI INST OF IT AND MANAGEMENT 3
4. Portfolio Revision:-It helps for liquidating the unattractive securities and acquiring the
new stars from the market. It involves periodic repetition of the previous three steps of
the investment policy by setting new investment policy, security analysis afresh, and
reallocation of cash for the new portfolio.
Formula Plans are to ease the problem of timing and minimize the emotions
involved in investment.
1. To minimize loss but not to increase profits.
2. In formula plans the portfolio investment involve two types
Aggressive Portfolio
Conservative Portfolio
3. Formula plans classified into four types.
Constant Rupee Plan
Constant Ratio Plan
Variable Ratio Plan
Rupee Cost Averaging Plan
5. Portfolio Performance Evaluation:-It involves determining periodically how the
portfolio performed, in terms returns earned and the risk experienced by the investor. For
this the investor need to select appropriate benchmark.
The following techniques are used for measuring the performance of the portfolio.
Sharpe’s Performance Measure
Treynor’s Performance Measure
Jensen’s Performance Measure
5.1.1 SCOPE OF PORTFOLIO MANAGEMENT
1) Monitoring the performance of portfolio by incorporating the latest market
conditions.
2) Identification of the investor’s objective, constraints and preferences.
3) Making an evaluation of portfolio income (comparison with targets and
achievement).

IPM- Finance Specialization FINACE & MARKETING –FINANCE & HR
UNIT-5 Portfolio Management | BALAJI INST OF IT AND MANAGEMENT 4
4) Making revision in the portfolio.
5) Implementation of the strategies in tune with investment objectives.
5.1.2 BENEFITS OF PORTFOLIO MANAGEMENT
1) Increased decision making transparency through a more consistent evaluation of all
business units and options.
2) A consistent approach to risk measurement.
3) A systematic way of including different views of risk in decision making process.
4) A clear enhancement to the due diligence process.
5) Better understanding of value creation among new investment opportunities.
6) Consideration of the correlation and diversification effects of the organization’s
different businesses and investment options.
7) Guidance for strategic planning (e.g. identification of where the company needs to
move to improve
8) its risk-return position).
9) Consideration of qualitative and non-financial implications. These benefits can
easily be recognized across most organizations, regardless of size or industry.
5.2. MODERN PORTFOLIO (MPT)
MPT - Modern Portfolio Theory - represents the mathematical formulation of risk
diversification in investing, that aims at selecting a group of investment assets which have
collectively lower risk than any single asset on its own. This becomes possible, since
various asset types frequently change in value in opposite directions. Actually investing,
being a tradeoff between risk and return, presupposes that risky assets have the highest
expected returns.
Thus, MPT shows how to choose a portfolio with the maximum possible expected return
for the given amount of risk. It also describes how to choose a portfolio with the minimum
IPM- Finance Specialization FINACE & MARKETING –FINANCE & HR
UNIT-5 Portfolio Management | BALAJI INST OF IT AND MANAGEMENT 5
possible risk for the given expected return. Therefore, Modern Portfolio Theory is viewed
as a form of diversification which explains the way of finding the best possible
diversification strategy.
5.2.1 MODERN PORTFOLIO (MPT) ASSUMPTIONS
Modern Portfolio Theory relies on the following assumptions and fundamentals that are
the key concepts upon which it has been constructed:
For buying and selling securities there are no transaction costs. There is no spread
between bidding and asking prices. No tax is paid, its only risk that plays a part in
determining which securities an investor will buy.
An investor has a chance to take any position of any size and in any security. The
market liquidity is infinite and no one can move the market. So that nothing can
stop the investor from taking positions of any size in any security.
While making investment decisions the investor does not consider taxes and is
indifferent towards receiving dividends or capital gains.
Investors are generally rational and risk adverse. They are completely aware of all
the risk contained in investment and actually take positions based on the risk
determination demanding a higher return for accepting greater volatility.
The risk-return relationships are viewed over the same time horizon. Both long term
speculator and short term speculator share the same motivations, profit target and
time horizon.
Investors share identical views on risk measurement. All the investors are provided
by information and their sale or purchase depends on an identical assessment of the
investment and all have the same expectations from the investment. A seller will be
motivated to make a sale only because another security has a level of volatility that
corresponds to his desired return. A buyer will buy because this security has a level
of risk that corresponds to the return he wants.
Investors seek to control risk only by the diversification of their holdings.
In the market all assets can be bought and sold including human capital.
IPM- Finance Specialization FINACE & MARKETING –FINANCE & HR
UNIT-5 Portfolio Management | BALAJI INST OF IT AND MANAGEMENT 6
Politics and investor psychology have no influence on market.
The risk of portfolio depends directly on the instability of returns from the given
portfolio.
An investor gives preference to the increase of utilization.
An investor either maximizes his return for the minimum risk or maximizes his
portfolio return for a given level of risk.
Analysis is based on a single period model of investment.
5.2.2 Choosing the Best Portfolio
Two essential decisions are necessary to be made to choose the best portfolio from a
number of possible portfolios, each with its risk and return opportunities:
1. Determine a set of efficient portfolios.
2. Select the best portfolio out of the efficient set.
Being an important achievement in the financial sphere, the theory has found ground in
other fields as well. In 1970s, it was widely applied in the area of regional sciences to
derive the relationship between variability and economic growth. Similarly it has been
used in the field of social psychology to form the self-concept. Currently, it is used by
experts to model project portfolios of both financial and non-financial instruments.
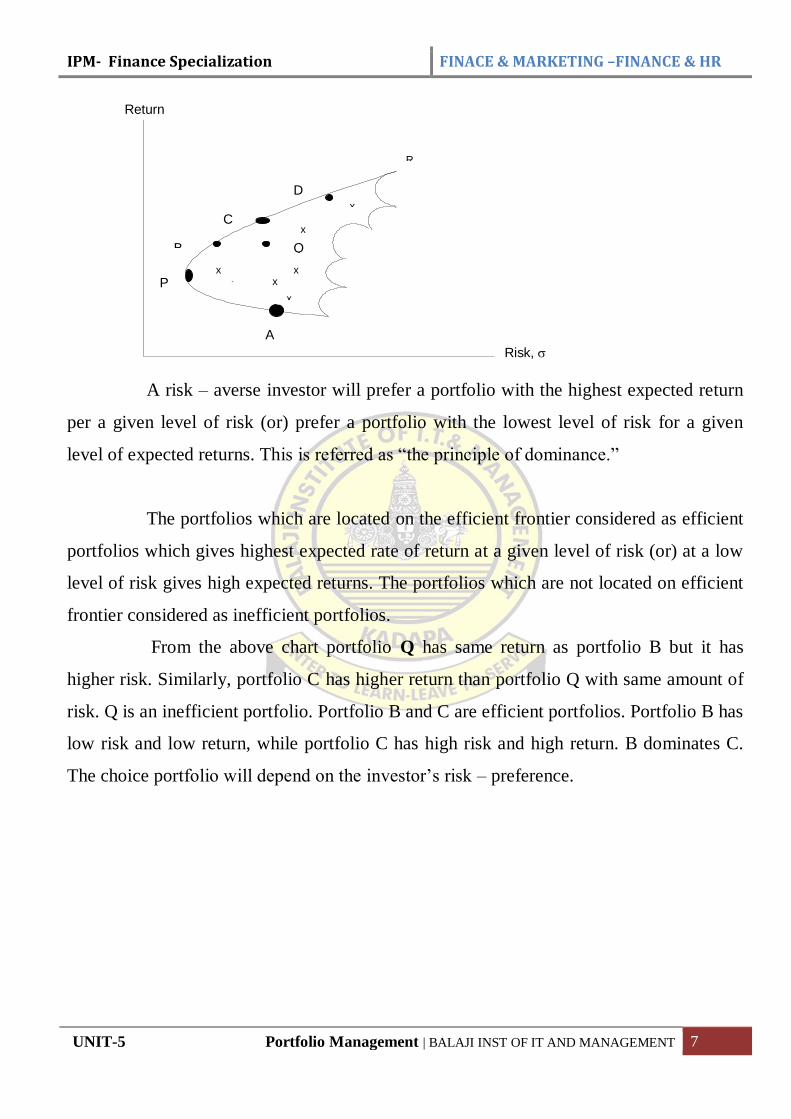
IPM- Finance Specialization FINACE & MARKETING –FINANCE & HR
UNIT-5 Portfolio Management | BALAJI INST OF IT AND MANAGEMENT 7
A risk – averse investor will prefer a portfolio with the highest expected return
per a given level of risk (or) prefer a portfolio with the lowest level of risk for a given
level of expected returns. This is referred as “the principle of dominance.”
The portfolios which are located on the efficient frontier considered as efficient
portfolios which gives highest expected rate of return at a given level of risk (or) at a low
level of risk gives high expected returns. The portfolios which are not located on efficient
frontier considered as inefficient portfolios.
From the above chart portfolio Q has same return as portfolio B but it has
higher risk. Similarly, portfolio C has higher return than portfolio Q with same amount of
risk. Q is an inefficient portfolio. Portfolio B and C are efficient portfolios. Portfolio B has
low risk and low return, while portfolio C has high risk and high return. B dominates C.
The choice portfolio will depend on the investor’s risk – preference.
Risk,
Return
A
P
Q B
C
D
x x
x x
x
x
x
R
IPM- Finance Specialization FINACE & MARKETING –FINANCE & HR
UNIT-5 Portfolio Management | BALAJI INST OF IT AND MANAGEMENT 8
5.3 PORTFOLIO MODELS
Portfolio models
Markowitz model Sharpe single index model
THE HARRY MARKOWITZ MODEL
Markowitz Portfolio Theory (MPT), a hypothesis put forth by Harry Markowitz in his
paper "Portfolio Selection," (published in 1952 by the Journal of Finance) is an investment
theory based on the idea that risk-averse investors can construct portfolios to optimize or
maximize expected return based on a given level of market risk, emphasizing that risk is
an inherent part of higher reward. It is one of the most important and influential economic
theories dealing with finance and investment.
Harry Markowitz model (HM model), also known as Mean-Variance Model because it
is based on the expected returns (mean) and the standard deviation (variance) of different
portfolios, helps to make the most efficient selection by analyzing various portfolios of the
given assets. It shows investors how to reduce their risk in case they have chosen assets
not “moving” together.
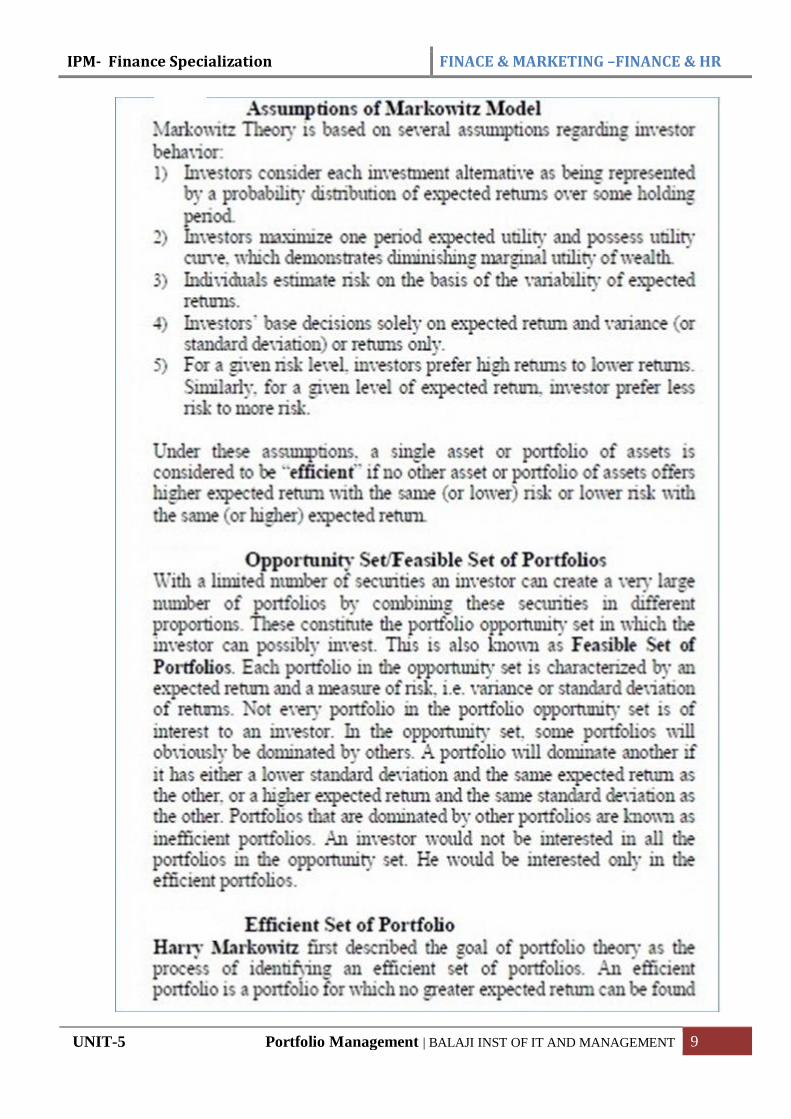
IPM- Finance Specialization FINACE & MARKETING –FINANCE & HR
UNIT-5 Portfolio Management | BALAJI INST OF IT AND MANAGEMENT 9
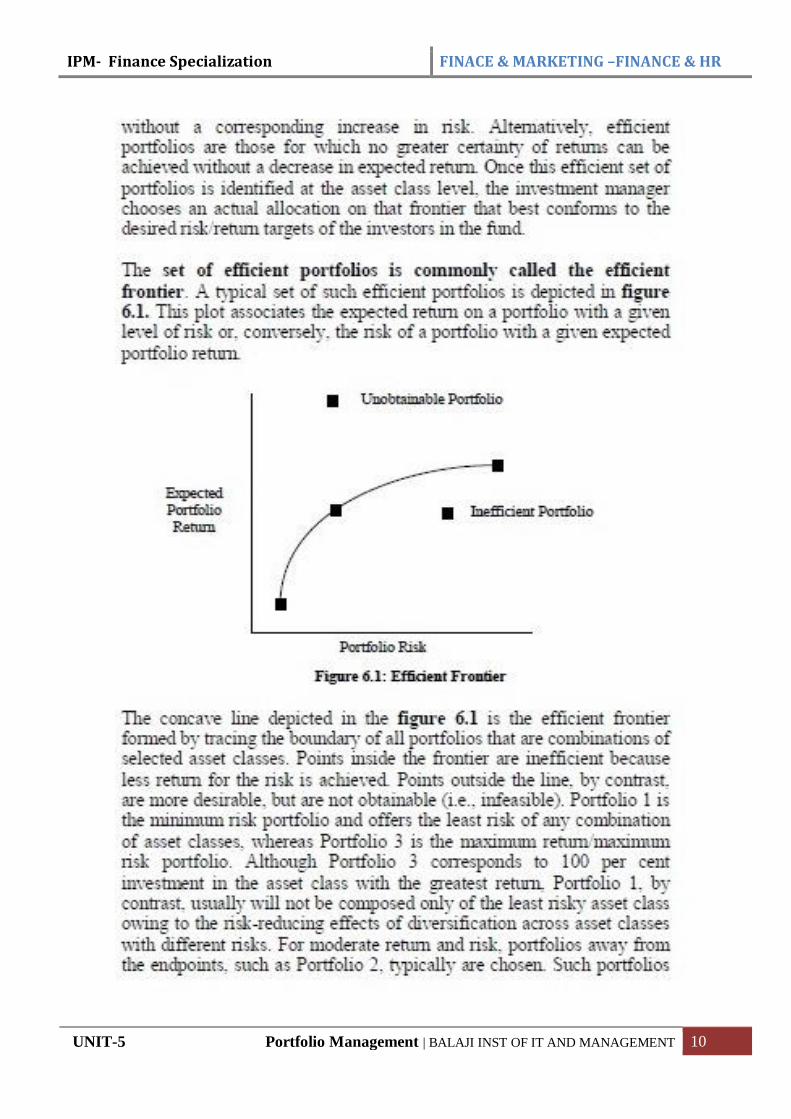
IPM- Finance Specialization FINACE & MARKETING –FINANCE & HR
UNIT-5 Portfolio Management | BALAJI INST OF IT AND MANAGEMENT 10
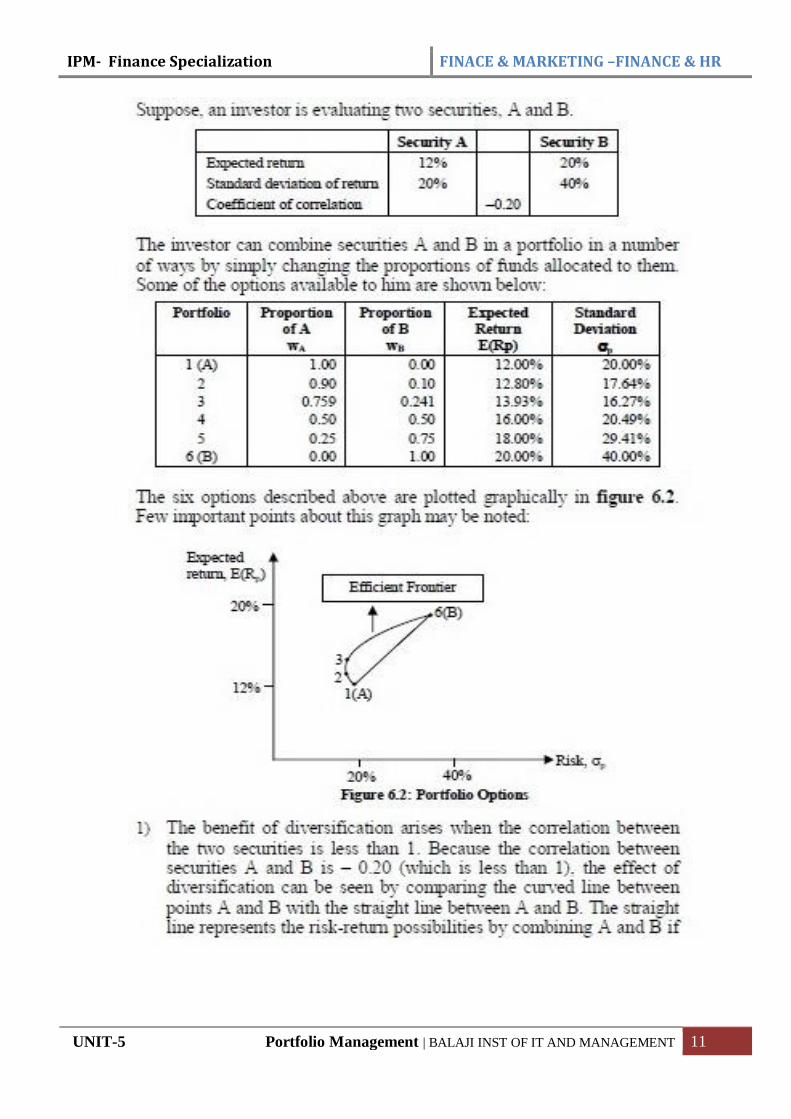
IPM- Finance Specialization FINACE & MARKETING –FINANCE & HR
UNIT-5 Portfolio Management | BALAJI INST OF IT AND MANAGEMENT 11
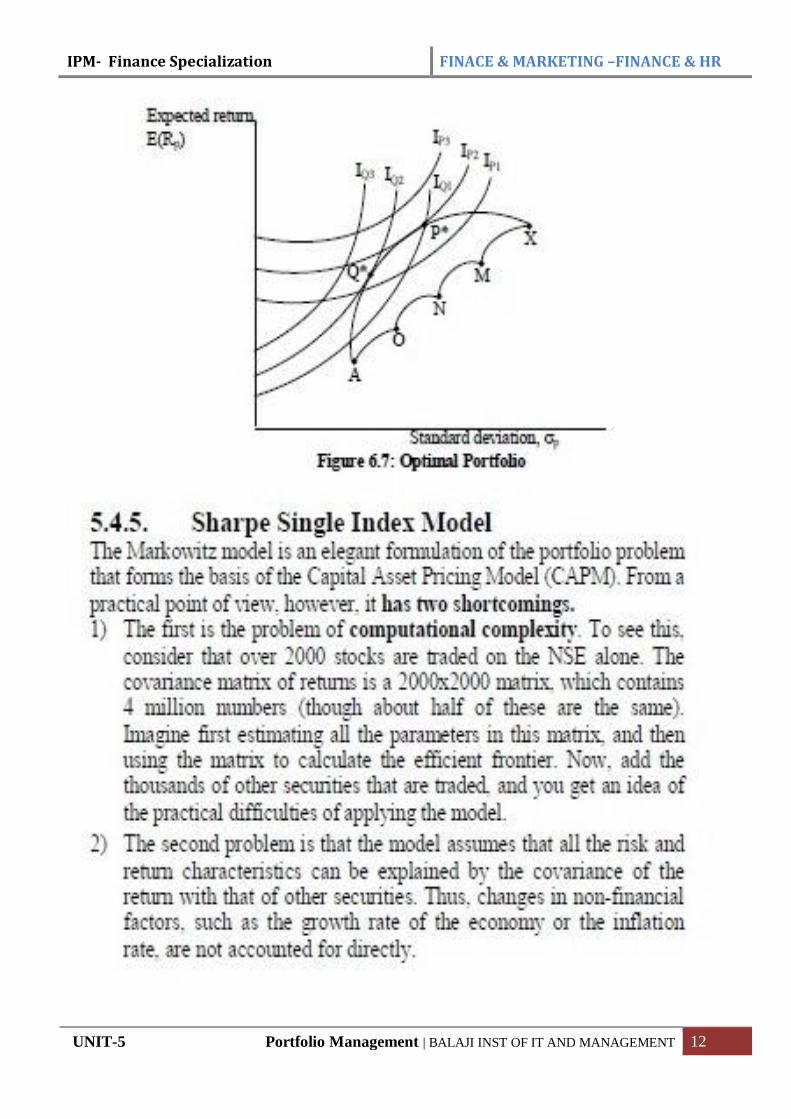
IPM- Finance Specialization FINACE & MARKETING –FINANCE & HR
UNIT-5 Portfolio Management | BALAJI INST OF IT AND MANAGEMENT 12
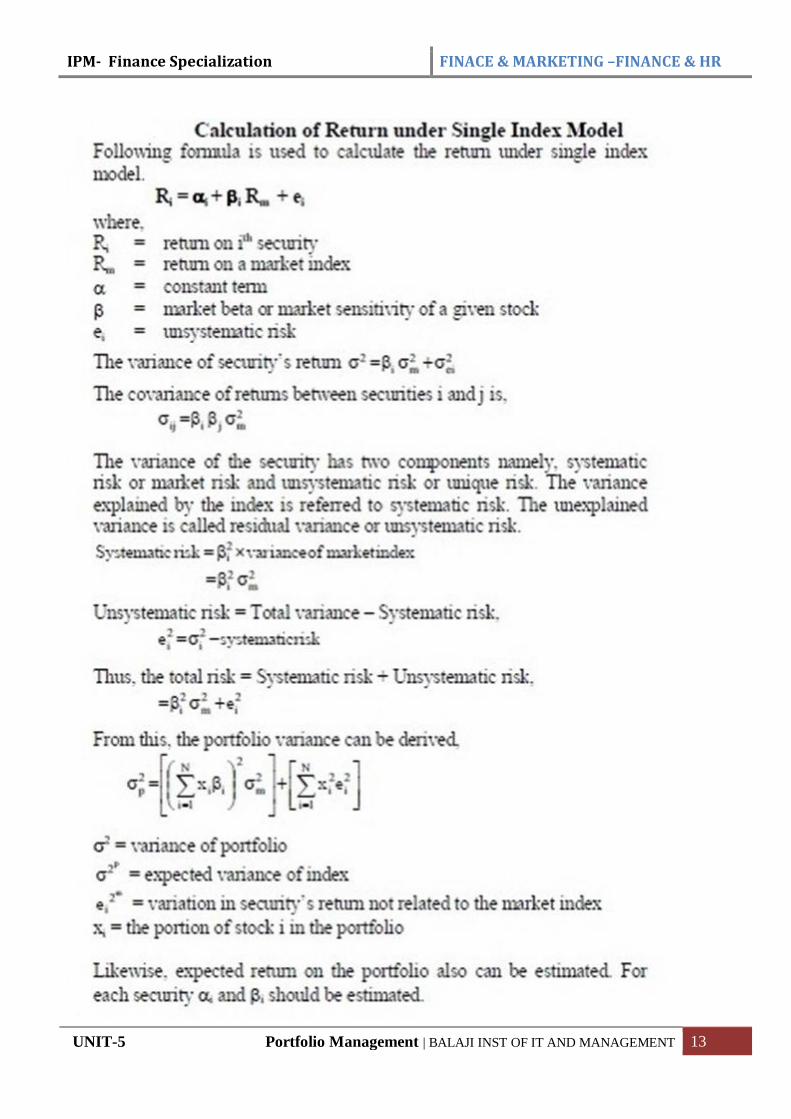
IPM- Finance Specialization FINACE & MARKETING –FINANCE & HR
UNIT-5 Portfolio Management | BALAJI INST OF IT AND MANAGEMENT 13
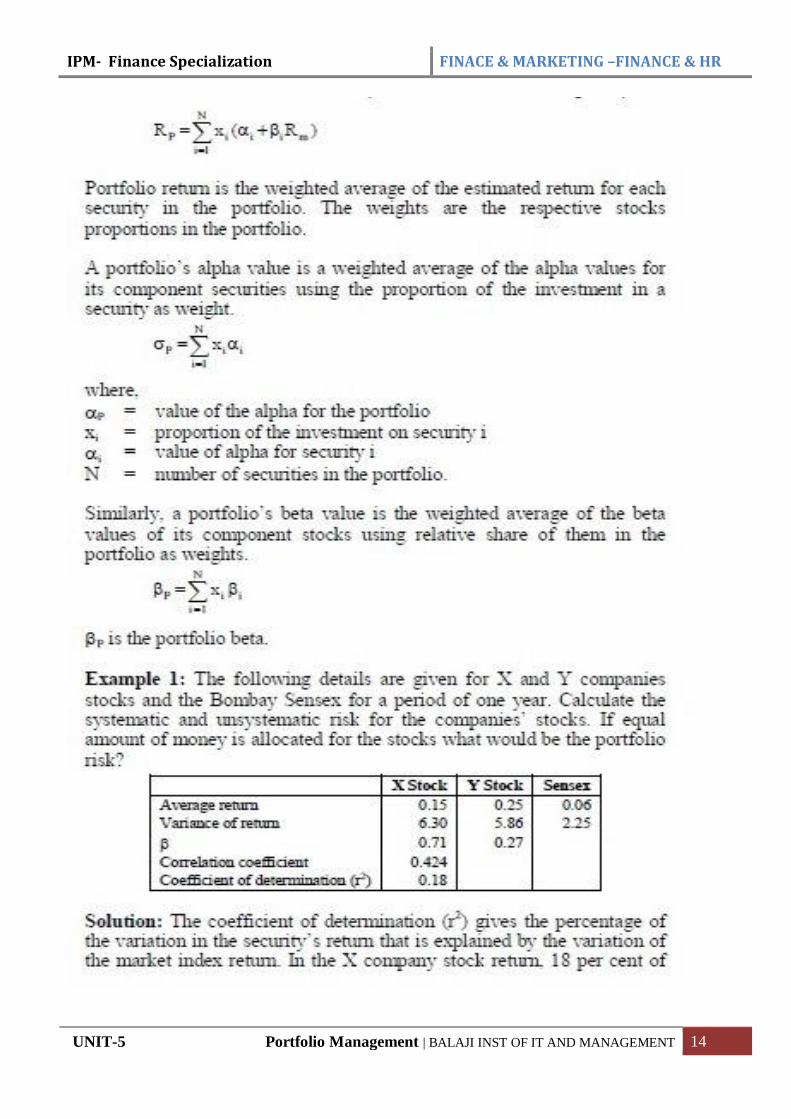
IPM- Finance Specialization FINACE & MARKETING –FINANCE & HR
UNIT-5 Portfolio Management | BALAJI INST OF IT AND MANAGEMENT 14
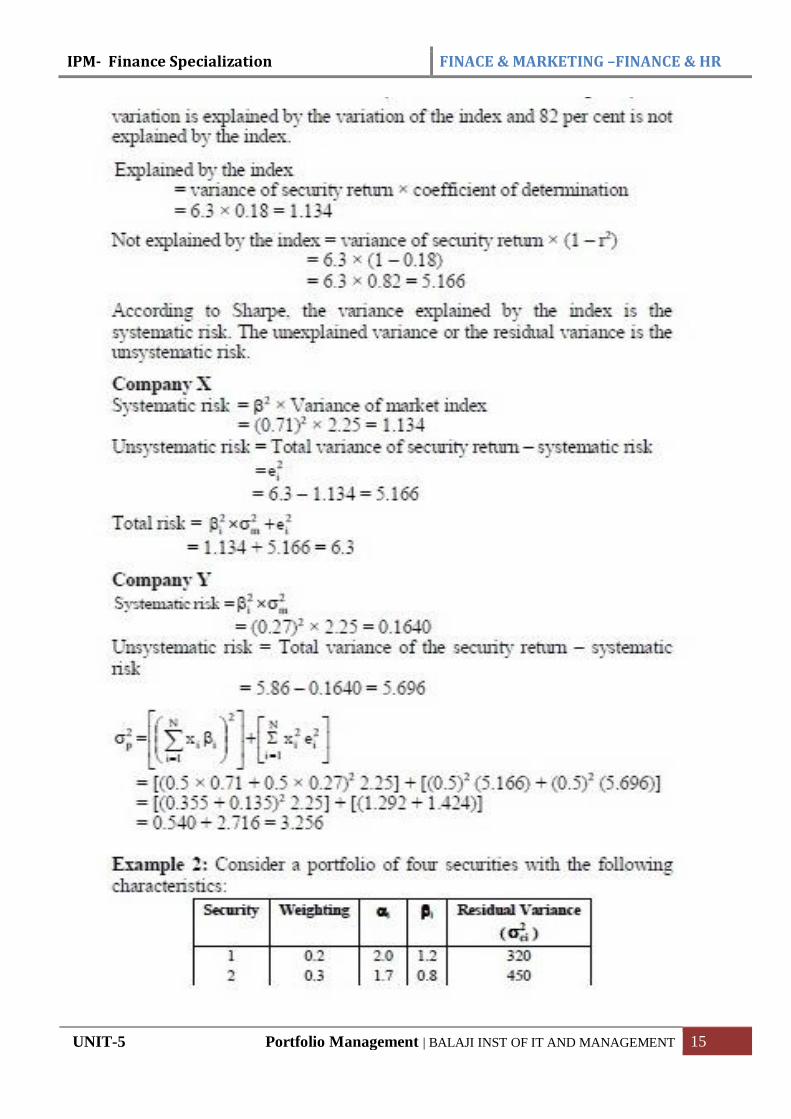
IPM- Finance Specialization FINACE & MARKETING –FINANCE & HR
UNIT-5 Portfolio Management | BALAJI INST OF IT AND MANAGEMENT 15
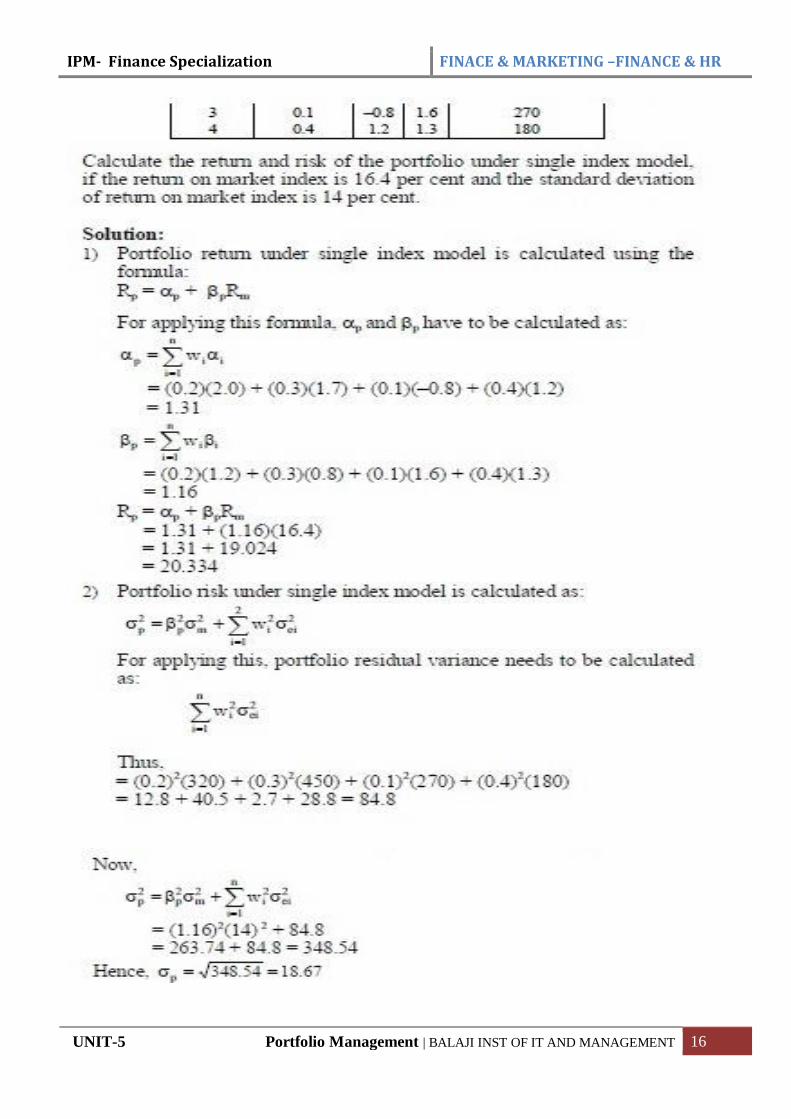
IPM- Finance Specialization FINACE & MARKETING –FINANCE & HR
UNIT-5 Portfolio Management | BALAJI INST OF IT AND MANAGEMENT 16
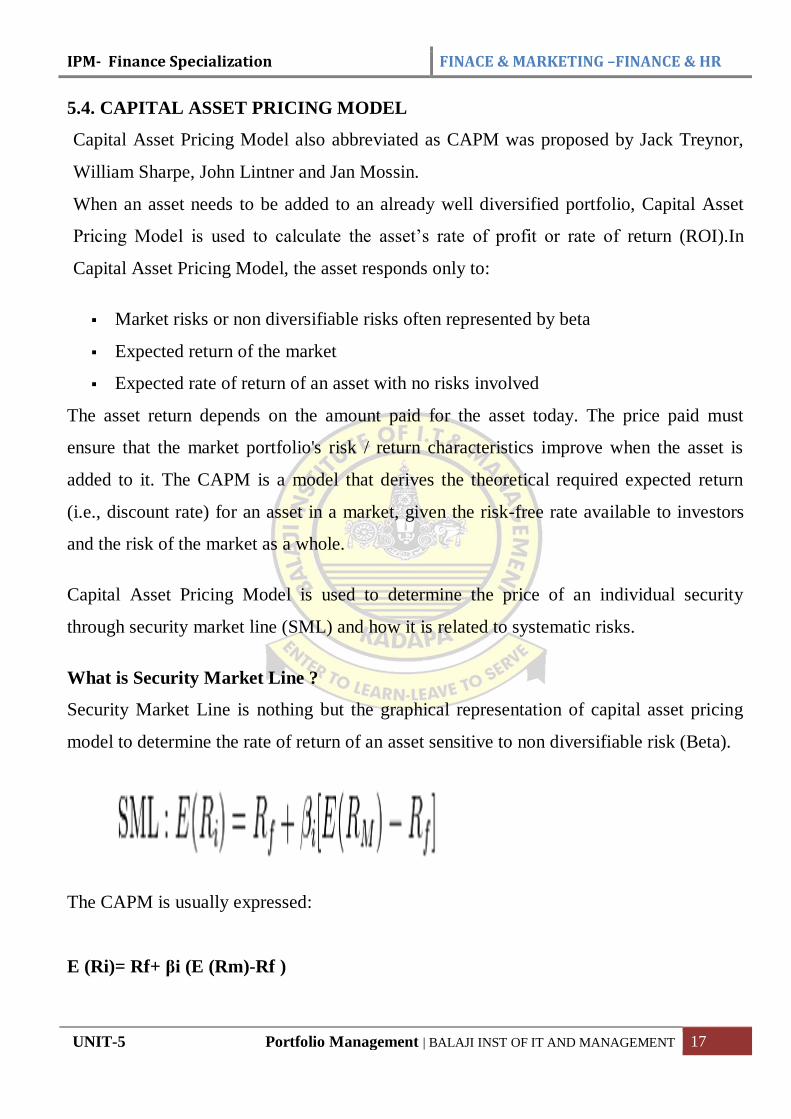
IPM- Finance Specialization FINACE & MARKETING –FINANCE & HR
UNIT-5 Portfolio Management | BALAJI INST OF IT AND MANAGEMENT 17
5.4. CAPITAL ASSET PRICING MODEL
Capital Asset Pricing Model also abbreviated as CAPM was proposed by Jack Treynor,
William Sharpe, John Lintner and Jan Mossin.
When an asset needs to be added to an already well diversified portfolio, Capital Asset
Pricing Model is used to calculate the asset’s rate of profit or rate of return (ROI).In
Capital Asset Pricing Model, the asset responds only to:
Market risks or non diversifiable risks often represented by beta
Expected return of the market
Expected rate of return of an asset with no risks involved
The asset return depends on the amount paid for the asset today. The price paid must
ensure that the market portfolio's risk / return characteristics improve when the asset is
added to it. The CAPM is a model that derives the theoretical required expected return
(i.e., discount rate) for an asset in a market, given the risk-free rate available to investors
and the risk of the market as a whole.
Capital Asset Pricing Model is used to determine the price of an individual security
through security market line (SML) and how it is related to systematic risks.
What is Security Market Line ?
Security Market Line is nothing but the graphical representation of capital asset pricing
model to determine the rate of return of an asset sensitive to non diversifiable risk (Beta).
The CAPM is usually expressed:
E (Ri)= Rf+ βi (E (Rm)-Rf )
IPM- Finance Specialization FINACE & MARKETING –FINANCE & HR
UNIT-5 Portfolio Management | BALAJI INST OF IT AND MANAGEMENT 18
β, Beta, is the measure of asset sensitivity to a movement in the overall market; Beta is
usually found via regression on historical data. Betas exceeding one signify more than
average "riskiness" in the sense of the asset's contribution to overall portfolio risk; betas
below one indicate a lower than average risk contribution.
( E ( R m ) − R f ) is the market premium, the expected excess return of the market
portfolio's expected return over the risk-free rate.

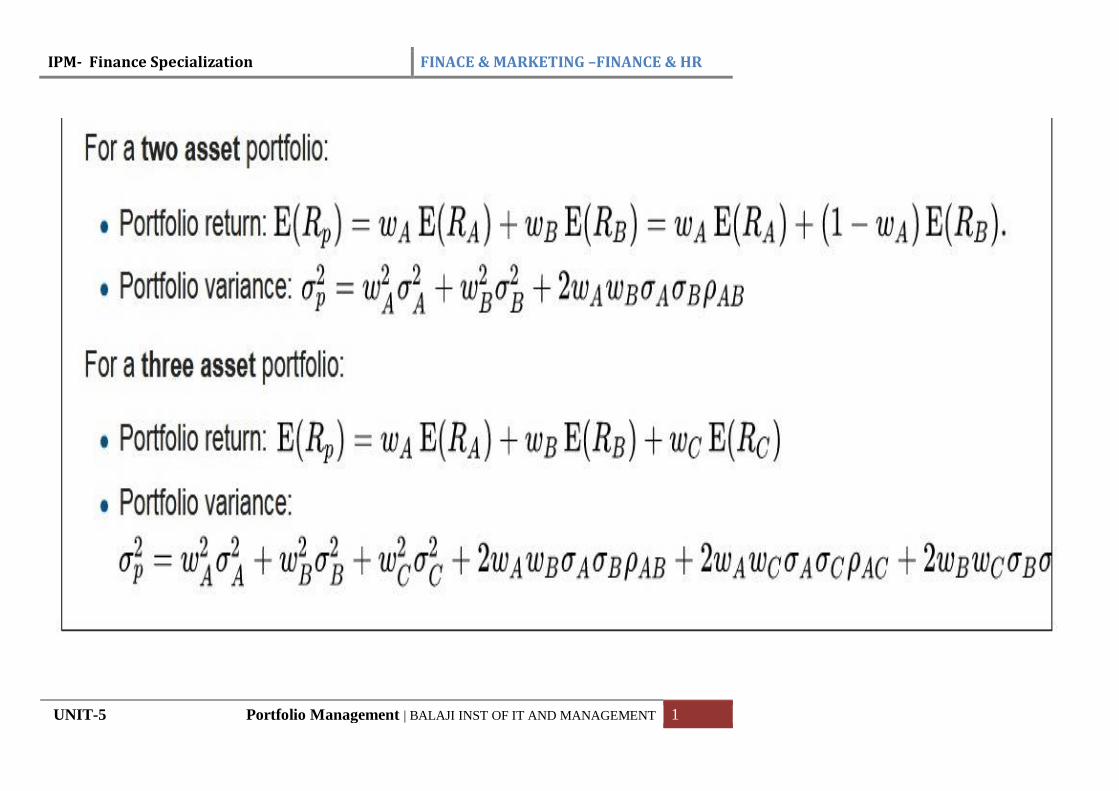
IPM- Finance Specialization FINACE & MARKETING –FINANCE & HR
UNIT-5 Portfolio Management | BALAJI INST OF IT AND MANAGEMENT 1

UNIT-5-IMPORTANT QUESTIONS
1) Explain the Process of Portfolio Management,
2) Briefly write about Modern Portfolio (Markowitz model & Sharpe single index model)
3) What is CAPM? Detail note on Capital Asset Pricing Models
Problems: Sharpe single index model.