Embed Size (px)
DESCRIPTION
BakerHughes
Citation preview
Feasibility of CO2
Flooding Higher Viscosity Oils, Field Results, and Screening
Presented by:Richard Baker,December 7, 2012
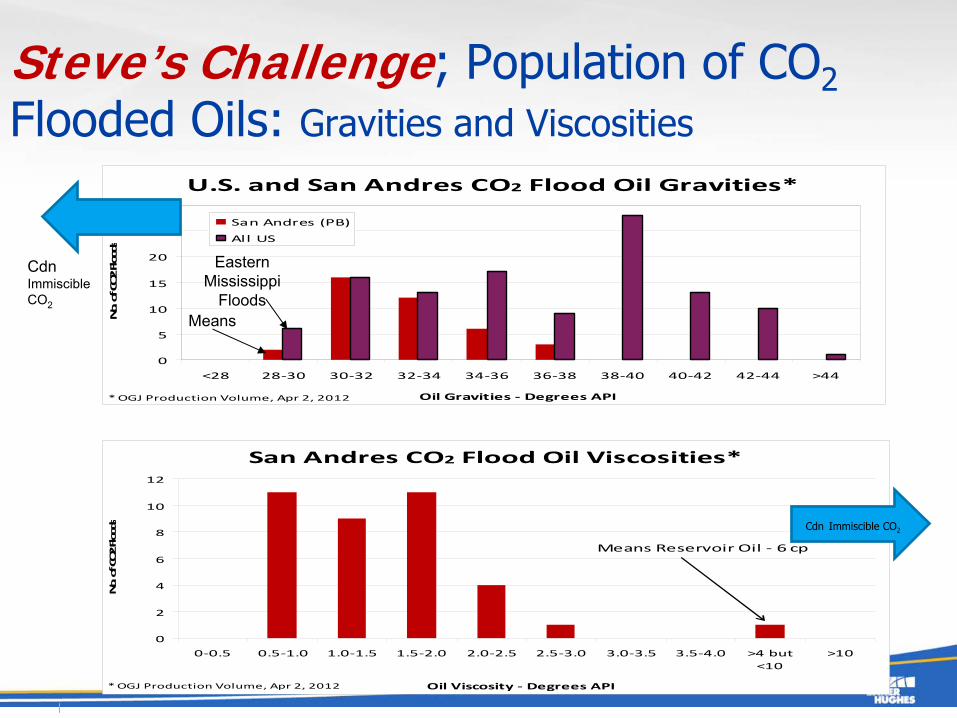
Steve’s Challenge; Population of CO2 Flooded Oils: Gravities and Viscosities
San Andres CO2 Flood Oil Viscosities*
0
2
4
6
8
10
12
0‐0.5 0.5‐1.0 1.0‐1.5 1.5‐2.0 2.0‐2.5 2.5‐3.0 3.0‐3.5 3.5‐4.0 >4 but<10
>10
Oil Viscosity ‐ Degrees API
No. of CO2 Floods
* OGJ Production Volume, Apr 2, 2012
Means Reservoir Oil ‐ 6 cp
U.S. and San Andres CO2 Flood Oil Gravities*
0
5
10
15
20
25
30
<28 28‐30 30‐32 32‐34 34‐36 36‐38 38‐40 40‐42 42‐44 >44
Oil Gravities ‐ Degrees API
No. of CO2 Floods
San Andres (PB)
All US
* OGJ Production Volume, Apr 2, 2012
Means
Eastern Mississippi
Floods
Cdn
Immiscible CO2
CdnImmiscible CO2

Organization of Immiscible CO2 Talk
•Executive Summary•Summary of Field experience in immiscible floods
√
California (Wilmington)
–
Arkansas (Lick Creek)–
Trinidad
–
Malaysia–
Turkey
√
Canada (Retlaw)
•Screening Criteria

Executive Summary
Limited immiscible pilots in literature show the promise immiscible CO2
floodingLaboratory work seems to show promise of improved recovery
(∆RF=6-15%OOIP)Review of Old CO2
Pilot Project in Canada shows good responseRough simulation @μoil
= 30cP (∆RFCO2-wtrfld
=7%OOIP)@μoil
= 20cP (∆RFCO2-wtrfld
=16%OOIP)@μoil
= 5cP (∆RFCO2-wtrfld
~+20%OOIP)
Criteria;
Oil saturation SO current
>50%
Successful waterflood; volumetric sweep Evol
>50%
Biggest hurdle; Inexpensive CO2
corrosion hurdle existing pipe systems +CTP
API gravity 15-25API Insitu viscosity= 10- 1000cP

Why Medium Grade Oil Pools? 20-25 API, oil viscosity 10-1000cP, CRF>20%
√
In excellent quality reservoirs, predictable and well understood water flood development
√
High permeability and porosity√
High oil saturation
√
Thin (3-5m), but good continuity

Map of Alberta Pools 20 -25 API
As well as Sask. side
~8 Bbbl

USA Target
©
2009 Baker Hughes Incorporated. All Rights Reserved.7
Heavy oil fields

OLD IMMISCIBLE CO2 PILOTS
©
2009 Baker Hughes Incorporated. All Rights Reserved.8

Summary of Field Experience in Immiscible Floods
Wilmington Calif. USALick Creek Arkansas USATrinidadMalaysia

CO2
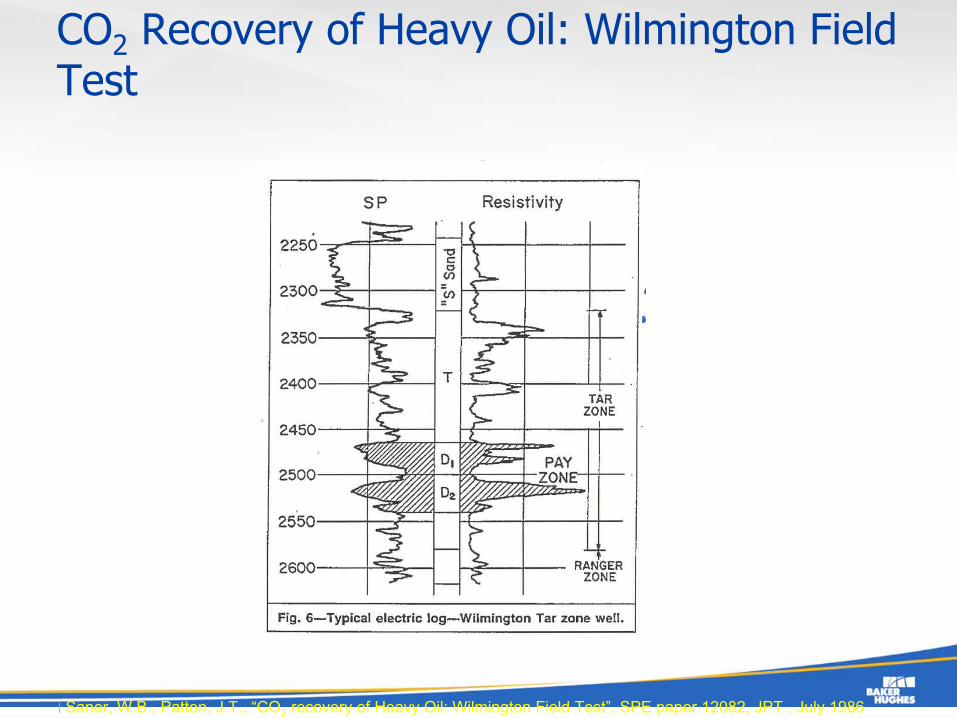
Recovery of Heavy Oil: Wilmington Field Test
Saner, W.B., Patton, J.T., “CO2
recovery of Heavy Oil: Wilmington Field Test”, SPE paper 12082, JPT , July 1986
CO2
Recovery of Heavy Oil: Wilmington Field Test
Saner, W.B., Patton, J.T., “CO2
recovery of Heavy Oil: Wilmington Field Test”, SPE paper 12082, JPT , July 1986

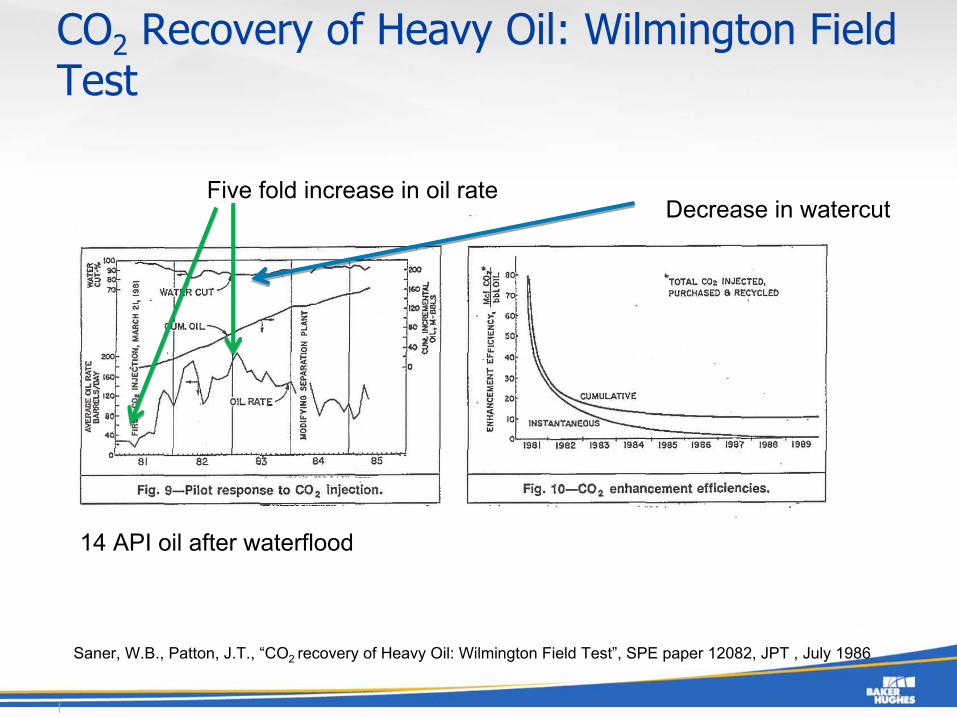
CO2
Recovery of Heavy Oil: Wilmington Field Test
Saner, W.B., Patton, J.T., “CO2
recovery of Heavy Oil: Wilmington Field Test”, SPE paper 12082, JPT , July 1986
CO2
Recovery of Heavy Oil: Wilmington Field Test
Saner, W.B., Patton, J.T., “CO2 recovery of Heavy Oil: Wilmington Field Test”, SPE paper 12082, JPT , July 1986
14 API oil after waterflood
Five fold increase in oil rateDecrease in watercut

Wilmington Field
•“Actually, CO2
displacement of viscous crude is not as efficient as the miscible displacement lighter crude.”
• “ However, the difference in efficiency is more than offset by the generous oil saturation present at the end of waterflooding in reservoirs that contain viscous crudes.”
Saner, W.B., Patton, J.T., “CO2 recovery of Heavy Oil: Wilmington Field Test”, SPE paper 12082, JPT , July 1986

CANADIAN IMMISCIBLE FLOOD
Retlaw
Mannville
V
©
2009 Baker Hughes Incorporated. All Rights Reserved.15

Mannville
Retlaw
V –
map view
Oil viscosity @ initial reservoir conditions –
30cpCO2 allocation to HC gas injected is at an average of 0.5 (ranges from 0.4-0.6)
1 mile

Summary Data for Retlaw
Mannville
V Oil PoolPay Thickness 5.03 ft
Porosity 18.9%
Water Saturation 28.4%
Bo 1.12
Initial Pressure 1743 psia
~Psat=MMP
Fm Temperature 89.6 F
API Gravity 18.1 API
OOIP 12 MMBbl
OOIP Remaining 71%
Number of wells 47
μoil
= 30 cP

CO2 & Gas Injection Rate, Oil Production Rate vs
Time
1000 Stk
bbl O/ d10 MMcf/d

Water Rate Injected, Gas Rate and CO2 Rate Injected vs
Time
Start, middle and late time CO2
injection.
6 mmcf/d

Retlaw
Mannville
V background
•
Current RF = 29%•
47 wells in total, 33 Oil producers, 13 injection wells (6 CO2
injectors)
•
1st
cycle of CO2 injection began October 1983 and concluded on April 1989.
•
2nd
cycle of CO2 injection began on January 1991 and concluded on April 1996.
•
Water injection began on May 1987

Recovery Factor vs. HCPVI
Injection of CO2 Stops
For the geeks
Total (water +CO2
)

RF vs
HCPVI
Injection of CO2 Stops
Water injected

Cum Gas & CO2
Inj
for Retlaw
Mannville
V
Cum Gas Injected : 1.1 MMMcfCum CO2
injected : 4.8 MMMcf

Cum Oil Prod for Retlaw
Mannville
V
July 2012

Cum Gas Prod for Retlaw
Mannville
V

North South Pressure Regions
1976 1978 1980 1982 1984 1986 1988 1990 1992 1994 1996 1998 2000 2002 2004 2006 20080
2500
5000
7500
10000
12500
15000
17500
20000
22500
25000
0
1
_TIME_ [Years]
OIL
PR
ES
SU
RE
[kP
a]
OIL PRESSURE
NORTH PRODUCERSSOUTH PRODUCERS
UNTITLED PROJECTDATE 2008 -7 All WellsGROUP1GROUP3NORTH PRODUCERSSOUTH PRODUCERS
More Injection in South Region
Initial pressure Psi
=Pbubbble
= MMP

SIMULATION MODEL

History Matching Parameters
•
Liquid Rate Constraint•
Frac
Pressure Injection Well Constraint
•
Perm Increase around producing wells•
K = 100mD
•
Kv/Kh
= 0.1•
Pi = Pb
= 120bar
•
2 perm streaks introduced between inj
prod pairs

Ternary Saturation Diagrams
Feb 1971 Aug 2008
Injected water into gas cap
Well location

30
History Match –
Water Production

31
History Match –
Gas Production

Sensitivity to oil viscosity; What did we do?
©
2009 Baker Hughes Incorporated. All Rights Reserved.32
20
cp
Waterflood CO2Waterflood CO2
Waterflood CO2

Incremental recovery vs. Oil Viscosity
©
2009 Baker Hughes Incorporated. All Rights Reserved.33
Incremental recovery factor for CO2
immiscible flooding vs. waterfloods

SCREENING FOR IMMISCIBLE CO2
©
2009 Baker Hughes Incorporated. All Rights Reserved.34

Screening for Immiscible CO2
criteria
•Oil saturation SO current
>50%•Successful waterflood; volumetric sweep Evol
>50%•Biggest hurdle;
–
Inexpensive CO2
–
corrosion hurdle existing pipe systems +CTP•API gravity 15-25API
–
Insitu
viscosity= 10-
1000cP
•
But at low temperatures and higher viscousity
there is a larger viscosity effect on Oil
©
2009 Baker Hughes Incorporated. All Rights Reserved.35

Insitu
viscosity= 10-
1000cP why is screening problematic
©
2009 Baker Hughes Incorporated. All Rights Reserved.36
As temperature ↓→
the change in oil viscosity goes up
~50 time drop
~10 time drop

37
What Really Controls Recovery?
Recovery Factor = ERecovery Factor = Edd
··
EEvolvol
Without Horizontal Well
EEvolvol
––
volumetric efficiencyvolumetric efficiencyEEd d ––
displacement efficiencydisplacement efficiency
Maximize thecontacted rockvolume

Epic Copyright 200938
where:
Ed
=
displacement efficiencySoi
=
initial oil saturationROS
=
the remaining average oil saturation after one movable pore volume has been
injected.
oi
oid S
ROSSE
)(
Displacement Efficiency
ROS is high for heavyoils therefore change Is significant if oil saturated with CO2

Summary
Limited immiscible pilots in literature show the promise immiscible CO2
floodingLaboratory work seems to show promise of improved recovery (∆RF=6-15%OOIP)Field projects show promiseSimulation of Canadian pilot shows; @μoil
= 30cP (∆RFCO2-wtrfld
=7%OOIP)
Simulation sensitivity @μoil
= 5cP (∆RFCO2-wtrfld
~+20%OOIP)
•Screening–Oil saturation SO current
>50%–Successful waterflood; volumetric sweep Evol
>50%