Embed Size (px)
Citation preview

INVESTOR PRESENTATION
Q1 - 2018
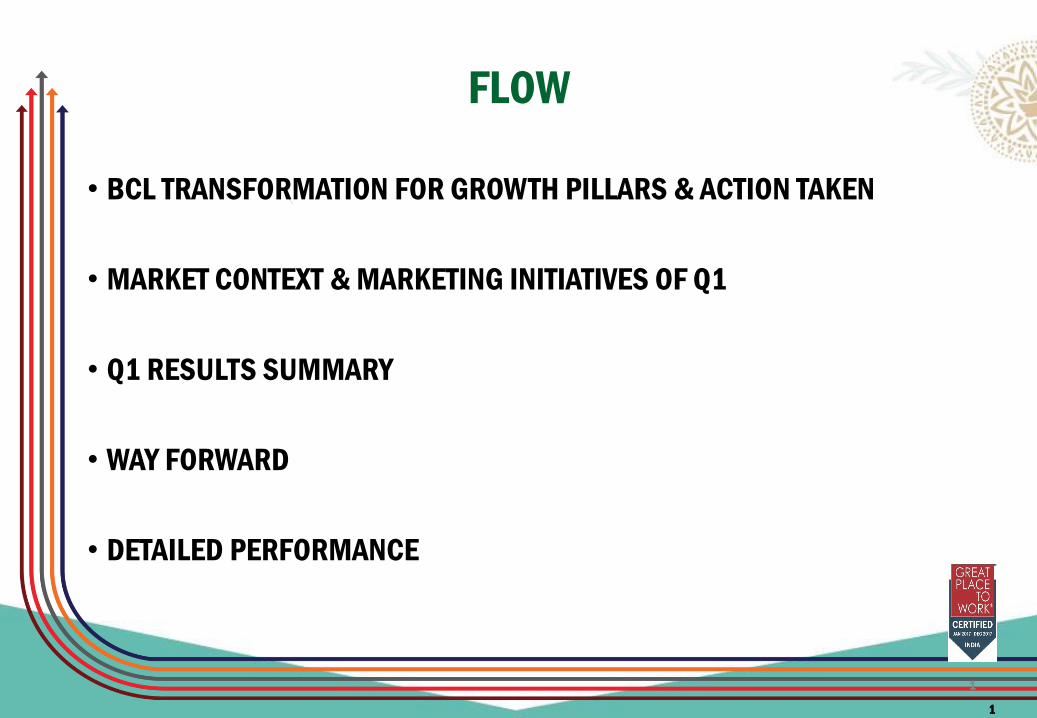
FLOW
• BCL TRANSFORMATION FOR GROWTH PILLARS & ACTION TAKEN
• MARKET CONTEXT & MARKETING INITIATIVES OF Q1
• Q1 RESULTS SUMMARY
• WAY FORWARD
• DETAILED PERFORMANCE
1
1
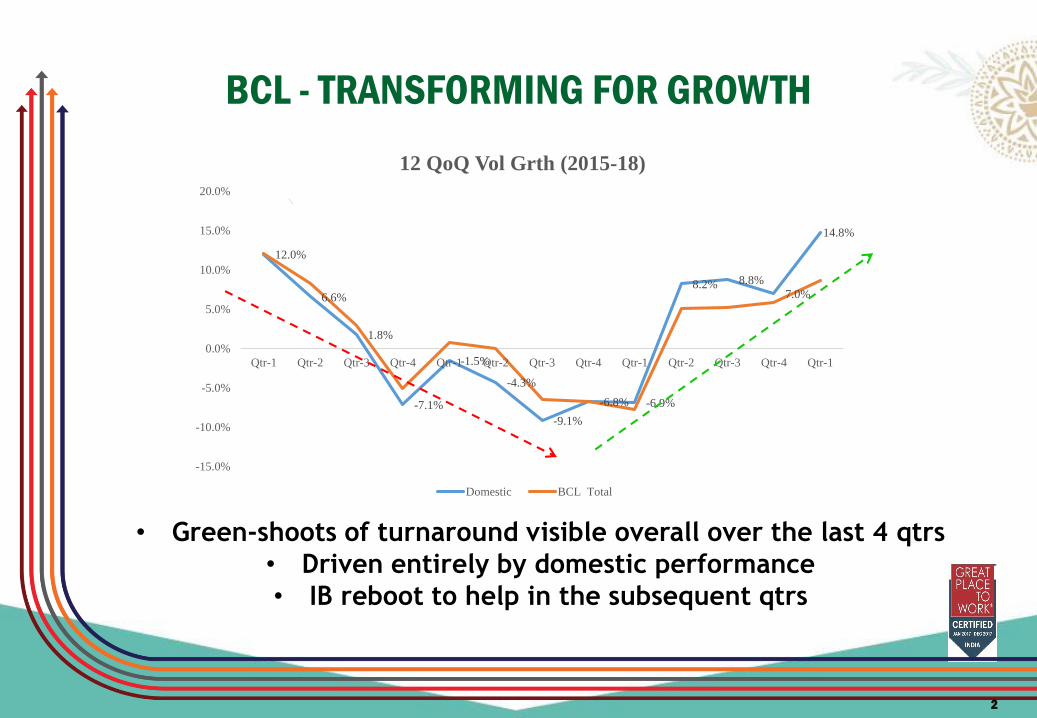
BCL - TRANSFORMING FOR GROWTH
• Green-shoots of turnaround visible overall over the last 4 qtrs
• Driven entirely by domestic performance
• IB reboot to help in the subsequent qtrs
12.0%
6.6%
1.8%
-7.1%
-1.5%
-4.3%
-9.1%
-6.8% -6.9%
8.2% 8.8%
7.0%
14.8%
-15.0%
-10.0%
-5.0%
0.0%
5.0%
10.0%
15.0%
20.0%
Qtr-1 Qtr-2 Qtr-3 Qtr-4 Qtr-1 Qtr-2 Qtr-3 Qtr-4 Qtr-1 Qtr-2 Qtr-3 Qtr-4 Qtr-1
12 QoQ Vol Grth (2015-18)
Domestic BCL Total
2
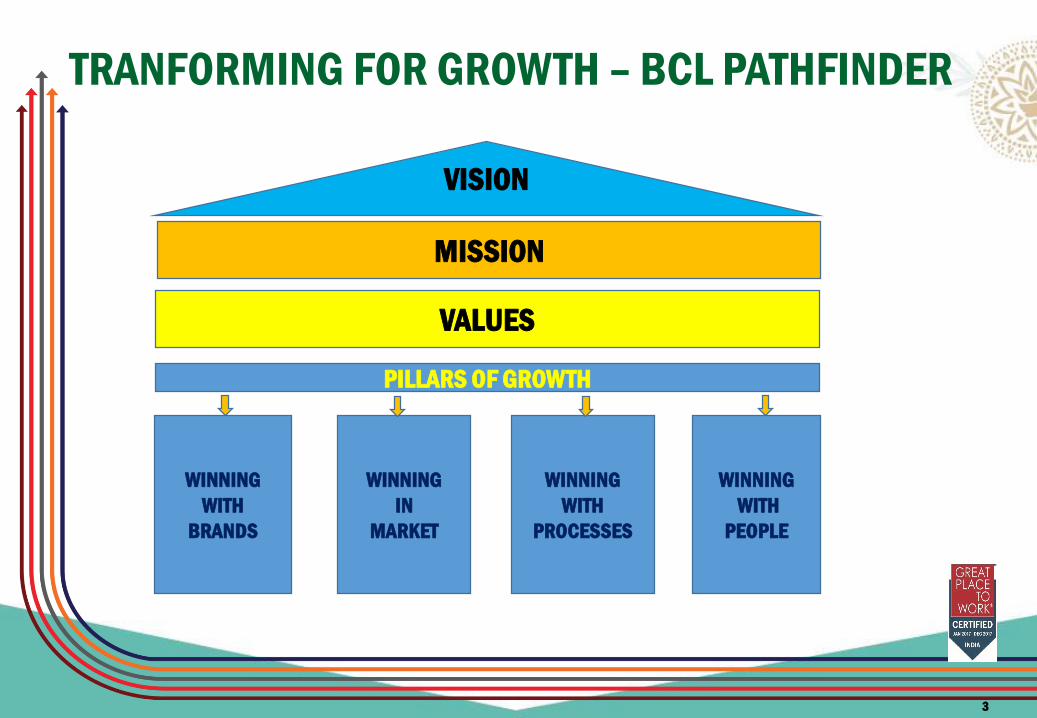
VISION
VALUES
WINNING
WITH
BRANDS
WINNING
IN
MARKET
WINNING
WITH
PROCESSES
WINNING
WITH
PEOPLE
TRANFORMING FOR GROWTH – BCL PATHFINDER
PILLARS OF GROWTH
MISSION
3
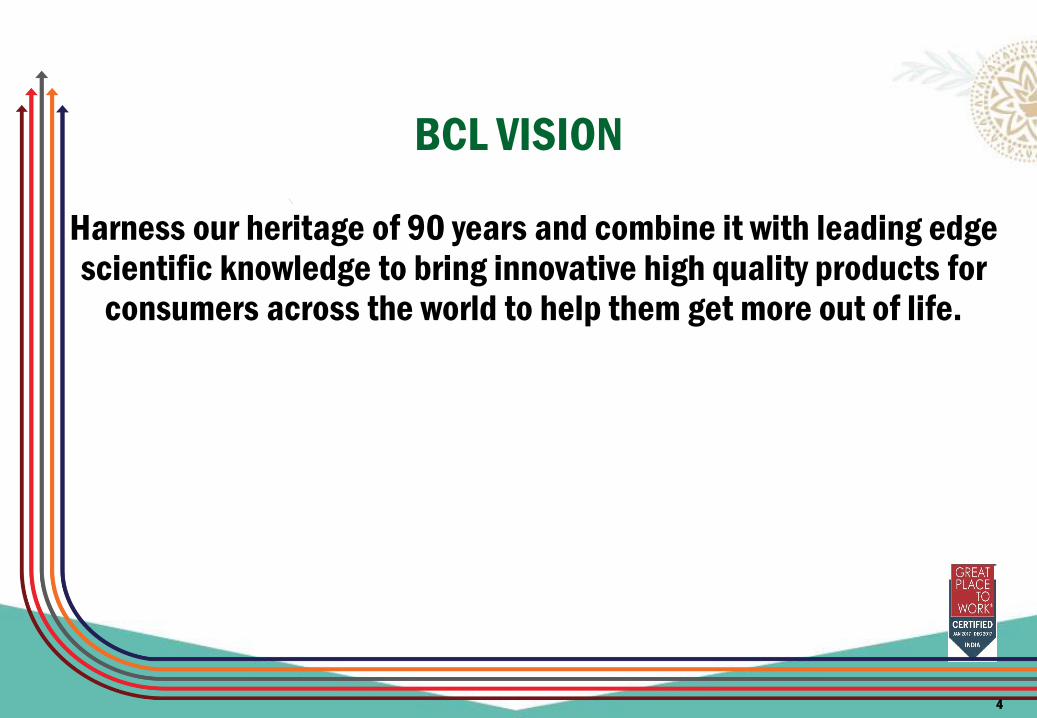
BCL VISION
Harness our heritage of 90 years and combine it with leading edge scientific knowledge to bring innovative high quality products for
consumers across the world to help them get more out of life.
4

NAYA BAJAJ – MISSION 2020
• We aspire to make BCL a complete FMCG company by introducing a culture of innovation here to create newer pathbreaking products for consumers
across the globe
• We will help our consumers feel good, look good and get more out of lifewith our premium mixes and make them accessible even in the farthest
corner of the rural markets
• We will strongly Engage with, Develop, Recognize and Retain Talent within the organization across every department
• We will develop the most efficient ways of doing business by using cutting edge IT tools across all processes and make BCL a future ready
organization that can add even more value for our consumers and customers
5
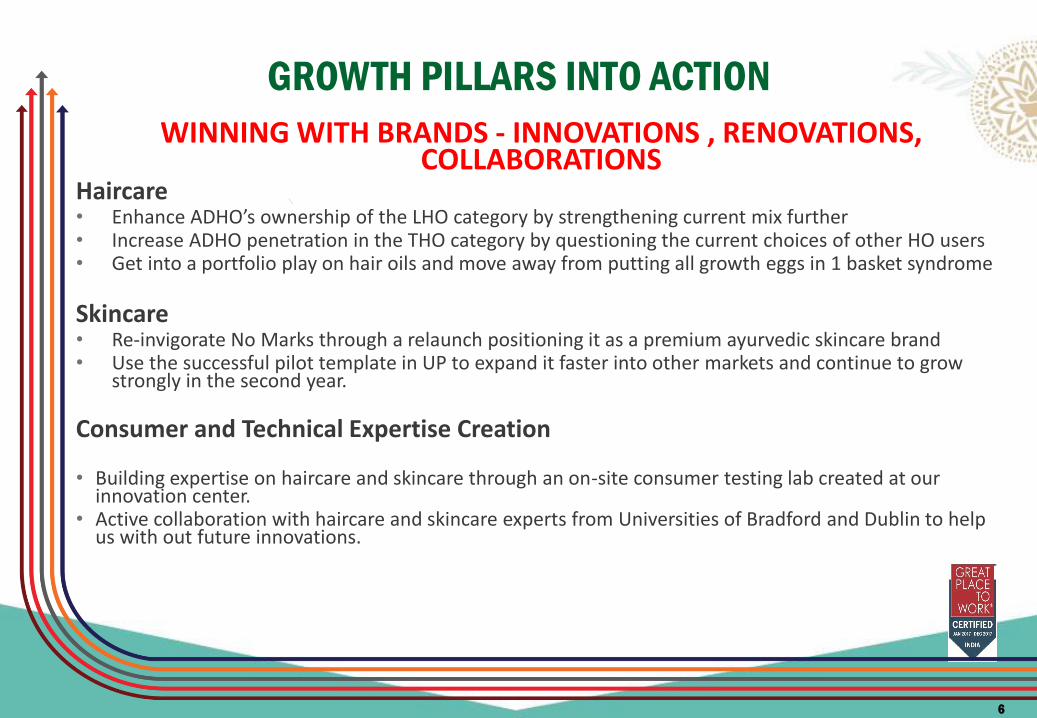
GROWTH PILLARS INTO ACTION
WINNING WITH BRANDS - INNOVATIONS , RENOVATIONS, COLLABORATIONS
Haircare • Enhance ADHO’s ownership of the LHO category by strengthening current mix further• Increase ADHO penetration in the THO category by questioning the current choices of other HO users • Get into a portfolio play on hair oils and move away from putting all growth eggs in 1 basket syndrome
Skincare• Re-invigorate No Marks through a relaunch positioning it as a premium ayurvedic skincare brand• Use the successful pilot template in UP to expand it faster into other markets and continue to grow
strongly in the second year.
Consumer and Technical Expertise Creation
• Building expertise on haircare and skincare through an on-site consumer testing lab created at our innovation center.
• Active collaboration with haircare and skincare experts from Universities of Bradford and Dublin to help us with out future innovations.
6
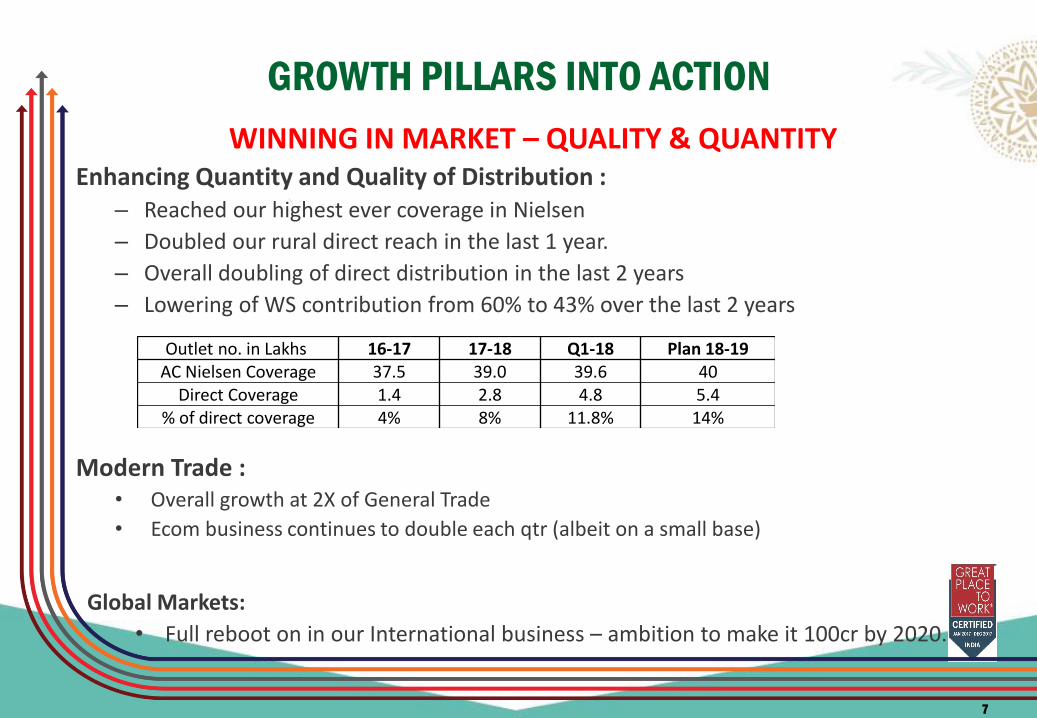
GROWTH PILLARS INTO ACTION
WINNING IN MARKET – QUALITY & QUANTITYEnhancing Quantity and Quality of Distribution :
– Reached our highest ever coverage in Nielsen
– Doubled our rural direct reach in the last 1 year.
– Overall doubling of direct distribution in the last 2 years
– Lowering of WS contribution from 60% to 43% over the last 2 years
Modern Trade :• Overall growth at 2X of General Trade
• Ecom business continues to double each qtr (albeit on a small base)
Outlet no. in Lakhs 16-17 17-18 Q1-18 Plan 18-19AC Nielsen Coverage 37.5 39.0 39.6 40
Direct Coverage 1.4 2.8 4.8 5.4 % of direct coverage 4% 8% 11.8% 14%
Global Markets:
• Full reboot on in our International business – ambition to make it 100cr by 2020.
7
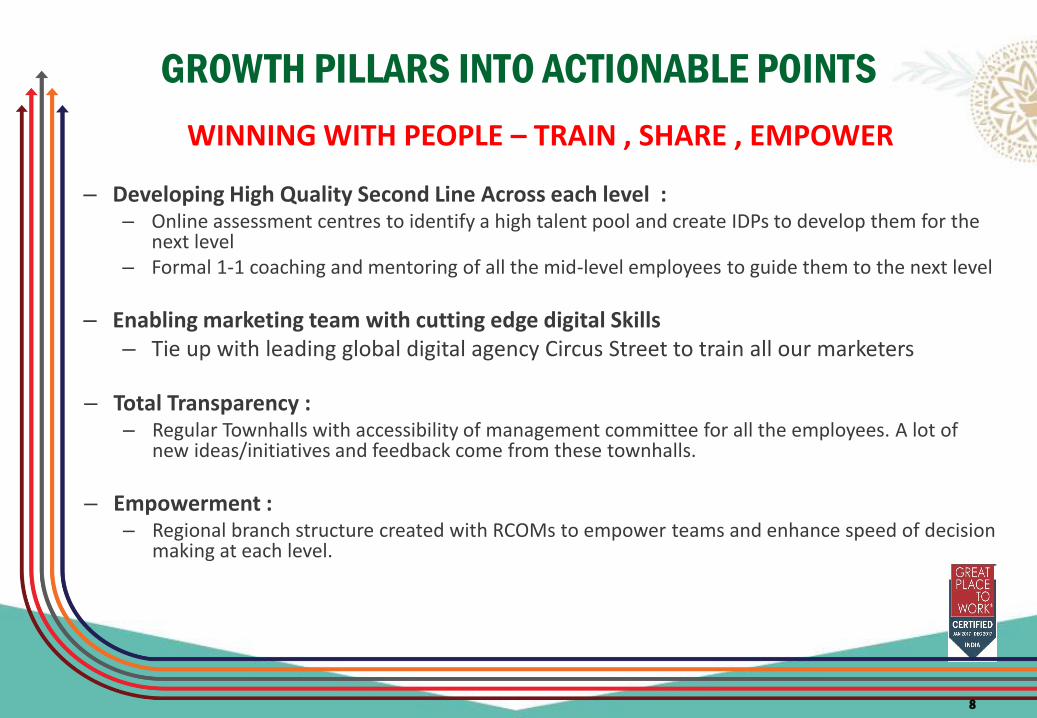
GROWTH PILLARS INTO ACTIONABLE POINTS
WINNING WITH PEOPLE – TRAIN , SHARE , EMPOWER
– Developing High Quality Second Line Across each level : – Online assessment centres to identify a high talent pool and create IDPs to develop them for the
next level– Formal 1-1 coaching and mentoring of all the mid-level employees to guide them to the next level
– Enabling marketing team with cutting edge digital Skills – Tie up with leading global digital agency Circus Street to train all our marketers
– Total Transparency : – Regular Townhalls with accessibility of management committee for all the employees. A lot of
new ideas/initiatives and feedback come from these townhalls.
– Empowerment : – Regional branch structure created with RCOMs to empower teams and enhance speed of decision
making at each level.
8

GROWTH PILLARS INTO ACTIONABLE POINTSWINNING WITH PROCESS
• Full Automation In Sales • 100% SFA rollout in the country (including rural)• Rollout of BI tool happening in Q2 now • Piloting new ARS tool for a seamless end to end integration of offtakes to production planning
• Automation In HR Processes• Full automation of PMS to complete in Q2• Travel Expense automation started with Happay
• SC –Leveraging Pockets Of Efficiency In an Inflationary Environment• Distribution re-organization in progress as per supply chain network strategy :
• Shifting of Zirakpur Mother warehouse to Ambala with state of the art facilities• Reduction in overall number of depots to fewer, bigger more technologically advanced ….• New Advanced Sales Forecasting Tool rolled out to ensure lesser deviation from forecast
• Best Practices Learnings From External Agencies • Functional Audits conducted across support functions to get an As-Is Vs Best-In class gap analysis
• All Business Processes Audit - SAP / Operations – PWC / HR – Aon Hewitt
9
MARKET CONTEXT & INITIATIVES –Q1
Q1 – MARKET CONTEXT• Trade
• Rural showing strong signs of recovery and growing faster than urban
• Urban Retail looking positive and mostly out of any GST related woes
• WS softness exists in pockets but recovering at an overall level
• CSD channel continues its unpredictable journey over the last 6 qtrs and prospects look bleak for the future.
• Offtakes• LHO market growing faster than the THO market on volumes but slower on value because of
the price hikes in coconut oil.
• Costs • Crude continued rising trend with 50% increase over 2017 lows impacting 50% of spend LLP,
Freight and plastic
• Initiatives like forward coverage, freight optimization post GST and spec optimization helping us to minimize COGS impact
11
Q1 HIGHLIGHTS
Strong Volume Growth Across Categories
HAIROILS
• Volume MS% improved to 7.4% in MAT Jun 18 vs 7.2% in MAT Jun 17 , backed by sequential Qtr on Qtr share increase ( 7%, 7.2% ,7.6% , 7.7%)
• Share within the LHO segment continued to surge forward with MAT Jun 18 at 61.3% vs 60.7% for MAT Jun 17 , propelled by an all time high share of 62.9% for Q1 .
• Bajaj Ayurvedic Brahmi Amla continues to show good potential – 20% Offtake growth in Q1over Q4 LY.
NO MARKS
• MAT Jun 18 MS% improved to 8% from 7.5% in MAT Jun 17 despite a decline in Q1 share ( 7.5% vs 8.8% in Q4 ) as trade pipeline was cleaned up for Brand Restage in Jun 18.
12
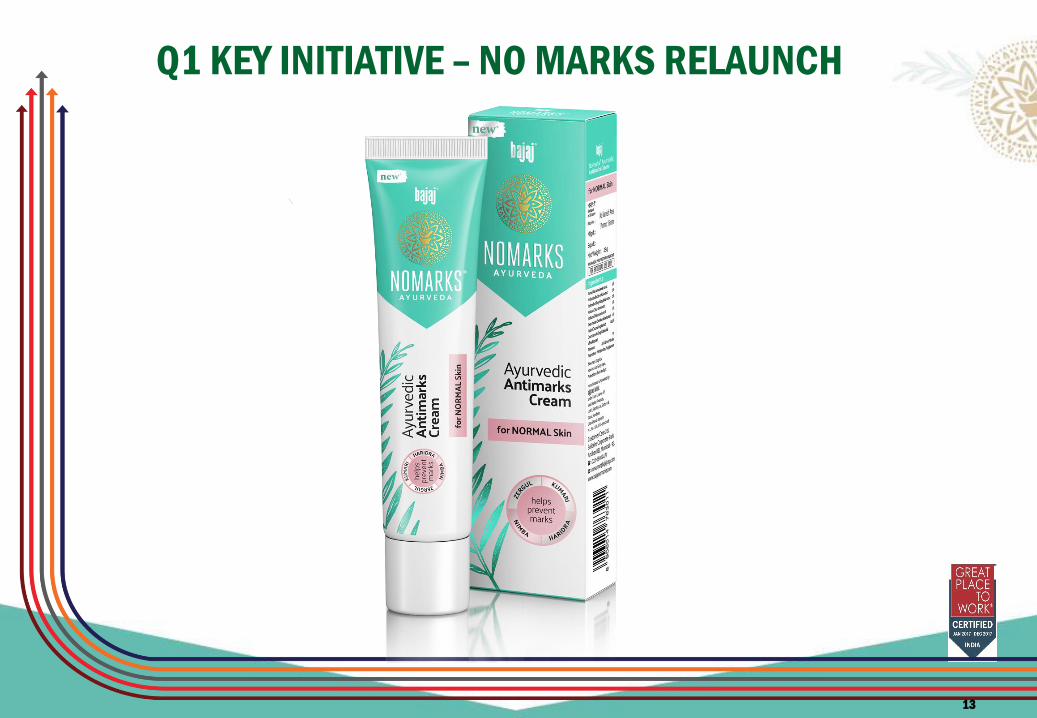
Q1 KEY INITIATIVE – NO MARKS RELAUNCH
13
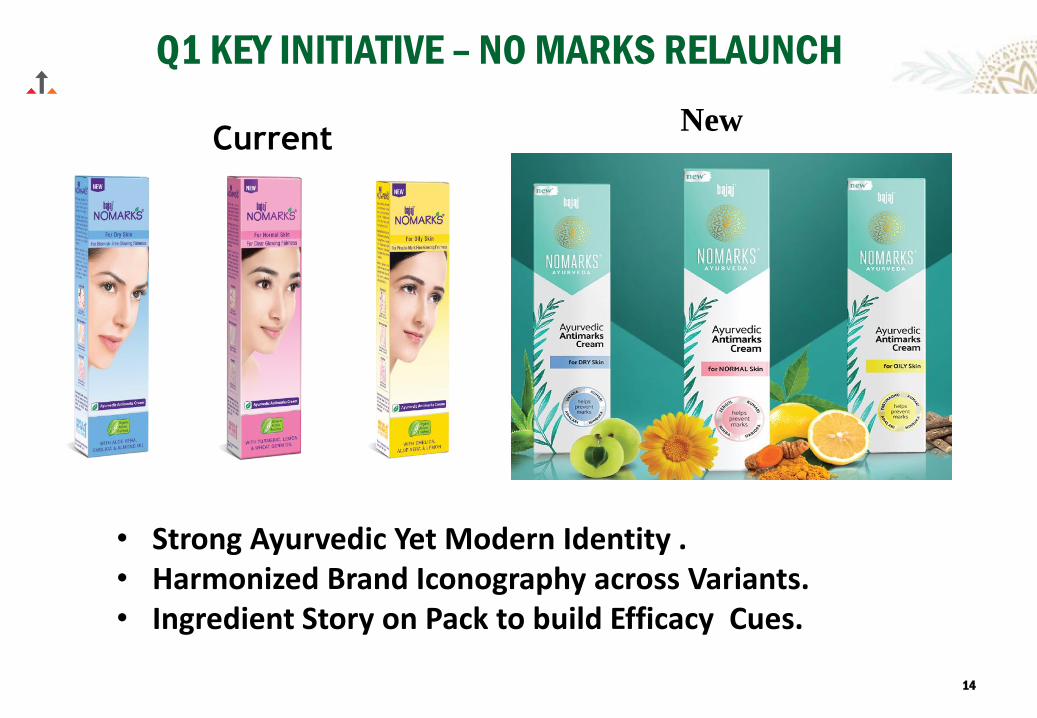
• Strong Ayurvedic Yet Modern Identity .• Harmonized Brand Iconography across Variants.• Ingredient Story on Pack to build Efficacy Cues.
CurrentNew
Q1 KEY INITIATIVE – NO MARKS RELAUNCH
14

Q1 KEY INITIATIVE – NO MARKS RELAUNCH
15

Q1 - Bajaj Brahmi Amla Ayurvedic Hair Oil
3022.
6668.
13690.
21846.
26393.
0
5,000
10,000
15,000
20,000
25,000
30,000
Q1
FY18
Q2
FY18
Q3
FY18
Q4
FY18
Q1
FY19
Value Offtake (000 Rs)
8202.
29589.
58890.
84644.
96515.
0
25,000
50,000
75,000
1,00,000
Q1
FY18
Q2
FY18
Q3
FY18
Q4
FY18
Q1
FY19
Dealers ('000)
Bajaj Brahmi Amla Ayurvedic Hair Oil :• Benefits of Ayurvedic Brahmi and Amla extracts to reduce
hairfall• New Premium packaging• Launch supported with TV featuring Brand Ambassador-
Drashti Dhami• Both offtakes and Distribution are showing a positive trend for
the Quarter .
Source: AC Nielsen Jun’18
16
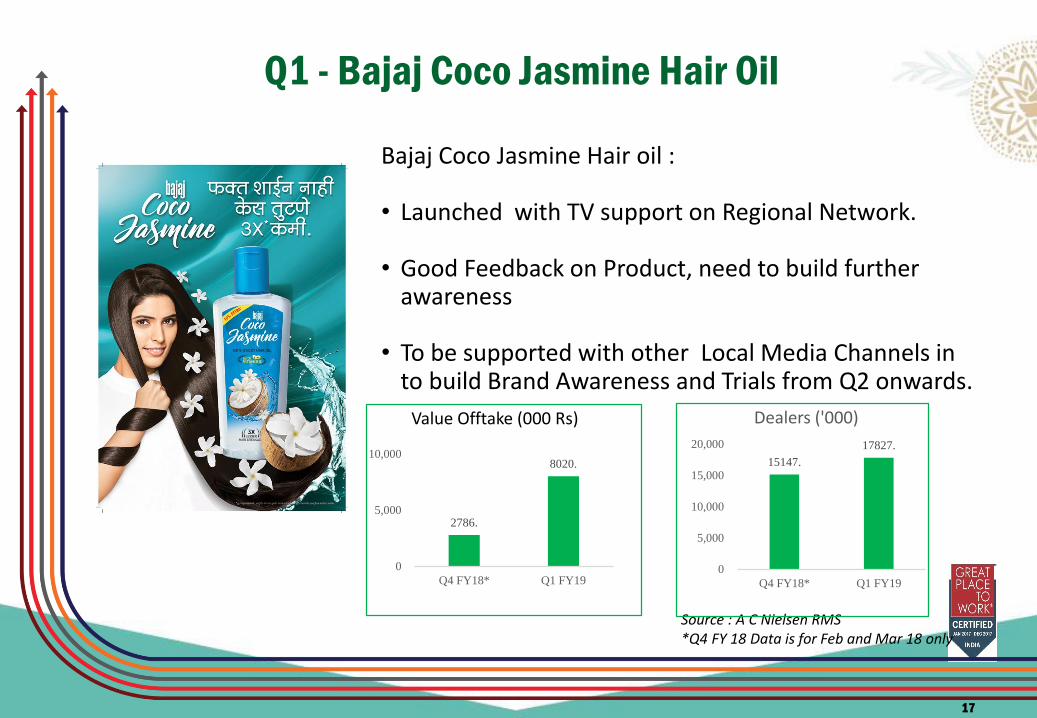
Q1 - Bajaj Coco Jasmine Hair Oil
Bajaj Coco Jasmine Hair oil :
• Launched with TV support on Regional Network.
• Good Feedback on Product, need to build further awareness
• To be supported with other Local Media Channels in to build Brand Awareness and Trials from Q2 onwards.
Source : A C Nielsen RMS*Q4 FY 18 Data is for Feb and Mar 18 only
2786.
8020.
0
5,000
10,000
Q4 FY18* Q1 FY19
Value Offtake (000 Rs)
15147.
17827.
0
5,000
10,000
15,000
20,000
Q4 FY18* Q1 FY19
Dealers ('000)
17
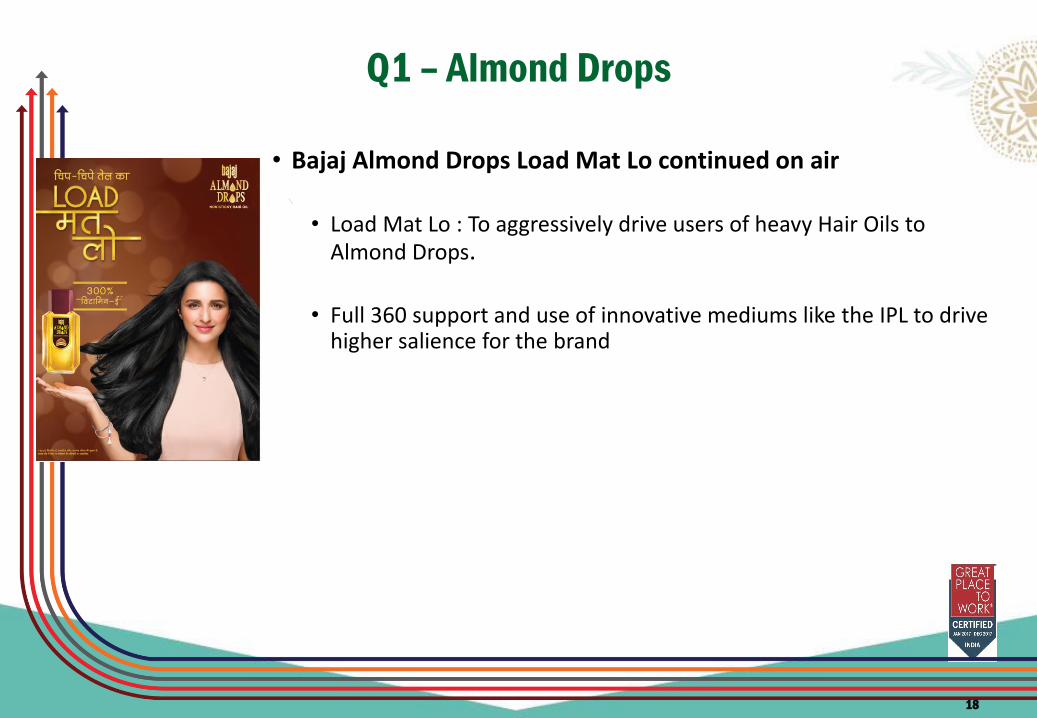
Q1 – Almond Drops
• Bajaj Almond Drops Load Mat Lo continued on air
• Load Mat Lo : To aggressively drive users of heavy Hair Oils to Almond Drops.
• Full 360 support and use of innovative mediums like the IPL to drive higher salience for the brand
18
Q1 – GROWTH FROM BOTH CATEGORIES
• 4 Consecutive Qtr of volume growths upwards of 5% for the company
• Growths led by the domestic business with MT growing at 2.5 times higher
than GT.
• Both Core Brands Leading the growth
• Almond Drops has grown at 14 % value and No Marks has grown at 41%
value for the Qtr.
• Rural leading the ADHO volume surge in the market
• ADHO Offtake growths in rural are 1.3 times higher than urban (both vol and val)
• ADHO value and vol growths in rural are higher than the overall THO market
19
Q1 RESULTS – CONSISTENT VOLUME DRIVEN GROWTHS
20
• Overall Company Value growth of 9.45%
• Led by a strong domestic Value Growth of 13.5% and volume growth of 13.9%
• Domestic growths led by a 13.4% value growth in GT and 31.8% in MT
• Both CSD and Export are underperforming and bring down Company growth to 9.45%
• Comparable tax base value growth of 13.2%
• Taking base tax rate to be similar to current
• Value growth in Domestic business at 17.5% (on comparable Tax basis)
• EBITDA - 32.8%
• EBITDA for the quarter has grown by 13.9% in absolute value terms on account of growth in sales coupled with operational efficiency.
• PAT - 25.01%
• PAT for the quarter has declined by 2.2% on account of reduction in other income.
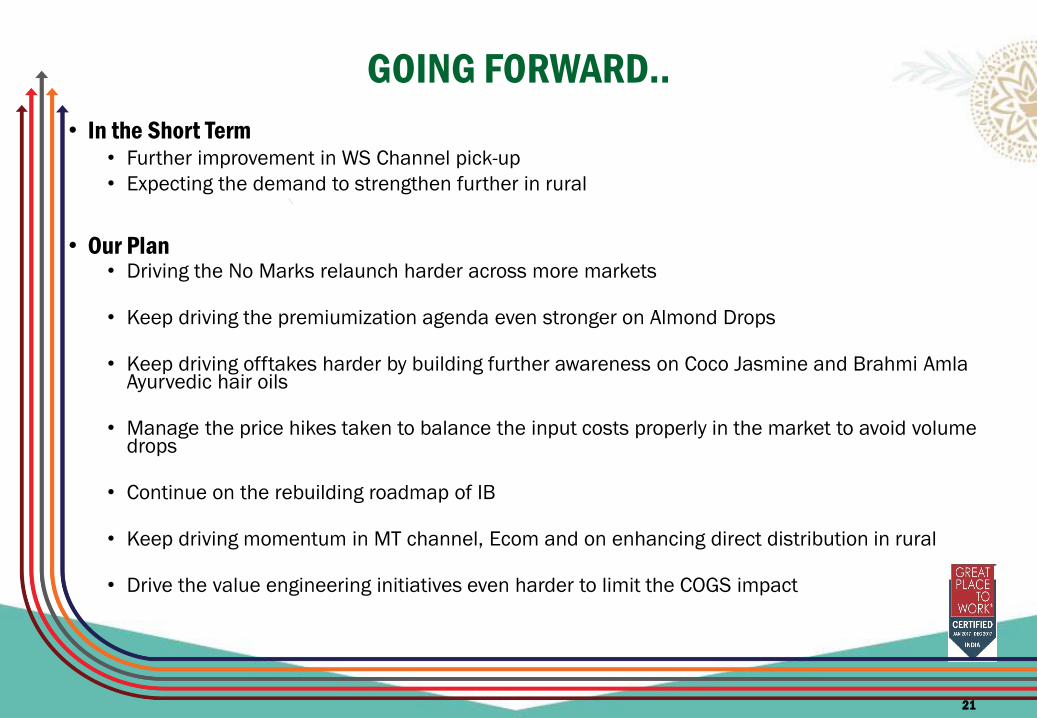
GOING FORWARD..
• In the Short Term• Further improvement in WS Channel pick-up
• Expecting the demand to strengthen further in rural
• Our Plan • Driving the No Marks relaunch harder across more markets
• Keep driving the premiumization agenda even stronger on Almond Drops
• Keep driving offtakes harder by building further awareness on Coco Jasmine and Brahmi AmlaAyurvedic hair oils
• Manage the price hikes taken to balance the input costs properly in the market to avoid volume drops
• Continue on the rebuilding roadmap of IB
• Keep driving momentum in MT channel, Ecom and on enhancing direct distribution in rural
• Drive the value engineering initiatives even harder to limit the COGS impact
21

INDUSTRY OVERVIEW
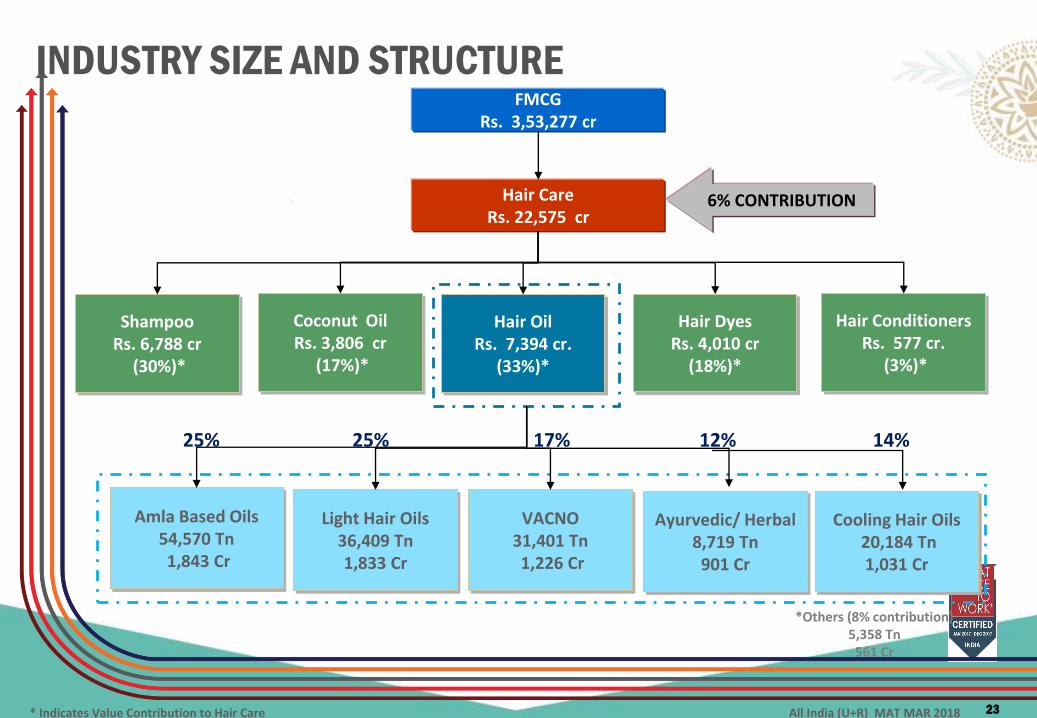
INDUSTRY SIZE AND STRUCTURE
Light Hair Oils36,409 Tn1,833 Cr
FMCGRs. 3,53,277 cr
Hair CareRs. 22,575 cr
ShampooRs. 6,788 cr
(30%)*
Coconut OilRs. 3,806 cr
(17%)*
Hair OilRs. 7,394 cr.
(33%)*
Hair ConditionersRs. 577 cr.
(3%)*
Hair DyesRs. 4,010 cr
(18%)*
Amla Based Oils54,570 Tn1,843 Cr
VACNO31,401 Tn1,226 Cr
6% CONTRIBUTION
All India (U+R) MAT MAR 2018
*Others (8% contribution)5,358 Tn
561 Cr
Ayurvedic/ Herbal8,719 Tn
901 Cr
Cooling Hair Oils20,184 Tn1,031 Cr
25% 25% 17% 12% 14%
* Indicates Value Contribution to Hair Care 23

831
1,080
1,3111,474 1,502
1,576 1,6391,743
482
0
200
400
600
800
1,000
1,200
1,400
1,600
1,800
2,000
10-11 11-12 12-13 13-14 14-15 15-16 16-17 17-18 YTD Jun18
22.4
26.830.0
31.9 31.3 32.2 33.134.9
9.7
0.0
5.0
10.0
15.0
20.0
25.0
30.0
35.0
40.0
10-11 11-12 12-13 13-14 14-15 15-16 16-17 17-18 YTD Jun18
5,728
6,9817,867
8,6769,390
9,928 10,103
11,200
3,181
0
2,000
4,000
6,000
8,000
10,000
12,000
10-11 11-12 12-13 13-14 14-15 15-16 16-17 17-18 YTD Jun18
236 238 247269
255 254 264283
76
0
50
100
150
200
250
300
10-11 11-12 12-13 13-14 14-15 15-16 16-17 17-18 YTD Jun18
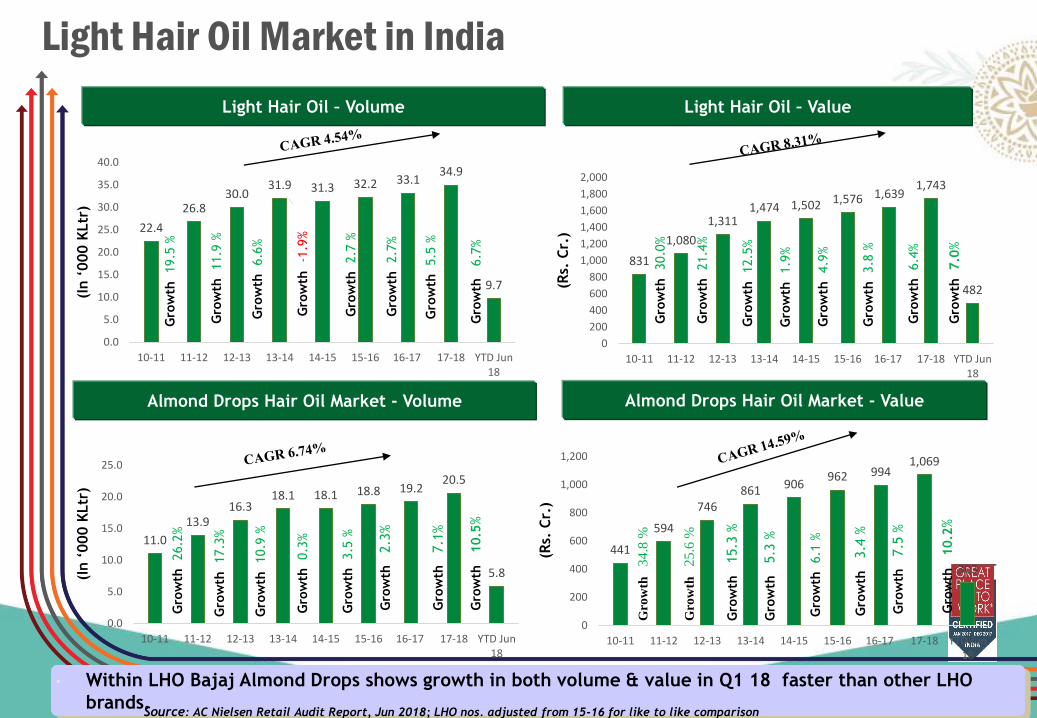
Hair Oil Market in IndiaOverall Hair Oil Market – Volume Overall Oil Market – Value
Light Hair Oil – Volume Light Hair Oil – Value
• Hair Oils category shows Vol & Val growth at a YTD Jun 18 level. Volume Growth Led By Amla and LHO segment
• CNO Segment declined in Volume ( -2%) but Price increase led to Value Growth. For LHO , Volume and Value Gr% similar.
Source: AC Nielsen Retail Audit Report, Jun 2018
24
(In ‘
000 K
Ltr
)
(Rs.
Cr.
)
(In ‘
000 K
Ltr
)
(Rs.
Cr.
)
Gro
wth
7.4
%
Gro
wth
3.9
%
Gro
wth
-0
.2%
Gro
wth
-5
.3%
Gro
wth
8.7
%
Gro
wth
3.9
%
Gro
wth
5.7
%
Gro
wth
8.2
%
Gro
wth
10.3
%
Gro
wth
12.7
%G
row
th
21.4
%
Gro
wth
4.9
%
Gro
wth
1.9
%
Gro
wth
3.8
%
Gro
wth
12.5
%
Gro
wth
2.7
%
Gro
wth
2.7
%
Gro
wth
-1
.9%
Gro
wth
6.6
%
Gro
wth
11.9
%
Gro
wth
2.6
%
Gro
wth
10.9
%
Gro
wth
5.5
%
Gro
wth
6.4
%
Gro
wth
11.1
%
Gro
wth
6.7
%
Gro
wth
7.0
%
Gro
wth
1.8
%
Gro
wth
1.2
%
Gro
wth
21.9
%
Gro
wth
19.5
%
Gro
wth
30.0
%
441
594
746861 906
962 9941,069
303
0
200
400
600
800
1,000
1,200
10-11 11-12 12-13 13-14 14-15 15-16 16-17 17-18 YTD Jun18
11.0
13.916.3
18.1 18.1 18.8 19.220.5
5.8
0.0
5.0
10.0
15.0
20.0
25.0
10-11 11-12 12-13 13-14 14-15 15-16 16-17 17-18 YTD Jun18
Light Hair Oil Market in India
Almond Drops Hair Oil Market - Volume Almond Drops Hair Oil Market - Value
• Within LHO Bajaj Almond Drops shows growth in both volume & value in Q1 18 faster than other LHO
brands.
(Rs.
Cr.
)
Light Hair Oil – Volume Light Hair Oil – Value
(In ‘
000 K
Ltr
)
(Rs.
Cr.
)
(In ‘
000 K
Ltr
)
Source: AC Nielsen Retail Audit Report, Jun 2018; LHO nos. adjusted from 15-16 for like to like comparison
22.4
26.830.0
31.9 31.3 32.2 33.134.9
9.7
0.0
5.0
10.0
15.0
20.0
25.0
30.0
35.0
40.0
10-11 11-12 12-13 13-14 14-15 15-16 16-17 17-18 YTD Jun18
Gro
wth
2.7
%
Gro
wth
2.7
%
Gro
wth
11.9
%
831
1,080
1,3111,474 1,502 1,576 1,639
1,743
482
0
200
400
600
800
1,000
1,200
1,400
1,600
1,800
2,000
10-11 11-12 12-13 13-14 14-15 15-16 16-17 17-18 YTD Jun18
Gro
wth
21.4
%
Gro
wth
4.9
%
Gro
wth
1.9
%
Gro
wth
3.8
%
Gro
wth
12.5
%
Gro
wth
3
.4 %
Gro
wth
6.1
%
Gro
wth
5
.3 %
Gro
wth
1
5.3
%
Gro
wth
2
5.6
%
Gro
wth
2
.3%
Gro
wth
3.5
%
Gro
wth
0.3
%
Gro
wth
10.9
%
Gro
wth
5.5
%
Gro
wth
6.4
%
Gro
wth
7
.1%
Gro
wth
7
.5 %
Gro
wth
6.7
%
Gro
wth
7.0
%
Gro
wth
17.3
%
Gro
wth
1
0.5
%
Gro
wth
1
0.2
%
Gro
wth
-1
.9%
Gro
wth
6.6
%
Gro
wth
19.5
%
Gro
wth
30.0
%
Gro
wth
26.2
%
Gro
wth
3
4.8
%
26
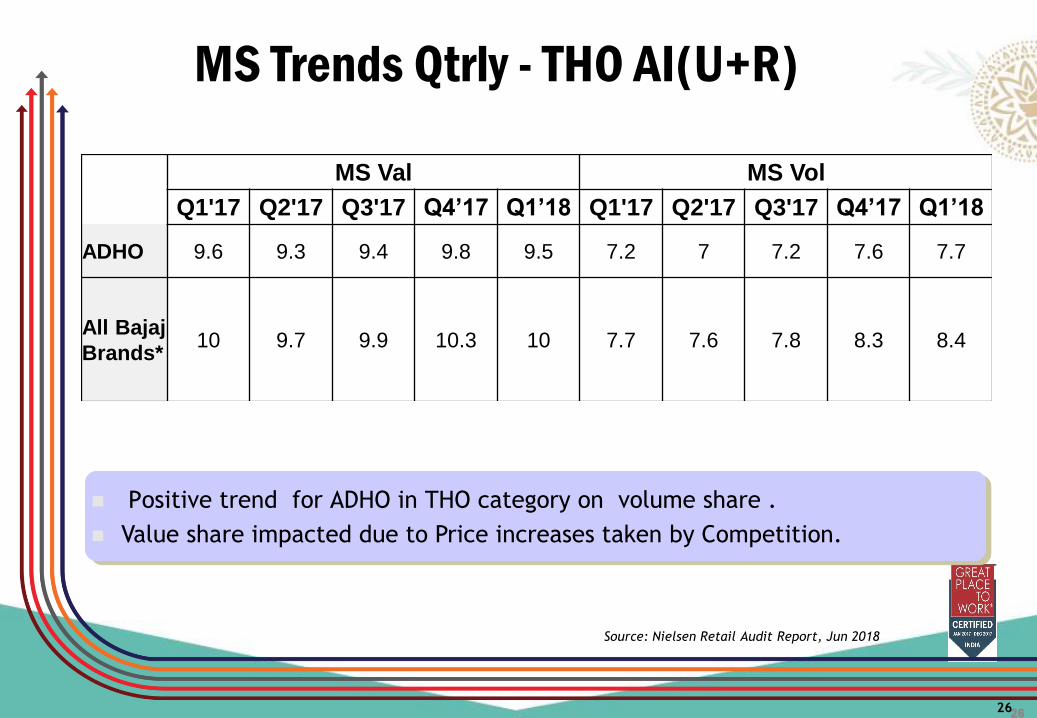
MS Trends Qtrly - THO AI(U+R)
26
Source: Nielsen Retail Audit Report, Jun 2018
◼ Positive trend for ADHO in THO category on volume share .
◼ Value share impacted due to Price increases taken by Competition.
MS Val MS Vol
Q1'17 Q2'17 Q3'17 Q4’17 Q1’18 Q1'17 Q2'17 Q3'17 Q4’17 Q1’18
ADHO 9.6 9.3 9.4 9.8 9.5 7.2 7 7.2 7.6 7.7
All Bajaj
Brands*10 9.7 9.9 10.3 10 7.7 7.6 7.8 8.3 8.4
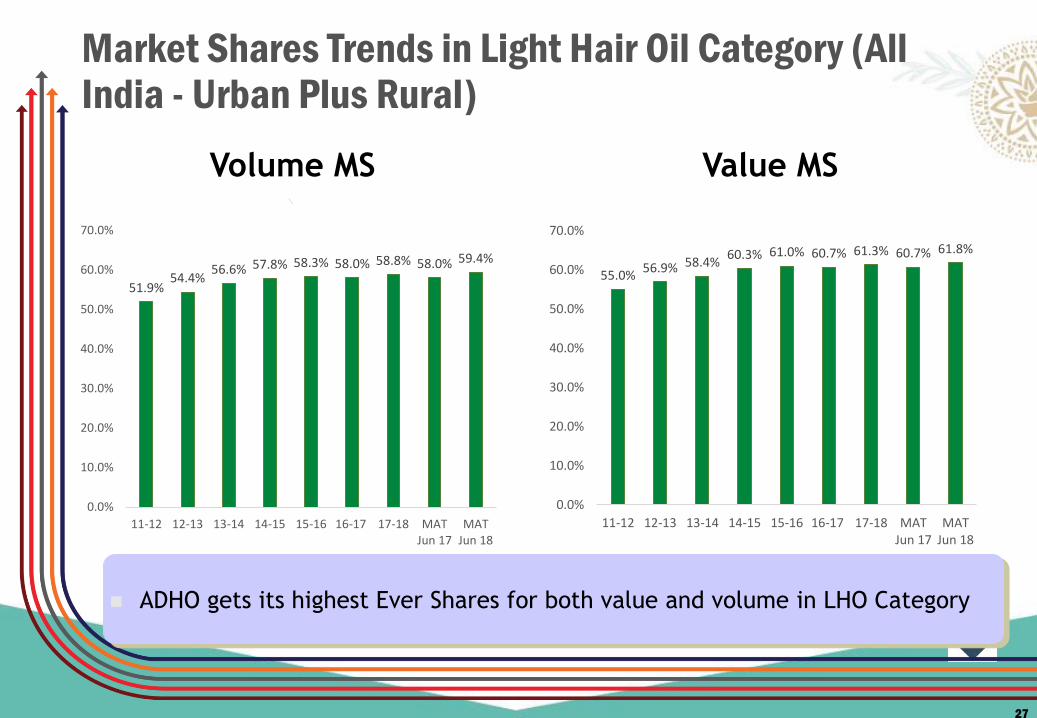
Market Shares Trends in Light Hair Oil Category (All India - Urban Plus Rural)
Source: AC Nielsen Retail Audit Report, Jun 2018
Volume MS Value MS
27
51.9%54.4%
56.6% 57.8% 58.3% 58.0% 58.8% 58.0% 59.4%
0.0%
10.0%
20.0%
30.0%
40.0%
50.0%
60.0%
70.0%
11-12 12-13 13-14 14-15 15-16 16-17 17-18 MATJun 17
MATJun 18
55.0%56.9% 58.4%
60.3% 61.0% 60.7% 61.3% 60.7% 61.8%
0.0%
10.0%
20.0%
30.0%
40.0%
50.0%
60.0%
70.0%
11-12 12-13 13-14 14-15 15-16 16-17 17-18 MATJun 17
MATJun 18
◼ ADHO gets its highest Ever Shares for both value and volume in LHO Category
28
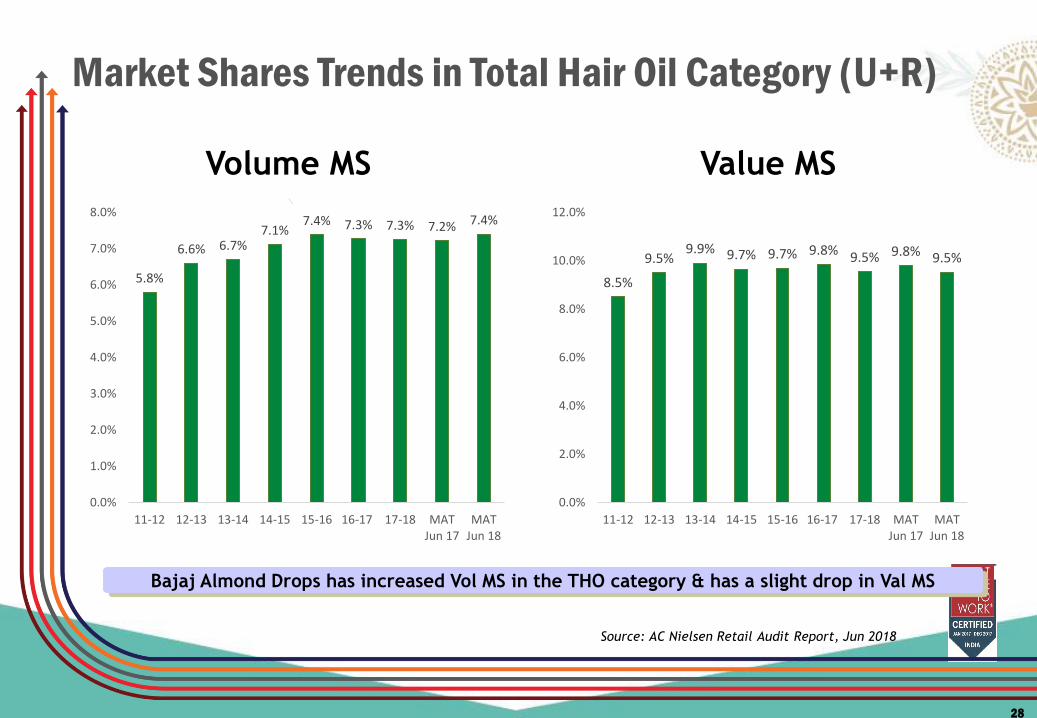
Market Shares Trends in Total Hair Oil Category (U+R)
Source: AC Nielsen Retail Audit Report, Jun 2018
5.8%
6.6% 6.7%7.1%
7.4% 7.3% 7.3% 7.2% 7.4%
0.0%
1.0%
2.0%
3.0%
4.0%
5.0%
6.0%
7.0%
8.0%
11-12 12-13 13-14 14-15 15-16 16-17 17-18 MATJun 17
MATJun 18
8.5%
9.5%9.9% 9.7% 9.7% 9.8% 9.5% 9.8% 9.5%
0.0%
2.0%
4.0%
6.0%
8.0%
10.0%
12.0%
11-12 12-13 13-14 14-15 15-16 16-17 17-18 MATJun 17
MATJun 18
Volume MS Value MS
Bajaj Almond Drops has increased Vol MS in the THO category & has a slight drop in Val MS
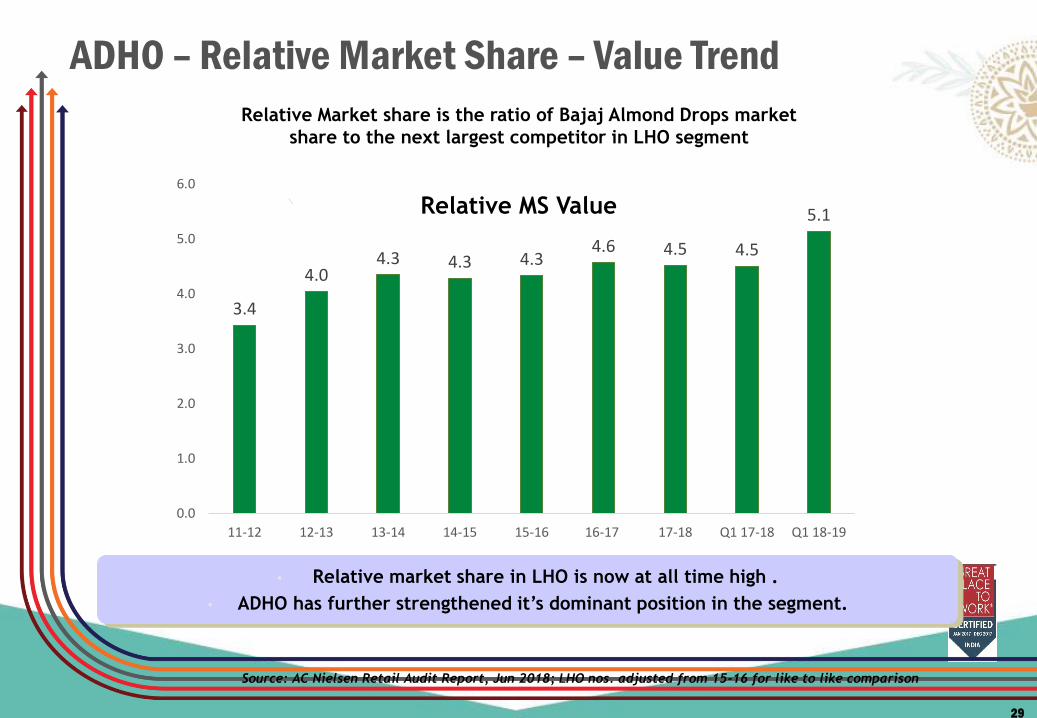
ADHO – Relative Market Share – Value Trend
• Relative market share in LHO is now at all time high .
• ADHO has further strengthened it’s dominant position in the segment.
Relative Market share is the ratio of Bajaj Almond Drops market
share to the next largest competitor in LHO segment
29
Source: AC Nielsen Retail Audit Report, Jun 2018; LHO nos. adjusted from 15-16 for like to like comparison
3.4
4.04.3 4.3 4.3
4.6 4.5 4.5
5.1
0.0
1.0
2.0
3.0
4.0
5.0
6.0
11-12 12-13 13-14 14-15 15-16 16-17 17-18 Q1 17-18 Q1 18-19
Relative MS Value
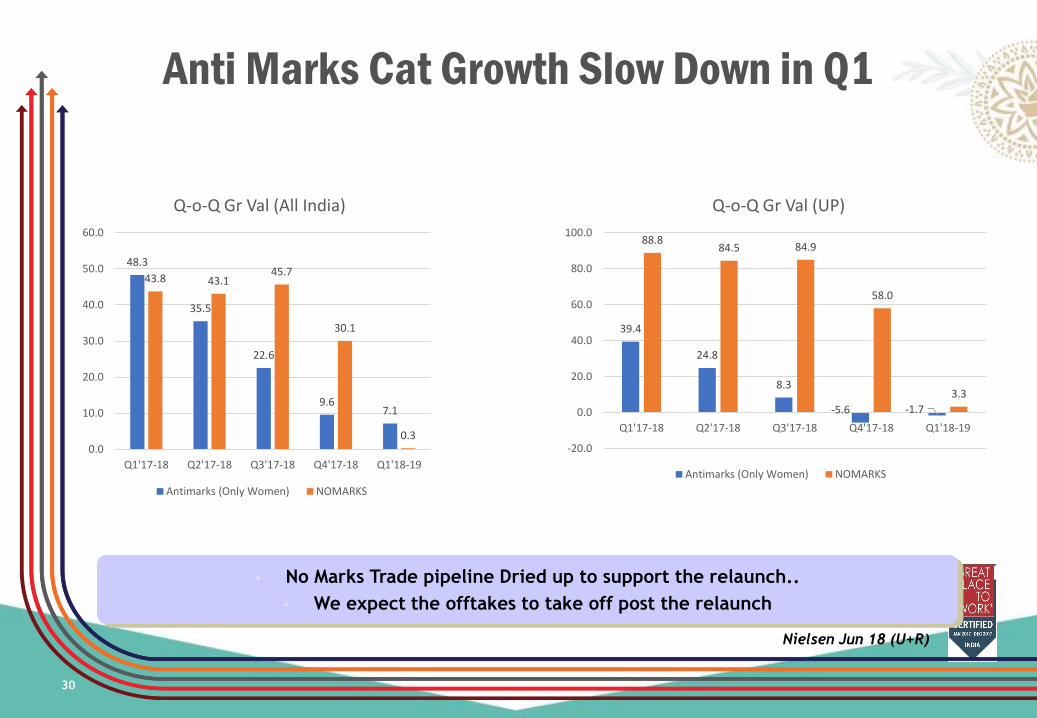
Anti Marks Cat Growth Slow Down in Q1
30
Nielsen Jun 18 (U+R)
48.3
35.5
22.6
9.67.1
43.8 43.145.7
30.1
0.30.0
10.0
20.0
30.0
40.0
50.0
60.0
Q1'17-18 Q2'17-18 Q3'17-18 Q4'17-18 Q1'18-19
Q-o-Q Gr Val (All India)
Antimarks (Only Women) NOMARKS
39.4
24.8
8.3
-5.6 -1.7
88.884.5 84.9
58.0
3.3
-20.0
0.0
20.0
40.0
60.0
80.0
100.0
Q1'17-18 Q2'17-18 Q3'17-18 Q4'17-18 Q1'18-19
Q-o-Q Gr Val (UP)
Antimarks (Only Women) NOMARKS
• No Marks Trade pipeline Dried up to support the relaunch..
• We expect the offtakes to take off post the relaunch

Slight decline for NM cream in UP
31
Nielsen Jun 18
4.64.0
4.9 5.0
3.94.2
5.3
6.1 6.3
8.27.9
8.3
10.3
11.5
9.0
7.88.3
9.710.0
13.012.5
10.6
9.0
11.7
9.9
0.0
2.0
4.0
6.0
8.0
10.0
12.0
14.0
Nomarks MS Val Trend – UP (Antimarks Women Category)
UP-Urban UP-Rural UP (U+R)
Distribution
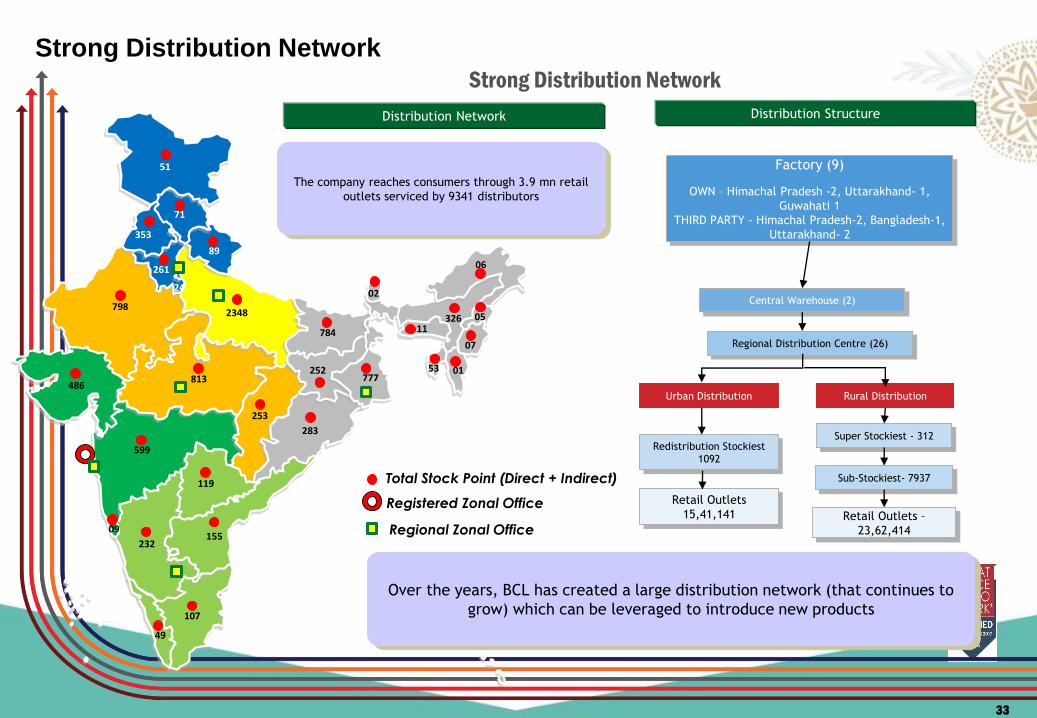
Strong Distribution Network
Factory (9)
OWN – Himachal Pradesh -2, Uttarakhand- 1,
Guwahati 1
THIRD PARTY - Himachal Pradesh-2, Bangladesh-1,
Uttarakhand- 2
Central Warehouse (2)
Regional Distribution Centre (26)
Urban Distribution Rural Distribution
Redistribution Stockiest
1092
Retail Outlets
15,41,141
Super Stockiest - 312
Sub-Stockiest- 7937
Retail Outlets –
23,62,414
Distribution Network Distribution Structure
The company reaches consumers through 3.9 mn retail
outlets serviced by 9341 distributors
Strong Distribution Network
Over the years, BCL has created a large distribution network (that continues to
grow) which can be leveraged to introduce new products
777
784
252
283
353
89
261
24
2348798
813
253
119
51
71
486
599
155232
107
49
06
326
07
1105
02
53
Total Stock Point (Direct + Indirect)
Registered Zonal Office
Regional Zonal Office
01
09
33
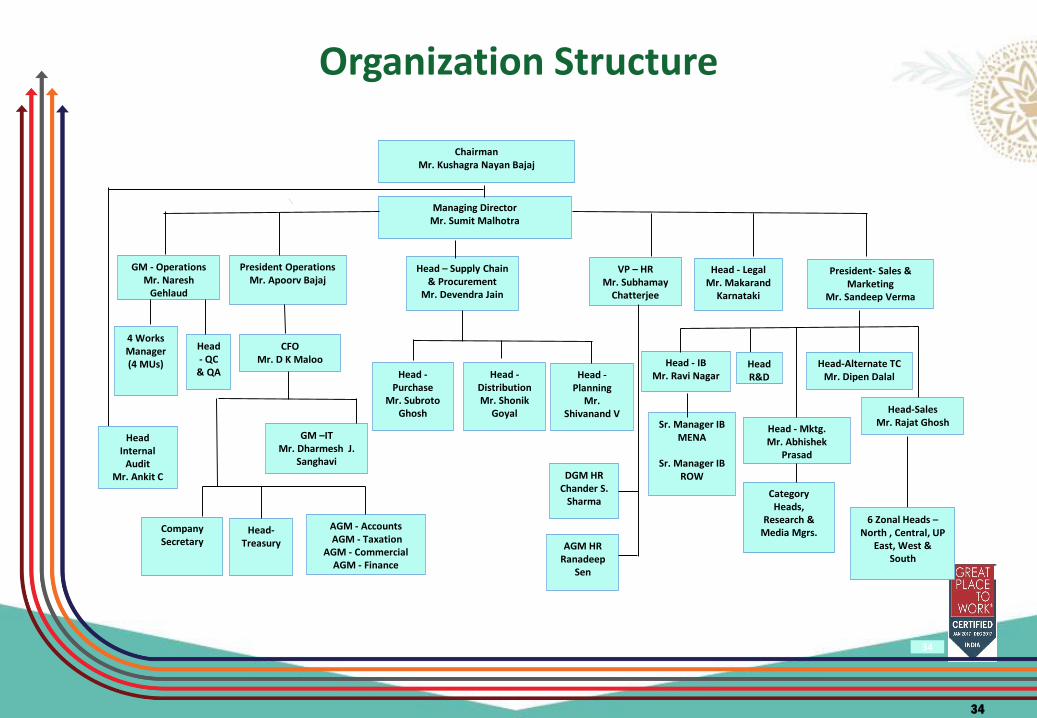
ChairmanMr. Kushagra Nayan Bajaj
Managing Director Mr. Sumit Malhotra
President OperationsMr. Apoorv Bajaj
CFOMr. D K Maloo
Company Secretary
Head-Treasury
4 Works Manager (4 MUs)
Head- QC
& QA Head -Distribution Mr. Shonik
Goyal
AGM - AccountsAGM - Taxation
AGM - CommercialAGM - Finance
GM –ITMr. Dharmesh J.
Sanghavi
GM - Operations Mr. Naresh
Gehlaud
Head - Mktg. Mr. Abhishek
Prasad
VP – HRMr. Subhamay
Chatterjee
Head-Sales Mr. Rajat Ghosh
Head-Alternate TCMr. Dipen Dalal
34
6 Zonal Heads –North , Central, UP
East, West & South
Head Internal
Audit Mr. Ankit C
Head -Purchase
Mr. Subroto Ghosh
Head – Supply Chain & Procurement
Mr. Devendra Jain
President- Sales & Marketing
Mr. Sandeep Verma
DGM HR Chander S.
Sharma
AGM HR Ranadeep
Sen
Category Heads,
Research & Media Mgrs.
Head - LegalMr. Makarand
Karnataki
Head - IBMr. Ravi Nagar
Sr. Manager IB MENA
Sr. Manager IB ROW
Head R&DHead -
Planning Mr.
Shivanand V
Organization Structure
34

Financials
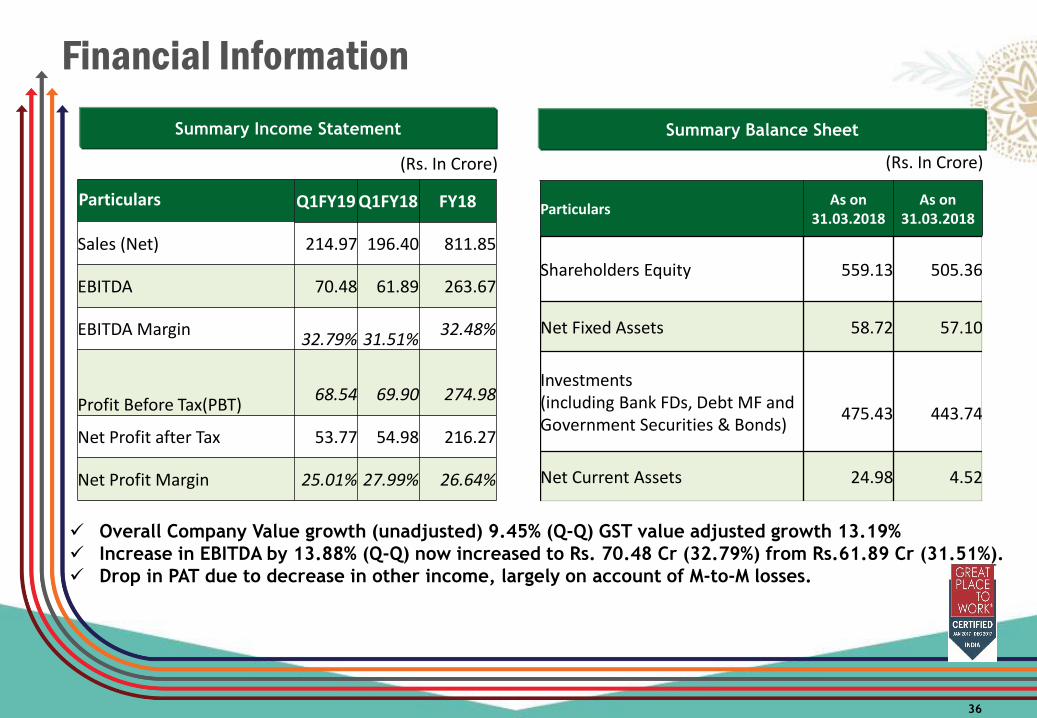
Financial Information
36
Summary Income Statement Summary Balance Sheet
Particulars Q1FY19 Q1FY18 FY18
Sales (Net) 214.97 196.40 811.85
EBITDA 70.48 61.89 263.67
EBITDA Margin32.79% 31.51%
32.48%
Profit Before Tax(PBT)68.54 69.90 274.98
Net Profit after Tax 53.77 54.98 216.27
Net Profit Margin 25.01% 27.99% 26.64%
Particulars As on
31.03.2018As on
31.03.2018
Shareholders Equity 559.13 505.36
Net Fixed Assets 58.72 57.10
Investments (including Bank FDs, Debt MF and Government Securities & Bonds)
475.43 443.74
Net Current Assets 24.98 4.52
(Rs. In Crore)(Rs. In Crore)
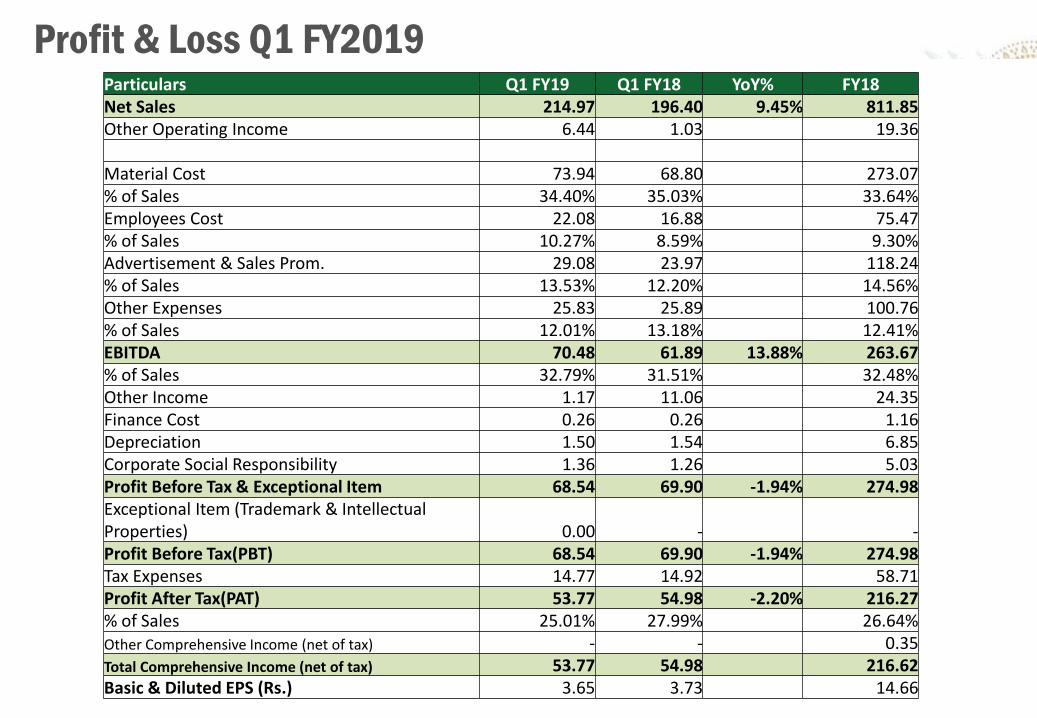
✓ Overall Company Value growth (unadjusted) 9.45% (Q-Q) GST value adjusted growth 13.19%
✓ Increase in EBITDA by 13.88% (Q-Q) now increased to Rs. 70.48 Cr (32.79%) from Rs.61.89 Cr (31.51%).
✓ Drop in PAT due to decrease in other income, largely on account of M-to-M losses.
37
Rs. in CroreProfit & Loss Q1 FY2019
Particulars Q1 FY19 Q1 FY18 YoY% FY18Net Sales 214.97 196.40 9.45% 811.85Other Operating Income 6.44 1.03 19.36
Material Cost 73.94 68.80 273.07% of Sales 34.40% 35.03% 33.64%Employees Cost 22.08 16.88 75.47% of Sales 10.27% 8.59% 9.30%Advertisement & Sales Prom. 29.08 23.97 118.24% of Sales 13.53% 12.20% 14.56%Other Expenses 25.83 25.89 100.76 % of Sales 12.01% 13.18% 12.41%EBITDA 70.48 61.89 13.88% 263.67% of Sales 32.79% 31.51% 32.48%Other Income 1.17 11.06 24.35Finance Cost 0.26 0.26 1.16Depreciation 1.50 1.54 6.85Corporate Social Responsibility 1.36 1.26 5.03Profit Before Tax & Exceptional Item 68.54 69.90 -1.94% 274.98 Exceptional Item (Trademark & Intellectual Properties) 0.00 - -Profit Before Tax(PBT) 68.54 69.90 -1.94% 274.98Tax Expenses 14.77 14.92 58.71 Profit After Tax(PAT) 53.77 54.98 -2.20% 216.27% of Sales 25.01% 27.99% 26.64%Other Comprehensive Income (net of tax) - - 0.35Total Comprehensive Income (net of tax) 53.77 54.98 216.62Basic & Diluted EPS (Rs.) 3.65 3.73 14.66
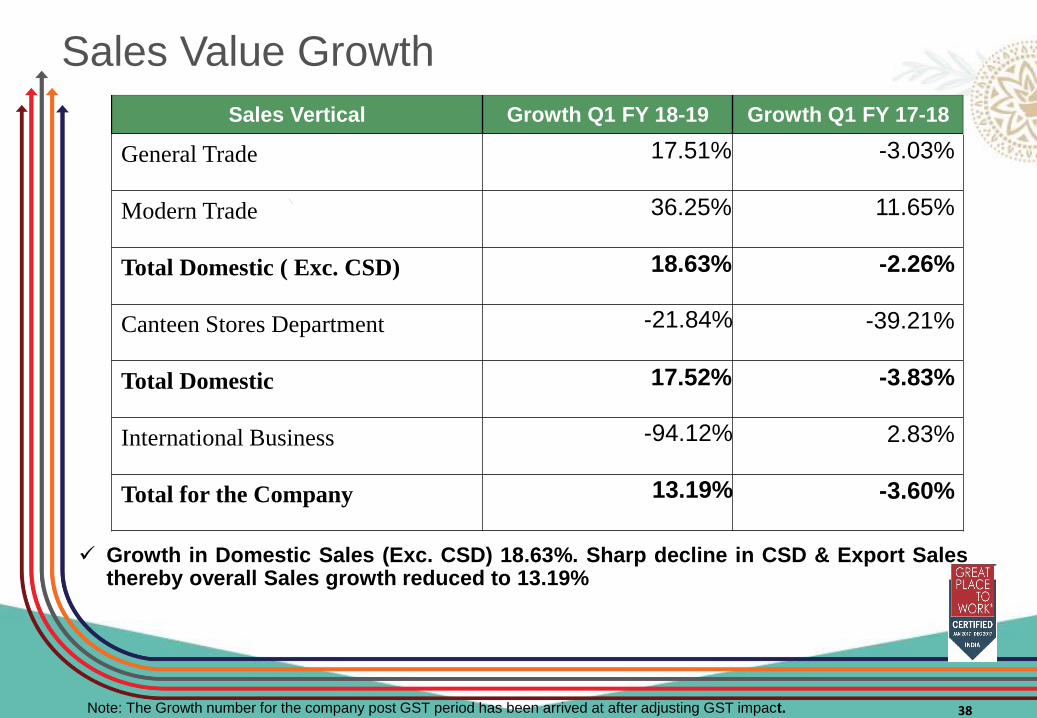
Sales Value Growth
38Note: The Growth number for the company post GST period has been arrived at after adjusting GST impact.
Sales Vertical Growth Q1 FY 18-19 Growth Q1 FY 17-18
General Trade 17.51% -3.03%
Modern Trade 36.25% 11.65%
Total Domestic ( Exc. CSD) 18.63% -2.26%
Canteen Stores Department -21.84% -39.21%
Total Domestic 17.52% -3.83%
International Business -94.12% 2.83%
Total for the Company 13.19% -3.60%
✓ Growth in Domestic Sales (Exc. CSD) 18.63%. Sharp decline in CSD & Export Salesthereby overall Sales growth reduced to 13.19%

Statement of Quarter wise Sales (Volume)
39
STATEMENT OF QUARTERWISE SALES (VOLUME - In Cases )
PRODUCT Q1 FY 19 % to Total Q1 FY 18 % to Total% Growth
Q-Q
ADHO 1,318,489 95.92% 1,185,731 93.75% 11.20%
Nomarks 25,756 1.87% 24,817 1.96% 3.78%
BAHO 7,147 0.52% 9,408 0.74% -24.03%
AHO 14,342 1.04% 32,058 2.53% -55.26%
KPCO 3,487 0.25% 7,407 0.59% -52.92%
Others 5,331 0.39% 5,347 0.42% -0.30%
Total 1,374,552 100.00% 1,264,768 100.00% 8.68%
✓ Volume Growth in ADHO : 11.20 %✓ Overall volume growth of 8.68% (Q-Q)
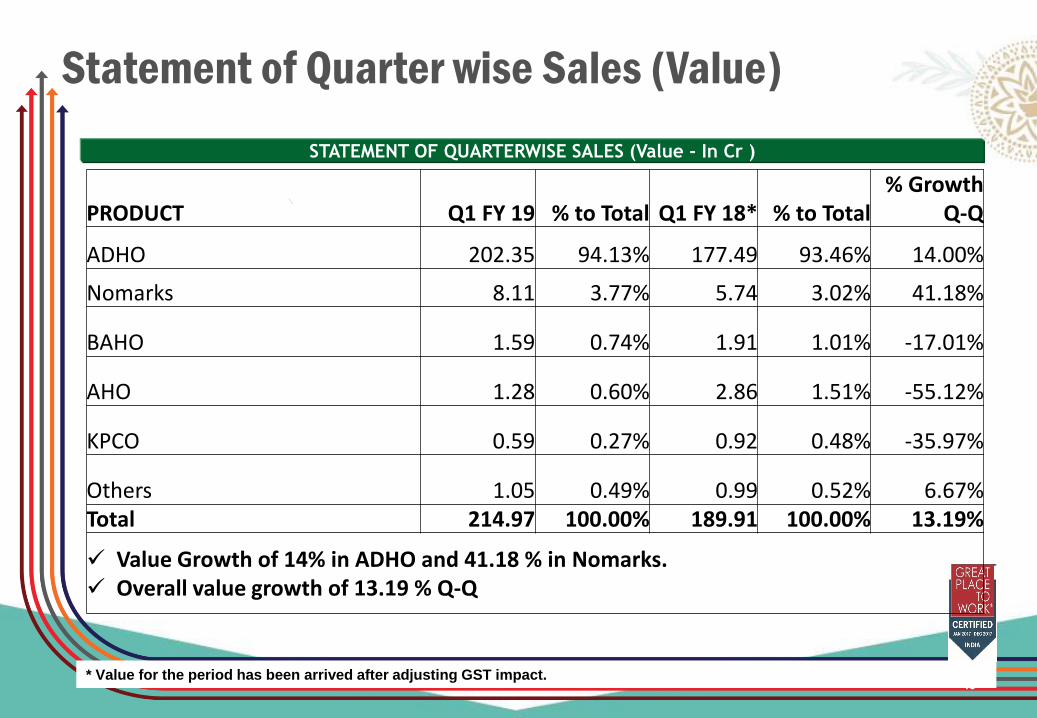
Statement of Quarter wise Sales (Value)
40
STATEMENT OF QUARTERWISE SALES (Value - In Cr )
PRODUCT Q1 FY 19 % to Total Q1 FY 18* % to Total% Growth
Q-Q
ADHO 202.35 94.13% 177.49 93.46% 14.00%
Nomarks 8.11 3.77% 5.74 3.02% 41.18%
BAHO 1.59 0.74% 1.91 1.01% -17.01%
AHO 1.28 0.60% 2.86 1.51% -55.12%
KPCO 0.59 0.27% 0.92 0.48% -35.97%
Others 1.05 0.49% 0.99 0.52% 6.67%Total 214.97 100.00% 189.91 100.00% 13.19%
✓ Value Growth of 14% in ADHO and 41.18 % in Nomarks.✓ Overall value growth of 13.19 % Q-Q
* Value for the period has been arrived after adjusting GST impact.
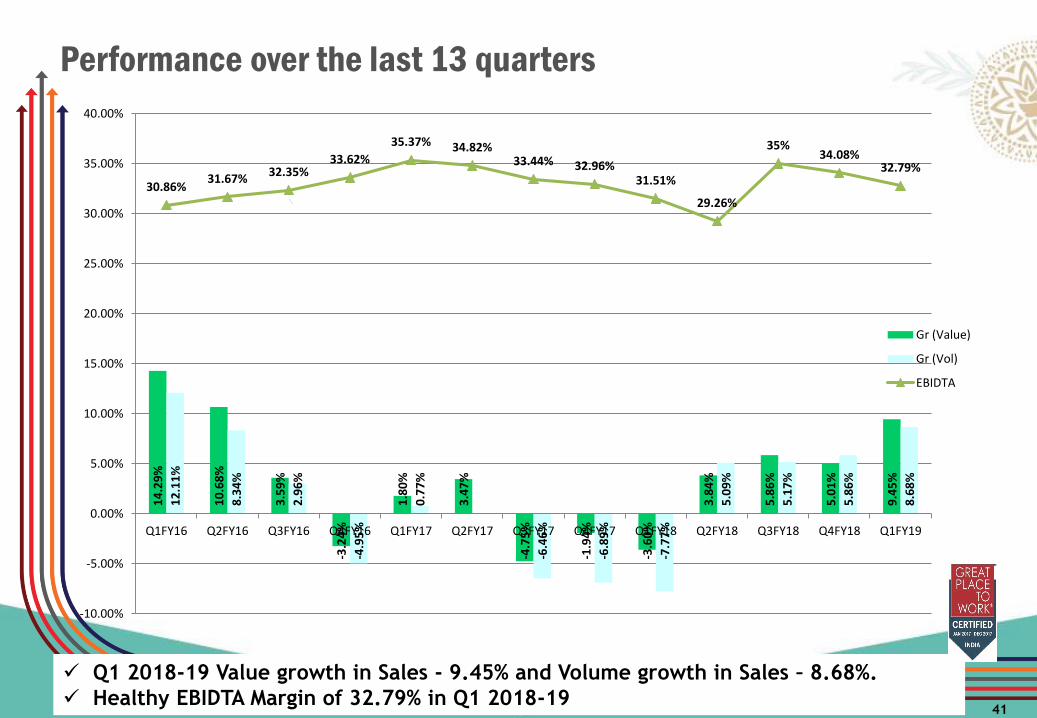
Performance over the last 13 quarters
41
14
.29
%
10
.68
%
3.5
9%
-3.2
4%
1.8
0%
3.4
7%
-4.7
5%
-1.9
4%
-3.6
0%
3.8
4%
5.8
6%
5.0
1%
9.4
5%
12
.11
%
8.3
4%
2.9
6%
-4.9
5%
0.7
7%
-6.4
6%
-6.8
9%
-7.7
7%
5.0
9%
5.1
7%
5.8
6%
8.6
8%
30.86%31.67%
32.35%33.62%
35.37% 34.82%33.44% 32.96%
31.51%
29.26%
35%34.08%
32.79%
-10.00%
-5.00%
0.00%
5.00%
10.00%
15.00%
20.00%
25.00%
30.00%
35.00%
40.00%
Q1FY16 Q2FY16 Q3FY16 Q4FY16 Q1FY17 Q2FY17 Q3FY17 Q4FY17 Q1FY18 Q2FY18 Q3FY18 Q4FY18 Q1FY19
Gr (Value)
Gr (Vol)
EBIDTA
✓ Q1 2018-19 Value growth in Sales - 9.45% and Volume growth in Sales – 8.68%.
✓ Healthy EBIDTA Margin of 32.79% in Q1 2018-19
42
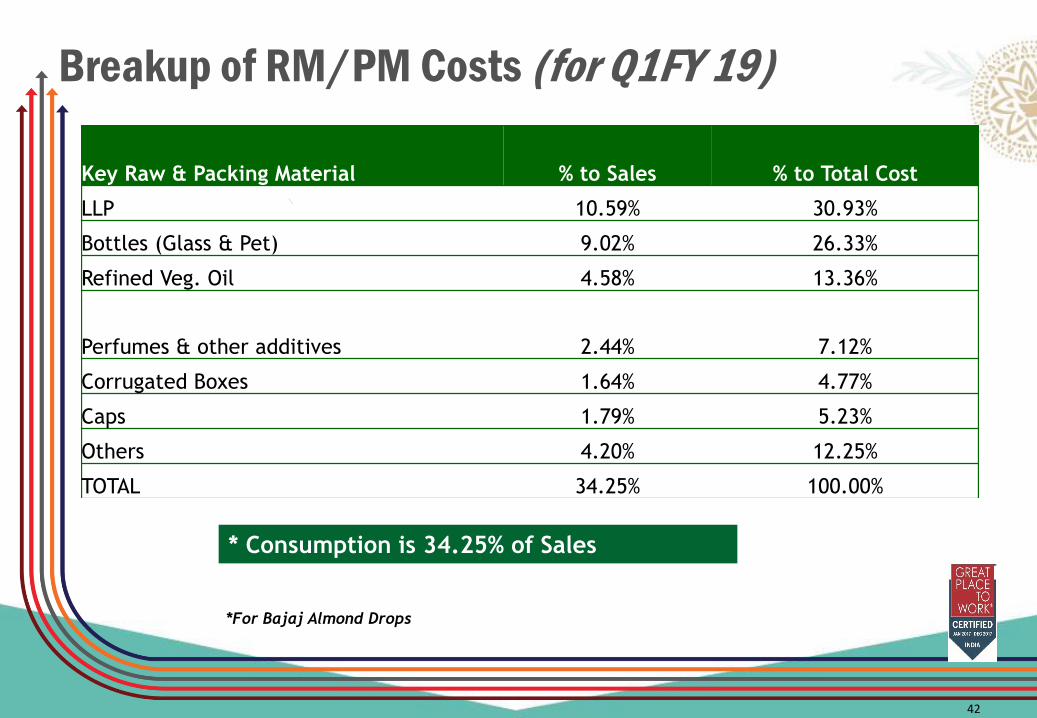
Breakup of RM/PM Costs (for Q1FY 19)
Key Raw & Packing Material % to Sales % to Total Cost
LLP 10.59% 30.93%
Bottles (Glass & Pet) 9.02% 26.33%
Refined Veg. Oil 4.58% 13.36%
Perfumes & other additives 2.44% 7.12%
Corrugated Boxes 1.64% 4.77%
Caps 1.79% 5.23%
Others 4.20% 12.25%
TOTAL 34.25% 100.00%
* Consumption is 34.25% of Sales
*For Bajaj Almond Drops
✓ The adjusted landed cost of LLP during the quarter is Rs. 60.46/Kg. (after adjusting ITC of
Rs. 9.66/Kg).
✓ The adjusted landed cost of Refined Oil during the quarter is Rs. 81.88/Kg (after adjusting
ITC of Rs. 4.10/Kg).
43
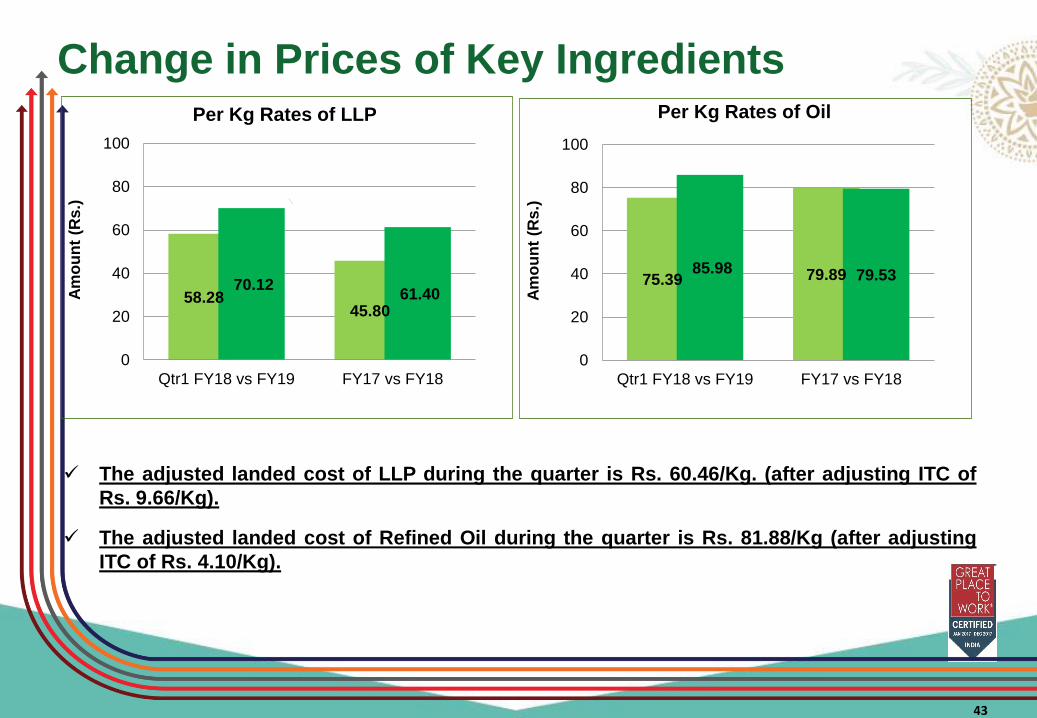
58.28 45.80
70.12 61.40
0
20
40
60
80
100
Qtr1 FY18 vs FY19 FY17 vs FY18
Am
ou
nt
(Rs
.)
Per Kg Rates of LLP
75.39 79.8985.98 79.53
0
20
40
60
80
100
Qtr1 FY18 vs FY19 FY17 vs FY18
Am
ou
nt
(Rs
.)
Per Kg Rates of Oil
Change in Prices of Key Ingredients
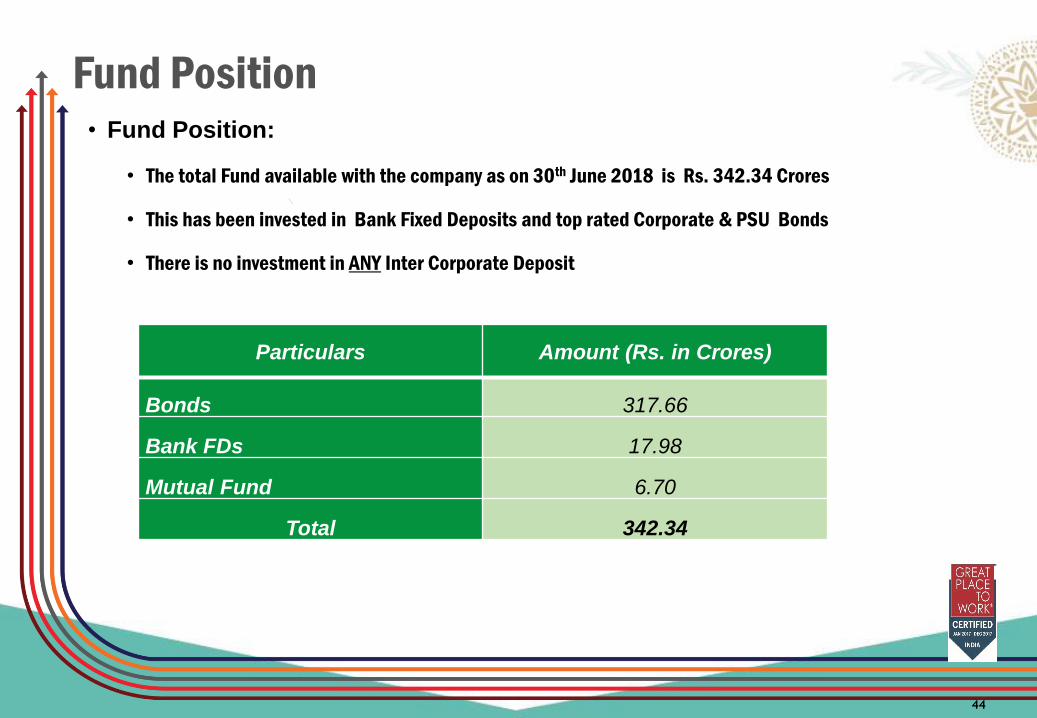
Fund Position• Fund Position:
• The total Fund available with the company as on 30th June 2018 is Rs. 342.34 Crores
• This has been invested in Bank Fixed Deposits and top rated Corporate & PSU Bonds
• There is no investment in ANY Inter Corporate Deposit
44
Particulars Amount (Rs. in Crores)
Bonds 317.66
Bank FDs 17.98
Mutual Fund 6.70
Total 342.34
45
M2M Effect on Other Income
• As part of Accounting standards, we have recognized fair value of our investments in Corporate bonds as on 30th June 2018
• There has been an MTM loss of Rs. 5.47 crores at the quarter end against MTM gain of Rs. 2.79 crores in corresponding quarter in previous year
• The investments are in top AAA rated bonds however due to currency volatility at quarter end, interest rates spike resulted in MTM loss for this quarter
• If this MTM loss is not considered then Other Income would have been Rs. 6.64 crores and PAT would have been Rs. 58.06 crs (10% increase Q-Q)
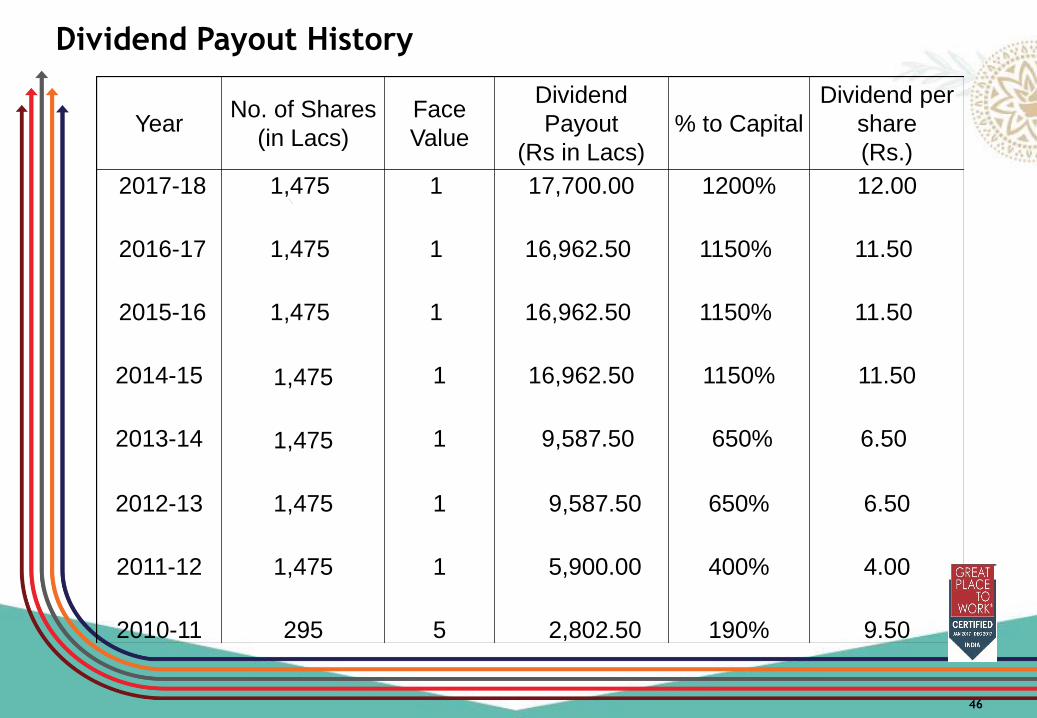
YearNo. of Shares
(in Lacs)
Face
Value
Dividend
Payout
(Rs in Lacs)
% to Capital
Dividend per
share
(Rs.)
2017-18 1,475 1 17,700.00 1200% 12.00
2016-17 1,475 1 16,962.50 1150% 11.50
2015-16 1,475 1 16,962.50 1150% 11.50
2014-15 1,475 1 16,962.50 1150% 11.50
2013-14 1,475 1 9,587.50 650% 6.50
2012-13 1,475 1 9,587.50 650% 6.50
2011-12 1,475 1 5,900.00 400% 4.00
2010-11 295 5 2,802.50 190% 9.50
46
Dividend Payout History

THANK YOU