Embed Size (px)
Citation preview
Bad Matches Last Longer – Unobserved
Heterogeneity across Firm-Owner Matches
Markus Brendel∗
HHL Leipzig Graduate School of Management, Germany
First draft: 11 December 2013
Abstract
Most of the recent studies on the value impact of ownership con-
centration have considered firm heterogeneity as a potential source of
endogeneity. This paper suggests ownership concentration to be addi-
tionally correlated with unobserved firm-owner match characteristics
that affect firm valuation. Using a sample of CDAX firms for 2000-
2009, we find the emergence of a good – value enhancing – matches to
be more likely at low ownership concentration. At the same time, sta-
ble matches are characterized by high ownership concentration of the
controlling owner. We use the variation of ownership concentration
over a given firm-owner spell as instrumental variable. This variation
is uncorrelated by construction with the fixed firm as well as firm-
owner match component of the error term of the firm value equation.
Our main finding is that neglecting unobserved match effects under-
states the positive effect of control ownership in Germany.
Keywords and Classification JEL classification: G32, G34
Key words: Unobserved heterogeneity · firm-owner match · ownership concentra-
tion · agency conflicts
∗Corresponding author; email: [email protected].
1
1 Introduction
It has been an old and long time discussion whether ownership concentration
in the hands of a controlling blockholder is value increasing or destroying.
The theoretical background is briefly told, it is the story about a double
edged sword often encountered in fairy tales. There is the light side of own-
ership concentration coming from the proposition that large shareholders
have greater power and incentives to ensure shareholder value maximization.
That is done by monitoring the management, which is beneficial to all share-
holders (Jensen and Meckling, 1976; Zeckhouser and Pound, 1990; Burkart,
1997). On the flip side, controlling shareholders may misuse their power to
consume private benefits at the expense of minority shareholders which even-
tually leads to a discount of the firm value (Fama and Jensen, 1983; Shleifer
and Vishny, 1997). As things get even more complicated when testing the
impact of control ownership empirically, retrieving a causal relationship be-
tween ownership structure and firm value is found to be rather challenging in
the presence of severe endogeneity concerns. The seminal papers by Demsetz
(1983), and Demsetz and Lehn (1985) suspect ownership and firm value to
be determined simultaneously. Himmelberg et al. (1999), however, argue
in favor of unobservable heterogeneity (i.e. omitted variable bias) to be the
major source of endogeneity. They stress fixed firm-effects as the once to
be blamed for the spurious correlation between ownership and firm perfor-
mance.1 But critique did not take long to emerge in the subsequent literature.
Zhou (2001) raised concerns over the fixed effects (within-group) estimator as
variation in ownership concentration is usually rich in across-firm variation,
but small within firms when tracking ownership in a panel dataset. He con-
cludes by promoting instrumental variable estimators to be more appropriate
when accounting for firm heterogeneity. Beyond that, other sources of un-
observed heterogeneity were neglected at this time. However, Cronquist and
Fahlenbrach (2008) started to additionally consider blockholder fixed effects
suggesting controlling shareholders to differ systematically in their skills and
1In the case of Himmelberg et al. (1999), the positive effect of managerial blockholderownership disappears once firm fixed-effects are taken into account.
2
preferences – everything else being equal. This heterogeneity among control-
ling owners becomes of interest as it implies differences in their beliefs on
what constitutes ‘good policies’ towards firm value and utility maximization.
This argumentation is in line with other studies (e.g. Giannetti and Simonov,
2006) that point towards differences in investors motivation to invest into a
firm with respect to monitoring effort and minority shareholder expropri-
ation. Some investor types (e.g. strategic investors) are found to exert a
comparably unfavorable impact on firm valuation as they also follow other
motives than shareholder value maximization; examples include extraction
of private benefits and information, respectively. The opposite is suggested
to hold true for institutional investors (Rapp and Trinchera, 2011).
We now extend the idea of blockholder heterogeneity by introducing the
notion of unobservable firm-owner match effects, which come about when a
firm i is controlled by any owner j. In our econometric exercise we find a
negative relationship between ‘quality’ of the firm-owner match and owner-
ship concentration. In other words, good firm-owner matches are more likely
to occur at lower ownership concentration levels. This finding feeds in a
downward bias of the average effect of ownership concentration on firm value
once we do not account for this match heterogeneity. Thanks to our instru-
mental variable (IV) approach that acts in the spirit of Altonji and Shkotko
(1987), we are able to correct for both firm and match specific heterogeneity
simultaneously, and beyond that, this approach gives us the opportunity to
work out the relative importance of each bias. Eventually, our estimates of
the true effect of ownership concentration – free from firm and match specific
heterogeneity – suggest a positive effect on firm value in Germany.
At the same time, our descriptive analysis suggest long control spells –
that owner j is in control of firm i for many years – to come along with high
ownership concentration as the controlling owner primarily comes in with a
high control stake or partly buys additional shares over time to defend and
strengthen his position.
The remainder of the paper is organized as follows. Section 2 introduces
our econometric framework and our identification assumptions that help us
to eliminate and to contrast the two major sources of unobserved hetero-
3
geneity. Section 3 describes the data set, in particular with respect to the
relationship between ownership concentration and control duration of the
controlling owner. We present and discuss the results of our econometric
exercise in Section 4. Section 5 concludes.
2 Estimation Framework
In this section, we introduce various regression estimators that help us to
identify and then to eliminate possible bias that stem from unobservable
firm-owner match effects.
2.1 Empirical Model
In our empirical model, we assume that the value of a firm i held by with
the controlling owner j at time t is determined by the following regression
equation:
Yijt = β1Xijt +W ′ijtδ + εijt. (1)
The variable Yijt denotes Tobin’s Q as a measure of firm value, Xijt is
the ownership concentration of the controlling owner j in firm i given in
percent2, W ′ijt is a 1×k vector of observable firm characteristics3 also includ-
ing the constant. An alternative model specification adds squared ownership
concentration (X2ijt) to the estimation equation in order to control for a non-
monotonic relationship between control ownership and firm value.4 However,
for ease of demonstration, we will discuss our estimation strategy assuming a
linear effect of control ownership, but we account for non-linear effects later
in our regression analysis.
2In the following also referred to as control ownership or control concentration.3We include firm size, leverage, EBIT to sales, dividend payments, sales growth,
CAPEX to sales; for definitions please refer to the appendix.4In particular, a non-linear relation was documented for insider ownership concentra-
tion (e.g. Morck et al., 1988; McConnell and Servaes, 1990). They find an invertedU-shaped relation between Tobin’s Q and managerial ownership with an ‘inflection’ pointbetween 40% and 50%.
4
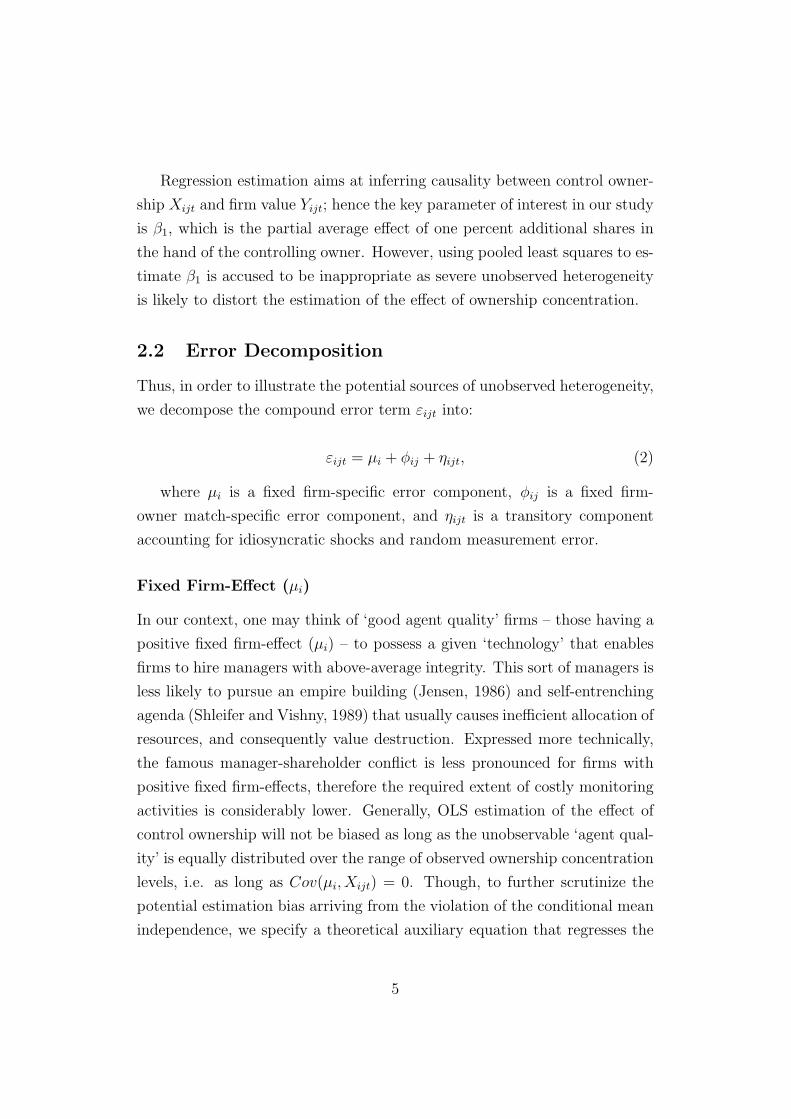
Regression estimation aims at inferring causality between control owner-
ship Xijt and firm value Yijt; hence the key parameter of interest in our study
is β1, which is the partial average effect of one percent additional shares in
the hand of the controlling owner. However, using pooled least squares to es-
timate β1 is accused to be inappropriate as severe unobserved heterogeneity
is likely to distort the estimation of the effect of ownership concentration.
2.2 Error Decomposition
Thus, in order to illustrate the potential sources of unobserved heterogeneity,
we decompose the compound error term εijt into:
εijt = µi + ϕij + ηijt, (2)
where µi is a fixed firm-specific error component, ϕij is a fixed firm-
owner match-specific error component, and ηijt is a transitory component
accounting for idiosyncratic shocks and random measurement error.
Fixed Firm-Effect (µi)
In our context, one may think of ‘good agent quality’ firms – those having a
positive fixed firm-effect (µi) – to possess a given ‘technology’ that enables
firms to hire managers with above-average integrity. This sort of managers is
less likely to pursue an empire building (Jensen, 1986) and self-entrenching
agenda (Shleifer and Vishny, 1989) that usually causes inefficient allocation of
resources, and consequently value destruction. Expressed more technically,
the famous manager-shareholder conflict is less pronounced for firms with
positive fixed firm-effects, therefore the required extent of costly monitoring
activities is considerably lower. Generally, OLS estimation of the effect of
control ownership will not be biased as long as the unobservable ‘agent qual-
ity’ is equally distributed over the range of observed ownership concentration
levels, i.e. as long as Cov(µi, Xijt) = 0. Though, to further scrutinize the
potential estimation bias arriving from the violation of the conditional mean
independence, we specify a theoretical auxiliary equation that regresses the
5
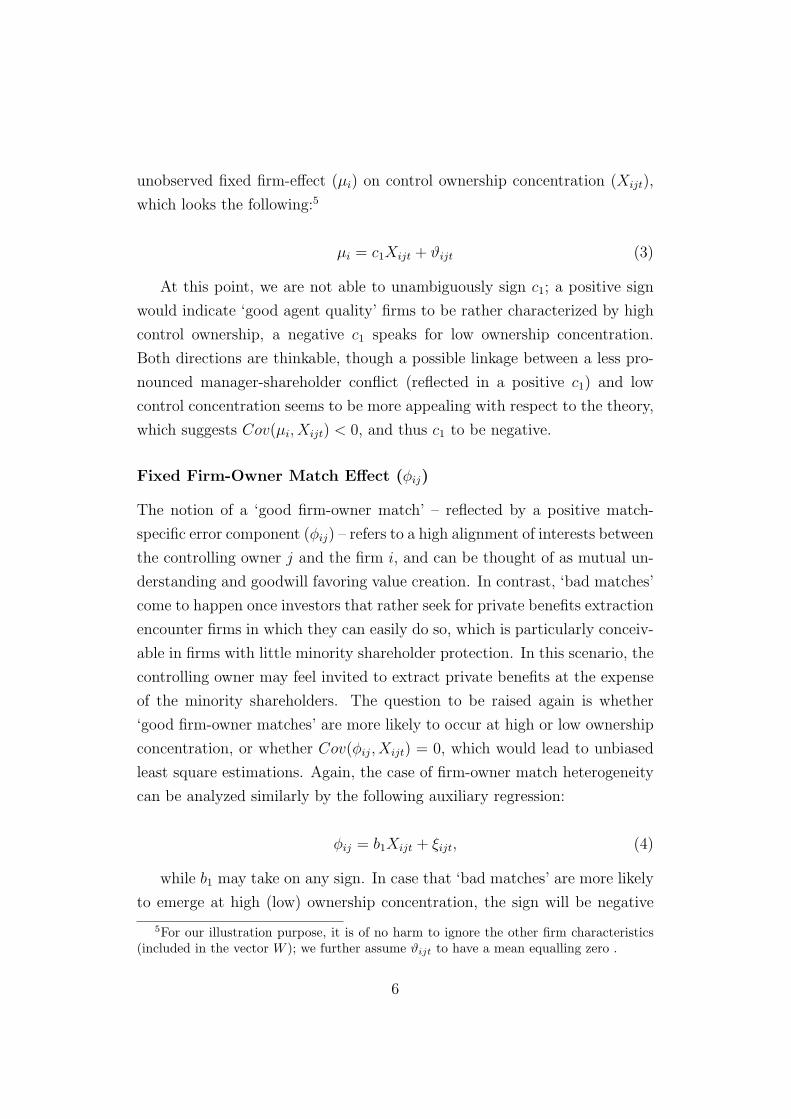
unobserved fixed firm-effect (µi) on control ownership concentration (Xijt),
which looks the following:5
µi = c1Xijt + ϑijt (3)
At this point, we are not able to unambiguously sign c1; a positive sign
would indicate ‘good agent quality’ firms to be rather characterized by high
control ownership, a negative c1 speaks for low ownership concentration.
Both directions are thinkable, though a possible linkage between a less pro-
nounced manager-shareholder conflict (reflected in a positive c1) and low
control concentration seems to be more appealing with respect to the theory,
which suggests Cov(µi, Xijt) < 0, and thus c1 to be negative.
Fixed Firm-Owner Match Effect (ϕij)
The notion of a ‘good firm-owner match’ – reflected by a positive match-
specific error component (ϕij) – refers to a high alignment of interests between
the controlling owner j and the firm i, and can be thought of as mutual un-
derstanding and goodwill favoring value creation. In contrast, ‘bad matches’
come to happen once investors that rather seek for private benefits extraction
encounter firms in which they can easily do so, which is particularly conceiv-
able in firms with little minority shareholder protection. In this scenario, the
controlling owner may feel invited to extract private benefits at the expense
of the minority shareholders. The question to be raised again is whether
‘good firm-owner matches’ are more likely to occur at high or low ownership
concentration, or whether Cov(ϕij, Xijt) = 0, which would lead to unbiased
least square estimations. Again, the case of firm-owner match heterogeneity
can be analyzed similarly by the following auxiliary regression:
ϕij = b1Xijt + ξijt, (4)
while b1 may take on any sign. In case that ‘bad matches’ are more likely
to emerge at high (low) ownership concentration, the sign will be negative
5For our illustration purpose, it is of no harm to ignore the other firm characteristics(included in the vector W ); we further assume ϑijt to have a mean equalling zero .
6
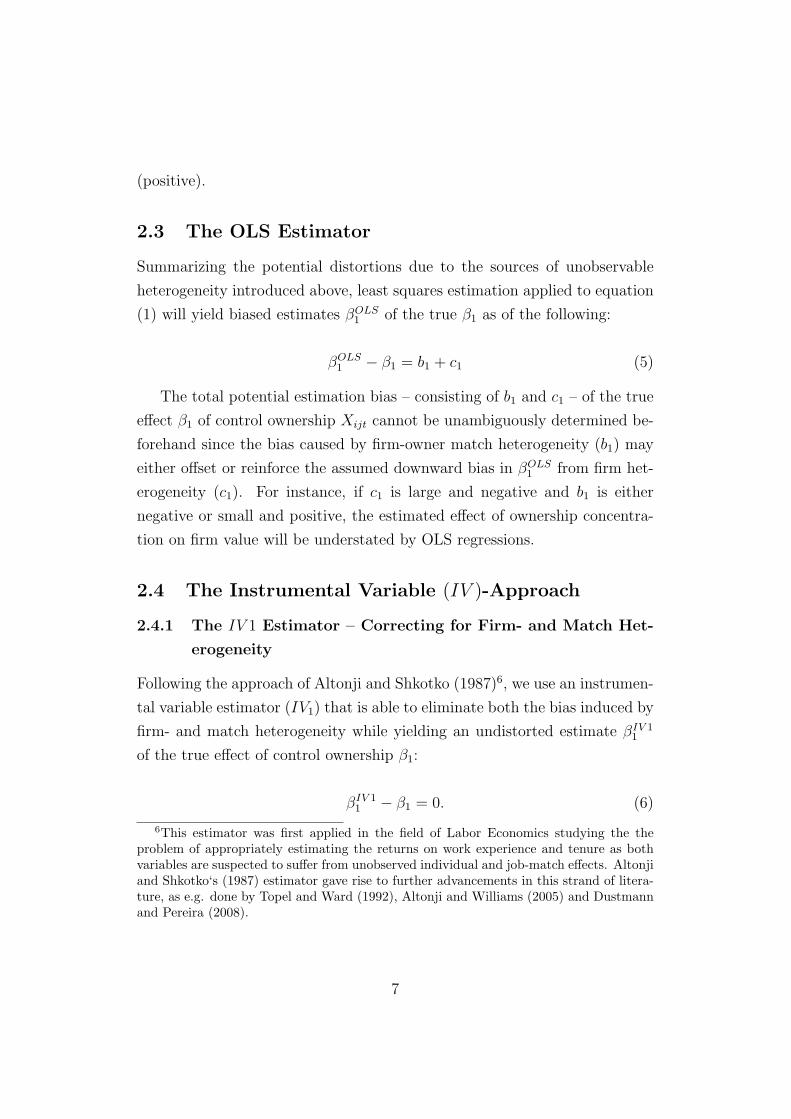
(positive).
2.3 The OLS Estimator
Summarizing the potential distortions due to the sources of unobservable
heterogeneity introduced above, least squares estimation applied to equation
(1) will yield biased estimates βOLS1 of the true β1 as of the following:
βOLS1 − β1 = b1 + c1 (5)
The total potential estimation bias – consisting of b1 and c1 – of the true
effect β1 of control ownership Xijt cannot be unambiguously determined be-
forehand since the bias caused by firm-owner match heterogeneity (b1) may
either offset or reinforce the assumed downward bias in βOLS1 from firm het-
erogeneity (c1). For instance, if c1 is large and negative and b1 is either
negative or small and positive, the estimated effect of ownership concentra-
tion on firm value will be understated by OLS regressions.
2.4 The Instrumental Variable (IV )-Approach
2.4.1 The IV 1 Estimator – Correcting for Firm- and Match Het-
erogeneity
Following the approach of Altonji and Shkotko (1987)6, we use an instrumen-
tal variable estimator (IV1) that is able to eliminate both the bias induced by
firm- and match heterogeneity while yielding an undistorted estimate βIV 11
of the true effect of control ownership β1:
βIV 11 − β1 = 0. (6)
6This estimator was first applied in the field of Labor Economics studying the theproblem of appropriately estimating the returns on work experience and tenure as bothvariables are suspected to suffer from unobserved individual and job-match effects. Altonjiand Shkotko‘s (1987) estimator gave rise to further advancements in this strand of litera-ture, as e.g. done by Topel and Ward (1992), Altonji and Williams (2005) and Dustmannand Pereira (2008).
7
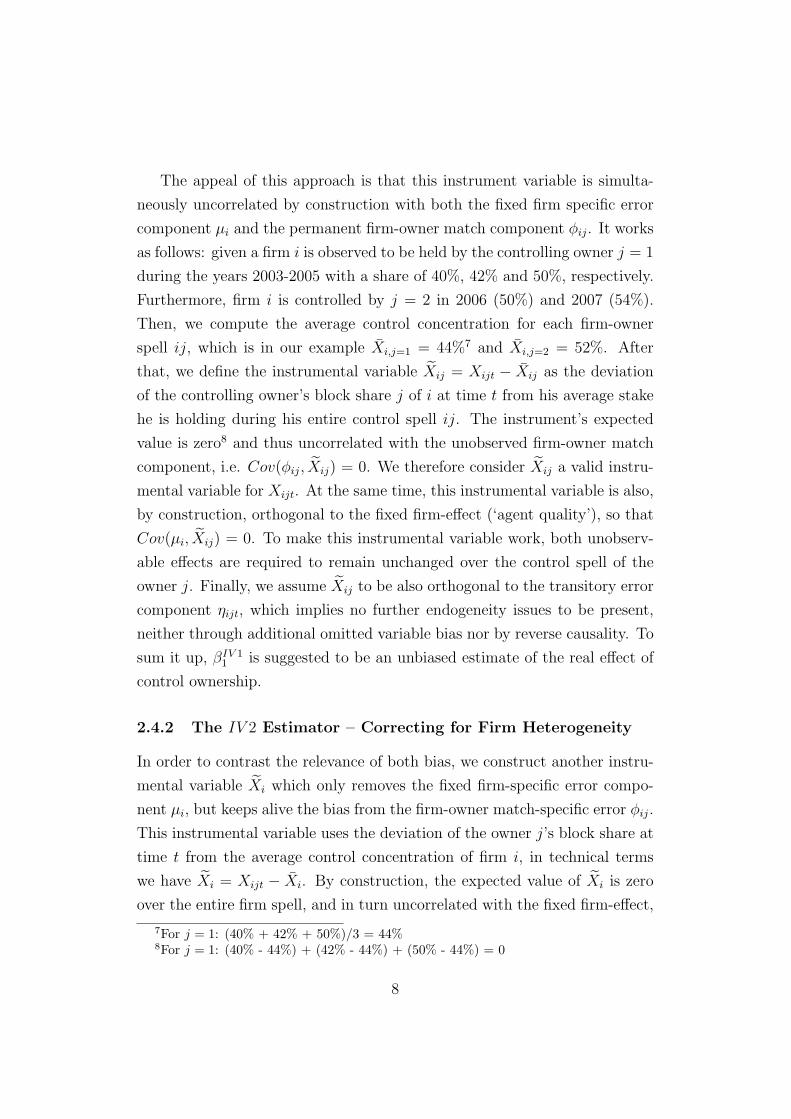
The appeal of this approach is that this instrument variable is simulta-
neously uncorrelated by construction with both the fixed firm specific error
component µi and the permanent firm-owner match component ϕij. It works
as follows: given a firm i is observed to be held by the controlling owner j = 1
during the years 2003-2005 with a share of 40%, 42% and 50%, respectively.
Furthermore, firm i is controlled by j = 2 in 2006 (50%) and 2007 (54%).
Then, we compute the average control concentration for each firm-owner
spell ij, which is in our example X̄i,j=1 = 44%7 and X̄i,j=2 = 52%. After
that, we define the instrumental variable X̃ij = Xijt − X̄ij as the deviation
of the controlling owner’s block share j of i at time t from his average stake
he is holding during his entire control spell ij. The instrument’s expected
value is zero8 and thus uncorrelated with the unobserved firm-owner match
component, i.e. Cov(ϕij, X̃ij) = 0. We therefore consider X̃ij a valid instru-
mental variable for Xijt. At the same time, this instrumental variable is also,
by construction, orthogonal to the fixed firm-effect (‘agent quality’), so that
Cov(µi, X̃ij) = 0. To make this instrumental variable work, both unobserv-
able effects are required to remain unchanged over the control spell of the
owner j. Finally, we assume X̃ij to be also orthogonal to the transitory error
component ηijt, which implies no further endogeneity issues to be present,
neither through additional omitted variable bias nor by reverse causality. To
sum it up, βIV 11 is suggested to be an unbiased estimate of the real effect of
control ownership.
2.4.2 The IV 2 Estimator – Correcting for Firm Heterogeneity
In order to contrast the relevance of both bias, we construct another instru-
mental variable X̃i which only removes the fixed firm-specific error compo-
nent µi, but keeps alive the bias from the firm-owner match-specific error ϕij.
This instrumental variable uses the deviation of the owner j’s block share at
time t from the average control concentration of firm i, in technical terms
we have X̃i = Xijt − X̄i. By construction, the expected value of X̃i is zero
over the entire firm spell, and in turn uncorrelated with the fixed firm-effect,
7For j = 1: (40% + 42% + 50%)/3 = 44%8For j = 1: (40% - 44%) + (42% - 44%) + (50% - 44%) = 0
8
hence Cov(µi, X̃i) = 0. However, this instrument may still be correlated with
the match effect (Cov(ϕij, X̃i) ̸= 0), so that the IV2 estimator still produces
the bias b1 in the estimated effect of control concentration βIV 21 :
βIV 21 − β1 = b1. (7)
2.5 Prediction of Bias Direction and Relevance
Applying our identification procedure, we are now able to retrieve evidence on
the parameters b1 and c1, thus the relative importance of firm and firm-owner
match heterogeneity. To be more precise, the different estimates of the effect
of control ownership (βOLS1 , βIV 1
1 , βIV 21 ) allow us to draw inference whether
there is any heterogeneity issue, and if so, whether the two unobserved effects
go in the same direction, or if we have the case of mixed unobserved effects.
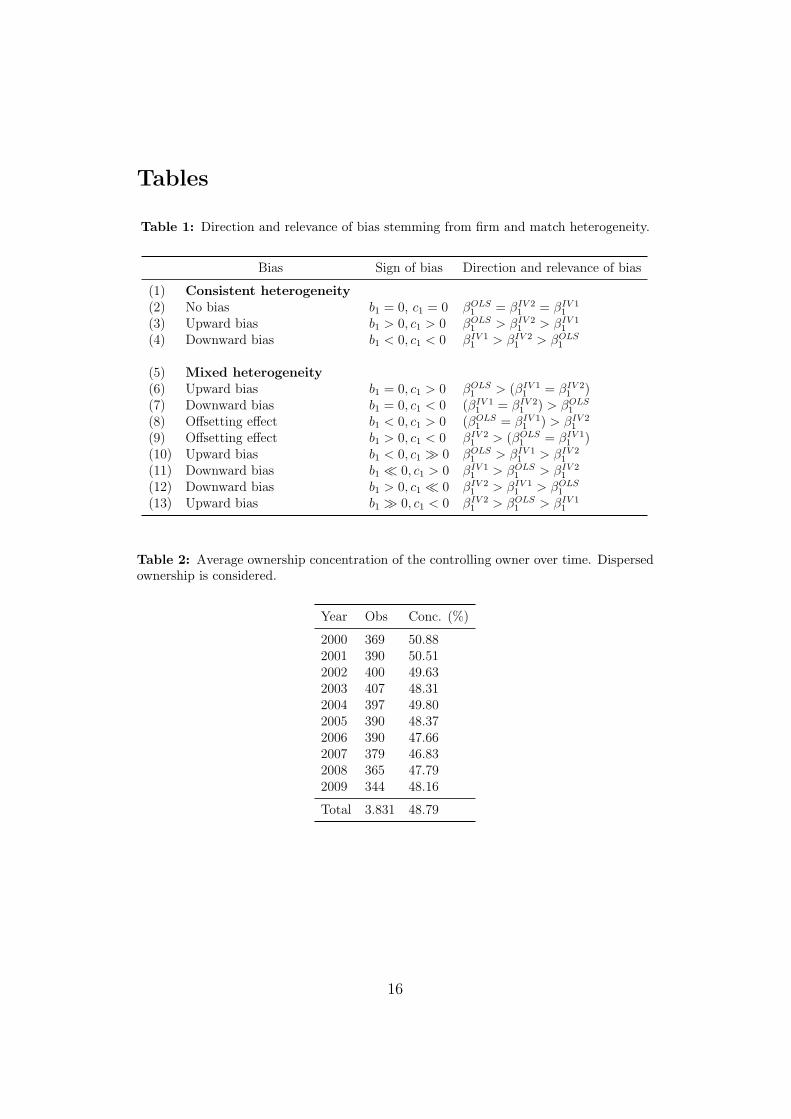
Please insert Table 1 approximately here
Table 1 provides an overview of possible scenarios of estimates with cor-
responding inference on the unobserved effects. It is self-explanatory is that
if we come across alike estimates (row 2), we do not have to worry about
any heterogeneity concerns. However, if we find βOLS1 > βIV 2
1 > βIV 11 , thus a
twofold upward biased OLS estimator, we can infer that both, the firm spe-
cific error (‘agent quality’) µi as well as the match-specific error ϕij are pos-
itively correlated with control ownership (row 3). If the opposite holds (row
4), i.e. if we have a negative correlation between ownership concentration
and both the heterogeneity sources, we will end up with βOLS1 < βIV 2
1 < βIV 11 ,
which is a consistently downward biased OLS estimator. Mixed heterogene-
ity effects are also conceivable; taking the most commonly assumed case of
fixed firm-effects with respect to control concentration, thus c1 ̸= 0, but no
firm-owner match effects (b1 = 0), we expect both instruments to deliver
equal results (βIV 11 = βIV 2
1 ) while deviating from the OLS estimate (row 6
and 7). Row 8 and 9 depict the case when both effects are present but per-
fectly offset each other; then βOLS1 will be equal to βIV 1
1 , but at the same
time higher (upward bias) or lower (downward) than βIV 21 . Both unobserved
9
effects may further differ in direction and magnitude. Once the fixed firm-
effect is stronger than the match effect (row 10 and 12), considering only firm
heterogeneity (βIV 21 ) will still provide the right direction of the bias, though
overstate the effect. However, following the conventional wisdom of only
controlling for firm effects will be strongly misleading once the unobserved
match effect is stronger and at odds with the firm effect (row 11 and 13).
For example, in case of a strong negative match-effect and a slightly positive
firm-effect (row 11), βIV 21 will indicate an upward biased OLS estimate βOLS
1 ,
though this estimate is actually suffering from an overall downward bias as
shown when exploring the difference with respect to βIV 11 .
3 Data and Sample Description
3.1 Sample
The starting point of our study is a sample of all CDAX-listed firms in Ger-
many comprising the years 2000-2009. The ownership data used in this study
come from the ”Wer gehoert zu wem?” database published by Commerzbank.
All financial data matched to the ownership data are retrieved from World-
scope / Datastream. We exclude all financial firms (SIC 6000-6999) and
utilities (SIC 4900-4949) from our sample as well as those firms with missing
or incomplete ownership information, ending up with a total sample size of
3831 firm-year observations comprising 499 different CDAX firms (see Table
2).
In order to account for the effects of the various firm-owner matches ij,
we need to identify the appropriate spell length of owner j he is in control
of firm i. At this point, we make the simplifying assumption that the own-
ers’ differences in beliefs and preferences are chiefly manifested by their legal
form, since individuals, for instance, (e.g. families) follow in general a dif-
ferent agenda than foreign investors. The appendix entails the assignment
rules used to determine whether a controlling owner is a corporation, a non-
incorporated firm, an individual, a state owner or a foreign investor.9 Thus,
9This rather broad identification assumption is also needed as owners names stated
10
once a change in the legal form of the controlling owner is observed (e.g. from
family to corporation), we infer a change in the controlling owner. Alterna-
tive definitions of controlling owners – e.g. by type (institutional investor,
strategic investor, etc.) as well as by name – are found to also hold, but
corresponding analysis are not yet included in this first draft of our study.
Further, we define owner j to control i in a row of years even if there are
disruptions of control ownership of one or two years. The measure of control
ownership refers to voting rights at the direct ownership level while implicitly
assuming the ‘one share-one vote’ principle to hold.10
3.2 Summary Statistics
Table 2 presents the development of average control ownership in Germany
over the time span of 2000-2009. In accordance with other studies (e.g. Fac-
cio and Lang, 2002), we find strong evidence for a pronounced ownership
concentration in the hands of the controlling owner with an across-year av-
erage of 48.8%. Ownership concentration decreased slightly over time with
an ownership concentration of 50.88% recorded in 2000 compared to 48.16%
in 2009.
Please insert Table 2 approximately here
Up to this point, these are all well explored findings. What comes sur-
prisingly to the reader, however, is the relationship between average control
concentration and length of the control spell. Table 3 shows that the average
control stake of owner j is higher the longer he is in control of firm i. While
an average owner holds a share block of 43.25% in his first year of control
ownership, the control stake is 51.48% in his fifth year, and further increases
to 58.07% in his 10th year of control ownership.11
in the database are partly vague, or changes in the owners’ names do not appropriatelyreflect a change of owners.
10In fact, dual class shares are only found for less than 7% of firm-year observations inGermany (Brendel et al., 2013) and are thus considered negligible in our analysis.
11Please note that each firm may have been held by multiple owners jk with the samenumber of years of controlling ownership, e.g. firm i may have been owned three years
11
Please insert Table 3 approximately here
However, this naive plotting is rather unable to answer the question of
whether the average controlling owner j with a long control spell in i comes in
with a relatively high share block, or whether he increases his stake over time
in order to defend his leading position. In this light, Table 4 contrasts the
average ownership concentration at the beginning (t0) and at the end (T ) of
a control spell between short term (1-3 years), mid term (4-6 years) and long
term (7-10 years) matches. Both suggestions turn out to apply; in particular,
those matches with a short spell are characterized by a significantly lower
control concentration at the first time of appearance (38%) compared to mid-
term (44%) and long term matches (49%). In addition but of less importance,
long term owners gradually increase their control stake over time; we find
an average increase of 3.62% for those owners with 7 and more years of
control, 1.95% for spells of 4-6 years, and only a negligible increase (0.73%) for
short term matches. However, our data encounters one major problem that
imposes some limitations on our interpretation; we only observe firm-owners
matches from 2000-2009 and are therefore exposed to potential truncation
with respect to firm-owner spells that started prior to 2000, and those that
lasted longer than 2009.12
At least, we find by now a tentative relationship between average control
concentration and the time span an owner j is in control of firm i. Or to put it
in sharper terms, we suggest entering blockholders (at t0) to be aware of their
own type, i.e. whether the investor aims to stay in for a rather short or long
while. The remaining question is now, whether those controlling owners –
who posses a comparably higher share block from the beginning on, and who
are more likely to maintain their control over a long spell – produce better or
worse match effects than those owners with lower initial control ownership
concentration. This question is connected with the assertion that controlling
owners consciously decide – by following their unobserved preferences on their
by first by j1 from 2000 to 2002, and then j2from 2003 to 2005. Firm-owner matchesobserved in their third year of collaboration are found to have an average level of 48.78%of ownership concentration.
12Additional evidence is about to be provided. Please note that this study is still workin progress.
12

trade-off between value enhancing monitoring and destroying expropriation –
on the volume of the initial ownership stake and thus on the potential control
spell length.
Please insert Table 4 approximately here
4 Results
This section aims at shedding light on the question to which extent OLS
estimates of the effect of ownership concentration are biased through firm and
match heterogeneity. Therefore, Table 5 reports the estimated effects (βOLS1 ,
βIV 11 , βIV 2
1 ) of control ownership concentration (Conc.) on firm value for
all estimators introduced above (OLS, IV 1, IV 2). Accordingly, we further
consider a possible non-monotonic relationship between firm performance
and control ownership by adding squared ownership concentration to our
analysis (Conc.2). All regression specifications control for additional firm
characteristics, period and industry effects.
Please insert Table 5 approximately here
It can be seen at first glance that the estimates of the pooled OLS regres-
sor (columns 1-2), the IV 1 (columns 3-4) and the IV 2 estimator (columns
5-6) tell different stories about the effect of control ownership. The least
squares estimate – presuming a linear effect (column 1) – is slightly positive
(0.0021) but insignificant. If we account for a non-monotonic relationship
(column 2), the coefficient estimates (-0.0153 for Xijt, 0.0017 for X2ijt) pro-
pose an overall negative significant effect of control concentration diminishing
with increasing concentration levels. Thus, the OLS estimation that accounts
for neither heterogeneity source suggest the negative expropriation effect to
dominate over the positive monitoring effect in Germany.
However, if we take account of firm heterogeneity by applying our IV 2
estimator (column 5), the marginal effect is estimated to be positive and
significant at 0.0045. In contrast to the least squares results, we can in-
fer a predominating positive monitoring effect of control ownership. Using
13
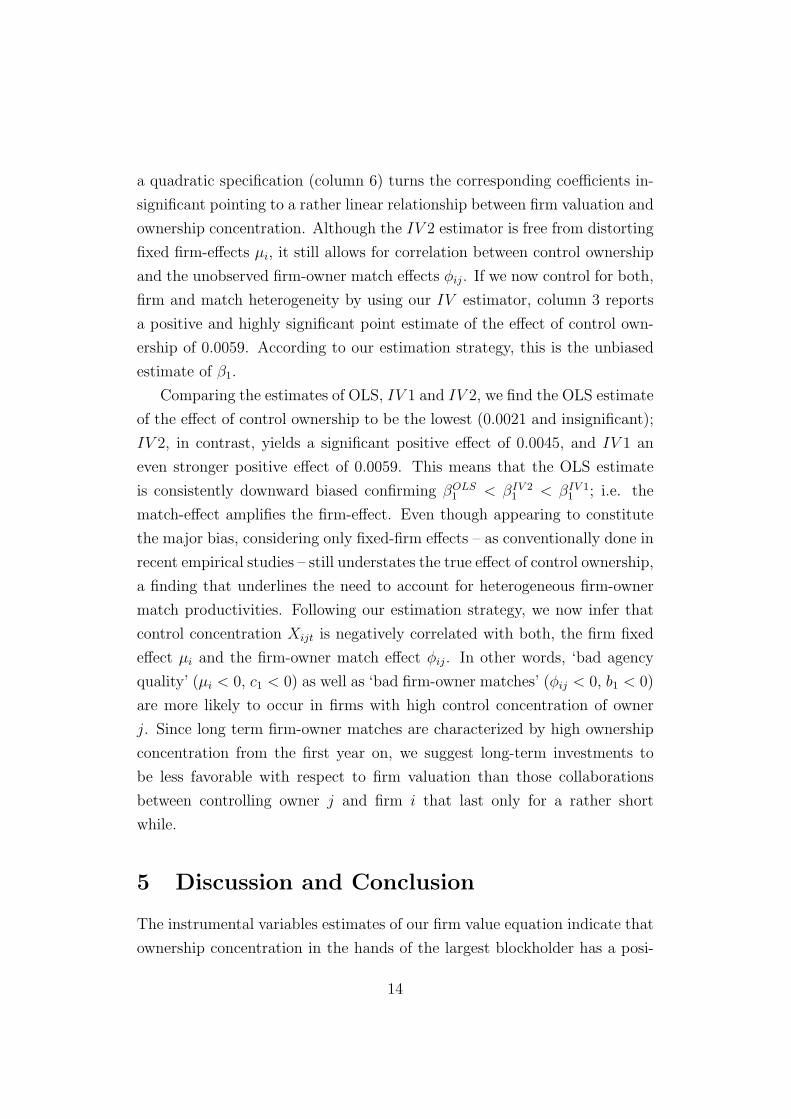
a quadratic specification (column 6) turns the corresponding coefficients in-
significant pointing to a rather linear relationship between firm valuation and
ownership concentration. Although the IV 2 estimator is free from distorting
fixed firm-effects µi, it still allows for correlation between control ownership
and the unobserved firm-owner match effects ϕij. If we now control for both,
firm and match heterogeneity by using our IV estimator, column 3 reports
a positive and highly significant point estimate of the effect of control own-
ership of 0.0059. According to our estimation strategy, this is the unbiased
estimate of β1.
Comparing the estimates of OLS, IV 1 and IV 2, we find the OLS estimate
of the effect of control ownership to be the lowest (0.0021 and insignificant);
IV 2, in contrast, yields a significant positive effect of 0.0045, and IV 1 an
even stronger positive effect of 0.0059. This means that the OLS estimate
is consistently downward biased confirming βOLS1 < βIV 2
1 < βIV 11 ; i.e. the
match-effect amplifies the firm-effect. Even though appearing to constitute
the major bias, considering only fixed-firm effects – as conventionally done in
recent empirical studies – still understates the true effect of control ownership,
a finding that underlines the need to account for heterogeneous firm-owner
match productivities. Following our estimation strategy, we now infer that
control concentration Xijt is negatively correlated with both, the firm fixed
effect µi and the firm-owner match effect ϕij. In other words, ‘bad agency
quality’ (µi < 0, c1 < 0) as well as ‘bad firm-owner matches’ (ϕij < 0, b1 < 0)
are more likely to occur in firms with high control concentration of owner
j. Since long term firm-owner matches are characterized by high ownership
concentration from the first year on, we suggest long-term investments to
be less favorable with respect to firm valuation than those collaborations
between controlling owner j and firm i that last only for a rather short
while.
5 Discussion and Conclusion
The instrumental variables estimates of our firm value equation indicate that
ownership concentration in the hands of the largest blockholder has a posi-
14
tive effect on firm value in Germany. We provide novel evidence that least
squares estimates suffer from substantial downward bias and should not be
used as they suggest an even negative effect. This is due to both firm hetero-
geneity as well as firm-owner match heterogeneity. With respect to the latter
unobserved effect, the higher propensity of unfavorable firm-owner matches
at high concentration levels may come to happen as private benefits seeking
investors coincide with firms with little minority protection, i.e. firms lacking
effective control of the controlling owner by the minority shareholders. This
constellation is arguably more likely to occur the higher the concentration
of the controlling owner is. Thus, only correcting for fixed firm-effects is
not sufficient in order to retrieve the true effect of ownership concentration.
This in turn may partly explain the mixed results in previous studies on
the value effect of ownership concentration. At the same time, we find long
lasting firm-owner matches to come along with comparably high ownership
concentration levels of the controlling owner. This, and our exploration of the
differences between OLS and IV results provide tentative evidence consistent
with better firm-owner matches lasting only for a relatively short time span
compared to ‘bad matches’. Bohren et al. (2005) support this view finding
a negative relationship between ownership duration and firm’s performance.
However, the majority of other studies (e.g. Lardon et al., 2013) promote
stable blockholder ownership to have a positive effect on firm valuation – at
least during the financial crisis.
15
Tables
Table 1: Direction and relevance of bias stemming from firm and match heterogeneity.
Bias Sign of bias Direction and relevance of bias
(1) Consistent heterogeneity(2) No bias b1 = 0, c1 = 0 βOLS
1 = βIV 21 = βIV 1
1
(3) Upward bias b1 > 0, c1 > 0 βOLS1 > βIV 2
1 > βIV 11
(4) Downward bias b1 < 0, c1 < 0 βIV 11 > βIV 2
1 > βOLS1
(5) Mixed heterogeneity(6) Upward bias b1 = 0, c1 > 0 βOLS
1 > (βIV 11 = βIV 2
1 )(7) Downward bias b1 = 0, c1 < 0 (βIV 1
1 = βIV 21 ) > βOLS
1
(8) Offsetting effect b1 < 0, c1 > 0 (βOLS1 = βIV 1
1 ) > βIV 21
(9) Offsetting effect b1 > 0, c1 < 0 βIV 21 > (βOLS
1 = βIV 11 )
(10) Upward bias b1 < 0, c1 ≫ 0 βOLS1 > βIV 1
1 > βIV 21
(11) Downward bias b1 ≪ 0, c1 > 0 βIV 11 > βOLS
1 > βIV 21
(12) Downward bias b1 > 0, c1 ≪ 0 βIV 21 > βIV 1
1 > βOLS1
(13) Upward bias b1 ≫ 0, c1 < 0 βIV 21 > βOLS
1 > βIV 11
Table 2: Average ownership concentration of the controlling owner over time. Dispersedownership is considered.
Year Obs Conc. (%)
2000 369 50.882001 390 50.512002 400 49.632003 407 48.312004 397 49.802005 390 48.372006 390 47.662007 379 46.832008 365 47.792009 344 48.16
Total 3.831 48.79
16
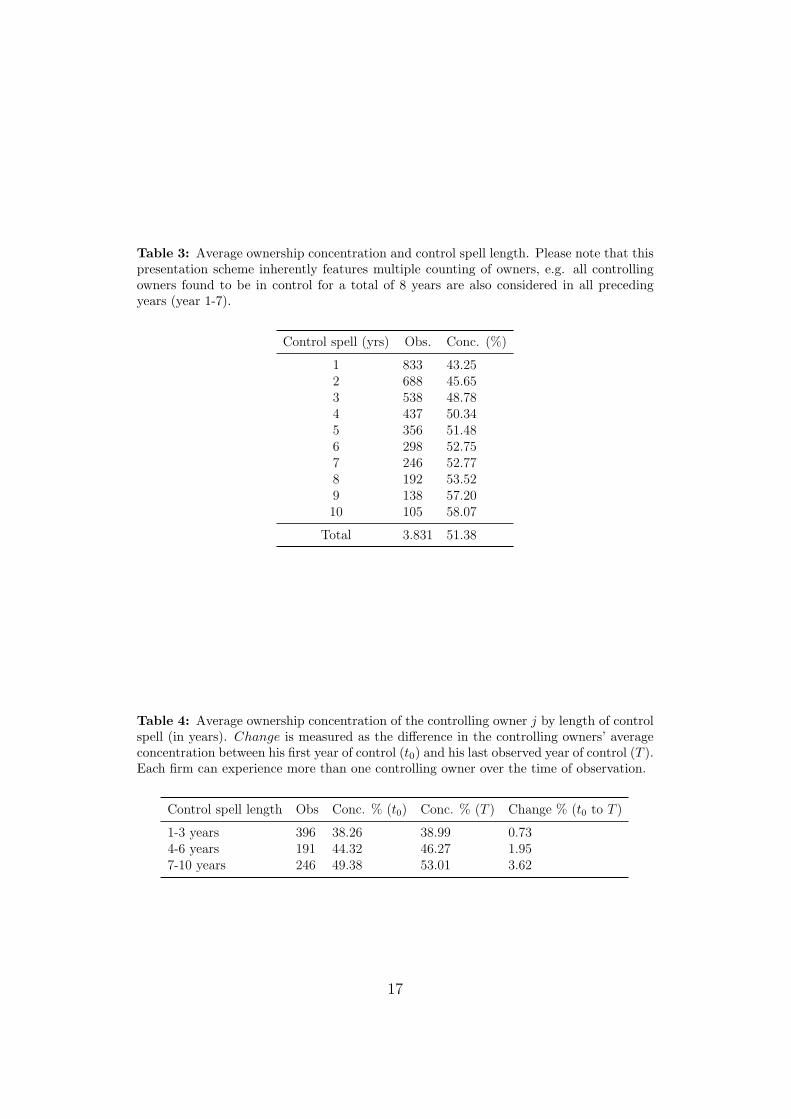
Table 3: Average ownership concentration and control spell length. Please note that thispresentation scheme inherently features multiple counting of owners, e.g. all controllingowners found to be in control for a total of 8 years are also considered in all precedingyears (year 1-7).
Control spell (yrs) Obs. Conc. (%)
1 833 43.252 688 45.653 538 48.784 437 50.345 356 51.486 298 52.757 246 52.778 192 53.529 138 57.2010 105 58.07
Total 3.831 51.38
Table 4: Average ownership concentration of the controlling owner j by length of controlspell (in years). Change is measured as the difference in the controlling owners’ averageconcentration between his first year of control (t0) and his last observed year of control (T ).Each firm can experience more than one controlling owner over the time of observation.
Control spell length Obs Conc. % (t0) Conc. % (T ) Change % (t0 to T )
1-3 years 396 38.26 38.99 0.734-6 years 191 44.32 46.27 1.957-10 years 246 49.38 53.01 3.62
17
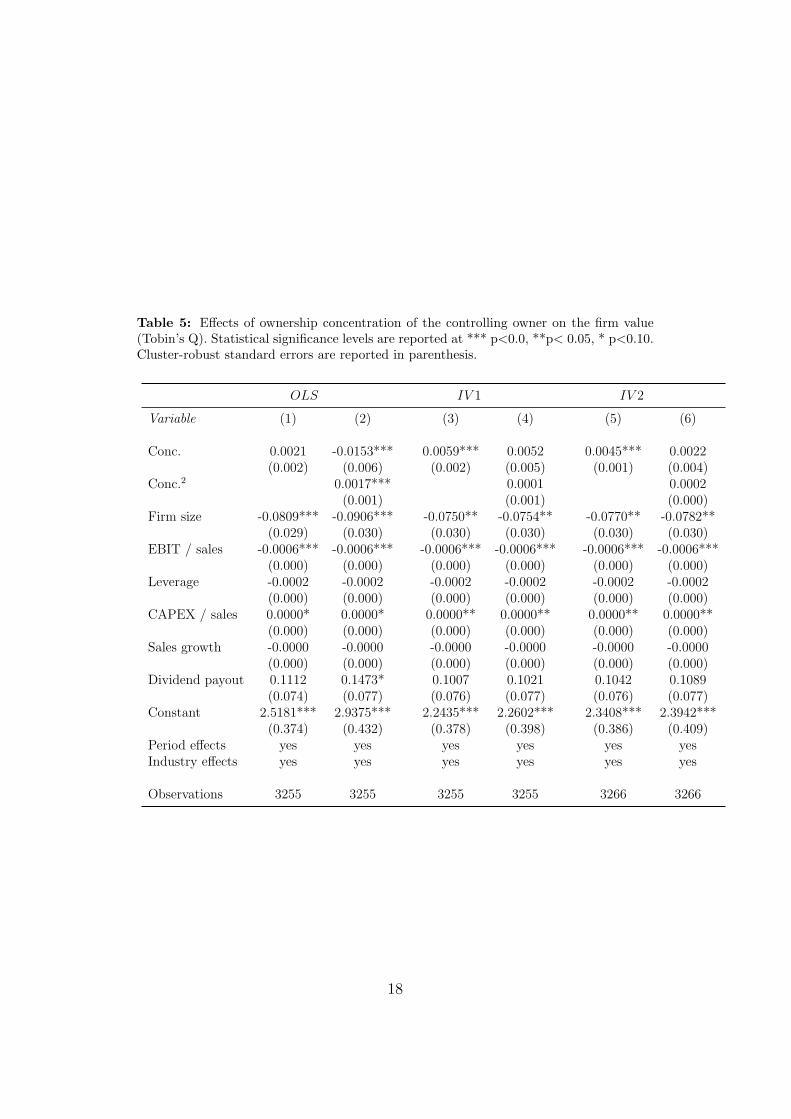
Table 5: Effects of ownership concentration of the controlling owner on the firm value(Tobin’s Q). Statistical significance levels are reported at *** p<0.0, **p< 0.05, * p<0.10.Cluster-robust standard errors are reported in parenthesis.
OLS IV 1 IV 2
Variable (1) (2) (3) (4) (5) (6)
Conc. 0.0021 -0.0153*** 0.0059*** 0.0052 0.0045*** 0.0022(0.002) (0.006) (0.002) (0.005) (0.001) (0.004)
Conc.2 0.0017*** 0.0001 0.0002(0.001) (0.001) (0.000)
Firm size -0.0809*** -0.0906*** -0.0750** -0.0754** -0.0770** -0.0782**(0.029) (0.030) (0.030) (0.030) (0.030) (0.030)
EBIT / sales -0.0006*** -0.0006*** -0.0006*** -0.0006*** -0.0006*** -0.0006***(0.000) (0.000) (0.000) (0.000) (0.000) (0.000)
Leverage -0.0002 -0.0002 -0.0002 -0.0002 -0.0002 -0.0002(0.000) (0.000) (0.000) (0.000) (0.000) (0.000)
CAPEX / sales 0.0000* 0.0000* 0.0000** 0.0000** 0.0000** 0.0000**(0.000) (0.000) (0.000) (0.000) (0.000) (0.000)
Sales growth -0.0000 -0.0000 -0.0000 -0.0000 -0.0000 -0.0000(0.000) (0.000) (0.000) (0.000) (0.000) (0.000)
Dividend payout 0.1112 0.1473* 0.1007 0.1021 0.1042 0.1089(0.074) (0.077) (0.076) (0.077) (0.076) (0.077)
Constant 2.5181*** 2.9375*** 2.2435*** 2.2602*** 2.3408*** 2.3942***(0.374) (0.432) (0.378) (0.398) (0.386) (0.409)
Period effects yes yes yes yes yes yesIndustry effects yes yes yes yes yes yes
Observations 3255 3255 3255 3255 3266 3266
18

Appendix
19
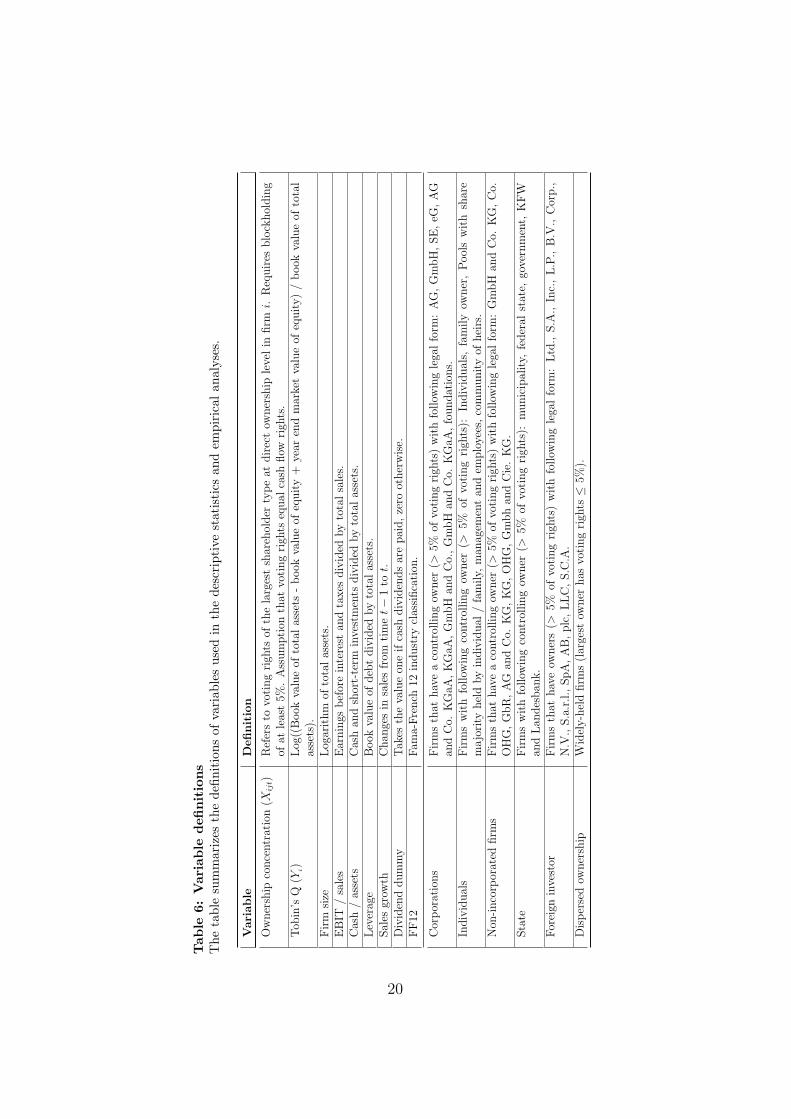
Table
6:Variable
definitions
Thetable
summarizesthedefi
nitionsof
variab
lesusedin
thedescriptivestatistics
andem
pirical
analyses.
Variable
Definition
Ownership
concentration(X
ijt)
Refersto
votingrigh
tsof
thelargestshareholder
typeat
directow
nership
levelin
firm
i.Requires
blockholding
ofat
least5%
.Assumption
that
votingrigh
tsequal
cash
flow
righ
ts.
Tob
in’sQ
(Yi)
Log((Book
valueof
totalassets
-book
valueof
equity+
year
endmarketvalueof
equity)/book
valueof
total
assets).
Firm
size
Logarithm
oftotalassets.
EBIT
/sales
Earnings
beforeinterest
andtaxes
divided
bytotalsales.
Cash/assets
Cashan
dshort-term
investments
divided
bytotalassets.
Leverage
Book
valueof
debtdivided
bytotalassets.
Sales
grow
thChan
gesin
salesfrom
timet−
1to
t.Dividenddummy
Takes
thevalueon
eifcash
dividendsarepaid,zero
otherwise.
FF12
Fam
a-French
12industry
classification
.
Corporations
Firmsthat
haveacontrollingow
ner
(>5%
ofvotingrigh
ts)withfollow
inglegalform
:AG,GmbH,SE,eG
,AG
andCo.
KGaA
,KGaA
,GmbH
andCo.,GmbH
andCo.
KGaA
,foundations.
Individuals
Firmswithfollow
ingcontrollingow
ner
(>5%
ofvotingrigh
ts):
Individuals,
familyow
ner,Poolswithshare
majority
heldbyindividual
/family,
man
agem
entan
dem
ployees,communityof
heirs.
Non
-incorporated
firm
sFirmsthat
haveacontrollingow
ner
(>5%
ofvotingrigh
ts)withfollow
inglegalform
:GmbH
andCo.
KG,Co.
OHG,GbR,AG
andCo.
KG,KG,OHG,Gmbhan
dCie.KG.
State
Firmswithfollow
ingcontrollingow
ner
(>5%
ofvotingrigh
ts):
municipality,
federal
state,
government,
KFW
andLan
desban
k.
Foreign
investor
Firmsthat
haveow
ners(>
5%of
votingrigh
ts)withfollow
inglegalform
:Ltd.,S.A
.,Inc.,L.P.,B.V
.,Corp.,
N.V
.,S.a.r.l.,SpA,AB,plc,LLC,S.C.A
.Dispersedow
nership
Widely-heldfirm
s(largest
owner
has
votingrigh
ts≤
5%).
20
References
Altonji, J. and Shakotko, R.: 1987, Do wages rise with job seniority?, Review
of Economic Studies 54(3), 437–459.
Altonji, J. and Williams, N.: 2005, Do wages rise with job seniority? a
reassessment, Industrial & Labor Relations Review 58(3), 370–397.
Bohren, O., Priestley, R. and Odegaard, B.: n.d., The duration of equity
ownership, Working Paper, December 2005 .
Brendel, M., Rudolph, C. and Schwetzler, B.: n.d., Diversi
cation discount revisited: An application of the oaxaca-blinder decompo-
sition, Working Paper, Version 2nd, August 2013 .
Burkart, M.: 1997, Large shareholders, monitoring, and the value of the firm,
The Quarterly Journal of Economics 112(3), 693–729.
Cronqvist, H. and Fahlenbrach, R.: 2008, Large shareholders and corporate
policies, Review of Financial Studies 22(10), 3941–3976.
Demsetz, H.: 1983, The structure of ownership and the theory of the firm,
Journal of Law and Economics 26(2), 375–394.
Demsetz, H. and Lehn, K.: 1985, The structure of corporate ownership:
Causes and consequences, Journal of Political Economy 93(6), 1155–1177.
Dustmann, C. and Pereira, S.: 2008, Wage growth and job mobility in
the united kingdom and germany, Industrial & Labor Relations Review
61(3), 372–393.
Faccio, M. and Lang, L. H.: 2002, The ultimate ownership of Western Euro-
pean corporations, Journal of Financial Economics 65(3), 365–395.
Fama, E. and Jensen, M.: 1983, Agency problems and residual claims, Jour-
nal of Law and Economics 26(2), 327–349.
21
Gianetti, M. and Simonov, A.: 2006, Which investors fear expropriation?
evidence from investor’s portfolio choices, Journal of Finance 61(3), 1507–
1542.
Himmelberg, C., Hubbard, R. and Palia, D.: 1999, Understanding the deter-
minants of managerial ownership and the link between ownership structure
and performance, Journal of Financial Economics 53(3), 353–384.
Jensen, M. C.: 1986, Agency costs of free cash flow, corporate finance, and
takeovers, American Economic Review 76(2), 323–329.
Jensen, M. C. and Meckling, W.: 1976, The theory of the firm: Manage-
rial behavior, agency costs, and capital structure, Journal of Financial
Economics 3(4), 305–360.
Lardon, A., Beuselinck, C. and Deloof, M.: n.d., The value of stable owner-
ship during the global financial crisis., Working Paper, Version 2nd May,
2013 .
McConnell, J. and Servaes, H.: 1990, Additional evidence on equity owner-
ship and corporate value, Journal of Financial Economics 27(2), 595–612.
Morck, R., Shleifer, A. and Vishny, R.: 1988, Management ownership
and firm value: an empirical analysis, Journal of Financial Economics
20(1), 293–315.
Rapp, M. S. and Trinchera, O.: 2011, Regulation and the anatomy of own-
ership structures in european listed firms, Working Paper, Version 29th
September, 2011 .
Shleifer, A. and Vishny, R. W.: 1989, Management entrenchment: the case of
manager-specific investments, Journal of Financial Economics 25(1), 123–
139.
Shleifer, A. and Vishny, R. W.: 1997, A survey of corporate governance,
Journal of Finance 52(2), 737–782.
22
Topel, R. and Ward, M.: 1992, Job mobility and the careers of young men,
Quarterly Journal of Economics 107(2), 439–479.
Zeckhouser, R. and Pound, J.: 1990, Are large shareholders effective moni-
tors? an investigation of share ownership and corporate performance, in
G. Hubbard (ed.), Asymmetric Information, Carporate Finance and In-
vestment, Imoversity of Chicago Press.
Zhou, X.: 2001, Understanding the determinants of managerial ownership
and the link between ownership and performance: comment, Journal of
Financial Economics 62(3), 559–571.
23