Embed Size (px)
Citation preview

‘Bad jobs’ recovery?European Job Quality Index2005-2015 —Agnieszka Piasna
Working Paper 2017.06


‘Bad jobs’ recovery?European Job Quality Index2005-2015 —Agnieszka Piasna
Working Paper 2017.06european trade union institute

Agnieszka Piasna is a senior researcher at the European Trade Union Institute (ETUI) inBrussels. Contact: [email protected]
Brussels, 2017©Publisher: ETUI aisbl, BrusselsAll rights reservedPrint: ETUI Printshop, Brussels
D/2017/10.574/28ISSN: 1994-4446 (print version)ISSN: 1994-4454 (electronic version)
The ETUI is financially supported by the European Union. The European Union is not responsible forany use made of the information contained in this publication.

3WP 2017.06
Contents
Abstract ........................................................................................................................................................ 4
1. Introduction ................................................................................................................................ 5
2. Job Quality Index: data and methods ............................................................................. 7
3. Job quality of European workers in 2015 ..................................................................... 9
4. Positive synergies between 'more and better jobs' ............................................... 19
5. One decade of developments in job quality: 2005-2015 .................................... 24
6. Conclusions .............................................................................................................................. 35
References ................................................................................................................................................ 37Annex .......................................................................................................................................................... 39

4 WP 2017.06
Abstract
This paper updates the European Job Quality Index (JQI) with the latestavailable data, from 2015, and analyses how the quality of jobs for Europeanworkers has changed in the last decade (2005-2015). The JQI encompassesa broad range of work and employment characteristics, summarising themwithin six categories of job quality including wages, non-wage aspects ofemployment and work organisation, and collective interest representation.Overall, we observe a decline in non-wage job quality over the past decadeand sluggish real wage growth in the years following the crisis. The resultsshow great variation across EU member states, with an indication ofdeepening polarisation between countries, in particular in terms of forms ofemployment, job security and working conditions. Finally, we find a positiverelationship between labour market participation and quality of jobs atcountry level.
Agnieszka Piasna

1. Introduction
The European Union has gone a long way since the announcement of theLisbon Strategy of 2000 and the ‘more and better jobs’ objective. In parallelwith the Decent Work agenda of the ILO, job quality gained a firm ground inthe EU policy debate. Nevertheless, 17 years after the Lisbon Strategy, it hashardly moved beyond the rhetoric, still less into a concrete action plan orpolicy. There is still no agreed indicator and no concrete target for achievingjob quality has been set into European employment policy (Burchell et al.,2013). It does not help that, among the policy actors involved in the debate,views on the definition of job quality are quite divergent.
The European Pillar of Social Rights, recently announced by the EuropeanCommission, was hoped to bring a major breakthrough in the social policyarea by supporting labour markets and welfare systems. From theimplementation perspective, of particular relevance is the Social Scoreboardthat consists of a set of indicators to be mainstreamed in governanceprocesses (for a more detailed description of the Scoreboard see ETUI, 2017).However, the focus on quantitative aspects of employment and on the supply-side (upskilling of the workforce) continues to prevail in this set of EU-levelindicators, and the quality of available jobs is not addressed.
Against this background, the European Job Quality Index (JQI) has beendeveloped for EU28 countries. The JQI encompasses a broad range of workand employment characteristics, summarising them within six categories ofjob quality. The results can thus be presented as a synthetic measure ofoverall job quality, broken down by the six dimensions of the index, but alsobeyond that into single items making up each dimension (this will beillustrated in our analysis of the dimension on working conditions). Theobjective of the Index is to offer a tool comparing the quality of jobs held byEuropean workers and analysing trends in job quality over time (compareBothfeld and Leschke, 2012; Leschke and Watt, 2014; Leschke, Watt andFinn, 2008). It takes a clear stance with respect to what constitutes a goodquality job and what direction of change indicates improvement. Thisassessment is based on the wealth of previous research that investigated thelinks between work and employment conditions, on the one hand; and health,well-being and the productivity of workers on the other (see e.g. Benach andMuntaner, 2007; Burchell, Ladipo and Wilkinson, 2002; Gallie, 2013; Piasna,2017; Quinlan, Mayhew and Bohle, 2001).
The Index provides a synthetic measure which is easy to compare acrosscountries and over time. It can be used as a simple and swift diagnostic tool,
‘Bad jobs’ recovery? European Job Quality Index 2005-2015
5WP 2017.06 5

providing empirical evidence for the policy debate on the outcomes of thecrisis, current employment policies and the future challenges facingEuropean labour markets. For this purpose, its synthetic nature is a strength.However, it renders the Index ill-suited for any in-depth analysis focused onparticular segments of the labour force or on a detailed examination ofselected job features. For such analysis, a job quality index relying exclusivelyon one individual-level data source, such as the one developed by Green andMostafa (2012), would be more appropriate. Moreover, the JQI provides acomprehensive overview of changes in the various dimensions of job qualityover time, yet it does not provide definitive answers as to whether thefluctuations are driven by changes in the quality of existing jobs or rather bystructural effects, including sectoral shifts, automation or generationalchange with a higher share of better-educated workers entering the labourforce.
This paper is structured as follows. Section 2 describes the construction ofthe European Job Quality Index, including a description of its dimensions,the data used and the method of calculation of the scores. Section 3summarises the most recent results of the JQI for 2015, first by providing anoverview of changes in the overall index and then by describing eachdimension separately. Results are analysed by country and by gender. Section4 explores the relationship between job quality and job quantity, as well asthe positive association between selected dimensions of job quality at countrylevel. Section 5 presents an analysis of job quality in the EU over the lastdecade, 2005-2015. The last section concludes with a summary of the resultsand some policy implications.
Agnieszka Piasna
6 WP 2017.06

2. Job Quality Index: data and methods
The European Job Quality Index (JQI) is a multidimensional measure of thequality of jobs across the 28 EU Member States. The Index takes a broadperspective on the characteristics of work and assesses jobs in sixdimensions: (1) wages; (2) forms of employment and job security; (3)working time and work-life balance; (4) working conditions; (5) skills andcareer development; and (6) collective interest representation. Each of thesesix dimensions, in turn, is comprised of a large number of individualindicators derived from the European Working Conditions Survey (EWCS),the EU Labour Force Survey (LFS) and the database on the InstitutionalCharacteristics of Trade Unions, Wage Setting, State Intervention and SocialPacts (ICTWSS). A detailed description of the items used to calculate each ofthe dimensions of the JQI is presented in the Annex (Table A1), together withthe weighting of the components of each dimension. The overall JQI is anunweighted average of the six dimensions listed above.
Jobs are at the centre of the European Job Quality Index and job characteristicsare the object of analysis. This implies that other features of labour marketsand employment systems, including institutional set-up and policies, areimportant mechanisms which have an impact on the quality of jobs and whichprovide different means of support for individuals in coping with poor jobquality, but are not part of the job quality measure (Piasna et al., 2017).Furthermore, the Index evaluates jobs from workers’ perspective: their healthand safety, as well as their psychological and economic well-being. Thus, evenif more intense work, long working hours or low wages might increase theprofits of companies in the short-run, these work characteristics are classifiedas indicating poor job quality because a wealth of empirical research hasdemonstrated that they have negative consequences for workers and theirfamilies (see e.g. Benach and Muntaner, 2007; Burchell et al., 2002; Piasna,2017; Piasna and Plagnol, 2017; Quinlan et al., 2001).
With the exception of wages, all other dimensions of the Index have valuesranging from 0 to 100 and which are derived from percentages; that is, theshare of respondents reporting a certain work arrangement or characteristic.Where necessary, the values are inverted so that higher scores in the Indexalways represent a better quality of jobs. The dimension measuring wages isexpressed in monetary terms: this shows earnings in Euro adjusted forpurchasing power parity (PPP). Adjustment for PPP is made to account fordifferences in price levels between countries and thus to compare earningsbetween countries in real terms. Finally, a small number of outliers have beenremoved by coding as missing the 0.25 per cent of respondents with the
‘Bad jobs’ recovery? European Job Quality Index 2005-2015
7WP 2017.06

lowest and the highest earnings; such unusually high or low values are likelyto result from mistakes in data entry.
In order to compute the overall Job Quality Index that includes all sixdimensions in one composite measure, the scores for each sub-dimensionare standardised to range from 0 to 1. This was necessary as the sub-dimension of wages is expressed in different units (Euro) than the other fivedimensions (on a scale of 0-100, corresponding to percentages). To obtainthe overall JQI, the scores for the six dimensions have been averaged, eachcontributing equally to the overall result.
Where possible due to data availability, the job quality measures arecomputed and presented for men and women separately, allowing for theidentification of gender gaps in the various dimensions of job quality. Theonly exception is collective interest representation, in which the twomeasures taken from the ICTWSS database, i.e. trade union density andcollective bargaining coverage, are not broken down by gender. Only the thirdindicator of collective interest representation, i.e. employee representationat company level, which is derived from the EWCS, could be computed formen and women separately.
In updating the JQI, emphasis has been put on ensuring comparability withthe Index from previous years—that is, 2005 and 2010 (Leschke and Watt,2014; Leschke et al., 2008)—and allowing for an analysis of changes in jobquality over time. This has been complicated by changes in data availability,for instance related to revisions of the EWCS questionnaire over the years.Therefore, the updated JQI has been re-calculated using measures that aregenerally available for all three years: 2005, 2010 and 2015. Where datasources other than the EWCS were used and information for either 2005,2010 or 2015 was missing, the nearest available years were used.
In terms of comparison of the JQI over time, the dimension on collectiveinterest representation is an exception as it has been calculated in twoversions. The first version is only available for 2015, but it includes moredetailed information on employee representation at company level, inaddition to trade union density and collective bargaining coverage. Such anexpansion is possible thanks to new questions added to the EWCS only in2015. The second version is available for time comparison for the wholeperiod 2005-2015, but it only contains information about trade union densityand collective bargaining coverage, available from the ICTWSS database.
Furthermore, data on monthly income available from the EWCS could notbe compared over time due to changes in the questionnaire and income bandsin the 2015 wave. Therefore, wages are calculated for 2015 using the EWCSdata, but analysis of changes over time is carried out based on the AMECOindex showing changes in real compensation per employee. For this reason,the comparison of changes in the overall JQI over time is only carried outbased on the five non-wage dimensions of the Index.
Agnieszka Piasna
8 WP 2017.06

3. Job quality of European workersin 2015
This section presents the recent results for the European Job Quality Indexand discusses the performance of EU28 countries in 2015. We begin byproviding an overview of the Index and its sub-dimensions at EU level andoverall job quality for each member state. We then move on to deconstructthe overall index into the six dimensions and discuss in more detail eachdimension by gender and at country level. Such a focused analysis allows theexploration of cross-country differences in levels of job quality as well as thedisentangling of various patterns of gender inequality found within EU28countries. It reveals that average levels of job quality usually derive fromdifferent profiles and trade-offs with regard to particular dimensions of jobquality between countries and between men and women.
Figure 1 presents the average levels of job quality reported in 2015 by workersin EU28 countries. The overall JQI shows very little variation by gender, butthere are important trade-offs between dimensions. Men, according to ourIndex, have much better outcomes on two dimensions of job quality: wages;and forms of employment and job security. The latter dimension includesinformation on the share of workers in involuntary temporary work,involuntary part-time jobs and those who think they might lose their job inthe next six months (all inverted so that higher scores represent better jobquality). Women are, on average, more likely than men to work in non-standard employment arrangements, such as temporary and part-time jobs.Women are also, compared to men, more often trapped in temporary jobsbecause they could not find a permanent position. The case of involuntarypart-time work is more complicated as women’s choice in this respect is moreoften dictated by care obligations. For this reason, our indicator mightunderestimate involuntary part-time work among women since respondentswho declared that they work part-time because they look after children,incapacitated adults or due to other family responsibilities are not includedin the involuntary part-time work category. Interestingly, there was littledifference between men and women at EU level in terms of whether theyperceived their jobs as secure or not. The segregation of women into non-standard forms of employment is one of the factors contributing to the genderwage gap. In our Index, we take into account the difference in net monthlyearnings without adjusting for the number of weekly working hours, as thisshows how much financial resources one has at the end of the day to coverthe cost of living. This illustrates the magnitude of the discrepancy in monthlyearnings that still exists between men and women in the EU, with the scorefor women being nearly one-half that of men.
‘Bad jobs’ recovery? European Job Quality Index 2005-2015
9WP 2017.06

The poorer situation of women with respect to wages and forms ofemployment contrasts with their better outcomes in terms of working timequality and working conditions. This can be explained by the overall shorterworking hours of female workers, which translates into a lower incidence ofworking long hours (above 48 per week) and during unsocial hours—two ofthe components of our working time quality dimension. Women were alsosomewhat more likely than men to report a good fit between their workinghours and other commitments outside of paid employment. This is, in largepart, linked to their selection in jobs, such as part-time work, that wouldmake such a fit possible (see discussion in Fagan and Walthery, 2011). Betterquality of working conditions, on the other hand, is mainly related to sectoralgender segregation, with women less likely to be exposed to certain physicalrisk factors. Women, however, have less autonomy at work and less controlover the organisation of their work.
Finally, there was little gender difference in terms of skills and careerdevelopment as well as collective interest representation. The latterdimension of the Job Quality Index is mostly composed of indicators whichdo not have a gender breakdown and this translates into a narrow gendergap. Only one of its components—employee representation at companylevel—could be calculated separately for men and women. This shows thatmen were slightly more likely to work in workplaces where trade unions orworks councils are active.
Agnieszka Piasna
10 WP 2017.06
Figure 1 Comparison of sub-dimensions and overall JQI in 2015, EU28 by gender
0
0.1
0.2
0.3
0.4
0.5
0.6
0.7
0.8
0.9
1
Wages Forms of empl.and job sec.
Working timeand WLB
Workingconditions
Skills andcareer dev.
Collectiveinterest rep.
JOB QUALITYINDEX
Men Women Total
Notes: For the purpose of calculating the overall Job Quality Index, all sub-dimensions were normalised to a range from 0 to 1.

The average experience of job quality at EU level hides huge variation acrossthe Member States. As illustrated in Figure 2, overall job quality wasparticularly low in Greece, followed by Romania, Spain, Poland and Hungary;while Denmark, Luxembourg, Finland and Sweden were among the topperformers. Job quality was lower in post-2004 accession countriescompared to the EU15 group.
The size and direction of the gender gap in the overall Job Quality Index alsodiffered substantially between countries. Women scored visibly higher inPoland, Hungary, Croatia and Malta, while the gap in favour of men was mostprominent in Finland, Luxembourg and Germany. In Romania and Spain,the gender difference was the smallest.
Decent wages are one of the key elements of job quality for workers. Asshown in Figure 3, substantial wage differentials persist among EU MemberStates. The bottom of the wage distribution is filled by central and easternEuropean, as well as Mediterranean, countries all of which had wage levelsin 2015 which were below the EU28 average. Highest net monthly earnings,after adjusting for price differences, are reported by workers in Luxembourg,Denmark, Ireland and Sweden.
Unsurprisingly, gender differences are particularly visible in this dimensionand consistently show that women earned less than men in all EU28countries. The smallest gender gaps were found in Croatia, Poland, Hungary,
‘Bad jobs’ recovery? European Job Quality Index 2005-2015
11WP 2017.06
Figure 2 Overall JQI in 2015, by country and gender
0
0.1
0.2
0.3
0.4
0.5
0.6
0.7
0.8
0.9
1
Gre
ece
Rom
ania
Spai
n
Pola
nd
Hun
gary
Cypr
us
Slov
akia
Croa
tia
Port
ugal
Bulg
aria
Slov
enia
Latv
ia
Lith
uani
a
Ital
y
Czec
hia
EU28
Ger
man
y
Esto
nia
UK
EU15
Irela
nd
Fran
ce
Net
herla
nds
Aus
tria
Mal
ta
Belg
ium
Swed
en
Finl
and
Luxe
mbo
urg
Den
mar
k
Men Women Total
Notes: For the purpose of calculating the overall Job Quality Index, all sub-dimensions have been normalised to a range from 0 to 1.Overall JQI is the unweighted average of the six sub-dimensions.

Romania and Slovenia. At the other extreme, the widest gender wage gapswere found in Luxembourg, Germany, Ireland and the Netherlands. Thismay, at least in part, be related to the share of part-time work, for which ahigh incidence drives down average monthly wages and gender norms relatedto maternal employment, as well as the generalised low-wage economicmodel in CEE countries with a compressed wage structure (Drahokoupil andPiasna, 2017).
The quality of forms of employment and job security are measured bythe share of workers who had temporary jobs because they could not findpermanent work; and the share of part-time workers who could not find full-time jobs. Therefore, only non-standard work that was reported asinvoluntary is included as an indication of poor job quality. Moreover, asubjective dimension is added to this dimension by including a measure ofthe self-perceived chances of losing one’s job in the next six months.
This dimension shows much less variation across the EU than wages, butthere is a group of countries at the top and at the bottom of the distributionthat visibly stand out (see Figure 4). The six countries that are clearly badperformers on this dimension are Spain, Cyprus, Portugal, Poland, Italy andGreece; while the four countries with outcomes visibly above the average areMalta, Denmark, Luxembourg and Austria. The rest of the Member Statesremained fairly concentrated around the EU28 average.
Agnieszka Piasna
12 WP 2017.06
Figure 3 JQI dimension on wages in 2015, by country and gender
0
500
1,000
1,500
2,000
2,500
3,000
Rom
ania
Hun
gary
Bulg
aria
Latv
ia
Croa
tia
Pola
nd
Gre
ece
Port
ugal
Slov
akia
Esto
nia
Czec
hia
Slov
enia
Lith
uani
a
Spai
n
Cypr
us
Ital
y
Mal
ta
EU28
EU27
Aus
tria
Net
herla
nds
EU15
Ger
man
y
Fran
ce UK
Belg
ium
Finl
and
Swed
en
Irela
nd
Den
mar
k
Luxe
mbo
urg
Men Women Total
Notes: Average net monthly earnings from main paid job in 2015, adjusted for PPP.

In the vast majority of countries, men reported better outcomes on thisdimension compared to women, with the widest gender gaps being found inItaly, Germany and the UK. On the other hand, most central and easternEuropean countries show much higher gender equality on this dimension,mainly attributable to a full-time working model with mothers of youngchildren either exiting the labour market completely or combining full-timepaid work with care obligations often with the help of relatives.
The working time and work-life balance dimension measures not onlythe extent to which work spills over beyond ‘standard’ hours (i.e. daytimeand weekday work) but also provides a subjective assessment of work-life fit.This is influenced by national regulation, for instance on the extent of Sundaywork, as well as cultural and gender norms.
Greece is an evident outlier on the basis of the 2015 data, with particularlylow levels of working time quality driven by very long reported workinghours, followed by Slovenia, Slovakia and Spain (see Figure 5). Overall,working time quality is lower in southern European countries, where worktends to extend into late evening hours, and in several CEE countries, knownfor the weak enforcement of working time regulation including with regardto payment for overtime. In this respect, the relatively low position of theNetherlands might be surprising, given the high incidence of short hourswork. Denmark, on the other hand, stands out as a top performer.
Across the whole EU, women continue to work according to differentschedules than men, a fact predominantly related to the unequal division ofhousehold and care work. This is manifest in a considerable gender gap in
‘Bad jobs’ recovery? European Job Quality Index 2005-2015
13WP 2017.06
Figure 4 JQI dimension on forms of employment and job security in 2015, by country and gender
Men Women Total
70
75
80
85
90
95
100
Spai
n
Cypr
us
Port
ugal
Pola
nd
Ital
y
Gre
ece
Slov
enia
Net
herla
nds
Czec
hia
UK*
EU28
Croa
tia
Hun
gary
EU15
Swed
en
Fran
ce
Latv
ia
Irela
nd
Finl
and
Lith
uani
a
Esto
nia
Ger
man
y*
Slov
akia
Belg
ium
Rom
ania
Bulg
aria
Aus
tria
Luxe
mbo
urg
Den
mar
k
Mal
ta
Notes: *missing data on involuntary temporary employment.

working time quality that favours women; this is found to be wider incountries with overall lower levels of working time quality, such as Ireland,Malta or Czech Republic.
The quality of working conditions is the most complex dimension of theJob Quality Index in that it takes into account the largest number of variables(it is calculated based on a total of twenty items from the EWCSquestionnaire) describing how and in what environment work is performed.It is composed of three sub-dimensions each contributing equally to theoverall score: work intensity; work autonomy; and physical risk factors.Values have been inverted where appropriate so that, for each dimension, ahigher score corresponds to a better quality of work: a lower risk of workintensification, higher autonomy and lower exposure to physical risk factors.
The results presented in Figure 6 show considerable divergence across EUcountries. There are three countries with scores much below the EU average:Cyprus, Greece and Romania, countries that also score relatively lowly onsome of the other dimensions of job quality. However, there is no clearclustering among the remaining countries with respect to the quality ofworking conditions. Central and eastern European countries are spreadevenly across the distribution, with the Baltic States, Poland and CzechRepublic placed higher than the EU average. Sweden, on the other hand,which is among the top performers on all other dimensions of job quality,lies below the EU average.
The lack of a clear clustering of countries together with some surprises, suchas very high scores for Estonia and Malta, are largely due to the encompassingnature of this dimension of job quality, which averages the outcomes of quite
Agnieszka Piasna
14 WP 2017.06
Figure 5 JQI dimension on working time and work-life balance in 2015, by country and gender
60
65
70
75
80
85
90
Gre
ece
Slov
enia
Slov
akia
Spai
n
Rom
ania
Ital
y
Mal
ta
Pola
nd
Hun
gary
Czec
hia
EU28
Irela
nd
EU15 U
K
Latv
ia
Croa
tia
Net
herla
nds
Finl
and
Ger
man
y
Fran
ce
Bulg
aria
Esto
nia
Cypr
us
Port
ugal
Swed
en
Luxe
mbo
urg
Lith
uani
a
Belg
ium
Aus
tria
Den
mar
k
Males Females Total

diverse work characteristics. A closer look at each sub-dimension of theworking conditions measure is thus useful (see Table A3 in the Annex). Forinstance, the low overall position of Denmark, Sweden and the UK is largelydriven by high levels of work intensity in these countries, which translates intohigh levels of burnout and work-related stress (see e.g. Norlund et al., 2010;Vision, 2016). On the other hand, Nordic countries and the UK score very wellin terms of worker autonomy. Germany, which scores below the average onoverall quality of working conditions, is among the top performers in termsof physical risk factors. This is especially the case in the German industrialsector, an important part of the country’s economy. This might be related tothe offshoring of the more arduous elements of production and the retentionof mainly core, highly-skilled activities within the sector, but also the relativelygood standards, in general, regarding health and safety.
Certainly, sectoral composition has a strong impact on the overall ranking ofcountries on quality of working conditions. When we compare the samesector across countries, results tend to differ from the overall rankingpresented in Figure 6 (see Table A4 in the Annex). For instance, looking atworkers in manufacturing alone, the Nordic countries and the Netherlandsbecome the top four performers in quality of working conditions, althoughthe bottom of the ranking remains virtually unchanged with Cyprus,Romania, Greece, Slovakia and Hungary having the worst outcomes.
As noted earlier, women tend to work in jobs with better working conditionsthan men. This is largely accounted for by sectoral gender segregation, withwomen less likely to be exposed to many of the physical stress factorsassociated with male-dominated manufacturing. This pattern is, to a largeextent, confirmed at country level, with the gender gap being particularlywide in Hungary, Poland and Italy. However, the gender gap is reversed—with women working in jobs with worse working conditions than men—inFinland, Denmark, Sweden, Ireland and the Netherlands. Such a result mightat first be surprising in view of persistent sectoral gender segregation inNordic countries. The reversed gender gap in quality of working conditionsis largely due to a much smaller advantage of women in these countries withrespect to exposure to physical stress factors. In fact, Denmark is the onlycountry where women report overall higher exposure to physical risk factorsthan men. However, women face different risk factors than men, and highsectoral segregation is linked to a higher exposure of women to handlinginfectious materials, tiring positions and the lifting or moving of other people,all risks featuring in the female-dominated healthcare sector.
The skills and career development dimension is composed of twoelements. One records the share of the adult population (aged 25-64) thatparticipated in education or training in the four weeks preceding the survey.The second element captures the extent to which workers agree with thestatement ‘My job offers good prospects for career advancement’.
‘Bad jobs’ recovery? European Job Quality Index 2005-2015
15WP 2017.06

The results are displayed in Figure 7. What first strikes when analysing theresults is that EU countries score relatively lowly on this dimension. On ascale from 0 to 100, most countries score between 20 and 30. This meansthat, on average, only every fourth worker in the EU had participated in anytraining in the previous month and/or considered their job to offer goodprospects for career development. Moreover, the results show widedivergence between EU countries. The bottom six positions are filled byeastern and southern European countries: Croatia, Slovakia, Lithuania, Italy,Greece and Bulgaria. The below-average position of Germany and therelatively high rank of the UK confirm expectations based on differences ineducation systems and the character of skill formation. While in liberalmarket economies (such as the UK), workplaces and continuing learning tendto be more important than schools for skill formation, the opposite isexpected for coordinated economies, and in particular in Germany with itshighly-developed formal vocational training and apprentice system (seesimilar results and discussion in Tahlin, 2007). In Germany, new labourmarket entrants are equipped with more firm-specific skills than in the UKand thus the general skill profile in the UK requires more training effort fromemployers to adapt skills to firm-specific needs. Finally, the ranking of skillsand career development is topped by the three Nordic countries—Denmark,Sweden and Finland. In these countries, the gender gap is also the mostpronounced and in favour of women. Conversely, in countries with the worstoutcomes on this dimension of job quality, men are in a better situation thanwomen.
Agnieszka Piasna
16 WP 2017.06
Figure 6 JQI dimension on working conditions in 2015, by country and gender
Men Women Total
50
55
60
65
70
75
80
Cypr
us
Gre
ece
Rom
ania
Hun
gary
Spai
n
Croa
tia
Swed
en
Slov
akia UK
Aus
tria
Ger
man
y
Slov
enia
EU28
Fran
ce
Bulg
aria
EU15
Port
ugal
Irela
nd
Pola
nd
Czec
hia
Lith
uani
a
Belg
ium
Den
mar
k
Luxe
mbo
urg
Net
herla
nds
Latv
ia
Ital
y
Finl
and
Mal
ta
Esto
nia

The sixth and final dimension of the Job Quality Index measures collectiveinterest representation among the European workforce. This capturesthe scope for voice and the empowerment of workers vis-à-vis employers;these are important aspects of intrinsic job quality, affecting workers’ jobsatisfaction and well-being at the workplace. This dimension has beencomputed in two variants. The first only includes information about theadjusted coverage of collective bargaining and trade union density at countrylevel. It is, however, possible to supplement these two measures with threeadditional items from the EWCS, capturing employee representation atcompany level and including the presence of trade union or works councilsand health and safety delegates, as well as the extent to which managementholds regular meetings with employees.
A comparison of these two measures for 2015 is presented in Figure 8. Adivision of countries into ‘welfare state’ typology is evident. In general, thepost-transition economies and liberal welfare regimes rank at the bottom,continental and Mediterranean countries are placed in the middle, whileNordic countries achieve the highest scores. The inclusion of additionalinformation about workplace-level employee representation does not changethe ranking of countries substantially, but it does bring them more closelytogether, suggesting that informal forms of employee representation, to somedegree, supplement formal ones in countries where the latter are at very lowlevels.
‘Bad jobs’ recovery? European Job Quality Index 2005-2015
17WP 2017.06
Figure 7 JQI dimension on skills and career development in 2015, by country and gender
0
10
20
30
40
50
Croa
tia
Slov
akia
Lith
uani
a
Ital
y
Gre
ece
Bulg
aria
Ger
man
y
Rom
ania
Spai
n
Belg
ium
Pola
nd
Latv
ia
Port
ugal
Irela
nd
EU28
Hun
gary
Czec
hia
Slov
enia
EU15
Cypr
us
Mal
ta
Aus
tria
Esto
nia
Fran
ce
Net
herla
nds
Luxe
mbo
urg
UK
Finl
and
Swed
en
Den
mar
k
Men Women Total

Agnieszka Piasna
18 WP 2017.06
Figure 8 JQI dimension on collective interest representation in 2015, by country and gender
0
10
20
30
40
50
60
70
80
90
Lith
uani
a
Pola
nd
Latv
ia
Esto
nia
Hun
gary
Slov
akia
Bulg
aria UK
Rom
ania
Czec
hia
Gre
ece
Irela
nd
Ger
man
y
EU28
Cypr
us
Slov
enia
Croa
tia
Luxe
mbo
urg
Port
ugal
Spai
n
EU15
Net
herla
nds
Mal
ta
Fran
ce
Ital
y
Aus
tria
Den
mar
k
Belg
ium
Swed
en
Finl
and
AdjCov, UD and EmpRep AdjCov and UD

4. Positive synergies between ‘moreand better jobs’
In the Lisbon Strategy of 2000, the promotion of ‘more and better jobs’ wasexpressed as a non-mutually exclusive objective. In some of its recentdocuments, the European Commission has re-stated that the creation ofemployment does not need to compromise on the quality of jobs (e.g.European Commission, 2012, 2017). Nevertheless, the overall policy directionand many of the labour market reforms introduced across the EU after the2008 crisis seem to have followed different principles, with the deregulationof employment taking a front seat (see discussion in Piasna and Myant, 2017).The view that has underpinned much of the reform effort in recent years isthat less protected forms of work, that are associated with lower job securityand often with lower wages, non-wage benefits or limited access to training,increase the chances of those outside the labour market to access paid work.Contrary to such presumptions, our analysis shows a strong and positiverelationship between the quantity and the quality of jobs.
‘Bad jobs’ recovery? European Job Quality Index 2005-2015
19WP 2017.06
Figure 9 Relationship between job quality and employment, 2015
Job
Qua
lity
Inde
x 20
15
0
0.1
0.2
0.3
0.4
0.5
0.6
0.7
0.8
0.9
1
Employment rate 2015
50 55 60 65 70 75 80
ATBE
BG
HRCY
CZ
DK
EEEU15
EU28
FI
FR
DE
EL
HU
IE
IT LVLT
LU
MT
NL
PL
PT
ROSK
SI
ES
SE
UK
y = 0.0185x - 0.7093 R2= 0.4028
Notes: employment rate from Eurostat, age 15-64.

As illustrated in Figure 9, in countries where jobs were of overall higherquality in 2015, participation in the labour market, as expressed by theemployment rate, is also higher. The correlation is strong and positive, andit clearly demonstrates that, across EU Member States, there is no apparenttrade-off between the number of people in employment and how good theirjobs are. Quite the opposite: the results imply that it is possible for advancedlabour markets to perform well across both dimensions—quantity andquality—if only the right mix of policies and institutions is set in place. Sucha positive relationship is still to be found, but is far less clear cut, in the caseof the unemployment rate (Figure 10). The correlation at EU level is strongand positive but, to a large extent, driven by Greece and Spain, both havinghigh unemployment rates in 2015 and a low incidence of good jobs. Thecomplicating factor here is that the unemployment rate does not simplyreflect how many people do not have paid jobs, hence being the reverse ofthe employment rate, but is also affected by the avenues pursued by thoseoutside employment, for instance whether they go into education or withdrawfrom the labour force completely. In other words, the unemployment rate isalso affected by institutional support for individuals across the whole courseof their lives.
Agnieszka Piasna
20 WP 2017.06
Figure 10 Relationship between job quality and unemployment, 2015
Job
Qua
lity
Inde
x 20
15
0
0.1
0.2
0.3
0.4
0.5
0.6
0.7
0.8
0.9
1
Unemployment rate 2015
0 5 10 15 20 25 30
ATBE
BG HRCY
CZ
DK
EE EU15EU28
FI
FR
DE
EL
HU
IE
ITLV
LT
LU
MT
NL
PL
PT
RO
SK
SI
ES
SE
UK
y = -0.0206x + 0.7045 R2= 0.32584
Notes: Unemployment rate from Eurostat, age 15-64.

4.1 Collective interest representation and otherdimensions of job quality
There are positive synergies not only between the quantity and quality of jobsin the EU, but also between different dimensions of job quality. In otherwords, jobs that are good in one aspect also tend to have other valuedfeatures, at least at country level. In this section, we focus on the positiverelationship between collective interest representation and other dimensionsof job quality. This is of particular interest as the ability of trade unions toexert a positive impact on working conditions has long been debated and, attimes, challenged. Our results cannot give an answer about causal direction,but they paint a rather clear picture of a positive relationship since, incountries with strong collective interest representation, jobs are of generallybetter quality.
The strongest positive synergy between collective interest representation andother aspects of job quality is found for wages (Figure 11). Countries thatjoined the EU after 2004 are characterised both by low wage levels, even afteradjusting for price differences, and by very low levels of workerrepresentation. Mediterranean and continental countries rank in the middle,while in Scandinavia and Belgium high net wages go hand-in-hand with highlevels of unionisation and collective representation. UK and Ireland standout in the sense that reported wages are higher than would be expected fromtheir below-average levels of employee representation.
‘Bad jobs’ recovery? European Job Quality Index 2005-2015
21WP 2017.06
Figure 11 Collective interest representation and wages, 2015
Wag
es
0
500
1,000
1,500
2,000
2,500
3,000
Collective interest representation
0 10 20 30 40 50 60 70 80 90
AT
BE
BGHR
CY
CZ
DK
EE
EU15EU28
FIFRDE
EL
HU
IE
IT
LV
LT
LU
MT
NL
PL
PT
RO
SK
SIES
SEUK
y = 18.119x + 521.49 R2= 0.49347

Among other, non-pecuniary dimensions of job quality measured by the JQI,skills and career development, as well as working conditions, show the mostnoticeable positive relationship with collective interest representation(Figures 12 and 13). However, breaking down the quality of workingconditions into the three components which comprise this dimension (notshown) reveals a more complex underlying pattern. In countries with moredeveloped employee representation, workers have much more autonomy andare somewhat less exposed to physical risk factors, but report higher levelsof work intensity.
Overall, trade unions play an important role in providing social support thatcan help workers cope with high work demands and give a sense of controlover how their work is organised (Wood, 2008), while they also negotiate onbehalf of members over organisational change or adverse working conditions(Bryson, Barth and Dale-Olsen, 2013). Moreover, trade unions put emphasison promoting vocational training and lifelong learning in the workplace andthey also play an active role in developing learning opportunities for theirmembership, through negotiating time-off and investment (Forrester andPayne, 2000; McCoshan, 2016). Therefore, the correlation at country levelbetween collective representation and skills and career development can,arguably, provide evidence in support of the positive role of trade unions. Inthe case of working conditions, however, this relationship might be morenuanced and, to a large extent, linked to the sectoral segregation ofemployment. However, we are unable to determine the importance ofcompositional factors with the data at hand.
Agnieszka Piasna
22 WP 2017.06
Figure 12 Collective interest representation and skills and career development, 2015
Skill
s an
d ca
reer
dev
elop
men
t
15
20
25
30
35
40
45
Collective interest representation
0 10 20 30 40 50 60 70 80 90
AT
BE
BG
HR
CYCZ
DK
EE
EU15EU28
FI
FR
DEEL
HUIE
IT
LV
LT
LU
MT
NL
PL PTRO
SK
SI
ES
SE
UK
y = 0.21x + 16.753 R2 = 0.42154

‘Bad jobs’ recovery? European Job Quality Index 2005-2015
23WP 2017.06
Figure 13 Collective interest representation and working conditions, 2015
62
64
66
68
70
72
74
76
Wor
king
con
diti
ons
Collective interest representation
0 10 20 30 40 50 60 70 80 90
AT
BE
BG
HR
CY
CZ
DK
EE
EU15SI
FI
FRDE
EL
HU
ITLV
LT
LU
MT
NL
PLPT
IE
RO
SKEU28
ES
SE
UK
y = 0.0374x + 69.168 R2 = 0.04548

5. One decade of developments in jobquality: 2005-2015
Since the height of the post-2008 crisis, some progress has been made inbringing more Europeans into paid employment and curbing the rise inunemployment. As pictured in Figure 14, between 2010 and 2015 theunemployment rate fell in 15 EU countries and on average in the EU28 as awhole. Not everywhere were the developments positive and, in particular, inthe six countries with the highest unemployment levels the unemploymentrate was still on the rise between 2010 and 2015.
Changes in the quality of jobs over the past decade are more difficult to pindown as they have been driven by a variety of often contradictory factors(compare discussion in Gallie, 2013; Leschke, Watt and Finn, 2012). On theone hand, many of the long-term structural trends towards a knowledge-basedeconomy (such as a rising level of skills or technological change) were expectedto bring overall improvements in the quality of work, at least for a group ofhighly-skilled workers. On the other hand, the jobs crisis that followed the2008 financial crash had an impact on job quality in at least two, oftencontradictory, ways. The market power of workers was considerably weakenedby the rise in unemployment and declining collective representation, whichgave employers the upper hand in imposing less favourable work andemployment conditions. This has had a largely negative effect on the qualityof existing jobs. However, poor quality jobs (such as those featuring temporarycontracts, but also construction jobs with poor physical working conditions)were disproportionately destroyed in the initial period of the crisis, whichtranslates into increases in average job quality levels at country level.
Nevertheless, the post-crisis growth in employment has been accompanied bya widespread perception that many of the new jobs that are being created are‘bad jobs’. Countries that followed a policy of internal devaluation saw wagesfor many groups of workers decline (Myant, Theodoropoulou and Piasna,2016). A continuation of the trend towards greater flexibility has resulted in arise in non-standard forms of work, offering less protection for workers andless predictability in terms of income and working hours (Cappelli and Keller,2013; Piasna and Drahokoupil, 2017; Rubery and Piasna, 2016).
Figure 15 illustrates this trend and shows that, after the initial declineimmediately following the 2008 shock, there has been a general return totemporary employment among European employers. The share of temporarywork in total employment increased in 18 EU countries between 2010 and2015, reaching the highest levels in Poland and Spain where more than onein four workers had contracts of limited duration in 2015.
Agnieszka Piasna
24 WP 2017.06

‘Bad jobs’ recovery? European Job Quality Index 2005-2015
25WP 2017.06
Figure 14 Unemployment rate, percentage point change 2005-2010 and 2010-2015, and rate in 2015
-15
-10
-5
0
5
10
15
20
25
30
Ger
man
y
Czec
hia
UK
Mal
ta
Aus
tria
Den
mar
k
Esto
nia
Luxe
mbo
urg
Hun
gary
Net
herla
nds
Rom
ania
Pola
nd
Swed
en
Belg
ium
Slov
enia
Bulg
aria
Lith
uani
a
EU28
Irela
nd
Finl
and
EU15
Latv
ia
Fran
ce
Slov
akia
Ital
y
Port
ugal
Cypr
us
Croa
tia
Spai
n
Gre
ece
change 2005-2010 change 2010-2015 2015
Notes: age 15-64.Data source: Eurostat (LFS)
Figure 15 Temporary employment rate, percentage point change 2005-2010 and 2010-2015,and rate in 2015
-30
-15
0
15
30
-10
-5
0
5
10
Rom
ania
Lith
uani
a
Esto
nia
Latv
ia
Bulg
aria UK
Mal
ta
Den
mar
k
Irela
nd
Belg
ium
Aus
tria
Czec
hia
Luxe
mbo
urg
Slov
akia
Hun
gary
Gre
ece
Ger
man
y
EU15
EU28
Ital
y
Finl
and
Fran
ce
Swed
en
Slov
enia
Cypr
us
Net
herla
nds
Croa
tia
Port
ugal
Spai
n
Pola
nd
change 2005-2010 change 2010-2015 2015 (right axis)
Notes: age 15-64.Data source: Eurostat (LFS)

In this section, we aim to document changes in a broad range of dimensionsof job quality over the last decade across the EU. As the main data source forthe Job Quality Index is the European Working Conditions Survey, which iscarried out every five years, the time comparison is based on three points intime: 2005, 2010 and 2015. We begin our analysis with an overview ofchanges in non-wage dimensions of job quality across countries. Non-wagejob quality is the average score for each country in dimensions 2-5 of the JobQuality Index: forms of employment and job security; working time andwork-life balance; working conditions; skills and career development; andcollective interest representation. Wages are not included in this compositemeasure due to the non-comparability of the EWCS wage data over time. Wethen move on to examining changes in each dimension of the JQI separately.
Overall, non-wage job quality has deteriorated in the most recent decade inthe EU. Figure 16 provides an overview of changes over time in the non-wageJob Quality Index by country, alongside the EU average. Countries areordered according to their score in 2015. The impact of recession emergesfrom the picture, with the dominant pattern of change in non-wage jobquality found across EU28 countries being a decline in 2010 followed by anincrease in 2015. However, compared with a decade ago, the average levelswere lower in 2015, both at EU28 and EU15 level. Nevertheless, most of thechanges at country level are relatively minor, with considerable stability inaverage scores over the ten-year period. On a 0-100 scale, an increase of atleast one point is noted in ten countries: Poland, Lithuania, Hungary, Latvia,Bulgaria, Estonia, Czech Republic, Malta, Finland and Denmark. Declines innon-wage job quality occurred in fewer countries, but they are much morepronounced, most notably in Greece, Romania, Cyprus, the UK, Ireland andSlovenia.
Agnieszka Piasna
26 WP 2017.06
Figure 16 Non-wage job quality, change 2005-2015
40
45
50
55
60
65
70
75
Pola
nd
Gre
ece
Lith
uani
a
Slov
akia
Hun
gary
Latv
ia
Rom
ania
Bulg
aria
Esto
nia
Cypr
us UK
Czec
hia
Spai
n
Irela
nd
Croa
tia
Ger
man
y
Slov
enia
EU28
Port
ugal
Ital
y
EU15
Luxe
mbo
urg
Net
herla
nds
Fran
ce
Mal
ta
Aus
tria
Belg
ium
Swed
en
Finl
and
Den
mar
k
2005 2010 2015
Note: Unweighted average of the five non-wage dimensions of JQI.

In an analysis of changes in wages over time, we rely on data from theAMECO data base (Figure 17). Data from the EWCS cannot be used for thispurpose due to changes in the way respondents are asked on the EWCSquestionnaire about their income. Thus, Figure 17 shows the evolution of realcompensation expressed as a share of 2010 levels. Values below 100 meanthat wages were lower than in 2010 while ones above this threshold indicatea wage increase.
Figure 17 shows that developments in real compensation per employee havebeen rather diverse across the EU. In Bulgaria, Latvia, Lithuania and Estonia,there is a high degree of volatility and the proportionate increase in realwages has been vast. This is due to relatively low nominal wages, where evena small increase in nominal values translates into a substantial increase inpercentage terms, as well as to conversion to the Euro in the Baltic Statesover this period (although detailed studies suggest that the Euro had, at most,a very small effect on prices, see e.g. Meriküll and Rõõm, 2015). On the otherhand, all Mediterranean countries, including Croatia and Cyprus, as well asHungary, Austria and the UK, note real wage declines between 2010 and2015.
To arrive at a better understanding of developments in wages, theirdistributional aspect should also be taken into account. Figure 18 illustrateschanges in the share of the so-called ‘working poor’; that is, the percentageof workers (employed or self-employed) in the total population who are atrisk of poverty (i.e. with an equivalised disposable income below the risk-of-poverty threshold, which is set at 60 per cent of national median equivaliseddisposable income after social transfers). In 19 EU countries, the share of theworking poor was higher in 2015 compared to 2005, and in 16 EU countriessuch an increase can be observed over the period 2010-2015. In Estonia,
‘Bad jobs’ recovery? European Job Quality Index 2005-2015
27WP 2017.06
Figure 17 Changes in real compensation per employee, 2010=100
60
70
80
90
100
110
120
130
140
Belg
ium
Bulg
aria
Czec
hia
Den
mar
k
Ger
man
y
Esto
nia
Irela
nd
Gre
ece
Spai
n
Fran
ce
Croa
tia
Ital
y
Cypr
us
Latv
ia
Lith
uani
a
Luxe
mbo
urg
Hun
gary
Mal
ta
Net
herla
nds
Aus
tria
Pola
nd
Port
ugal
Rom
ania
Slov
enia
Slov
akia
Finl
and
Swed
en UK
2005 2010 2015

Portugal, Poland, Italy, Luxembourg, Spain and Greece, at least every tenthworker was at risk of poverty in 2015. In Romania this was a striking 19 percent of workers.
For the period between 2005 and 2010, when the European labour marketfirst took a hit from the financial crisis, almost all EU countries note a declinein job quality measured in terms of forms of employment and job security(Figure 19). There are only three exceptions: Poland, the Netherlands andGermany. In the following period, between 2010 and 2015, the quality offorms of employment and job security worsened in eight countries: Cyprus,Portugal, Poland, Italy, Greece, the Netherlands, France and Germany. Thefirst six countries also rank below the EU average on this dimension of jobquality; thus, further declines observed in these countries has led to adeepening of polarisation within the EU. Overall, in 15 EU countries thequality of forms of employment and job security was lower in 2015 thanbefore the crisis in 2005.
The quality of working time and work-life balance has been improvingslightly but steadily over the past ten years in the EU28 as a whole (Figure20). However, the improvement appears to be very small in view of thesubstantial decline in weekly working hours in the EU which, in theory,should have led to better work-life balance and less spill-over of workinghours into unsocial times. However, as more detailed analysis of recentworking time reduction in the EU shows, the changes have been mainlydriven by employers’ needs for greater flexibility and thus their impact onjob quality for workers has been, at best, mixed (see e.g. De Spiegelaere andPiasna, 2017).
Agnieszka Piasna
28 WP 2017.06
Figure 18 In-work at risk of poverty rate, 2005-2015
0
5
10
15
20
Finl
and
Czec
hia
Belg
ium
Irela
nd
Net
herla
nds
Mal
ta
Den
mar
k
Croa
tia
Slov
akia
Slov
enia
Swed
en
Fran
ce
Bulg
aria
Aus
tria UK
Cypr
us
Latv
ia
Hun
gary
EU28
EU27
Ger
man
y
Lith
uani
a
Esto
nia
Port
ugal
Pola
nd
Ital
y
Luxe
mbo
urg
Spai
n
Gre
ece
Rom
ania
2005 2010 2015
Source: Eurostat (EU-SILC)

As ever, the experiences of particular countries have been quite diverse. Thesituation in 18 Member States was better in 2015 than in 2005 but, at thesame time, the quality of working time deteriorated over the last five-yearperiod in 12 EU countries, most notably in Spain, Ireland, Cyprus andDenmark. The outcomes on this dimension of job quality have improvedsubstantially in Romania, Poland, Latvia and Bulgaria. In all these countries,weekly working hours are, on average, much longer than in the EU at countrylevel but also when comparing only full-time workers. In the analysed period,and in particular between 2005 and 2010, weekly working hours in all these
‘Bad jobs’ recovery? European Job Quality Index 2005-2015
29WP 2017.06
Figure 19 Forms of employment and job security, 2005-2015
2005 2010 2015
70
75
80
85
90
95
100
Spai
n
Cypr
us
Port
ugal
Pola
nd
Ital
y
Gre
ece
Slov
enia
Net
herla
nds
Czec
hia
UK*
EU28
Croa
tia
Hun
gary
EU15
Swed
en
Fran
ce
Latv
ia
Irela
nd
Finl
and
Lith
uani
a
Esto
nia
Ger
man
y*
Slov
akia
Belg
ium
Rom
ania
Bulg
aria
Aus
tria
Luxe
mbo
urg
Den
mar
k
Mal
ta
Notes: *missing data on involuntary temporary employment.
Figure 20 Working time and work-life balance, 2005-2015
60
65
70
75
80
85
90
Gre
ece
Slov
enia
Slov
akia
Spai
n
Rom
ania
Ital
y
Mal
ta
Pola
nd
Hun
gary
Czec
hia
EU28
Irela
nd
EU15 U
K
Latv
ia
Croa
tia
Net
herla
nds
Finl
and
Ger
man
y
Fran
ce
Bulg
aria
Esto
nia
Cypr
us
Port
ugal
Swed
en
Luxe
mbo
urg
Lith
uani
a
Belg
ium
Aus
tria
Den
mar
k
2005 2010 2015
Notes: Missing data for work in the evening in 2005 in Portugal.

countries dropped substantially, which also lowered the incidence of verylong hours and work during unsocial hours, important elements of theworking time quality measure. This is likely to be one of the paradoxicaleffects of the crisis, whereby a drop in labour demand and in available workhas resulted in a re-distribution of work through a shortening of averageweekly working hours (for a discussion see De Spiegelaere and Piasna, 2017).
The quality of working conditions displays not only huge dispersion acrossEU countries, but also considerable variation over time (Figure 21). At EU28level, there has been a steady improvement in the analysed period. At countrylevel, two patterns of change are most common. In eleven countries, thequality of working conditions improved in the first period of the crisis (2005-2010) and then declined between 2010 and 2015. This pattern can be found,among others, in Spain, Romania, Portugal, Poland, Lithuania and Latvia.To a large extent, such changes can be linked to structural shifts in theeconomy following the post-2008 jobs crisis (see e.g. Bothfeld and Leschke,2012), with sectors such as construction or manufacturing, characterised bya high degree of physical risk factors, being hit particularly hard. Decline herecontributed to an increase in the average level of job quality, while recoveryand the renewed growth of these sectors contributed to a drop in the averagelevel of quality of working conditions. The second dominant pattern ofchange is an improvement both in the period 2005-2010 and 2010-2015. Thiscan be observed in ten countries, including Germany, Slovenia, Slovakia,Czech Republic and Finland. It remains to be seen whether this improvementis sustained in the following years and to what extent it can be linked totechnological advances that promise greater autonomy and control forworkers and a shift of the most strenuous physical work to being done bymachines.
Agnieszka Piasna
30 WP 2017.06
Figure 21 Working conditions, 2005-2015
50
55
60
65
70
75
80
Cypr
us
Gre
ece
Rom
ania
Hun
gary
Spai
n
Croa
tia
Swed
en
Slov
akia UK
Aus
tria
Ger
man
y
Slov
enia
EU28
Fran
ce
Bulg
aria
EU15
Port
ugal
Irela
nd
Pola
nd
Czec
hia
Lith
uani
a
Belg
ium
Den
mar
k
Luxe
mbo
urg
Net
herla
nds
Latv
ia
Ital
y
Finl
and
Mal
ta
Esto
nia
2005 2010 2015

An important prerequisite for the successful development of the knowledge-based economy is a highly-skilled workforce and continuous investment inadapting qualifications to new market needs and technologies. Notsurprisingly, skills and career development have improved in the EU28 inthe last five years; a welcome advance after the stagnation observed between2005 and 2010 (Figure 22). Spain, Belgium, Slovenia and the UK stand outas the only Member States with worse outcomes in this dimension of jobquality in 2015 than five years earlier. Training behaviour is assumed to varyby severity of recession, institutional support for the training effort andemployment regulation (Dieckhoff, 2013; Felstead, Green and Jewson, 2012).The variation of responses across EU countries displayed in Figure 22 seemsto confirm the expectation that a deregulated training market, such as in theUK, is particularly sensitive to changing economic conditions while theinclusive regimes in Nordic countries have substantially stepped up theirtraining efforts in times of economic downturns.
There is ample scope for the development of effective policies that willencourage employers to invest in their workforce. On the one hand, this is theexpectation of a long-term continuation of the employment relationship and theretention of skilled workers that makes investment in adult learning attractive.On the other hand, legislation can promote skill development and training byemployers through measures such as the right to training and portable personaltraining accounts for workers that were introduced in France in 2015.
Several of the dimensions of job quality discussed above have shownimprovement at EU level in recent years, but collective interest representationhas substantially declined (Figure 23). As noted earlier, data constraints meanthat the analysis of change over time can only be carried out for trade uniondensity and collective bargaining coverage. Overall, the huge divergence
‘Bad jobs’ recovery? European Job Quality Index 2005-2015
31WP 2017.06
Figure 22 Skills and career development, 2005-2015
0
10
20
30
40
50
Croa
tia
Slov
akia
Lith
uani
a
Ital
y
Gre
ece
Bulg
aria
Ger
man
y
Rom
ania
Spai
n
Belg
ium
Pola
nd
Latv
ia
Port
ugal
Irela
nd
EU28
EU27
Hun
gary
Czec
hia
Slov
enia
EU15
Cypr
us
Mal
ta
Aus
tria
Esto
nia
Fran
ce
Net
herla
nds
Luxe
mbo
urg
UK
Finl
and
Swed
en
Den
mar
k
2005 2010 2015

across EU countries with respect to collective bargaining has further deepenedin recent years, as countries with strong collective actors retained or evenimproved their outcomes while countries at the bottom of the ranking saw afurther deterioration in collective interest representation.
When analysed in greater detail, changes across Member States to a greatextent reaffirm the clustering into institutional and regulatory regimes(Esping-Andersen, 1990; Hall and Soskice, 2001). The Nordic countries,including Finland, Sweden and Denmark, with a strong bargaining culture andunion mobilisation, have preserved high levels of bargaining coverage andmembership rates. The continental cluster has experienced an overall declinein collective interest representation, mainly driven by shrinking trade uniondensity, although the high degree of bargaining coordination has preservedmuch of its coverage, except for Germany. In Mediterranean countries, theconsequence of the reforms implemented after the crisis and the conditionalityimposed in programme countries has been that collective bargaining has beenweakened substantially, especially in Greece. In both liberal and post-transition clusters, collective interest representation, starting from an alreadylow position, has further weakened over the analysed period, in some cases(notably Romania) actively supported by changes in national legislation.
The changes in job quality discussed in this section have not unfolded in avacuum. A major role has been played by the changing macroeconomicsituation and the policy responses to it. A rise in unemployment and aweakened position of collective actors has given employers the upper hand inthe post-2008 period. For instance, changes in the quality of forms ofemployment and job security are closely related to the scale of unemploymentchanges at country level. This is pictured in Figure 24 for the period 2010-2015.
Agnieszka Piasna
32 WP 2017.06
Figure 23 Collective interest representation (collective bargaining coverage and trade union density),2005-2015
0
10
20
30
40
50
60
70
80
90
Lith
uani
a
Pola
nd
Latv
ia
Esto
nia
Hun
gary
Slov
akia
Bulg
aria UK
Rom
ania
Czec
hia
Gre
ece
Irela
nd
Ger
man
y
EU28
Cypr
us
Slov
enia
Croa
tia
Luxe
mbo
urg
Port
ugal
Spai
n
EU15
Net
herla
nds
Mal
ta
Fran
ce
Ital
y
Aus
tria
Den
mar
k
Belg
ium
Swed
en
Finl
and
2005 2010 2015
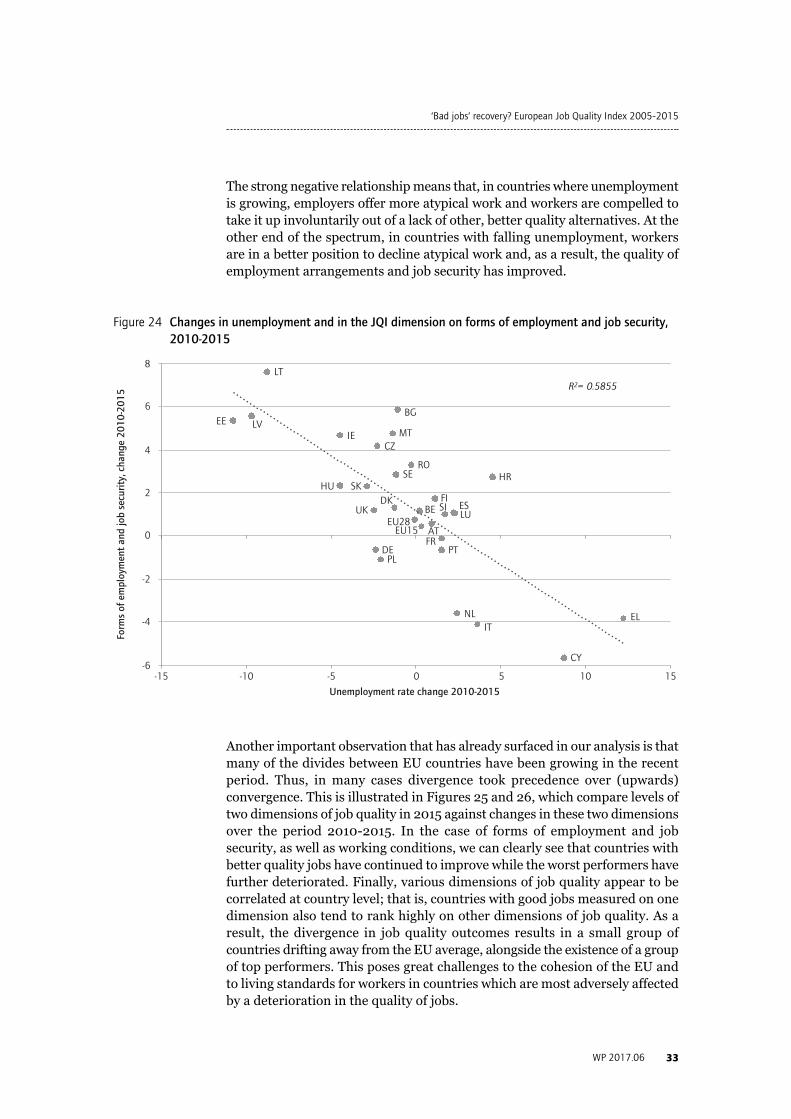
The strong negative relationship means that, in countries where unemploy mentis growing, employers offer more atypical work and workers are compelled totake it up involuntarily out of a lack of other, better quality alternatives. At theother end of the spectrum, in countries with falling unemployment, workersare in a better position to decline atypical work and, as a result, the quality ofemployment arrangements and job security has improved.
Another important observation that has already surfaced in our analysis is thatmany of the divides between EU countries have been growing in the recentperiod. Thus, in many cases divergence took precedence over (upwards)convergence. This is illustrated in Figures 25 and 26, which compare levels oftwo dimensions of job quality in 2015 against changes in these two dimensionsover the period 2010-2015. In the case of forms of employment and jobsecurity, as well as working conditions, we can clearly see that countries withbetter quality jobs have continued to improve while the worst performers havefurther deteriorated. Finally, various dimensions of job quality appear to becorrelated at country level; that is, countries with good jobs measured on onedimension also tend to rank highly on other dimensions of job quality. As aresult, the divergence in job quality outcomes results in a small group ofcountries drifting away from the EU average, alongside the existence of a groupof top performers. This poses great challenges to the cohesion of the EU andto living standards for workers in countries which are most adversely affectedby a deterioration in the quality of jobs.
‘Bad jobs’ recovery? European Job Quality Index 2005-2015
33WP 2017.06
Figure 24 Changes in unemployment and in the JQI dimension on forms of employment and job security,2010-2015
Form
s of
em
ploy
men
t an
d jo
b se
curit
y, c
hang
e 20
10-2
015
-6
-4
-2
0
2
4
6
8
Unemployment rate change 2010-2015
-15 -10 -5 0 5 10 15
FRAT
BE
BG
HR
CY
CZ
DK
EE
EU15EU28
FI
DE
EL
HU
IE
IT
LV
LT
LU
MT
NL
PLPT
RO
SK
SI ES
SE
UK
R2= 0.5855

Agnieszka Piasna
34 WP 2017.06
Figure 25 Polarisation in quality of forms of employment and job security across EU28 countries
Form
s of
em
ploy
men
t an
d jo
b se
curit
y, c
hang
e 20
10-2
015
-6
-4
-2
0
2
4
6
8
Forms of employment and job security 2015
76 78 80 82 84 86 88 90 92 94
ATBE
BG
HR
CY
CZ
DK
EE
EU15EU28
FI
FR DE
EL
HU
IE
IT
LV
LT
LU
MT
NL
PL
PT
RO
SK
SIES
SE
UK
R2= 0.3214
Figure 26 Polarisation in quality of working conditions across EU28 countries
Wor
king
con
diti
ons,
cha
nge
2010
-201
5
-6
-5
-4
-3
-2
-1
0
1
2
3
4
Working conditions 2015
62 64 66 68 70 72 74 76
CY
EL
RO
HU
ES
HR
SE
SK
UK
ATDE
SI
EU28
FR
BGEU15
PT
IE
PL
CZ
LT
BE
DK
LU
NL
LV
IT FI
MT
EE
R2= 0.0783

6. Conclusions
This paper presents the results of the most recent update of the EuropeanJob Quality Index for EU28 countries. Where available, data for 2015 areused, with the small exception of collective interest representation for whichwe use the nearest available year (for most countries, 2013). Moreover, anoverview of changes in the JQI over the last decade (2005-2015) is provided.We analyse the six dimensions of job quality separately and present asynthetic measure which combines all six.
The most common pattern of change in job quality in the EU over the lastdecade is decline, in consequence of the post-2008 crisis, followed by modestimprovement. Overall, non-wage job quality has worsened over the mostrecent decade in the EU28. Pre-crisis real wage growth considerably sloweddown after 2010, while in-work poverty amplified between 2010 and 2015 atEU level. A worrying development is that, in many aspects of job quality, theworst performing countries have seen a further deterioration. As a result,divergence rather than upwards convergence has taken place. Therefore, theresumed growth in employment levels following the post-2008 jobs crisis hasbeen, to some extent, a ‘bad jobs’ recovery, marked by a return to non-standard forms of employment and with average levels of job quality in theEU remaining below pre-crisis levels.
On a positive note, the results support the view that job quality and jobquantity can go hand-in-hand. There is a strong positive relationship betweenemployment rates and overall job quality at country level, while countrieswith a lower quality of jobs also note higher rates of unemployment.Moreover, when looking at aggregate level, we find positive synergiesbetween various valued features of jobs. Among others, high levels ofcollective interest representation are associated with higher wages, betteroutcomes in terms of skills and career development, and better quality ofworking conditions.
The Job Quality Index, at a high level of aggregation, allows for an easy yetcomprehensive assessment of levels and trends in job quality. However, acloser look at each dimension, or at the results for different groups of workers(here considered in terms of gender and sector), paints a more nuancedpicture. For instance, women work in jobs with better working conditionsand a better quality of working time; but women are still paid much less thanmen and they work in less secure jobs, are more often involuntarily inatypical forms of work and have less scope for skills and career developmentand less access to collective interest representation.
‘Bad jobs’ recovery? European Job Quality Index 2005-2015
35WP 2017.06

Overall, this update of the Job Quality Index confirms that a complexphenomenon such as job quality can and should be measured. In EUemployment policy, the quality of jobs remains a contested concept whichhas not sufficiently penetrated policy formulation, monitoring andevaluation. What is needed is a clear definition and synthetic measurementof job quality that clearly indicates the desired direction of change and thepolicy steps necessary to achieve it. With this update of the JQI, we deliversuch an empirical tool to the policy debate on job quality at EU and nationallevel.
Agnieszka Piasna
36 WP 2017.06

References
Benach J. and Muntaner C. (2007) Precarious employment and health: developing aresearch agenda, Journal of Epidemiology and Community Health, 61 (4), 276–277.
Bothfeld S. and Leschke J. (2012) ‘More and better jobs’: is quality of work still anissue – and was it ever?, Transfer, 18 (3), 337–353.
Bryson A., Barth E. and Dale-Olsen H. (2013) The effects of organizational change onworker well-being and the moderating role of trade unions, ILR Review, 66 (4),989-1011.
Burchell B., Ladipo D. and Wilkinson F. (2002) Job insecurity and work intensification,London, Routledge.
Burchell B., Sehnbruch K., Piasna A. and Agloni N. (2014) The quality of employmentand decent work: definitions, methodologies, and ongoing debates, CambridgeJournal of Economics, 38 (2), 459-477.
Cappelli P.H. and Keller J. (2013) A study of the extent and potential causes ofalternative employment arrangements, ILR Review, 66 (4), 874–901.
De Spiegelaere S. and Piasna A. (2017) The why and how of working time reduction,Brussels, ETUI.
Dieckhoff M. (2013) Continuing training in times of economic crisis, in D. Gallie (ed.)Economic crisis, quality of work, and social integration: the European experience,Oxford, Oxford University Press, 88–114.
Drahokoupil J. and Piasna A. (2017) What drives wage gaps in Europe?, Working Paper2017.04, Brussels, ETUI.
Esping-Andersen G. (1990) The three worlds of welfare capitalism, Princeton, PrincetonUniversity Press.
ETUI (ed.) (2017) The Social Scoreboard revisited, Brussels, ETUI.European Commission (2012) New skills and jobs in Europe: pathways towards full
employment, Luxembourg, Publications Office of the European Union.European Commission (2017) Reflection paper on the social dimension of Europe,
COM(2017) 206 final, 26 April 2017. Felstead A., Green F. and Jewson N. (2012) An analysis of the impact of the 2008–9
recession on the provision of training in the UK, Work, Employment and Society,26 (6), 968–986.
Forrester K. and Payne J. (2000) Trade union modernisation and lifelong learning,Research in Post-Compulsory Education, 5 (2), 153–171.
Gallie D. (ed.) (2013) Economic crisis, quality of work, and social integration, Oxford,Oxford University Press.
Hall P.A. and Soskice D. (2001) Varieties of capitalism: the institutional foundations ofcomparative advantage, Oxford, Oxford University Press.
Leschke J. and Watt A. (2014) Challenges in constructing a multi-dimensional EuropeanJob Quality Index, Social Indicators Research, 118 (1), 1–31.
Leschke J., Watt A. and Finn M. (2008) Putting a number on job quality? Constructing aEuropean Job Quality Index, Working Paper 2008.03, Brussels, ETUI.
McCoshan A. (2016) How trade unions ensure quality in workplace learning, Blog[European Commission]. https://ec.europa.eu/epale/en/blog/how-trade-unions-ensure-quality-workplace-learning
Meriküll J. and Rõõm T. (2015) One currency, one price? Euro changeover-relatedinflation in Estonia, JCMS: Journal of Common Market Studies, 53 (4), 822–839.
‘Bad jobs’ recovery? European Job Quality Index 2005-2015
37WP 2017.06

Myant M., Theodoropoulou S. and Piasna A. (eds.) (2016) Unemployment, internaldevaluation and labour market deregulation in Europe, Brussels, ETUI.
Norlund S. et al. (2010) Burnout, working conditions and gender - results from thenorthern Sweden MONICA Study, BMC Public Health, 10, 326.
Piasna A. (2017) Scheduled to work hard: the relationship between non standardworking hours and work intensity among European workers (2005–2015), HumanResource Management Journal. https://doi.org/10.1111/1748-8583.12171
Piasna A., Burchell B., Sehnbruch K. and Agloni N. (2017) Job quality: conceptual andmethodological challenges for comparative analysis, in D. Grimshaw et al. (eds.)Making work more equal: a new labour market segmentation approach, Manchester,Manchester University Press, 168–187.
Piasna A. and Drahokoupil J. (2017) Gender inequalities in the new world of work,Transfer, 23 (3), 313–332.
Piasna A. and Myant M. (eds.) (2017) Myths of employment deregulation: how itneither creates jobs nor reduces labour market segmentation, Brussels, ETUI.
Piasna A. and Plagnol A. (2017) Women’s job quality across family life stages: ananalysis of female employees across 27 European countries, Social IndicatorsResearch. https://doi.org/10.1007/s11205-017-1743-9
Quinlan M., Mayhew C. and Bohle P. (2001) The global expansion of precariousemployment, work disorganization, and consequences for occupational health: areview of recent research, International Journal of Health Services, 31 (2), 335–414.
Rubery J. and Piasna A. (2016) Labour market segmentation and the EU reform agenda:developing alternatives to the mainstream, Working Paper 2016.10, Brussels, ETUI.
Tahlin M. (2007) Skills and wages in European labour markets: structure and change, inD. Gallie (ed.) Employment regimes and the quality of work, Oxford, OxfordUniversity Press, 35–76.
Vision (2016) Välfärdens yrken hårdast drabbade av stress, 26 March 2016.https://vision.se/nyheter/2016/mars/vision-valfardens-yrken-hardast-drabbade-av-stress/
Wood S. (2008) Job characteristics, employee voice and well-being in Britain, IndustrialRelations Journal, 39 (2), 153–168.
Agnieszka Piasna
38 WP 2017.06

Annex
‘Bad jobs’ recovery? European Job Quality Index 2005-2015
39WP 2017.06
Table A1 Dimensions of the Job Quality Index and their indicators: 2005-2015
Indicators
Average net monthly earnings from main paid job, adjusted for PPP (2015)
Real compensation per employee
Temporary employment as a share of total number of employees*share oftemps indicating that main reason was that they could not find permanent job
Part-time employment as a share of total number of employees*share of part-timers indicating that main reason was that they could not find full-time job
'I might lose my job in the next six months'
Share of workers working more than 48 hours a week
Average of share of workers on shift work; Saturday work; Sunday work; nightwork; evening work.
'Working hours fit with family/social commitments'
‘Work intensity’ (working at a very high speed, working to tight deadlines andnot having enough time to get the job done)
‘Work autonomy’ (can choose/change order of tasks, methods of work, speedof work; can take a break when you wish)
‘Physical work factors’ (vibrations; noise; high/low temperature; breathing insmoke, fumes, powder, dust, vapours such as solvents and thinners; handlingchemical substances; radiation (b), tobacco smoke from other people;infectious materials; tiring or painful positions; lifting or moving people;carrying or moving heavy loads; repetitive hand or arm movements)
Share of population (25-64 years) participating in education/training overfour weeks prior to survey
‘My job offers good prospects for career advancement’
Collective bargaining coverage
Trade union density
Employee representation in the company/organisation (trade union or workscouncil; health and safety delegate; regular meetings with employees)
Sub-indices
1. Wages
2. Forms of employmentand job security
3. Working time andwork-life balance
4. Working conditions
5. Skills and careerdevelopment
6. Collective interestrepresentation
Data source
EWCS / Eurostat
AMECO
Eurostat (LFS)
Eurostat (LFS)
EWCS
EWCS
Eurostat (LFS)
EWCS
EWCS
EWCS
EWCS
Eurostat (LFS)
EWCS
ICTWSS database
ICTWSS database
EWCS
Weighting
<separate>
1/3
1/3
1/3
1/3
1/3
1/3
1/3
1/3
1/3
3/5
2/5
1/3 (2015)3/5 (2005-2015)
1/3 (2015)2/5 (2005-2015)
1/3 (2015)

Agnieszka Piasna
40 WP 2017.06
Table A2 Job quality in 2015, by each non-wage dimension and for overall JQI (sorted by scores on each dimension)
Forms of empl.and job sec.
Working timeand W-LB
Workingconditions
Skills andcareer dev.
Collectiveinterest rep.
Overall JQI(normalised)
ES
CY
PT
PL
IT
EL
SI
NL
CZ
UK
EU28
HR
HU
EU15
SE
FR
LV
IE
FI
LT
EE
DE
SK
BE
RO
BG
AT
LU
DK
MT
77.7
79.3
80.3
80.5
80.7
81.4
84.7
85.4
85.7
86.4
86.4
86.5
86.6
86.8
87.4
87.4
87.6
87.9
88.0
88.3
88.4
88.8
89.0
89.1
89.1
89.4
91.2
92.3
92.6
92.9
EL
SI
SK
ES
RO
IT
MT
PL
HU
CZ
EU28
IE
EU15
UK
LV
HR
NL
FI
DE
FR
BG
EE
CY
PT
SE
LU
LT
BE
AT
DK
69.8
76.5
76.7
76.8
78.3
78.6
79.0
79.4
79.6
79.9
80.0
80.0
80.2
80.3
80.4
80.5
80.6
80.8
80.9
81.3
81.3
81.4
82.1
82.4
82.7
82.7
83.1
83.1
83.2
85.8
CY
EL
RO
HU
ES
HR
SE
SK
UK
AT
DE
SI
EU28
FR
BG
EU15
PT
IE
PL
CZ
LT
BE
DK
LU
NL
LV
IT
FI
MT
EE
63.6
64.7
64.9
67.7
67.9
68.7
69.4
70.0
70.3
70.4
70.5
70.7
70.7
70.8
70.9
70.9
71.6
71.8
71.9
72.0
72.0
72.8
73.3
73.5
73.5
73.9
74.1
74.1
74.9
75.0
HR
SK
LT
IT
EL
BG
DE
RO
ES
BE
PL
LV
PT
IE
EU28
HU
CZ
SI
EU15
CY
MT
AT
EE
FR
NL
LU
UK
FI
SE
DK
19.2
19.7
19.8
20.7
20.8
21.7
22.4
22.8
23.6
23.7
23.8
24.0
24.1
25.3
25.7
25.8
25.9
26.0
26.3
26.4
27.0
27.5
28.5
29.4
30.8
31.2
31.7
36.3
36.7
42.4
LT
PL
LV
EE
HU
SK
BG
UK
RO
CZ
EL
IE
DE
EU28
CY
SI
HR
LU
PT
ES
EU15
NL
MT
FR
IT
AT
DK
BE
SE
FI
9.5
13.9
14.2
16.4
18.1
20.3
24.4
28.0
28.9
33.5
33.8
37.8
41.6
44.5
45.2
47.5
48.4
48.5
51.1
53.3
57.8
58.1
58.8
61.9
62.9
69.8
77.1
79.6
80.4
83.4
EL
RO
ES
PL
HU
CY
SK
HR
PT
BG
SI
LV
LT
IT
CZ
EU28
DE
EE
UK
EU15
IE
FR
NL
AT
MT
BE
SE
FI
LU
DK
0.135
0.308
0.312
0.322
0.323
0.333
0.357
0.379
0.406
0.414
0.424
0.434
0.442
0.452
0.456
0.502
0.516
0.535
0.546
0.551
0.568
0.600
0.609
0.635
0.655
0.674
0.730
0.777
0.785
0.915

‘Bad jobs’ recovery? European Job Quality Index 2005-2015
41WP 2017.06
Table A3 Working conditions in 2015, for each sub-dimension and overall measure (ordered by scores on each dimension; higher scores always represent better job quality)
Workintensity
CY
RO
SE
EL
DK
UK
ES
MT
HU
DE
EU15
FI
BE
EU28
AT
IE
FR
NL
SI
LU
IT
HR
SK
EE
CZ
PT
PL
LT
LV
BG
51.1
55.2
56.1
56.4
56.9
57.8
59.5
60.5
61.1
61.2
61.2
61.4
62.0
62.1
62.3
62.3
63.0
63.0
63.4
64.3
65.3
66.5
66.6
67.1
67.8
68.1
68.7
69.4
73.0
74.1
Autonomy
BG
HR
EL
HU
SK
CY
PT
RO
CZ
PL
ES
LT
DE
AT
SI
LV
EU28
IE
EU15
UK
SE
FR
BE
IT
NL
LU
EE
DK
FI
MT
54.2
56.8
57.6
58.3
59.0
59.3
61.1
61.3
61.4
63.8
64.1
64.1
64.2
64.6
65.1
65.3
66.2
66.8
67.4
68.3
68.8
69.7
70.3
70.3
71.2
72.4
74.6
77.9
78.1
80.7
Physicalrisks
RO
FR
ES
EL
CY
HR
LT
FI
LV
PL
EE
SE
MT
SI
EU28
HU
LU
EU15
BG
SK
AT
UK
DK
PT
BE
DE
IE
NL
IT
CZ
78.1
79.7
80.0
80.1
80.2
82.4
82.6
82.8
83.1
83.2
83.2
83.2
83.4
83.5
83.8
83.8
83.9
84.0
84.2
84.2
84.4
84.9
84.9
85.6
85.7
86.1
86.2
86.3
86.5
86.7
Working conditions(overall)
CY
EL
RO
HU
ES
HR
SE
SK
UK
AT
DE
SI
EU28
FR
BG
EU15
PT
IE
PL
CZ
LT
BE
DK
LU
NL
LV
IT
FI
MT
EE
63.6
64.7
64.9
67.7
67.9
68.7
69.4
70.0
70.3
70.4
70.5
70.7
70.7
70.8
70.9
70.9
71.6
71.8
71.9
72.0
72.0
72.8
73.3
73.5
73.5
73.9
74.1
74.1
74.9
75.0

Agnieszka Piasna
42 WP 2017.06
Table A4 Working conditions in 2015, by country and sector of economic activity (ordered by country)
Agricul-ture
Manufac-turing
Construc-tion
Commerceand hospi-tality
Transport Financialservices
Publicadminis-trationand de-fence
Education Health Otherservices
Austria
Belgium
Bulgaria
Croatia
Cyprus
Czechia
Denmark
Estonia
Finland
France
Germany
Greece
Hungary
Ireland
Italy
Latvia
Lithuania
Luxembourg
Malta
Netherlands
Poland
Portugal
Romania
Slovakia
Slovenia
Spain
Sweden
UK
79.1
74.3
73.4
79.8
59.4
71.1
81.3
75.5
76.1
64.6
75.2
65.5
69.4
78.9
73.2
76.7
72.0
75.4
72.3
75.3
72.8
83.4
69.4
69.2
74.7
64.1
77.6
82.1
65.1
67.2
60.1
61.2
54.4
65.2
72.2
68.1
72.6
64.3
63.8
58.5
59.3
65.9
67.2
69.5
64.1
68.0
68.8
73.6
66.1
60.6
57.1
59.1
65.8
62.8
69.6
68.0
61.9
68.6
64.5
66.4
58.3
65.5
71.4
71.9
69.8
63.6
63.2
64.2
61.1
72.6
68.1
71.5
67.5
64.6
69.6
69.4
65.5
66.4
59.8
74.3
67.6
63.2
70.3
68.9
69.1
72.4
75.4
66.6
65.5
73.7
72.4
74.9
72.8
67.3
71.3
63.3
69.5
70.7
75.3
71.9
72.7
70.4
76.6
70.6
71.9
71.3
66.2
70.6
69.4
66.9
67.9
67.6
64.9
64.8
69.0
57.8
62.0
64.7
66.8
71.8
66.6
62.6
63.6
60.7
58.3
68.3
68.3
67.0
65.8
64.5
69.1
69.0
66.2
61.3
64.1
67.0
65.4
60.8
58.4
62.6
74.3
78.1
80.1
76.5
69.8
79.2
73.3
77.4
74.1
78.6
80.0
70.7
72.1
69.8
80.7
76.9
75.0
78.9
78.7
80.5
78.6
76.5
64.5
74.1
74.8
72.4
69.1
74.4
76.4
76.5
72.2
62.9
55.7
68.1
78.4
76.1
76.2
76.7
77.6
65.2
67.6
76.3
77.7
75.3
78.3
75.6
76.4
74.1
76.7
76.2
64.1
75.8
74.6
72.6
73.2
74.9
78.7
77.2
78.8
80.8
71.0
82.8
73.7
82.1
76.0
78.1
78.4
75.2
72.5
77.5
80.3
80.5
76.3
79.1
77.9
76.2
79.3
74.6
75.4
79.6
76.3
75.7
70.7
72.2
67.8
70.0
73.1
63.3
59.8
73.8
70.9
74.0
72.3
70.3
69.2
61.4
71.7
64.3
70.4
71.8
70.9
70.0
73.5
72.2
74.8
67.4
64.8
72.0
66.1
65.5
65.7
67.0
74.2
76.5
75.2
73.9
66.4
79.3
76.5
80.5
77.7
75.2
75.0
66.6
75.5
77.3
77.3
78.6
79.0
76.3
78.5
76.6
74.6
76.2
69.5
77.7
76.5
71.4
73.0
74.2

ETUI Working Papers
Bridging the gaps or falling short? The European Pillar of Social Rights and what itcan bring to EU-level policymakingWorking Paper 2017.05Zane Rasnača
What drives wage gaps in Europe?Working Paper 2017.04Jan Drahokoupil and Agnieszka Piasna
Foreign Direct Investment and the development of the automotive industry in Easternand Southern EuropePetr Pavlínek, Ricardo Aláez-Aller, Carlos Gil-Canaleta and Miren Ullibarri-ArceWorking Paper 2017.03
Is Europeanised board-level employee representation specific?The case of European Companies (SEs)Working Paper 2017.02Jeremy Waddington and Aline Conchon
Why central and eastern Europe needs a pay riseWorking Paper 2017.01Béla Galgóczi
Uses and abuses of the OECD’s Employment Protection Legislation index in researchand EU policy makingWorking Paper 2016.11Martin Myant and Laura Brandhuber
Labour market segmentation and the EU reform agenda: developing alternatives tothe mainstreamWorking Paper 2016.10Jill Rubery and Agnieszka Piasna
What role can minimum wages play in overcoming the low-wage model in central andeastern Europe?Working Paper 2016.09Jan Drahokoupil
Unit labour costs: no argument for low wages in eastern and central EuropeWorking Paper 2016.08Martin Myant
These publications can be downloaded free of charge from our website.Please visit: www.etui.org/publications
‘Bad jobs’ recovery? European Job Quality Index 2005-2015
43WP 2017.06