Embed Size (px)
Citation preview
FEMS Microbiology Letters 21 (1984) 279-286 Published by Elsevier
279
Scientific Report of the Advanced Course of Microbial Ecology, sponsored by FEMS and the Swiss Society for Microbiology, held at Kastanienbaum, Switzerland, 12 September-9 October 1982
Bacteriological studies on the sulfur cycle in the anaerobic part of the hypolimnion and in the surface sediments of Rotsee in
Switzerland
(Sulfur cycle in a lake; phototropic bacteria; sulfate-reducing bacteria; migration of purple sulfur bacteria; Thiopedia rosea; Lamprocystis roseopersicina; 'Pelochromatium roseum')
H.-P. Kohler , B. ,~hring *, C. Albel la *, K. Ingvorsen, H. Keweloh *, E. Laczk6, E. S tupper ich * and F. To m e i *
Swiss Federal Institute for Water Resources and Water Pollution Control, Swiss Federal Institute of Technology, CH-8600 Diibendorf, Switzerland
Received 4 November 1983 Accepted 8 November 1983
1. SUMMARY
The microbial ecology of the sulfur cycle in the anaerobic part of Rotsee (Switzerland) was studied. Almost all the sulfate reduction took place at the sediment surface at a rate of 2 mmol SO 2 re- duced m -2 day -1. Approx. 104 sulfate reducers per ml were present in the surface sediments. The
sulfide produced was phototrophically consumed mainly by Thiopedia rosea, Lamprocystis roseoper- sicina and "Pelochromatium roseum' consortia. Thiopedia rosea migrated diurnally about one me- ter. Bacterial photosynthesis was limited by light and sulfide rather than by temperature.
2. INTRODUCTION
* Present addresses: (B.A.) Department of Microbial Ecology, University of Copenhagen. 1353 Copenhagen K, Denmark; (C.A.) Department of Biology, University College of Girona, Hospital 6, Girona, Spain; (H.K.) Fachbereich 5, Universit~t Osnabr~ek, F.R.G.; (E.S.) Angewandte Mikrobiologie, Uni- versit~t Ulm, Oberer Eselsberg, D-7900 Ulm, F.R.G.; (F.T.) Division of Applied Sciences, Eng. Sci. Lab. 324, Harvard University, 40 Oxford Street, Cambridge, MA 02138, U.S.A. Reprint requests to H.P. Kohler. Correspondence concerning this paper to: Alexander J.B. Zehnder, Department of Microbi- ology, Hesselink v. Suchtelenweg 4, 6703 CT Wageningen, The Netherlands.
The work presented here was conducted during the FEMS-SSM 'Advanced Course in Microbial Ecology' held at Kastanienbaum, Switzerland, from September 12 to October 9, 1982. The lake selected for this investigation was the Rotsee, an eutrophic lake situated in Kanton Lucerne in central Switzerland. Since 1850 wastewater from the city of Lucerne has been discharged into the lake. In 1920, the lake would have been called 'polytrophic'. Two years later a tunnel was con- structed between the River Reuss and the lake, increasing the freshwater input from 40 1 s - t to
0378-1097/84/$03.00 © 1984 Federation of European Microbiological Societies
280
400 1 s 1, to give a water residence time in the lake of 0.44 years. The intention was that a fast re- covery of the Rotsee would occur, but by 1974 little had changed, because water running into the lake still contained municipal sewage from Lucerne. Only during the last 3 years has a slight recovery been observed [1]. Bacteriological studies on the Rotsee have been undertaken by Daggeli [2,3], Minder [4], and Schegg [5]. Minder [4] de- scribed a mass development of Thiopedia rosea at depths between 7.5 and 15 metres. Other informa- tion on sulfur bacteria, except for repeated ob- servations of Chromatium okenii at depths between 7 and 15 metres [6], are not available.
Planctonic phototrophic bacteria are common in many lakes during summer stratification. They are found at depths almost devoid of light (1% of total incident light), where anaerobic conditions prevail and sulfide is present. Sulfide is formed by sulfate-reducing bacteria in [7,8] deeper layers of the water columns or in the sediments. In marine sediments bacterial sulfate reduction is a quantita- tively important process in the anaerobic minerali- zation of organic matter in marine sediments [9,10]. In freshwater sediments, the ratio of incoming organic carbon to available sulfate dictates whether anaerobic mineralization occurs predominantly either by methanogenesis or by dissimilatory sulfate reduction [11-13]. In this study we describe the microbial ecology of the sulfur cycle in the anaerobic part of the Rotsee.
lake are given in Table 1. Water samples were taken with a manually driven peristaltic pump (WAB model LPA 2, W. Bachofen, Basel) con- nected to a cone-shaped inlet [14]. Samples were collected in glass bottles with tapered ground-glass stoppers, allowing several bottle volumes to over- flow before replacing the stoppers.
3.2. Sulfate determination Sulfate concentrations in the water column were
determined turbidimetrically in a medium contain- ing hydrochloric acid and gelatin as described by Tabatabai [15]. Sulfide-containing samples were fixed in the field with a zinc acetate solution and subsequently filtered in the laboratory [12]. Sulfate in the filtrate was measured as described above.
3. 3. Sulfide determination Sulfide was determined by the methylene blue
method as outline by Pachmayr [16] and Cline [17]. Samples were collected in 60 ml biochemical oxygen demand bottles and were fixed with zinc acetate.
3. 4. Sulfur determination Elemental sulfur was determined according to
Jorgensen et al. [14]. Samples were filtered through glass fiber filters (Whatman GF/C) . The retained elemental sulfur was converted with sulfite to thiosulfate which was then titrated with a 1 mM iodine solution.
3. MATERIALS AND METHODS
3.1. Location and sampling All sediment and water samples were obtained
from the Rotsee. The hydrographical data of this
T a b l e 1
H y d r o g r a p h i c a l d a t a for Ro t see [1]
D r a i n a g e a r ea 4.6 k m 2
Sur face a rea 0.46 k m 2
V o l u m e 0.0039 k m ~
M a x i m a l d e p t h 16 m
M e a n d e p t h 9 m
O u t f l o w 0.33 m 3 / s
Res idence t ime 0 .44 yea r s
3.5. Measurement of sulfate reduction rates Rates of bacterial sulfate reduction were mea-
sured with [35S]SO~ as tracer. Method and han- dling procedures were as described by Ingvorsen et al. [18].
(i) Rates in the water column. The sample bottles were wrapped in aluminium foil to avoid sulfide oxidation by phototrophic bacteria and incubated for 22 h at the depth of sampling. Preliminary studies had shown the rate of bacterial sulfate reduction to be linear for at least 22 h.
(ii) Rates in the sediment. Since sulfate con- centrations in the interstitial water of the sediment were below detection limit, it was not possible to estimate in situ rates of bacterial sulfate reduction in the sediment. To measure potential rates of

281
bacterial sulfate reduction in the sulfate-depleted surface sediment, tracer and carrier sulfate were added together at a concentration equal to that of the sediment surface.
3.6. Absorption of sulfide by the sediment Sediment grab samples were taken with a dredge
and were immediately transferred into 250-ml serum flasks. The flasks were filled completely without entrapping air. For determination of bound sulfide in the sediment, samples were acidified and HzS was stripped with an N 2 stream into a trap containing 2% zinc acetate solution that was subsequently titrated with iodine [19]. Sedi- ment dry weight was determined by drying ho- mogenized sediment samples at 105°C until the weight remained constant. For measuring the sulfide absorption capacity of the sediment, sam- ples were mixed anaerobically with deoxygenated water in serum bottles. A neutralized sulfide solu- tion was injected and mixed for 6 h on a shaker; the same amount of sulfide was injected into water without sediment. After centrifuging the closed serum bottles, sulfide was determined in the super- natant by the methylene blue method of Cline [17] and compared with the controls without sediment.
3. 7. Determination of sulfate-reducing bacteria Sulfate-reducing bacteria were counted in the
lactate medium of Postgate [20] with ethanol (0.05%) as additional electron donor. Lake water and homogenized sediment samples were stepwise diluted in liquid ascorbate/thioglycollate reduced medium; 1 ml portions from each dilution step were mixed in test tubes with about 10 ml molten agar medium each at 42°C. After solidification in a cold water bath, the agar tubes were incubated under N 2 at 30°C and checked every day for black colonies.
3.8. Enrichments of sulfate-reducing bacteria Physiologically different types of sulfate-reduc-
ing bacteria were enriched and isolated as described by Pfennig et al. [21] with the following electron donors and carbon sources: acetate (20 mM); pro- pionate (10 mM); palmitate (1 mM) and H 2 plus CO 2. The H 2 / C O 2 culture received in addition 2 mM acetate as organic carbon source.
3.9. Phototrophic bacteria Samples were usually taken at 1 m intervals,
except for the migration studies, where samples were taken every 0.5 m from 6 to 14.5 m. The bottles were kept in the dark and 30 min after sampling a 500-ml portion was filtered through a glass fiber filter (Whatman G F / F ) . The filters were extracted overnight in 5 ml 90% acetone and the extracts were used for pigment analysis. Spec- tra of pigment extracts were obtained from 350 to 800 nm in a Uvikon 610 CL spectrophotometer (Kontron). The spectra were quantified according to the techniques of Takahashi and Ichimura [22] and Golterman et al. [23]. For counts of total cell numbers, 10-20 ml were filtered through poly- carbonate filters 0.2 #m (nucleopore) and stained with acridine orange [24]. Light was measured using a quantameter (Lamda Instruments). The sensor was placed in a spherical bulb to integrate light from all directions [25]. For the experiments with pure cultures, Rhodopseudomonas capsulata ATCCll166 was grown in the medium described by Biebl and Pfennig [26].
3.10. Total carbon dioxide Samples were directly filled into 250-ml serum
flasks and sealed immediately. Within 1 h they were acidified to below pH 2 and CO 2 was mea- sured by gas chromatography with a thermal con- ductivity detector (TCD). Total carbon dioxide, i.e. the sum of all carbon dioxide species (HzCO 3 -]- C O z a q --[- H C O ; + CO 2 ) was calculated assum- ing ideal gas behaviour.
4. RESULTS
Fig. 1 shows typical profiles of sulfate, sulfide and total CO 2 in the Rotsee at the end of summer stratification. Sulfate was depleted in the hypo- limnion. Sulfide accumulation in the hypolimnion is almost parallel to sulfate depletion. The pres- ence of elemental sulfur indicates an active popu- lation of phototrophic sulfur bacteria. Total carbon dioxide was measured at concentrations between 1.30 mM near the surface and 4.48 mM at the bottom of the Rotsee. This range of the total carbon dioxide content and the increase in the

282
[C02]to t concentration (raM)
o ,, i
I I I 50 100 150
S042- concentrationl ('uM)I 50 100
[$2-]tot concentration (IJM) n I 5 10
S O concentratgon (pM)
Fig. 1, SO 2 and [S 2 ]tot (sum of all sulfide species) and total CO 2 concentrations in the water column of the Rotsee on September 30, 1982. S o concentrations were measured October 4, 1982.
values with increasing depth (Fig. 1) is in agree- ment with observations in other stratified lakes [27]. Sulfate reduction occurred not only in the sediments, but also in the water column (Table 2). Thus, part of the sulfide gradient, however small, is due to a local increase of sulfide concentrations and not only to its upward diffusion from the sediments which were saturated with bound sulfide (1.6 mg S 2 - / g dry weight). Excess sulfide was not absorbed by these sediments.
The numbers of viable sulfate-reducing bacteria in the water column and the sediments of the Rotsee counted in agar medium with lactate and ethanol as electron donors are shown in Table 2. The black colonies contained sulfate reducers mor- phologically resembling Desulfovibrio desulfuricans. Whitish to yellowish colonies of fermentative bacteria developed in even higher numbers than
Table 2
Sulfate reduction rates and numbers of sulfate-reducing bacteria in the water column and the sediments of the Rotsee
Depth Pool size Sulfate reduction Black colony
(m) (tLmol SO42 rate (tLmol SO~ forming units I t) 1 l d a y - ~ ) p e r m l b
Water column
0 154 n.d. ~ 1
3 151 0.013 n.d. 5 153 n.d. 0
8 156 0.048 n.d,
10 139 0.146 0 11 119 0.067 5
12 108 n.d. 40
13 101 0.115 10 13.5 91 0.216 n.d.
14 64 0.534 100
14.5 50 3.520 20
Sediment 0 40 c 128-232 a 2000
0.05 n.d. n.d. 10 000
n.d., not determined.
b Black colonies were counted in agar medium with lactate and
ethanol as electron donors and FeSO 4 as indicator (MPN). c Sulfate concentration immediately above sediment at day of
sampling.
d Expressed as tLmol SO~- per liter of wet sediment per day.
The water content of the sediment was about 87% (w/v). The
sediment was incubated at the in situ temperature (8°C) the same day of sampling (October 4, 1982).
did sulfate reducers. Enrichments with H 2 inoc- ulated with sediment from the Rotsee yielded sulfate reducers resembling Desulfovibrio de- sulfuricans after 3 days of incubation at 30°C. Strains isolated with H 2 also grew well with lactate. With acetate, Desulfotomaculum acetoxidans was enriched after 2 weeks of incubation. Desulfobul- bus strains growing preferentially in clumps were obtained with propionate as electron donor. Palmitate yielded vibrioid sulfate reducers.
The light penetration curve (Fig. 2) shows that in the Rotsee only 1% of the incident light is found at a depth of 7.5 m; the 0.01% limit is at a depth of 9.5 m. Light is not detectable with the quantam- eter below 12 m (_<0.1 /~E m 2 S - l ) . In Fig. 3, total numbers of the three predominant species of phototrophic bacteria found in the water column are presented. These species were Thiopedia rosea, Lamprocystis roseopersicina, and ' Pelochromatium

i=
,,m
lO
15
- 10
.__...L___ 100
2 T
1 I 500 1000
light intensity (pEm-2sec -1) Fig. 2. Light penetration curve. Light was measured on a sunny day, during the morning.
~ Th/oped/a rosea
i ~- ............... a I ~ -"a'-z.'~ "roseopersicina I
,o ____::12 -I I ; .s:r'-' "~
~ ' - consortiumJ
14 ~lh 1 L L 1 I 2 3 5 [
I I I l ~ xlO" [
1 2 3 4 a- ~ .-,a xlO 41 t J - - x / I 2 3 1
(mlcrocolonies.m1-1) ~.--.m xlO 31 Organisms ( ce l l s .m r -1)
283
I / O I I I I I I I
I - ~/ChtorophyU a
I
5 "-~'-e-. . ! Bacteriochtorophyll a
.= ~ . . . . . Y_':..--'~O
10 -
hlor ophyll e
/ ,~ ,,/
10 20 30 40 50 60 70 80 90 Ch lo rophy l l (ijg , {-1)
Fig. 4. Concentrations of pigments in the water column of the Rotsee: Bacteriochlorophyll a, bacteriochlorophyll e, and chlo- rophyll a (October 4, 1982).
roseum ' -consort ium. Other species such as Chloro- nema giganteum and Chromatium okenii were also detected, but their low numbers did not allow reliable cell counts. At the day of sampling (Oc- tober 4, 1982) the highest numbers of cells were found for Thiopedia rosea at a depth of 7.0 m (3.1 • 105 cells/ml), for Lamprocystis roseopersicina at a depth of 7.5 m (3.7.10 4 cells/ml), and for 'Pelochromatiurn roseurn'-consortium at a depth of 11 m (2.9.103 microcolonies). Thiopedia rosea and Lamprocystis roseopersicina formed a purple layer above the brown layer of 'Pelochromatium roseum'-consortium. These two distinctive layers of planctonic phototrophic bacteria in the Rotsee were also reflected by the distribution of pigments. Fig. 4 shows the concentrations of bacteriochloro- phyll a and e in the hypolimnion. The distribution of pigments fits the curve of total numbers. Chlo- rophyll a (mainly from Anabaena flos-aquae) was present in the epilimnion and disappeared at a depth of 8 m.
Fig. 3. Distribution of the major species of phototrophic sulfur bacteria throughout the water column of the Rotsee on October 4, 1982 at 8.00 a.m.
284
5 I I I
"---=.~z_~-~= ~ _ 0700 " ~ ..... / 1200
~" .-" ~ 19oo 9 - - . ~ f " S " ~ ' ~ = ~_ / t
~ lO
11 I
12 *
13
14 i, 15 ~ t I 1
1 2 3 Organ isms (105 ¢ells-m1-1)
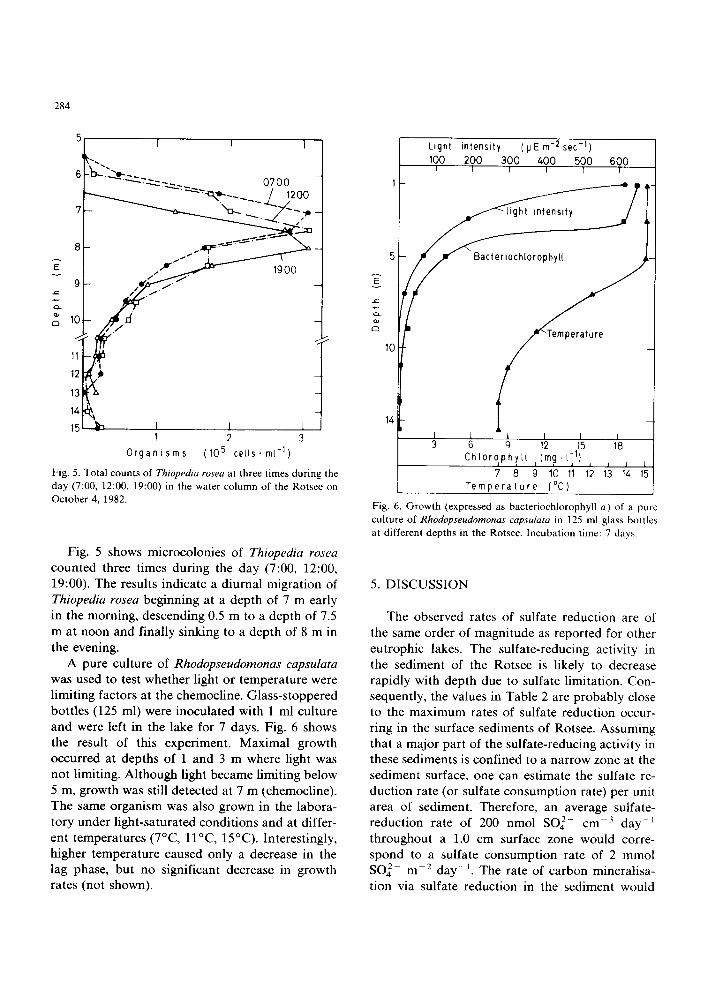
Fig. 5. Total counts of Thiopedia rosea at three times during the day (7:00, 12:00, 19:00) in the water column of the Rotsee on October 4, 1982.
Fig. 5 shows mlcrocolonies of Thiopedia rosea counted three times during the day (7:00, 12:00, 19:00). The results indicate a diurnal migration of Thiopedia rosea beginning at a depth of 7 m early in the morning, descending 0.5 m to a depth of 7.5 m at noon and finally sinking to a depth of 8 m in the evening.
A pure culture of Rhodopseudomonas capsulata was used to test whether light or temperature were limiting factors at the chemocline. Glass-stoppered bottles (125 ml) were inoculated with 1 ml culture and were left in the lake for 7 days. Fig. 6 shows the result of this experiment. Maximal growth occurred at depths of 1 and 3 m where light was not limiting. Al though light became limiting below 5 m, growth was still detected at 7 m (chemocline). The same organism was also grown in the labora- tory under light-saturated conditions and at differ- ent temperatures (7°C, 11°C, 15°C). Interestingly, higher temperature caused only a decrease in the lag phase, but no significant decrease in growth rates (not shown).
IE3
10
14
Light intensity (~JEm-2sec -1 ) 100 200 300 400 500 600
l I I I 1 I
I 1 I I I 1 3 6 9 12 15 18
Ch lo roph , ) ' t l , ( m , g I J ) , , , ,
7 8 9 10 11 12 13 14 15 T e m p e r a t u r e (°C)
Fig. 6. Growth (expressed as bacteriochlorophyll a) of a pure culture of Rhodopseudomonas capsulata in 125 ml glass bottles at different depths in the Rotsee. Incubation time: 7 days.
5. D I S C U S S I O N
The observed rates of sulfate reduction are of the same order of magnitude as reported for other eutrophic lakes. The sulfate-reducing activity in the sediment of the Rotsee is likely to decrease rapidly with depth due to sulfate limitation. Con- sequently, the values in Table 2 are probably close to the maximum rates of sulfate reduction occur- ring in the surface sediments of Rotsee. Assuming that a major part of the sulfate-reducing activity in these sediments is confined to a narrow zone at the sediment surface, one can estimate the sulfate re- duction rate (or sulfate consumpt ion rate) per unit area of sediment. Therefore, an average sulfate- reduction rate of 200 nmol SO42- cm 3 day 1 throughout a 1.0 cm surface zone would corre- spond to a sulfate consumption rate of 2 mmol SO42 m - 2 day-1 . The rate of carbon mineralisa- tion via sulfate reduction in the sediment would

then be approx. 4 mmol CO 2 m - 2 day 1. For this estimate, it was assumed that 2 mol of CO 2 are produced per mol of sulfate reduced.
Sulfate-reduction rates measured in the hypo- limnion of the Rotsee (Table 2) are low when compared with rates in the sediment. However, the relatively high rates of sulfate reduction measured at 14 and 14.5 m may be due to contamination of the water samples with surface sediment. If the samples were uncontaminated it would imply that a substantial part of sulfate reduction, and there- fore organic carbon mineralisation, occurs in the deepest part of the water column of the Rotsee during summer stratification. In the sediment, sulfate reducers were found in far higher numbers than in the water column. These findings are in agreement with sulfate reduction activities mea- sured. Thus, the bulk of the sulfide in the hypo- limnion of Rotsee must have been formed in the sediment. As the sediment did not show any fur- ther capacity to bind sulfide, one can assume that all the sulfide produced in the sediment remained in solution and became available for the photo- trophic sulfur bacteria in the upper water column in an extent controlled only by diffusion and chemical oxidation. The relative maximum of total carbon dioxide around the thermocline observed on September 30 (Fig. 1) is unusual. With respect to the alkalinity measurements (not shown) either the relative maximum of total carbon dioxide indi- cates production of CO 2, or the relative minimum of total carbon dioxide indicates consumption of CO 2 at the corresponding depths. Indeed, at a depth of 7 m, a maximum methane oxidation rate was measured 5 days later (not shown). On the other hand, a relatively dense population of photo- trophic sulfur bacteria (Fig. 5) was observed at depths from 7.5 to 9 m (5 • 105 cells/ml).
The distribution of the phototrophic sulfur bacteria in the anaerobic hypolimnion in Rotsee followed the two layer pattern observed in other lakes [30-33]. The upper layer between 6.5 and 9 m consisted mainly of Chromatiaceae and the lower layer between 9 and 10.5 m of Chlorobi- aceae. The brown carotenoids that the Chlorobi- aceae possess allow them to survive at low light intensities than the Chromatiaceae. Light is the principal limiting factor at the depths where pho-
285
totrophic sulfur bacteria are found (Fig. 6). How- ever, sulfide limitation also plays an important role in the ecological 'behaviour ' of the photo- trophic sulfur bacteria expressed by their distribu- tion in the water column. The migration of Thio- pedia rosea (Fig. 5) may be due to chemotactic movement influenced by the sulfide gradient. The layer reached its uppermost position in the morn- ing, when sulfide had accumulated during the night. During the day, sulfide was continuously oxidized at the chemocline by photosynthetic bacteria, causing the Thiopedia rosea to migrate to regions of higher sulfide concentrations. The migration interval of 1 m seems to be a comprom- ise between the two major limitations: light and sulfide. Until now, only one report on the diurnal migration of phototrophic bacteria existed. Soro- kin [34] described the migration of Chromatium in Lake Belovod.
It is also known that gas-vacuolated cyanobac- teria migrate [35]. Parkin and Brock [8] could not find any diurnal changes in bacteriochlorophyll d, although sulfide concentrations showed a regular fluctuation. They reasoned that, in green sulfur bacteria, the gas vacuoles do not function in the fine regulation of buoyancy but simply keep them from sinking. The migration of Thiopedia rosea indicates a role of the gas vacuoles in the fine regulation of buoyancy in purple sulfur bacteria. Studies on the diurnal migration of gas vacuolated bacteria, such as Thiopedia rosea, have not been reported previously.
A C K N O W L E D G E M E N T S
The 'Advanced Course of Microbial Ecology' was sponsored by the Federation of European Microbiological Societies and the Swiss Society for Microbiology. The Swiss Federal Institute for Water Resources and Water Pollution Control provided the infrastructure and materials for this study. Their generous support is acknowledged. We also would like to thank the Quartierverein Maihof /P ro Rotsee for use of their boats and for giving permission to sample in the lake. We are grateful to N. Pfennig, F. Widdel and A.J.B. Zehnder who scientifically and intellectually guided us throughout this study.
286
REFERENCES
[1] Stadelmann, P. (1980) in Maihof-Rotsee, pp. 54-61, Verlag Quartierverein Maihof, Luzern.
[2] Di~ggeli, M. (1934) Schweiz. Z. Hydrol. 6, 216-440. [3] DtiggelL M. (1936) Schweiz. Z. Hydrol. 7, 205-364. [4] Minder, L. (1949) Schweiz. Z. Hydrol. 11, 245 253. [5] Schegg, E. (1971) Schweiz. Z. Hydrol. 33, 425-532. [6] Bachmann, H. (1931) Schweiz. Z. Hydrol. 5, 39-81. [7] Pfennig, N. (1975) Plant and Soil, 43, 1-16. [8] Parkin, T.B. and Brock, T.D. (1981) Limnol. Oceanogr. 26,
880-890. [9] Jorgensen, B.B. (1977) Limnol. Oceanogr. 22, 814-832.
[10] Sarensen, J., Jorgensen, B.B. and Revsbech, N.P. (1979) Mar. Ecol. 5, 105-115.
[11] Smith, R.L. and Klug, M.J. (1981) Appl. Environ. Micro- biol. 41, 1230-1237.
[12] lngvorsen, K. and Brock, T.D. (1982) Limnol. Oceanogr. 27, 559-564.
[13] Loveley, D.R. and Klug, M.J. (1983) Appl. Environ. Mi- crobiol. 45, 187-192.
[14] Jorgensem B.B., Kuenen, J.C. and Cohen, Y. (1979) Limnol. Oceanogr. 24, 799-822.
[15] Tabatabai, M.A. (1974) Sulfur Inst. J. 10, 11-13. [16] Pachmayr, F. (1960) Vorkommen und Bestimmung von
Schwefelverbindungen in Mineralwasser. Ph.D. thesis, University of Munich.
[17] Cline, J.D. (1969) Limnol. Oceanogr. 14, 454-458. [18] Ingvorsen, K, Zeikus, J.G. and Brock, T.D. (1981) Appl.
Environ. Microbiol. 42, 1029-1036. [19] Goltermann, H.L. (1971) Methods for Chemical Analysis
of Fresh Waters. Blackwell, Oxford. [20] Postgate, J.R. (1979) The Sulfate Reducing Bacteria. Cam-
bridge University Press, Cambridge.
[21] Pfennig, N., Widdel, F. and Triaper, H.G. (1981) in The Prokaryotes (Starr, M.P., Stolp, H., Trtiper, H.G., Balows, A. and Schlegel, H.G., Eds.) pp. 926-940, Springer, Berlin.
[221 Takahashi, M. and lchimura, S. (1970) Limnol. Oceanogr. 15, 711-718.
[23] Goltermann, H.L., Clymo, R.S. and Ohnstatd, M.A. (1978) Methods for Physical and Chemical Analysis of Fresh Waters. IBP Handbook 8, Blackwell, Oxford.
[241 Zimmermann, R. and Meyer-Reil, LA. (1974) Kiel. Meeresforsch. 30, 24-27.
[251 Kirk, J.T.O. (1977) Aust. J. Mar. Freshwater Res. 28, 9-21.
[261 Biebl, H. and Pfennig, N. (1981) in The Prokaryotes (Starr, M.P., Stolp, H., Triiper, H.G., Balows, A. and Schlegcl, H.G., Eds.) pp. 267-273, Springer, Berlin.
[27] Stumm, W. and Morgan, J.J. (1981) Aquatic Chemistry. Wiley lnterscience, New York.
[281 King, G.M. and Klug, M.J. (1982) Appl. Environ. Micro- biol. 43, 1406-1412.
[291 Jones, J.G. and Simon, B.M. (1981) J. Gen. Microbiot. 123, 297-312.
[30] Caldwell, D.E. and Tiedje, J.M. (1975) Can. J. Microbiol. 21, 362-376.
[311 Caldwell, D.E. and Tiedje, J.M. (1975) Can. J. Microbiol. 21, 377-385.
[32] Dubinina, G.A. and Kuznetsov, S.I. (1976) Int. Rev. Ges. Hydrobiol. 61, 1-19.
[33] Abella, C., Montesinos, E. and Guerrero, R. (1980) De- velop. Hydrobiol. 3, 173-181.
[34] Sorokin, Y.I. (1970) Arch. Hydrobiol. 66, 391-446. [35] Konopka, A. and Schnur, M. (1980) Microb. Ecol. 6,
291-301.