Embed Size (px)
Citation preview
Bacterial pneumonia and pandemic influenza could there be an Impact on a sewage treatment plant?
http://www.wordle.net/
Andrew SingerCentre for Ecology & Hydrology
A gentle introduction to influenza pandemics!

What is an influenza pandemic?
• Pandemic Influenza = global spread of influenza infection in humans.
• Pandemic influenza is a rare but inevitable event:– 1918 “Spanish influenza” (H1N1)– 1957 “Asian influenza” (H2N2)– 1968 “Hong Kong influenza” (H3N3)

Cases/Deaths Since 2003: 408/254 (62%)
Why are we interested in this now?

One aim of the pandemic preparedness plan is to slow the spread of influenza, through:
1) vaccine development, stockpiling and distribution,
2) non-pharmaceutical measures, and
3) antiviral stockpiling and distribution 22 November 2007

InfluenzaVirus
InfluenzaCases
AntiviralUse
Secondary Infection Cases
AntibioticUse
41
2 5
5 Treat with antibiotics
2 Treat with antivirals
1 Clinical cases of influenza
4 Secondary infections
3
3 Antiviral prophylaxis (outbreak and post exposure)
Schematic of a Pharmaceutical Preparedness Plan

UK Guidelines
This document is intended for use in the UK in the event that the
World Health Organization declares
that an influenza pandemic has started

What do we need to know to predict the arrival of antibiotics at a sewage treatment
plant during a pandemic? Part I
• The scale of influenza infection (R0)• The scale of prophylactic antiviral use (AVP)• The scale of antiviral use to combat actual
infections (AVT)• The likelihood of secondary infections

Viral Infectivity (R0)
InfluenzaCases
AntiviralTreatment
(AVT)
Secondary Infection Cases
AntibioticUse
R0 = number of secondary cases of influenza produced by 1 infected individual
R0
2.3
2.7
3.1
1.9
AVP
5%
10%
0%30%
50%
70%
AVT
2%
40%
Antibiotic
Developing a Model for Pharmaceutical Use During an Pandemic Influenza
54% reduction in pneumonia with antiviral treatment
Kaiser (2003) Arch Intern Med; Nicholson (2000) Lancet; Treanor (2000) JAMA; Whitley (2000) Pediatr Infect Dis J
Robust Pandemic
EpidemiologyModel
AVP

What do we need to know to predict the arrival of antibiotics at a sewage treatment
plant during a pandemic? Part II
• What antibiotics would be used during a pandemic (how does this compare to baseline)?
• How much of these would be excreted?• How much of these might be lost in the
sewer/sewage treatment plant?• How this predicted concentration (PEC)
compares to thresholds of microbial toxicity (NOEC)
Amoxicillin
Doxycycline
Moxifloxacin
Clarithromycin
Levofloxacin
Erythromycin
Cefotaxime
Clavulanic acid
Cefuroxime
β-l
acta
mC
eph
alo
spo
rin
Mac
rolid
e
Tetracycline
Qu
ino
lon
e

0
500
1000
1500
2000
2500
3000
3500
4000
4500
5000C
efu
roxi
me
Ce
fota
xim
e
Am
oxi
cilli
n
Ery
thro
myc
in
Cla
rith
rom
ycin
Le
voflo
xaci
n
Cla
vula
na
te
Mo
xiflo
xaci
n
Do
xycy
clin
e
Ta
mifl
u
Za
na
miv
ir
Do
se
(m
g d
-1)
CURB 0-2
CURB 3-5
How much will be given to a patient?
Lim (2007) Thorax
Antivirals
Moderately sick
Severely sick

Baseline Antibiotic Use (excreted in England)
1
10
100
1000
10000F
loxa
cilli
n
Am
oxic
illin
Cef
alex
in
Ery
thro
myc
in
Am
pici
llin
Cip
roflo
xaci
n
Pen
icill
in V
Trim
etho
prim
Cef
radi
ne
Cla
rithr
omyc
in
Cef
aclo
r
Cef
adro
xil
Cla
vula
nate
Oxy
tetr
acyc
line
Lym
ecyc
line
Sul
fam
etho
xazo
le
Min
ocyc
line
Cef
urox
ime
Azi
thro
myc
in
Dox
ycyc
line
Oflo
xaci
n
Nor
floxa
cin
Levo
floxa
cin
Mox
iflox
acin
ug
/he
ad
/d
NHS BSA (2008) http://www.nhsbsa.nhs.uk/PrescriptionServices/Documents/NPC_Antibiotics_July_2008.ppt
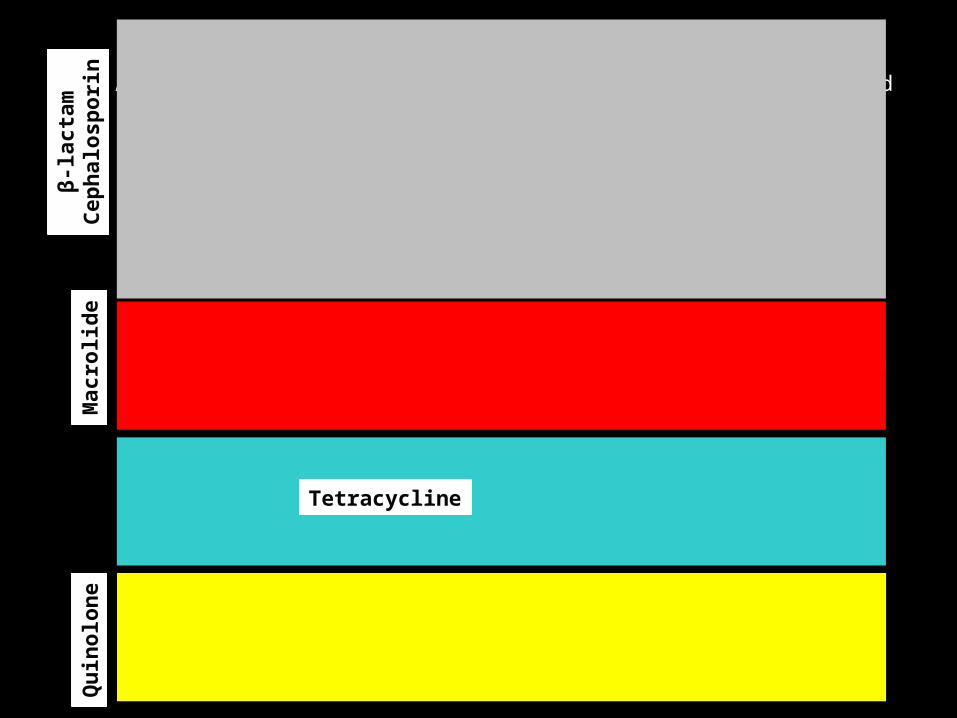
Those highlighted in red to be used in a pandemic

So as an example, today we might use 3.7 mg amoxicillin/d/capita (baseline), but
in a pandemic this would rise an additional 1.3 to 74 mg/d/capita (an
increase of 35 to 2000%)!

Probable Excretion to Sewage Works
10
0
10
0
96
95
80
75
61
55
38
0
20
40
60
80
100
120
Ery
thro
my
cin
Mo
xif
lox
ac
in
Le
vo
flo
xa
cin
Ce
furo
xim
e
Do
xy
cy
clin
e
Am
ox
icill
in
Ce
fota
xim
e
Cla
rith
rom
yc
in
Cla
vu
lan
ate
% E
xc
rete
d a
s P
are
nt
or
Co
nju
ga
te
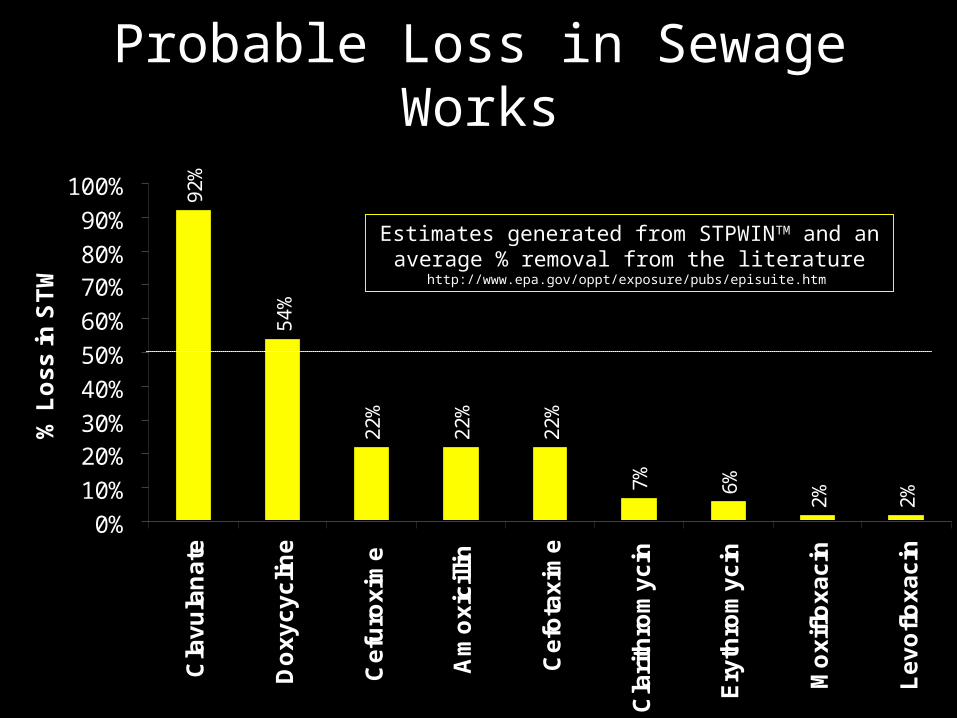
Probable Loss in Sewage Works
92
%
54
%
22
%
22
%
22
%
7%
6%
2%
2%
0%
10%
20%30%
40%
50%
60%
70%80%
90%
100%C
lav
ula
na
te
Do
xy
cy
clin
e
Ce
furo
xim
e
Am
ox
icill
in
Ce
fota
xim
e
Cla
rith
rom
yc
in
Ery
thro
my
cin
Mo
xif
lox
ac
in
Le
vo
flo
xa
cin
% L
os
s in
ST
W
Estimates generated from STPWINTM and an average % removal from the literature
http://www.epa.gov/oppt/exposure/pubs/episuite.htm

Where might the antibiotic concentrations start to hurt
bacteria?

NOEC
0.01
0.1
1
10
Am
oxi
cilli
n
Cla
vulin
ate
Do
xycy
clin
e
Ce
furo
xim
e
Ce
foto
xam
ine
Ery
thro
myc
in
Cla
rith
rom
ycin
Le
voflo
xaci
n
Mo
xiflo
xaci
n
ug
/L A
nti
bio
tic NOEC
Threshold Toxicity for Pandemic Antibiotics against Model Clinical Microorganisms
Andrews JM (2001) J Antimicrob Chemother Reynolds et al. (1987) Chemosphere
Note: we see impacts between 0.1 and 2 ug/L concentrations

R0
2.3
2.7
3.1
1.9
AVP
1%
5%
10%
0%
30%
50%
70%
AVT
2%
40%
2° Infection
A Realistic Scenario
Will antibiotic concentrations in sewage get to harmful levels under a realistic scenario?
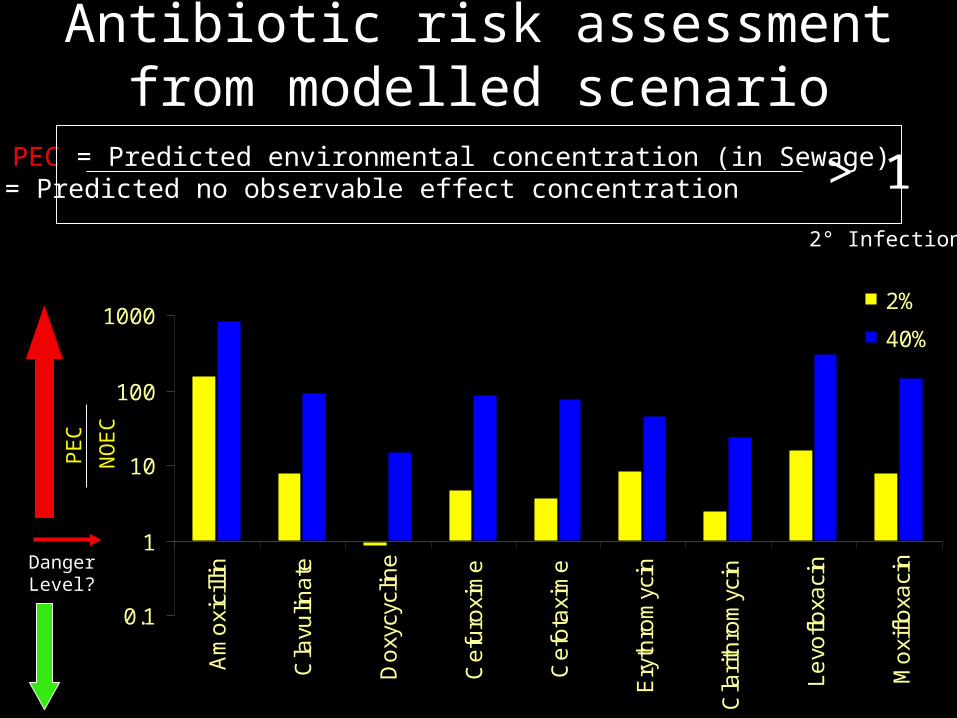
Antibiotic risk assessment from modelled scenario
PEC = Predicted environmental concentration (in Sewage)NOEC = Predicted no observable effect concentration
0.1
1
10
100
1000
Am
oxi
cilli
n
Cla
vulin
ate
Do
xycy
clin
e
Ce
furo
xim
e
Ce
fota
xim
e
Ery
thro
myc
in
Cla
rith
rom
ycin
Le
voflo
xaci
n
Mo
xiflo
xaci
n
2%
40%
PE
C
NO
EC
2° Infection
> 1
DangerLevel?

Under a realistic pandemic influenza scenario most of the individual predicted antibiotic
concentrations exceed the NOEC for laboratory bacteria
But what would it do to sewage bacteria?

Conclusions
• Pandemic usage of total antibiotics will greatly exceed (50-1000%) that of baseline use
• It is important to note that increased antiviral prophylaxis might lower antibiotic use.
• Individual antibiotics in sewage are predicted to exceed concentrations required to inhibit laboratory test microorganisms.

Key Scientific Questions
• Might high antibiotic concentrations harm the complex microbial consortium in a sewage works (rather than just laboratory bugs)?
• How important are additive effects of combined antibiotic usage (similar modes of action)?
• Are antibiotics in unlimited supply?
Further Concerns
• Risk to sewage works failure & ‘downstream’ implications.
• Risk to drinking water under current models and after sewage treatment plant “failure.”
• Increasing antibiotic resistance problem.

Epidemiology Model TeamV. Colizza, Complex Networks and Systems Group, ISI Foundation, Turin, Italy
D. Balcan, A. Vespignani, School of Informatics, Indiana University, Bloomington, IN, USA
River Flow Model TeamV.D.J. Keller, R.J. Williams, Centre for Ecology & Hydrology, Wallingford,
U.K
Thankyou to…..

R0
2.3
2.7
3.1
1.9
AVP
5%
10%
0%
30%
50%
70%
AVT
2%
40%
2° Infection
Role of AVP on Controlling Antibiotics in the Thames
(Realistic Worst Case Scenario)

Toxicity in Stretches of River (0% AVP)
Where, Ro=2.7; AVP 0%, AVT 50%, p40%

Where, Ro=2.7; AVP 10%, AVT 50%, p40%
Toxicity in Stretches of River (10% AVP)