Embed Size (px)
Citation preview

Backwash Optimization for Drinking Water Treatment
Biological Filters
A thesis submitted to
the Faculty of Graduate and Postdoctoral Affairs
in Partial Fulfillment of the requirements for the degree
Master of Applied Science in Environmental Engineering
by
Sarra Ikhlef
Department of Civil and Environmental Engineering
Carleton University
Ottawa-Carleton Institute of Civil and Environmental Engineering
January 2016
©2016 Sarra Ikhlef

ii
ABSTRACT
A lab scale study has been conducted in order to examine the impacts of backwashing on
biofiltration performance. Collapse pulsing resulted in significantly higher DOC removals
(21%) compared to a water only backwash (13%) under nutrient limited conditions. Three
backwash procedures were investigated under nutrient supplemented conditions and were
compared to a control backwash. Employing a lower bed expansion of 20% compared to
the 30% control bed expansion lead to similar %DOC removals (30%). However,
employing a higher bed expansion (40%) than the control backwash lead to significantly
lower %DOC removals (24%). A backwash strategy that reduced the backwash water
volume usage by about 20% resulted in similar % DOC reductions observed with the
control backwash. The investigated backwash procedures were also terminated by the
extended terminal subfluidization wash (ETSW). ETSW demonstrated no impact on
%DOC removals and successfully eliminated the filter ripening sequence. The backwash
procedures investigated in this study showed no consistent impact on biofilters' biomass
concentrations as measured by the phospholipids and the adenosine tri-phosphate (ATP)
methods. Moreover, none of these two analyses showed a direct correlation with DOC
removal. Meanwhile, dissolved oxygen (DO) uptake showed a direct correlation with DOC
removals.

iii
ACKNOWLEDGMENTS
First of all I would like to express my gratitude to my supervisor, Dr.Onita Basu, for giving
me the opportunity to work on this project and for your guidance and constant support. I
feel fortunate to have had the opportunity to work with you and learn from you.
I would like to thank Dr.Marie Tudoret for her constant help and advice in the laboratory.
I also want to thank everyone who has helped me throughout my research; Dejan
Chortanoski, Bruna Senna, Miaoyi Yan, Massie Aruiyengho, Adrian Soble, Quang Bac,
and everyone in Basu Research Group.
Finally, I would like to thank my family, for their unconditional love, their constant
encouragement, and all their sacrifices. Without the encouragement and support of my
parents and my brother I wouldn't be where I am today.

iv
TABLE OF CONTENTS
ABSTRACT ..................................................................................................................................... ii
ACKNOWLEDGMENTS .............................................................................................................. iii
TABLE OF CONTENTS ................................................................................................................ iv
LIST OF TABLES ........................................................................................................................ vii
LIST OF FIGURES ...................................................................................................................... viii
LIST OF ACRONYMS .................................................................................................................. ix
CHAPTER 1- INTRODUCTION .................................................................................................... 1
1.1 Problem Statement ................................................................................................................. 1
1.2 Research Objectives ............................................................................................................... 2
1.2.1 Main Objective ................................................................................................................ 2
1.2.2 Specific Objectives ......................................................................................................... 3
1.3 Organization of Thesis Document ......................................................................................... 3
CHAPTER 2- LITERATURE REVIEW ......................................................................................... 4
2. 1 Filtration in Drinking Water Treatment ................................................................................ 4
2.1.1 Removal Mechanisms ..................................................................................................... 5
2.1.2 Types of Filters ............................................................................................................... 5
2.2 Biologically Active Filters in Drinking Water Treatment ..................................................... 7
2.2.1 NOM Removal by Biofiltration ...................................................................................... 7
2.2.2 Operational Parameters of Biologically Active Filters ................................................... 8
2.3 Backwashing of Drinking Water Biofilters ......................................................................... 11
2.3.1 Backwash Theory and Backwashing Strategies ............................................................ 15
2.3.2 Filter Ripening .............................................................................................................. 19
CHAPTER 3- MATERIALS AND METHODS ........................................................................... 23
3.1 Biofiltration System ............................................................................................................. 23
3.1.1 Experimental Setup Description ................................................................................... 23
3.1.2 Process Configuration and Description ......................................................................... 25
3.2 Phases of Research and Backwashing Experiments ............................................................ 26
3.3 Analytical Methods .............................................................................................................. 32
3.3.1 Dosing Solutions ........................................................................................................... 32
v
3.3.2 Dissolved Organic Carbon ............................................................................................ 32
3.3.3 Ultraviolet Absorbance (UVA) .................................................................................... 33
3.3.4 Dissolved Oxygen ......................................................................................................... 33
3.3.5 Phospholipids Method for Biomass Quantification ...................................................... 33
3.3.6 Adenosine Tri-Phosphate (ATP) for Biomass Quantification ...................................... 35
3.3.7 Particle Counts .............................................................................................................. 36
3.3.8 Turbidity ....................................................................................................................... 36
3.3.9 Temperature, pH ........................................................................................................... 36
3.3.10 Statistical Methods and Data Analysis ........................................................................ 36
CHAPTER 4- BACKWASH OPTIMIZATION FOR DRINKING WATER TREATMENT
BIOLOGICAL FILTERS .............................................................................................................. 39
4.1 Introduction .............................................................................................................................. 40
4.2 Materials and Methods: ........................................................................................................ 43
4.2.1 Experimental Setup ....................................................................................................... 43
4.2.3 Experimental Methodology........................................................................................... 44
4.3 Results and Discussion ........................................................................................................ 48
4.3.1 Impact of Backwashing Procedures on DOC Removals ............................................... 48
4.3.2 Indirect Measurements of DOC Uptake: Biomass and Dissolved Oxygen .................. 52
4.3.3 Impact of Backwashing Procedures on Particles Removal ........................................... 58
4.4 Summary and Conclusions .................................................................................................. 62
CHAPTER 5- CONCLUSION AND RECOMMENDATIONS ................................................... 68
5.1 Overall Summary ................................................................................................................. 68
5.2 Main Findings ...................................................................................................................... 69
5.3 Recommendations for Future Work ..................................................................................... 70
REFERENCES .............................................................................................................................. 72
Appendix A- DOSING SOLUTIONS CALCULATIONS ............................................................ 78
Appendix B- EXTENDED TERMINAL SUBFLUIDIZATION WASH CALCULATION ........ 81
APPENDIX C- CONDITIONING PHASE RESULTS ................................................................. 82
APPENDIX D- POTASSIUM SUPPLEMENTATION PHASE RESULTS ................................ 84
APPENDIX E- ADDITIONAL TURBIDITY RESULTS ............................................................ 86
APPENDIX F- % DOC Removal Data.......................................................................................... 93
APPENDIX G- DO DATA ............................................................................................................ 97

vi
APPENDIX H- PHOSPHOLIPIDS AND ATP DATA ............................................................... 102
APPENDIX I- UV AND TEMPERATURE DATA .................................................................... 107

vii
LIST OF TABLES
Table 2.1- Effect of Backwashing on Drinking Water Treatment Biofilters ................................. 12
Table 3.1- Columns’ Design Parameters ....................................................................................... 25
Table 3.2- Study Phases along with Associated Backwash Experiments ...................................... 28
Table 3.3- Chemicals used for Dosing Solutions Preparation ....................................................... 32
Table 4.1- Summary of Experimental Phases and Backwash Procedures ..................................... 46
Table 4.2- Comparison of Effluent Particle Counts for Phase 2 Backwash Strategies .................. 61

viii
LIST OF FIGURES
Figure 2.1- Filter Ripening Sequence (Amburgey and Amirtharajah, 2005)................................. 20
Figure 3.1- Biofiltration Experimental Setup ................................................................................ 24
Figure 3.2- Columns Bottoms Design ........................................................................................... 24
Figure 4.1- Schematic of the Experimental Setup ......................................................................... 43
Figure 4.2- Impact of Collapse Pulsing on % DOC Removals under Nutrient Limited Conditions
....................................................................................................................................................... 49
Figure 4.3- Impact of Different Bed Expansions on % DOC Removals ....................................... 51
Figure 4.4- Impact of ETSW Addition on % DOC Removals ....................................................... 52
Figure 4.5- Relationship between Biomass and DOC Removal: ................................................... 55
Figure 4.6- Relationship between DOC Removal and DO Uptake ............................................... 57
Figure 4.7- Relationship between DOC Removal and DO Uptake ............................................... 58
Figure 4.8- Impact of Backwash Procedures on Effluent Turbidity: A- Phase 2 Trial 1, B- Phase 2
Trial 2, C- Phase 3 Trial 1, and D- Phase 3 Trial 2……………………………………………….60
ix
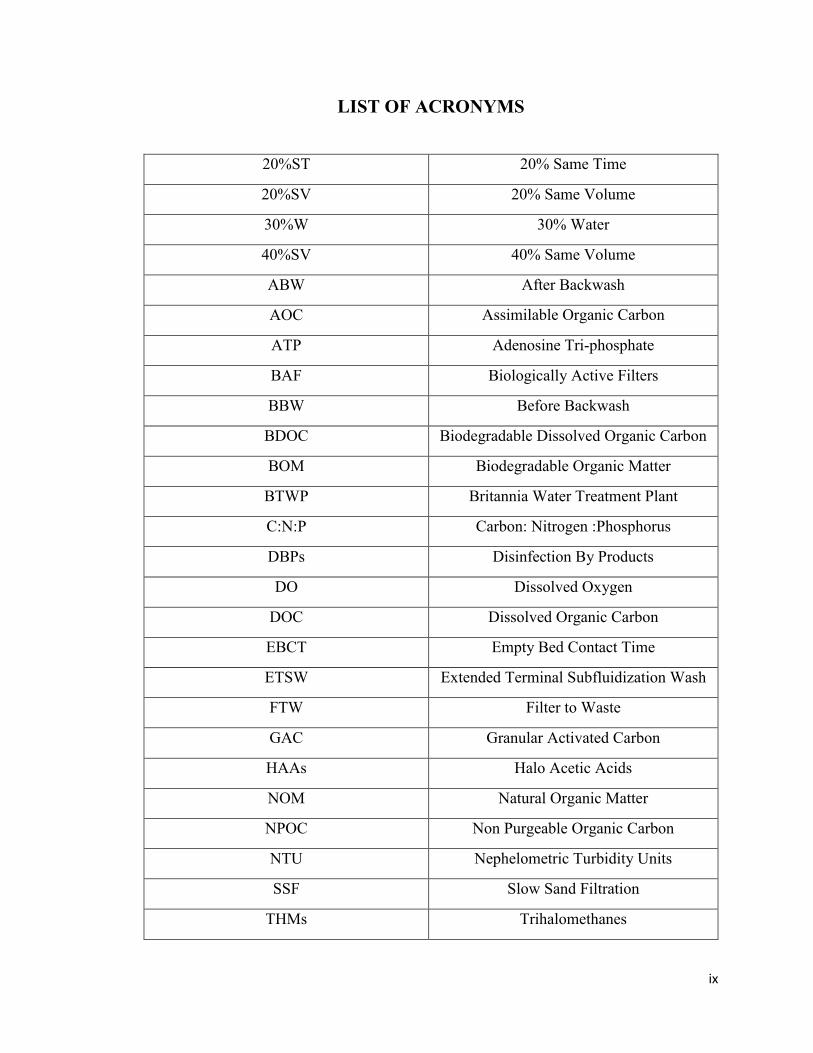
LIST OF ACRONYMS
20%ST 20% Same Time
20%SV 20% Same Volume
30%W 30% Water
40%SV 40% Same Volume
ABW After Backwash
AOC Assimilable Organic Carbon
ATP Adenosine Tri-phosphate
BAF Biologically Active Filters
BBW Before Backwash
BDOC Biodegradable Dissolved Organic Carbon
BOM Biodegradable Organic Matter
BTWP Britannia Water Treatment Plant
C:N:P Carbon: Nitrogen :Phosphorus
DBPs Disinfection By Products
DO Dissolved Oxygen
DOC Dissolved Organic Carbon
EBCT Empty Bed Contact Time
ETSW Extended Terminal Subfluidization Wash
FTW Filter to Waste
GAC Granular Activated Carbon
HAAs Halo Acetic Acids
NOM Natural Organic Matter
NPOC Non Purgeable Organic Carbon
NTU Nephelometric Turbidity Units
SSF Slow Sand Filtration
THMs Trihalomethanes

x
TOC Total Organic Carbon
UC Uniformity Coefficient
UVA Ultraviolet Absorbance

1
CHAPTER 1- INTRODUCTION
1.1 Problem Statement
According to Canadian Drinking Water Quality Guidelines; "surface water or any
groundwater that is under direct influence of surface water has to be filtered" (Health
Canada, 2014). Therefore, in Canada, filtration plays a critical role in the making of potable
water and it needs to be employed in conjunction with disinfection in order to ensure that
the water is free of pathogens and safe to drink. Biological filters are a special type of filters
that have the ability to effectively eliminate water contaminants through the accumulation
of naturally occurring bacteria on the media in the form of a biofilm. These microorganisms
utilize biodegradable organic matter (BOM) as an energy supply and a carbon source
through the mediation of oxidation reduction reactions (Urfer et al., 1997). Benefits of
biological filtration include; decrease in the formation potential of disinfection by products
(DBPs), elimination of taste and odor compounds, reduction in chlorine demand, and
decrease in bacterial re-growth potential within the distribution system resulting in a water
that is biologically stable (Chaudhary et al., 2007).
A biofilter that results in high quality effluent water needs to maintain a healthy biomass
concentration; therefore, backwashing is performed on a periodic basis to prevent
excessive biomass accumulation and headloss buildup and to regenerate the filter's removal
capacity. Backwashing is one of the most important parameters that define both the short
and long term performances of biofilters. An effective backwash has to take into account
the difference in the detachment of both biological and nonbiological particles that were
accumulated during the filtration cycle (Ahmad and Amirtharajah, 1998). An effective
backwash will also successfully balance the removal of excess biomass while keeping
enough attached biomass for subsequent filter runs (Ahmad et al., 1998). Traditionally,
conventional filters were backwashed using water only. However, a backwash that uses a
combination of water and air flow termed "collapse pulsing" was found to be more effective
for cleaning the media due to the increased media collisions and abrasions that are created
when air and water are used together (Amirtharajah, 1993). Because maintaining a healthy

2
biomass is key in biological filtration success, most of the backwashing research was
directed towards understanding the impact that collapse pulsing has on biofiters' biomass
and biological activity, this has shown different levels of success (Emelko et al., 2006; Liu
et al., 2001; Ahmad and Amirtharajah, 1998; Servais et al., 1991). Therefore, more
research is needed to examine the impacts of collapse pulsing backwash on biofiltration
performance under different conditions. Moreover, an optimized backwash not only will
result in excellent effluent water quality but should also take into account overall process
productivity by minimizing filters' time out of service and overall water usage. It is also
unclear whether the amount of biomass attached to the filter media is directly related to
microbial activity and biological filtration performance. Therefore, more investigations are
needed to estimate the relationship between biofilters' biomass and biological activity as
related to BOM removal.
Biofilters also face the same challenges that conventional filters face. Filter ripening
sequence, which is a period of increased effluent turbidity that is observed after backwash,
is a common problem in drinking water treatment industry (Amburgey and Amirtharajah,
2005). Amirtharajah (1988) stated that about 90% of particles' breakthrough in a well
operated filter occurs during the ripening period. Moreover, the main concern about this
stage is the potential breakthrough of pathogenic microorganisms such as Cryptosporidium
and Giardia (Colton et al., 1996). As a result, backwashing should minimize the risks that
are associated with this period by decreasing its duration and intensity. The extended
terminal subfluidization wash (ETSW) which is a flushing step added to the end of the
normal backwash procedure was proven to be successful in achieving that goal for both
conventional and biological filters (Amburgey, 2004). However, the impact of
implementing ETSW on biological filtration performance as related to BOM removal
needs to be investigated.
1.2 Research Objectives
1.2.1 Main Objective
The overall objective of this study was to optimize biological filters’ backwashing through
evaluating and comparing the implications of different backwash procedures on biolfilter's
recovery, performance, and overall effluent quality (Particle removal/Organics removal).

3
1.2.2 Specific Objectives
1. Assess the effect of backwash techniques developed for conventional filters (Collapse
pulsing) on biofilters to ensure that DOC removal is not affected.
2. Evaluate the impact of different backwashing procedures that employ the same amount
of water volume but different bed expansions on biological filters overall performance
(Turbidity/DOC) as well as on biofilters’ biomass.
3. Evaluate the impact of a backwash procedure that employs a different amount of water
volume and bed expansion compared to the control backwash but follows the same
time duration on biofilter’s overall performance (Turbidity/DOC) as well as on
biofilter’s biomass.
4. Assess how different backwashing procedures relate to ripening period duration and
intensity.
5. Evaluate the response of a fixed backwash regime to varying raw water quality
parameters.
6. Evaluate the effectiveness of adding the extended terminal subfluidization wash
(ETSW) to different backwashing procedures on biofilters' ripening period and overall
effluent quality, as well as its impact on biofilter’s biomass.
7. Assess whether microbial concentrations as measured by Phospholipids and Adenosine
tri-phosphate methods are directly related to DOC removal.
8. Assess whether dissolved oxygen uptake is directly related to microbial activity in
terms of DOC removal.
1.3 Organization of Thesis Document
The thesis document contains five chapters. The literature review that is presented in
chapter 2 provides background information for this research. Chapter 3 provides a
description of the experimental setup that was used for this study along with a detailed
description of the experimental methodology and the analytical methods. The results are
presented in chapter 4 in the form of a journal article. Finally, chapter 5 concludes the main
findings from this study and provides recommendation for future work.

4
CHAPTER 2- LITERATURE REVIEW
This chapter provides a general insight into the application of filtration in drinking water
treatment. A review of biologically active filters (BAFs), their importance, and the main
factors affecting their performance is presented. This is followed by a review of
backwashing in drinking water treatment biofilters and current backwashing strategies.
Finally, this chapter is concluded by discussing the main implications and challenges that
are associated with backwashing.
2. 1 Filtration in Drinking Water Treatment
Water treatment using granular media filters for the removal of contaminants is a process
that has been known and applied over decades in drinking water treatment plants. Filtration
is simply the removal of impurities from water as it flows through a porous medium such
as sand, granular activated carbon (GAC) or anthracite in order to improve water quality.
These contaminants can be either algae, sediment, clay, pathogenic microorganisms,
organic, inorganic particles or a combination of all of them (Howe et al., 2012). According
to Canadian Drinking Water Quality Guidelines, "surface water or any groundwater that is
under direct influence of surface water has to be filtered"(Health Canada, 2014). Therefore,
in Canada filtration plays a critical role in the making of potable water and it needs to be
employed in conjunction with disinfection in order to ensure that the water is free of
pathogens and safe to drink.
The importance of filtration lies behind the fact that chemical disinfection alone is
insufficient for the removal of microorganisms of public health concerns such as Giardia
lamblia and Cryptosporidium parvum. Filters have the ability to act as barriers to such
pathogens (Emelko, 2003). Moreover, research has shown that filtration and particularly
biofiltration is very successful in eliminating natural organic matter (NOM) from drinking
water (Huck et al., 1991; Melin and Odegaard, 2000; Liu et al., 2001; Basu and Huck,
2004; Gibertet al., 2012). NOM contributes to color, taste, and odor in the water. It also
promotes biological growth within the distribution system resulting in a water that is
biologically unstable. Furthermore, NOM is known to act as precursor to disinfection by

5
products which have been proven to result in adverse health effects (Matilainen et.al,
2010).
2.1.1 Removal Mechanisms
The removal of contaminants and particles within the water suspension can occur through
many mechanisms, it can be either physical, chemical, or biological. Chemical removal
can take place through adsorption, whereas biological removal is governed by the
biodegradation of pollutants through a biofilm that develops on the media grains. In the
case of physical removal, when the particle size is larger than the pores size, the removal
takes place through straining. However, straining occurs mostly for particles that are larger
than 75 microns (Howe et al., 2012). If the particle is smaller than the void space between
the media grains then straining is not possible and removal occurs through other means. In
that situation, the particle needs to be transported into the media grain and then removed,
there are several transportation mechanisms in which this can happen, and they include:
Interception, which takes place when the particle is moving uniformly within the
streamline and is captured when it collides with the media grain.
Sedimentation, this happens mainly due to the gravitational force which causes the
particle to deviate from the streamline and settle on the filter media.
Diffusion, which refers to the random movement of small particles by Brownian
motion (less than 1 micron in diameter).
Hydrodynamic action, which occurs when particles move towards the media grains
as a result of the velocity gradient in the vicinity of the filter media (Binnie and
Kimber, 2009; Howe et al., 2012).
2.1.2 Types of Filters
There are two main types of gravity filters in drinking water treatment, slow sand filters
and rapid sand filters and it is very important to note the differences between them.
2.1.2.1 Slow Sand Filters
As its name implies, "slow" sand filtration (SSF) occurs at a loading rate much slower than
rapid sand filtration; in fact ssf is about 50 to 100 times slower than rapid sand filtration
(Howe et al., 2012). SSF is the oldest and cheapest method for treating water. The filters

6
employ physical filtration, biological removal and adsorption. Moreover, they are very
efficient in removing particulate suspended matter and bacterial contamination. Fine sand
is used as the medium where a biological mat called the "Schmutzdecke" develops on its
surface, therefore most of the biological activity takes place at the top of the media. These
types of filters are mostly used in small communities, rural areas, or developing countries
where there is a lack of skilled operators as they do not require high maintenance.
Depending on the quality of the raw water they may run for several weeks to several months
without the need of cleaning. Once the filter is clogged and cleaning is required, the top
sand layer is scraped off either manually or mechanically, the filter is restarted afterwards
and the effluent is discharged into waste until testing shows that it meets the required water
quality (Huisman and Wood, 1974).
Although they have several advantages, slow sand filters do have few limitations that need
to be taken into account and these include; decreased biological activity at lower
temperatures, high sensitivity to sudden increases in raw water turbidity which might
require more frequent cleaning, and most importantly, slow sand filters can only be
implemented when there is enough land as they require larger areas compared to other
types of filters (Huisman and Wood, 1974).
2.1.2.2 Rapid Gravity Filters
Rapid gravity filters are the most common types of filters, and unlike slow sand filters, they
are usually part of a process train unless the water that is being treated is of exceptional
quality (Binnie and Kimber, 2009). The media grains are coarser and these filters can
operate at much higher flowrates compared to slow sand filters and thus cover less surface
area. This high filtration velocity indicates that the filtration run time would be shorter and
that the media bed would clog at a faster rate. As a result, cleaning or "backwashing" is
required more frequently which is achieved by simply reversing the water flow and
expanding the filter bed for a fixed time duration. Over the years, several modifications
have been made to the backwashing strategy (Slavik et al., 2013) and these will be
discussed in details in section 2.3. For this reason, rapid sand filters require high
maintenance and thus cannot be employed in areas where there is a limitation of skilled
workers (Howe et al., 2012). Rapid gravity filters employ the same physical and chemical

7
process for contaminants removal as a slow sand filters. However, when a biofilm develops
on the media and biological activities start playing a major role in degrading certain
pollutants they become biologically active filters (BAFs) (Zhu and Bates, 2013).
2.2 Biologically Active Filters in Drinking Water Treatment
Since their discovery, BAFs have been applied for decades in drinking water treatment to
remove a variety of contaminants that might include natural organic matter, nitrates,
perchlorate, sulfate, iron, manganese and trace organic compounds (Chaudhary et al.,
2007). BAFs are considered to be mostly effective in removing the fraction of pollutants
that promote bacterial regrowth within the distribution system and thus they result in a
water that is biologically stable.
Since they are rapid gravity filters in nature, BAFs are generally implemented in
conjunction with other treatment processes and they are almost always followed by
disinfection. As a result, their performance is highly affected by the design of the water
treatment plant, operational and water quality parameters (Moll and Summers, 1999).
2.2.1 NOM Removal by Biofiltration
Natural organic matter in water refers to a wide range of compounds that are derived from
the decaying and leaching processes of organic materials coming from animals, plants, and
microorganisms. Up until today, characterizing NOM remains challenging as it constitutes
of a complex mixture of humic substances, polysaccharides, proteins and amino acids.
Moreover, the abundance of each of these compounds within NOM is affected by seasonal
variations (Prevost et al., 2005). NOM has the potential of promoting microbial growth
within the distribution system. Furthermore, it is the main contributor to taste and odor
problems and to the formation of disinfection by products which are known to be harmful
and carcinogenic (Siddiqui et al., 1997). The Canadian Water Quality Guidelines set a
maximum acceptable concentration of 0.1 mg/L and 0.08 mg/L for Trihalomethanes
(THMs) and Haloacetic acids (HAAs) respectively (Health Canada, 2014).As a result, the
drinking water treatment industry places great importance on the removal of NOM. Several
treatment steps contribute to NOM removal within the drinking water treatment plant,
coagulation and flocculation are known to be effective at NOM removal. Research has

8
shown that the coagulation flocculation process contributes mostly to the removal of the
hydrophobic fraction of the organic matter which is composed mainly of humic substances
(Matilainen et al., 2010).
Biofilters have also been proven to be successful in eliminating the biodegradable fraction
of NOM (Urfer et al., 1997). Biodegradable organic matter (BOM) is mainly the fraction
of NOM that can be consumed by microorganisms as an energy supply and carbon source
(Prevost et al., 2005). Removal of BOM by biofilters has been investigated by many
researchers. For example, the optimization of ozone dose has always been a topic of
research as generally the biofiltration step is preceded by an ozonation step, the use of
ozone increases the biodegradable fraction of the organic matter and results in the
formation of lower molecular weight organic compounds that could be consumed more
easily by the bacteria (Urfer et al., 1997). Over the years, many studies have been
conducted to investigate the effect of ozonation in reducing the formation potential of
DBPs. For example, Siddiqui et al. (1997) looked at an optimal ozone dose that reduced
the DOC by 40-50 % and resulted in a 40-60% decrease in THMs formation potential.
Melin et al. (2002) observed a significant biological activity in biofilters treating ozonated
water even at cold temperatures. However, optimizing biofiltration performance for ideal
NOM removal is not simple as there are many parameters that impact the way it performs
which will be discussed in the next section.
2.2.2 Operational Parameters of Biologically Active Filters
As previously mentioned, biologically active filters have the same physical structure as
rapid gravity filters except that there is a significant presence of biological activity in BAFs
(Zhu and Bates, 2013). Therefore, most of the operational parameters that are discussed
here are also considered when optimizing the performance of conventional rapid gravity
filters.
2.2.2.1 Filter Media
Selecting the right filter media is of great importance for good operation of the biofilter.
The macroporous structure of GAC and its irregular shape makes it a more suitable surface
for the attachment of microorganisms than other types of media (Chaudhary et al., 2007).

9
By analyzing for phospholipids as an indicator for the amount of biomass present, Wang
et al. (1995) found that GAC media can support higher concentrations of biomass than
anthracite does. Urfer et al. (1997) recommended that future evaluations where biological
analysis and removal of BOM are being assessed start only when enough filtration time
has been run to ensure that the adsorptive capacity of GAC is completely exhausted and
that all the removal is actually attributed to biological activity rather than chemical
adsorption. In their study, Emelko and colleagues (2006) used spent GAC that has been in
service for several years and found that similar total organic carbon (TOC) removals were
achieved with both anthracite and GAC at high temperatures (21-24oC) whereas the
removals were higher with GAC at lower temperatures (1-3oC).
2.2.2.2 Empty Bed Contact Time (EBCT)
EBCT is a key design parameter for filters used in water treatment, in biofilters it is very
important to select a suitable contact time for ideal BOM removals (Urfer et al., 1997).
Both the hydraulic loading and the bed depth could be altered to increase or decrease the
EBCT as long as they are within the design ranges for rapid filtration. Research has shown
that increasing this parameter increases the removal but up to an optimum value
(Chaudhary et. al, 2007). A considerable amount of studies were conducted in order to
evaluate the impact of contact time on the performance of biofilters. For example, an
investigation that was carried by Hozalski et al. (1995) demonstrated that the removal of
total organic carbonis independent of EBCT in the range of 4-20 min. On the other hand,
Servais et al. (1992) observed a linear increase in BDOC removal with increasing EBCT
between 10 and 30 minutes. Following ozonation, (Wang and Summers, 1996) reported
that some ozonation by products such as aldehydes, glyoxal and methyl glyoxal were
successfully removed to below the detection limits after 2 minutes of EBCT and no further
removal was observed with increasing EBCTs. What is really important to note here, is
that generally, optimum contact time selection depends on the objective of the biofiltration
and on the water quality parameters as longer EBCTs are required to remove chlorination
by products precursors than the EBCTs required to remove ozonation by products (Urfer
et al., 1997).

10
2.2.2.3 Temperature
Generally, better biofiltration performance is observed at higher temperatures than at
colder ones, this is attributed to faster mass transfer and microbial kinetics during warm
conditions (Urfer et al., 1997). Emelko et al. (2006) observed significantly higher BOM
removals expressed in terms of oxalate during warm temperatures (21-24oC) than at colder
temperatures (1-3oC) for the same type of media. For example, GAC media had a median
TOC removal of 92% at warm temperatures whereas the median removal was about 50%
under cold temperatures. This is consistent with Moll et al. (1999) findings that
demonstrated average DOC removals of 15% at 5oC compared to average removals of 24%
for tests conducted at 20oC and 35oC. Likewise, Andersson et al. (2001) conducted a study
to examine ammonia removal in biologically activated carbon filters. The authors reported
ammonia removals of 40% to 90% at temperatures higher than 10oC and removals that
were below 30% for temperatures below 4oC.
2.2.2.4 Biomass
Perhaps the most important parameter governing biofiltration performance would be the
biomass that is attached to the media as most -if not all- of the biodegradable organic matter
removal is attributed to microbial activities. Many factors could affect biomass
accumulation and attachment on the media including backwashing procedures, type of
media used, filtration rate, and the type and concentration of nutrients and organics in the
raw water (Chaudhary et. al, 2007). In order to quantify biomass concentrations within the
biolfilters, numerous techniques have been adapted such as heterotrophic plate counts
(HPC) (Kaur et al., 2003; Ahmad et al., 1998), phospholipids analysis (Emelko et al., 2006;
Moll et al., 1999; Liu et al., 2002), and Adenosine Tri-Phosphate (ATP) analysis (Gibert
et al., 2013; Velten et al., 2011). Dissolved oxygen uptake rate is another method that is
adapted by several researcher to track biofilm activity in biological wastewater treatment
processes (Shariati et al., 2013; Meric et al., 2003; Orupold et al., 1999; Yoong et al., 1999).
2.2.2.4 Backwashing
Backwashing is performed in order to clean the biofilters and restore their removal
capacity. It is triggered by either headloss, time, breakthrough, or a combination of them.
This parameter is crucial as it doesn't only result in the start of a new filtration cycle but it

11
also determines the entire performance of the biolfilter both on the short and long terms.
Therefore, it is extremely critical to select a suitable backwashing regime to ensure
optimum and stable performance of biofilters (Chaudhary et. al, 2007). Backwashing is
discussed in detail in the next section (Section 2.3).
2.3 Backwashing of Drinking Water Biofilters
As stated earlier, it is highly essential to carry out biolfilter backwashes on a regular basis
to ensure their proper performance. However, determining which backwashing technique
is suitable for a certain type of biofilters is not always an easy task due to the fact that they
capture all sorts of pollutants including biological and nonbiological particles, therefore
the difference in the detachment of these particles need to be taken into account when
designing a cleaning strategy (Urfer et al., 1997; Chaudhary et al., 2007).
Furthermore, the biomass that is attached to the media is an important aspect that should
be considered as it contributes to most of the BOM removal. Successful performance of
biofilters is determined by maintaining an active biofilm that has the ability to degrade the
organic matter efficiently. As a result, an effective backwash procedure would control
biomass growth within the biolfilter by balancing the removal of excess biofilm that might
cause clogging and substrate diffusion limitations while keeping enough for subsequent
filter runs (Ahmad et al., 1998). When it comes to filtration (both conventional and
biological), most treatment plants design their backwash based on historical assumptions
and what has been applied in practice (Xue, 2011). But in fact, backwashing is one of the
parameters that cannot be generalized, meaning that each treatment plant has to optimize
its own procedure based on its own raw water quality characteristics, as a result what has
been proven to be optimal for a certain treatment facility might not be the best option for
another. Over the past few years, several investigations have been performed to study the
effect of backwashing on biofiltration performance, a number of them is summarized in
table 2.

12
Table 2.1- Effect of Backwashing on Drinking Water Treatment Biofilters
Source/
Reference
Backwash Strategy Duration
(Min)
Main Findings
Kim et al.
(2013)
1. Air scouring
2. Collapse pulsing:
Air flowrate = 1m/min
Water flowrate = 0.28 m/min
3. Water only wash at 0.4 m/min
NA
1
20
A large fraction of biomass was lost due to
backwashing (≈1015 bacteria/m3 BAC), however
the backwash had no impact on the bacterial
community composition and organization
(diversity, richness, and evenness)
Emelko et al.
(2006)
Investigation1:
1. Air scour = 3 scfm/sqft
2. Low rate water wash = 10.7 m/hr
3. High rate water wash = 42.7 m/hr
Investigation2:
1. Low rate water wash =10.7 m/hr
2. High rate water wash = 42.7 m/hr
Investigation3:
1. Low rate water wash = 7.3 m/hr
2. Collapse pulsing
Air flowrate = 3scfm/sqft
Water flowrate =7.3 m/hr
23-24
20-21
16
The backwash protocol had a significant effect on
the top of media biomass concentrations in
certain cases (When air scouring was absent,
higher biomass concentrations were observed
under warm water conditions 21-24oC). However,
BOM removals were not affected by any of the
backwashing procedures. Similarly, effluent
turbidities and particles removal were not
influenced by the presence or absence of air
scouring. Shorter filter run times were obtained
when collapse pulsing was employed.
13
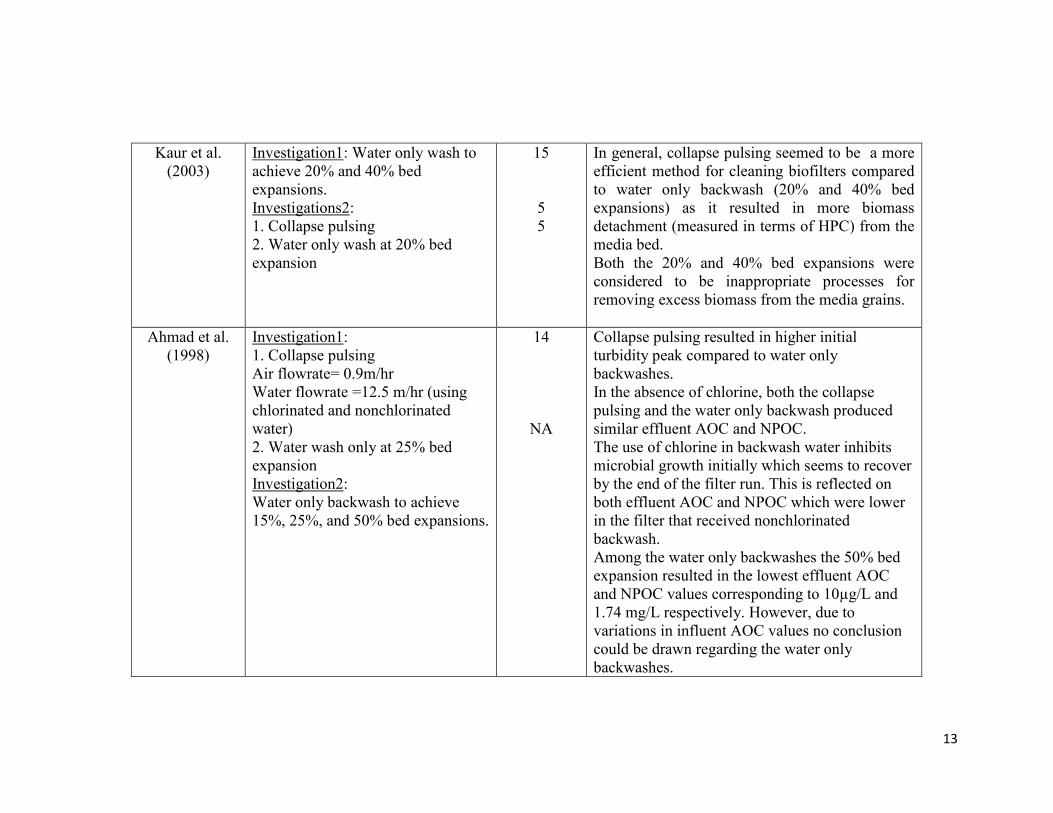
Kaur et al.
(2003)
Investigation1: Water only wash to
achieve 20% and 40% bed
expansions.
Investigations2:
1. Collapse pulsing
2. Water only wash at 20% bed
expansion
15
5
5
In general, collapse pulsing seemed to be a more
efficient method for cleaning biofilters compared
to water only backwash (20% and 40% bed
expansions) as it resulted in more biomass
detachment (measured in terms of HPC) from the
media bed.
Both the 20% and 40% bed expansions were
considered to be inappropriate processes for
removing excess biomass from the media grains.
Ahmad et al.
(1998)
Investigation1:
1. Collapse pulsing
Air flowrate= 0.9m/hr
Water flowrate =12.5 m/hr (using
chlorinated and nonchlorinated
water)
2. Water wash only at 25% bed
expansion
Investigation2:
Water only backwash to achieve
15%, 25%, and 50% bed expansions.
14
NA
Collapse pulsing resulted in higher initial
turbidity peak compared to water only
backwashes.
In the absence of chlorine, both the collapse
pulsing and the water only backwash produced
similar effluent AOC and NPOC.
The use of chlorine in backwash water inhibits
microbial growth initially which seems to recover
by the end of the filter run. This is reflected on
both effluent AOC and NPOC which were lower
in the filter that received nonchlorinated
backwash.
Among the water only backwashes the 50% bed
expansion resulted in the lowest effluent AOC
and NPOC values corresponding to 10µg/L and
1.74 mg/L respectively. However, due to
variations in influent AOC values no conclusion
could be drawn regarding the water only
backwashes.

14
Hozalski and
Bouwer (1998)
Water only backwash to achieve
15%-50% bed expansions.
Water flowrates= 23-53 m/hr
10 A 20-40% bacterial detachment was observed
during backwash which was not significantly
affected by the different bed expansions and the
backwashing. The authors concluded that TOC
removal is not impacted by water only
backwashing.
Miltner et al.
(1995)
Water only backwash to achieve 50
% bed expansion
Investigation1: Utilizing chlorinated
water (1 mg/L free chlorine)
Investigation2: Utilizing non
chlorinated water
10 Backwashing using chlorinated water resulted in
an average biomass loss of about 22%, However
biomass always recovered to its pre-backwash
concentration at about 40 hours after restart.
Backwashing using nonchlorinated water had no
apparent impact on biomass concentration.
Average formaldehyde removal was 67% 1 hour
after backwashing using chlorinated water and
then increased to an average of 85% at about 50
hours after restart, similar trends were observed
for acetaldehyde, methyl glyoxal, and AOC-
NOX.
Backwashing using nonchlorinated water had no
negative impact on natural organic matter
removal.
Servais et al.
(1991)
1. Collapse pulsing:
Air flowrate = 30 m/hr
Water flowrate = 10 m/hr
2. Water only wash at 25 m/hr
2
20
Backwash did not result in a vertical stratification
of the filter media and resulted in only 4-8% of
biomass detachment. Biological filtration
performance is not impacted by collapse pulsing
conditions.

15
It is important to note that the intensity and frequency of backwash should be selected with
caution. By conducting bench scale experiments, Choi et al. (2007) evaluated the impact
of strong and weak daily backwashes on biofilters performance used for perchlorate
removal, the weak cleaning regimes had a slight negative effect on the removals whereas
the strong cleaning regimes resulted in a complete deterioration of perchlorate
biodegradation.
Usually a filter cycle can last for several days, the end of this stage can be triggered either
by filter breakthrough which basically means that the filter is no longer efficient in
collecting particles and that increased turbidity is observed in the effluent. Excessive
headloss can also bring the filtration phase to an end, this happens when headloss reaches
the available head which is typically between 2 to 3 meters for rapid gravity filters. If the
filter has not reached headloss or breakthrough, then plant operators schedule a set period
of time for the filtration stage in which backwash needs to take place once that period is
over (Howe et al., 2012).
2.3.1 Backwash Theory and Backwashing Strategies
2.3.1.1 Water Only Backwash
Generally, by the end of filter run, the inlet is closed and the water direction is reversed
upwards to fluidize the media for a certain length of time in order to flush out all the
impurities that were collected during the filtration stage (Binnie and Kimber, 2009). The
backwash water velocity needs to be high enough to flush out all the captured impurities
but not too high that it would result in media loss (Howe et al., 2012). Some engineering
manuals recommend a 30-50% bed expansion, others state that a 15 to 20% bed expansion
would be sufficient with the right backwash duration (Satterfield, 2005). After determining
the required expansion, the following equations could be used to determine the required
backwash water flowrate (Howe et al., 2012), starting by Reynolds number equation:
Re=𝝆𝑾𝒗 𝒅𝟗𝟎
𝝁 Equation 2.1
Where:ρW= water density (kg/m3)

16
v = backwash velocity (m/hr)
μ= water viscosity (kg/m.s)
d90= the media grain diameter at which 90% of the media by weight is smaller
(m)
Equation 2.2 can be used to determine d90 using the effective size (d10) and the
uniformity coefficient (UC):
𝒅𝟗𝟎= 𝒅𝟏𝟎[𝟏𝟎𝟏.𝟔𝟕 𝐥𝐨𝐠(𝑼𝑪)] Equation 2.2
UC=𝒅𝟔𝟎
𝒅𝟏𝟎 Equation 2.3
Where: d60,d10= the 60th and 10th percentile media grain diameters respectively (mm)
Equation 2.4 is used to determine Reynolds number:
Re = −𝒌𝑽 (𝟏−𝜺𝑬)
𝟐𝒌𝒍+
𝟏
𝟐𝒌𝒍√𝒌𝒗
𝟐(𝟏 − 𝜺𝑬)𝟐 + 𝟒𝒌𝒍𝜷 Equation 2.4
Where: kV , kl= Ergun coefficients for viscous and inertial losses (unitless)
𝜀𝐸 = expanded bed porosity (dimensionless)
𝛽= backwash calculation factor (dimensionless)
The backwash calculation factor can be calculated by equation 2.5:
𝜷 =𝒈𝝆𝑾(𝝆𝑷−𝝆𝑾)𝒅𝟗𝟎
𝟑 𝜺𝑬𝟑
𝝁𝟐 Equation 2.5
Where:ρP: density of the media particles (kg/m3)

17
Finally the relationship between the expansion and the bed porosity is described by
equation 2.6:
𝑳𝑬
𝑳𝑭=
(𝟏−𝜺𝑭)
(𝟏−𝜺𝑬) Equation 2.6
Where: LE, LF : depth of expanded and fixed bed respectively (m)
Another important parameter to consider during backwash is the minimum fluidization
velocity (Vmf), which is the water flowrate rate at which the media bed starts fluidizing
(Xue, 2011).
To determine Vmfthe following equations are used (Taylor and Francis, 2006):
𝑹𝒎𝒇 = 𝒅𝟗𝟎𝑽𝒎𝒇𝝆𝑾
𝝁 Equation 2.7
Where:Vmf= minimum fluidization velocity (m/hr)
Rmf= Reynolds number at minimum fluidizationvelocity
𝑹𝒎𝒇 = [𝟑𝟑. 𝟕𝟐 + 𝟎. 𝟎𝟒𝟎𝟖𝑮𝒂]𝟎.𝟓 − 𝟑𝟑. 𝟕 Equation 2.8
Where: Ga represents Galileo number and it can be calculated using equation 2.9:
𝑮𝒂 =𝒅𝟗𝟎
𝟑𝝆𝑾(𝝆𝑷−𝝆𝒘) 𝒈
𝝁𝟐 Equation 2.9
It is very important to note that the backwash velocity would be different for summer and
winter as it depends on the viscosity of water. In order to keep the same expansion, a lower
flowrate should be employed during colder temperatures than the one used during warm
temperatures, keeping the same flowrate in winter might result in media loss (Howe et al.,
2012).
In rapid gravity filters the backwash can sometimes be coupled with a surface wash, which
is simply jets of water that are directed on the filter surface to help break the crust that was
formed during the filtration cycle. Even when the media finally starts fluidizing the surface
wash can still be employed to provide additional vigorous agitations which are believed to
result in more efficient cleaning (Howe et al., 2012; Binnie and Kimber, 2009).

18
2.3.1.2 Air Assisted Backwash
Research has shown that the use of water alone is not a very effective method for cleaning
filters due to the limited collisions and abrasions between media particles during
fluidization. Thus the most effective backwash that a filter could receive would be by the
simultaneous use of air scouring and subfluidization water flowrates (Amirtharajah et al.,
1990). As a result, modern water treatment plants employ both air and water for
backwashing. A typical sequence would be pumping air for 2 to 3 minutes through the bed
to break the surface crust that has formed during the filtration cycle. After that, water at a
very low rate is pumped simultaneously with air for about 5 minutes in order to carry out
dirt that is coming out from the media. Finally the air flow is stopped and the water flow is
increased to achieve the required bed expansion (Binnie and Kimber, 2009).
Amirtharajah et al. (1990) defined collapse pulsing conditions as the agitations that are
observed when the filter bed is backwashed with concurrent air and water flow. This
phenomenon results in a more adequate cleaning due to the high degree of abrasions and
collisions between the media grains. Air scouring is a technique that was initially
developed for nonbiological filters which are mainly employed for particle removal. As a
result, the main concern about employing collapse pulsing for biofilters was that this
vigorous cleaning regime would result in a great biomass loss and would therefore impair
BOM removal (Urfer et al., 1997). However, a lab scale study that was conducted by
Ahmad and Amirtharajah (1998) indicated that a greater force is needed to detach
biological particles from the media grains than the one needed to detach nonbiological
particles. As a result, a cleaning technique that is successful for the removal of particles
could be implemented on biofilters without the fear of compromising BOM degradation.
Various studies investigated the effect of implementing air scouring and collapse pulsing
on filter biomass and biofilters performance in general. Servais et al. (1991) reported only
a 4-8% loss in biomass. Interestingly, Emelko et al. (2006) found that utilizing air when
backwashing had a significant effect on top of filter biomass under warm water conditions
(21-24oC). However, this did not seem to have any impact on BOM and particle removals.
This is consistent with Ahmad et al. (1998) findings which indicated that filters
backwashed under collapse pulsing conditions produced similar effluent assimilable

19
organic carbon (AOC) to the filters that haven't received any air scouring. Furthermore,
their results indicated that collapse pulsing was actually a more efficient method of
cleaning as effluent microbial counts -expressed as HPC- were higher for the filter that
received a water only wash. Therefore, essentially, adding air to the backwash regime is
considered to be a more efficient strategy for controlling biofilm thickness and growth. Liu
et al. (2001) evaluated the impact of air scouring conditions under warm and cold
temperatures, 5oC and 20oC respectively, as well as the presence of chlorine or chloramines
in the water when collapse pulsing is employed, the only negative effect that air had on
BOM removal was observed under cold conditions and when chloramine was present, other
than that this backwash strategy did not seem to compromise biological activities.
2.3.1.3 Chlorinated Water Backwash
Some plants use chlorinated water for their backwash, therefore understanding the
implications of chlorine presence in the water is of great importance. Mitlner et al. (1995)
observed an immediate loss of biomass after employing a chlorinated water backwash.
Nevertheless, the amount of biomass present always seemed to recover to its prebackwash
concentration later in the filter run. Their observations were also consistent with BOM
removals which dropped right away after backwash and then returned to steady state
removal later in the filter cycle. Similarly, Ahmad et al. (1998), found that a higher initial
headloss is associated with biological filters backwashed with nonchlorinated water
compared to the ones backwashed with chlorinated water, this higher headloss was
attributed to microbial growth which indicates that chlorine use inhibits biomass growth
within the filter media. The authors also emphasized on the fact that the effects of chlorine
inhibition were only considerable during the initial stages of filter restart. In their study on
the impact of different factors on biofilters performance, Liu and colleagues (2001)
recommended that plants should avoid the use of chlorine in backwash water unless when
it is necessary to control excessive biomass growth and development within the filter.
2.3.2 Filter Ripening
Filter ripening is a well-known problem to the water treatment community, it is a period of
poor effluent quality and increased turbidity seen immediately after a filter has been
backwashed and put back into operation (Amirtharajah, 1984). The intensity and duration

20
of this phase could be affected by several parameters, including raw water quality
characteristics, efficiency of the coagulation, and the adapted backwash regime (Amburgey
and Amirtharajah, 2005).
As shown in figure 2.1, the filter ripening sequence is distinguished by five different stages;
the lag phase is associated with the clean backwash water that exists the filter first when it
is put back into service. Following that is the intramedia remnants stage which is observed
due to the particles that have been detached from the media during backwash and that have
remained in the pore water. The third phase is also linked to backwash remnants that ended
up in the filter box above the media, after that comes the fourth phase which represents the
second peak and it is related to the particles in the influent water mixing with the backwash
remnants. Finally, the fifth stage represents the improvement in the filtration efficiency as
newly attached particles act as collectors of other particles (Amburgey and Amirtharajah,
2005).
Figure 2.1- Filter Ripening Sequence (Amburgey and Amirtharajah, 2005)
Figure 2.2- Filter Ripening Sequence (Amburgey and Amirtharajah, 2005)

21
The major concern about this period of poor filtrate quality is associated with the potential
passage of pathogenic microorganisms (Slavik et al., 2013). Colton et al. (1996) reported
that 42%-48% of the particles exiting filters during ripening period are of the
Cryptosporidium oocysts size range. Canadian Drinking Water Quality Guidelines set a
maximum filter effluent turbidity of 0.3 NTU in at least 95% of the measurements per filter
cycle or per month and state that effluent turbidity should never exceed 1 NTU (Health
Canada, 2014). Therefore, the filter can only be put into operation after backwash when
the effluent turbidity falls below 0.3 NTU in order to avoid the risks that are associated
with the ripening period. This results in a waste of treated water.
For the reasons mentioned above, several efforts have been done trying to reduce the
duration and the intensity of this stage. One approach is the addition of filter aid polymers
or coagulants which increases the size of particles, enhances their attachment to the filter
media, and eventually ends up reducing backwash turbidity (Harris, 1970; Francois and
Van Haute, 1985; Zhu et al., 1996). Nevertheless, this is not always a feasible technique
as the dose of the chemical added needs to be optimized based on the changes in raw water
quality characteristics. Furthermore, the formed flocs may clog the filter and result in
excessive headloss development (Amburgey, 2004). Colton et al. (1996) suggested
optimizing the collapse pulsing duration to not be too short that it would result in poor
cleaning and not too long that it would detach all the particles that might act as additional
collectors. Furthermore, the authors proposed the slow start mode which is based on
restricting the flowrate through the filter until the filtrate becomes of acceptable quality.
This was a useful strategy as it reduced the particles passage (2-5µm in size) by more than
half. However, for this to be successful extensive flow control is required. Amburgey
(2004) investigated the impacts of the extended terminal subfluidization wash technique
(ETSW) on filter ripening period. ETSW is an additional flushing step to the normal
backwash procedure that is employed for the purpose of eliminating the backwash
remnants and preventing them from ending up in the effluent and causing turbidity spikes.
In order for it to be successful, the subfluidization wash has to allow for a sufficient time
duration to pass one theoretical filter volume of water through the bed. The critical part
about it is that the water flowrate has be high enough to flush out remnant particles but not
too high that it would results in the detachment of new particles that are needed to

22
contribute to the filtration efficiency once the filter is restarted. Salvik et al. (2013),
reported that the benefits of the additional flushing step is delaying turbidity breakthrough
and thus resulting in longer filter run times. Furthermore, Amburgey (2004) reported that
when ETSW was tested on biofilters it lead to the same results that were observed on
conventional filters. Although proven to be successful, not enough research has been
conducted to assess the implication of ETSW under varying conditions. The impact of
employing ETSW on biological filters performance in terms of DOC removal hasn’t been
investigated before. Moreover, although previous research has proved that backwashing is
a parameter that may affect both the short and long term performances of biological filters,
however, the exact impacts of this factor are still poorly understood. It is still unclear
whether collapse pulsing results in major biomass loss and deteriorates biodegradable
organic matter removal. In addition to that, backwash strategies should be optimized while
taking into account the detachment of both biological and nonbiological particles that were
accumulated during the filtration cycle. More information is needed to understand how a
backwash procedure could be optimized without compromising biological activity and the
biofilter particles ‘accumulation capacity. It is also important to note that there is a lack of
appropriate methods for estimating biological activity within the biofilters. The
experiments conducted in this research are directed towards developing a better
understanding of biological filtration performance by addressing these questions and by
contributing to the overall knowledge that was developed throughout the years about
biologically active filters.

23
CHAPTER 3- MATERIALS AND METHODS
This chapter provides a description of the experiments that were conducted for the
backwash optimization research on biofilters. A thorough description of the experimental
setup and process configuration is provided first, followed by a description of the different
phases of the experiments along with the backwashing procedures adapted. In addition to
that, a description of the water quality parameters analyzed and microbial analysis are
provided.
3.1 Biofiltration System
3.1.1 Experimental Setup Description
The experiments were conducted on a system consisting of four bench scale dual media
filters operating in parallel and containing 520 mm of GAC on top of 180 mm of sand as
the filter media along with 15 mm of synthetic underdrain that acted as a media support.
The columns were identical, each one of them was made of plexi-glass and had an inside
diameter of 50 mm. As seen in the experimental set up shown in figure 3.1, each column
had 5 sampling ports spaced equally at different media depths in addition to one overflow
port with an attached tubing that allowed for dirty backwash water collection. The flow
rate through each column was 100 mL/min to allow for an empty bed contact time of 15
minutes, however, flow control challenges lead to 20% variations in the incoming flowrate.
Figure 3.2 shows the design of the columns bottoms which was selected in order to allow
for effluent collection as well as the introduction of backwash water and air scour. Each
bottom had a 1/4 inch union cross attached to it which was also connected to a 1/4 inch tee
fitting at the other end. 1/4 inch ball valves were attached to each port. The effluent ball
valve was open 7 days a week except when the biofilter was put out of operation in order
to backwash it, then the effluent would be closed and the top left and right ball valves
would be open allowing for backwash water and air introduction.

24
Figure 3.1- Biofiltration Experimental Setup
Biofilter 1
Biofilter 1
Biofilter 1
Biofilter 1
Biofilter 2
Biofilter 2
Biofilter 2
Biofilter 2
Biofilter 3
Biofilter 3
Biofilter 3
Biofilter 3
Biofilter 4
Biofilter 4
Biofilter 4
Biofilter 4 Dosing
Pump
Dosing
Pump
Dosing
Pump
Dosing
Pump
Rotameters
Rotameters
Rotameters
Rotameters
Backwash
Water
Collection
Backwash
Water
Collection
Backwash
Water
Collection
Backwash
Water
Collection
Dechlorination
Column
Dechlorination
Column
Dechlorination
Column
Dechlorination
Column
Air
Introduction
Figure 3.3-
Columns
Bottoms
DesignAir
Introduction
Online
Turbidimeter
Online
Turbidimeter
Online
Turbidimeter
Online
Turbidimeter
Overflow
Ports
Overflow
Ports
Overflow
Ports
Overflow
Ports
Sampling
Ports
Sampling
Ports
Sampling
Ports
Sampling
Ports
Effluent to
drain
Backwash Water
Introduction
Dosing
Tanks
Dosing
Tanks
Dosing
Tanks
Dosing
Tanks
Figure 3.2- Columns Bottoms Design

25
Table 3.1 shows the different parameters that are associated with the biofilters.
Table 3.1- Columns’ Design Parameters
Design Parameter Value/Description
Flow Rate (ml/min) 100
EBCT (min) 15
Column Height (mm) 1250
Column Diameter (mm) 50
GAC Bed Depth (mm) 520
Sand Bed Depth (mm) 180
GAC Effective Size (mm) 0.7
Sand Effective Size (mm) 0.5
Number of Sampling Ports (#/column) 5 (+ 1 overflow port)
3.1.2 Process Configuration and Description
To feed the columns, two 50 L Nalgene heavy cylindrical containers were used, one of
them contained a mixture of carbon solutions (glyoxal, acetic acid, and formic acid), and
the other contained a mixture of nitrogen, phosphorous, and micronutrients (magnesium
and sodium). The carbon and nutrients solutions were dosed using a Masterflex peristaltic
pump (model 7519-15, Master flex tubing (LS-14) and cartridges) into a line where they
mixed with dechlorinated tap water. The tap water flow was controlled using a ½ inch
McMaster Carr brass check valve followed by a McMaster Carr flow meter. To ensure that
the dosing solutions were mixed adequately an inline static mixer was used (McMaster
Carr). After this, the flow went through a manifold (McMaster Carr) in order to split it
equally into four different rotameters (Cole Palmer) employed to control the influent

26
flowrate into the biofilters. The effluent flow from the columns was also controlled using
the same type of flow meters. In order to measure the effluent turbidity prior to and after
backwash an inline low range turbidimeter (HACH, Filter Track 660) was used, the device
was either attached to biofilter 1, 2 or 3 depending on the experiment being carried out.
During the conditioning phase -4 months- the carbon, nitrogen, and phosphorous
concentrations in the influent water were maintained at a C:N:P ratio of 546:24:1 on a
weight to weight basis. The synthetic water was prepared to mimic the nutrient limited
conditions of the raw water at the Britannia Water Treatment Plant (BWTP) located in
Ottawa, Ontario. Throughout that period, all 4 biofilters were inoculated five times with
backwash water from BWTP in order to promote bacterial attachment and growth on the
media.
According to LeChevalier et al. (1991), a ratio of 100:10:1 on a mol basis is considered to
be adequate for bacterial growth corresponding to 39:4.1:1 on a weight basis. Therefore,
the 546:24:1 C:N:P ratio was phosphorous limited and was not adequate for ideal bacterial
activity. As a result, starting from phase 2, the conditions were changed to a ratio of 25:5:1
(w/w) (Tchobanoglous et al., 2003) for biofilter 1 (B1), biofilter 2 (B2), and biofilter 3
(B3). A 26 L Nalgene cylindrical tank was used to provide the columns with the additional
phosphorus and nitrogen concentrations required to accomplish the 25:5:1 ratio. The new
solution was also dosed into the columns using the Masterflex peristaltic pump and the two
tubings were placed to drain directly into the columns. The carbon, nitrogen, and
phosphorous concentrations remained constant throughout the entire duration of the
backwash study. The influent water had an average turbidity of 0.3 and an average pH of
7.
3.2 Phases of Research and Backwashing Experiments
A summary of the different phases and the backwash protocols associated with them is
provided in table 3.2. The experiments consisted of 5 phases in total in addition to a
preliminary conditioning stage. B1 and B2 were used for this study. B4 and B3 were in use
by another graduate student. B3 was added into this study at phases 3 and 4. The
conditioning phase lasted around 4 months and its purpose was to develop an active biofilm
that has the ability to effectively degrade the DOC that the columns were constantly dosed

27
with. During that period the biofilters received the same backwashing regime to ensure that
similar conditions developed in them before conducting a backwash comparison study.
Water collected from the biofilters' effluent was used for the backwash. The filtration cycle
lasted for 7 days, and prior to each backwash the water level in the columns was drained
to 5 cm above the media. During the conditioning phase the backwash regime consisted of
a 30 m/hr nonchlorinated water flush that lasted for 10 minutes to achieve a 30% bed
expansion. In order to examine whether B1 and B2 developed the same behavior during
this phase, UV and particle counts samples were collected at different time intervals after
backwash and both biological filters showed the same performance. Results associated
with this phase can be found in Appendix C.
The backwash experiments started once a constant performance was observed in the
columns, the changes in the backwashing technique were made on B1. B2 served as the
control and had a control backwash strategy (30%Control) that remained constant
throughout the entire duration of the study which was selected based on the ranges that are
applied in practice and recommended by the Ontario Ministry of Environment (MOE,
2008). 30%Control consisted of 6 min of air and water flow combination to achieve
collapse pulsing conditions, followed by a high water wash to achieve a 30% bed
expansion, followed by a 2 min lower water wash to achieve 10% bed expansion. Phase 1
compared the implementation of a water only backwash (30%W) versus a collapse pulsing
backwash (30%Control) under nutrient limited conditions. After that, phase 2 was initiated.
The purpose of phase 2a was to examine the impact of changing the second step of the
control backwash that consists of the 30% bed expansion to a lower bed expansion (20%)
while utilizing the same amount of water volume, 20%SV served for this purpose. Phase
2b investigated the addition of the ETSW to 20%SV. Calculations associated with ETSW
can be found in Appendix B. Phase 3 was initiated to study the impact of implementing a
higher bed expansion (40%) than the one used in the 30%Control while utilizing a constant
water volume, 40%SV served for this purpose. B3 was added to the experiments starting
from phase 3.

28
Table 3.2- Study Phases along with Associated Backwash Experiments
Phase/
Backwash
Procedure(s)
Backwash Protocol
Biolfilter
Duration
(min)
Monitored
Parameters
Biofilter 1 Biofilter 2 (Control)
Biofilter 3 B1 B2 B3
Conditioning
Phase
30%W
Water only Backwash
at 30% bed expansion:
Vwater= 30 m/hr
(10 min)
Water only Backwash at
30% bed expansion:
Vwater= 30 m/hr
Water only
Backwash at 30%
bed expansion:
Vwater= 30 m/hr
10 10 10 DOC + UV 3/week
UV + PCs every 5 min for
50 min after backwash
(ABW)
Turbidity 3/week
Phase 1
30%W Versus
30%Control
Water only Backwash
at 30% bed expansion:
Vwater= 30 m/hr
(10 min)
1. Collapse Pulsing(6
min)
Vair = 70 m/hr
Vwater= 8 m/hr
2. High Rate Water Flush:
(2min)
Vwater= 30 m/hr (30%)
3. Low Rate Water Flush:
(2 min)
Vwater = 12 m/hr (10% )
NA 10 10 - DOC + UV 3/week
Turbidity 3/week
Phase 2a
20%SV
Versus
30%Control
1.Collapse Pulsing (6
min)
Vair = 70 m/hr
Vwater= 8 m/hr
2. High Rate Water
Flush: (3 min,20 sec)
Control Backwash NA 12
10
- DOC+ UV 3/week
DOC + UV+ PCs at
different time intervals
ABW

29
Vwater= 18 m/hr (20%)
3. Low Rate Water
Flush: (2 min)
Vwater = 12 m/hr (10% )
Phopsholipids before
backwash (BBW) and
ABW
Turbidity continuously
ABW
Phase 2b
20%SV+ETSW
Versus
30%Control
1. Collapse Pulsing (6
min)
Vair = 70 m/hr
Vwater= 8 m/hr
2. High Rate Water
Flush: (3 min,20 sec)
Vwater= 18 m/hr (20%)
3. Low Rate Water
Flush: (2 min)
Vwater = 12 m/hr (10%)
4.ETSW : (6 min)
Vwater = 9.5 m/hr
Control Backwash
NA 18 10 - DOC+ UV 3/week
DO BBW and at different
time steps ABW
DOC + UV+ PCs at
different time intervals
ABW
Phopsholipids BBW and
ABW
Turbidity continuously
ABW
Phase 3
40%SV,
40%SV+ETSW
Versus
30%Control
1. Collapse Pulsing (6
min)
Vair = 70 m/hr
Vwater= 8 m/hr
2. High Rate Water
Flush: (1 min: 37 sec)
Vwater= 37 m/hr (40%)
3. Low Rate Water
Flush: (2 min)
Vwater = 12 m/hr (10% )
Control Backwash
1-3. Same as B1
4. ETSW : (6 min)
Vwater = 9.5m/hr
9 10 15 DOC + UV + DO+ PCs
BBW and at different time
intervals ABW
ATP BBW and ABW.
Turbidity continuously
ABW

30
Phase 4
20%ST,
20%ST+ETSW
Versus
30%Control
1. Collapse Pulsing (6
min)
Vair = 70 m/hr
Vwater= 8 m/hr
2. High Rate Water
Flush: (2 min)
Vwater= 18 m/hr (20%)
3. Low Rate Water
Flush: (2 min)
Vwater = 12 m/hr (10%)
Control Backwash
1-3. Same as B1
4. ETSW : (6 min)
Vwater = 9.5 m/hr
10 10 16 DOC + UV + DO + PCs
BBW and at different time
intervals ABW
ATP BBW and ABW.
Turbidity continuously
ABW

31
It received the 40%SV backwash strategy in addition to the ETSW. Phase 4 examined the
impact of implementing 20%ST on B1 which adapted a 20% bed expansion but followed
the same time duration as 30%Control therefore utilizing less water volume than
30%Control. 20%ST was implemented to examine if potential water savings could be
achieved while maintaining adequate biofiltration performance. 20%ST was also tested on
B3 but terminated with the ETSW. In addition to that, during phase 4, turbidity was added
in the feed in the form of kaolin clay at a concentration of 2 mg/L to increase the influent
water turbidity to 4-5 NTU in order to investigate the response of the biofilters and the
efficiency of the backwash protocol when higher particle concentrations are present. The
clay was added to the nutrients dosing tank which was mixed continuously to ensure that
the particles remained in suspension. However, keeping constant operating conditions was
challenging during this period due to flow control operational difficulties which resulted
in a turbidity range of 4-24 NTU. Nevertheless, it was believed that this mimicked real
operating conditions where sudden increases in turbidity may occur during spring runoffs
or heavy rain events. As a result, it was important to examine the response of the biofilters’
performance and the effectiveness of the backwashing strategies under these extreme
conditions.
For phase 5, a change in the water quality conditions was made and the same backwash
experiments as phase 2 were conducted in order to investigate the reproducibility of the
results under these different conditions. Potassium was being added to the influent water
(0.315mol K/mol P). In wastewater treatment, potassium is an important parameter that
promotes biological phosphorous uptake (Mulkerrins et al., 2004) and there is no
information about the impact of potassium addition on the microbial activity of biofilms
used to treat dirking water. Therefore, it was import to investigate the impact of potassium
addition on DOC removal. Results associated with this phase can be found in Appendix D.

32
3.3 Analytical Methods
3.3.1 Dosing Solutions
Table 3.3 shows the different chemicals that were used to prepare the dosing solutions. The
solutions were prepared using distilled water, stock solutions were made in 1L volumetric
flasks and allowed to mix overnight on a stir plate with magnetic stirrer. After replacing
each solution into its tank and filling the tank to its mark, a stand mixer was used to mix
them at 350 rpm for a minimum of 30 minutes. Dosing solutions calculations and
associated concentrations can be found in Appendix A.
Table 3.3- Chemicals used for Dosing Solutions Preparation
Purpose Chemicals Used Phase
Carbon Source Acetic acid, formic acid, glyoxal All phases
Phosphorous
Source
Potassium dihydrogen phosphate All phases
Nitrogen Source Aluminum nitrates/ Sodium nitrates
All phases
Potassium Source Potassium sulphate` Phase 5
Micronutrients Magnesium sulphate
All phases
Alkalinity Sodium carbonate All phases
3.3.2 Dissolved Organic Carbon
Water samples were collected in clean amber glass bottles that were stored in 10% HCl
solution overnight, rinsed with DI water, wrapped in aluminum foil, and baked at 450oC
for 45 minutes in order to ensure that they were free of any organic contaminants. For the
purpose of DOC analysis, samples were filtered through a 0.45 µm filter paper and then
stored in 50 ml clean and baked glass vials at 4oC and analyzed within one week of storage.

33
DOC analysis was conducted based on Persulfate Ultraviolet Oxidation Method in
Standard Methods 5310C (APHA, 2012).A SHIMADZU TOC-VCPH/ CPN total organic
carbon analyzer was used.
3.3.3 Ultraviolet Absorbance (UVA)
UV absorbance was conducted on the same samples that were stored for DOC analysis
(using a UV visible Spectrophotometer, Spectronic Unicam), this was done before carrying
out the DOC test. This parameter was measured in accordance with Standard Methods
5910B (APHA, 2012). A 1cm quartz cell was used, the sample scan was performed from
200-400 nm and the values at 254 nm were recorded.
3.3.4 Dissolved Oxygen
Dissolved oxygen measurements were conducted using a Dissolved Oxygen probe
(Thermo Scientific ORION).
3.3.5 Phospholipids Method for Biomass Quantification
Phospholipids procedure was performed in order to determine top of media biomass
concentration. Media samples were taken from the top sampling port before backwash and
within one hour after backwash. The media was collected in 50 ml glass vials that have
been soaked for 24 hours in a phosphate free soap solution, rinsed with DI water, soaked
after that for another 24 hours in a 10% HCl solution and then rinsed again with DI water
and dried before collecting the media. This technique is based on the method described by
Wang et al. (1995) it involves lipids extraction, followed by a digestion with potassium
persulfate and then measurement.
Extraction

34
Digestion
Measurement
1. Transfer 0.1-1 g of the media after draining the column to a 50 ml clean
glass vial
2. Add 1.8 ml of ultrapure water, followed by 5 ml of methanol and 2.5 ml
of chloroform., mix at low speed for 10 minutes on a shaker and let
stand overnight for lipids extraction
3. Add 2.5 ml chloroform and 2.5 ml of ultrapure water. Let stand for
phase separation for 30 minutes
4. Remove the upper layer to waste with a pasteur pipette
5. Transfer the lower layer to a COD HACH vial with a pasteur pipette and
let the media dry
6. Under a steam of nitrogen remove the solvent (chloroform)
Add 1.1 ml of potassium persulfate, close tightly and let digest overnight on a
heating plate (95oC)
1. Remove the HACH vials from the heating plate and let them cool
2. Add 0.2 ml of ammonium molybdate solution, wait for 10 minutes
3. Add 0.9 ml of malachite green oxalate and wait for 30 minutes
4. Measure the absorbance at 610 nm, use reagent blank
5. Record the measurement and convert it to nmol of lipid phosphate using a
calibration curve
6. Weigh the dried media and record the measurement as nmol of lipid
phosphate per g of media

35
3.3.6 Adenosine Tri-Phosphate (ATP) for Biomass Quantification
ATP tests were performed on top and middle of the media before and after backwash
based on the method described by Hammes et al. (2010), a Deposit and Surface Analysis
test kit was used (LuminUltra Technologies Ltd). The test steps involve calibration,
sample preparation, and total ATP analysis.
Calibration
1. Add 100 µl of UltraCheck 1into 12x55 mm test tube
2. Add 100 µl of Luminase to the same tube, and swirl gently five times.
3. Insert the tube into the luminator and record the measurement ATP1
Sample Preparation
1. Take 1 g of the media after draining the column. Add the sample to a 6 ml
UltraLyse 7 to extract the ATP. Cap and mix the contents of the tube.
2. Transfer 1 ml from the UltraLyse 7to 9 ml UltraLute dilution tube. Cap
and invert three times.
1. Transfer 100 µl from the ultraLute dilution tube to a new 12x55 mm test
tube
2. Add 100 µl of luminase to the test tube and swirl gently for five times
3. Insert the tube into the luminometer and record the measurement as ATPt
4. Use the following equation to convert relative light units to ATP
concentrations:
tATP (pg ATP/ g) = 𝑹𝑳𝑼 𝒕𝑨𝑻𝑷
𝑹𝑳𝑼𝑨𝑻𝑷𝟏.
𝟓𝟎𝟎𝟎𝟎 (𝒑𝒈 𝑨𝑻𝑷)
𝒎 𝒔𝒂𝒎𝒑𝒍𝒆 (𝒈)
Total ATP Analysis

36
3.3.7 Particle Counts
Particle counts measurements were conducted using a BrightWell Technologies INC.
Dynamic Particle Analyzer (BP-4100-HEV). A BP-1400-FC-100-U flow cell was used and
it had the ability to detect the size and concentration of particles from the 0.75 µm lower
size range to the 100 µm upper size range.
Prior to each analysis, the flow cell had to be rinsed thoroughly with DI water and then
flushed with the sample solution which was inverted several times before introducing it to
the sampling syringe. At the end of the analyses, the flow cell had to be rinsed with DI
water again until no residual particles were shown on the screen. This was followed by
introducing the cleaning solution (50% PCC54 detergent by volume) and then a final
thorough DI rinse to flush out the cleaning solution and to ensure that the flow cell was
free from any particles or cleaning solution residuals. If the cell was not to be used the
following day, in addition to the standard cleaning strategy, the flow cell had to be flushed
with analytical grade IPA and then dried using an air duster (MG Chemicals Super Duster).
3.3.8 Turbidity
Influent turbidity measurements were performed using a portable HACK turbidimeter.
For each column, the effluent turbidity prior to and post backwash was monitored by an
inline low range turbidimeter (HACH, Filter Track 660).
3.3.9 Temperature, pH
Both pH and Temperature were carried out using the same probe (Thermo Scientific
ORION 087003)
3.3.10 Statistical Methods and Data Analysis
To analyze DOC samples minimum, first quartile, median, third quartile, and maximum
values were determined and plotted in box and whisker plots.
A student t-test was used in order to carry out statistical analysis. A t-test is a statistical
method used to compare the means of two groups by determining the ratio of the sample
means to the variance of the samples. Two parameters, T-value and P-value, are used to
determine the level of significance between two groups of data.
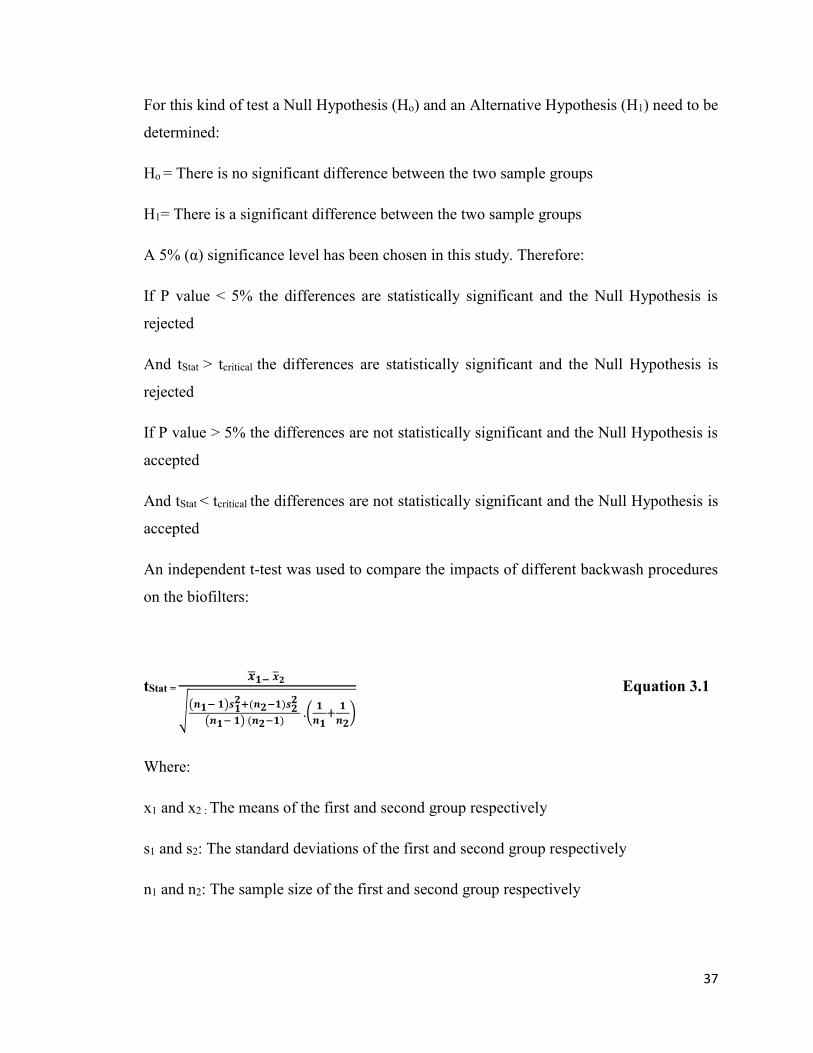
37
For this kind of test a Null Hypothesis (Ho) and an Alternative Hypothesis (H1) need to be
determined:
Ho = There is no significant difference between the two sample groups
H1= There is a significant difference between the two sample groups
A 5% (α) significance level has been chosen in this study. Therefore:
If P value < 5% the differences are statistically significant and the Null Hypothesis is
rejected
And tStat > tcritical the differences are statistically significant and the Null Hypothesis is
rejected
If P value > 5% the differences are not statistically significant and the Null Hypothesis is
accepted
And tStat < tcritical the differences are not statistically significant and the Null Hypothesis is
accepted
An independent t-test was used to compare the impacts of different backwash procedures
on the biofilters:
tStat = 𝒙𝟏− �̅�𝟐
√(𝒏𝟏− 𝟏)𝒔𝟏
𝟐+(𝒏𝟐−𝟏)𝒔𝟐 𝟐
(𝒏𝟏− 𝟏) (𝒏𝟐−𝟏) .(
𝟏
𝒏𝟏+
𝟏
𝒏𝟐)
Equation 3.1
Where:
x1 and x2 : The means of the first and second group respectively
s1 and s2: The standard deviations of the first and second group respectively
n1 and n2: The sample size of the first and second group respectively

38
These tests were carried out using Microsoft Excel and tCritical, tStat and the P value were
determined accordingly.
39
CHAPTER 4- BACKWASH OPTIMIZATION FOR DRINKING
WATER TREATMENT BIOLOGICAL FILTERS
This chapter is written in the form of a journal article and will be submitted to the journal
of Water Research. It contains an introduction, a materials and methods section, a
combined results and discussion section, and a conclusion. This paper will be published by
co-authors Sarra Ikhlef (student) and Dr. Onita Basu (supervisor).
Abstract
A lab scale biological filtration system was used in this study to examine the implications
of different backwash strategies on biological filtration performance. The backwash
strategies were evaluated based on dissolved organic carbon (DOC) removals, backwash
water volume usage, and filter ripening outcomes. Results showed that under nutrient
limited conditions, collapse pulsing improved DOC removal by approximately 10%
compared to a water only backwash condition. Employing a lower bed expansion of 20%
under nutrient supplemented conditions compared to a 30%Control bed expansion while
using the same amount of water volume lead to similar DOC removals of approximately
30%. However, employing a higher bed expansion (40%) than the control backwash lead
to significantly lower % DOC removals (24% versus 30% respectively). A backwash
strategy that reduced the backwash water volume usage by about 20% compared to the
control condition resulted in similar % DOC reductions. The backwash procedures
investigated in this study showed no consistent impact on the biofilters' biomass
concentrations as measured by the phospholipids and the adenosine tri-phosphate (ATP)
methods. Moreover, none of these two analyses showed a direct correlation with DOC
removal. On the other hand, dissolved oxygen (DO) uptake showed a direct correlation
with DOC removals. Higher DOC removals were obtained at DO uptake levels larger than
8 mg/L compared to DO uptake levels that were lower than 4 mg/L. The addition of the
extended terminal subfluidization wash (ETSW) demonstrated no impact on % DOC
removals and successfully eliminated the filter ripening sequence (FRS).
Key Words: biofiltration, backwashing, ETSW, air scour, organics removal, drinking
water

40
4.1 Introduction
The use of biological filtration in the drinking water treatment industry has become
increasingly popular over the past couple of decades. Biological filters have the ability to
effectively eliminate organic matter from water through the accumulation of naturally
occurring bacteria on the media in the form of a biofilm. These microorganisms utilize
DOC as an energy supply and a carbon source through the mediation of oxidation reduction
reactions (Urfer et al., 1997). Benefits of biological filtration include: a decrease in the
formation potential of disinfection by products (DBPs), elimination of taste and odor
compounds, reduction in chlorine demand, and decrease in bacterial re-growth potential
within the distribution system resulting in a water that is biologically stable (Chaudhary et
al., 2007).
In addition to DOC removal, biofilters are also expected to achieve the same level of
particle removal that is attained by conventional filters which makes their optimization
challenging (Ahmad et al., 1998). A biofilter that results in high quality effluent water
needs to maintain a healthy biomass concentration; therefore backwashing is performed on
a periodic basis to prevent excessive biomass accumulation and headloss buildup.
Furthermore, backwashing has the ability to regenerate the particle accumulation capacity
of the biofilter making it one of the most important parameters that define both the short
and long term performances of biological filters. An effective backwash will successfully
balance the removal of excess biomass while maintaining sufficient attached biomass for
continued organic removals in subsequent filter runs (Ahmad et al., 1998). Moreover, an
optimized backwash strategy will take into account the difference in detachment of both
biological and nonbiological particles that were accumulated during the filtration cycle
(Ahmad and Amirtharajah, 1998).
Over the years, studies have looked into optimizing biological filtration through selecting
the right type of media (Emelko et al., 2006; Wang et al., 1995; Liu et al., 2001), varying
the empty bed contact time (EBCT) (Hozalski et al., 1995; Servais et al., 1991), and
examining organics removal under different temperatures (Kim et al., 2014; Eemelko et
al., 2006; Liu et al., 2001; Moll et al., 1999). However, backwashing has received less
attention. In particular, the influence of backwashing on biofiltration performance in terms

41
of organics removal is still poorly understood. Research with respect to backwashing and
biofiltration has focused mainly on investigating the impacts of air scouring and collapse
pulsing (Emelko et al., 2006; Liu et al., 2001; Ahmad et al., 1998; Servais et al., 1991).
When it comes to conventional filters, collapse pulsing is deemed to be a more efficient
method for cleaning the media and reducing headloss compared to a water only backwash
due to the increased media collisions and abrasions when air and water are used
simultaneously (Amirtharajah, 1993). Although some concerns about the impact of
biomass loss associated with collapse pulsing have been expressed, research has generally
found that collapse pulsing had no significant impact on organics removal (Emelko et al.,
2006; Ahmad et al., 1998; Servais et al., 1991). Other investigations have examined the
potential detrimental impacts of chlorinated water backwash on biological activity (Liu et
al., 2001; Ahmad et al., 1998; Miltner et al., 1995). These studies observed a negative
influence of chlorine presence on biolfilter biomass and recommended that chlorinated
backwash water should be avoided whenever feasible.
Biomass and biological activity are important parameters governing biofiltration
performance. Maintaining a healthy biomass is key in achieving high levels of organics
removal. However, more understanding is needed on how specific backwashing procedures
impact microbial biomass. It is also unclear whether the amount of biomass attached to the
filter media is directly related to microbial activity and biological filtration performance.
In order to quantify biomass concentrations within biological filters, numerous techniques
have been adapted such as heterotrophic plate counts (HPC) (Kaur et al., 2003; Ahmad et
al., 1998), phospholipids analysis (Emelko et al., 2006; Liu et al., 2001; Moll et al., 1999),
and ATP analysis (Gibert et al., 2013; Velten et al., 2007; Knezev et al., 2004). Tracking
DO uptake in order to determine microbial activity of biolfims has been adapted in
wastewater treatments studies (Shariati et al., 2013; Meric et al., 2003; Orupold et al., 1999;
Yoong et al., 2000). But DO uptake in drinking water treatment studies seems to have
received little attention. Urfer and Huck (2001) looked at biomass respiration potential
(BRP) which is a method based on the DO consumption rate and observed a direct
correlation between BRP and biodegradable organic matter (BOM) removal potential.

42
When it comes to particles removal biofilters face the same challenges that conventional
filters face. Filter ripening is a common problem in the drinking water treatment industry.
It is a period of poor filtrate quality caused by high particulate passage observed
immediately after a filter has been backwashed and put back into operation (Amburgey and
Amirtharajah, 2005). Amirtharajah (1985) focused on developing an understanding of the
causes behind the ripening period in order to better address it. His findings concluded that
remnant particles and newly influent particles are the main causes behind the high effluent
turbidity peaks. Amirtharajah (1988) stated that about 90% of particles' breakthrough in a
well operated filter occurs during the ripening period. Moreover, the main concern about
this stage is the potential breakthrough of pathogenic microorganisms such as
Cryptosporidium and Giardia (Colton et al., 1996). As a result, most backwashing research
efforts for conventional filters were directed towards decreasing the intensity and duration
of this period. A common practice is the filter to waste procedure, where the treated filter
effluent is directed to waste until the effluent quality improves and turbidity meets the
desired goals (Soucie and Sheen, 2007). Some researchers suggested the addition of filter
aid polymers or coagulants to increase the size of particles and enhance their attachment to
the filter media (Francois and Van Haute, 1985; Zhu et al., 1996). This seemed to be
successful in reducing the turbidity peaks, however, coagulants addition is not always a
feasible technique as the dose of chemicals added needs to be optimized based on the
changes in the raw water quality characteristic (Amburgey, 2004). Amburgey (2004)
suggested the extended terminal subfluidization wash (ETSW) which is an additional
flushing step initiated by the end of the normal backwashing procedure. ETSW employs a
subfluidization flow rate that gently removes loose remnants particles without resulting in
the detachment of further particles while decreasing or eliminating the filter to waste time
period. However, the influence of ETSW on biolfiltration performance in terms of DOC
removal hasn't been investigated yet. The main objective of this study is to investigate the
impact of various backwashing regimes, including ETSW, on DOC removal in a biofilter.
In addition, the relationship between microbial biomass concentrations (as measured by
the phospholipids and ATP values), and the DOC removals as well as the correlations
between DO and DOC removals to determine the potential of secondary parameters to
assist with better understanding biofilter performance. This research is intended to improve

43
our understanding of how to determine an optimized backwash strategy that results in
shorter ripening times, maximizes DOC and particle removals while efficiently minimizing
overall water usage and the biofilter time out of service.
4.2 Materials and Methods:
4.2.1 Experimental Setup
The experiments were conducted on a laboratory scale system consisting of three dual
media filters operating in parallel and containing 520 mm of GAC on top of 180 mm of
sand along with 15 mm of synthetic underdrain that acted as a media support. The sand
effective size (ES) = 0.5 mm and the GAC ES = 0.7 mm. The biofilters were made of
plexi-glass and had an inside diameter of 50 mm. The experimental setup is shown in figure
4.1. Each column had 5 sampling ports in addition to one overflow port. The flow rate
through each column was 100 mL/min to allow for an empty bed contact time of 15
minutes, however, flow control operational difficulties resulted in 20% variations in the
incoming flowrate. In order to measure the effluent turbidity prior to and after backwash
an inline low range turbidimeter (HACH, Filter Track 660) was used, the device was either
Figure 4.1- Schematic of the Experimental Setup

44
attached to biofilter 1 (B1), biofilter 2 (B2), or biofilter 3 (B3) depending on the experiment
being carried out.
4.2.3 Experimental Methodology
Synthetic Raw Water Preparation
Biofilter influent was prepared by mixing dechlorinated tap water with dosing solutions
containing different concentrations of carbon and micronutrients. The synthetic water was
intended to mimic water coming into a biofilter post
coagulation/flocculation/sedimentation. Two 50 L Nalgene heavy cylindrical containers
were used (figure 4.1), one of them served as the carbon dosing tank and the other served
as the nutrients dosing tank. Glyoxal, acetic acid, and formic acid were selected as the
carbon source. They were dosed for a target influent DOC concentration of 7 mg/L. A
combination of aluminum nitrates and sodium nitrates served as the nitrogen source.
Potassium dihydrogen phosphate served as the phosphorous source. During the first phase
of this study, the carbon, nitrogen, and phosphorous concentrations in the influent water
were maintained at a C:N:P ratio of 546:24:1 on a weight to weight basis. In order to
improve DOC removal, starting from phase 2 the conditions were changed for all biofilters
to a ratio of 25:5:1 (w/w) and were maintained constant for the rest of the experiments.
This ratio was based on an empirical biomass formula of C60H87O23N12P (Tchobanoglous
et al., 2003). Excluding phase 4, influent water had an average turbidity of 0.3 NTU.
Average temperatures ranged from 17oC to 22oC throughout the different experimental
phases. Influent water had an average pH of 7 and an average alkalinity (CaCO3) of 24
mg/L. Influent DO concentrations ranged between 15 to 7 mg/L.
Backwash Experiments
Table 4.1 shows the backwash strategy associated with each experimental phase. The
biofilters were conditioned for four months before initiating the study. During that time all
3 biofilters (B1, B2, and B3) received the same backwash regime to ensure that similar
conditions developed in them before conducting a backwash comparison study. Water
collected from the biofilters' effluent was used for the backwash. The filtration cycle lasted
for 7 days, and prior to each backwash water level in the biofilters was drained to 5 cm
above the media. B2 was operated as the control and had a control backwash strategy

45
(30%Control) that consisted of 6 min of air and water flow combination to achieve collapse
pulsing conditions, followed by a high water wash at 30% bed expansion, followed by a 2
min lower water wash at 10% bed expansion. The backwash changes were made on B1
and B3. Phase 1 compared the implementation of a water only backwash (30%W) versus
a collapse pulsing backwash (30%Control) under nutrient limited conditions. After that,
phase 2 was initiated to study the impact of changing the 30% bed expansion following
collapse pulsing to a lower bed expansion (20%) while utilizing the same amount of water
volume, 20%SV served for this purpose. Phase 2 also investigated the impact of adding the
ETSW to 20%SV. Phase 3 was initiated to study the impact of implementing a higher bed
expansion (40%) than the one used in the 30%Control while utilizing a constant water
volume, 40%SV served for this purpose. B3 received 40%SV in addition to the ETSW.
Phase 4 examined the impact of implementing 20%ST on B1 which adapted a 20% bed
expansion but followed the same time duration as 30%Control therefore utilizing less water
volume than 30%Control. 20%ST was also tested on B3 but terminated with the ETSW.
In addition to that, during phase 4, turbidity was added in the feed in the form of kaolin
clay at a concentration of 2 mg/L to increase the influent water turbidity to 4-5 NTU in
order to investigate the response of the biofilters and the efficiency of the backwash
protocol when higher particle concentrations are present. The clay was added to the
nutrients dosing tank which was mixed continuously to ensure that the particles remained
in suspension. However, keeping constant operating conditions was challenging during this
period due to flow control operational difficulties which resulted in a turbidity range of 4-
24 NTU. Nevertheless, it was believed that this mimicked real operating conditions where
sudden increases in turbidity may occur during spring runoffs or heavy rain events. Table
4.1 also shows the backwash water volume utilized for each backwash strategy and the
normalized water volume with respect to the control backwash.

46
Table 4.1- Summary of Experimental Phases and Backwash Procedures
Backwash Procedure
Phase(s) C:N:P Ratio/
Comments
Backwashing Steps Backwash Water
Volume (m3) x 10-3
Normalized Backwash Volume
30%Control 1/2/3/4 Phase1: 546:24:1
Phases 2/3/4: 25:5:1
1. Collapse Pulsing (6 min) Vair = 70 m/hr Vwater= 8 m/hr 2. High Rate Water Flush: (2 min) Vwater= 30 m/hr (30%) 3. Low Rate Water Flush: (2 min) Vwater = 12 m/hr (10% )
4.5
1
30%W 1 546:24:1
Water only Backwash at 30% bed expansion (10 min) Vwater= 30 m/hr
9.8
2.2
20%SV 2
25:5:1 1. Collapse Pulsing (6 min) Vair = 70 m/hr Vwater= 8 m/hr 2. High Rate Water Flush: (3 min,20 sec) Vwater= 18 m/hr (20%) 3. Low Rate Water Flush: (2 min) Vwater = 12 m/hr (10% )
Without ETSW:
4.5
With ETSW: 6.28
Without ETSW:
1
With ETSW:
1.4
40%SV 3 25:5:1 1. Collapse Pulsing (6 min) Vair = 70 m/hr Vwater= 8 m/hr 2. High Rate Water Flush: (1 min, 37 sec) Vwater= 37 m/hr (40%) 3. Low Rate Water Flush: (2 min) Vwater = 12 m/hr (10% )
Without ETSW:
4.5
With ETSW: 6.28
Without ETSW:
1
With ETSW:
1.4
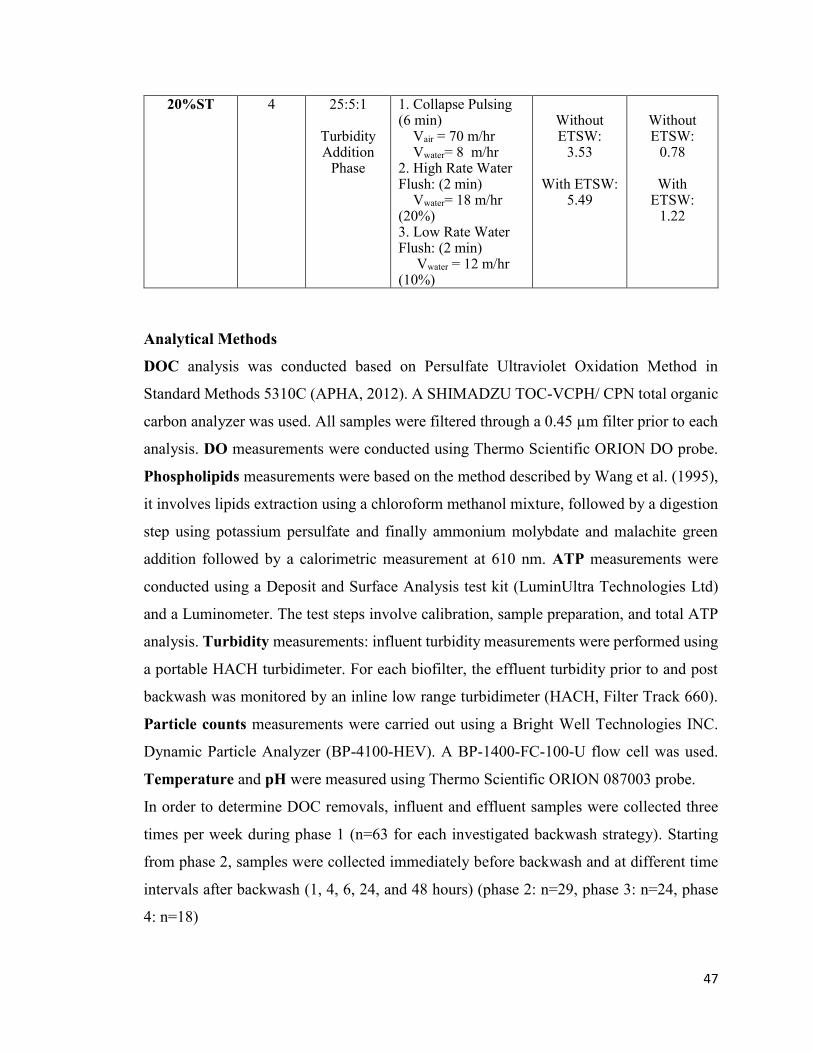
47
20%ST 4 25:5:1
Turbidity Addition
Phase
1. Collapse Pulsing (6 min) Vair = 70 m/hr Vwater= 8 m/hr 2. High Rate Water Flush: (2 min) Vwater= 18 m/hr (20%) 3. Low Rate Water Flush: (2 min) Vwater = 12 m/hr (10%)
Without ETSW:
3.53
With ETSW: 5.49
Without ETSW:
0.78
With ETSW:
1.22
Analytical Methods
DOC analysis was conducted based on Persulfate Ultraviolet Oxidation Method in
Standard Methods 5310C (APHA, 2012). A SHIMADZU TOC-VCPH/ CPN total organic
carbon analyzer was used. All samples were filtered through a 0.45 µm filter prior to each
analysis. DO measurements were conducted using Thermo Scientific ORION DO probe.
Phospholipids measurements were based on the method described by Wang et al. (1995),
it involves lipids extraction using a chloroform methanol mixture, followed by a digestion
step using potassium persulfate and finally ammonium molybdate and malachite green
addition followed by a calorimetric measurement at 610 nm. ATP measurements were
conducted using a Deposit and Surface Analysis test kit (LuminUltra Technologies Ltd)
and a Luminometer. The test steps involve calibration, sample preparation, and total ATP
analysis. Turbidity measurements: influent turbidity measurements were performed using
a portable HACH turbidimeter. For each biofilter, the effluent turbidity prior to and post
backwash was monitored by an inline low range turbidimeter (HACH, Filter Track 660).
Particle counts measurements were carried out using a Bright Well Technologies INC.
Dynamic Particle Analyzer (BP-4100-HEV). A BP-1400-FC-100-U flow cell was used.
Temperature and pH were measured using Thermo Scientific ORION 087003 probe.
In order to determine DOC removals, influent and effluent samples were collected three
times per week during phase 1 (n=63 for each investigated backwash strategy). Starting
from phase 2, samples were collected immediately before backwash and at different time
intervals after backwash (1, 4, 6, 24, and 48 hours) (phase 2: n=29, phase 3: n=24, phase
4: n=18)

48
4.3 Results and Discussion
4.3.1 Impact of Backwashing Procedures on DOC Removals
The impact of collapse pulsing backwash was investigated during the nutrient limited stage
of the experiments. This phase had a C:N:P ratio of 546:24:1 on a weight basis. According
to LeChevallier et al. (1991), a C:N:P ratio of 100:10:1 on a mol basis is required for
organic carbon removal, this corresponds to a ratio of 39:4.5:1 on a weight basis. Therefore,
a ratio of 546:24:1 would not lead to optimal biomass performance. Figure 4.2 compares
the % DOC removals for 30%W and 30%Control in a box and whisker plot. Box and
whisker plots give an enhanced representation of the data distribution as they show the
median (the middle line in the square), and the first and third quartiles indicated by the
bottom and top ends of the square respectively. In addition to that, the ends of the vertical
lines represent the maximum and minimum values reported. Adding air to the backwashing
strategy resulted in significantly higher % DOC removals (α=0.05). Median % DOC
removals went from 13% when water only backwash was employed to approximately 21%
when collapse pulsing was added to the backwash strategy. These findings indicate that
collapse pulsing is a more efficient backwashing method even under conditions in which
biological activity is stressed. A potential explanation for the success of collapse pulsing
would be related to biofilm thickness; by the end of the filtration cycle biofilm thickness
reaches a critical level that limits the diffusivity of the essential substrate and dissolved
oxygen (Simpson, 2008). The combination of air and water provides for greater media
collisions and abrasions during backwash (Amirtharajah, 1993). This would result in
greater detachment of biomass as compared to a water only backwash. Therefore, collapse
pulsing could successfully reduce the excess biofilm layer resulting in a thinner more active
biofilm at the conclusion of the backwash step. Indeed, Ahmad and Amirtharajah (1998)
reported higher effluent microbial counts when they adapted a backwash strategy that
utilized water only as compared to when collapse pulsing was employed. This happened
due to the shearing of the thick biofilm that was not successfully removed when air was
absent. However, in contrast to the findings reported in this paper the authors did not
observe any improvements with AOC removal when collapse pulsing was utilized. Similar
conclusions emerged from (Liu et al., 2001), the authors observed no significant impact on
BOM removal as a result of backwashing under collapse pulsing conditions in which the

49
C:N:P ratio was 15:5:1 on w/w basis. On the other hand, Emelko et al. (2006) observed
statistically higher oxalate removals when air scouring was utilized under cold water
temperatures of 1 to 3oC. This finding, in addition to the one reported in this paper, provide
insight that the use of collapse pulsing can be beneficial under conditions of bacterial
duress such as cold water temperatures or limited nutrients conditions.
It is also important to note that it was challenging to completely fluidize the media bed
during the first two minutes of backwashing under the water only backwash due to the
biofilter’s wall effects. However, this phenomenon was eliminated when air was
incorporated into the backwash strategy which might also explain the lower % DOC
removals obtained under 30%W.
Figure 4.2- Impact of Collapse Pulsing on % DOC Removals under
Nutrient Limited Conditions

50
Different bed expansions were investigated to study their impacts on biofiltration after
employing collapse pulsing. These experiments were conducted under a C:N:P ratio of
25:5:1 on w/w basis to reflect the nonlimiting nutrient case and ensure DOC removal was
not limited by low nutrient availability. Figure 4.3 compares the % DOC removals
associated with each investigated backwash with respect to the control backwash. The
median DOC removal ranged from 24% to 38% throughout the experiments shown in
figure 4.3. As it can be seen, 20%SV resulted in a median 35% DOC removal which is
comparable to the 34% median value observed with 30%Control. These results suggest
that employing a low bed expansion while using the same amount of water volume as a
higher bed expansion has no significant impact on the DOC removal. When the bed
expansion was increased to 40%SV, it caused an adverse result with regards to DOC
removal (p<0.05). The median DOC removal decreased to 24% compared to 30% DOC
removal with the 30%Control condition. In contrast Ahmad et al. (1998) observed
improved AOC removals with increasing % bed expansions (15%, 25%, and 50%). Their
results indicated that the lowest effluent AOC and NPOC values corresponding to 10 µg/L
and 1.74 mg/L respectively were observed under 50% expansion. However, the authors
argued that the variations in influent AOC concentrations may have impacted the results.
20%SV lead to the same results as 30%Control with respect to DOC removals. Therefore,
the next step was to investigate if savings on backwash water volume could be achieved
by decreasing the time duration of the 20% bed expansion to follow the same 2 minutes
duration as the 30% expansion employed in the control backwash. In addition to that,
because the influent turbidity was low, turbidity was added into the influent in the form of
kaolin clay to increase it from an average of 0.3 NTU to about 4 NTU. However, flow
control issues lead to variations in influent turbidity which was as high as 24 NTU during
certain experiments. Nevertheless, this was believed to mimic real situations where spring
runoffs and heavy rain events may lead to high particles load and sudden turbidity increase.
High particles concentration could impact biofiltration performance by interfering with the
biomass substrate uptake (Liu et al., 2001). In this study, similar (35% versus 36%) % DOC
removals were obtained with both low (0.3 NTU) and high (12 NTU) turbidity water
respectively. As illustrated in figure 4.3, 20%ST removals are not significantly lower
(p>0.05) than 30%Control removals with them ranging from 15% to 50 % and from 20%

51
to 52% for 20%ST and 30%Control respectively suggesting that under these conditions
backwash optimization based on overall productivity could be achieved without
compromising DOC removal. Savings of 22% on the use of total backwash water volume
could be achieved when employing 20%ST versus employing 30%Control (Table4.1).
ETSW is an additional flushing step performed at the conclusion of the normal
backwashing procedure in which the media is subfluidized for sufficient time duration to
pass one theoretical volume of water upward through the filter bed to minimize or prevent
the filter ripening time period (Amburgey and Amirtharajah, 2005). Although this
additional flushing step lengthens the duration of the backwashing stage and requires a
higher quantity of backwash water, the extra water usage and time out of service are
compensated by savings after restart when taking into account the overall productivity of
the process. Figure 4.4 shows the % DOC removals associated with 20%SV, 40%SV, and
20%ST with and without ETSW. The median % DOC removal for 20%SV was 35% when
ETSW was absent and 34% when ETSW was added. Similarly, 40%SV had a median of
24% without ETSW and 22% with ETSW. While the ETSW step for 20%ST gave a median
Phase 2
Phase 2
Phase 3
Phase 3
Figure 4.3- Impact of Different Bed Expansions on % DOC Removals
Phase 2 Phase 3 Phase 4

52
of 33% compared to 36% when ETSW was absent. Clearly, the additional flushing stage
due to the ETSW procedure does not impair nor improve DOC removal. These findings
provide insight on the fact that ETSW could be optimized for a successful filter ripening
sequence elimination without the fear of compromising BOM removal.
4.3.2 Indirect Measurements of DOC Uptake: Biomass and Dissolved
Oxygen
In order to better understand and optimize biological filters performance, it is necessary to
monitor for a secondary parameter that directly correlates to DOC removal. It is well
established that biofiltration performance in terms of organics removal is highly dependent
on microbial activity (Simpson, 2008). Therefore, several attempts with varying levels of
success have been carried out to estimate substrate removal in biological filters through
directly measuring the amount of biomass attached to the media (Emelko et al., 2006; Liu
et al., 2001; Huck et al., 2000; Wang et al., 1995), by measuring the quantity of ATP present
in the biofilm (Gibert et al., 2013; Velten et al., 2007; Knezev et al., 2004), and by
measuring the DO uptake rate (Urfer and Huck, 2001). In this study, three potential
Figure 4.4- Impact of ETSW Addition on % DOC Removals
ETSW Vmf@ 20o
C= 9.5 m/hr
Phase 2 Phase 4 Phase 3

53
measurements that could correlate to DOC removals were monitored for; phospholipids,
ATP, and dissolved oxygen uptake.
Biomass (Phospholipids and ATP)
Media samples were taken from the top sampling port (located at 5 cm below the media
surface) for each biofilter before and 1 hour after backwash to carry out phospholipids
analysis. Along with that, DOC samples were taken at the same time steps to examine if a
relationship between DOC removal and top of filter phospholipids concentrations could be
established. Backwashing did not show any apparent trend regarding its impact on biomass
concentration for all the procedures investigated in this study including the ones that were
terminated by the ETSW. Phospholipids concentrations ranged between 7 to 490 nmol P/g
media before backwash and from 8 to 331 nmol P/g media after backwash for both biofilter
columns. Biomass concentrations, decreased, increased, or remained unchanged after
backwash. The reasons behind these unexpected findings are not well understood. Media
collisions and abrasions caused by collapse pulsing are expected to result in an intense
media cleaning hence higher biofilm detachment resulting in lower biomass concentrations
after backwash (Huck et al. 2000; Ahamd et al., 1998; Emelko et al., 2006; Servais et al.,
1991; Liu et al., 2001). In this study collapse pulsing was followed by a primary (20%,
30%, or 40% bed expansion) high water wash, and then a lower water wash at 10% bed
expansion which is similar to full scale plant operation, perhaps these two consecutive
washes redistributed the loose biomass that was detached from different media depths. The
loose biomass aggregates may have ended up near the top media surface by the end of the
backwashing step which resulted in an increase in some of the biomass readings following
backwash.
Figure 4.5 (A) shows the phospholipids concentration versus the difference between
influent and effluent DOC. As can be seen, regardless of the biomass concentration, most
of the DOC removal lies between 2 to 6 mg/L, therefore it is evident that there is no direct
correlation between surface biomass as measured by the phospholipids method and DOC
removal. In contrast, in a pilot scale study, Wang et al. (1995) observed 25% higher TOC
removals with a sand biofilter that had 30% higher biomass concentrations compared to a
dual media anthracite-sand biofilter. However, in the same study, the authors argued that
the relationship between phospholipids and biofiltration performance is unclear as the

54
removal of other parameters did not improve under the higher biomass concentrations
(AOC-NOX, THMFP, and TOXFP). Huck et al. (2000) observed a drop in phospholipids
biomass concentration in the first 4 cm of the filter media by about 52% following
backwashing under collapse pulsing conditions, however, this significant drop had no
major impact on BOM removal and similar to this research no direct relationship was
established between phospholipids concentrations and biofiltration performance.
Analogous to the phospholipids measurements, media sampling for ATP quantification
was conducted immediately before and 1 hour after backwash along with the DOC
sampling. Impact of backwashing conditions on biofilter biomass in terms of the ATP
concentration is very limited in literature (Pharand et al., 2014). ATP is the main energy
carrier by all cell organisms; it is only formed by the energy obtained from oxidation
reduction reactions and is depleted rapidly following cell death or substrate limitation
(Pharand et al., 2014). Therefore, ATP quantification could represent a reliable method for
active biomass estimation contributing to the DOC removal. Figure 4.5 (B) shows the
combined before and after backwash top of media ATP data for both biofilters versus DOC
removal. Similar to the phospholipid data, none of the backwashing procedures
investigated had a clear impact on the biomass measured in terms of ATP. ATP
concentration decreased, increased, or remained unchanged following backwashing. Top
of media ATP concentrations ranged between 12 to 7777 ng ATP/g media before backwash
and from 16 to 2401 ng ATP/g media after backwash.
Interpretation of these data provides evidence that no direct relationship exists between
DOC removal and biomass concentration as measured by the ATP method. Unlike the
results obtained from this study, Lauderdale et al. (2012) observed a correlation between
ATP measurements and biofiltration performance, as increased ATP concentrations
corresponded to higher DOC, Mn, and MIB removals under nutrient supplemented
conditions. Similarly, Nadiu et al. (2013) observed higher AOC removals associated with
higher ATP values for biofilters used for seawater desalination. On the other hand, some
other research reported no apparent correlation between ATP and biofiltration performance
(Velten et al., 2011; Pharand et al., 2014; Vahala et al., 1998). It is important to note that
measurements taken from the media surface do not necessarily represent ATP

55
concentration throughout the entire filter depth. A pilot scale study conducted by Zhang et
al. (2010) revealed that as biofiltration performance reached steady state, ATP
concentrations at three different bed depths did not show any variations with them being
1024 ng ATP/ g media at the top, 995 ng ATP/ g media at the middle, and 935 ng ATP/ g
media at the bottom. This indicates that DOC removal might take place at multiple
locations within the filter bed. Similarly, in this research ATP values taken from the middle
sampling port located at 18 cm media depth (not shown) ranged between 16 to 785 ng
ATP/g media before backwash and 27 to 1972 ng ATP/g media after backwash for both
biofilter columns. In addition to that, caution must be taken when interpreting ATP data as
there could be a potential contribution in the measurements from the free extracellular ATP
which is not easily distinguished from the microbial ATP (Hammes et al., 2010).
Figure 4.5- Relationship between Biomass and DOC Removal:
A- Relationship between Phospholipids and DOC Removal and
B- Relationship between ATP and DOC Removal

56
Phospholipids and ATP findings point out to the need of a more reliable technique for
estimating microbial activity across the biofilter. The next section highlights on the use of
dissolved oxygen uptake as a method to predict biofiltration performance in terms of
dissolved organic carbon removal.
Dissolved Oxygen Uptake
Biofiltration for the purpose of biodegradable organic matter removal is an aerobic process
in which oxygen acts as the electron donor for the heterotrophic bacteria (Ghannoum and
O’Toole, 2004). Therefore, oxygen uptake could be directly related to microbial activity
with regards to dissolved organic carbon removal. The use of oxygen consumption as a
method for estimating biological activity of biofilms has been used extensively in
wastewater treatment studies specifically in activated sludge processes (Shariati et al.,
2013; Meric et al., 2003; Orupold et al., 1999; Yoong et al., 1999). However, this technique
has received little attention in drinking water treatment studies.
In this research, influent and effluent dissolved oxygen measurements were obtained at the
same time intervals in which DOC sampling was conducted to assess if a direct relationship
exists between these two parameters. Figure 4.6 and figure 4.7 represent DOC removal
versus DO uptake in mg/L. Figure 4.6 also demonstrates the DO and DOC removals
associated with each backwash strategy. The increasing pattern of DOC removal with
respect to DO uptake illustrated in these figures provides evidence on the dependent
relationship that exists between these two parameters. At DO uptake levels of less than 4
mg/L, DOC removals ranged between 0.5 to 2 mg/L, whereas at DO uptake levels larger
than 8 mg/L DOC removals ranged between 1.5 to 6 mg/L (figure 4.7). This signifies that
tracking dissolved oxygen at the influent and effluent levels of the biofilters provides a
useful tool for assessing biofiltration performance and estimating microbial activity
throughout the entire bed depth.
In addition to that, these findings may shed light on the need for sufficient dissolved oxygen
concentration to allow for efficient DOC removal. Careful interpretation of these data
indicates that with increasing DO concentrations increasing DOC removal is observed.
This suggests that substrate utilization is linked to the presence of certain dissolved oxygen
concentrations. These findings refer to the need for more research in which influent

57
dissolved oxygen concentration is varied in biofilters to be able to identify the critical DO
concentration that allows for optimum DOC removal. Nevertheless, based on these results,
it is believed that when sufficient oxygen concentrations are present, DO uptake represents
a helpful and easy tool for assessing the presence of microbial activity in biofilters without
the need of conducting other measurements that require sophisticated devices in many
situations.
y = 0.3845x + 0.0654R² = 0.3639
0
1
2
3
4
5
6
7
0 2 4 6 8 10 12 14
DO
C R
em
ova
l (m
g/L)
DO Removal (mg/L)
20%SV
20%ST
40%SV
30%Control
Figure 4.6- Relationship between DOC Removal and DO Uptake
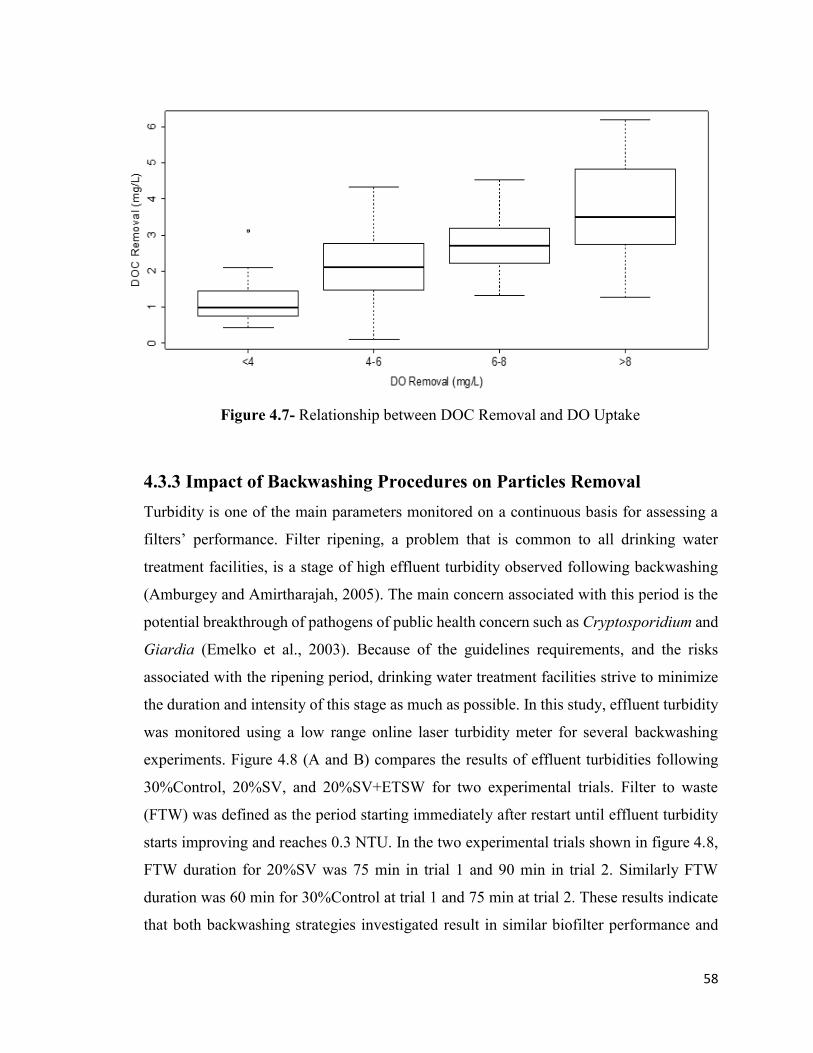
58
4.3.3 Impact of Backwashing Procedures on Particles Removal
Turbidity is one of the main parameters monitored on a continuous basis for assessing a
filters’ performance. Filter ripening, a problem that is common to all drinking water
treatment facilities, is a stage of high effluent turbidity observed following backwashing
(Amburgey and Amirtharajah, 2005). The main concern associated with this period is the
potential breakthrough of pathogens of public health concern such as Cryptosporidium and
Giardia (Emelko et al., 2003). Because of the guidelines requirements, and the risks
associated with the ripening period, drinking water treatment facilities strive to minimize
the duration and intensity of this stage as much as possible. In this study, effluent turbidity
was monitored using a low range online laser turbidity meter for several backwashing
experiments. Figure 4.8 (A and B) compares the results of effluent turbidities following
30%Control, 20%SV, and 20%SV+ETSW for two experimental trials. Filter to waste
(FTW) was defined as the period starting immediately after restart until effluent turbidity
starts improving and reaches 0.3 NTU. In the two experimental trials shown in figure 4.8,
FTW duration for 20%SV was 75 min in trial 1 and 90 min in trial 2. Similarly FTW
duration was 60 min for 30%Control at trial 1 and 75 min at trial 2. These results indicate
that both backwashing strategies investigated result in similar biofilter performance and
Figure 4.7- Relationship between DOC Removal and DO Uptake

59
that they are equally effective in meeting the current guideline of 0.3 NTU following the
ripening period (Health Canada, 2014). However, it should be noted that neither 20%SV
nor the 30%Control showed consistency in terms of FTW duration and the maximum
turbidity reached. Similarly, although in general the 40%SV resulted in lower turbidity
peaks compared to the 30%Control (figure 4.8 C and D), neither of the two monitored
backwashes showed consistency in terms of turbidity peaks and FTW duration. The reasons
behind this behavior are not well understood. A possible explanation for that would be the
absence of coagulation prior to the filtration step. It is well established that conventional
water treatment plants employ coagulation prior to filtration for the removal of turbidity
and organic matter (Yu et al., 2007). Zhu et al. (1996) observed higher turbidity peaks and
longer FRS durations when coagulation was absent compared to when influent water was
coagulated using different polymers. Similarly, Amburgey and Amirtharajah (2005)
reported long ripening periods’ durations of approximately 2 hours under cold water
temperatures (8oC) which was associated with an improper alum coagulation step.
Figure 4.8 also depict the impact of adding the ETSW on effluent turbidity following
restart. The concern with adding ETSW in biological filters is related to the possibility that
the biofilm present on the media could play a role in retaining particles thus preventing
them from being flushed out (Amburgey, 2004). As shown in both figures, excellent
turbidity removal is obtained when the ETSW is employed. The 300 mNTU (0.3 NTU)
threshold value is never exceeded in any of the ETSW experiments. Although adding this
step requires additional water usage this increase in backwash water volume is offset by
the absence of FRS that may take up to two hours and result in wasting treated water.
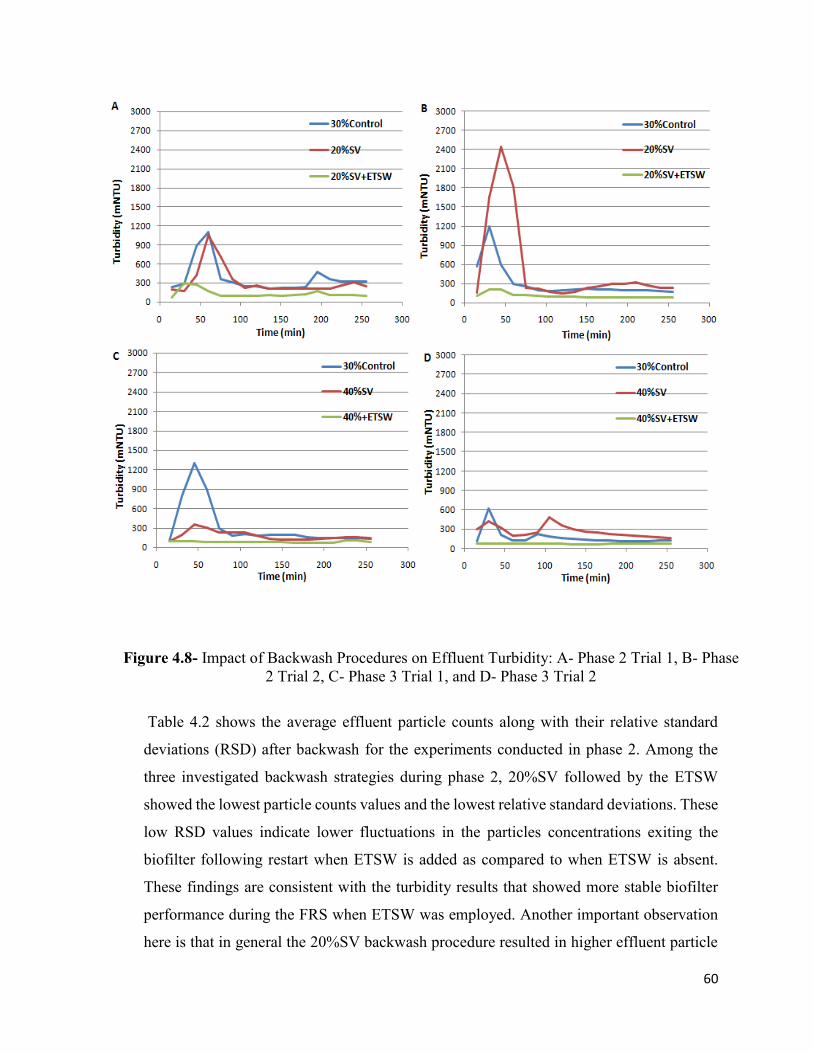
60
Table 4.2 shows the average effluent particle counts along with their relative standard
deviations (RSD) after backwash for the experiments conducted in phase 2. Among the
three investigated backwash strategies during phase 2, 20%SV followed by the ETSW
showed the lowest particle counts values and the lowest relative standard deviations. These
low RSD values indicate lower fluctuations in the particles concentrations exiting the
biofilter following restart when ETSW is added as compared to when ETSW is absent.
These findings are consistent with the turbidity results that showed more stable biofilter
performance during the FRS when ETSW was employed. Another important observation
here is that in general the 20%SV backwash procedure resulted in higher effluent particle
Figure 4.8- Impact of Backwash Procedures on Effluent Turbidity: A- Phase 2 Trial 1, B- Phase
2 Trial 2, C- Phase 3 Trial 1, and D- Phase 3 Trial 2

61
counts concentrations compared to 30%Control. Even at 1 hour after restart the average
particle counts values were still higher for 20%SV as compared to 30%Control (10482
versus 15987 particles/mL for 30%Control and 20%SV respectively). Therefore, although
no apparent differences existed between 30%Control and 20%SV in terms of DOC
removal, however, backwash optimization in terms of DOC removal cannot be achieved
while compensating particles removal. As a results when the implementation of ETSW is
not feasible for a certain water treatment facility it is recommended to employ a higher bed
expansion to avoid the risks that are associated with higher effluent particles
concentrations.
Table 4.2- Comparison of Effluent Particle Counts for Phase 2 Backwash Strategies
(0.75-100 µm)
Effluent Particle Counts (#/mL)
Time
After
Restart
(min)
30%Control 20%SV 20%SV + ETSW
Mean RSD Mean RSD Mean RSD
5 208,631 0.98 1,683,872 1.93 39,682 0.83
10 389,631 1.14 394,777 1.18 14,215 0.81
15 62,629 0.80 372,358 1.53 12,871 0.52
20 60,439 1.52 136,617 1.85 18,052 1.04
30 28,276 1.04 130,326 1.93 18,854 0.70
40 16,936 0.66 109,396 2.03 11,714 0.62
50 10,559 0.36 11,975 0.69 9,482 0.51
60 10,482 0.57 15,987 1.45 5,569 0.37

62
4.4 Summary and Conclusions
In this study, a lab scale biofiltration system was used to examine the implications of
different backwash strategies on DOC removal, backwash water usage, and effluent
turbidity. The following conclusions can be made from these investigations:
Adding collapse pulsing to the backwash strategy under nutrient limited conditions
improved DOC removals compared to a water only backwash (13% versus 21%,
respectively).
Employing a lower bed expansion, 20% versus 30%, while using the same amount
of water demonstrated no impact on DOC removal (35%). However, employing a
40% bed expansion while using the same amount of backwash water volume as the
30% control lead to significantly lower DOC removals (6% decrease).
Employing a 20% bed expansion under the same duration of backwash fluidization
as the 30% also had no impact on DOC removal resulting in approximately a 20%
savings in water required to backwash the biofilters.
DO uptake demonstrated a direct correlation to DOC removal. Influent DO
concentrations may have a potential impact on biomass substrate uptake and more
research is needed to clarify this. Biomass concentrations as measured by
phospholipids and ATP analyses showed no direct correlation with DOC removals.
ETSW successfully eliminated the filter ripening period, and resulted in lower
number of particles exiting the biofilters compared to backwashes that did not
employ the ETSW. In addition, the ETSW step did not impact the DOC removal
when the filters were back in service.

63
References
1. Ahmad, R., &Amirtharajah, A. (1998). Detachment of particles during biofilter
backwashing. Journal of American Water Works Association, 90 (11), 74-85.
2. Ahmad, R., Amirtharajah, A., Al-Shawwa, A., & Peter, M. (1998). Effects of
backwashing on biological filters. Journal of American Water Works Association,
90 (12), 62–73.
3. Amburgey, J. E., Amirtharajah, A. (2005). Strategic filter backwashing techniques
and resulting particle passage. Journal of Environmental Engineering, 131 (4),
535–547.
4. Amburgey,J.E. (2004). Optimization of the extended terminal subfluidization
wash (ETSW) filter backwashing procedure. Water Research, 39 (2-3), 314-330.
5. Amirtharajah, A. (1993). Optimum backwashing of filters with air scour: a
review. Water Science & Technology, 27 (10), 195-211.
6. Amirtharajah, A. (1988). Some theoretical and conceptual views of filtration.
Journal of American Water Works Association, 80 (12), 36-46.
7. Amirtharajah, A., (1985). The interface between filtration and backwashing.
Water Research, 19 (5), 581-588.
8. Chaudhary, D. S., Vigneswaran, S., Ngo, H. H., Shim, W. G., & Moon, H. (2003).
Biofilter in water and wastewater treatment. Korean Journal of Chemical
Engineering, 20 (6), 1054-1065.
9. Colton, J. F., Hillis, P., & Filtzpatrick, C. S.B. (1996). Filter backwash and start-
up strategies for enhanced particulate removal. Water Research, 30 (10), 2502–
2507.
10. Emelko, M. B., Huck, P. M., & Douglas, I. P. (2003). Cryptosporidium and
microsphere removal during late in-cycle filtration. Journal of American Water
Works Association, 95 (5), 173–182.
11. Emelko, M. B., Huck, P. M., Coffey, B. M., & Smith, E. F. (2006). Effects of
media, backwash, and temperature on full-scale biological filtration. Journal of
American Water Works Association, 98 (12), 61-73.
12. François, R. J., & Van Haute, A. A. (1985). Backwashing and conditioning of a

64
deep bed filter. Water Research, 19 (11), 1357–1362.
13. Ghannoum, M. & O'Toole, G.A. (2004). Microbial Biofilms, ASM Press,
Washington, USA.
14. Gibert, O., Benoit, L., Fernandez, M., Bernat, X., Paraira, M., Galderer, M., &
Martinez-Liado, X. (2013). Characterising biofilm development on granular
activated carbon used for drinking water production. Water Research, 47 (3),
1101–1110.
15. Hammes, F., Goldschmidt, F., Vital, M., Wang, Y., & Egli, T. (2010).
Measurement and interpretation of microbial adenosine tri-phosphate (ATP) in
aquatic environments. Water Research, 44 (13), 3915–3923.
16. Health Canada. (2014). Guidelines for Canadian Drinking Water Quality -
Summary Table. Water and Air Quality Bureau, Healthy Enviroments and
Consumer Safety Branch, Health Canada, Ottawa, Ontario, 1–25.
17. Hozalski, R., Goel, S., & Bouwer, E. (1995). TOC removal in biological filters.
Journal of American Water Works Association, 87 (12), 40–54.
18. Huck, P.M., B.M. Coffey, A. Amirtharajah and E.J. Bouwer. (2000). Optimizing
filtration in biological filters, American Water Works Association Research
Foundation Project 252, Report 90793, Denver
19. Kaur, P., & Fitzpatrick, C. S. B. (2003). Biofllm formation in granular-bed filters.
Water and Environmental Journal, 17 (3), 145-148.
20. Kim, T. G., Yun, J., & Hong, S. (2014). Effects of water temperature and
backwashing on bacterial population and community in a biological activated
carbon process at a water treatment plant. Applied Microbial Biotechnology, 98
(3), 1417–1427.
21. Lauderdale, C.; Chadik, P.; Kirisits, M.J.; & Brown, J. (2012). Engineered
biofiltration: enhanced biofilter performance through nutrient and peroxide
addition. Journal of American Water Works Association, 104 (5), E298-E309.
22. LeChevallier, M. W., Schulz, W., & Lee, R. G. (1991). Bacterial nutrients in
drinking water. Applied and Environmental Microbiology, 57 (3), 857-862.

65
23. Liu, X., Huck, P. M., &Slawson, R. M. (2001). Factors affecting drinking water
biofiltration: Filtration. Journal American Water Works Association, 93 (12), 90-
101.
24. Magic-Knezev, A. & van der Kooij, D. (2004). Optimization and significance of
ATP analysis for measuring active biomass in granular activated carbon filters
used in water treatment. Water Research, (38) 18, 3971–3979.
25. Meric, S., Ovez, S., Kaptan, D., & Orhon, D. (2003). Operational strategies for a
small wastewater treatment plant using OUR, microscopic analysis, and toxicity
test. Journal of Environmental Science and Health Part a-Toxic/Hazardous
Substances & Environmental Engineering, 38 (10), 2329–2338.
26. Miltner, R. J., Summers, R. S., & Wang, J. Z. (1995). Biofiltration performance:
part 2, effect of backwashing. Journal of American Water Works Association, 87
(12), 64-70.
27. Moll, D. M., Summers, R. S., Fonseca, A. C., &Matheis, W. (1999). Impact of
temperature on drinking water biofilter performance and microbial community
structure. Environmental Science & Technology, 33 (14), 2377-2382.
28. Naidu, G.; Jeong, S.; Vigneswaran, S.; & Rice, S.A. (2013). Microbial activity in
biofilter used as a pretreatment for seawater desalination. Desalination, 309 (0),
254-260.
29. Orupold, K., Hellat, K., & Tenno, T. (1999). Estimation of treatability of different
industrial wastewater by activated sludge oxygen uptake measurement. Water
Science Technology, 40 (1), 31–36.
30. Pharand, L., Dyke, M. Van, Anderson, W., & Huck, P. (2014). Assessment of
biomass in drinking water biofilters by adenosine triphosphate. Journal of
American Water Works Association, 106 (10), 433–444.
31. Servais, P., Billen, G., Bablon, G. P., & Ven, C. (1991). Microbial activity in
GAC filters at the CHOISY-LE-ROI TREATMENT PLANT. Journal of
American Water Works Association, 83 (2), 62–68.
32. Shariati, F. P., Heran, M., Sarrafzadeh, M. H., Mehrnia, M. R., Sarzana, G.,
Ghommidh, C., & Grasmick, A. (2013). Biomass characterization by dielectric
monitoring of viability and oxygen uptake rate measurements in a novel

66
membrane bioreactor. Bioresource Technology, 140 (0), 357–362.
33. Simpson, D. R. (2008). Biofilm processes in biologically active carbon water
purification. Water Research, 42(12), 2839-2848.
34. Soucie, W. & Sheen, B. (2007). Filter-to-waste optimization. Journal of
American Water Works Association, 99 (5), 148–157.
35. Standard Methods for the Examination of Water and Wastewater. (2012).
American Public Health Association/American Water Works Association/Water
Environment Federation, Washington DC, USA.
36. Tchobanoglous, G., Burton, F.L., &Stensel, H.D. (2003). Wastewater
Engineering: Treatment and reuse, McGraw Hill, New York, USA.
37. Urfer, D., & Huck, P. M. (2001). Measurement of biomass activity in drinking
water biofilters using a respirometric method. Water Research, 35 (6), 1469-1477.
38. Urfer, D., Huck, P. M., Booth, S. D. J., & Coffey, B. M. (1997). Biological
filtration for BOM and particle removal: a critical review. Journal of American
Water Works Association, 89 (12), 83–98.
39. Vahala, R.; Moramarco, V.; Niemi, R.M.; Rintala, J.; & Laukkanen, R., (1998).
The effects of nutrients on natural organic matter (NOM) removal in biological
activated carbon (BAC) filtration. Acta Hydrochim Hydrobiol, 26 (3), 169-199.
40. Velten, S., Hammes, F., Boller, M., & Egli, T. (2007). Rapid and direct estimation
of active biomass on granular activated carbon through adenosine tri-phosphate
(ATP) determination. Water Research, 41 (9), 1973–1983.
41. Wang, J. Z., Summers, R. S., & Miltner, R. J. (1995). Biofiltration performance:
part 1, relationship to biomass. Journal of American Water Works Association, 87
(12), 55–63.
42. Yoong, E. T., Lant, P. a., & Greenfield, P. F. (2000). In situ respirometry in an
SBR treating wastewater with high phenol concentrations. Water Research, 34
(1), 239–245.
43. Yu, J., Wang, D., Yan, M.,Ye, C., Yang, M., & Ge, X. (2007). Optimized
coagulation of high alkalinity, low temperature and particle water: pH
adjustment and Polyelectrolytes as Coagulant Aids. Environmental
Monitoring and Assessment, 131 (1), 377-386.

67
44. Zhang, D.; Li, W.; Wang, K.; Zhang, L.; & Gong, H., (2010). Bacterial
community dynamics and its effects during biological activated carbon filter
process for drinking water treatment. 2nd International Conference on Chemical,
Biological, and Environmental Engineering, Cairo, Egypt, 137-142.
45. Zhu, H., Smith, D.W., Zhou, H., & Stanley, S. J. (1996). Improving removal of
turbidity causing materials by using polymers as a filter aid. Water Research, 30
(1), 103–114.

68
CHAPTER 5 –CONCLUSION AND RECOMMENDATIONS
This chapter provides an overall summary about the purpose of this research, concludes
the main findings and discusses their significance on full scale biological filters, and finally
provides recommendations for future work.
5.1 Overall Summary
The use of biological filtration in drinking water treatment has become increasingly
popular for the past few years. Biological filters have the ability to effectively remove
NOM from water resulting in a water that is biologically stable, that has a lower DBPs
formation potential, and that requires a lower disinfectant dose (Urfer et al., 1997). In
addition to that, biological filtration is one of the most sustainable and cost effective
processes that are employed in drinking water treatment industry. As a result, over the
years, research has focused on optimizing drinking water treatment plants performance
through optimizing biological filters performance. This was achieved by mainly studying
the impact of employing different media, varying the EBCTs, and examining the process
effectiveness under varying temperatures (Chaudhary et al., 2007). On the other hand, the
impact of backwashing hasn’t been studied extensively. Similar to conventional filters,
biological filters have to be backwashed on a periodic basis to prevent excessive headloss
buildup, to regenerate the filtration removal capacity, and to maintain a heathy biomass
level. The effectiveness of the backwashing step determines the effectiveness of the entire
biological filtration process. Therefore, the overall goal of this research was to develop a
better understanding of the biological filtration process by examining the effectiveness of
different backwash procedures on biological filters’ performance. The backwash strategies
investigated in this study were assessed based on their impacts on biofilters’ effluent
quality in terms of DOC, turbidity, and particles counts. The overall process productivity
was also taken into account by examining the duration of the backwash procedure, the
backwash water volume used, and the duration of the FTW step. To further increase the
overall understanding of biological filtration, the relationship between bifilters’ biomass
(in terms of phospholipids and ATP) and DOC removal along with the correlation between

69
DO uptake and DOC removal were examined. To achieve all of that, a lab scale system
consisting of 4 biologically active filters has been used.
The next section highlights on the main findings of this study along with their significance
on full scale biological filters.
5.2 Main Findings
The outcomes obtained from this study have several implications on future backwash
optimizations studies and may provide a useful insight to how existing treatment plants
should optimize their backwashing procedures, the outcomes include:
1. Collapse pulsing was found to result in higher DOC removals compared to water
only backwash under nutrient limited conditions. Therefore, collapse pulsing may
offer a more efficient backwash method for existing utilities that seek to improve
their NOM removal, that treat water that is relatively low in nutrients
concentrations, and that backwash their biological filters using water only.
2. The optimization of the reference backwash was examined by fixing the amount of
backwash water volume used and varying the bed expansions. The higher bed
expansion was found to impair DOC removals whereas the lower bed expansion
had no impact on DOC removal. The downside of employing the lower bed
expansion would be a longer biofilters’ time out of service duration which results
in less drinking water production. Therefore, the lower bed expansion backwash
strategy was further optimized to result in a filters’ time out of service that is equal
to the duration of the existing reference backwash strategy. This resulted in
backwash water savings of 22%. Therefore, it is recommended that water treatment
utilities follow this approach when they are optimizing their biological filters
performance and when they are optimizing the overall drinking water treatment
process.
3. ETSW did not show any impact on DOC removal. However, ETSW was successful
in completely eliminating the filter ripening sequence. Adding ETSW to an existing
backwash strategy requires additional water usage and increases the duration of the
backwash step. Nevertheless, this is compensated by savings after restart as some
water treatment utilities waste their water after backwash until effluent turbidity

70
meets the required criteria. In addition to that, it is recommended to add ETSW for
small water treatment plants that do not coagulate their water prior to the biological
filtration step as in this study ETSW was successful even though the influent water
did not receive any coagulation. Doing this will eliminate the pathogenic
microorganism breakthrough risks that are associated with the ripening period.
4. All the backwash strategies that were investigated did not show any apparent
impact on biofilters’s biomass as measured by the ATP and phospholipids methods.
This indicates that the use of collapse pulsing does not result in the loss of biomass
that is responsible for NOM removal as claimed by some previous studies.
However, it should be noted here that collapse pulsing backwash was initiated once
sufficient biomass concentrations have developed in the biological filters and once
steady state removal was observed. Therefore, the use of air may have a negative
impact during the conditioning phase when the aim is to develop an active biofilm
and when steady state removal is not reached yet.
5. Top of media biomass concentration as measured by the ATP and phospholipids
methods did not show any correlation with DOC removal. On the other hand, DO
uptake showed a direct relationship with DOC removal. This may provide an easy
and a direct tool for estimating biological activity across the biofilter without the
need of measuring other parameters that may require sophisticated instruments in
certain situations.
5.3 Recommendations for Future Work
1. It is well documented that water temperatures change with seasonal variations in
Canada and that a temperature drop could be accompanied by a drop in biological
activity and DOC removal. Therefore, it is recommended to investigate the
reproducibility of the results obtained in this study under cold water temperatures
(5oC).
2. The influent water did not receive any coagulation in this study. As a result, no
conclusions were drawn regarding the impact of the backwash strategies –in which
ETSW was absent- on the ripening period’s intensity and duration. It is
recommended to coagulate biological filters’ influent water for future studies that

71
seek to investigate the relationship between backwashing effects and effluent
turbidity during the ripening period.
3. Only two different bed expansions have been investigated in this research with
respect to the control 30% bed expansion. It is therefore recommended to
investigate the potential impacts of other bed expansions such as 15%, 25%, and
35%.
4. It is possible that DOC removal is related to influent DO concentrations. Therefore,
it is recommended to carry out investigations that assess DOC removal under
varying DO concentrations.
5. To further develop a better understanding of the biological filtration process, it is
recommended to identify the bacterial species that are present in the biofilm using
molecular tools such as DNA sequencing.

72
REFERENCES
1. Ahmad, R., & Amirtharajah, A. (1998). Detachment of particles during biofilter
backwashing. Journal of American Water Works Association, 90(11), 74-85.
2. Ahmad, R., Amirtharajah, A., Al-Shawwa, A., & Peter, M. (1998). Effects of
backwashing on biological filters. Journal of American Water Works Association,
90 (12), 62–73.
3. Amburgey, J. E., Amirtharajah, A. (2005). Strategic filter backwashing techniques
and resulting particle passage. Journal of Environmental Engineering, 131 (4),
535–547.
4. Amburgey, J.E. (2004). Optimization of the extended terminal subfluidization
wash (ETSW) filter backwashing procedure. Water Research, 39 (2-3), 314-330.
5. Amirtharajah, A. (1993). Optimum backwashing of filters with air scour: a
review. Water Science & Technology, 27 (10), 195-211.
6. Amirtharajah, A. (1988). Some theoretical and conceptual views of filtration.
Journal of American Water Works Association, 80 (12), 36-46.
7. Amirtharajah, A. (1985). The interface between filtration and backwashing. Water
Research. 19 (5), 581-588.
8. Andersson, A., Laurent, P., Kihn, A., Prevost, M., & Servais, P. (2001). Impact of
temperature on nitrification in biological activated carbon (BAC) filters used for
drinking water treatment. Water Research, 35 (12), 2923-2934.
9. Binnie, C., & Kimber, M. (2009). Basic water treatment fourth edition, Thomas
Telford Limited, London, United Kingdom
10. Chaudhary, D. S., Vigneswaran, S., Ngo, H. H., Shim, W. G., & Moon, H. (2003).
Biofilter in water and wastewater treatment. Korean Journal of Chemical
Engineering, 20 (6), 1054-1065.
11. Choi, Y.C., Li, X., Raskin, L., & Morgenroth, E. (2007). Effect of backwashing
on perchlorate removal in fixed bed biofilm reactors, Water Research, 41(9),
1949-1959.
12. Colton, J. F., Hillis, P., & Filtzpatrick, C. S.B. (1996). Filter backwash and start-
up strategies for enhanced particulate removal. Water Research, 30 (10), 2502–
2507.

73
13. Emelko, M. B., Huck, P. M., & Douglas, I. P. (2003). Cryptosporidium and
microsphere removal during late in-cycle filtration. Journal of American Water
Works Association, 95 (5), 173–182.
14. Emelko, M. B., Huck, P. M., Coffey, B. M., & Smith, E. F. (2006). Effects of
media, backwash, and temperature on full-scale biological filtration. Journal of
American Water Works Association, 98 (12), 61-73.
15. François, R. J., & Van Haute, A. A. (1985). Backwashing and conditioning of a
deep bed filter. Water Research, 19 (11), 1357–1362.
16. Ghannoum, M. & O'Toole, G.A. (2004). Microbial Biofilms, ASM Press,
Washington, USA.
17. Gibert, O., Benoit, L., Fernandez, M., Bernat, X., Paraira, M., Galderer, M., &
Martinez-Liado, X. (2013). Characterising biofilm development on granular
activated carbon used for drinking water production. Water Research, 47 (3),
1101–1110.
18. Hammes, F., Goldschmidt, F., Vital, M., Wang, Y., & Egli, T. (2010).
Measurement and interpretation of microbial adenosine tri-phosphate (ATP) in
aquatic environments. Water Research, 44 (13), 3915–3923.
19. Health Canada. (2014). Guidelines for Canadian Drinking Water Quality -
Summary Table. Water and Air Quality Bureau, Healthy Enviroments and
Consumer Safety Branch, Health Canada, Ottawa, Ontario, 1–25.
20. Howe, K.J., Hand, D.W., Crittenden, J.C., Trussell, R.R., &Tchobangolous, D.
(2012). Principles of water treatment. John Wiley & Sons Inc. USA.
21. Hozalski, R., Goel, S., & Bouwer, E. (1995). TOC removal in biological filters.
AWWA, 87 (12), 40–54.
22. Huck, P.M, Fedorak, P.M, & Anderson, W.B. (1991). Formation and removal of
assimilable organic carbon during biological treatment. Journal of American
Water Works Association, 83(12), 69-80
23. Huck, P.M., B.M. Coffey, A. Amirtharajah and E.J. Bouwer. (2000). Optimizing
filtration in biological filters, American Water Works Association Research
Foundation Project 252, Report 90793, Denver.

74
24. Huisman, L. & Wood, W.E. Slow sand filtration. World Health Organization-
Geneva 1974.
25. Kaur, P., & Fitzpatrick, C. S. B. (2003). Biofllm formation in granular-bed filters.
Water and Environmental Journal, 17 (3), 145-148.
26. Kim, T. G., Yun, J., & Hong, S. (2014). Effects of water temperature and
backwashing on bacterial population and community in a biological activated
carbon process at a water treatment plant. Applied Microbial Biotechnology, 98
(3), 1417–1427.
27. Lauderdale, C.; Chadik, P.; Kirisits, M.J.; & Brown, J. (2012). Engineered
biofiltration: enhanced biofilter performance through nutrient and peroxide
addition. Journal of American Water Works Association, 104 (5), E298-E309.
28. LeChevallier, M. W., Schulz, W., & Lee, R. G. (1991). Bacterial nutrients in drinking
water. Applied and Environmental Microbiology, 57 (3), 857-862.
29. Liu, X., Huck, P. M., &Slawson, R. M. (2001). Factors affecting drinking water
biofiltration: Filtration. Journal American Water Works Association, 93 (12), 90-
101.
30. Magic-Knezev, A. & van der Kooij, D. (2004). Optimization and significance of
ATP analysis for measuring active biomass in granular activated carbon filters
used in water treatment. Water Research, (38) 18, 3971–3979.
31. Matilainen, A., Vepsalainen, M., & Sillanpaa M. (2010). Natural organic matter
removal by coagulation during drinking water treatment: a review. Advances in
Colloid and Interface Science, 159 (2), 189-197.
32. Melin, E.S., & Odegaard, H. (2000). The effect of biofilter loading rate on the
removal of organic ozonation by products, Water Research, 34 (18), 4464-4476.
33. Meric, S., Ovez, S., Kaptan, D., & Orhon, D. (2003). Operational strategies for a
small wastewater treatment plant using OUR, microscopic analysis, and toxicity
test. Journal of Environmental Science and Health Part a-Toxic/Hazardous
Substances & Environmental Engineering, 38 (10), 2329–2338.
34. Miltner, R. J., Summers, R. S., & Wang, J. Z. (1995). Biofiltration performance:
part 2, effect of backwashing. Journal of American Water Works Association, 87
(12), 64-70.

75
35. Moll, D. M., Summers, R. S., Fonseca, A. C., &Matheis, W. (1999). Impact of
temperature on drinking water biofilter performance and microbial community
structure. Environmental Science & Technology, 33 (14), 2377-2382.
36. Mulkerrins, D., Dobson, A.D.W, & Colleran, E. (2004). Parameters affecting
biological phosphate removal from wastewaters. Environment International, 30
(2), 249-259.
37. Naidu, G.; Jeong, S.; Vigneswaran, S.; & Rice, S.A. (2013). Microbial activity in
biofilter used as a pretreatment for seawater desalination. Desalination, 309 (0),
254-260.
38. Ontario Ministry of the Environment (2008). Design Guidelines for Drinking
Water Systems.
39. Orupold, K., Hellat, K., & Tenno, T. (1999). Estimation of treatability of different
industrial wastewater by activated sludge oxygen uptake measurement. Water
Science Technology, 40 (1), 31–36.
40. Pharand, L., Dyke, M. Van, Anderson, W., & Huck, P. (2014). Assessment of
biomass in drinking water biofilters by adenosine triphosphate. Journal of
American Water Works Association, 106 (10), 433–444.
41. Prevost, M., Laurent, P., Servais, P., & Joret, J.C . (2005). Biodegradable organic
matter in drinking water treatment and distribution, American Water Works
Association, Denver, USA.
42. Salvik, I., Jehmlich, A., & Uhl, W. (2013). Impact of backwashing procedures on
deep bed filtration productivity in drinking water treatment, Water Research, 47
(16), 6348-6357.
43. Satterfield, Z. (2005). Filter backwashing. National Environmental Services
Center,5 ( 3).
44. Servais, P., Billen, G., Bablon, G. P., & Ven, C. (1991). Microbial activity in
GAC filters at the Choisy-Le-Roi Treatment Plant. Journal of American Water
Works Association, 83 (2), 62–68.
45. Shariati, F. P., Heran, M., Sarrafzadeh, M. H., Mehrnia, M. R., Sarzana, G.,
Ghommidh, C., & Grasmick, A. (2013). Biomass characterization by dielectric
monitoring of viability and oxygen uptake rate measurements in a novel

76
membrane bioreactor. Bioresource Technology, 140 (0), 357–362.
46. Siddiqui,M.S., Gary,L.M, & Murphay,B.D. (1997). Ozone enhanced removal of
natural organic matter from drinking water sources. Water Research, 31 (12),
3089-3105.
47. Simpson, D. R. (2008). Biofilm processes in biologically active carbon water
purification. Water Research, 42 (12), 2839-2848.
48. Soucie, W. & Sheen, B. (2007). Filter-to-waste optimization. Journal of
American Water Works Association, 99 (5), 148–157.
49. Standard Methods for the Examination of Water and Wastewater. (2012).
American Public Health Association/American Water Works Association/Water
Environment Federation, Washington DC, USA.
50. Tchobanoglous, G., Burton, F.L., & Stensel, H.D. (2003). Wastewater
Engineering: Treatment and reuse, McGraw Hill, New York, USA.
51. Urfer, D., & Huck, P. M. (2001). Measurement of biomass activity in drinking
water biofilters using a respirometric method. Water Research, 35 (6), 1469-1477.
52. Urfer, D., Huck, P. M., Booth, S. D. J., & Coffey, B. M. (1997). Biological
filtration for BOM and particle removal: a critical review. Journal of American
Water Works Association, 89 (12), 83–98.
53. Vahala, R.; Moramarco, V.; Niemi, R.M.; Rintala, J.; & Laukkanen, R., (1998).
The effects of nutrients on natural organic matter (NOM) removal in biological
activated carbon (BAC) filtration. Acta Hydrochim Hydrobiol, 26 (3), 169-199.
54. Velten, S., Hammes, F., Boller, M., & Egli, T. (2007). Rapid and direct estimation
of active biomass on granular activated carbon through adenosine tri-phosphate
(ATP) determination. Water Research, 41 (9), 1973–1983.
55. Wand, J.Z, & Summers, R.S. (1996). Biodegradation behavior of natural organic
matter in sand filters. Journal of Water Science, 9 (1), 3-16.
56. Wang, J. Z., Summers, R. S., & Miltner, R. J. (1995). Biofiltration performance:
part 1, relationship to biomass. Journal of American Water Works Association, 87
(12), 55–63.
57. Xue, F. Master’s Thesis (2011). The effect of backwashing procedures on filter
ripening and general effluent quality.
77
58. Yoong, E. T., Lant, P. a., & Greenfield, P. F. (2000). In situ respirometry in an
SBR treating wastewater with high phenol concentrations. Water Research, 34
(1), 239–245.
59. Yu, J., Wang, D., Yan, M., Ye, C., Yang, M., & Ge, X. (2007). Optimized
coagulation of high alkalinity, low temperature and particle water: pH
adjustment and Polyelectrolytes as Coagulant Aids. Environmental
Monitoring and Assessment, 131 (1), 377-386.
60. Zhang, D., Li, W., Wang, K., Zhang, L., & Gong, H., (2010). Bacterial
community dynamics and its effects during biological activated carbon filter
process for drinking water treatment. 2nd International Conference on Chemical,
Biological, and Environmental Engineering, Cairo, Egypt, 137-142.
61. Zhu, H., Smith, D.W., Zhou, H., & Stanley, S. J. (1996). Improving removal of
turbidity causing materials by using polymers as a filter aid. Water Research, 30
(1), 103–114.

78
Appendix A- DOSING SOLUTIONS CALCULATIONS
1. Carbon Dosing Solution
7.1 mg/L of carbon is needed in the biofilters’ influent
Three chemicals are to be used, therefore:
7.1/3= 2.37 mg/L from each chemical is needed.
Define:
Qo= volumetric flow rate from nutrients dosing tank (5ml/min)
Q1=tap water volumetric flow rate (400ml/min)
Q2 = volumetric flow rate from the carbon dosing tank (5ml/min)
Q3= overall volumetric flow rate to the biofilters (410ml/min)
C = carbon concentration (mg/L)
QoCo + Q1 C1 + Q2 C2 = Q3C3
Q2 C2 = Q3C3
5 Ml/min (C2) = 410 mL/min (2.37 mg/L)
C2 = 194.34 mg/L
A carbon concentration of 194.34 mg/L needs to be present from each chemical in the 50
L carbon dosing tank
Glyoxal
149.34 mg C/L . (1mmol C/ 12 mg C) . (58 mg glyoxal/1 mmolglyoxal) = 470 mg
glyoxal/L needed in the 50 L dosing solution
- 500 mL stock solutions are prepared to make up the 50L dosing tank

79
- To determine the concentration of stock solutions:
(470 mg/L. 50L. 1000 ml/L)/ 500 mL= 47000 mg/L of glyoxal are needed in the stock
solution
- Purity of glyoxal used (provided by the manufacturer) = 40000 mg/L
- Volume of glyoxal to be added to the 500 ml stock solution:
(47000 mg/L . 500 mL)/ 40000 mg/L = 58.75 ml of glyoxal
Formic Acid
Similar calculations are performed to determine formic acid concentration
- Volume of formic acid to be added to the 500 ml stock solution = 42.32 ml of formic
acid
Acetic Acid
Similar steps are performed to determine acetic acid concentration
- Volume of acetic acid to be added directly to the 50 L dosing solution = 9 ml of acetic
acid
2. Nutrients Dosing Solution
Magnesium Sulphate
2.1 mg/L of Mg are needed in the biofilters’ influent
2.1 mg/L.(1mmolMg/24 mg Mg). (120.4 mg Mg/1mmol MgSO4)= 10.5 mg/L
- Mass of MgSO4 needed to be added to the 50L dosing tank:
(10.5mg/L .410 ml/min. 50L) / (5 ml/min .1000 mg/g) = 43.05 g of MgSO4
Aluminum Nitrate
0.18 4mg/L of Al are needed in the biofilters’ influent

80
0.184 mg/L .(1mmol Al/27 mg Al). (213 mg Al/1mmol AlNO3)= 1.45 mg/L
- Mass of AlNO3 needed to be added to the 50L dosing tank:
(1.45 mg/L .410 ml/min . 50L) /( 5 ml/min .1000 mg/g )= 5.95 g of AlNO3
Sodium Nitrate
NaNO3 was added to the 26 L supplementary dosing solution
0.31 g N are needed in the biofilters’ influent
Similar calculations are performed to determine amount of NaNO3 needed while taking
into account amount of N present in AlNO3
- Mass of NaNO3 to be added to the 26 L dosing solution: 4.16 g of NaNO3
Sodium Carbonate
3.1 g of Na re needed in the biofilters’ influent
Similar calculations are performed to determine amount of Na2CO3 needed while taking
into account amount of Na present in NaNO3
- Mass of Na2CO3 to be added to the 50 L dosing solution: 29.3 g of Na2CO3
Potassium Dihydrogen Phosphate
0.031 g of P are needed in the biofilters’ influent
0.315 mol K/ mol P are needed in the biofilters’ influent
Similar calculations are performed to determine amount of KH2PO4 needed
- Mass of KH2PO4 to be added to the 50 L dosing solution: 023 g of KH2PO4
- Mass of KH2PO4 to be added to the 26 L dosing solution

81
Appendix B- EXTENDED TERMINAL SUBFLUIDIZATION WASH
CALCULATION
GAC media specifications
LF= 520 mm
ρp = 1500 kg/m3
d10=0.7 mm
d60= 0.85 mm
d90=0.96 mm
kl= 4.4
kv= 228
ρw@20C = 998.3 kg/m3
µw@20C= 0.001002 kg/m.s
ETSW flow rate
Ga =(0.96x 10⁻³
)3
998.3(1500−998.3)9.8
(0.001002)2 = 4325.3
Rmf = [33.72 + 0.0408 (4325.3)]0.5 − 33.7 = 2.5
𝑉𝑚𝑓 = 2.5 (0.001002).3600
(0.96𝑥10−3) 𝑥 998.3 = 9.4 m /h
ETSW duration
𝜋 (25 𝑥 10−3)2𝑥 1.04𝑚
9/60= 7 minutes

82
APPENDIX C- CONDITIONING PHASE RESULTS
0.000
0.020
0.040
0.060
0.080
0.100
0.120
0 10 20 30 40 50 60 70
UV
(1
/cm
)
Time (min)
Average UVA After BackwashB1
Eff
Inf
0.000
0.020
0.040
0.060
0.080
0.100
0.120
0 10 20 30 40 50 60 70
UV
(1
/cm
)
Time (min)
Average UVA After BackwashB2
Eff
Inf
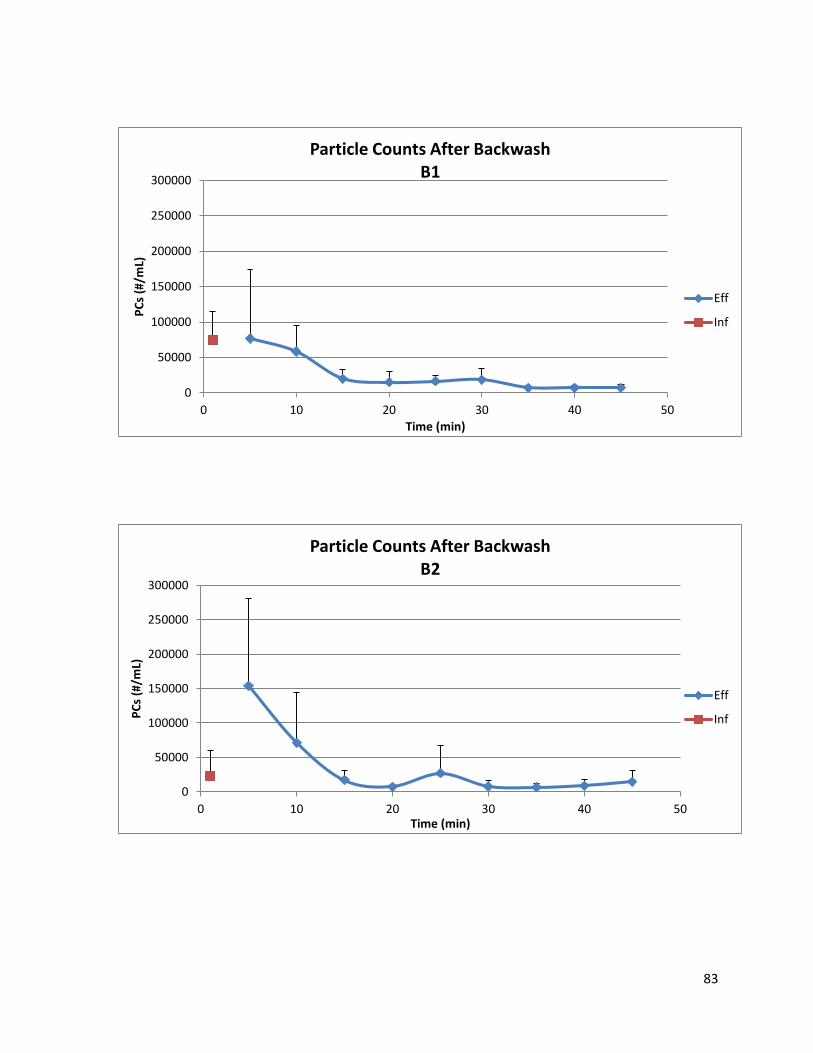
83
0
50000
100000
150000
200000
250000
300000
0 10 20 30 40 50
PC
s (#
/mL)
Time (min)
Particle Counts After BackwashB1
Eff
Inf
0
50000
100000
150000
200000
250000
300000
0 10 20 30 40 50
PC
s (#
/mL)
Time (min)
Particle Counts After BackwashB2
Eff
Inf
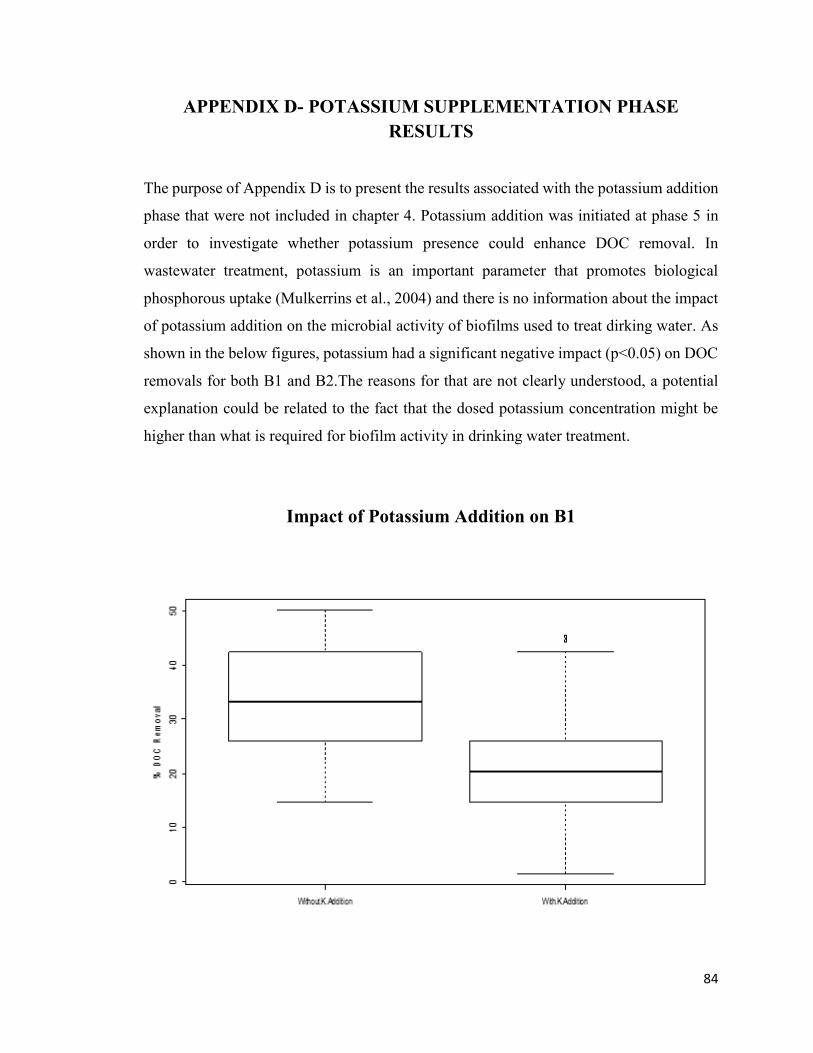
84
APPENDIX D- POTASSIUM SUPPLEMENTATION PHASE
RESULTS
The purpose of Appendix D is to present the results associated with the potassium addition
phase that were not included in chapter 4. Potassium addition was initiated at phase 5 in
order to investigate whether potassium presence could enhance DOC removal. In
wastewater treatment, potassium is an important parameter that promotes biological
phosphorous uptake (Mulkerrins et al., 2004) and there is no information about the impact
of potassium addition on the microbial activity of biofilms used to treat dirking water. As
shown in the below figures, potassium had a significant negative impact (p<0.05) on DOC
removals for both B1 and B2.The reasons for that are not clearly understood, a potential
explanation could be related to the fact that the dosed potassium concentration might be
higher than what is required for biofilm activity in drinking water treatment.
Impact of Potassium Addition on B1

85
Impact of Potassium Addition on B2

86
APPENDIX E- ADDITIONAL TURBIDITY RESULTS
0
300
600
900
1200
1500
1800
2100
2400
2700
3000
0 50 100 150 200 250 300
Turb
idit
y (m
NTU
)
Time (min)
20%SV versus 30%Control (Trial 1)
30%Control
20%SV
20%SV+ETSW
0
300
600
900
1200
1500
1800
2100
2400
2700
3000
0 50 100 150 200 250 300
Turb
idit
y (m
NTU
)
Time (min)
20%SV versus 30%Control (Trial 4)
30%Control
20%SV
20%SV+ETSW

87
0
300
600
900
1200
1500
1800
2100
2400
2700
3000
0 50 100 150 200 250 300
Turb
idit
y (m
NTU
)
Time (min)
20%SV versus 30%Control (Trial 5)
30%Control
20%SV
0
300
600
900
1200
1500
1800
2100
2400
2700
3000
0 50 100 150 200 250 300
Turb
idit
y (m
NTU
)
Time (min)
Potassium Supplementtion Phase 20%SV versus 30%Control (Trial 1)
30%Control
20%SV
20%+ETSW

88
0
300
600
900
1200
1500
1800
2100
2400
2700
3000
0 50 100 150 200 250 300
Turb
idit
y (m
NTU
)
Time (min)
Potassium Supplementation Phase 20%SV versus 30%Control (Trial 2)
30%Control
20%SV
20%SV+ETSW
0
300
600
900
1200
1500
1800
2100
2400
2700
3000
0 50 100 150 200 250 300
Turb
idit
y (m
NTU
)
Time (min)
Potassium Supplementation Phase 20%SV versus 30%Control(Trial 3)
30%Control
20%SV
20%SV+ETSW

89
0
300
600
900
1200
1500
1800
2100
2400
2700
3000
0 50 100 150 200 250 300
Turb
idit
y (m
NTU
)
Time (min)
Potassium Supplementation Phase 20%SV versus 30%Control (Trial 4)
30%Control
20%SV
20%SV+ETSW
0
300
600
900
1200
1500
1800
2100
2400
2700
3000
0 50 100 150 200 250 300
Turb
idit
y (m
NTU
)
Time (min)
40%SV versus 30%Control (Trial 1)
30%Control
40%SV
40%SV+ETSW

90
0
300
600
900
1200
1500
1800
2100
2400
2700
3000
0 50 100 150 200 250 300
Turb
idit
y (m
NTU
)
Time (min)
40%SV versus 30%Control (Trial 3)
30%Control
40%SV
40%SV+ETSW
0
300
600
900
1200
1500
1800
2100
2400
2700
3000
0 50 100 150 200 250 300
Turb
idit
y (m
NTU
)
Time (min)
20%ST versus 30%Control (Trial 1)
30%Control
20%ST
20%ST+ETSW

91
0
300
600
900
1200
1500
1800
2100
2400
2700
3000
0 50 100 150 200 250 300
Turb
idit
y (m
NTU
)
Time (min)
20%ST versus 30%Control (Trial 2)
30%Control
20%ST
20%ST+ETSW
0
900
1800
2700
3600
4500
5400
6300
7200
8100
9000
0 50 100 150 200 250 300
Turb
idit
y (m
NTU
)
Time (min)
20%ST versus 30%Control (Trial 3)
30%Control
20%ST
20%ST+ETSW

92
0
500
1000
1500
2000
2500
3000
3500
4000
4500
5000
0 50 100 150 200 250 300
Turb
idit
y (m
NTU
)
Time (min)
20%ST versus 30%Control (Trial 4)

93
APPENDIX F- % DOC Removal Data
30%W 30%Control 20%SV 30%Control 20%ST 30%Control 40%SV 30%Control
0.00 13.18 42.44 59.30 20.76 39.36 25.45 25.50
-6.31 8.39 41.70 31.55 35.84 37.89 21.64 30.57
5.79 22.60 39.21 47.53 35.53 43.36 6.60 35.18
31.93 20.07 37.63 47.04 42.60 40.28 16.80 36.85
21.74 2.42 35.26 47.75 50.13 24.94 27.61 23.04
-9.73 22.94 42.53 36.66 33.78 45.52 29.06 25.31
15.17 40.27 46.89 61.30 41.01 20.87 15.70 25.74
13.00 19.85 66.33 37.68 45.64 19.60 48.74 35.91
26.37 18.91 35.72 48.01 44.61 27.51 21.46 37.59
17.70 28.80 30.61 16.05 42.34 27.62 24.42 30.67
-16.04 12.71 24.87 47.80 43.05 33.74 27.30 36.85
-5.19 4.03 28.12 24.29 49.73 52.05 30.56 21.79
14.86 24.27 34.85 29.16 26.99 41.26 27.95 25.83
3.01 35.13 57.34 28.46 31.97 39.28 33.17 28.46
9.34 44.66 52.49 40.78 31.12 38.79 24.25 12.24
17.27 24.45 29.34 29.55 40.90 38.56 22.09 41.50
19.12 17.19 31.91 10.38 38.14 31.21 2.35 34.04
10.98 23.84 20.17 35.58 40.04 24.84 6.15 25.37
24.78 28.07 26.45 13.29 26.33 36.96 NA NA
8.01 30.12 25.39 18.06 24.43 46.31 NA NA
7.04 29.55 23.45 17.32 23.60 51.25 NA NA
20.63 32.67 25.04 22.87 14.65 34.29 NA NA
13.58 25.22 33.17 25.32 24.14 37.57 NA NA
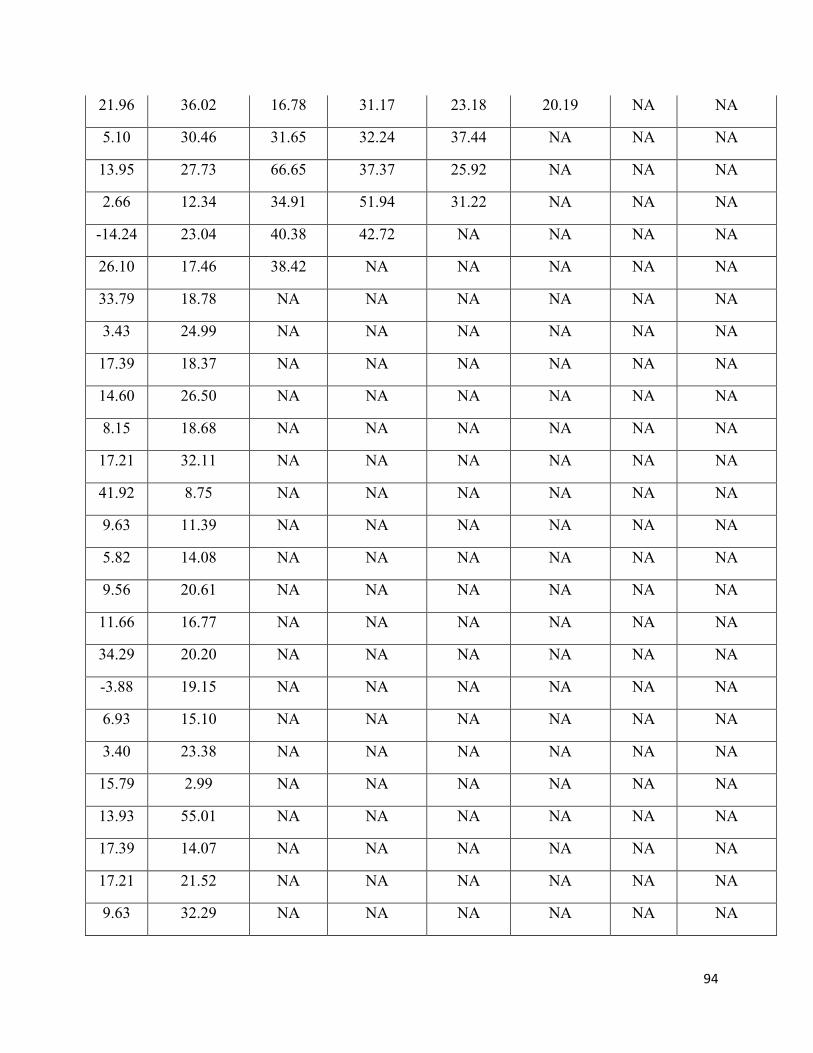
94
21.96 36.02 16.78 31.17 23.18 20.19 NA NA
5.10 30.46 31.65 32.24 37.44 NA NA NA
13.95 27.73 66.65 37.37 25.92 NA NA NA
2.66 12.34 34.91 51.94 31.22 NA NA NA
-14.24 23.04 40.38 42.72 NA NA NA NA
26.10 17.46 38.42 NA NA NA NA NA
33.79 18.78 NA NA NA NA NA NA
3.43 24.99 NA NA NA NA NA NA
17.39 18.37 NA NA NA NA NA NA
14.60 26.50 NA NA NA NA NA NA
8.15 18.68 NA NA NA NA NA NA
17.21 32.11 NA NA NA NA NA NA
41.92 8.75 NA NA NA NA NA NA
9.63 11.39 NA NA NA NA NA NA
5.82 14.08 NA NA NA NA NA NA
9.56 20.61 NA NA NA NA NA NA
11.66 16.77 NA NA NA NA NA NA
34.29 20.20 NA NA NA NA NA NA
-3.88 19.15 NA NA NA NA NA NA
6.93 15.10 NA NA NA NA NA NA
3.40 23.38 NA NA NA NA NA NA
15.79 2.99 NA NA NA NA NA NA
13.93 55.01 NA NA NA NA NA NA
17.39 14.07 NA NA NA NA NA NA
17.21 21.52 NA NA NA NA NA NA
9.63 32.29 NA NA NA NA NA NA

95
5.82 30.80 NA NA NA NA NA NA
11.66 44.12 NA NA NA NA NA NA
34.29 32.90 NA NA NA NA NA NA
6.93 17.81 NA NA NA NA NA NA
3.40 19.41 NA NA NA NA NA NA
15.79 27.87 NA NA NA NA NA NA
16.75 8.01 NA NA NA NA NA NA
16.82 4.12 NA NA NA NA NA NA
2.36 16.59 NA NA NA NA NA NA
7.05 15.57 NA NA NA NA NA NA
18.49 NA NA NA NA NA NA NA
33.55 NA NA NA NA NA NA NA
13.24 NA NA NA NA NA NA NA
4.87 NA NA NA NA NA NA NA
20%SV+ETSW
20%SV+ETSW
20%SV+ETSW (+K) 40%SV+ETSW 20%ST+ETSW
35.39 4.80 21.65 49.21
35.37 14.81 27.02 43.22
27.90 12.10 0.48 37.33
25.48 19.36 29.57 42.33
33.43 26.21 29.57 47.38
34.80 24.11 15.00 43.41
32.97 25.19 25.32 43.77
35.36 27.96 16.25 45.56
30.90 26.03 8.14 41.25
40.93 6.49 26.53 30.90

96
17.59 22.19 38.60 47.85
22.13 21.94 3.14 31.38
24.20 20.58 19.22 32.28
39.64 16.83 19.76 26.26
39.61 19.62 22.93 25.85
40.51 20.22 0.21 45.02
37.11 25.42 29.62 24.13
34.06 21.26 31.20 25.54
24.18 8.93 NA 24.94
30.28 12.27 NA 27.69
36.31 1.71 NA 27.09
41.32 17.69 NA 32.63
22.08 23.95 NA 33.58
NA 20.09 NA NA
NA 11.94 NA NA
NA 22.92 NA NA
NA 21.78 NA NA
NA 24.56 NA NA

97
APPENDIX G- DO DATA
Influent Effluent Change
10.93 1.7 9.23
10.42 4.67 5.75
10.62 3.71 6.91
12.27 4.67 7.60
11.35 4.38 6.97
11.72 3.53 8.19
12.70 4.79 7.91
12.05 4.30 7.75
11.63 3.16 8.47
12.99 1.94 11.05
12.17 1.97 10.20
14.50 2.12 12.38
12.08 3.76 8.32
11.12 1.97 9.15
10.46 1.27 9.19
12.01 5.31 6.70
11.92 4.21 7.71
11.67 3.01 8.66
10.87 3.32 7.55
10.32 4.01 6.31
11.07 5.03 6.04
11.10 7.14 3.96
12.07 7.90 4.17

98
10.45 8.75 1.70
8.94 6.32 2.62
10.01 5.64 4.37
9.33 2.89 6.44
9.83 4.26 5.57
9.66 5.68 3.98
9.70 6.23 3.47
9.82 4.81 5.01
9.66 4.64 5.02
9.76 5.35 4.41
8.81 4.19 4.62
7.19 4.38 2.81
6.74 3.39 3.35
8.49 3.40 5.09
8.62 2.88 5.74
8.39 4.23 4.16
8.21 2.28 5.93
8.31 2.88 5.43
8.21 3.97 4.24
8.14 3.18 4.96
8.02 4.62 3.40
8.17 3.54 4.63
8.42 3.94 4.48
7.34 0.27 7.07
7.67 2.22 5.45
7.23 0.57 6.66

99
7.54 0.35 7.19
7.05 0.12 6.93
7.20 0.31 6.89
7.66 0.90 6.76
6.69 0.12 6.57
7.17 0.58 6.59
6.91 0.13 6.78
7.67 0.07 7.60
7.44 0.14 7.30
7.53 0.12 7.41
7.21 0.07 7.14
7.73 3.08 4.65
7.73 0.22 7.51
10.49 6.35 4.14
11.49 7.55 3.94
12.50 8.56 3.94
11.07 8.39 2.68
- 8.42 -
11.92 8.89 3.03
11.76 9.37 2.39
10.91 8.27 2.64
11.87 8.35 3.52
11.03 8.15 2.88
12.30 9.71 2.59
13.01 7.12 5.89
11.93 7.21 4.72

100
12.72 7.07 5.65
11.95 7.63 4.32
7.81 6.80 1.01
9.14 6.09 3.05
9.21 7.32 1.89
9.02 6.75 2.27
8.92 6.72 2.20
10.21 5.88 4.33
8.19 7.52 0.67
8.72 7.25 1.48
7.84 7.40 0.44
6.82 6.29 0.53
7.37 5.86 1.51
5.93 5.84 0.09
7.23 5.78 1.46
6.63 5.79 0.84
6.20 5.28 0.91
6.20 5.51 0.68
6.14 5.18 0.97
6.61 5.36 1.25
6.62 5.47 1.15
6.70 5.71 0.98
7.14 5.38 1.76
7.02 4.26 2.76
7.09 5.32 1.77
7.09 3.86 3.23

101
5.29 4.19 1.10
5.68 3.76 1.92
7.09 3.40 3.69
10.22 6.00 4.22
7.54 5.19 2.35
7.58 5.70 1.88
9.57 6.03 3.54
8.55 6.39 2.16
7.79 6.12 1.66
8.61 6.21 2.40
8.39 6.25 2.14
10.14 7.80 2.34
10.39 6.39 4.00
12.34 9.16 3.18
12.27 7.75 4.52
12.24 9.57 2.67
11.95 8.86 3.09
12.09 7.98 4.12
12.22 9.12 3.10

102
APPENDIX H- PHOSPHOLIPIDS AND ATP DATA
Phospholipids Concentration Before
Backwash (nmol P/g media)
Phospholipids Concentration After
Backwash (nmol P/g media)
12.28 35.95
167.46 113.07
36.45 144.66
91.24 140.13
23.14 23.07
371.49 270.58
157.67 249.52
131.14 142.86
43.22 90.34
17.21 69.150
22.33 14.77
20.27 9.380
20.27 9.376
35.57 24.105
8.89 28.660
6.56 8.38
92.61 77.78
30.45 33.97
167.18 53.25
364.99 44.26
490.40 219.10
230.34 239.39

103
149.68 330.78
45.89 115.09
259.90 16.62
40.42 223.89
10.98 16.02
34.76 58.77
NA 16.32
Top of Media ATP Before Backwash
(ng ATP/g media)
Top of Media ATP After Backwash
(ng ATP/g media)
7776.64 859.71
688.23 1558.63
703.93 1017.77
40.34 43.94
52.58 28.80
272.55 486.72
156.89 21.83
374.38 311.96
846.63 1497.13
170.86 238.96
386.93 525.09
375.64 446.37
192.98 206.56
341.72 322.83

104
474.43 213.34
1492.42 640.54
332.19 389.66
139.17 124.57
633.18 75.95
5041.01 756.39
1018.15 2104.29
430.33 261.64
435.93 361.38
306.12 208.90
11.80 15.91
271.66 1485.58
1148.41 691.50
127.57 250.88
20.66 136.66
835.43 528.10
207.12 214.64
228.70 286.43
1230.60 1263.82
3845.15 2400.75
495.17 611.97
1487.63 327.24
61.56 559.86
7777 2401
12 16

105
Middle of Media ATP Before
Backwash
(ng ATP/g media)
Middle of Media ATP After
Backwash
(ng ATP/g media)
48.84 33.25
397.46 684.03
477.54 572.25
237.12 319.99
54.63 94.62
312.01 211.46
78.58 133.64
136.90 49.37
253.18 536.20
420.43 597.44
70.31 258.62
60.35 50.31
85.69 26.54
15.82 44.97
567.44 1111.63
757.98 956.25
195.76 220.20
55.35 235.91
216.73 1971.74
21.47 71.86
134.85 186.58
173.18 279.73

106
736.08 1006.62
150.48 105.66
47.38 105.90
61.56 92.78
16 27
758 1972

107
APPENDIX I- UV AND TEMPERATURE DATA
Phase2 Phase3 Phase 4 Phase 5
15.27 29.87 13.65 15.42
-2.82 25.23 11.24 38.09
25.97 22.69 13.84 17.47
14.04 32.27 16.94 40.86
26.59 23.32 14.19 24.32
30.87 18.11 13.15 24.08
36.16 17.24 -16.20 89.01
27.98 19.11 0.38 84.83
13.26 20.59 -6.38 87.58
-35.41 25.58 -0.22 85.69
-40.16 -5.74 11.28 85.67
-24.68 -7.09 1.60 82.23
17.24 -9.46 9.79 13.28
7.88 0.70 19.65 12.83
20.62 3.28 6.41 38.04
21.41 0.63 -5.64 -2.69
12.18 -2.90 -2.62 13.69
8.12 -4.41 -3.61 29.30
5.20 0.00 -7.66 8.06
-31.76 0.64 -7.67 28.77
-21.13 1.99 -285.16 7.80
12.35 -0.12 8.92 26.64
4.47 -0.58 15.62 -7.43
20.90 -2.77 13.56 13.41
-15.54 -0.96 14.37 30.63
15.25 11.88 15.77 31.61
4.35 16.92 15.75 17.62
13.54 25.28 7.65 32.42
38.05 92.70 -2.42 24.79
43.66 -83.73 -0.20 37.17
47.23 -2.31 1.07 27.94
25.85 -2.90 -12.47 26.19
26.03 -4.47 12.08 27.51
20.55 -3.67 12.92 28.79
2.49 0.64 9.55 93.08
24.57 29.87 -5.01 93.32
7.55 25.23 -4.17 -10.27
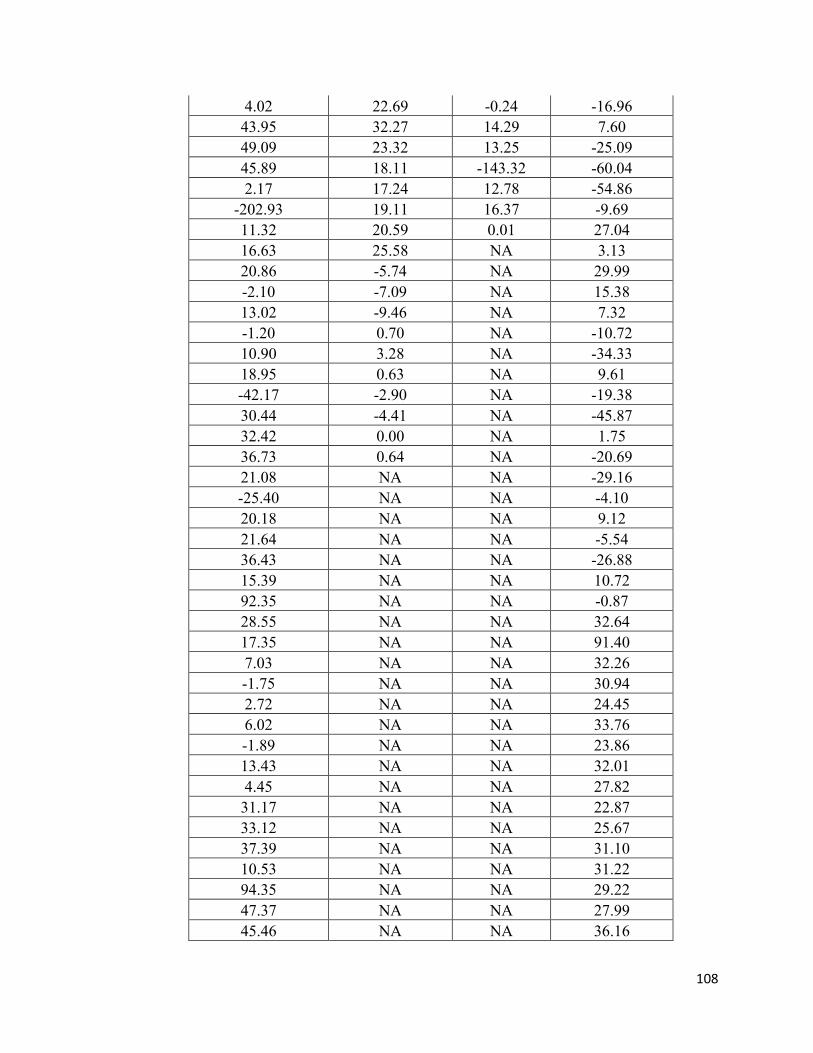
108
4.02 22.69 -0.24 -16.96
43.95 32.27 14.29 7.60
49.09 23.32 13.25 -25.09
45.89 18.11 -143.32 -60.04
2.17 17.24 12.78 -54.86
-202.93 19.11 16.37 -9.69
11.32 20.59 0.01 27.04
16.63 25.58 NA 3.13
20.86 -5.74 NA 29.99
-2.10 -7.09 NA 15.38
13.02 -9.46 NA 7.32
-1.20 0.70 NA -10.72
10.90 3.28 NA -34.33
18.95 0.63 NA 9.61
-42.17 -2.90 NA -19.38
30.44 -4.41 NA -45.87
32.42 0.00 NA 1.75
36.73 0.64 NA -20.69
21.08 NA NA -29.16
-25.40 NA NA -4.10
20.18 NA NA 9.12
21.64 NA NA -5.54
36.43 NA NA -26.88
15.39 NA NA 10.72
92.35 NA NA -0.87
28.55 NA NA 32.64
17.35 NA NA 91.40
7.03 NA NA 32.26
-1.75 NA NA 30.94
2.72 NA NA 24.45
6.02 NA NA 33.76
-1.89 NA NA 23.86
13.43 NA NA 32.01
4.45 NA NA 27.82
31.17 NA NA 22.87
33.12 NA NA 25.67
37.39 NA NA 31.10
10.53 NA NA 31.22
94.35 NA NA 29.22
47.37 NA NA 27.99
45.46 NA NA 36.16

109
11.31 NA NA 1.40
-21.89 NA NA 36.55
-4.08 NA NA 33.13
4.91 NA NA 29.19
12.33 NA NA 24.23
NA NA NA 7.22
NA NA NA 11.29
NA NA NA 48.27
NA NA NA 34.14
NA NA NA 3.26
NA NA NA 35.44
NA NA NA 12.93
NA NA NA -28.25
NA NA NA -27.78
NA NA NA 6.90
NA NA NA 31.94
NA NA NA 13.51
NA NA NA -31.07
NA NA NA -16.74
NA NA NA -32.53
NA NA NA 26.31
NA NA NA 26.17
NA NA NA 27.00
NA NA NA 29.51
NA NA NA 25.68
NA NA NA -36.55
NA NA NA 36.60
NA NA NA 38.99
NA NA NA 23.15
NA NA NA -2.69
NA NA NA -27.80
NA NA NA 3.39
NA NA NA 24.10
NA NA NA 42.51
NA NA NA 31.98
NA NA NA 16.30
NA NA NA -31.71
NA NA NA -10.06
NA NA NA -9.13
NA NA NA 4.60
NA NA NA 1.85

110
NA NA NA 11.79
NA NA NA 21.25
NA NA NA 33.22
TEMPERATURE DATA (oC)
Phase 1 (August 15, 2014 to October 15, 2014,
60 days)
Phase2 (October 20, 2014 to December 20, 2014,
60 days)
Phase 3 (July 15, 2015 to August 15,
2015, 30 days)
Phase 4 (May 1, 2015 to
June 30, 2015, 60 days)
20.3 20.30 20.00 19.30
21.3 19.40 20.40 19.90
22.5 19.30 21.00 20.50
21.4 19.00 21.00 20.40
20.5 18.40 21.40 20.50
20.7 18.70 22.50 21.00
21.7 18.00 22.80 21.00
21.00 17.50 21.90 20.90
20.1 18.30 22.00 NA
21.10 17.30 22.90 NA
19.90 17.50 NA NA
20.40 15.60 NA NA
20.10 16.10 NA NA
19.80 15.30 NA NA
19.90 14.90 NA NA
NA 14.50 NA NA
NA 14.30 NA NA
NA 13.70 NA NA
NA 13.40 NA NA
NA 13.10 NA NA
NA 12.90 NA NA


![The Removal of Arsenic in Drinking Water in Cambodia using Sand Filters - Final [Molis O'nilia Nou]](https://img.dokumen.tips/doc/110x75/58759c421a28ab6d198b56f7/the-removal-of-arsenic-in-drinking-water-in-cambodia-using-sand-filters-final.jpg)