Embed Size (px)
Citation preview

Back Pain Report
June 2016
North Tyneside
Copyright © 2016 Northumberland Tyne and Wear NHS Foundation Trust and South Tees NHS Foundation
Trust (on behalf of the North East Quality Observatory Service, NEQOS)
BetterKnowledgeBetterCareBetterOutcomes
Page 1 of [email protected]
www.neqos.nhs.uk

<----
NEQOS Back Pain Report This back pain report contains health intelligence produced by NEQOS to support the implementation of the national pathfinder project to provide better pathways of care for people with low back and radicular pain. The NHS England Pathfinder Projects were established to address high value care pathways which cross commissioning and health care boundaries. Many conditions require a pathway of care which moves from the general practitioner through primary care and community services and into secondary care and sometimes specialised services. Difficulties in commissioning across boundaries, however, can cause artificial interruptions in what should be a seamless care pathway. The Pathfinder Projects are designed for all Stakeholders to work collaboratively to examine in depth these health care interfaces and to develop commissioning structures to commission care across the whole pathway. The Trauma Programme of Care Board selected low back pain and radicular pain as the Pathfinder Project as this is a high value care pathway in view of the very large number of patients involved. The future of the pathway is that it is designed to be run in primary care (general practice and community physiotherapy) and referral into secondary specialist care is only at the end of the pathway. Key to the success of the pathway are the Triage and Treat practitioners; the highly trained practitioners, either extended scope physiotherapists or nurse specialists who essentially run the pathway and have access to bookable slots for the core therapies, nerve root blocks, spinal surgical clinic appointments or pain clinic appointments. This reduces very significantly the delays in the previous system and also reduces the “pinball” management that is a feature of so many health care systems. Quality care is less expensive by reducing ineffective or repetitive treatment and by reducing conversion into chronic disability In this profile, the current utilisation of secondary care services for back and radicular pain are shown by CCG and providers, including both NHS Trusts and Independent Sector providers to demonstrate variation in activity regionally and across England. This report is based on the population of patients under the care of CCGs in the Cumbria & North East Region and provides important information about patient flows from these CCGs across all providers within this region. Information on hospital admissions is presented by admission method (elective vs. emergency) and type of procedure (surgery, injections, pain management etc.) undertaken. The aim of this report is to assist both clinicians and commissioners in comparing treatment activity rates between regional providers and against national data to reduce variation and develop evidence based care pathways to improve patient outcomes. Ongoing monitoring of this secondary care activity will evidence where changes implemented through the national pathfinder project for acute low back and radicular pain to provide timely access to evidence based treatments can improve the quality of patient care, provide community based alternatives to secondary care admissions for back pain and reduce secondary care expenditure. It is important to note that this report is based on the cohort of patients with back and/or radicular pain but does not include patients who have back pain due to specific diagnosis such as cancer, infection, spinal trauma, inflammatory arthritis, cauda equine syndrome as these patients have very different treatment pathways of care.
Acknowledgements This work has been funded through the Getting It Right First Time (GIRFT) project that is part of the Department of Health funded Clinically-Led Quality and Efficiency Programme. Acknowledgements to the Health & Social Care Information Centre (HSCIC) as the source of data used in this report and to Professor Greenough and Mr Ashley Cole for their expert clinical guidance and advice.
Page 2 of [email protected]
www.neqos.nhs.uk

<----
The NHS Trusts included for the Cumbria & North East Region are: • The Newcastle Upon Tyne Hospitals NHS Foundation Trust • Northumbria Healthcare NHS Foundation Trust • South Tyneside NHS Foundation Trust (emergency admissions only) • Gateshead Health NHS Foundation Trust • City Hospitals Sunderland NHS Foundation Trust • North Tees & Hartlepool NHS Foundation Trust • South Tees Hospitals NHS Foundation Trust • County Durham & Darlington NHS Foundation Trust • North Cumbria University Hospitals NHS Trust
The Independent Sector Providers included for the Cumbria & North East Region are: • Tyneside Surgical Services • Spire Washington Hospital
Introduction and background Low back pain is extremely common and is the largest single cause of loss of disability adjusted life years, and the largest single cause of years lived with disability in England (Global Burden of Disease, 2013). In terms of disability adjusted life years lost per 100,000, low back pain is responsible for 2,313. By contrast the remainder of musculo-skeletal complaints counts for 911, depression 704 and diabetes 337. It should be borne in mind that this is principally occurring in people of working age, or with families. UK specific data shows that LBP was top cause of years lived with disability in both 1990 and 2010 – with a 12% increase over this time. Back pain accounts for 11% of the entire disability burden from all diseases in the UK; furthermore the burden is increasing both absolutely (3.7% increase) and proportionally (7% to 8.5%). NEQOS have produced CCG and hospital Trust level activity profiles to understand the current position in terms of secondary care activity for back and radicular pain and have worked with a range of key stakeholders from both provider and commissioner organisations to develop the profiles to ensure that the indicators shown are appropriate and relevant to the project. This information needs to be viewed in conjunction with data soon to become available from Arthritis Research UK about the prevalence of back pain and associated risk factors and where possible with locally available data from general practice, including prescribing rates, and onward referrals from primary care (e.g. physiotherapy and radiology). Technical specification Following a data discovery exercise supported by Professor Charles Greenough (National Clinical Director for Spinal Disorders, South Tees NHS Foundation Trust), definitions for low back and radicular pain were developed based on a combination of diagnosis codes (ICD-10) and relevant secondary care procedures were identified using OPCS 4.7 codes. These codes have been supported by Mr Ashley Cole, Chair of Specialised Spinal Surgery Clinical Reference Group (Consultant Orthopaedic Surgeon, Northern General Hospital and Sheffield Children's Hospital).
Data definitions Data Source: Hospital Episode Statistics (Health & Social Care Information Centre via HDIS). Please note that 2014/15 data is currently classed as provisional. CCG populations: Health & Social Care Information Centre (Ages 15 & over as at April 2015) (Data was provided in 5 year ages bands, therefore we were unable to use exact figures for Ages 16 & over) A summary of the data definitions used is shown below: Time period: April 2011 - March 2015 Primary diagnosis = back pain (specific ICD10 codes) Limited to episode 1 Age 16 years and over Private patients are included unless specified Admission costs are based on the national tariff Directly Age & Sex Standardised Rates use the European Standard Populations
Page 3 of [email protected]
www.neqos.nhs.uk

Clinical Commissioning Group (CCG) activity summary
1. Hospital admissions for low back and radicular pain in people aged 16 years and over (April 2014 - March 2015), summarya. Hospital admissions at national level, indicating back pain type and admission method
England Back Radicular Total % Back % Radicular
Elective 134,448 102,808 237,256 56.7% 43.3%
Emergency 39,331 14,309 53,640 73.3% 26.7%
Other 771 951 1,722 44.8% 55.2%
Total 174,550 118,068 292,618 59.7% 40.3%
Cumbria &
North East Back Radicular Total % Back % Radicular
Elective 9,010 7,887 16,897 53.3% 46.7%
Emergency 2,956 1,057 4,013 73.7% 26.3%
Other 69 85 154 44.8% 55.2%
Total 12,035 9,029 21,064 57.1% 42.9%
b. Hospital admissions at CCG level, indicating proportion of admissions for back pain
Table indicates the proportion of admissions for back pain only (and not radicular pain)
Northumberland 50.0% Newcastle North & East 57.8%
Hambleton, Richmondshire & Whitby 50.0% Newcastle West 58.9%
Gateshead 51.8% Darlington 59.8%
North Tyneside 52.8% Cumbria 60.1%
South Tyneside 53.5% South Tees 60.7%
North Durham 53.8% Durham Dales, Easington & Sedgefield 61.4%
Sunderland 56.9% Hartlepool & Stockton-On-Tees 65.8%
57.1% 59.8%
c. Hospital admissions at CCG level, by admission method
Table indicates the proportion of admissions for back and radicular pain that is recorded as elective
Newcastle West 69.9% North Durham 78.4%
Newcastle North & East 70.5% South Tyneside 80.8%
Hambleton, Richmondshire & Whitby 73.5% Sunderland 83.0%
North Tyneside 73.7% Cumbria 83.5%
Gateshead 74.3% Hartlepool & Stockton-On-Tees 85.8%
South Tees 75.9% Durham Dales, Easington & Sedgefield 87.8%
Northumberland 78.0% Darlington 88.9%
80.2% 81.1%Cumbria & North East CCGs England
Cumbria & North East CCGs England
Highlighted CCGs:
North Tyneside
Highlighted CCGs:
North Tyneside
0%
10%
20%
30%
40%
50%
60%
70%
80%
90%
100%
Per
cen
tage
of
All
Ad
mis
sio
ns
Percentage of Admissions that are Elective 01/04/2014 - 31/03/2015 Cumbria & North East CCGs National Average Cumbria & North East CCGs Average
CCG
0%
10%
20%
30%
40%
50%
60%
70%
80%
90%
100%
Per
cen
tage
of
All
Ad
mis
sio
ns
Percentage of Admissions for Back Pain 01/04/2014 - 31/03/2015 All Admission Methods
Cumbria & North East CCGs National Average Cumbria & North East CCGs Average
CCG
What is the data telling us?
In the latest 12 month period there were almost 300,000 admissions for back and radicular pain in England, with 21,064 (7.2%) of these from patients registered within the North East and Cumbria.
At a national level the proportional split for hospital admissions is 60% for back pain and 40% for radicular pain, and at CCG level in the North East and Cumbria the proportion of admissions for back pain ranges from 50.0% to 65.8%.
Approximately 81% of back and radicular pain admissions are elective, with the North East and Cumbria mirroring the national rate. At CCG level in the North East the proportion of elective admissions across CCGs ranges from 69.9% in Newcastle West to 88.9% in Darlington.
Page 4 of [email protected]
www.neqos.nhs.uk

Clinical Commissioning Group (CCG) activity
2. Hospital admissions for low back and radicular pain in people aged 16 years and over (April 2014 - March 2015)
a. Hospital admissions for back pain by CCG (all admission methods), Directly Age & Sex Standardised Admission rate per 100,000 population
All Elective Emergency All Elective Emergency
954.1 705.2 243.5 725.7 570.4 149.6912.8 811.0 97.3 Newcastle West 697.4 493.4 204.0894.7 695.3 190.8 Gateshead 695.3 516.1 169.1828.1 724.6 97.2 Sunderland 686.6 567.7 113.6
799.3 685.1 113.5 Newcastle North & East 642.7 466.2 175.1
779.2 647.3 120.9 South Tees 564.0 427.9 135.7
728.6 589.5 136.0 Hambleton, Richmondshire & Whitby 394.8 282.6 109.7748.6 600.2 142.9 645.6 526.5 115.4
b. Hospital admissions for back and radicular pain (all admission methods), Directly Age & Sex Standardised Admission rate per 100,000 population
c. Elective hospital admissions for back and radicular pain, Directly Age & Sex Standardised Admission rate per 100,000 population
d. Emergency hospital admissions for back and radicular pain, Directly Age & Sex Standardised Admission rate per 100,000 population
CCG name
North Tyneside
CCG name
Durham Dales, Easington & SedgefieldNorthumberlandDarlington
Cumbria & North East CCGs England
South Tyneside
Cumbria
North Durham
Hartlepool & Stockton-On-Tees
Highlighted CCGs:
North Tyneside
North Tyneside
Highlighted CCGs:
North Tyneside
Highlighted CCGs:
0
200
400
600
800
1,000
1,200
1,400
1,600
1,800
Dir
ectl
y A
ge &
Sex
Sta
nd
ard
ised
Rat
e o
f A
dm
issi
on
s p
er
10
0,0
00
Directly Age & Sex Standardised Rate of Admissions per 100,000 Population 01/04/2014 - 31/03/2015 All Admission Methods
Cumbria & North East CCGs National Average Cumbria & North East CCGs Average
CCG
What is the data telling us?
CCG level admissions are presented here as directly age and sex standardised rates (DSR) to enable comparisons between organisations to be made. Nationally, the hospital admission rate (DSR) for back and radicular pain (all admission methods) by CCG ranges from 292 to 1,746 admissions per 100,000 population. The rate for the North East and Cumbria CCGs is varied and 11 of the 14 CCGs highlighted have admission rates higher than the national average, with three CCGs in the top quintile.
0
200
400
600
800
1,000
1,200
1,400
1,600
1,800
Dir
ectl
y A
ge &
Se
x St
and
ard
ised
Rat
e o
f A
dm
issi
on
s p
er 1
00
,00
0
Directly Age & Sex Standardised Rate of Admissions per 100,000 Population 01/04/2014 - 31/03/2015 Elective Admissions only
Cumbria & North East CCGs National Average Cumbria & North East CCGs Average
CCG
0
50
100
150
200
250
300
Dir
ectl
y A
ge &
Sex
Sta
nd
ard
ised
Rat
e o
f A
dm
issi
on
s p
er 1
00
,00
0
Directly Age & Sex Standardised Rate of Admissions per 100,000 Population 01/04/2014 - 31/03/2015 Emergency Admissions only
Cumbria & North East CCGs National Average Cumbria & North East CCGs Average
CCG
Page 5 of [email protected]
www.neqos.nhs.uk

Clinical Commissioning Group (CCG) activity - GP practice level
3. Hospital admissions for low back and radicular pain in people aged 16 years and over (April 2014 - March 2015)Each symbol represents one GP practice
a. Hospital admissions for back pain (Elective admissions), Indirectly Standardised RatioNorth Tyneside
b. Hospital admissions for back pain (Emergency admissions), Indirectly Standardised Ratio
Legend:
North Tyneside
Legend:
North Tyneside
What is the data telling us?
The admission rates for elective and emergency admissions for each GP practice within the CCG are expressed as Indirectly Standardised Ratios with 100 representing the national average. This adjustment has been made due to small numbers and in order that comparisons can be made between practices.
The upper and lower confidence limits on the funnel charts above are based on national data. Each circle represents the constituent GP Practices for the selected CCG(s). All GP practices within the funnel have admission rates that are not significantly different that the national rates with those above the upper blue funnel having significantly higher rates than the national average.
0
50
100
150
200
250
300
350
0 20 40 60 80 100 120
Ind
irec
tly
stan
dar
dis
ed
Rat
io
Expected events
Elective Admissions - Indirectly Standardised Ratios
Upper 3SD limit
Upper 2SD limit
National Average
Lower 2SD limits
Lower 3SD limits
0
50
100
150
200
250
300
350
400
450
500
0 5 10 15 20 25 30
Ind
irec
tly
stan
dar
dis
ed
Rat
io
Expected events
Emergency Admissions - Indirectly Standardised Ratios
Upper 3SD limit
Upper 2SD limit
National Average
Lower 2SD limits
Lower 3SD limits
Page 6 of [email protected]
www.neqos.nhs.uk

4. Indirectly Standardised Ratios for Elective & Emergency Admissions for Back & Radicular Pain, by GP Practice
North Tyneside
Practice Code Practice Name CCG Population 15+ Observed Expected Ratio Observed Expected Ratio
A86005 West Farm Surgery 99C 4,901 28 23.89 117.22 10 5.50 181.89
A86016 Lane End Surgery 99C 7,260 31 36.18 85.69 7 8.22 85.15
A86041 Swarland Avenue Surgery 99C 4,192 18 21.81 82.54 8 4.81 166.28
A87002 Spring Terrace Health Centre 99C 6,065 58 34.22 169.50 18 7.25 248.26
A87003 Portugal Place Health Ctr 99C 10,095 74 52.51 140.93 32 11.31 282.95
A87004 Collingwood Surgery 99C 14,338 123 75.04 163.90 38 16.27 233.58
A87005 Whitley Bay Health Centre 99C 10,785 84 59.31 141.62 27 12.62 213.90
A87006 49 Marine Avenue Surgery 99C 5,283 22 30.63 71.84 13 6.65 195.40
A87007 Forest Hall Health Centre 99C 9,328 58 50.01 115.97 29 10.75 269.69
A87008 Marine Avenue Medical Ctr 99C 5,704 54 30.84 175.11 12 6.66 180.30
A87009 Priory Medical Group 99C 12,152 79 63.80 123.83 23 13.60 169.12
A87011 Beaumont Park Surgery 99C 5,572 56 31.07 180.26 15 6.46 232.27
A87012 Wideopen Medical Centre 99C 6,116 39 34.20 114.02 10 7.39 135.40
A87013 Bewicke Medical Centre 99C 8,282 71 40.84 173.85 19 8.98 211.51
A87014 Earsdon Park Medical Practice 99C 3,451 22 17.14 128.33 14 3.91 357.64
A87015 Appleby Surgery 99C 5,177 20 29.00 68.96 22 6.29 349.96
A87016 The Village Green Surgery 99C 8,137 57 41.87 136.14 23 9.04 254.29
A87017 Woodlands Park Health Ctr 99C 4,611 28 26.34 106.30 <6 5.62 53.34
A87019 Nelson Medical Group 99C 4,916 27 26.13 103.32 11 5.70 192.90
A87020 Monkseaton Medical Centre 99C 7,692 33 42.27 78.07 17 9.03 188.31
A87022 Northumberland Park Medical Group 99C 4,275 29 20.60 140.79 8 4.55 175.82
A87023 The Smith Practice 99C 4,632 51 24.09 211.68 16 5.21 307.12
A87027 Garden Park Surgery 99C 5,602 54 27.93 193.36 12 5.98 200.78
A87029 Park Road Medical Pract 99C 4,094 35 20.60 169.92 9 4.67 192.59
A87030 Redburn Park Medical Centre 99C 3,902 34 16.54 205.54 17 3.93 432.86
A87600 Park Parade Practice 99C 3,611 26 19.77 131.49 <6 4.28 116.86
A87612 Wellspring Medical Pract. 99C 4,399 25 22.69 110.20 8 4.93 162.11
A87615 Preston & Austin Practice 99C 3,864 34 19.51 174.24 12 4.17 287.61
Y02710 Battle Hill Health Centre 99C 2,681 13 10.39 125.07 9 2.55 353.43
Indirectly Standardised Ratios that are coloured Red are higher than 3 standard deviations from the mean. Those coloured Yellow are between 2 and 3 higher
standard deviations from the mean.
Elective Emergency
Page 7 of [email protected]
www.neqos.nhs.uk

Hospital Trust activity
5. Hospital admissions for low back and radicular pain in people aged 16 years and over (April 2014 - March 2015)a. Number of hospital admissions for back pain (all admission methods, NHS Trusts only)
Newcastle Upon Tyne Hospitals 4,595 County Durham & Darlington 1,472
Northumbria 3,215 North Cumbria 807South Tees 2,653 Gateshead 501North Tees & Hartlepool 2,492 South Tyneside 129Sunderland 1,600
Cumbria & North East NHS Trusts 17,464 England 251,444
b. Number of admissions per hospital Trust, by admission method(Cumbria & North East Providers only)
What is the data telling us?
The total number of admissions for back pain is presented due to the absence of a relevant denominator at hospital Trust level. Activity for the 9 NHS Trusts is to some degree proportional to the size of the Trust and is spread across the quintile chart. South Tyneside only has emergency admissions and is therefore not included in the charts reporting elective activity.
The proportion of hospital activity for back pain which is classed as elective care is similar to the England rate for the North East and Cumbria providers overall, however at NHS Trust level the proportion (excluding South Tyneside) this varies between 48.7% at Gateshead to 88.2% at North Tees and Hartlepool. All NHS activity at independent sector providers is classed as elective.
0
1,000
2,000
3,000
4,000
5,000
6,000
7,000
8,000
Nu
mb
er
of
Ad
mis
sio
ns
Number of Admissions per Provider 01/04/2014 - 31/03/2015 All Admissions
Cumbria & North East NHS Trusts
Trusts
0%
10%
20%
30%
40%
50%
60%
70%
80%
90%
100%
Pe
rce
nta
ge o
f A
dm
issi
on
s
Hospital Admissions for Back Pain by Admission Method 01/04/2014 - 31/03/2015
Elective Emergency Other
Page 8 of [email protected]
www.neqos.nhs.uk

Hospital Trust activity
5. Hospital admissions for low back and radicular pain in people aged 16 years and over (April 2014 - March 2015)c. Elective admissions for back and radicular pain, by treatment specialty(Cumbria & North East Providers only)
Provider Name
Pain
Management &
Anaesthetics
Trauma &
Orthopaedics
Spinal Surgery
Service
Interventional
Radiology Neurosurgery Other Functions Total
Newcastle Upon Tyne Hospitals 529 <6 1,783 1,258 70 89 3,729
Northumbria 787 1,574 - - - 15 2,376
South Tyneside - - - - - <6 -
Gateshead 225 <6 - - - 15 240
Sunderland 489 823 - - - 16 1,328
North Tees & Hartlepool 771 1,413 - - - 14 2,198
South Tees 891 765 32 12 429 24 2,153
County Durham & Darlington 931 <6 - - - 70 1,001
North Cumbria 535 <6 - - - 8 543
Tyneside Surgical Services 188 103 60 - - <6 351
Spire Washington Hospital - 784 <6 - 56 - 840
BMI Woodlands Hospital 302 265 - - - <6 567
Total 5,648 5,727 1,875 1,270 555 251 15,326
d. Elective admissions for injections for back and radicular pain, by injection type and treatment specialty (national data)
Updated with new codes. Not automatically updated yet.
BUT doesn't need to be updated
What is the data telling us?
For elective activity the treatment specialty code indicated within the hospital data varies by hospital trust. Overall the most common specialties are trauma and orthopaedics and pain management, however for Newcastle Hospitals the highest volume of activity is recorded within spinal surgery and interventional radiology.
The second table shows the different types of injections being undertaken within each of the treatment function codes and demonstrates that nationally over 62% (104,751) of injections take place within Pain Management/Anaesthetics and 25% of injections are undertaken within Trauma and Orthopaedics.
The most common injection type is facet joint injections, which mainly take place within Pain Management/Anaesthetics treatment function, but are also being used in Trauma and Orthopaedics, Spinal Surgery Service and Neurosurgery.
Page 9 of [email protected]
www.neqos.nhs.uk

Hospital Trust activity from CCGs
a. Hospital elective admissions by CCG population (percentage of activity)
b. Hospital elective admissions by CCG population (actual activity)
6. Patient flows from CCG to Hospital Trust for back and radicular pain in people aged 16 years and over (April 2014 - March
2015)
What is the data telling us?
There is variation between hospital trusts in terms of the number of patients from each of the CCGs that are admitted for back and radicular pain.
Newcastle upon Tyne hospitals has activity from at least ten of the north east CCGs, whereas with North Cumbria, Gateshead and South Tyneside trusts the majority of activity comes from one main CCG.
The data is shown in two ways, indicating both the proportion and amount of activity relating to each CCG.
535
1,437
463
458
559
690
359
29 259
382
199
24
141
9
847
338
7
42
44
313
57
142
547 357
503
43 141
156
1,385
197
12
68
900
402 166
23
525
301
29 31 84 164
19
0%
10%
20%
30%
40%
50%
60%
70%
80%
90%
100%
Per
cen
tage
of
adm
issi
on
s
Elective Admissions by NHS Trust from each CCG 01/04/2014 - 31/03/2015 Other
Hambleton, Richmondshire& WhitbyCumbria
South Tees
Hartlepool & Stockton-On-TeesDarlington
Durham Dales, Easington &SedgefieldNorth Durham
Sunderland
Gateshead
South Tyneside
North Tyneside
Newcastle West
Newcastle North & East
Northumberland
535
1,437 463
10
458
6
559 690
359
259
382
199
141
847
338
42
313
57
142
547 357
503 43 141
156
1,385
197
900
402
166
23
525
301
29
84 164
-
500
1,000
1,500
2,000
2,500
3,000
3,500
4,000
Nu
mb
er o
f ad
mis
sio
ns
Elective Admissions by NHS Trust from each CCG 01/04/2014 - 31/03/2015 Other
Hambleton, Richmondshire& WhitbyCumbria
South Tees
Hartlepool & Stockton-On-TeesDarlington
Durham Dales, Easington &SedgefieldNorth Durham
Sunderland
Gateshead
South Tyneside
North Tyneside
Newcastle West
Newcastle North & East
Northumberland
Page 10 of [email protected]
www.neqos.nhs.uk

Hospital Trust activity from CCGs
c. Hospital elective admissions for surgery by CCG population (percentage of activity)
d. Hospital elective admissions for surgery by CCG population (actual activity)
6. Patient flows from CCG to Hospital Trust for back and radicular pain in people aged 16 years and over (April 2014 - March
2015)
What is the data telling us?
There is variation between hospital trusts in terms of the number of patients from each of the CCGs that are admitted for sur gery for back and radicular pain. In the North East and Cumbria, Newcastle and South Tees do the highest volume of spinal surgery.
Newcastle Hospitals and South Tees providers are more likely to take patients from several different CCGs across the region c ompared to the other Trusts which predominantly admit patients from the CCG(s) where they are located.
The data is shown in two ways, indicating both the proportion and number of admissions relating to each CCG.
133
94
86
102
116
38
104
15
99
28
84
97
19
12
11
45 169
49
121
54
11
183
124 13
6
6
118
23 76
0%
10%
20%
30%
40%
50%
60%
70%
80%
90%
100%
Per
cen
tage
of
adm
issi
on
s
Elective Surgery Admissions by NHS Trust from each CCG 01/04/2014 - 31/03/2015 Other
Hambleton, Richmondshire& WhitbyCumbria
South Tees
Hartlepool & Stockton-On-TeesDarlington
Durham Dales, Easington &SedgefieldNorth Durham
Sunderland
Gateshead
South Tyneside
North Tyneside
Newcastle West
Newcastle North & East
Northumberland
133 94
86
102
116
38
104
15
99
28
84
97
19
12
11
45
169
49
121
54
183
124
13
6
118
6
23
76
-
100
200
300
400
500
600
700
800
900
1,000
Nu
mb
er o
f ad
mis
sio
ns
Elective Surgery Admissions by NHS Trust from each CCG 01/04/2014 - 31/03/2015 Other
Hambleton, Richmondshire& WhitbyCumbria
South Tees
Hartlepool & Stockton-On-TeesDarlington
Durham Dales, Easington &SedgefieldNorth Durham
Sunderland
Gateshead
South Tyneside
North Tyneside
Newcastle West
Newcastle North & East
Northumberland
Page 11 of [email protected]
www.neqos.nhs.uk

Hospital Trust activity from CCGs
e. Hospital elective admissions for injections by CCG population (percentage of activity)
f. Hospital elective admissions for injections by CCG population (actual activity)
6. Patient flows from CCG to Hospital Trust for back and radicular pain in people aged 16 years and over (April 2014 - March
2015)
What is the data telling us?
There is variation between hospital trusts in terms of the number of patients from each of the CCGs that are admitted for injections for back and radicular pain. Newcastle, Northumbria and North Tees & Hartlepool have the highest volume of activity for injections.
Newcastle Hospitals and South Tees providers are more likely to take patients from several different CCGs across the region compared to the other Trusts which predominantly admit patients from the CCG(s) where they are located.
The data is shown in two ways, indicating both the proportion and number of admissions relating to each CCG.
289
1,211
283
273
318
578
210
219
217
37
16
82
669
180 35
19
224
32
116
449
131
381
37
67
119
1,117
115
51
603
224 138
6
392
140
13 24 55 58 13
0%
10%
20%
30%
40%
50%
60%
70%
80%
90%
100%
Pe
rce
nta
ge o
f ad
mis
sio
ns
Elective Injections Admissions by NHS Trust from each CCG 01/04/2014 - 31/03/2015 Other
Hambleton, Richmondshire& WhitbyCumbria
South Tees
Hartlepool & Stockton-On-TeesDarlington
Durham Dales, Easington &SedgefieldNorth Durham
Sunderland
Gateshead
South Tyneside
North Tyneside
Newcastle West
Newcastle North & East
Northumberland
289
1,211
283
273
318
578
210
219
217
37
82
669
180
35
224
32
116
449
131
381 37
67
119
1,117
115
603
224 138
392
140
13
24
55
58
13
-
500
1,000
1,500
2,000
2,500
Nu
mb
er o
f ad
mis
sio
ns
Elective Injections Admissions by NHS Trust from each CCG 01/04/2014 - 31/03/2015 Other
Hambleton, Richmondshire& WhitbyCumbria
South Tees
Hartlepool & Stockton-On-TeesDarlington
Durham Dales, Easington &SedgefieldNorth Durham
Sunderland
Gateshead
South Tyneside
North Tyneside
Newcastle West
Newcastle North & East
Northumberland
Page 12 of [email protected]
www.neqos.nhs.uk

CCG activity to Hospital Trust
7. Patient flows to Hospital Trusts from CCGs for back pain in people aged 16 years and over (April 2014 - March 2015)a. Hospital elective admissions by CCG population (percentage of activity)
b. Hospital elective admissions from each CCG (actual activity)
What is the data telling us?
There is variation between CCGs in terms of the number of the number of hospital trusts that their patients are admitted to. DDES CCG patients attend five of the acute hospital trusts as well as using an Independent Sector Provider, Darlington CCG use three acute hospital trusts and in contrast the Newcastle CCGs almost solely use Newcastle Hospitals.
Activity is highest for Cumbria CCG and is spread across several hospital trusts, including Trusts outside of North East and Cumbria region. Over 85% of activity for Hartlepool & Stockton on Tees CCG is at North Tees & Hartlepool FT and over 91% of South Tees CCG activity is at South Tees FT. Darlington CCG has the highest proportion of Independent Sector activity.
The data is shown in two ways, indicating both the proportion and amount of activity relating to each hospital trust.
535
463 458
559 359 382
141
338
57 402
1,437
10
690
166
29
199
259 24
847
42
142
20
547
43
1,385
68 21
8
44
357
141
197
900 301
313
503
156
525
11 31
27
100
266 296
389
174
370
30 25
700
27
1,167
14
0%
10%
20%
30%
40%
50%
60%
70%
80%
90%
100%
No
rth
um
ber
lan
d
New
cast
le N
ort
h&
Eas
t
New
cast
le W
est
No
rth
Tyn
esid
e
Sou
th T
ynes
ide
Gat
esh
ead
Sun
der
lan
d
No
rth
Du
rham
Du
rham
Dal
es,
Easi
ngt
on
&Se
dge
fiel
d
Dar
lingt
on
Har
tlep
oo
l &St
ock
ton
-On
-Tee
s
Sou
th T
ees
Cu
mb
ria
Ham
ble
ton
,R
ich
mo
nd
shir
e &
Wh
itb
y
Pe
rce
nta
ge o
f ad
mis
sio
ns
Elective Admissions by CCG to each Provider 01/04/2014 - 31/03/2015 Other
Independent SectorProviders
North Cumbria
County Durham &Darlington
South Tees
North Tees &Hartlepool
Sunderland
Gateshead
South Tyneside
Northumbria
Newcastle Upon TyneHospitals
535 463 458 559 359 382
141 338
57 402
1,437
690
166 199 259 847
142
547
1,385
68
44
357
141
197
900
301
313
503
156
525 100 266
296
389
174
370
700
1,167
-
500
1,000
1,500
2,000
2,500
3,000
3,500
No
rth
um
ber
lan
d
New
cast
le N
ort
h&
Eas
t
New
cast
le W
est
No
rth
Tyn
esi
de
Sou
th T
ynes
ide
Gat
esh
ead
Sun
der
lan
d
No
rth
Du
rham
Du
rham
Dal
es,
Easi
ngt
on
&Se
dge
fiel
d
Dar
lingt
on
Har
tlep
oo
l &St
ock
ton
-On
-Tee
s
Sou
th T
ees
Cu
mb
ria
Ham
ble
ton
,R
ich
mo
nd
shir
e &
Wh
itb
y
Nu
mb
er o
f ad
mis
sio
ns
Elective Admissions by CCG to each Provider 01/04/2014 - 31/03/2015 Other
Independent SectorProviders
North Cumbria
County Durham &Darlington
South Tees
North Tees &Hartlepool
Sunderland
Gateshead
South Tyneside
Northumbria
Newcastle Upon TyneHospitals
Page 13 of [email protected]
www.neqos.nhs.uk

CCG activity to Hospital Trust
7. Patient flows to Hospital Trusts from CCGs for back pain in people aged 16 years and over (April 2014 - March 2015)c. Hospital elective admissions for surgery by CCG population (percentage of activity)
d. Hospital elective admissions for surgery from each CCG (actual activity)
What is the data telling us?
There is variation between CCGs in terms of the number of hospital trusts to which their patients are admitted.
Activity is highest for Cumbria, DDES, North Durham and Northumberland CCGs. These CCGs use multiple NHS and independent sector providers.
Cumbria, North Durham and Sunderland CCGs are the highest users of Independent Sector activity in the North East and Cumbria.
The data is shown in two ways, indicating both the proportion and amount of activity relating to each hospital trust.
133
86 102
116 104 99
28
97
12
124
94 38
13
15
84
11
45
121
11 6
19
169
49
54
183
6
118
8 9 16
37 65
109
26
22
124
134
0%
10%
20%
30%
40%
50%
60%
70%
80%
90%
100%
No
rth
um
ber
lan
d
New
cast
le N
ort
h&
Eas
t
New
cast
le W
est
No
rth
Tyn
esid
e
Sou
th T
ynes
ide
Gat
esh
ead
Sun
der
lan
d
No
rth
Du
rham
Du
rham
Dal
es,
Easi
ngt
on
&Se
dge
fiel
d
Dar
lingt
on
Har
tlep
oo
l &St
ock
ton
-On
-Tee
s
Sou
th T
ees
Cu
mb
ria
Ham
ble
ton
,R
ich
mo
nd
shir
e &
Wh
itb
y
Per
cen
tage
of
adm
issi
on
s
Elective Surgery Admissions by CCG to each Provider 01/04/2014 - 31/03/2015 Other
Independent SectorProviders
South Tees
North Tees &Hartlepool
Sunderland
Northumbria
Newcastle Upon TyneHospitals
133 86 102 116 104 99
28
97
12
124
94
38 13 15
84
11
45 121
11 6
19
169
49
54
183
6
118
8
9
16 37 65
109
26
22
124
134
-
50
100
150
200
250
300
350
400
450
No
rth
um
ber
lan
d
New
cast
le N
ort
h&
Eas
t
New
cast
le W
est
No
rth
Tyn
esi
de
Sou
th T
ynes
ide
Gat
esh
ead
Sun
der
lan
d
No
rth
Du
rham
Du
rham
Dal
es,
Easi
ngt
on
&Se
dge
fiel
d
Dar
lingt
on
Har
tlep
oo
l &St
ock
ton
-On
-Tee
s
Sou
th T
ees
Cu
mb
ria
Ham
ble
ton
,R
ich
mo
nd
shir
e &
Wh
itb
y
Nu
mb
er
of
adm
issi
on
s
Elective Surgery Admissions by CCG to each Provider 01/04/2014 - 31/03/2015 Other
Independent SectorProviders
South Tees
North Tees &Hartlepool
Sunderland
Northumbria
Newcastle Upon TyneHospitals
Page 14 of [email protected]
www.neqos.nhs.uk

CCG activity to Hospital Trust
7. Patient flows to Hospital Trusts from CCGs for back pain in people aged 16 years and over (April 2014 - March 2015)e. Hospital elective admissions for injections by CCG population (percentage of activity)
f. Hospital elective admissions for injections from each CCG (actual activity)
What is the data telling us?
There is variation between CCGs in terms of the number of hospital trusts to which their patients are admitted for injections.
Activity is highest for Cumbria and Northumberland CCGs. Cumbria CCG uses at least 5 providers for injections compared to Northumberland CCG who uses only two providers with the majority of admissions (80%) to Northumbria Healthcare.
Darlington, North Durham and Cumbria CCGs are the highest users of Independent Sector activity in the North East and Cumbria for injections. The data is shown in two ways, indicating both the proportion and amount of activity relating to each hospital trust.
289
283 273
318 210 217
82
180
32 224
1,211
8 6
578
6
8
7
138
37
219
16
669
35
116
8
13 449
37
1,117
51 14
19
131
67
115
603
140 224
381
119 392
11 9 22
16
76
207
218
250
136
322
25 21
543
19
831
6
0%
10%
20%
30%
40%
50%
60%
70%
80%
90%
100%
No
rth
um
ber
lan
d
New
cast
le N
ort
h&
Eas
t
New
cast
le W
est
No
rth
Tyn
esid
e
Sou
th T
ynes
ide
Gat
esh
ead
Sun
der
lan
d
No
rth
Du
rham
Du
rham
Dal
es,
Easi
ngt
on
&Se
dge
fiel
d
Dar
lingt
on
Har
tlep
oo
l &St
ock
ton
-On
-Tee
s
Sou
th T
ees
Cu
mb
ria
Ham
ble
ton
,R
ich
mo
nd
shir
e &
Wh
itb
y
Pe
rce
nta
ge o
f ad
mis
sio
ns
Elective Injections Admissions by CCG to each Provider 01/04/2014 - 31/03/2015 Other
Independent SectorProviders
North Cumbria
County Durham &Darlington
South Tees
North Tees &Hartlepool
Sunderland
Gateshead
Northumbria
Newcastle Upon TyneHospitals
289 283 273 318 210 217 82 180
32 224
1,211
578
138 219 669
116
8
449
37
1,117
51
131
67
115
603
140
224
381
119
392
11
16
76 207
218
250
136
322
21
543
831
-
500
1,000
1,500
2,000
2,500
No
rth
um
ber
lan
d
New
cast
le N
ort
h&
Eas
t
New
cast
le W
est
No
rth
Tyn
esi
de
Sou
th T
ynes
ide
Gat
esh
ead
Sun
der
lan
d
No
rth
Du
rham
Du
rham
Dal
es,
Easi
ngt
on
&Se
dge
fiel
d
Dar
lingt
on
Har
tlep
oo
l &St
ock
ton
-On
-Tee
s
Sou
th T
ees
Cu
mb
ria
Ham
ble
ton
,R
ich
mo
nd
shir
e &
Wh
itb
y
Nu
mb
er o
f ad
mis
sio
ns
Elective Injections Admissions by CCG to each Provider 01/04/2014 - 31/03/2015 Other
Independent SectorProviders
North Cumbria
County Durham &Darlington
South Tees
North Tees &Hartlepool
Sunderland
Gateshead
Northumbria
Newcastle Upon TyneHospitals
Page 15 of [email protected]
www.neqos.nhs.uk

Hospital Trust activity (national level)
a. Hospital admissions by procedure type over time (all admission types)
b. Elective hospital admissions by surgery procedure type over time
c. Hospital admissions by injection procedure type over time
8. Hospital admissions for low back and radicular pain in people aged 16 years and over (1st April 2011 - 31st March 2015)
What is the data telling us? These charts show national trends in the types of procedures undertaken during elective admissions including a group where no procedure was undertaken during their admission. There is also a category listed as 'procedure not linked to back pain' which reports admission activity where there is a primary diagnosis of back pain but with a procedure not linked to back pain.
The main procedure type relating to elective admissions are for back and radicular pain injections which has increased from a combined total of just under 140,000 to 170,000 episodes over the four year period. This is in stark contrast to number of admissions related to surgery which has remained relatively constant at 30,000 admissions per year. The proportion of admissions with no procedure reported has remained at approximately 15-16% of all activity.
The charts in sections b and c show the elective admissions over time specifically for different groups of surgery procedures and injections.
-
10,000
20,000
30,000
40,000
50,000
60,000
70,000
80,000
90,000
100,000
2011/12 2012/13 2013/14 2014/15
Nu
mb
er
of
adm
issi
on
s
Total Number of Admissions by Procedure Type & Year
Radicular pain injection
Back pain injections
No procedure done
Surgery
Procedure not linked toback pain
Pain managementexcluding injections
Imaging
-
2,000
4,000
6,000
8,000
10,000
12,000
14,000
16,000
2011/12 2012/13 2013/14 2014/15
Nu
mb
er o
f ad
mis
sio
ns
Elective Admissions by Surgery Group & Year
Decompression
Discectomy
Posterior lumbar fusion
Revision decompression
All other surgery
-
10,000
20,000
30,000
40,000
50,000
60,000
70,000
2011/12 2012/13 2013/14 2014/15
Nu
mb
er o
f ad
mis
sio
ns
Elective Admissions by Injection Group & Year
Injection facet joint
Epidural sacral
Spinal nerve rootinjection
Epidural lumbar
Other backinjection
Epidural (notspecified)
Page 16 of [email protected]
www.neqos.nhs.uk

Hospital Trust activity
a. Elective hospital admissions by procedure type (national level including all providers)
b. Number of elective admissions per hospital Trust, by procedure type (percentage of activity)
(Cumbria & North East Providers only)
c. Number of elective admissions per hospital Trust, by procedure type (actual activity)
(Cumbria & North East Providers only)
9. Elective hospital admissions for low back and radicular pain in people aged 16 years and over (April 2014 - March 2015)
What is the data telling us?
The table shows the number of procedures done in the latest 12 month period, by procedure type, with injections being the most common elective procedure. Nationally only 4.4% of elective admissions have no procedure recorded (compared to 15-16% of all admission types - see previous sheet).
Eight of the North East Trusts have a higher proportion of elective activity for injections than the England rate and it is possible that the variation is due to differences in the point of delivery of care across hospital Trusts (for example it is possible that activity may also take place as outpatient procedures).
The data is shown in two ways, indicating both the proportion and amount of activity relating to each procedure.
812 461 26
430
997
253
494 253 137
158
290
4,311 74,701
1,314
1,533
20
636
763
896
246 152 133
414
206
6,313 93,605
908
153 117 216
681
42 227
35
2,380 27,668
213
13
52 50 74
50 12
20 13
526 10,552 203
54
33
73 76 105
115 102
20
792 12,765
246 133
150
15 78 120 96 25 15 28 914 16,797
0%
10%
20%
30%
40%
50%
60%
70%
80%
90%
100%
Per
cen
tage
of
adm
issi
on
s
Elective Admissions for Back Pain by Procedure Type, 01/04/2014 - 31/03/2015
Back pain Injections Radicular Pain Injections Surgery No procedure done Procedure not linked to Back Pain Pain Management excluding Injections Imaging
812 461 430
997
253 494
253 137 158 290
1,314
1,533
636
763
896 246
152 133
414 206
908
153
117
216
681
227
213
25
74
50
203
76 105
115
102
246
133
150
78 120
96
-
500
1,000
1,500
2,000
2,500
3,000
3,500
4,000
Nu
mb
er
of
adm
issi
on
s
Elective Admissions for Back Pain by Procedure Type, 01/04/2014 - 31/03/2015
Back pain Injections Radicular Pain Injections Surgery No procedure done Procedure not linked to Back Pain Pain Management excluding Injections Imaging
Page 17 of [email protected]
www.neqos.nhs.uk

Hospital Trust activity
d. Number of elective admissions for injections per hospital Trust, by injection type (percentage of activity)
(Cumbria & North East Providers only)
e. Number of elective admissions for injections per hospital Trust, by injection type (actual activity)
(Cumbria & North East Providers only)
f. Proportion of elective admissions for lumbar facet joint injections, by hospital trust
From FT4b Data
9. Elective hospital admissions for low back and radicular pain in people aged 16 years and over (April 2014 - March 2015)
What is the data telling us?
Spinal nerve root and facet joint injections are those most frequently done within the North East and Cumbria, constituting almost 75% of injection activity compared to 55% across England as a whole. The data is shown in two ways, indicating both the proportion and amount of activity relating to each CCG.
The proportion of facet joint injections done at Trust level ranges from 15% to 61% compared to the England figure of 37%.
56
349
14 296 563 243 156
149
42
157 148 2,173
61,147
1,258
1,184
6
340
200
653
90 91
257
58 4,140
32,458
757
427
7
369
772
196
422
248 106
156
226
3,686 61,463
55 34
19
61 225
57 72 31 64
625 13,238
0%
10%
20%
30%
40%
50%
60%
70%
80%
90%
100%
Pe
rce
nta
ge o
f ad
mis
sio
ns
Elective Admissions for Back Pain for Injections, by Injection Type, 01/04/2014 - 31/03/2015
Epidurals Spinal nerve root injection Injection facet joint Other back injections
56
349
14
296
563
243 156 149 157 148
1,258
1,184
6
340
200 653
90 91
257 58
757 427
7
369
772
196
422
248 106
156
226
55 34
19
61
225
57
72
64
-
500
1,000
1,500
2,000
2,500
Nu
mb
er
of
adm
issi
on
s
Elective Admissions for Back Pain for Injections, by Injection Type, 01/04/2014 - 31/03/2015
Epidurals Spinal nerve root injection Injection facet joint Other back injections
0%
10%
20%
30%
40%
50%
60%
70%
Pro
po
rtio
n o
f in
ject
ion
s w
hic
h w
ere
fo
r fa
cet
join
t
Proportion of Elective Admissions for Injections which relate to Facet Joint Injections, 01/04/2014 - 31/03/2015
Injection facet joint % Cumbria & North East Providers Average England Average
Page 18 of [email protected]
www.neqos.nhs.uk

Hospital Trust activity
g. Number of elective admissions for surgery per hospital Trust, by surgery type (percentage of activity)
(Cumbria & North East Providers only)
h. Number of elective admissions for surgery per hospital Trust, by surgery type (actual activity)
(Cumbria & North East Providers only)
9. Elective hospital admissions for low back and radicular pain in people aged 16 years and over (April 2014 - March 2015)
What is the data telling us? The charts above show the range in activity relating specifically to elective admissions for surgery, by type of surgery, for the North East and Cumbria Providers. Although the profile for the region overall is relatively similar to the England profile, there are wide variations at provider level.
Decompression is the most common surgical procedure for back pain in five providers and the number of fusions at North Tees & Hartlepool is notably higher than the other providers in the region.
The data is shown in two ways, indicating both the proportion and amount of activity relating to each surgery type.
593
34
87
36
474
13
124
30
1,391 14,509
83
52
6
89
25 262
5,014
62
33
16
120 1,631
88 13 30
135 883
35
25
115
26
83
290 3,115
47
36 56
29 182 2,516
0%
10%
20%
30%
40%
50%
60%
70%
80%
90%
100%
Per
cen
tage
of
adm
issi
on
s
Elective admissions for back pain for surgery, by surgery type, 01/04/2014 - 31/03/2015
Decompression Discectomy Revision decompression Decompression + fusion Posterior lumbar fusion All Other Surgery
593
34 87
36
474
124 30
83
52
89
25
62
33
16
88
13
30
35
25 115
26
83
47
36 56
29
-
100
200
300
400
500
600
700
800
900
1,000
Nu
mb
er
of
adm
issi
on
s
Elective admissions for back pain for surgery, by surgery type, 01/04/2014 - 31/03/2015
Decompression Discectomy Revision decompression Decompression + fusion Posterior lumbar fusion All Other Surgery
Page 19 of [email protected]
www.neqos.nhs.uk

CCG activity by back pain procedure group
a. Number of elective admissions for surgery per CCG, by surgery type (Cumbria & North East only)
b. Number of elective admissions for injections per CCG, by injection type (Cumbria & North East only)
c. Number of elective admissions for lumbar facet joint injections, by CCG (Cumbria & North East only)
From CCG3 Data
10. Elective hospital admissions for low back and radicular pain in people aged 16 years and over (April 2014 - March 2015)
What is the data telling us?
Chart 10a shows the range in the activity rate per 100,000 relating specifically to elective admissions for surgery, by type of surgery, for the North East and Cumbria CCGs, with chart 9b showing the same for injections.
Hartlepool & Stockton-on-Tees CCG have a notably higher rate of posterior lumbar fusions compared to the England rates (27 vs. 7 per 100,000). Eight CCGs have higher rates for all types of injections compared to England rates. Proportion of lumbar facet joint injections vary from 15% at Hambleton, Richmondshire and Whitby CCG to 48% at Darlington CCG.
0%
10%
20%
30%
40%
50%
60%
Ham
ble
ton
,R
ich
mo
nd
shir
e&
Wh
itb
y
Sou
th T
ees
No
rth
um
ber
lan
d
No
rth
Tyn
esi
de
Gat
esh
ead
Sun
der
lan
d
Sou
th T
ynes
ide
No
rth
Du
rham
New
cast
leW
est
Har
tlep
oo
l &St
ock
ton
-On
-Te
es
New
cast
leN
ort
h &
Eas
t
Du
rham
Dal
es,
Easi
ngt
on
&Se
dge
fiel
d
Cu
mb
ria
Dar
lingt
on
Pro
po
rtio
n o
f in
ject
ion
s w
hic
h w
ere
for
face
t jo
int
Proportion of Elective Admissions for Injections which relate to Facet Joint Injections 01/04/2014 - 31/03/2015
Injection facet joint % Cumbria & North East Average England Average
89 13 18
63 71 44 106
70 128 129
168
73 140
26 92
130
332
104 130
289
168
132
155
125
109 104 82
144
90
88
148 69
129
91
115
147
140
83
139
134
227 300
221
50
227
23
152
131
9
13
9
18
24
21
11
55
86
58
14
31
15
26
28
-
100
200
300
400
500
600
700
No
rth
um
ber
lan
d
New
cast
leN
ort
h &
Eas
t
New
cast
leW
est
No
rth
Tyn
esid
e
Sou
thTy
nes
ide
Gat
esh
ead
Sun
der
lan
d
No
rth
Du
rham
Du
rham
Dal
es,
Easi
ngt
on
&…
Dar
lingt
on
Har
tlep
oo
l &St
ock
ton
-On
-Te
es
Sou
th T
ees
Cu
mb
ria
Ham
ble
ton
,R
ich
mo
nd
shir
e &
Wh
itb
y
Cu
mb
ria
&N
ort
h E
ast
Engl
andN
um
ber
of
adm
issi
on
s p
er
10
0,0
00
po
pu
lati
on
Elective Admissions for Back Pain for Injections, by Injection Type, 01/04/2014 - 31/03/2015 Epidurals Spinal nerve root injection Injection facet joint Other back injections
48 42 55 54
75 57
47
70 74 62
29
55 62 74
57
33
18
7
7 15
13
8
13 9
9
6
13 14
16
11
12
9 8
8
6
9 7
7
7
11 6
7
6
7
6 9 7
8
9
14
14 17
7
27
6
7
10
7
11 8 8
7
6
15
8
6
7
6
-
20
40
60
80
100
120
140N
ort
hu
mb
erla
nd
New
cast
leN
ort
h &
Eas
t
New
cast
le W
est
No
rth
Tyn
esi
de
Sou
th T
ynes
ide
Gat
esh
ead
Sun
der
lan
d
No
rth
Du
rham
Du
rham
Dal
es,
Easi
ngt
on
&Se
dge
fiel
d
Dar
lingt
on
Har
tlep
oo
l &St
ock
ton
-On
-Te
es
Sou
th T
ees
Cu
mb
ria
Ham
ble
ton
,R
ich
mo
nd
shir
e&
Wh
itb
y
Cu
mb
ria
&N
ort
h E
ast
Engl
and
Nu
mb
er
of
adm
issi
on
s p
er
10
0,0
00
po
pu
lati
on
Elective Admissions for Back Pain for Surgery, by Surgery Type, 01/04/2014 - 31/03/2015 Decompression Discectomy Revision decompression Decompression + fusion Posterior lumbar fusion All Other Surgery
Page 20 of [email protected]
www.neqos.nhs.uk
Hospital Trust activity
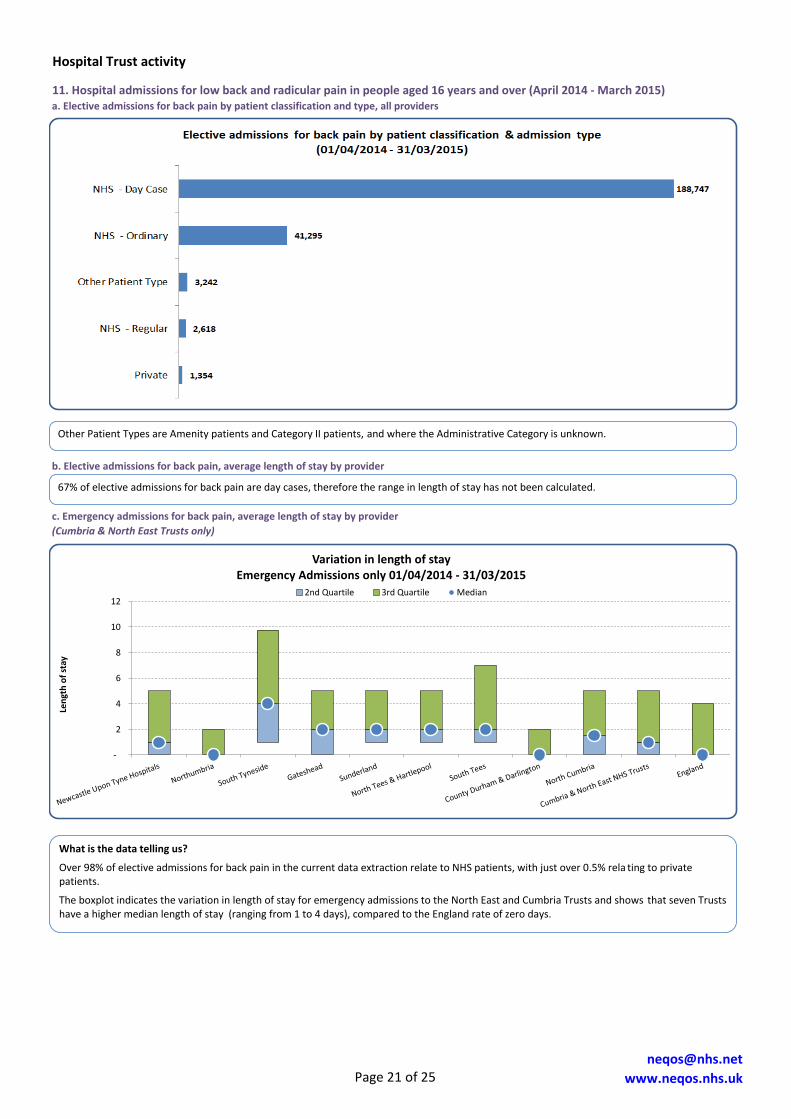
11. Hospital admissions for low back and radicular pain in people aged 16 years and over (April 2014 - March 2015)a. Elective admissions for back pain by patient classification and type, all providers
b. Elective admissions for back pain, average length of stay by provider
c. Emergency admissions for back pain, average length of stay by provider
(Cumbria & North East Trusts only)
What is the data telling us?
Over 98% of elective admissions for back pain in the current data extraction relate to NHS patients, with just over 0.5% rela ting to private patients.
The boxplot indicates the variation in length of stay for emergency admissions to the North East and Cumbria Trusts and shows that seven Trusts have a higher median length of stay (ranging from 1 to 4 days), compared to the England rate of zero days.
67% of elective admissions for back pain are day cases, therefore the range in length of stay has not been calculated.
Other Patient Types are Amenity patients and Category II patients, and where the Administrative Category is unknown.
-
2
4
6
8
10
12
Len
gth
of
stay
Variation in length of stay Emergency Admissions only 01/04/2014 - 31/03/2015
2nd Quartile 3rd Quartile Median
Page 21 of [email protected]
www.neqos.nhs.uk

Hospital Trust Activity Total Costs
a. Total Costs by Admission Method Type (Cumbria & North East FTs only)
Provider Name Elective Emergency Other Total
Newcastle Upon Tyne Hospitals 6,220,132£ 1,412,718£ 217,194£ 7,850,044£
South Tees 4,370,371£ 801,954£ 4,563£ 5,176,888£
North Tees & Hartlepool 2,931,321£ 393,156£ -£ 3,324,477£
Northumbria 2,203,012£ 599,914£ 23,449£ 2,826,375£
Sunderland 1,641,556£ 417,074£ 3,523£ 2,062,153£
County Durham & Darlington 568,684£ 436,351£ 56,665£ 1,061,699£
North Cumbria 307,429£ 284,656£ 1,447£ 593,532£
Gateshead 57,364£ 297,599£ 3,413£ 358,376£
South Tyneside 6,084£ 229,491£ 2,435£ 238,009£ Total 18,305,954£ 4,872,912£ 312,689£ 23,491,555£
b. Total Costs by Procedure Type (Cumbria & North East FTs only)
Provider Name Surgery
Radicular pain
Injections
Back pain
Injections
No procedure
done
Procedure not
linked to back
pain Imaging
Pain
Management
excluding
Injections
Other Non-
Surgical Total
Newcastle Upon Tyne Hospitals 4,323,686£ 821,266£ 490,017£ 745,465£ 825,783£ 337,394£ 306,433£ -£ 7,850,044£
South Tees 3,120,368£ 559,358£ 143,915£ 390,246£ 434,835£ 255,056£ 273,110£ -£ 5,176,888£
North Tees & Hartlepool 1,616,066£ 542,640£ 681,303£ 202,875£ 169,132£ 69,619£ 40,508£ 2,334£ 3,324,477£
Northumbria 825,379£ 955,024£ 281,732£ 411,875£ 195,406£ 90,783£ 66,175£ -£ 2,826,375£
Sunderland 724,910£ 418,936£ 259,676£ 276,265£ 275,273£ 99,420£ 7,674£ -£ 2,062,153£
County Durham & Darlington 2,403£ 152,909£ 288,974£ 317,711£ 136,010£ 111,533£ 52,159£ -£ 1,061,699£
North Cumbria -£ 100,727£ 155,451£ 158,157£ 76,058£ 90,536£ 12,602£ -£ 593,532£
Gateshead -£ 5,741£ 6,802£ 216,012£ 30,112£ 66,356£ 33,353£ -£ 358,376£
South Tyneside -£ -£ -£ 158,704£ 20,635£ 58,671£ -£ -£ 238,009£ Total 10,612,811£ 3,556,600£ 2,307,871£ 2,877,309£ 2,163,245£ 1,179,369£ 792,015£ 2,334£ 23,491,555£
12. Total costs to the commissioner for hospital admissions for low back and radicular pain in people aged 16 years and over
(April 2014 - March 2015)
What is the data telling us?
Across all North East and Cumbria FTs in 2014/15 the total cost to commissioners for back and radicular pain admissions was almost £23.5 million, with 80% of the costs attributed to elective activity. Note that these costs are by provider Trust and will include activity for CCGs outside of the North East and Cumbria region.
Activity at Newcastle Hospitals accounts for one third of the total spend for the North East and Cumbria, followed by South Tees FT.
The surgery procedures group accounts for almost 45% of the total cost of all procedures, and the cost of injections is an additional 25% of the total.
Page 22 of [email protected]
www.neqos.nhs.uk

CCG Activity Total Costs
13. Hospital admissions Total Cost for low back and radicular pain in people aged 16 years and over (April 2014 - March 2015)a. All Admission Methods - Table
Responsible CCG Name
Cost per head
of Population Total Cost
Cost per head
of Population Total Cost
Cost per head
of Population Total Cost
Registered
Population
(Ages 15+)
Newcastle North & East 6.74£ 961,710£ 4.73£ 674,624£ 1.97£ 281,418£ 142,612
South Tees 8.41£ 2,022,050£ 6.26£ 1,504,876£ 2.15£ 516,264£ 240,445
Hambleton, Richmondshire & Whitby 8.59£ 1,044,238£ 6.89£ 837,629£ 1.70£ 206,609£ 121,613
Gateshead 8.60£ 1,501,199£ 6.25£ 1,091,330£ 2.11£ 368,597£ 174,491
Newcastle West 9.72£ 1,074,797£ 7.27£ 804,234£ 2.45£ 270,563£ 110,581
North Durham 9.91£ 2,126,282£ 8.23£ 1,766,457£ 1.50£ 322,760£ 214,562
Sunderland 9.97£ 2,380,042£ 8.15£ 1,946,588£ 1.75£ 416,744£ 238,749
Cumbria 10.00£ 4,436,619£ 7.95£ 3,527,176£ 1.72£ 762,705£ 443,515
South Tyneside 10.37£ 1,357,033£ 7.82£ 1,023,108£ 2.50£ 326,940£ 130,885
Darlington 10.45£ 923,584£ 8.89£ 785,462£ 1.47£ 129,690£ 88,357
Hartlepool & Stockton-On-Tees 10.46£ 2,528,917£ 9.06£ 2,190,538£ 1.39£ 336,325£ 241,687
Northumberland 10.84£ 2,956,132£ 8.42£ 2,298,014£ 2.13£ 581,961£ 272,766
Durham Dales, Easington & Sedgefield 11.17£ 2,699,379£ 9.76£ 2,359,792£ 1.26£ 304,004£ 241,753
North Tyneside 11.17£ 2,022,362£ 8.58£ 1,553,566£ 2.44£ 441,180£ 181,117
Cumbria & North East Total 9.86£ 28,034,343£ 7.87£ 22,363,392£ 1.85£ 5,265,761£ 2,843,133
b. All Admission Methods - Quintile Chart
c. Elective Admissions only, by Procedure Type
Responsible CCG Name Surgery
Radicular pain
Injections
Back pain
Injections
No procedure
done
Procedure not
linked to back
pain Imaging
Pain
Management
excluding
Injections
Other Non-
Surgical
Total Cost
Cumbria 1,748,388£ 622,151£ 669,491£ 45,700£ 312,224£ 8,218£ 121,004£ -£ 3,527,176£
Durham Dales, Easington & Sedgefield 1,271,887£ 368,835£ 442,008£ 1,765£ 157,770£ 18,246£ 99,282£ -£ 2,359,792£
Northumberland 1,036,642£ 692,865£ 228,770£ 9,244£ 229,918£ 10,673£ 89,901£ -£ 2,298,014£
Hartlepool & Stockton-On-Tees 1,092,222£ 388,127£ 446,826£ 3,048£ 186,908£ 9,377£ 61,697£ 2,334£ 2,190,538£
Sunderland 1,033,005£ 387,531£ 226,364£ 16,723£ 245,755£ 6,497£ 30,713£ -£ 1,946,588£
North Durham 1,109,325£ 253,897£ 179,176£ 12,288£ 134,230£ 4,878£ 72,663£ -£ 1,766,457£
North Tyneside 740,368£ 385,744£ 167,195£ 3,042£ 179,743£ 7,318£ 70,156£ -£ 1,553,566£
South Tees 896,868£ 322,658£ 93,625£ 8,265£ 96,342£ 6,497£ 80,621£ -£ 1,504,876£
Gateshead 647,585£ 176,883£ 112,100£ 10,504£ 89,429£ 3,243£ 51,586£ -£ 1,091,330£
South Tyneside 611,921£ 194,315£ 115,081£ 2,832£ 71,080£ 4,529£ 23,349£ -£ 1,023,108£
Hambleton, Richmondshire & Whitby 620,894£ 83,870£ 30,494£ 2,630£ 71,086£ 2,878£ 25,777£ -£ 837,629£
Newcastle West 519,895£ 97,337£ 79,083£ 1,413£ 81,450£ 1,776£ 23,280£ -£ 804,234£
Darlington 341,060£ 131,838£ 217,978£ -£ 69,282£ 2,838£ 22,466£ -£ 785,462£
Newcastle North & East 364,375£ 102,436£ 85,022£ 706£ 76,947£ 5,697£ 39,441£ -£ 674,624£
All Admissions Elective Admissions Emergency Admissions
North Tyneside
Highlighted CCGs:
What is the data telling us?
Nine of the north east CCGs are in the highest quintile for spend per head of population on admissions for back and radicular pain and North Tyneside and DDES CCG have the highest spend per head of population (£11.17) in the North East and Cumbria. Newcastle North and East CCG is the only CCG with a spend per head which is below the national average.
For emergency admissions only, South Tyneside CCG has the highest spend per head (£2.50) and DDES CCG has the lowest (£1.26).
The final table shows the total spend for elective admissions for each CCG for 2014/15 (based on national tariff) and indicates the spend by procedure type. Surgery generally accounts for the majority of spend, and this is consistently seen across all CCGs where there is greater spend on admissions for surgery with the exception of Darlington CCG where more is spent on injections than surgery.
£0
£2
£4
£6
£8
£10
£12
£14
£16
Co
st p
er
he
ad o
f p
op
ula
tio
n
Cost of Back Pain Admissions per head of Population 01/04/2014 - 31/03/2015 All Admission Methods
Cumbria & North East CCGs National Average Cumbria & North East CCGs Average
CCG
Page 23 of [email protected]
www.neqos.nhs.uk

14. Back & Radicular Pain Admissions Breakdown for the Cumbria & North East RegionHighlighted Provider Data is included in this report(Red=Complex Spinal Provider, Blue=NHS Trust & Green=Independent Sector Provider)
Code Provider Name Surgery Injections Other
RTD THE NEWCASTLE UPON TYNE HOSPITALS NHS FOUNDATION TRUST 902 2,113 686 773 82 4,556
RTF NORTHUMBRIA HEALTHCARE NHS FOUNDATION TRUST 149 1,970 226 822 <6 3,172
RTR SOUTH TEES HOSPITALS NHS FOUNDATION TRUST 605 1,091 293 469 - 2,458
RVW NORTH TEES AND HARTLEPOOL NHS FOUNDATION TRUST 193 1,705 216 289 - 2,403
RLN CITY HOSPITALS SUNDERLAND NHS FOUNDATION TRUST 117 1,065 145 269 <6 1,599
RXP COUNTY DURHAM AND DARLINGTON NHS FOUNDATION TRUST <6 740 261 440 23 1,465
RTX UNIVERSITY HOSPITALS OF MORECAMBE BAY NHS FOUNDATION TRUST 13 689 81 187 6 976
NT333 SPIRE WASHINGTON HOSPITAL 226 571 42 - - 839
RNL NORTH CUMBRIA UNIVERSITY HOSPITALS NHS TRUST - 392 133 254 <6 780
NT457 BMI WOODLANDS HOSPITAL 34 492 41 - - 567
RR7 GATESHEAD HEALTH NHS FOUNDATION TRUST - 46 198 251 6 501
NN401 TYNESIDE SURGICAL SERVICES AT THE NORTH EAST NHS SURGERY CENTRE 42 270 40 - - 352
NT449 BMI THE LANCASTER HOSPITAL - 329 7 - - 336
RXN LANCASHIRE TEACHING HOSPITALS NHS FOUNDATION TRUST 116 121 63 22 6 328
NT347 SPIRE FYLDE COAST HOSPITAL 85 175 8 - - 268
RE9 SOUTH TYNESIDE NHS FOUNDATION TRUST - - <6 125 <6 128
NVC07 FULWOOD HALL HOSPITAL 31 24 18 - - 73
RET THE WALTON CENTRE NHS FOUNDATION TRUST <6 <6 55 - - 59
RNN CUMBRIA PARTNERSHIP NHS FOUNDATION TRUST - - <6 36 16 54
RCB YORK TEACHING HOSPITAL NHS FOUNDATION TRUST - <6 <6 20 <6 29
RM3 SALFORD ROYAL NHS FOUNDATION TRUST <6 10 - <6 - 13
NT497 BMI GISBURNE PARK HOSPITAL 6 <6 - - - 11
RAN ROYAL NATIONAL ORTHOPAEDIC HOSPITAL NHS TRUST <6 <6 <6 - - 6
RXL BLACKPOOL TEACHING HOSPITALS NHS FOUNDATION TRUST <6 - <6
RWA HULL AND EAST YORKSHIRE HOSPITALS NHS TRUST <6 - <6
RWY CALDERDALE AND HUDDERSFIELD NHS FOUNDATION TRUST - <6 - <6 - <6
NT403 BMI - THE BEARDWOOD HOSPITAL <6 <6 - - - <6
RCD HARROGATE AND DISTRICT NHS FOUNDATION TRUST <6 - <6
RR8 LEEDS TEACHING HOSPITALS NHS TRUST <6 <6 <6 - - <6
RW3 CENTRAL MANCHESTER UNIVERSITY HOSPITALS NHS FOUNDATION TRUST - <6 - <6 <6 <6
RWW WARRINGTON AND HALTON HOSPITALS NHS FOUNDATION TRUST <6 <6 <6 - - <6
RX1 NOTTINGHAM UNIVERSITY HOSPITALS NHS TRUST <6 - <6 <6 - <6
NVC20 THE YORKSHIRE CLINIC - <6 - - - <6
RFS CHESTERFIELD ROYAL HOSPITAL NHS FOUNDATION TRUST <6 - <6
RHQ SHEFFIELD TEACHING HOSPITALS NHS FOUNDATION TRUST - <6 - - - <6
RJ1 GUY'S AND ST THOMAS' NHS FOUNDATION TRUST - <6 - <6 - <6
RQ6 ROYAL LIVERPOOL AND BROADGREEN UNIVERSITY HOSPITALS NHS TRUST <6 - <6
RRF WRIGHTINGTON, WIGAN AND LEIGH NHS FOUNDATION TRUST - <6 - - - <6
RRV UNIVERSITY COLLEGE LONDON HOSPITALS NHS FOUNDATION TRUST - <6 <6 - - <6
RWE UNIVERSITY HOSPITALS OF LEICESTER NHS TRUST <6 - <6
RYJ IMPERIAL COLLEGE HEALTHCARE NHS TRUST <6 - <6
NT350 SPIRE METHLEY PARK HOSPITAL - <6 - - - <6
R1F ISLE OF WIGHT NHS TRUST <6 - <6
RA2 ROYAL SURREY COUNTY HOSPITAL NHS FOUNDATION TRUST <6 - <6
RA3 WESTON AREA HEALTH NHS TRUST <6 - <6
RA7 UNIVERSITY HOSPITALS BRISTOL NHS FOUNDATION TRUST <6 - <6
RAE BRADFORD TEACHING HOSPITALS NHS FOUNDATION TRUST <6 - <6
RAL ROYAL FREE LONDON NHS FOUNDATION TRUST <6 - <6
RBL WIRRAL UNIVERSITY TEACHING HOSPITAL NHS FOUNDATION TRUST <6 - <6
RC1 BEDFORD HOSPITAL NHS TRUST <6 - <6
RCX THE QUEEN ELIZABETH HOSPITAL, KING'S LYNN, NHS FOUNDATION TRUST <6 - <6
RD8 MILTON KEYNES HOSPITAL NHS FOUNDATION TRUST <6 - <6
RDU FRIMLEY HEALTH NHS FOUNDATION TRUST <6 - <6
RDZ THE ROYAL BOURNEMOUTH AND CHRISTCHURCH HOSPITALS NHS FOUNDATION TRUST <6 - <6
REM AINTREE UNIVERSITY HOSPITAL NHS FOUNDATION TRUST <6 - <6
RFF BARNSLEY HOSPITAL NHS FOUNDATION TRUST <6 - <6
RGN PETERBOROUGH AND STAMFORD HOSPITALS NHS FOUNDATION TRUST <6 - <6
RGQ IPSWICH HOSPITAL NHS TRUST <6 - <6
RHW ROYAL BERKSHIRE NHS FOUNDATION TRUST - - <6 - - <6
RJL NORTHERN LINCOLNSHIRE AND GOOLE NHS FOUNDATION TRUST <6 - <6
RJR COUNTESS OF CHESTER HOSPITAL NHS FOUNDATION TRUST <6 - <6
RK9 PLYMOUTH HOSPITALS NHS TRUST <6 - <6
RKB UNIVERSITY HOSPITALS COVENTRY AND WARWICKSHIRE NHS TRUST <6 - <6
RN3 GREAT WESTERN HOSPITALS NHS FOUNDATION TRUST <6 - <6
RN7 DARTFORD AND GRAVESHAM NHS TRUST <6 - <6
RP5 DONCASTER AND BASSETLAW HOSPITALS NHS FOUNDATION TRUST <6 - <6
RR1 HEART OF ENGLAND NHS FOUNDATION TRUST <6 - <6
RRJ THE ROYAL ORTHOPAEDIC HOSPITAL NHS FOUNDATION TRUST <6 - - - - <6
RTG DERBY TEACHING HOSPITALS NHS FOUNDATION TRUST <6 - - - - <6
RTP SURREY AND SUSSEX HEALTHCARE NHS TRUST <6 - <6
RVR EPSOM AND ST HELIER UNIVERSITY HOSPITALS NHS TRUST <6 - <6
RVV EAST KENT HOSPITALS UNIVERSITY NHS FOUNDATION TRUST <6 - - - - <6
RVY SOUTHPORT AND ORMSKIRK HOSPITAL NHS TRUST <6 - <6
RW6 PENNINE ACUTE HOSPITALS NHS TRUST <6 - <6
RWH EAST AND NORTH HERTFORDSHIRE NHS TRUST - <6 - - - <6
RWJ STOCKPORT NHS FOUNDATION TRUST - <6 - - - <6
RXF MID YORKSHIRE HOSPITALS NHS TRUST <6 - <6
NTPH1 SHEPTON MALLET NHS TREATMENT CENTRE - <6 - - - <6
NTX01 ONE HEALTH GROUP LTD <6 - - - - <6
NVC09 NEW HALL HOSPITAL <6 - - - - <6
Total 2,534 11,837 2,526 4,013 154 21,064
Elective Admissions Emergency
Admissions
Other Admission
Types Total
Page 24 of [email protected]
www.neqos.nhs.uk

Version Document Type Date Amendments By
0.1 First Draft 10/03/2016 ---Adam Fearing,
Liz Lingard
0.2 Draft V2 15/03/2016 Amendments & Final QAAdam Fearing,
Kayoung Goffe
0.3 Draft V3 15/04/2016 Further minor amendmentsAdam Fearing,
Kayoung Goffe
0.4 Draft V4 03/05/2016 Further minor amendments Adam Fearing
0.5 Draft V5 11/05/2016 Further minor amendments Adam Fearing
0.6 Draft V6 13/06/2016 Narrative & formatting Liz Lingard
Has the recipient of the report signed the NDA?
NEQOS
www.neqos.nhs.uk -
Please contact the NEQOS advisory service through this web link for further
information or to enquire about NEQOS undertaking similar work.
N/A
Contact email address
VERSION CONTROL
Public file location
Internal file location G:\Project Management\Project Mgt 15-16\Back Pain
Does the report include any small numbers?
If yes, can we produce a meaningful suppressed
version?
Yes
Yes, the small numbers in this report have been suppressed.
Observed events less than 6 have been replaced by "<6". Rates where
the numerator or denominator are less than 6 have been shown,
although to calculate that small number would not be possible from
the data shown here.
Liz Lingard
Helen Ridley
DOCUMENT GOVERNANCEBack Pain Report
Final
0.5
12/05/2016
Document name
Document type
Version
Date
CONFIDENTIALITY CHECKLIST – FOR COMPLETION PRIOR TO ANY DRAFTS SENT TO CLIENTS
Document Classification
Prepared on behalf of
Created by
If not, the Epidemiologist AND Director must
justify why not here, highlight, and agree the need
for an NDA
Have Lightfoot/HSCIC approved use of NDA in
order to disclose small numbers?
Approved by Epidemiologist
Approved by Project Director
Peer Reviewed by (if appropriate)
Originating organisation
Website of originating organisation
Confidential
GIRFT
Adam Fearing, Andrea Brown & Liz Lingard
Page 25 of [email protected]
www.neqos.nhs.uk