Embed Size (px)
Citation preview
' .
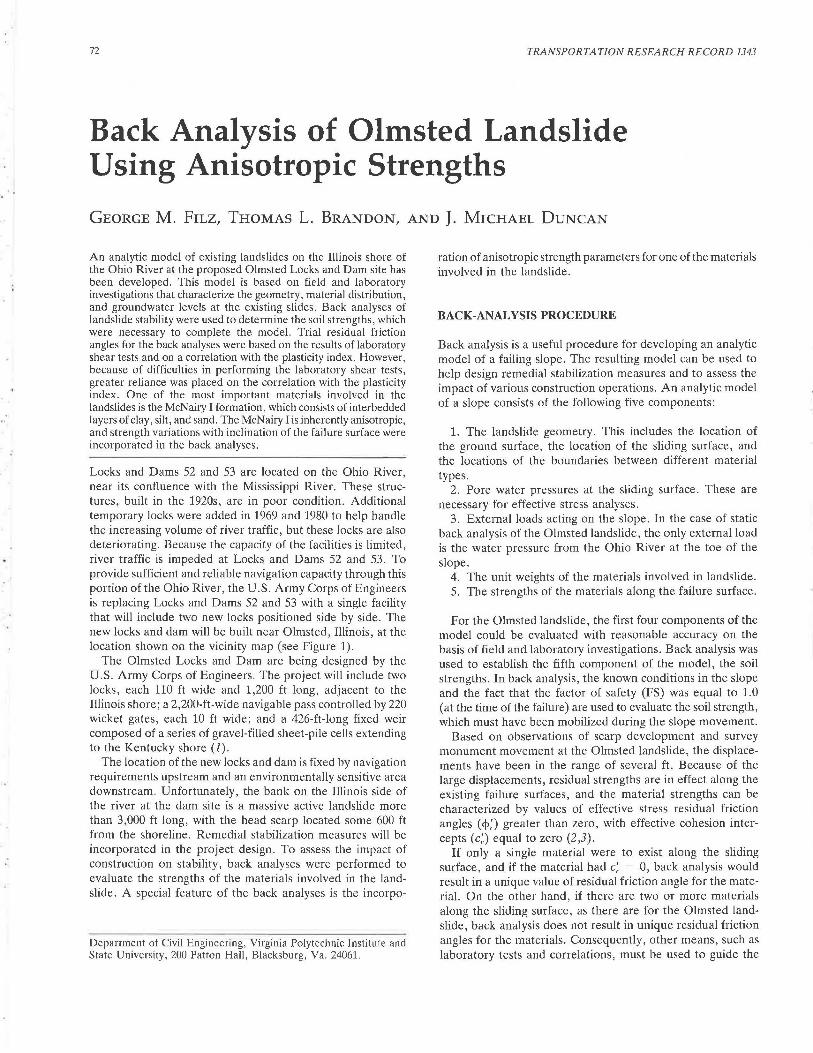
72 TRANSPORTATION RESEARCH RECORD 1343
Back Analysis of Olmsted Landslide Using Anisotropic Strengths
GEORGE M. FILZ, THOMAS L. BRANDON, AND J. MICHAEL DUNCAN
An analytic model of existing landslides on the Illinois shore of the Ohio River at the proposed Olmsted Locks and Dam site has been developed. This model is based on field and laboratory investigations that characterize the geometry, material distribution, and groundwater levels at the existing slides. Back analyses of landslide stability were used to determine the soil strengths, which were necessary to complete the model. Trial residual friction angles for the back analyses were based on the results of laboratory shear tests and on a correlation with the plasticity index. However, because of difficulties in performing the laboratory shear tests, greater reliance was placed on the correlation with the plasticity index. One of the most important materials involved in the landslides is the McNairy I formation, which consists of interbedded layers of clay, silt, and sand. The McNairy I is inherently anisotropic, and strength variations with inclination of the failure surface were incorporated in the back analyses.
Locks and Dams 52 and 53 are located on the Ohio River, near its confluence with the Mississippi River. These structures, built in the 1920s, are in poor condition. Additional temporary locks were added in 1969 and 1980 to help handle the increasing volume of river traffic, but these locks are also deteriorating. Because the capacity of the facilities is limited, river traffic is impeded at Locks and Dams 52 and 53. To provide sufficient and reliable navigation capacity through this portion of the Ohio River, the U.S. Army Corps of Engineers is replacing Locks and Dams 52 and 53 with a single facility that will include two new locks positioned side by side. The new locks and dam will be built near Olmsted, Illinois, at the location shown on the vicinity map (see Figure 1).
The Olmsted Locks and Dam are being designed by the U.S. Army Corps of Engineers. The project will include two locks, each 110 ft wide and 1,200 ft long, adjacent to the Illinois shore; a 2,200-ft-wide navigable pass controlled by 220 wicket gates, each 10 ft wide; and a 426-ft-long fixed weir composed of a series of gravel-filled sheet-pile cells extending to the Kentucky shore (J).
The location of the new locks and dam is fixed by navigation requirements upstream and an environmentally sensitive area downstream. Unfortunately, the bank on the Illinois side of the river at the dam site is a massive active landslide more than 3,000 ft long, with the head scarp located some 600 ft from the shoreline. Remedial stabilization measures will be incorporated in the project design. To assess the impact of construction on stability, back analyses were performed to evaluate the strengths of the materials involved in the landslide. A special feature of the back analyses is the incorpo-
Department of Civil Engineering, Virginia Polytechnic Institute and State University, 200 Patton Hall, Blacksburg, Va. 24061.
ration of anisotropic strength parameters for one of the materials involved in the landslide.
BACK-ANALYSIS PROCEDURE
Back analysis is a useful procedure for developing an analytic model of a failing slope. The resulting model can be used to help design remedial stabilization measures and to assess the impact of various construction operations. An analytic model of a slope consists of the following five components:
1. The landslide geometry. This includes the location of the ground surface, the location of the sliding surface, and the locations of the boundaries between different material types.
2. Pore water pressures at the sliding surface. These are necessary for effective stress analyses.
3. External loads acting on the slope. In the case of static back analysis of the Olmsted landslide, the only external load is the water pressure from the Ohio River at the toe of the slope.
4. The unit weights of the materials involved in landslide. 5. The strengths of the materials along the failure surface.
For the Olmsted landslide, the first four components of the model could be evaluated with reasonable accuracy on the basis of field and laboratory investigations. Back analysis was used to establish the fifth component of the model, the soil strengths. In back analysis, the known conditions in the slope and the fact that the factor of safety (FS) was equal to 1.0 (at the time of the failure) are used to evaluate the soil strength, which must have been mobilized during the slope movement.
Based on observations of scarp development and survey monument movement at the Olmsted landslide, the displacements have been in the range of several ft. Because of the large displacements, residual strengths are in effect along the existing failure surfaces, and the material strengths can be characterized by values of effective stress residual friction angles ( <1>;) greater than zero, with effective cohesion intercepts (c;) equal to zero (2,3).
If only a single material were to exist along the sliding surface, and if the material had c; = 0, back analysis would result in a unique value of residual friction angle for the material. On the other hand, if there are two or more materials along the sliding surface, as there are for the Olmsted landslide, back analysis does not result in unique residual friction angles for the materials. Consequently, other means, such as laboratory tests and correlations, must be used to guide the

Filz et al.
Olmsted Lock and Dam Site
Indiana
FIGURE I Location of Olmsted Lock and Dam site.
analyses. A reasonable back analysis procedure for a slope with more than one material along the failure surface includes the following steps:
1. Laboratory test results and correlations with index properties are used to establish trial values of shear strength parameters for the materials along the failure surface . For the Olmsted landslide, only the values of the residual friction angles, <1>:, are needed because the displacements are large enough to reduce the shear strengths to their residual values and can be closely approximated by values of <1>;, with c; = 0.
2. A stability analysis is performed using the known slope geometry, groundwater levels, and external loading conditions at the time of the failure. The analysis yields a FS corresponding to the trial strengths from Step 1.
3. The trial strengths from Step 1 are adjusted using the FS computed in Step 2 according to the following formula:
(1)
If extensive local experience with a particular material is available, this experience along with Equation 1, could be used to adjust the strength of some of the materials more than others .
4. The results of Step 3 can be verified by reanalyzing the slide using the strengths from Step 3. The value of FS calculated using these strengths should be 1.00. The final backcalculated strengths, which produce a FS equal to unity, are appropriate for the existing sliding surface where the shear strength has been reduced to residual.
This procedure takes full advantage of the information provided by the large-scale shear test, which an existing landslide represents. Whereas laboratory tests use relatively small specimens whose properties must be extrapolated to entire formations, a landslide involves all of the material along the failure surface and the shearing resistance of all this material is reflected in the back analysis. As long as the location of the failure surface, groundwater conditions, external loads, and material unit weights can be estimated with reasonable accuracy, a useful analytical model can be developed. Minor inaccuracies in the location of the failure surface or the phreatic surface will result in compensating changes in the back-
73
calculated strengths in order to produce an internally consistent model that can be used to evaluate the effectiveness of remedial stabilization measures .
Confidence in the analytic model, obtained from back analysis is increased when the same set of strengths results in an FS value close to 1.0 for several cross sections throughout the landslide and when the back-calculated strengths are in reasonable agreement with laboratory tests and correlations with index properties .
For the Olmsted landslide, a complicating factor is the presence of the layered McNairy I formation along significant portions of the failure surfaces. The McNairy I consists of interbedded layers of clay, silt, and sand. As a result of the layering, the strength properties of the formation are highly anisotropic, with the lowest strengths on horizontal and nearhorizontal surfaces that pass primarily along the clay layers, and with the higher strengths on inclined surfaces that cut across the clay, silt, and sand layers. Here, the term "anisotropic" is used to refer to the inherent strength anisotropy of an entire formation, as described by Ladd and Foott ( 4) for varved clays.
The following sections describe how the back-analysis procedure was applied to the Olmsted landslide and how strength anisotropy of the McNairy I formation was incorporated into the analyses.
DESCRIPTION OF EXISTING LANDSLIDES
Evidence of instability on the Illinois shore at the Olmsted site was first discovered in 1987 during the foundation investigation for the proposed locks and dam. On the basis of observations of geomorphic features such as scarps, cracks, leaning trees, and hummocky terrain, the approximate extent of unstable ground was mapped. The boundary of the unstable area is shown by the line labeled Upper-Bank Slide Scarp in the site plan, as shown in Figure 2. The upper-bank slide is about 3,300 ft long and the head scarp of the slide is about 600 ft from the shoreline. Because of the observed instability, slope inclinometers and additional piezometers were installed in the slide area.
In late May and early June of 1988, a rapid drop in the river level from Elevation 290 ft to Elevation 283 ft took place over a 10-day period. In the lower portion of the river bank, near-vertical scarps up to 3 ft high developed 150 to 200 ft from the shoreline. Over the next month, the scarps and cracks propagated laterally along the river and eventually reached a total length of 3,100 ft. The location of the summer 1988 scarp is shown in Figure 2 by the line labeled LowerBank Slide Scarp.
Geology
Cross-section 1, which is located on the dam centerline, cuts through both the lower- and upper-bank landslides. The lowerbank portion and the upper-bank portion of Cross-section 1 are shown in Figures 3 and 4, respectively. The most important stratigraphic units in the lower-bank area are presented in Table 1, and their distributions at Cross-section 1 are shown on Figure 3.

·.
J50
........ JOO ~ -.__,
<::: 0
:;:; 0 > Cl)
w 250
200
I I I I
@ 0
/ I I
I
I I I I
@ 200 400
Scale, ft
I I I I I I I I
@ @ -Ohio River
I
I I I
Slide :Scarp I
I I I
I
l I I
Cb @ § Cross-section __/ Number, typ.
FIGURE 2 Plan view of Olmsted Lock and Dam site showing the scarp for the lowerand upper-bank slides.
650 700 750 BOO
-.&- Piezometer Levels 6/04/88 I Piezometer sensing element location .. Piezometer Break I Inclinometer Movement
McNairy I
850
Distance (ft)
- - Estimated phreatic surface in the McNairy I - - River level on 6/04/88
900 950 1000
FIGURE 3 Cross section of lower-bank slide at Section 1.
....--... 450 +-' 4-..._, c 400
0 +' 0 350
~ 300 ~Sl!ii~~~llili,!~~~~~~~~~~~~~ijiJ~igjll~t;;;;;5.lii~t";::::-;;-~~
200 250 300 350 400 450 500 550
Distance (ft) -¥- Piezometer Levels 6/04/88
Piezometer sensing element location
I Inclinometer Movement
·-- Estimated phreatic surface in McNairy I
600 650
FIGURE 4 Cross section of upper-bank slide at Section I.
700 750 800
1050

Fitz et al.
TABLE 1 STRATIGRAPHIC UNITS IN LOWER-BANK SLIDE AREA
Unit Name Descrtpt 1 on
Alluvium Very soft to stiff silty clay wtth tnterbedded
colluvtal layers and occastonil fine sand
lenses.
Colluvium A heterogeneous mixture of clay, silt, and
Qravel.
McNairy I Medium stiff to stiff interbedded clay, silt,
and very fine to fine sand. Based on SPT N-
values, laboratory tests, and shear wave
velocity measurements, the upper few feet of
the McNairy I are softer than the deeper
oort i on_s.
The most important stratigraphic units in the upper-bank area are presented in Table 2 and their distributions at Crosssection 1 are shown in Figure 4. In comparing Figures 3 and 4, it should be noted that the head scarp of the lower-bank slide in Figure 3 is at approximately the same location as the toe of the upper-bank slide in Figure 4.
Topography
The Ohio River flows southwest at the Olmsted site. The normal pool level is at Elevation 290 ft; however, the level seasonally fluctuates between low water at about Elevation 280 ft in the summer to high water at about Elevation 315 ft in the winter. The lowest elevation of the river bottom is 250 ft. Typical ground surface slopes on the Illinois shore in the area of the existing landslides range from 8 to 14 degrees. A gently rounded ridge line is located about 700 ft from the Illinois shoreline. The ridge elevation is about 390 ft at the downstream end of the locks and about 445 ft at the upstream end of the locks.
TABLE 2 STRATIGRAPHIC UNITS IN UPPER-BANK SLIDE AREA
Unit Name Description
Wilcox Gravel Iron oxide cemented sandy gravel with fine
sand and sandy clay.
Porter's Stiff to hard, fat clay. Montmori 11 onite ts
Creek the predominant clay mineral in this unit.
OWl 's Creek This unit is mineralogically similar to the
underlying McNairy I. Its consistency ts
stiff to bard.
McNairy I Medium stiff to stiff interbedded clay, silt,
and very fine to fine sand. As in the lower
bank area, SPT N-values, laboratory tests, and
shear wave ve 1 ocity measurements indicate that
the upper few feet of the McNairy I are softer
than the deeper portions.
75
Groundwater
Piezometric levels in the McNairy I formation slope down toward the river but at a shallower rate than the ground surface slopes. Artesian conditions exist near and beneath the river. Because the McNairy I formation consists of nearhorizontal layers of clay, silt, and sand, the formation undoubtedly has higher horizontal than vertical permeability. This high horizontal permeability is believed to be a factor in the development of artesian pressures. Elevated pressures near and beneath the river are probably driven by the higher groundwater levels upslope to the north and possibly upstream to the east.
Piezometer readings taken during summer 1988 landslide indicate that piezometric levels in the slope only dropped 1 to 3 ft in response to the 7-ft drop in the river level of late May and early June.
Location of Failure Surfaces
Twelve slope inclinometers installed in the landslide areas helped define the location of the failure surface. In addition, five standpipe piezometers were obstructed or broken during the lower-bank slide in 1988. The elevations of the piezometer disturbances were determined. The information from the inclinometer casings and piezometer disturbances, with the location of the surface scarps, was used to estimate the location of the failure surface at several cross sections through the landslides. The estimated failure surface locations at Crosssection 1 are shown in Figures 3 and 4.
Slide Mechanism
The instrumentation data, surface feature observations, and information from the foundation exploration present a consistent picture of the slope movements at this site. The data indicate that sliding is primarily translational and that separate upper- and lower-bank slides exist. The base of the upper slide is at Elevation 298 to 322 ft and the base of the lowerbank slide is at Elevation 238 to 256 ft. These locations put the central portions of both the upper- and lower-bank slides within the top several feet of the McNairy I formation.
This position for the failure plane indicates that weak layers exist in the top of the McNairy I formation. In fact, as presented in Tables 1 and 2, the foundation exploration disclosed that the top of the McNairy I is softer than the rest of the formation. In addition, the McNairy I contains interbedded horizontal layers of clay, silt, and sand. Horizontal, or nearhorizontal, sliding of the central portion of the landslides is probably taking place along the weaker clay layers in the upper part of the McNairy I.
A way from the central portion of the landslides, the failure surface cuts across the bedding planes of the McNairy I formation. The strength along an inclined surface that cuts through clay, silt, and sand layers would be expected to be much higher than the strength along a horizontal surface in a clay layer. Thus, layering is the source of inherent strength anisotropy in the McNairy I formation.
The lower-bank slide in 1988 occurred during an abrupt drop in river level from 290 ft to 283 ft. The decrease in

76
stabilizing force due to this drop in the river level was sufficient enough to cause movement of the lower-bank slide mass toward the river.
Data from inclinometer readings taken after the 1988 slide, show that there is continuing movement of both the lower and the upper bank slides. This indicates that the FS for the existing slope has been close to unity since the slide. Relatively small changes in river level or small changes in piezometric levels within the slope appear to be sufficient to cause additional increments of downslope movement.
The slope movements have been large enough that there is little doubt that the shear strengths along the failure surfaces have been reduced to their residual values. A survey monument in the lower-bank area moved down 1.3 ft and 2.0 ft toward the river over a 2.5-year period encompassing the 1988 slide. As mentioned previously, near-vertical head scarps of the lower-bank slide range up to 3 ft high. These facts indicate that relatively large movements have taken place in this area. Consequently, residual friction angles appear to be appropriate for the analysis of sliding on existing failure surfaces.
TRIAL STRENGTH VALUES FOR BACK ANALYSIS
Trial strength values are necessary to begin the back-analysis procedure. Both laboratory shear tests and correlations with index properties were used to select the trial strength values for the Olmsted slide.
Laboratory Shear Tests
Repeated direct shear tests were performed on small samples of alluvium, colluvium, McNairy I, and Porter's Creek soils to determine values of the drained residual friction angles, <Ji; . Table 3 presents the results of all the tests that were carried
TABLE 3 SUMMARY OF RESIDUAL DIRECT SHEAR TESTS
So il Boring Sample c ' ; • r LL (tsf) (degr ees)
Alluvium AS-105 5A 0.00 22 . 5 46
U0-21A I 0.00 33 . 0 31
Colluvi um AS-105 7A 0.00 19 . 5 52
U0-21 I 0.00 29 . 0 46
U0-2JA. 2 0 .00 9.0 IOI
McNa iry I UD-214 IA 0 . 05 10 .0 85
U0-214 3C 0.10 15 . 2 64
U0-214 2C 0. 20 18 . 0 47
UD- 214 2C 0 . 03 13 .0 47
U0-214 IC o . 20 6 . 7 70
UD-214 3E 0.00 21. 0 47
Porter's TP-7 I 0. 20 5. 0 Ill
Creek TP-7 2 0.20 10 .0 112
TP -7 3 0 . 20 12 .0 114
TP-7 4 0.20 10 .0 117
PL PI
24 22
23 8
25 27
25 21
37 64
34 51
23 41
20 27
20 27
29 41
2.6 2.1
45 66
38 74
43 71
43 74
TRANSPORTATION RESEARCH RECORD 1343
to sufficient displacement in order to develop residual strength conditions. There is considerable scatter in the results. The test data are believed to be erratic because of the difficulties involved in sampling, trimming, and testing representative samples of these materials. The alluvium tended to be soft and difficult to sample, the Porter's Creek material tended to be brittle and difficult to trim, and the alluvium and colluvium were highly variable. Variability in the materials probably contributed to scatter in the data because of the small size of the laboratory test specimens. In addition, the laminated character of the McNairy I made trimming difficult. During testing, it was sometimes difficult to determine which components of the McNairy I were involved in shearing.
Correlations with Index Properties
There have been successful efforts to correlate <P', with the index properties of soils (2,5- 7). Typically, these correlations employ the PI, and the percentage of the clay fraction (less than 0.002 mm) composing the soil. One of these correlations could have been used to estimate reasonable <P' , values for the Olmsted project. However, because numerous additional data were available from more recent literature, it was considered desirable to update the previous correlations. A total of 154 different pairs of q,; - PI values were collected (8) . The data include values of residual friction angles determined from the back analysis of existing slides, from repeated direct shear tests, and from ring shear tests. For estimating trial values of <Ji; for the Olmsted project, the subset of these data consisting of natural soils having no cohesion (c; = 0) was used . Figure 5 shows the data and the estimated <P', - PI trend. For comparison, the relationship proposed by Voight (5) is also shown . It can be seen that the two trend lines are quite similar. The trend line by Brandon et al. (8) shows a sharper curvature, and lower <1>; values in the PI range from 20 to 50.
Trial Shear Strengths
Trial residual friction angles for the important soils involved in the landslides were based on the results of the laboratory shear tests and on the correlation with PI. However, more reliance was placed on the correlation with PI because of (a) difficulties in performing the laboratory shear tests cast some doubt on the accuracy of the test results, and (b) more Atterbert limits tests than repeated direct shear tests were performed on the site soils. For each soil type, Table 4 presents the range of values of PI, residual friction angle measured by laboratory tests, residual friction angle obtained from the correlation in Figure 5, and the trial residual friction angle adopted for beginning the back analyses .
Because of the interbedded nature of the McNairy I, the shear-strength parameters for this formation are undoubtedly anisotropic. The residual friction angle from the correlation with PI listed in Table 4 for the McNairy I soil ranges from 10 to 30 degrees . The lower friction angles in this range correspond to the higher Pis, which are representative of the clay layers that would be involved in horizontal shearing. The higher friction angles correspond to the lower Pis, which are

Fitz et al. 77
40
35
30 /Doto Compiled by Brandon, et. al., 1991
!:>
25 !:>
<j'r
!:> t> / Trend Line from Voight, 1973
"( M 20
(degrees)
15
10
5
0 0
~ l>.i>" ~ " ~
!:> "~ %.!:>
25 50 75
Plasticity Index (%)
/
Trend Line from Brandon, et. al. , 1991
!:> "
100 125 150
FIGURE S PI-residual friction angle relationship (5,8) .
TABLE 4 MEASURED, CORRELATED, AND TRIAL VALUES OF q,; FOR OLMSTED SOILS
Representative ~' r rneasur;ef '>' r cor Soi 1 Pl ranae• . decrees (decrees)
Alluvium 20 to 30 22.5 to 33 14. 5 to 20
Coll uvi um 20 to 35 9 to 29 12.5 to 20
McNairy I 10 to 50 7 to 21 IO to 30
Porter's Creek 50 to 80 5 to 12 6.5 to 10
•The representative ranges of plasticity index values 1 isted
in Table 4 exclude atypical Atterberg limits tests results
(8).
;' r trial I decrees l
18
15
see text
8
representative of mixtures of the coarse and fine material that would be involved in inclined shearing. On this basis, these trial friction angles for the McNairy I soil were selected for beginning the back analysis: ¢; (horJ = 10 to 11 degrees and ¢; (non_ hoc) = 25 degrees. Arbitrarily, ¢; (hoc) was applied for sections of the failure surface to within ± 5 degrees of horizontal and ¢; (non_ horJ was applied for steeper sections of the failure surface.
As shown in Figures 3 and 4, the Owl's Creek and Wilcox deposits play relatively minor roles in the sliding at this site. Their trial residual friction angles were estimated on the basis of visual classifications. A summary of the trial residual friction angles used for the back analyses is presented in Table 5, which also includes the unit weights of the materials.
STABILITY ANALYSES
Slope stability analyses were performed using the computer program SPENCER. SPENCER is a modern version of the program SLOPE8R (9) for analysis of noncircular slip surfaces using Spencer's method (10).
Stability analyses were performed at four sections throughout the landslide. In addition to the upper- and lower-bank slides at Cross-section 1, which are shown in Figures 3 and 4, the lower-bank slides at Cross-sections 14, 16, and 18 were
also analyzed. At these sections, sufficient data were available regarding the location of the failure surface and groundwater levels at the time of the 1988 landslide to define the conditions required for analysis. The location of Cross-sections 14, 16, and 18 are also shown on Figure 2.
Two analyses were performed for each section: one with ¢; (horJ = 11 degrees in the McNairy I and another with ¢; (horJ = 10 degrees in the McNairy I. In every case, a ¢; (non_ hor) value of 25 degrees in the McNairy I was used. Table 6 presents the results of the analyses.
TABLE 5 MATERIAL PROPERTIES FOR BACK ANALYSES
Trial ¢', Total Unit Weights
Soil I dearees \ llbs. oer cu.
Alluvium 18 117
Colluvium 15 112
McNairy I 10 to II (horizontal) 118
25 I non-horizontal I
Olrll ' s Creek 18 117
Porter's Creek 8 105
Wi 1 cox 24 122
TABLE 6 FACTORS OF SAFETY DETERMINED FROM SLOPE STABILITY ANALYSES
Factor of Safetv
Section McNairy I McNairy I
¢' clho; l = 11' ¢',rhorl • 10•
I Lower 1.05 0.99
I Uooer 1.08 1.00
14 1.03 0.99
16 1.07 0.99
18 1.00 0. 96
ft.)

78
As indicated in the table, the calculated values of FS are generally slightly greater than 1.0 for <P; (hmJ = 11 degrees and are close to 1 .0 for <P: (ho•) = 10 degrees. Because the calculated values of FS are so close to 1.0 for the analyses performed with <1>; = 10 degrees, it was judged unnecessary to adjust the trial strengths. It was therefore concluded that the residual friction angles listed in Table 5, with <P;(hm) = 10 degrees in the McNairy I, provide results in good agreement with all available information. These values of residual friction angle complete the analytic model of the Olmsted landslide.
Confidence in the analytic model is relatively high but not solely because of the use of the back-calculation procedure to establish the residual friction angles. The number of unknowns (seven values of <J>;.) is greater than the number of analyses that could be performed (five cross sections). For this reason, and because of the inherent uncertainty in all of the measurements and interpretations made to characterize the landslide, it cannot be concluded that the set of <1>; values obtained from the back analyses are the true values in an absolute sense. In fact, infinitely many other sets of <P; values could be found, which would also give factors of safety close to 1.0. However, most of these sets of <1>: values would not be consistent with the other information known about the site soils.
Confidence in the model obtained from these back analyses is relatively high because
l. The analyses incorporate what is known about the stratigraphy and geologic characteristics of the site soils, including anisotropy in the McNairy I formation.
2. The strengths corresponding to a value of FS equal to 1.0 are in reasonable agreement with the laboratory test results and the estimated strengths from the PI correlation.
3. The same strengths yield FSs close to 1.0 for all of the sections throughout the landslide for which there is sufficient data for analysis. Because there are variations from section to section in the distribution of materials, the position of the piezometric surface, and the position of the failure plane, the confidence increased in the model in comparison to a back analysis performed at only one section.
SUMMARY AND CONCLUSIONS
An analytic model of existing landslides on the Illinois shore of the Ohio river at the proposed Olmsted Locks and Dam site was developed. The model was based on field and laboratory investigations to characterize the geometry, material distribution, and groundwater levels at the existing slides. Back analyses of landslide stability were used to determine the soil strengths necessary to complete the model. The model will be useful for assessing the effects of proposed construction operations on the slope and for evaluating the effectiveness of remedial stabilization measures.
Trial residual friction angles for the back analyses were based on the results of laboratory shear tests and on a correlation with the PI. However, because of difficulties in performing the laboratory shear tests, more reliance was placed on the correlation with the PI.
TRANSPORTATION RESEARCH RECORD 1343
One of the most important materials involved in the landslides is the McNairy I formation, which consists of interbedded layers of clay, silt, and sand. The McNairy I formation is inherently anisotropic, and strength variation with inclination of the failure surface was incorporated in the back analyses.
Confidence in the analytic model obtained from the back analyses is relatively high because the same strength values yield FSs very close to 1.0 for all of the five cross sections for which there are sufficient data for analysis, and because the strengths agree reasonably well with the laboratory test results and the index property correlation.
ACKNOWLEDGMENTS
The writers wish to express their appreciation to the U.S. Army Corps of Engineers, which performed the field investigations and laboratory tests. Jane Ruhl, John Jent, Jeff Schaefer, David Kiefer, Don Tupman, and Bruce Murry, all of the Louisville District of the Corps of Engineers, made many valuable suggestions and provided much helpful information for the studies and analyses described in this paper.
REFERENCES
1. U.S. Army Corps of Engineers. Design Memorandum No. 1: General Design Memorandum. Main Report, Vol. 1. Olmsted Locks and Dam, Dec. 1988.
2. L. Bjerrum . Progressive Failure in Slopes of Overconsolidated Plastic Clay and Clay-Shales. Third Terzaghi Lecture, Journal of the Soil Mechanics and Foundations Division, ASCE, Vol. 93, No. 5, Sept . 1967, pp. 1-49.
3. A. W. Skempton. Residual Strength of Clays in Landslides, Folded Strata, and the Laboratory. Geotechnique, Vol. 35, No. l, 1985, pp. 3-18.
4. C. C. Ladd and R. Foott. New Design Procedure for Stability of Soft Clay . Joumal of the Geotechnical Engineering Division, ASCE, Vol. 100, No . 7 . July 1974, pp. 763- 786.
5. B. Voight. Correlation Between Atterberg Plasticity Limits and Residual Shear Strength of Natural Soils . Geotechnique , Vol. 23, No. 2, June 1973, pp. 265-267.
6. R. J. Chandler. The Effect of Weathe ring on the Shear Strength Properties of Keuper Marl. Geotechnique, Vol. 19, No. 3, 1967, pp. 321-334 .
7. J . F. Lupini, A. E. Skinner, and P. R. Vaughan. The Drained Residual Strength of Cohesive Soils. Geotechnique. Vol. 31, No. 2, 1981, pp. 181-213 .
8. T . L. Brandon, G. M. Filz, and J.M. Duncan. Review of Landslide Investigation, Phase I-Part B, Olmsted Locks and Dam. U.S. Army Corps of Engineers, Louisville, Ky .. June 1991.
9. J . M. Duncan and K. W. Wong. SLOPE8R: A Complller Program for Slope Stability Analysis with Non-Cirrnlar Slip Swfaces. Department of Civil Engineering, Virginia Polytechnic Institute and State University, Blacksburg, Va., April 1984.
10. E. Spencer. A Method of Analysis of the Stability of Embankments Assuming Parallel Inter-slice Forces. Geotechnique, Vol. 17, No. 1, 1967 , pp. 11-26.
Publication of this paper sponsored by Commillee on Soils and Rock Instrumentation .