Embed Size (px)
Citation preview
Bachelor thesis
Author:
Tino Kreszies
<
Experimental validation of RNA
interference efficiency and off-
target prediction in barley
Mittweida, 21th
August 2013
Faculty of mathematics, natural sciences, informatics
Bachelor thesis
Experimental validation of RNA
interference efficiency and off-
target prediction in barley
Author:
Tino Kreszies
Course of studies:
Biotechnology/Bioinformatics
Seminar group:
BI10w2-B
First examiner:
Prof. Dr. habil. Röbbe Wünschiers
Second examiner:
Dr. habil Patrick Schweizer
Submission:
Mittweida, 21th
August 2013
Defense of bachelor thesis:
Mittweida, 26th
August 2013
Bibliographic Description:
Kreszies, Tino: Experimental validation of RNA interference efficiency and off-target
prediction in barley. - 2013. - 13, 46, 12 S. Mittweida, Hochschule Mittweida, Faculty
of mathematics, natural sciences, informatics, Bachelor thesis, 2013
Abstract:
This Bachelor thesis provides an experimental validation of the “si-Fi” software, which
was designed for RNAi off-target searches and silencing efficiency predictions. The
experimental approach is based on using synthetic DNA as RNAi-target as well as
RNAi-trigger sequence. The data was generated by two different types of experiments
using a transient gene silencing system in bombarded barley epidermal cells. The
efficiency of RNAi was estimated by scoring the effect of silencing of the
susceptibility-related gene Mlo on resistance of transformed cells to the powdery
mildew fungus Blumeria graminis f. sp. hordei by observing reduction of fluorescent
signals coming from an RNAi target fused to the green fluorescent protein.
The aim of this work was a comparison between in silicio prediction of RNAi efficiency
and off-target effects in barley and experimental data.

Acknowledgements
Acknowledgements
At first I would like to thank Dr. Patrick Schweizer for giving me the chance to work in
his lab in the Pathogen-Stress Genomics group at Leibniz Institute of Plant Genetics and
Crop Plant Research (IPK). In addition I am grateful for all the fruitful discussions and
the critical reading of this manuscript.
I furthermore thank Stefanie Lück and Dr. Dimitar Douchkov for developing the “si-Fi”
(siRNA-Finder) software, what made this project possible.
Moreover I am thankful to Dr. Dimitar Douchkov for his supervision and the
development of experimental designs of this work, for the valuable discussions and the
critical reading of this manuscript.
I would also thank Stefanie Lück for teaching me the basics in the lab, how to
microscopically assess the different samples, and for the successful cloning of the
pIPKTA44_Mlo500_100 construct.
Thanks to Dr. Daniela Nowara for providing the pIPKTA44 vector.
In addition I would thank Gabriele Brantin for teaching me all practical things that
concern bombardments with the PDS-1000/He Particle Delivery System.
Finally I would like to thank Prof. Röbbe Wünschiers for his attendance to support me
as university supervisor.
Index of Contents
I
Index of Contents
Index of Contents ............................................................................................................. I
List of Figures ................................................................................................................ IV
List of Tables .................................................................................................................. V
List of Appendix ............................................................................................................ VI
List of Abbreviations .................................................................................................. VII
1 Introduction .................................................................................................................. 1
1.1 RNA interference .................................................................................................... 1
1.2 The “si-Fi” software tool ........................................................................................ 3
1.3 Barley ...................................................................................................................... 5
1.4 The phytopathogenic fungus Blumera graminis ..................................................... 6
1.5 Barley – Blumeria graminis - interaction ............................................................... 7
1.6 mlo resistance .......................................................................................................... 7
1.7. MLO family ........................................................................................................... 9
1.8 Particle bombardment / biolistics ......................................................................... 11
1.9 Aim ....................................................................................................................... 12
2 Materials and methods .............................................................................................. 13
2.1 Materials ............................................................................................................... 13
2.1.1 Antibiotics ...................................................................................................... 13
2.1.2 Enzymes and enzyme buffers ........................................................................ 13
2.1.3 Synthetic 500 bp mlo sequences .................................................................... 14
2.1.3.1 Generating of synthetic 500 bp mlo sequences ....................................... 14
2.1.3.2 ClustalW2 multiple sequence alignment ................................................ 14
2.1.4 Plasmid vectors and plasmid constructs ........................................................ 14
2.1.5 Bacterial strains .............................................................................................. 15
2.1.6 Kits ................................................................................................................. 15
2.1.7 Software used ................................................................................................. 16
2.1.7.1 DNASTAR Lasergene® ......................................................................... 16
2.1.7.2 GIMP ...................................................................................................... 16
2.1.7.3 LabTools ................................................................................................. 16
2.1.7.4 “si-Fi” (siRNA Finder) ........................................................................... 16
2.1.8 Chemicals ....................................................................................................... 16
Index of Contents
II
2.1.9 Generally used media and solutions .................................................................. 17
2.1.9.1 Media ...................................................................................................... 17
2.1.9.2 Solutions ................................................................................................. 18
2.1.10 Barley and growth conditions ...................................................................... 18
2.1.11 Blumeria graminis ....................................................................................... 18
2.2 Methods ................................................................................................................ 19
2.2.1 General standard methods .............................................................................. 19
2.2.1.1 Agarose gel electrophoresis .................................................................... 19
2.2.1.2 Gel extraction with Qiagen: “QIAquick® Gel Extraction Kit” .............. 19
2.2.1.3 Plasmid isolation ..................................................................................... 19
2.2.1.4 Optical density measurement .................................................................. 19
2.2.1.5 Transformation of E.coli ......................................................................... 20
2.2.2 Creation of RNAi constructs .......................................................................... 20
2.2.2.1 Ligation into entry vector ....................................................................... 20
2.2.2.2 LR reaction to destination vector ............................................................ 21
2.2.3 Creation of plasmid construct pIPKTA44_Mlo500_100 ............................... 22
2.2.4 Transient expression by particle bombardment ............................................. 22
2.2.4.1 Gold particle suspension ......................................................................... 22
2.2.4.2 Coating of gold particles with DNA ....................................................... 22
2.2.4.3 Biolistic gene transfer ............................................................................. 24
2.2.5 Inoculation with Blumeria graminis .............................................................. 25
2.2.6 Staining of Mlo-silencing experiments .......................................................... 25
2.2.7 Microscopy .................................................................................................... 26
2.2.7.1 Microscopy of Mlo-silencing experiments ............................................. 26
2.2.7.2 Microscopy of GFP-fused-Mlo-silencing experiments .......................... 27
2.2.8 Statistical analysis of Mlo-silencing experiments .......................................... 27
3 Results ......................................................................................................................... 29
3.1 Multiple sequence alignment ................................................................................ 30
3.2 “si-Fi” predictions ................................................................................................. 31
3.3 Constructs ............................................................................................................. 32
3.3.1 Plasmid constructs pIPKTA38_Mlo500RNAi(0-100%+H1) ........................ 32
3.3.2 Plasmid vector pIPKTA30NMlo500RNAi(0-100%+H1) ............................. 34

Index of Contents
III
3.3.3 Plasmid construct pIPKTA44_Mlo500_100 ................................................. 35
3.4 Mlo-silencing experiments .................................................................................... 36
3.5 GFP-fused-Mlo-silencing experiments ................................................................. 39
4 Discussion and outlook .............................................................................................. 42
5 Summary ..................................................................................................................... 45
List of References .......................................................................................................... 47
Appendix ........................................................................................................................ 53
Statement of authorship ............................................................................................... 65
List of Figures
IV
List of Figures
Figure 1: Simplified RNA interference mechanism [URL 1] ........................................... 2
Figure 2: Graphical user interface “si-Fi” software [URL 2] ........................................... 4
Figure 3: Barley leaves infected with B. graminis f.sp hordei (Dean et al., 2012) .......... 6
Figure 4: Asexual life cycle of B. graminis f.sp hordei (Both et al., 2005) ..................... 8
Figure 5: B. graminis f.sp. hordei haustorium (Dean et al., 2012) ................................... 9
Figure 6: Reviewed MLO family (The UniProt Consortium, 2013) .............................. 10
Figure 7: The biolistic bombardment process (Bio-Rad Laboratories, n.d.) .................. 11
Figure 8: Comparison between the in silico prediction and the experimental data ........ 12
Figure 9: SmartLadder Eurogentec [URL 5] .................................................................. 17
Figure 10: Pipeline for the experimental validation (D. Douchkov unpublished) .......... 21
Figure 11: Transformed cells with expression of a GUS reporter gene [URL 6] ........... 26
Figure 12: Graphical view of “si-Fi” predictions ........................................................... 32
Figure 13: Control digestion of pIPKTA38Mlo500RNAi(0-100%+H1) with SalI and
XbaI ........................................................................................................ 33
Figure 14: Plasmid vector pIPKTA38_Mlo500RNAi(0-100%+H1).............................. 33
Figure 15: Control digestion of pIPKTA30NMlo500RNAi(0-100%) with EcoRV ....... 34
Figure 16: Plasmid vector pIPKTA30NMlo500RNAi(0-100%+H1) ............................. 35
Figure 17: Plasmid vector pIPKTA44_Mlo500_100...................................................... 36
Figure 18: Statistics of Mlo-silencing experiments ........................................................ 39
Figure 19: normalized GFP-fused-Mlo-silencing experiments ...................................... 41
List of Tables
V
List of Tables
Table 1: Overview of the used antibiotics ...................................................................... 13
Table 2: Overview of the used enzymes and enzyme buffers ........................................ 13
Table 3: Overview of the used plasmid vectors .............................................................. 14
Table 4: Overview of the used plasmid constructs ......................................................... 15
Table 5: Overview of the used kits ................................................................................. 15
Table 6: Pipetting scheme of the Mlo-silencing experiment .......................................... 23
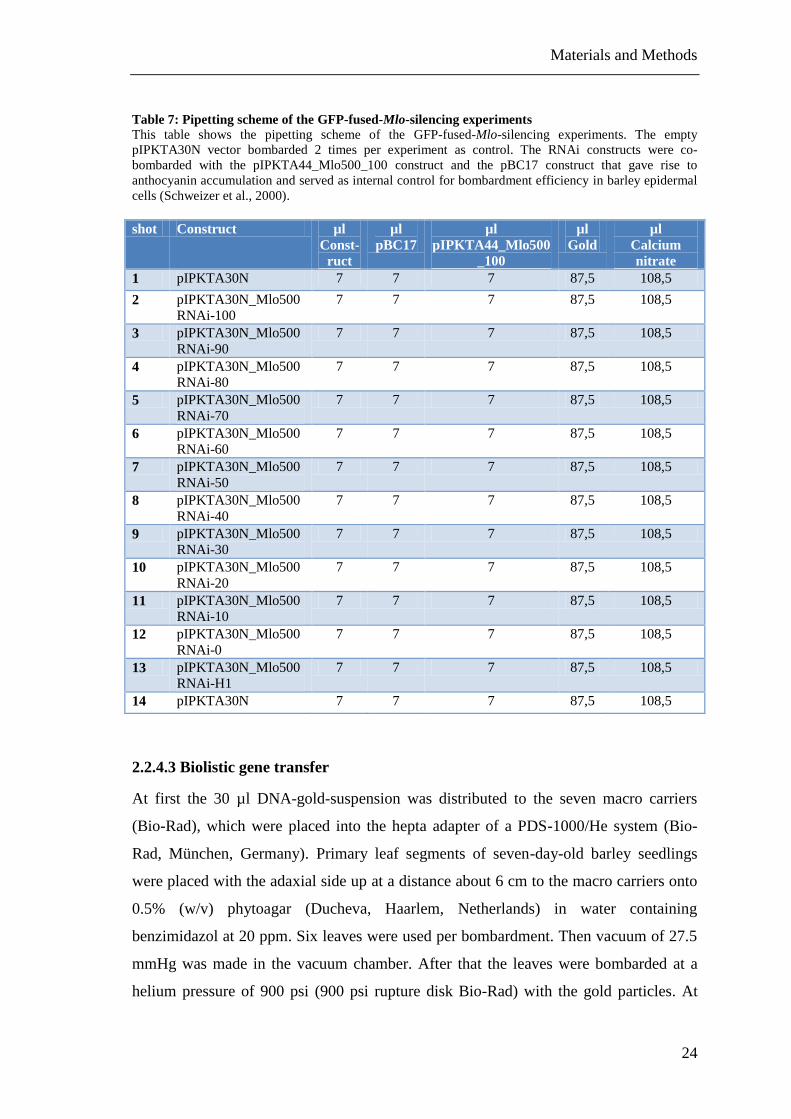
Table 7: Pipetting scheme of the GFP-fused-Mlo-silencing experiments ...................... 24
Table 8: Percent identity matrix of mlo sequences ......................................................... 30
Table 9: “si-Fi” predictions of mlo sequences against HarvEST assembly 35 ............... 31
Table 10: Mlo-silencing experiments statistics ............................................................... 38
Table 11: Data of GFP-fused-Mlo-silencing experiments .............................................. 40
List of Appendix
VI
List of Appendix
Appendix A: Sequences of synthetic 500 bp Mlo ........................................................... 53
Appendix B: Pseudocode Mlo shuffle (S. LÜCK and D. DOUCHKOV unpublished) . 58
Appendix C: Microscopy data Mlo - silencing experiments .......................................... 59
Appendix D: SI indices of Mlo - silencing experiments ................................................. 60
Appendix E: Percentage SI of Mlo - silencing experiments ........................................... 61
Appendix F: Log2 transformation of Mlo - silencing experiments ................................ 61
Appendix G: Nalimov test for outliers of Mlo - silencing experiments ......................... 62
Appendix H: Mlo - silencing experiments statistics ....................................................... 63
Appendix I: Microscopy data GFP - fused - Mlo - silencing experiment ....................... 64
List of Abbreviations
VII
List of Abbreviations
ACS 1-aminocyclopropane-1-carboxylate synthase
AGT appressorial germ tube
Amp Ampilicin
APP appressorium
ATP Adenosine-5'-triphosphate
Bgh Blumeria graminis f. sp. hordei
bp base pairs
DNA Deoxyribonucleic acid
dsRNA double-stranded RNA
ESH elongating secondary hyphae
EST Expressed Sequence Tag
GFP green fluorescent protein
GUS ß-Glucuronidase
HAU haustorium
hpi hours post inoculation
IPK Leibniz Institute of Plant Genetics and Crop Plant Research
Kan Kanamycin
Mlo Mildew locus O
mRNA Messenger RNA
nt nucleotide
PAZ Piwi Argonaut and Zwille
PGT primary germ tube
RDRP RNA-dependent-RNA-Polymerase
RISC RNA-induced silencing complex
RNA Ribonucleic acid
RNAi RNA interference
shRNA short hairpin RNA
SI susceptibility index
siRNA small interfering RNA

List of Abbreviations
VIII
SM SmartLadder
TIGS Transient-induced gene-silencing
X - Gluc 5-Bromo-4-chloro-1H-indol-3-yl β-D-glucopyranosiduronic acid
Introduction
1
1 Introduction
1.1 RNA interference
RNA interference (RNAi) is a biological process where RNA molecules can suppress
gene expression, typically by targeted destruction of specific mRNA molecules. This
can be used to silence specific genes. RNAi is an ancient natural antiviral mechanism
which has now been observed in many organisms such as plants, animals and fungi
(Agrawal et al., 2003). The stepwise discovery of RNAi led to various names in the
history of this mechanism including “co-suppression” (Napoli et al., 1990), “post-
transcriptional gene silencing” (Ingelbrecht et al., 1994) and “quelling” (Cogoni et al.,
1996). In 1998 Andrew Fire and Craig Mello published the technique of RNAi, in
which double stranded RNA (dsRNA) in Caenorhabditis elegans led to an efficient and
specific gene knockdown (Fire et al., 1998). For this Work Andrew Fire and Craig
Mello shared the Nobel Prize in Physiology or Medicine in 2006. There exist several
related RNAi pathways in animals, fungi and plants that differ in the type of double-
stranded triggering RNA and in the involved multigene-family member of dicer,
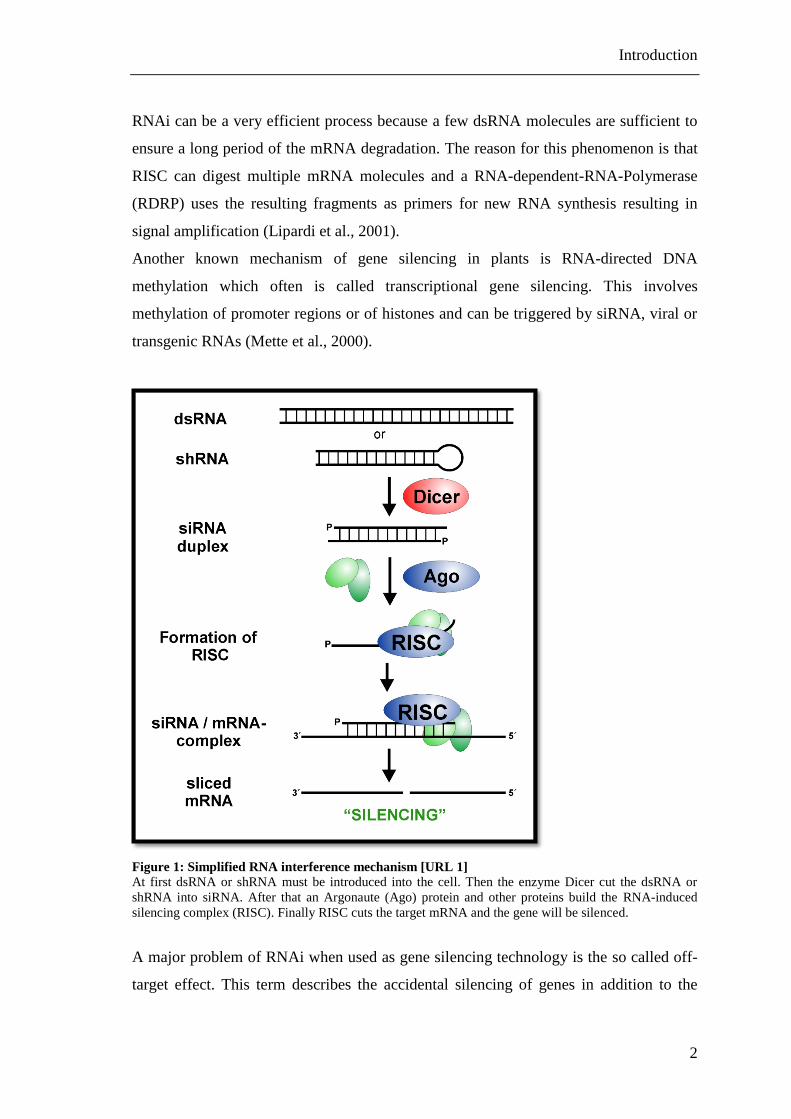
argonaute etc (Agrawal et al., 2003). A general and simplified view of the mechanism
of RNA interference is shown in Figure 1.
The RNAi mechanism typically is triggered by double stranded RNA (dsRNA).
Artificially, the formation of dsRNA can be achieved for example by introducing
hairpin constructs or antisense constructs into the cell. In the next step the dsRNA is
degraded to 19-25 bp fragments described as small interfering RNA (siRNA), by a
ribonuclease enzyme in the RNase III family commonly called Dicer or Dicer-like
(DCL). Dicer has four distinct domains: (1) an aminoterminal helicase domain, (2) dual
RNase III motifs, (3) a dsRNA binding domain and (4) a PAZ domain named after the
proteins Piwi Argonaut and Zwille (Agrawal et al., 2003; Kim, 2005). Divalent metal
ions such as Mg2+
and Mn2+
are required as cofactors in the dicer protein (Blaszczyk et
al., 2001). The RNase III domain of Dicer requires Adenosine-5'-triphosphate (ATP)
(Elbashir et al., 2001).
Dicer together with other proteins as well as RNA forms the so-called RNA-induced
silencing complex (RISC) (Hammond et al., 2001) that is capable of targeted
degradation of specific mRNA and knockdown of gene expression.
Introduction
2
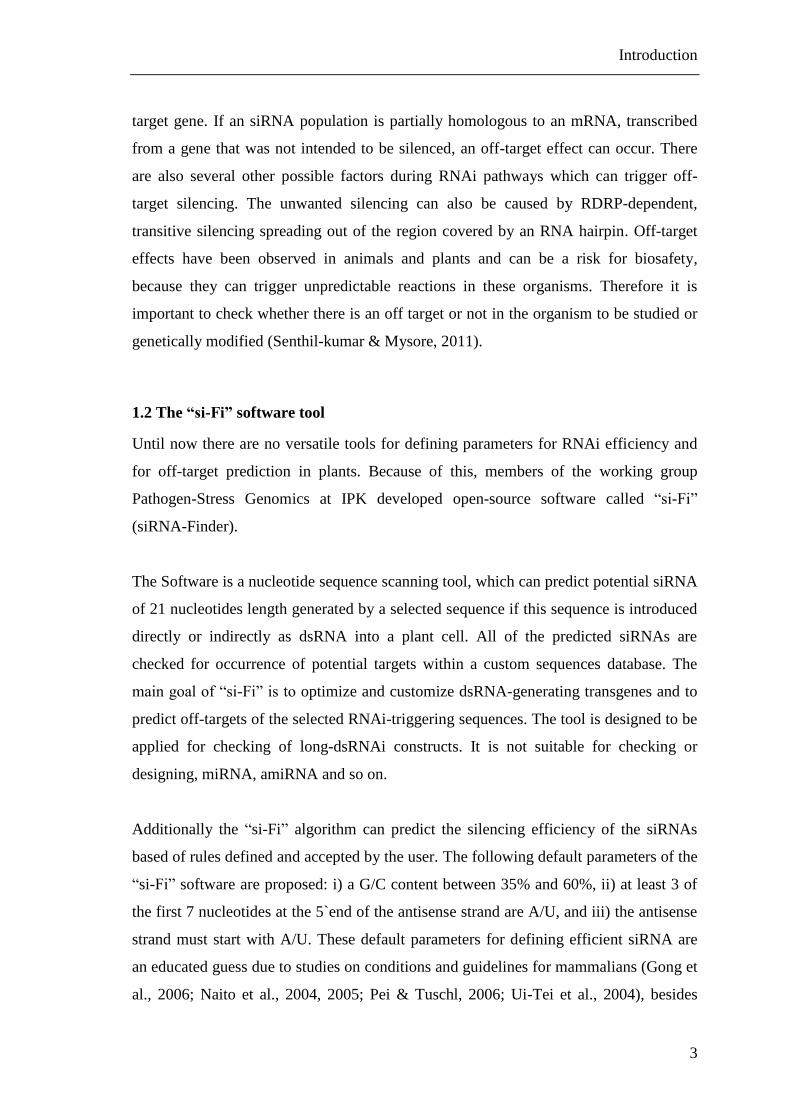
RNAi can be a very efficient process because a few dsRNA molecules are sufficient to
ensure a long period of the mRNA degradation. The reason for this phenomenon is that
RISC can digest multiple mRNA molecules and a RNA-dependent-RNA-Polymerase
(RDRP) uses the resulting fragments as primers for new RNA synthesis resulting in
signal amplification (Lipardi et al., 2001).
Another known mechanism of gene silencing in plants is RNA-directed DNA
methylation which often is called transcriptional gene silencing. This involves
methylation of promoter regions or of histones and can be triggered by siRNA, viral or
transgenic RNAs (Mette et al., 2000).
Figure 1: Simplified RNA interference mechanism [URL 1]
At first dsRNA or shRNA must be introduced into the cell. Then the enzyme Dicer cut the dsRNA or
shRNA into siRNA. After that an Argonaute (Ago) protein and other proteins build the RNA-induced
silencing complex (RISC). Finally RISC cuts the target mRNA and the gene will be silenced.
A major problem of RNAi when used as gene silencing technology is the so called off-
target effect. This term describes the accidental silencing of genes in addition to the
Introduction
3
target gene. If an siRNA population is partially homologous to an mRNA, transcribed
from a gene that was not intended to be silenced, an off-target effect can occur. There
are also several other possible factors during RNAi pathways which can trigger off-
target silencing. The unwanted silencing can also be caused by RDRP-dependent,
transitive silencing spreading out of the region covered by an RNA hairpin. Off-target
effects have been observed in animals and plants and can be a risk for biosafety,
because they can trigger unpredictable reactions in these organisms. Therefore it is
important to check whether there is an off target or not in the organism to be studied or
genetically modified (Senthil-kumar & Mysore, 2011).
1.2 The “si-Fi” software tool
Until now there are no versatile tools for defining parameters for RNAi efficiency and
for off-target prediction in plants. Because of this, members of the working group
Pathogen-Stress Genomics at IPK developed open-source software called “si-Fi”
(siRNA-Finder).
The Software is a nucleotide sequence scanning tool, which can predict potential siRNA
of 21 nucleotides length generated by a selected sequence if this sequence is introduced
directly or indirectly as dsRNA into a plant cell. All of the predicted siRNAs are
checked for occurrence of potential targets within a custom sequences database. The
main goal of “si-Fi” is to optimize and customize dsRNA-generating transgenes and to
predict off-targets of the selected RNAi-triggering sequences. The tool is designed to be
applied for checking of long-dsRNAi constructs. It is not suitable for checking or
designing, miRNA, amiRNA and so on.
Additionally the “si-Fi” algorithm can predict the silencing efficiency of the siRNAs
based of rules defined and accepted by the user. The following default parameters of the
“si-Fi” software are proposed: i) a G/C content between 35% and 60%, ii) at least 3 of
the first 7 nucleotides at the 5`end of the antisense strand are A/U, and iii) the antisense
strand must start with A/U. These default parameters for defining efficient siRNA are
an educated guess due to studies on conditions and guidelines for mammalians (Gong et
al., 2006; Naito et al., 2004, 2005; Pei & Tuschl, 2006; Ui-Tei et al., 2004), besides
Introduction
4
studies for plants, which are also based on rules for mammalians (Xu et al., 2006).
However, further adjustments to define efficient siRNA in plants have remained
unsolved. This parameterization option gives the user control over the parameters for
defining efficient siRNA [URL 2].
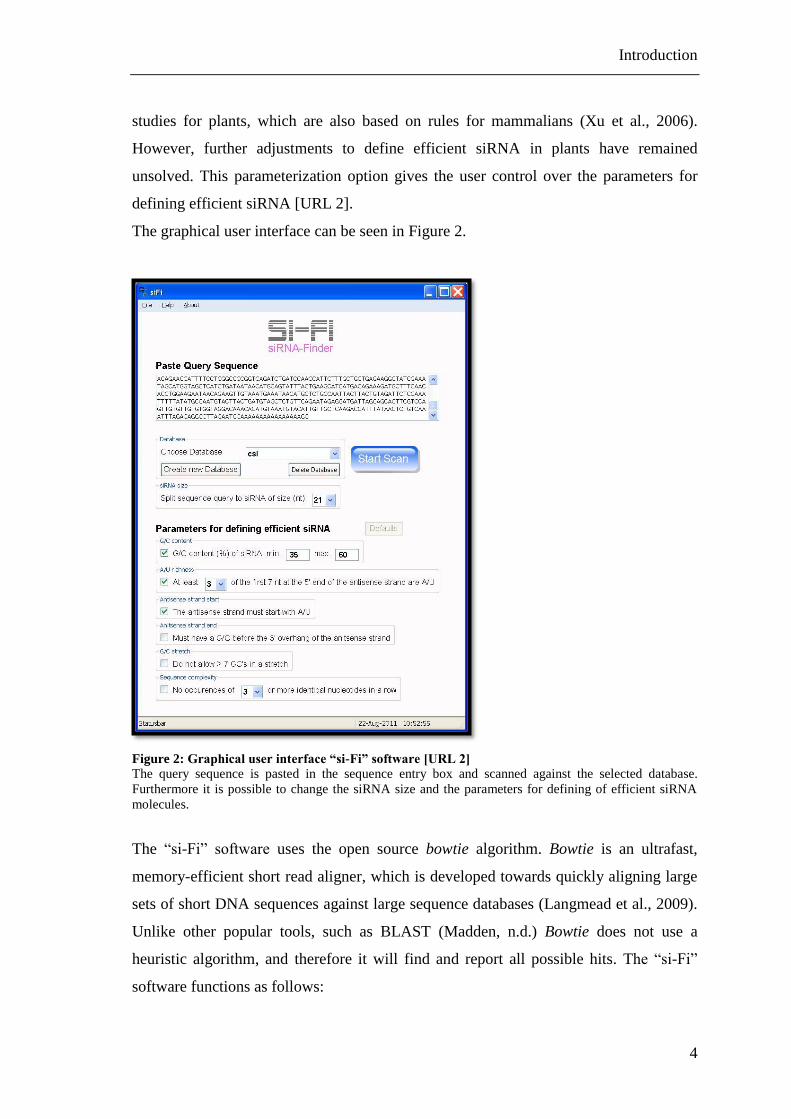
The graphical user interface can be seen in Figure 2.
Figure 2: Graphical user interface “si-Fi” software [URL 2]
The query sequence is pasted in the sequence entry box and scanned against the selected database.
Furthermore it is possible to change the siRNA size and the parameters for defining of efficient siRNA
molecules.
The “si-Fi” software uses the open source bowtie algorithm. Bowtie is an ultrafast,
memory-efficient short read aligner, which is developed towards quickly aligning large
sets of short DNA sequences against large sequence databases (Langmead et al., 2009).
Unlike other popular tools, such as BLAST (Madden, n.d.) Bowtie does not use a
heuristic algorithm, and therefore it will find and report all possible hits. The “si-Fi”
software functions as follows:
Introduction
5
The process starts with creating a new sequence database by loading a FASTA file.
After selecting a FASTA file, the bowtie-build indexer builds an index of the DNA
sequences. The output is a set of files which together constitute the index. This index
represents the new database and the original multiple FASTA file is no longer used
[URL 9].
To start a scan with “si-Fi” an existing database must be selected and a query RNAi
triggering sequence must be pasted into the corresponding field. With the start of the
scan the query sequence will be split into siRNA with a size selected by the user. Both
forward and reverse complement sequences will be created. After that the bowtie-
aligner searches for siRNA matches against the selected database. The software will
report all valid alignments per read. In the next step the “si-Fi” software takes the
bowtie-aligner results and checks every siRNA hit, which was found, for efficiency.
This check is according to the chosen parameters for defining efficient siRNA. Finally
the software ends up with one list that includes all hits and another list that includes
only the potentially efficient hits. For the graphical display, the software count how
many siRNA nucleotides are at every query sequence position and plot all hits and the
potentially efficient hits into one graphic.
1.3 Barley
Barley (Hordeum vulgare L.) is one of the most important crop plants in the world. It is
a member of the tribe Triticeae within the grass family Poceae and belongs to the genus
Hordeum. Cultivated barley (Hordeum vulgare spp vulgare) is a diploid organism with
a large haploid genome of approximately 5.1 gigabases. It is one of the earliest
domesticated crop plants in the world and represents the fourth most abundant cereal
after wheat, maize and rice. As a crop species barley has particular importance because
it is widely adapted to variable environmental conditions. In addition barley is more
stress tolerant than wheat and because of this it remains a major food source in poorer
countries. The range of uses implies mainly animal feed, human food and malt
production. Beside its importance as a nutritional source barley has been established as
a model organism, because it is a diploid, inbreeding and temperate crop. In addition
large ex-situ germplasm collections are existing carrying huge number of potentially
Introduction
6
valuable alleles. Enormous amount of expert knowledge concerning individual traits has
been accumulated by the breeders. Valuable genomics resources were established for
barley (The International Barley Genome Sequencing Consortium, 2012).
1.4 The phytopathogenic fungus Blumera graminis
Blumera graminis is an obligate biotrophic ascomycete belonging to the Erysiphales. It
causes powdery mildew of grasses, including the crop plants wheat and barley. Cereals
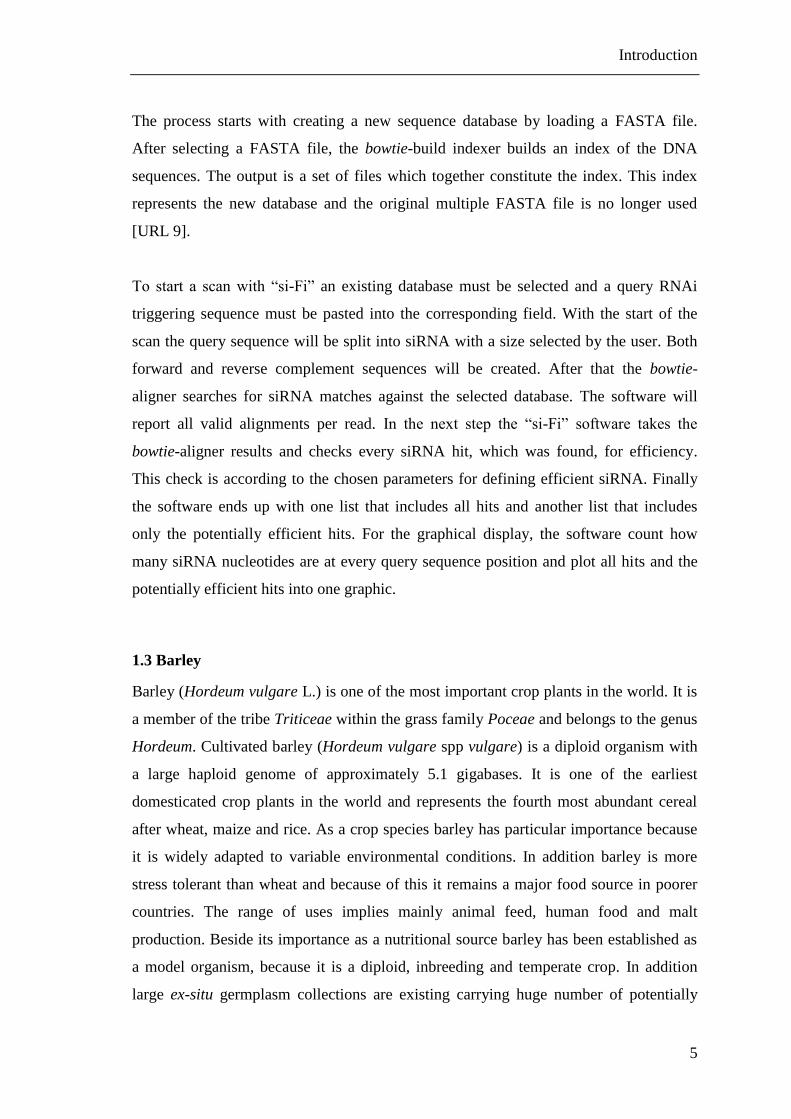
infected with Blumera graminis (B. graminis) have typical powdery “pustules” (Figure
3) produced by the mildew colonies and result into a reduced grain yield. B. graminis
shows an extremely host specificity. The “formae specialis” tritici (wheat) and hordei
(barley) can only infect the corresponding cereal species. All powdery mildews are
strict obligate biotrophic pathogens, which means, that they are absolutely dependent on
a living host plant (Dean et al., 2012).
Figure 3: Barley leaves infected with B. graminis f.sp hordei (Dean et al., 2012)
On the outer surface of the barley leaves grow the powdery mildew colonies.
Introduction
7
1.5 Barley – Blumeria graminis - interaction
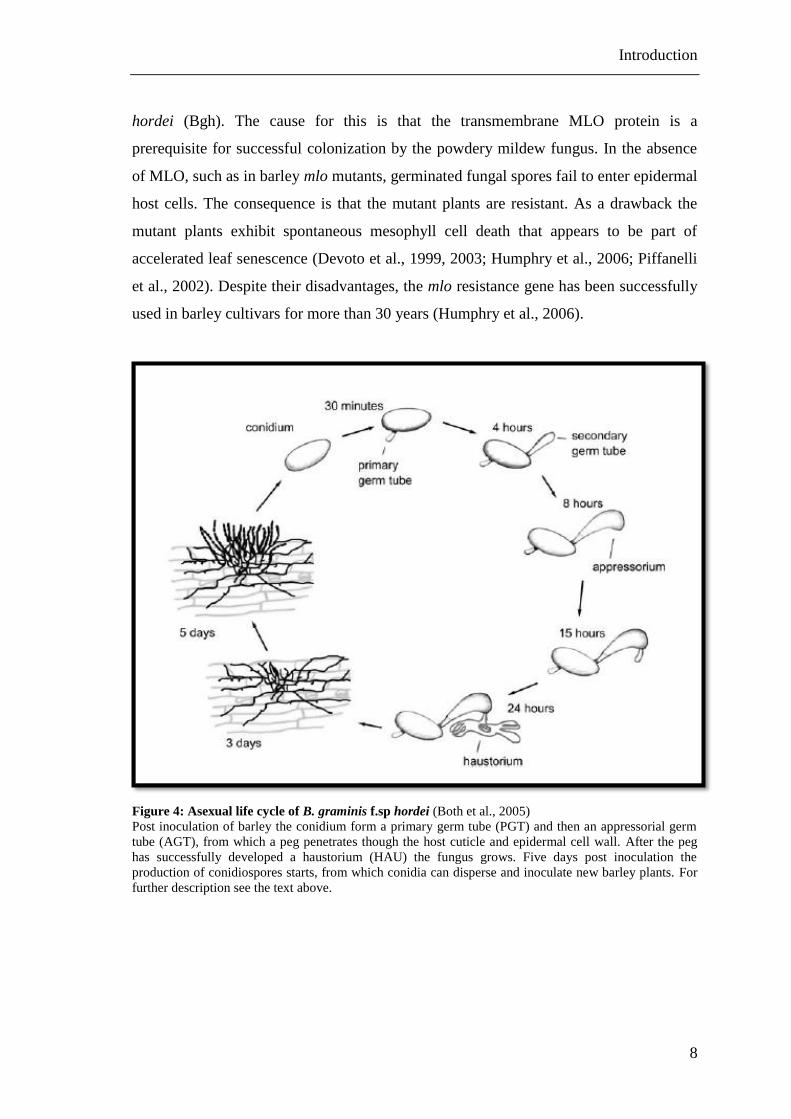
Powdery mildew epidemics are caused due to the short asexual life cycle of B. graminis
and massive production of airborne spores (conidia). The 5 day cycle starts with the
landing of conidia on barley leaf or stem surfaces. Within 0.5 hours post inoculation
(hpi), a conidium germinates and a primary germ tube (PGT) emerges, which is
dedicated to surface sensing. About 2 hpi the PGT is fully developed and approximately
5 to10 µm long. A few hours later an appressorial germ tube (AGT) is formed. The
AGT is 30 to 40 µm long and separated from the conidium by a septum. A bat-like
structure called appressorium (APP) is formed at the tip of the AGT. Approximately 10
- 12 hpi the APP forms a penetration peg which attempts to penetrate the plant cell wall.
If this penetration is successful, the fungus develops its feeding organ called haustorium
(HAU). The HAU invaginates but does not penetrate the cell membrane. Establishing of
an HAU assures the further growth of the fungus and is a critical stage in fungal
development. Approximately 24 hpi the fungus forms elongating secondary hyphae
(ESH) which can differentiate into new AGTs forming secondary HAU. Four to five
days post inoculation the fungal colony starts the production of conidiophores and the
formation of ripe conidia. These can be dispersed easily by wind and let the cycle start
again (Figure 4).
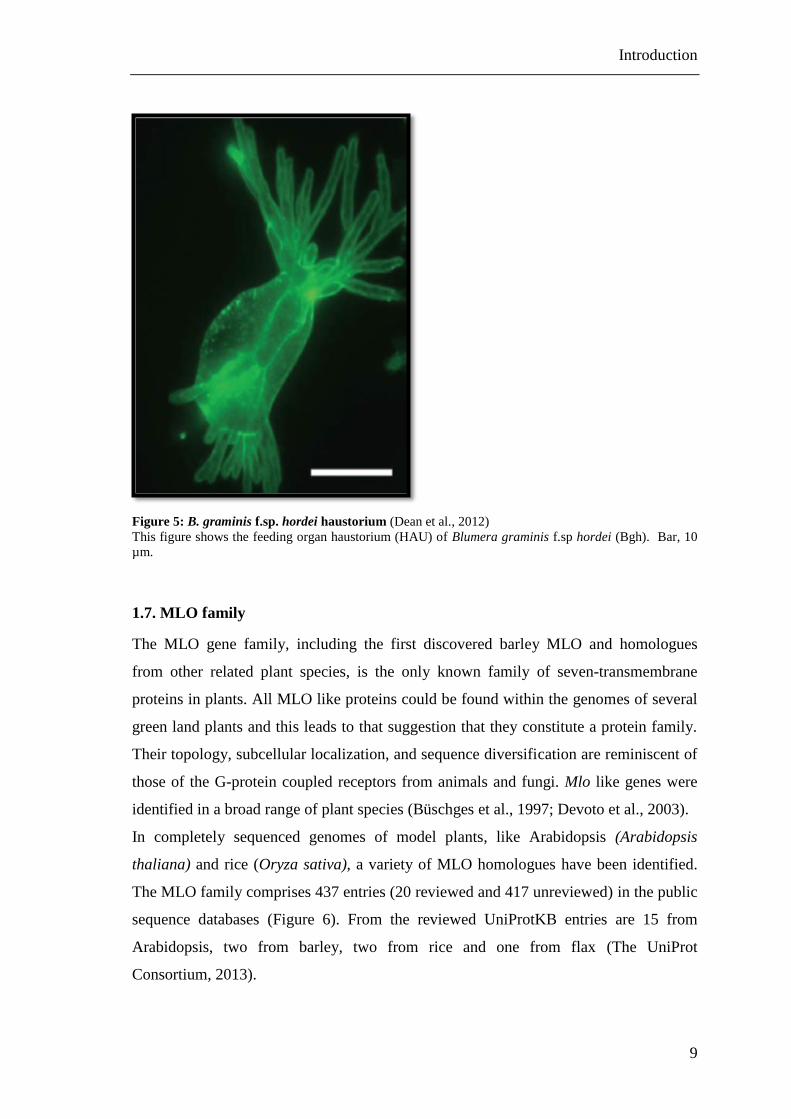
During its entire development B. graminis stays on the leaf surface and attacks only
epidermal cells, which renders it readily accessible for microscopic studies (Figure 5).
Because of this and other facts like: relatively easy to maintain, massive sporulation,
fast and synchronous development, reduced biological complexity, easy to observe
(surface growth), closely related “nonhost” forma specialis and high host specificity,
sequenced genome and high agronomical relevance, B.graminis is a model organism to
study other mildews and other obligate biotrophic pathogens (Baum et al., 2011; Both et
al., 2005; Dean et al., 2012).
1.6 mlo resistance
Plant pathogen resistance can be introduced by mutations in single host genes. These
mutants generally exhibit resistance to single or multiple classes of pathogens. The
barley mlo gene mutant confers a broad spectrum resistance to Blumera graminis f.sp
Introduction
8
hordei (Bgh). The cause for this is that the transmembrane MLO protein is a
prerequisite for successful colonization by the powdery mildew fungus. In the absence
of MLO, such as in barley mlo mutants, germinated fungal spores fail to enter epidermal
host cells. The consequence is that the mutant plants are resistant. As a drawback the
mutant plants exhibit spontaneous mesophyll cell death that appears to be part of
accelerated leaf senescence (Devoto et al., 1999, 2003; Humphry et al., 2006; Piffanelli
et al., 2002). Despite their disadvantages, the mlo resistance gene has been successfully
used in barley cultivars for more than 30 years (Humphry et al., 2006).
Figure 4: Asexual life cycle of B. graminis f.sp hordei (Both et al., 2005)
Post inoculation of barley the conidium form a primary germ tube (PGT) and then an appressorial germ
tube (AGT), from which a peg penetrates though the host cuticle and epidermal cell wall. After the peg
has successfully developed a haustorium (HAU) the fungus grows. Five days post inoculation the
production of conidiospores starts, from which conidia can disperse and inoculate new barley plants. For
further description see the text above.
Introduction
9
Figure 5: B. graminis f.sp. hordei haustorium (Dean et al., 2012)
This figure shows the feeding organ haustorium (HAU) of Blumera graminis f.sp hordei (Bgh). Bar, 10
µm.
1.7. MLO family
The MLO gene family, including the first discovered barley MLO and homologues
from other related plant species, is the only known family of seven-transmembrane
proteins in plants. All MLO like proteins could be found within the genomes of several
green land plants and this leads to that suggestion that they constitute a protein family.
Their topology, subcellular localization, and sequence diversification are reminiscent of
those of the G-protein coupled receptors from animals and fungi. Mlo like genes were
identified in a broad range of plant species (Büschges et al., 1997; Devoto et al., 2003).
In completely sequenced genomes of model plants, like Arabidopsis (Arabidopsis
thaliana) and rice (Oryza sativa), a variety of MLO homologues have been identified.
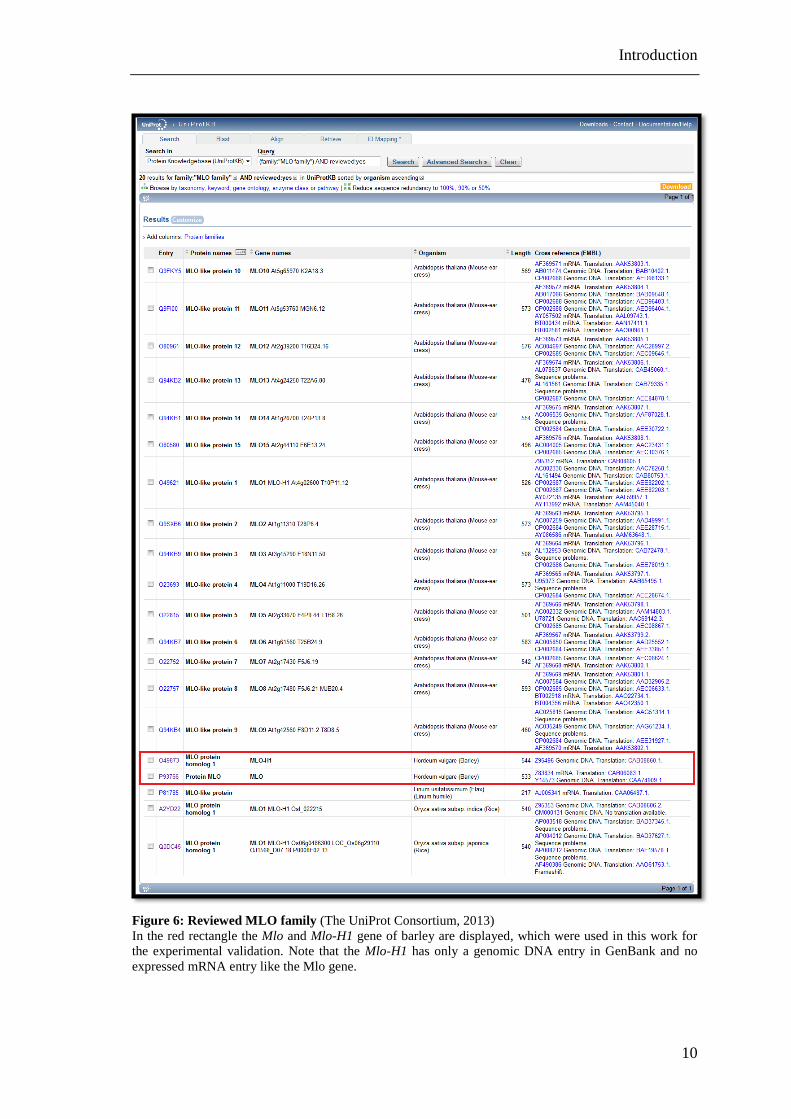
The MLO family comprises 437 entries (20 reviewed and 417 unreviewed) in the public
sequence databases (Figure 6). From the reviewed UniProtKB entries are 15 from
Arabidopsis, two from barley, two from rice and one from flax (The UniProt
Consortium, 2013).
Introduction
10
Figure 6: Reviewed MLO family (The UniProt Consortium, 2013)
In the red rectangle the Mlo and Mlo-H1 gene of barley are displayed, which were used in this work for
the experimental validation. Note that the Mlo-H1 has only a genomic DNA entry in GenBank and no
expressed mRNA entry like the Mlo gene.
Introduction
11
1.8 Particle bombardment / biolistics
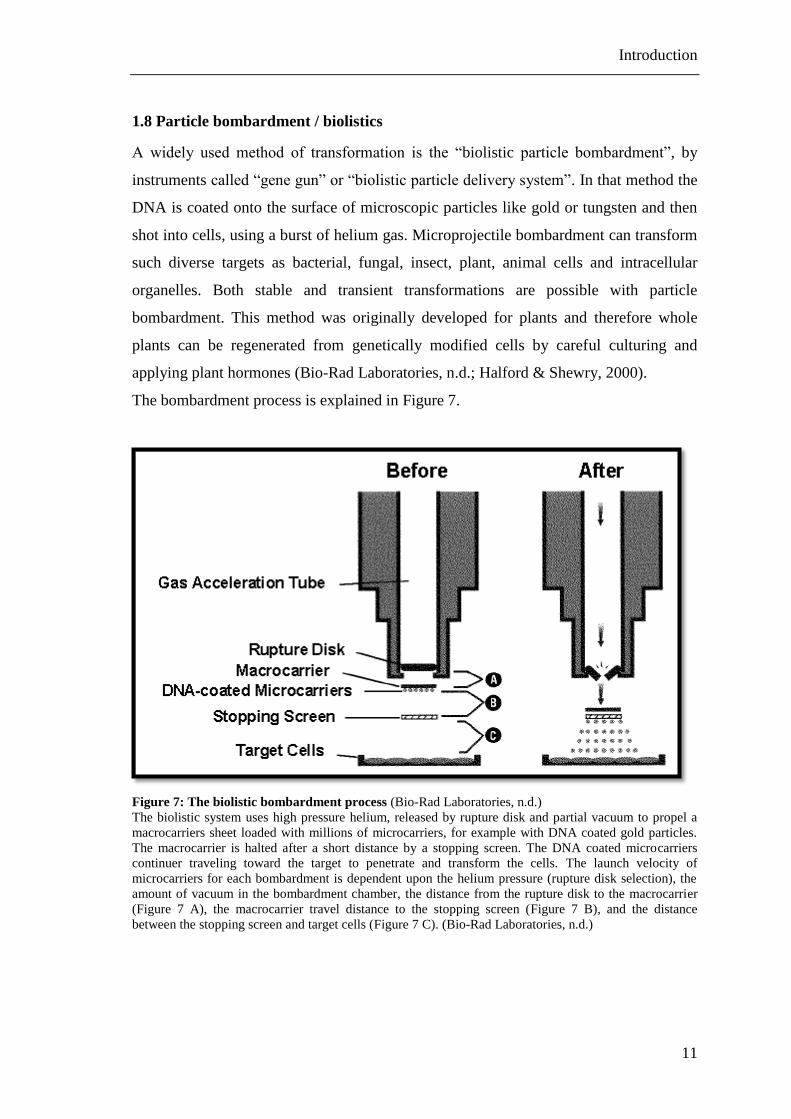
A widely used method of transformation is the “biolistic particle bombardment”, by
instruments called “gene gun” or “biolistic particle delivery system”. In that method the
DNA is coated onto the surface of microscopic particles like gold or tungsten and then
shot into cells, using a burst of helium gas. Microprojectile bombardment can transform
such diverse targets as bacterial, fungal, insect, plant, animal cells and intracellular
organelles. Both stable and transient transformations are possible with particle
bombardment. This method was originally developed for plants and therefore whole
plants can be regenerated from genetically modified cells by careful culturing and
applying plant hormones (Bio-Rad Laboratories, n.d.; Halford & Shewry, 2000).
The bombardment process is explained in Figure 7.
Figure 7: The biolistic bombardment process (Bio-Rad Laboratories, n.d.)
The biolistic system uses high pressure helium, released by rupture disk and partial vacuum to propel a
macrocarriers sheet loaded with millions of microcarriers, for example with DNA coated gold particles.
The macrocarrier is halted after a short distance by a stopping screen. The DNA coated microcarriers
continuer traveling toward the target to penetrate and transform the cells. The launch velocity of
microcarriers for each bombardment is dependent upon the helium pressure (rupture disk selection), the
amount of vacuum in the bombardment chamber, the distance from the rupture disk to the macrocarrier
(Figure 7 A), the macrocarrier travel distance to the stopping screen (Figure 7 B), and the distance
between the stopping screen and target cells (Figure 7 C). (Bio-Rad Laboratories, n.d.)
Introduction
12
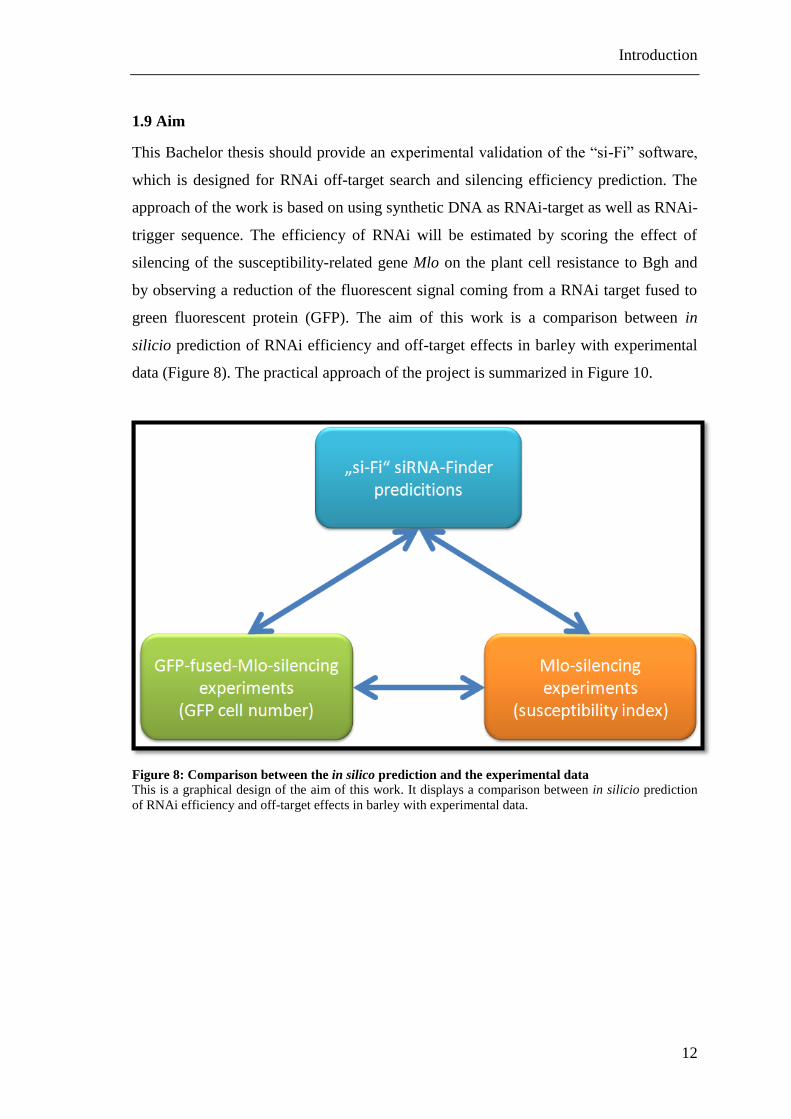
1.9 Aim
This Bachelor thesis should provide an experimental validation of the “si-Fi” software,
which is designed for RNAi off-target search and silencing efficiency prediction. The
approach of the work is based on using synthetic DNA as RNAi-target as well as RNAi-
trigger sequence. The efficiency of RNAi will be estimated by scoring the effect of
silencing of the susceptibility-related gene Mlo on the plant cell resistance to Bgh and
by observing a reduction of the fluorescent signal coming from a RNAi target fused to
green fluorescent protein (GFP). The aim of this work is a comparison between in
silicio prediction of RNAi efficiency and off-target effects in barley with experimental
data (Figure 8). The practical approach of the project is summarized in Figure 10.
Figure 8: Comparison between the in silico prediction and the experimental data
This is a graphical design of the aim of this work. It displays a comparison between in silicio prediction
of RNAi efficiency and off-target effects in barley with experimental data.
Materials and Methods
13
2 Materials and methods
2.1 Materials
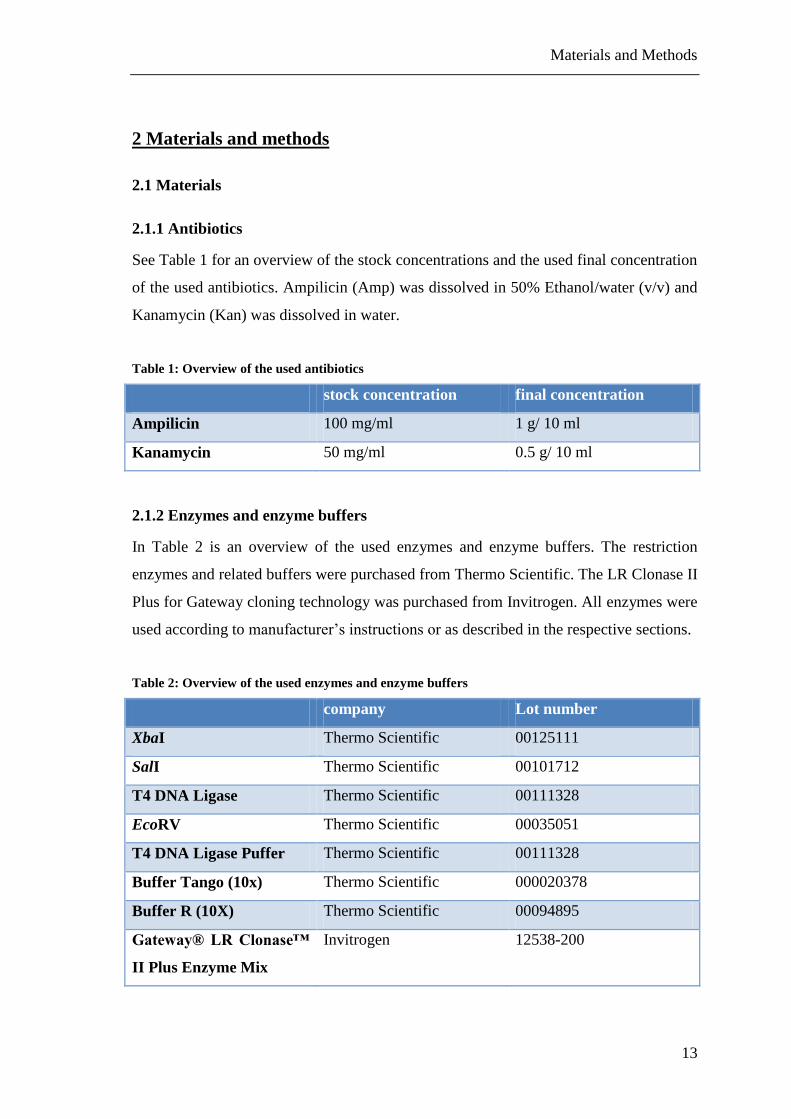
2.1.1 Antibiotics
See Table 1 for an overview of the stock concentrations and the used final concentration
of the used antibiotics. Ampilicin (Amp) was dissolved in 50% Ethanol/water (v/v) and
Kanamycin (Kan) was dissolved in water.
Table 1: Overview of the used antibiotics
stock concentration final concentration
Ampilicin 100 mg/ml 1 g/ 10 ml
Kanamycin 50 mg/ml 0.5 g/ 10 ml
2.1.2 Enzymes and enzyme buffers
In Table 2 is an overview of the used enzymes and enzyme buffers. The restriction
enzymes and related buffers were purchased from Thermo Scientific. The LR Clonase II
Plus for Gateway cloning technology was purchased from Invitrogen. All enzymes were
used according to manufacturer’s instructions or as described in the respective sections.
Table 2: Overview of the used enzymes and enzyme buffers
company Lot number
XbaI Thermo Scientific 00125111
SalI Thermo Scientific 00101712
T4 DNA Ligase Thermo Scientific 00111328
EcoRV Thermo Scientific 00035051
T4 DNA Ligase Puffer Thermo Scientific 00111328
Buffer Tango (10x) Thermo Scientific 000020378
Buffer R (10X) Thermo Scientific 00094895
Gateway® LR Clonase™
II Plus Enzyme Mix
Invitrogen 12538-200
Materials and Methods
14
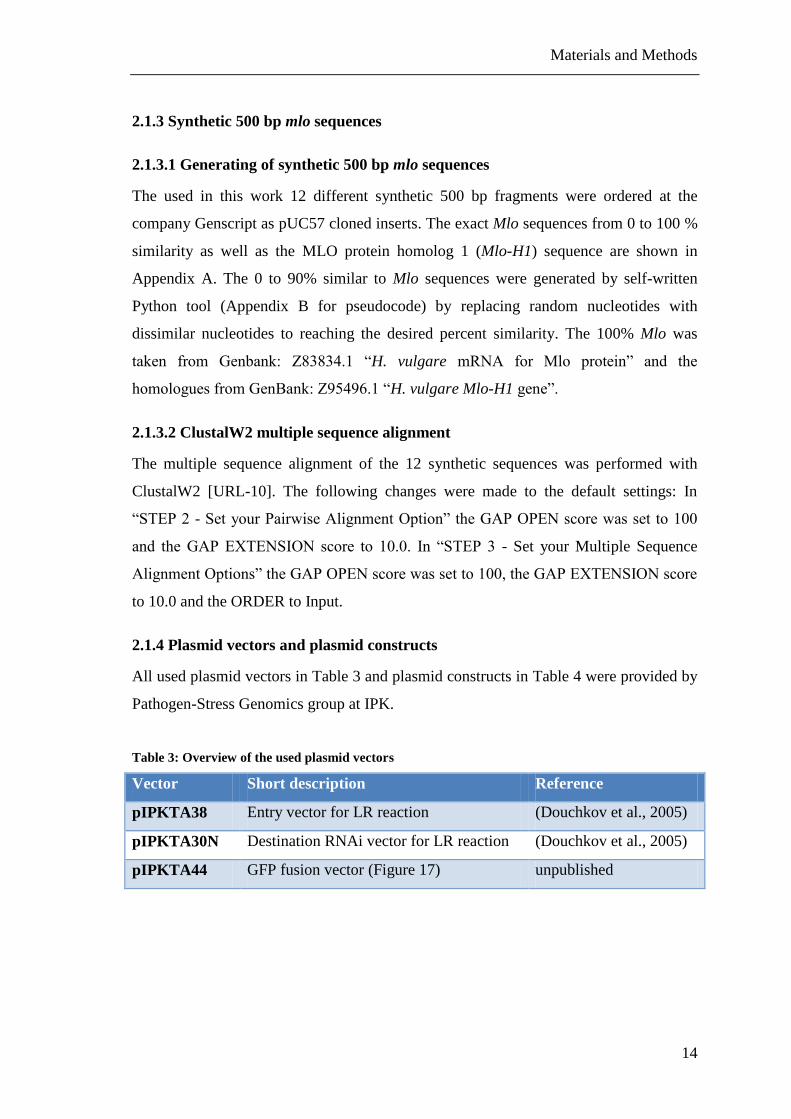
2.1.3 Synthetic 500 bp mlo sequences
2.1.3.1 Generating of synthetic 500 bp mlo sequences
The used in this work 12 different synthetic 500 bp fragments were ordered at the
company Genscript as pUC57 cloned inserts. The exact Mlo sequences from 0 to 100 %
similarity as well as the MLO protein homolog 1 (Mlo-H1) sequence are shown in
Appendix A. The 0 to 90% similar to Mlo sequences were generated by self-written
Python tool (Appendix B for pseudocode) by replacing random nucleotides with
dissimilar nucleotides to reaching the desired percent similarity. The 100% Mlo was
taken from Genbank: Z83834.1 “H. vulgare mRNA for Mlo protein” and the
homologues from GenBank: Z95496.1 “H. vulgare Mlo-H1 gene”.
2.1.3.2 ClustalW2 multiple sequence alignment
The multiple sequence alignment of the 12 synthetic sequences was performed with
ClustalW2 [URL-10]. The following changes were made to the default settings: In
“STEP 2 - Set your Pairwise Alignment Option” the GAP OPEN score was set to 100
and the GAP EXTENSION score to 10.0. In “STEP 3 - Set your Multiple Sequence
Alignment Options” the GAP OPEN score was set to 100, the GAP EXTENSION score
to 10.0 and the ORDER to Input.
2.1.4 Plasmid vectors and plasmid constructs
All used plasmid vectors in Table 3 and plasmid constructs in Table 4 were provided by
Pathogen-Stress Genomics group at IPK.
Table 3: Overview of the used plasmid vectors
Vector Short description Reference
pIPKTA38 Entry vector for LR reaction (Douchkov et al., 2005)
pIPKTA30N Destination RNAi vector for LR reaction (Douchkov et al., 2005)
pIPKTA44 GFP fusion vector (Figure 17) unpublished
Materials and Methods
15
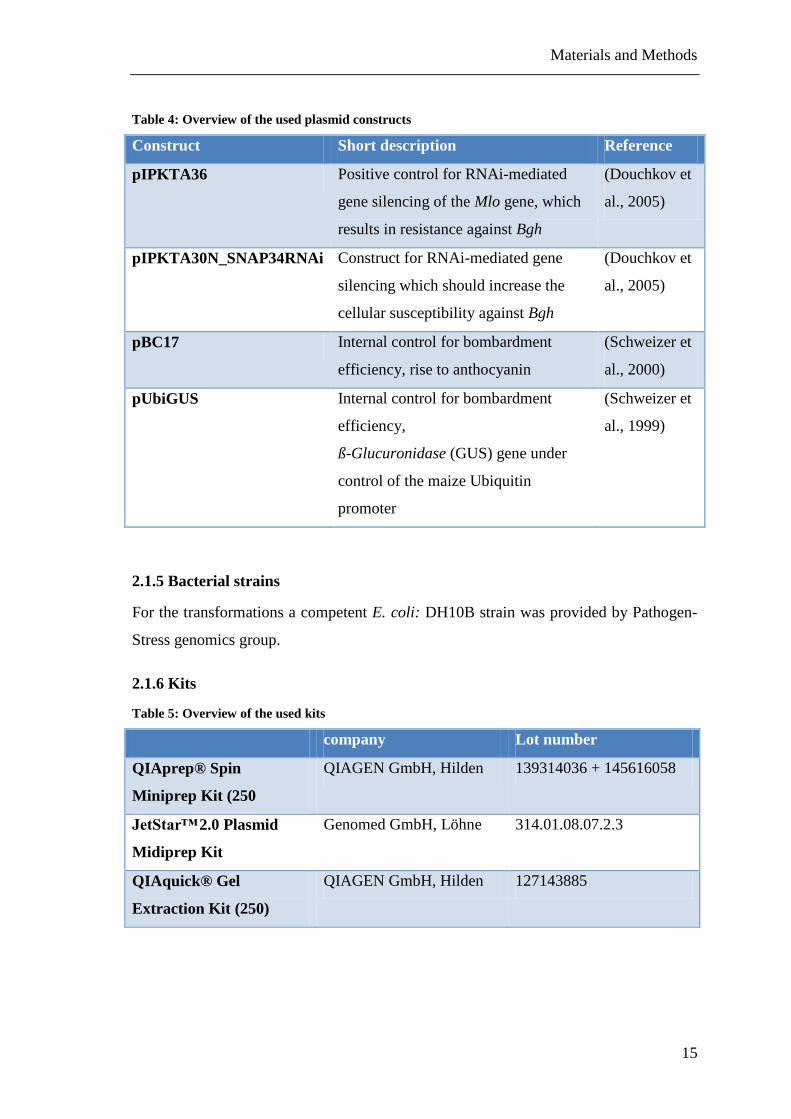
Table 4: Overview of the used plasmid constructs
Construct Short description Reference
pIPKTA36 Positive control for RNAi-mediated
gene silencing of the Mlo gene, which
results in resistance against Bgh
(Douchkov et
al., 2005)
pIPKTA30N_SNAP34RNAi Construct for RNAi-mediated gene
silencing which should increase the
cellular susceptibility against Bgh
(Douchkov et
al., 2005)
pBC17 Internal control for bombardment
efficiency, rise to anthocyanin
(Schweizer et
al., 2000)
pUbiGUS Internal control for bombardment
efficiency,
ß-Glucuronidase (GUS) gene under
control of the maize Ubiquitin
promoter
(Schweizer et
al., 1999)
2.1.5 Bacterial strains
For the transformations a competent E. coli: DH10B strain was provided by Pathogen-
Stress genomics group.
2.1.6 Kits
Table 5: Overview of the used kits
company Lot number
QIAprep® Spin
Miniprep Kit (250
QIAGEN GmbH, Hilden 139314036 + 145616058
JetStar™ 2.0 Plasmid
Midiprep Kit
Genomed GmbH, Löhne 314.01.08.07.2.3
QIAquick® Gel
Extraction Kit (250)
QIAGEN GmbH, Hilden 127143885
Materials and Methods
16
2.1.7 Software used
2.1.7.1 DNASTAR Lasergene®
DNAStar Lasergene is a proprietary suite of software tools for molecular biology
analyses [URL 3]. In this work the software SeqBuilder from DNASTAR Lasergene®
Version 10.1.1 was used to create all vector maps.
2.1.7.2 GIMP
GIMP is an acronym for GNU Image Manipulation Program. It is a freely distributed
program for such tasks as photo retouching, image composition and image authoring
[URL 4]. GIMP Version: 2.8 were used to process all gel electrophoresis images. In all
these images the colors were inverted and the relevant labels were placed.
2.1.7.3 LabTools
LabTools is a program for molecular biologists developed to assist them in common
calculations in the lab, e.g. DNA ligation ratios, oligo annealing temperatures in a PCR
reaction, solution calculator or unit conversions [URL 2]. For this work, the "ligation
Calculator" of LabTools Version: 2.1.2-0008Beta was mainly used to calculate the
required volumes for the ligation reactions.
2.1.7.4 “si-Fi” (siRNA Finder)
The prediction of targets and off-targets was done with the „si-Fi“ Version 3.1.0 (see
section 1.2). All 12 mlo sequences were checked against the HarvEST:Barley Version
1.73 database, sequence assembly Nr. 35 [URL 11], with an efficient siRNA size of 21
nt and default parameters.
2.1.8 Chemicals
All chemicals were purchased from Carl Roth GmbH + Co. KG, Karlsruhe, except as
otherwise stated.
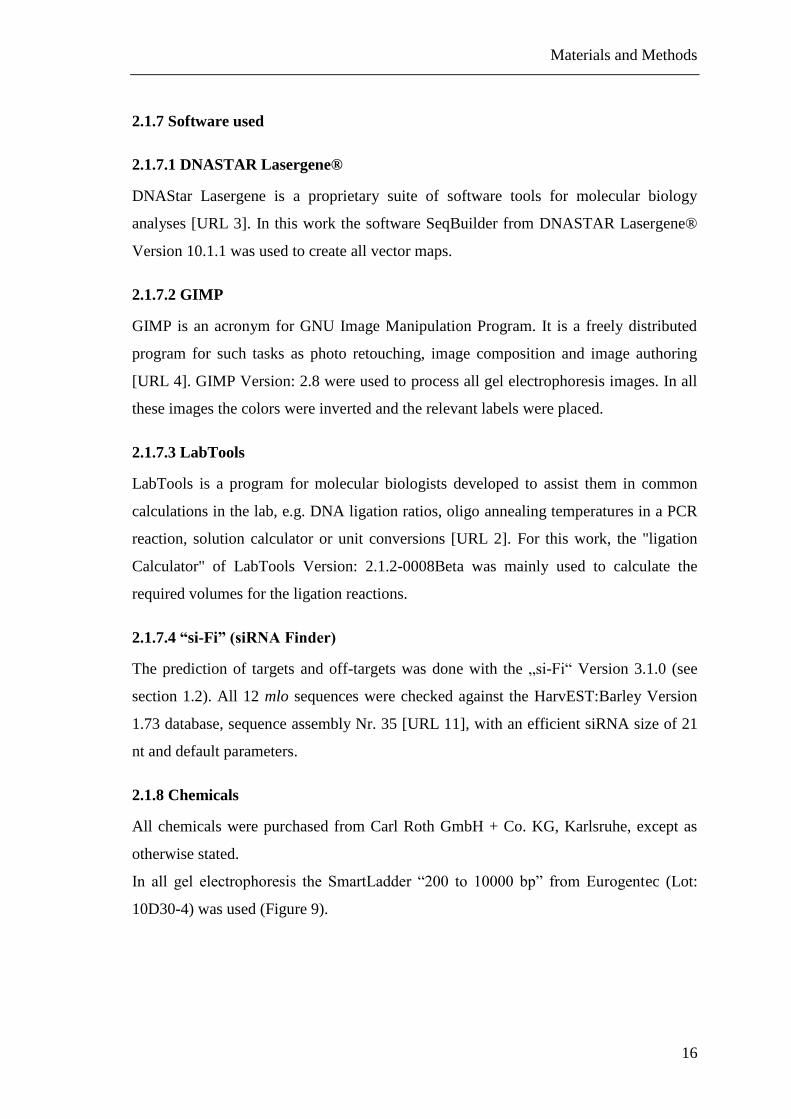
In all gel electrophoresis the SmartLadder “200 to 10000 bp” from Eurogentec (Lot:
10D30-4) was used (Figure 9).
Materials and Methods
17
Figure 9: SmartLadder Eurogentec [URL 5]
The Figure shows the 14 regularly spaced bands from 200 to 10 000 bp. The 1000 and 10000 bp bands
have a higher intensity than the others to allow quick and easy identification. The size of each band is an
exact multiple of 100 bp [URL 5].
2.1.9 Generally used media and solutions
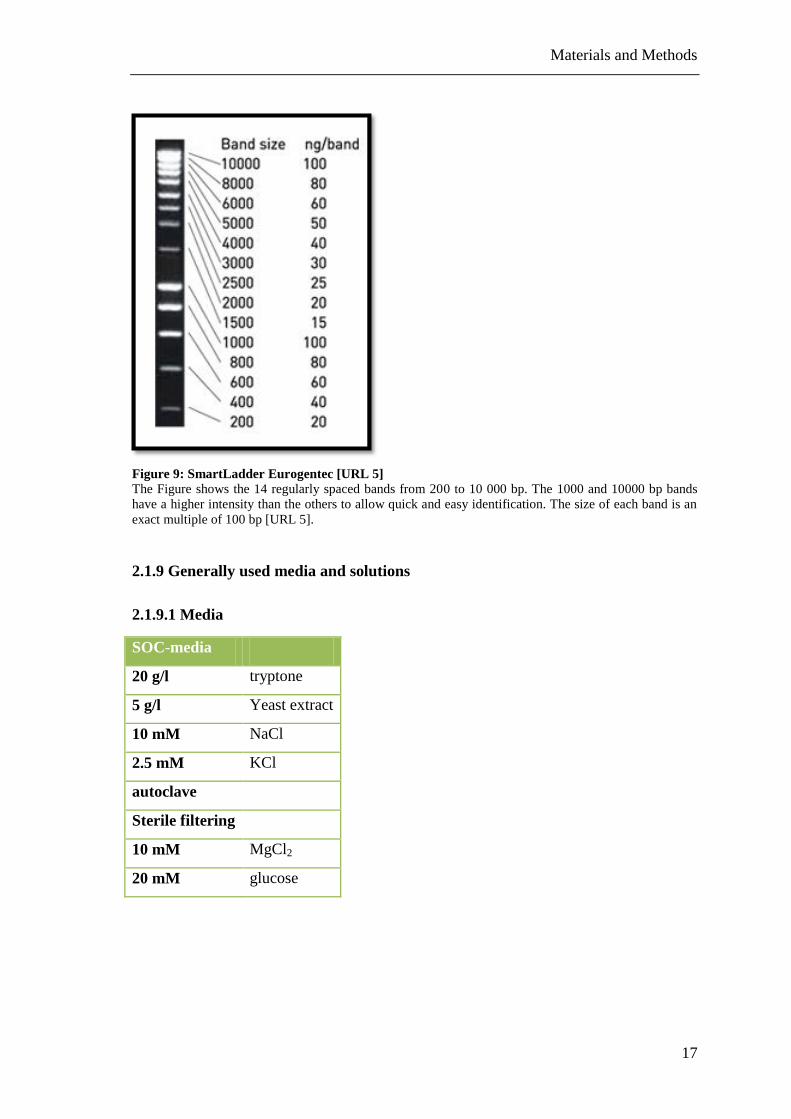
2.1.9.1 Media
SOC-media
20 g/l tryptone
5 g/l Yeast extract
10 mM NaCl
2.5 mM KCl
autoclave
Sterile filtering
10 mM MgCl2
20 mM glucose
Materials and Methods
18
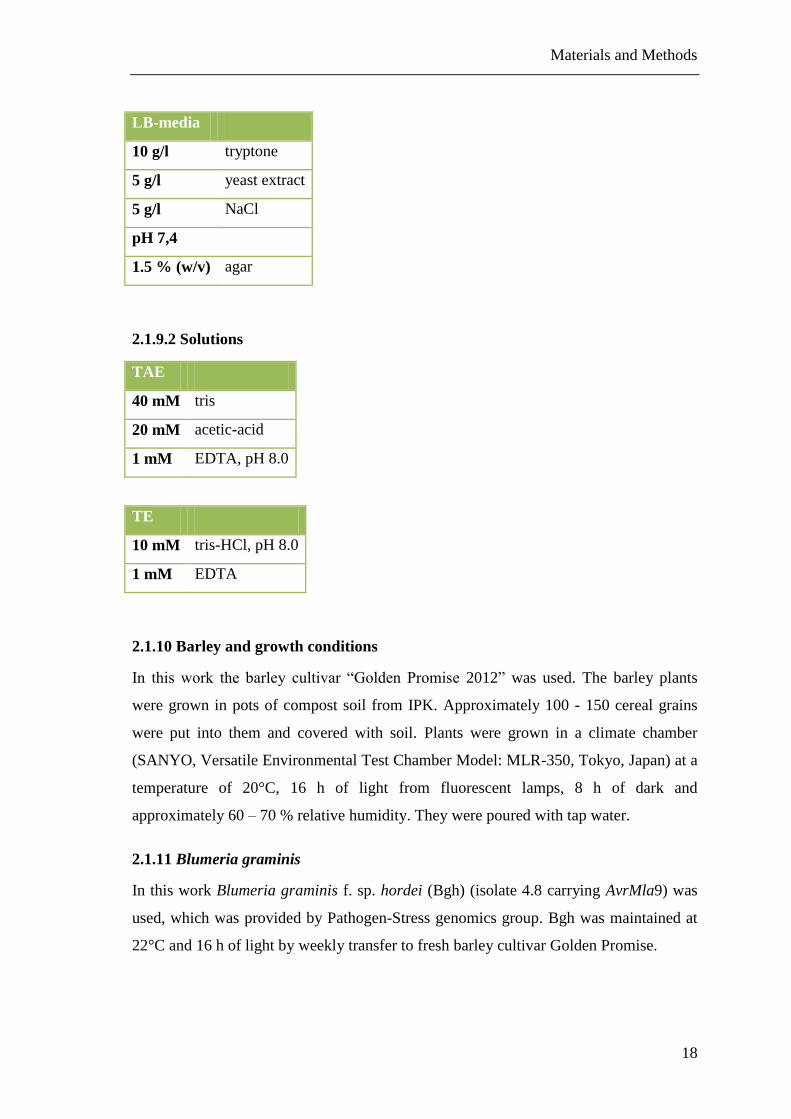
LB-media
10 g/l tryptone
5 g/l yeast extract
5 g/l NaCl
pH 7,4
1.5 % (w/v) agar
2.1.9.2 Solutions
TAE
40 mM tris
20 mM acetic-acid
1 mM EDTA, pH 8.0
TE
10 mM tris-HCl, pH 8.0
1 mM EDTA
2.1.10 Barley and growth conditions
In this work the barley cultivar “Golden Promise 2012” was used. The barley plants
were grown in pots of compost soil from IPK. Approximately 100 - 150 cereal grains
were put into them and covered with soil. Plants were grown in a climate chamber
(SANYO, Versatile Environmental Test Chamber Model: MLR-350, Tokyo, Japan) at a
temperature of 20°C, 16 h of light from fluorescent lamps, 8 h of dark and
approximately 60 – 70 % relative humidity. They were poured with tap water.
2.1.11 Blumeria graminis
In this work Blumeria graminis f. sp. hordei (Bgh) (isolate 4.8 carrying AvrMla9) was
used, which was provided by Pathogen-Stress genomics group. Bgh was maintained at
22°C and 16 h of light by weekly transfer to fresh barley cultivar Golden Promise.
Materials and Methods
19
2.2 Methods
2.2.1 General standard methods
2.2.1.1 Agarose gel electrophoresis
The separation of DNA to their fragment sizes were performed with agarose gel
electrophoresis. For the gel electrophoresis a 1.0% Agarose Gel was made by solving
1% (w/v) agarose in 1x TAE buffer. The suspension was heated to complete melting of
the agarose. Afterwards 1% (w/v) of the fluorescent dye Ethidium bromide (EtBr) was
added after cooling down to about 55°C. Next the gel was poured into the gel
electrophoresis tray with a corresponding gel comp, and was left to solidify for at least
30 minutes. The electrophoretic separation was carried out in 1x TAE buffer at 100V
for about 45 minutes. Finally a picture of the gel was taken using the UV gel imaging
system (INTAS Science Imaging Instruments GmbH, Göttingen, Germany).
2.2.1.2 Gel extraction with Qiagen: “QIAquick® Gel Extraction Kit”
The extraction of DNA fragments from agarose gels was performed as described in the
kit protocol: “QIAquick Gel Extraction Kit Protocol using a microcentrifuge”. The
fragment were eluted from the column with 30 µL EB.
2.2.1.3 Plasmid isolation
The isolation of extrachromosomal plasmid DNA from bacteria was made with the
“QIAprep® Spin Miniprep Kit” for minipreps or with the “JetStar™ 2.0 Plasmid
Midiprep Kit” for midipreps. All steps were performed as described in the respective kit
protocol. For both kits an overnight culture of bacteria was incubated under selection
pressure of an antibiotic in LB medium at 37 ° C and 200 rpm agitation.
2.2.1.4 Optical density measurement
The quantification of isolated nucleic acids was performed by using a Photometer
(Biophotometer, Eppendorf, Hamburg, Germany). A sample was diluted 1:100 and the
concentration was determined. As reference “BLANK” sample, water was used.
Materials and Methods
20
2.2.1.5 Transformation of E.coli
To perform the transformations, 5 µl of the respective vector DNA were pipetted to
competent E.coli DH10B cells. Then this mix was incubated for 30 minutes on ice.
After that this mix was heat shocked at 42°C for 20 seconds. Subsequently it was
chilled on ice for one minute. Thereafter 100 µl SOC media was added to the mix and it
was incubated on a Thermomixer at 37°C and 800 rpm for one hour. At least 100 µl of
each mix were spread on LB agar plates with an antibiotic as selection marker. These
plates were incubated overnight at 37°C.
2.2.2 Creation of RNAi constructs
The pipeline of the creation of RNAi constructs and the experimental validation is
summarized in Figure 10.
2.2.2.1 Ligation into entry vector
The twelve synthetic Mlo500 inserts in pUC57 cloning vector were digested with XbaI
and SalI. The Mlo fragments were isolated from an agarose gel as described in section
2.2.1.3. After this the Mlo fragments were ligated into a XbaI and SalI digested
pIPKTA38. The ligation reactions were performed for one hour at room temperature in
10 µl containing 1 µl of T4 DNA Ligase, 1 µl of T4 DNA Ligase buffer, 5 µl of the
respective Mlo fragment (20 ng/µl) and 3 µl of the pIPKTA38 vector (65 ng/µl). The
volumes of the components were calculated with the software “LabTools”. The
resulting pIPKTA38_MloRNAi(100-0%+H1) constructs were transformed as described
in section 2.2.1.5 and spread on LB+ Kanamycin agar plates. One colony of each
reaction was picked and inoculated for plasmid isolation as described in section 2.2.1.3.
A control digestion of each clone was performed by restriction digestion with XbaI and
SalI. The positive pIPKTA38_MloRNAi(100-0%+H1) clones were used as donor
vector in the LR reaction of the Gateway cloning system with pIPKTA30N.
Materials and Methods
21
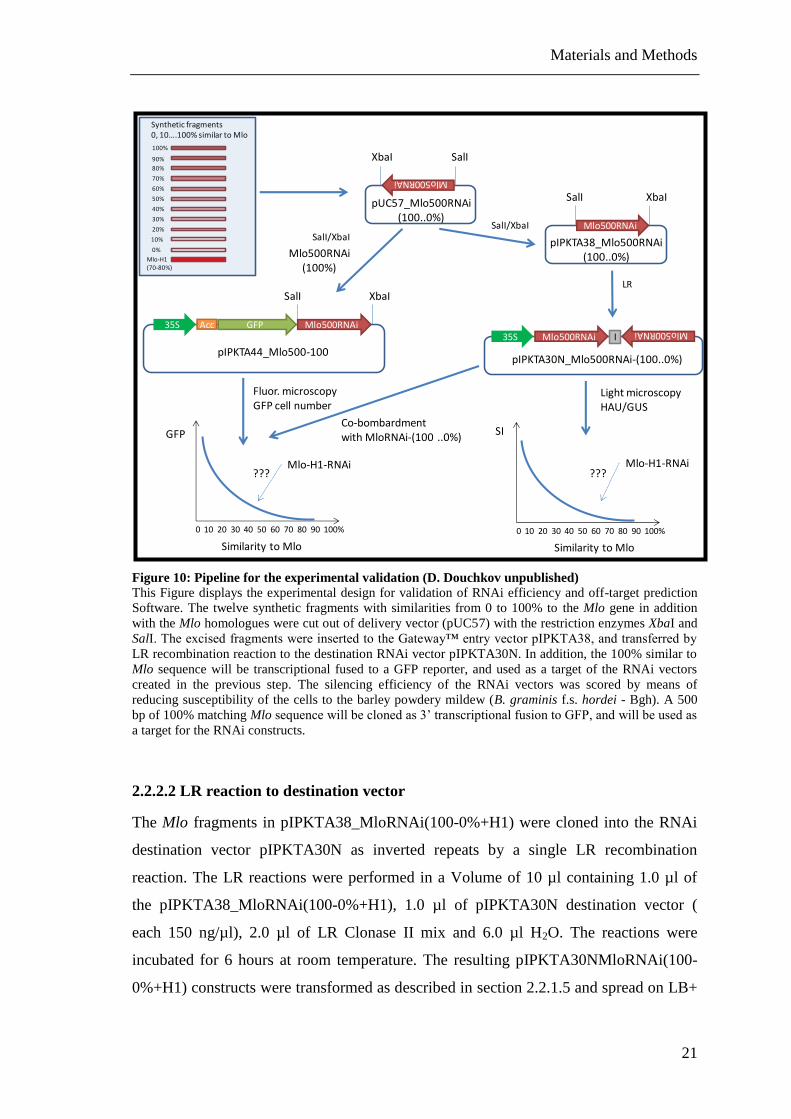
Figure 10: Pipeline for the experimental validation (D. Douchkov unpublished)
This Figure displays the experimental design for validation of RNAi efficiency and off-target prediction
Software. The twelve synthetic fragments with similarities from 0 to 100% to the Mlo gene in addition
with the Mlo homologues were cut out of delivery vector (pUC57) with the restriction enzymes XbaI and
SalI. The excised fragments were inserted to the Gateway™ entry vector pIPKTA38, and transferred by
LR recombination reaction to the destination RNAi vector pIPKTA30N. In addition, the 100% similar to
Mlo sequence will be transcriptional fused to a GFP reporter, and used as a target of the RNAi vectors
created in the previous step. The silencing efficiency of the RNAi vectors was scored by means of
reducing susceptibility of the cells to the barley powdery mildew (B. graminis f.s. hordei - Bgh). A 500
bp of 100% matching Mlo sequence will be cloned as 3’ transcriptional fusion to GFP, and will be used as
a target for the RNAi constructs.
2.2.2.2 LR reaction to destination vector
The Mlo fragments in pIPKTA38_MloRNAi(100-0%+H1) were cloned into the RNAi
destination vector pIPKTA30N as inverted repeats by a single LR recombination
reaction. The LR reactions were performed in a Volume of 10 µl containing 1.0 µl of
the pIPKTA38_MloRNAi(100-0%+H1), 1.0 µl of pIPKTA30N destination vector (
each 150 ng/µl), 2.0 µl of LR Clonase II mix and 6.0 µl H2O. The reactions were
incubated for 6 hours at room temperature. The resulting pIPKTA30NMloRNAi(100-
0%+H1) constructs were transformed as described in section 2.2.1.5 and spread on LB+
pUC57_Mlo500RNAi(100..0%)
XbaI SalI
Mlo500RNAi
pIPKTA44_Mlo500-100
SalI XbaI
Mlo500RNAiGFPAcc35SMlo500RNAi
Mlo500RNAi
35S I
pIPKTA30N_Mlo500RNAi-(100..0%)
pIPKTA38_Mlo500RNAi(100..0%)
SalI XbaI
Mlo500RNAiSalI/XbaI
SalI/XbaI
LR
0 10 20 30 40 50 60 70 80 90 100%
GFP
0 10 20 30 40 50 60 70 80 90 100%
SI
Light microscopyHAU/GUS
Fluor. microscopyGFP cell number
Mlo-H1-RNAi Mlo-H1-RNAi??? ???
Similarity to Mlo Similarity to Mlo
0%
100%
90%
80%
70%
60%
50%
40%
30%
20%
10%
Synthetic fragments0, 10….100% similar to Mlo
Mlo-H1 (70-80%)
Co-bombardment with MloRNAi-(100 ..0%)
Mlo500RNAi(100%)
Materials and Methods
22
Ampicilin agar plates. One colony of each reaction was picked and inoculated for
plasmid isolation as described in section 2.2.1.3. At least a control digestion of each
clone was performed by restriction digestion with EcoRV.
2.2.3 Creation of plasmid construct pIPKTA44_Mlo500_100
The synthetic Mlo500_100 insert in pUC57 cloning vector was digested with XbaI and
SalI. The Mlo fragment was isolated from an agarose gel as described in section 2.2.1.3.
After this the Mlo fragment was ligated into a XbaI and SalI digested pIPKTA44. The
ligation reactions were performed for one hour at room temperature in 10 µl containing
1 µl of T4 DNA Ligase, 1 µl of T4 DNA Ligase buffer, 1.5 µl of the Mlo fragment (40
ng/µl), 2.5 µl of the pIPKTA44 vector (40 ng/µl) and 4 µl water. The volumes of the
components were calculated with the software “LabTools”. The resulting
pIPKTA44_Mlo500_100 construct was transformed as described in section 2.2.1.5 and
spread on LB+ Ampicilin agar plates. One colony of each reaction was picked and
inoculated for plasmid isolation as described in section 2.2.1.3. At least a control
digestion of each clone was performed by restriction digestion with XbaI and SalI.
2.2.4 Transient expression by particle bombardment
2.2.4.1 Gold particle suspension
27.5 mg of gold powder (diameter 1µm, Bio-Rad, Hercules, USA) was added to 1 ml of
sterile water. The suspension was mixed well and treated for 20 seconds in an ultrasonic
bath. Then the gold was centrifuged at 14000 rpm for 30 seconds and the supernatant
was removed. This whole wash procedure was repeated again with sterile water and
then with 99.8% ethanol. Finally, the gold pellet was dried at 50°C for 10 minutes and
dissolved in 1 ml 50% sterile glycerol by 30 seconds ultrasonication.
2.2.4.2 Coating of gold particles with DNA
Per shot 7 µl DNA (1 µg/µl) per construct and reporter construct were pipetted. The
pipetting schemes of the experiments can be seen in Table 6 and Table 7. To each 87.5
µl ultrasonicated gold (27.5 mg/ml) suspension was added. While continuous mixing on
a vortexer calcium nitrate (CaNO3)2 (pH = 10) was added drop wise to a final
concentration of 0.5 M (CaNO3)2. These suspensions were incubated for approximately
10 minutes at room temperature by inverting from time to time. Then these suspensions
Materials and Methods
23
were centrifuged at 14000 rpm for 30 seconds and the supernatant were removed. After
that the pellets were washed in 70% ethanol and then in 98.8% ethanol. At least the
pellet was resuspendet in 30µl 98.8% ethanol.
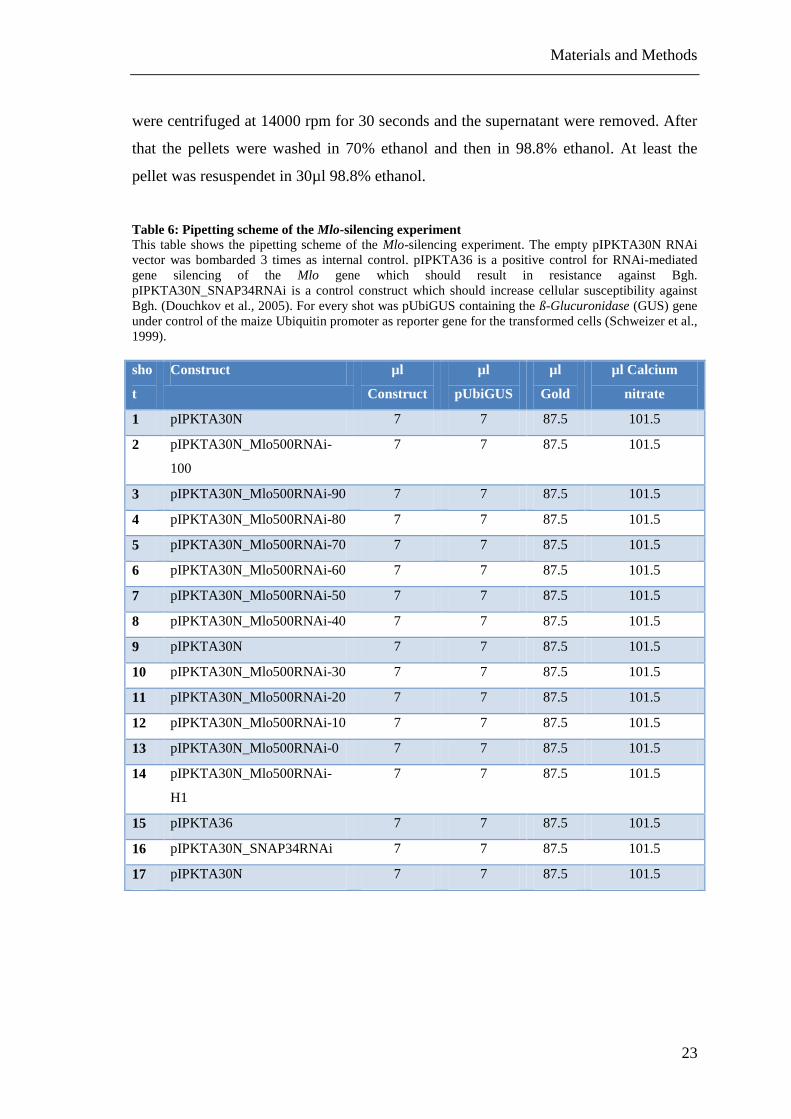
Table 6: Pipetting scheme of the Mlo-silencing experiment
This table shows the pipetting scheme of the Mlo-silencing experiment. The empty pIPKTA30N RNAi
vector was bombarded 3 times as internal control. pIPKTA36 is a positive control for RNAi-mediated
gene silencing of the Mlo gene which should result in resistance against Bgh.
pIPKTA30N_SNAP34RNAi is a control construct which should increase cellular susceptibility against
Bgh. (Douchkov et al., 2005). For every shot was pUbiGUS containing the ß-Glucuronidase (GUS) gene
under control of the maize Ubiquitin promoter as reporter gene for the transformed cells (Schweizer et al.,
1999).
sho
t
Construct µl
Construct
µl
pUbiGUS
µl
Gold
µl Calcium
nitrate
1 pIPKTA30N 7 7 87.5 101.5
2 pIPKTA30N_Mlo500RNAi-
100
7 7 87.5 101.5
3 pIPKTA30N_Mlo500RNAi-90 7 7 87.5 101.5
4 pIPKTA30N_Mlo500RNAi-80 7 7 87.5 101.5
5 pIPKTA30N_Mlo500RNAi-70 7 7 87.5 101.5
6 pIPKTA30N_Mlo500RNAi-60 7 7 87.5 101.5
7 pIPKTA30N_Mlo500RNAi-50 7 7 87.5 101.5
8 pIPKTA30N_Mlo500RNAi-40 7 7 87.5 101.5
9 pIPKTA30N 7 7 87.5 101.5
10 pIPKTA30N_Mlo500RNAi-30 7 7 87.5 101.5
11 pIPKTA30N_Mlo500RNAi-20 7 7 87.5 101.5
12 pIPKTA30N_Mlo500RNAi-10 7 7 87.5 101.5
13 pIPKTA30N_Mlo500RNAi-0 7 7 87.5 101.5
14 pIPKTA30N_Mlo500RNAi-
H1
7 7 87.5 101.5
15 pIPKTA36 7 7 87.5 101.5
16 pIPKTA30N_SNAP34RNAi 7 7 87.5 101.5
17 pIPKTA30N 7 7 87.5 101.5
Materials and Methods
24
Table 7: Pipetting scheme of the GFP-fused-Mlo-silencing experiments
This table shows the pipetting scheme of the GFP-fused-Mlo-silencing experiments. The empty
pIPKTA30N vector bombarded 2 times per experiment as control. The RNAi constructs were co-
bombarded with the pIPKTA44_Mlo500_100 construct and the pBC17 construct that gave rise to
anthocyanin accumulation and served as internal control for bombardment efficiency in barley epidermal
cells (Schweizer et al., 2000).
shot Construct µl
Const-
ruct
µl
pBC17
µl
pIPKTA44_Mlo500
_100
µl
Gold
µl
Calcium
nitrate
1 pIPKTA30N 7 7 7 87,5 108,5
2 pIPKTA30N_Mlo500
RNAi-100
7 7 7 87,5 108,5
3 pIPKTA30N_Mlo500
RNAi-90
7 7 7 87,5 108,5
4 pIPKTA30N_Mlo500
RNAi-80
7 7 7 87,5 108,5
5 pIPKTA30N_Mlo500
RNAi-70
7 7 7 87,5 108,5
6 pIPKTA30N_Mlo500
RNAi-60
7 7 7 87,5 108,5
7 pIPKTA30N_Mlo500
RNAi-50
7 7 7 87,5 108,5
8 pIPKTA30N_Mlo500
RNAi-40
7 7 7 87,5 108,5
9 pIPKTA30N_Mlo500
RNAi-30
7 7 7 87,5 108,5
10 pIPKTA30N_Mlo500
RNAi-20
7 7 7 87,5 108,5
11 pIPKTA30N_Mlo500
RNAi-10
7 7 7 87,5 108,5
12 pIPKTA30N_Mlo500
RNAi-0
7 7 7 87,5 108,5
13 pIPKTA30N_Mlo500
RNAi-H1
7 7 7 87,5 108,5
14 pIPKTA30N 7 7 7 87,5 108,5
2.2.4.3 Biolistic gene transfer
At first the 30 µl DNA-gold-suspension was distributed to the seven macro carriers
(Bio-Rad), which were placed into the hepta adapter of a PDS-1000/He system (Bio-
Rad, München, Germany). Primary leaf segments of seven-day-old barley seedlings
were placed with the adaxial side up at a distance about 6 cm to the macro carriers onto
0.5% (w/v) phytoagar (Ducheva, Haarlem, Netherlands) in water containing
benzimidazol at 20 ppm. Six leaves were used per bombardment. Then vacuum of 27.5
mmHg was made in the vacuum chamber. After that the leaves were bombarded at a
helium pressure of 900 psi (900 psi rupture disk Bio-Rad) with the gold particles. At
Materials and Methods
25
least the leaves incubated in closed petri dishes at 20°C, 50% relative humidity, 16h
light with an intensity of 12 µE/m2/s and 8 h dark in a climate chamber (Panasonic,
Versatile Environmental Test Chamber Model: MLR-352-H , Japan). The incubation
time was depending on the experiment.
2.2.5 Inoculation with Blumeria graminis
Three days after bombardment, the barley leaves of the GUS shooting experiments were
inoculated with Bgh. The inoculation density was approximately 150 – 200
conidia/mm2. Afterwards the leaves were incubated again in the Panasonic climate
chamber.
2.2.6 Staining of Mlo-silencing experiments
72 hpi with Bgh the X-Gluc staining were performed. The leaves were carefully
collected with tweezers, superimposed to cut the leaves ends to the same length and
transferred them into X-Gluc staining solution. The leaves were infiltrated 3 times with
the X-Gluc staining solution in a vacuum exicator till the leaves go down to the bottom.
After that they were incubated at 37°C for 24 h. To stop the staining reaction and
increase the contrast, the X-Gluc staining solution was replaced by Trichloroacetic acid
solution. The leaves were incubated for 10 minutes until complete decolorization of
chlorophyll. Subsequently, they were washed twice with water and stored at 4 °C.
X – Gluc Solution
0.1% (w/v) 5-Bromo-4-chloro-1H-indol-3-yl β-D-glucopyranosiduronic acid (X-
Gluc)
20 % (v/v) Methanol
0.1 M NaH2PO4
0.1 M Na2HPO4
10 mM Na-EDTA
0.1 % (v/v) Triton – X - 100
1.4 mM Potassium ferrycyanide
1.4 mM Potassium hexacyanoferrate (II)
pH 6.8 – 7.2
Materials and Methods
26
Trichloroacetic acid solution
7.5 % (w/v) Trichloroacetic acid
50 % (v/v) Methanol
2.2.7 Microscopy
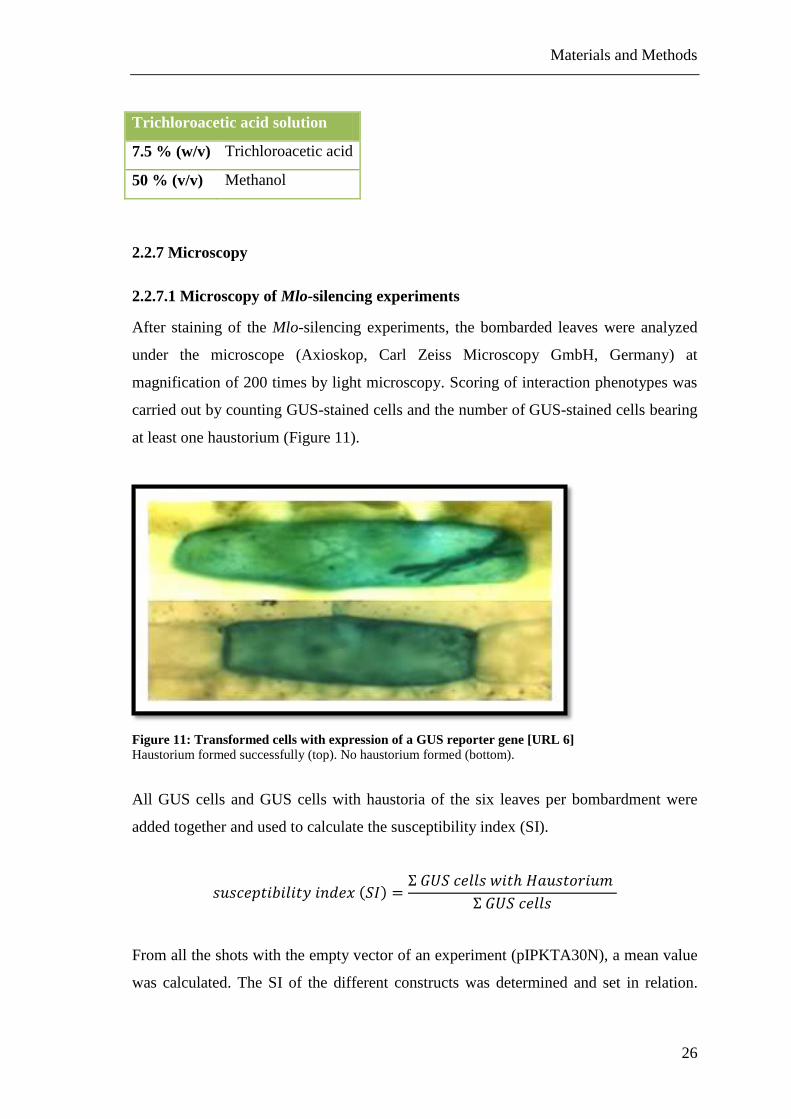
2.2.7.1 Microscopy of Mlo-silencing experiments
After staining of the Mlo-silencing experiments, the bombarded leaves were analyzed
under the microscope (Axioskop, Carl Zeiss Microscopy GmbH, Germany) at
magnification of 200 times by light microscopy. Scoring of interaction phenotypes was
carried out by counting GUS-stained cells and the number of GUS-stained cells bearing
at least one haustorium (Figure 11).
Figure 11: Transformed cells with expression of a GUS reporter gene [URL 6]
Haustorium formed successfully (top). No haustorium formed (bottom).
All GUS cells and GUS cells with haustoria of the six leaves per bombardment were
added together and used to calculate the susceptibility index (SI).
From all the shots with the empty vector of an experiment (pIPKTA30N), a mean value
was calculated. The SI of the different constructs was determined and set in relation.
Materials and Methods
27
This is the relative SI as a percentage. This is considered to be a normalized
measurement value of the sensitivity or rate of infection of the cells (Douchkov et al.,
2005).
2.2.7.2 Microscopy of GFP-fused-Mlo-silencing experiments
At 24 h postbombardment the number of GFP expressing cells was counted by
fluorescence microscopy (Axioplan 2 imaging, Carl Zeiss Microscopy GmbH,
Germany). Data were normalized to the number of anthocyanin-accumulating cells 5
days postbombardment, which was counted by light microscopy.
From all the shots with the empty vector of an experiment (pIPKTA30N), a mean value
was calculated. The normalized GFP of the different constructs were determined and set
in relation. This is the relative normalized GFP as a percentage (Douchkov et al., 2005).
2.2.8 Statistical analysis of Mlo-silencing experiments
The statistical analysis, which is described in this section was based and performed on
observations and rules of the Pathogen-Stress Genomics group.
At first all susceptibility indices, which are based on lesser than 50 GUS cells were
removed. Then the 0% values were replaced with the default value of 13.0%, in order to
prevent erratic values by log2 transformation. This corresponds to the average effect in
approximately 150 experiments of the Pathogen-Stress Genomics group for the best
resistance-inducing control pIPKTA36, which is targeting the Mlo gene. After that a
Nalimov outlier test (p < 0.01) is applied on the values (percent) [URL 7].
The resulting outliers are excluded in further calculations. In the next step all values
were log2 transformed. At least a two-sided one sampled t-test [URL 8] is performed on
the log2 values (Significant values: p< 0.05). This t test is performed against the
Materials and Methods
28
hypothetical relative susceptibility-index value “-0.355” corresponding to the observed
median of more than 1000 RNAi constructs and is assumed to reflect a non-specific
transient-induced gene-silencing (TIGS) effect. The reason for this type of calculation
was the observation of the Pathogen-Stress genomics group that any RNAi construct
has the tendency to induce some weak, sequence non-specific protection against
Blumeria graminis f.sp. hordei, for reasons still unknown.
Results
29
3 Results
Until now there are no common rules for defining parameters of RNAi efficiency and
no experimentally validated versatile software tools for off-target prediction in plants.
This asks for a combined in silico and experimental approach to that problem. The aim
of the present Bachelor thesis was a comparison of in silicio prediction of RNAi
efficiency and off-targets by the “si-Fi” software developed in the Pathogen-Stress
Genomics group of the IPK and experimental data. The experimental assessment in
plants of potential common rules as proposed in animal systems will remain a future
task.
The experimental approach was based on synthetic DNA with different levels of
similarity to the Mlo gene of barley. By incremental random mutagenesis of Mlo the
desired percentage of similarity was reached. The Mlo gene is a negative regulator of
cell death. Silencing of Mlo gene expression causes a strong increase of the resistance of
transformed cells to powdery mildew fungi, which provides an easy observable and
quantifiable phenotype.
A perfect match to the Mlo sequence (100% similarity) and 10 further sequences with
decreasing similarity (from 90% to 0% in 10% steps approximately) where designed
with a length of 500 bp. In addition a sequence derived from the MLO protein homolog
Mlo-H1 gene of barley sharing approximately 80% similarity to the Mlo gene was also
included to the experiments as a natural gene potentially off-targeting Mlo (Appendix
A).
With these previously designed sequences the in silico prediction was performed using
the software “si-Fi”, developed by the working group Pathogen-Stress Genomics at
IPK.
For the experimental validation a transient gene silencing system in bombarded barley
epidermal cells was used. In total twelve RNAi constructs including the synthetic
sequences were generated. To perform this, these twelve synthetic fragments were cut
out of the delivery vector (pUC57) with the restriction enzymes XbaI and SalI. The
excised fragments were inserted to the Gateway™ entry vector pIPKTA38, and
transferred by LR recombination reaction to the destination RNAi vector pIPKTA30N.
Results
30
The efficiency of the different RNAi constructs can be estimated by their effect on the
resistance to Bgh. This was analyzed microscopically to determine the susceptibility
index.
Another way to score the efficiency of the RNAi constructs was to fuse the original Mlo
sequence transcriptionally to a GFP reporter. The resulting construct was used as a
target of the RNAi constructs with decreasing similarity to Mlo. The silencing
efficiency of the RNAi vectors was scored by means of determining reduction of the
fluorescent signal of GFP.
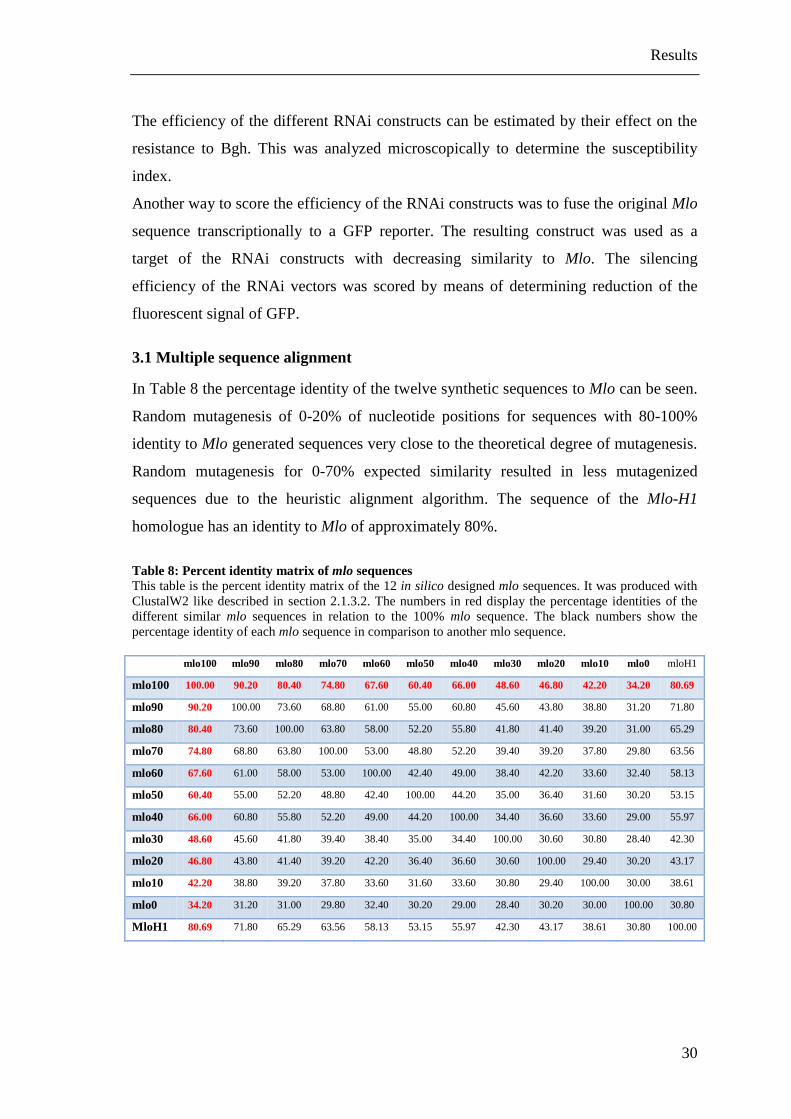
3.1 Multiple sequence alignment
In Table 8 the percentage identity of the twelve synthetic sequences to Mlo can be seen.
Random mutagenesis of 0-20% of nucleotide positions for sequences with 80-100%
identity to Mlo generated sequences very close to the theoretical degree of mutagenesis.
Random mutagenesis for 0-70% expected similarity resulted in less mutagenized
sequences due to the heuristic alignment algorithm. The sequence of the Mlo-H1
homologue has an identity to Mlo of approximately 80%.
Table 8: Percent identity matrix of mlo sequences
This table is the percent identity matrix of the 12 in silico designed mlo sequences. It was produced with
ClustalW2 like described in section 2.1.3.2. The numbers in red display the percentage identities of the
different similar mlo sequences in relation to the 100% mlo sequence. The black numbers show the
percentage identity of each mlo sequence in comparison to another mlo sequence.
mlo100 mlo90 mlo80 mlo70 mlo60 mlo50 mlo40 mlo30 mlo20 mlo10 mlo0 mloH1
mlo100 100.00 90.20 80.40 74.80 67.60 60.40 66.00 48.60 46.80 42.20 34.20 80.69
mlo90 90.20 100.00 73.60 68.80 61.00 55.00 60.80 45.60 43.80 38.80 31.20 71.80
mlo80 80.40 73.60 100.00 63.80 58.00 52.20 55.80 41.80 41.40 39.20 31.00 65.29
mlo70 74.80 68.80 63.80 100.00 53.00 48.80 52.20 39.40 39.20 37.80 29.80 63.56
mlo60 67.60 61.00 58.00 53.00 100.00 42.40 49.00 38.40 42.20 33.60 32.40 58.13
mlo50 60.40 55.00 52.20 48.80 42.40 100.00 44.20 35.00 36.40 31.60 30.20 53.15
mlo40 66.00 60.80 55.80 52.20 49.00 44.20 100.00 34.40 36.60 33.60 29.00 55.97
mlo30 48.60 45.60 41.80 39.40 38.40 35.00 34.40 100.00 30.60 30.80 28.40 42.30
mlo20 46.80 43.80 41.40 39.20 42.20 36.40 36.60 30.60 100.00 29.40 30.20 43.17
mlo10 42.20 38.80 39.20 37.80 33.60 31.60 33.60 30.80 29.40 100.00 30.00 38.61
mlo0 34.20 31.20 31.00 29.80 32.40 30.20 29.00 28.40 30.20 30.00 100.00 30.80
MloH1 80.69 71.80 65.29 63.56 58.13 53.15 55.97 42.30 43.17 38.61 30.80 100.00
Results
31
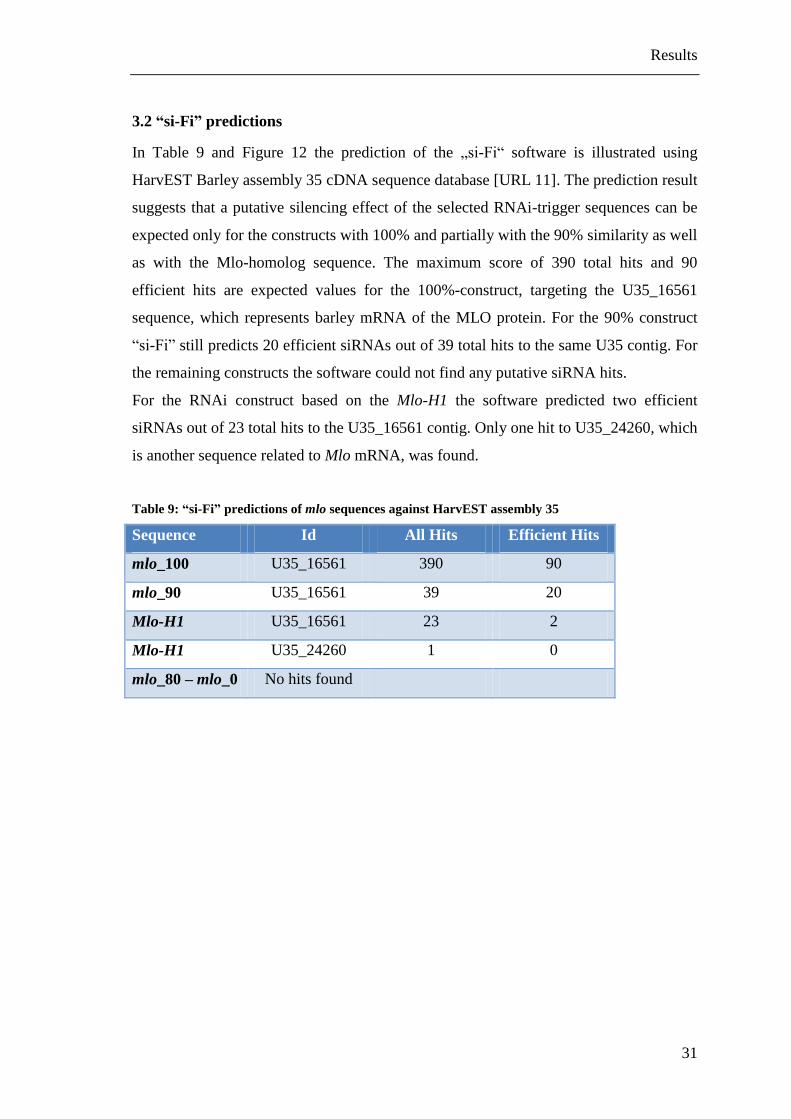
3.2 “si-Fi” predictions
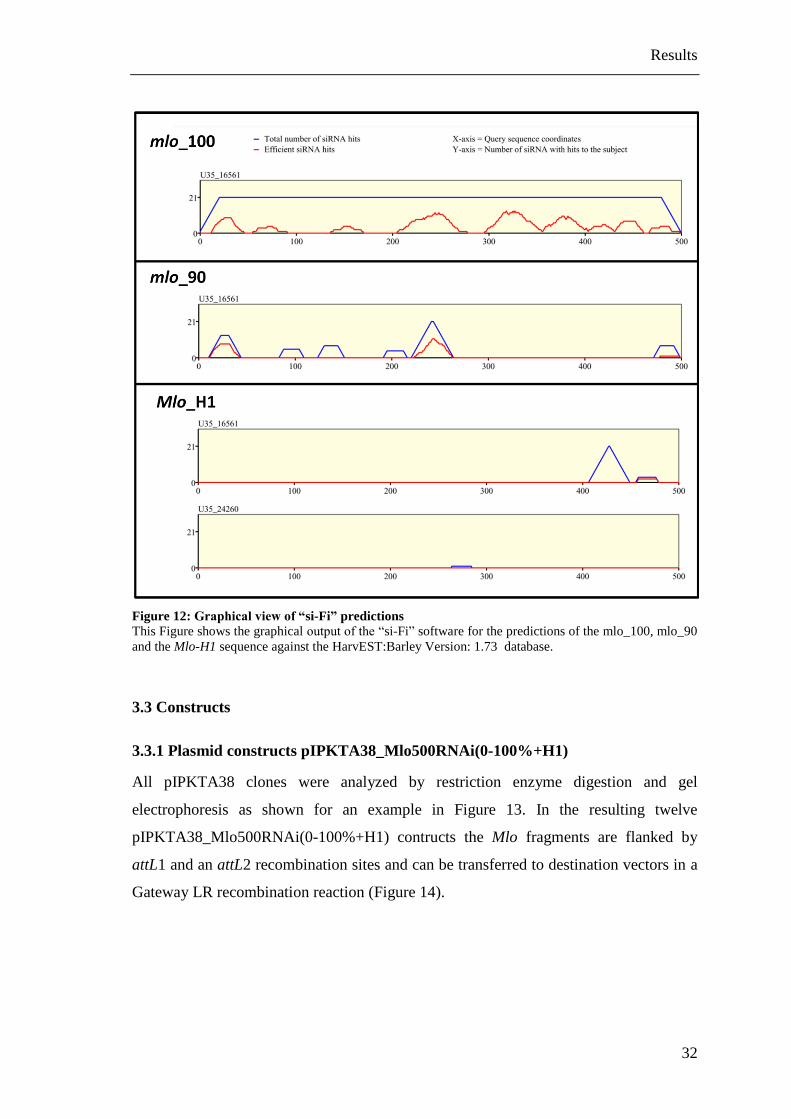
In Table 9 and Figure 12 the prediction of the „si-Fi“ software is illustrated using
HarvEST Barley assembly 35 cDNA sequence database [URL 11]. The prediction result
suggests that a putative silencing effect of the selected RNAi-trigger sequences can be
expected only for the constructs with 100% and partially with the 90% similarity as well
as with the Mlo-homolog sequence. The maximum score of 390 total hits and 90
efficient hits are expected values for the 100%-construct, targeting the U35_16561
sequence, which represents barley mRNA of the MLO protein. For the 90% construct
“si-Fi” still predicts 20 efficient siRNAs out of 39 total hits to the same U35 contig. For
the remaining constructs the software could not find any putative siRNA hits.
For the RNAi construct based on the Mlo-H1 the software predicted two efficient
siRNAs out of 23 total hits to the U35_16561 contig. Only one hit to U35_24260, which
is another sequence related to Mlo mRNA, was found.
Table 9: “si-Fi” predictions of mlo sequences against HarvEST assembly 35
Sequence Id All Hits Efficient Hits
mlo_100 U35_16561 390 90
mlo_90 U35_16561 39 20
Mlo-H1 U35_16561 23 2
Mlo-H1 U35_24260 1 0
mlo_80 – mlo_0 No hits found
Results
32
Figure 12: Graphical view of “si-Fi” predictions
This Figure shows the graphical output of the “si-Fi” software for the predictions of the mlo_100, mlo_90
and the Mlo-H1 sequence against the HarvEST:Barley Version: 1.73 database.
3.3 Constructs
3.3.1 Plasmid constructs pIPKTA38_Mlo500RNAi(0-100%+H1)
All pIPKTA38 clones were analyzed by restriction enzyme digestion and gel
electrophoresis as shown for an example in Figure 13. In the resulting twelve
pIPKTA38_Mlo500RNAi(0-100%+H1) contructs the Mlo fragments are flanked by
attL1 and an attL2 recombination sites and can be transferred to destination vectors in a
Gateway LR recombination reaction (Figure 14).
Results
33
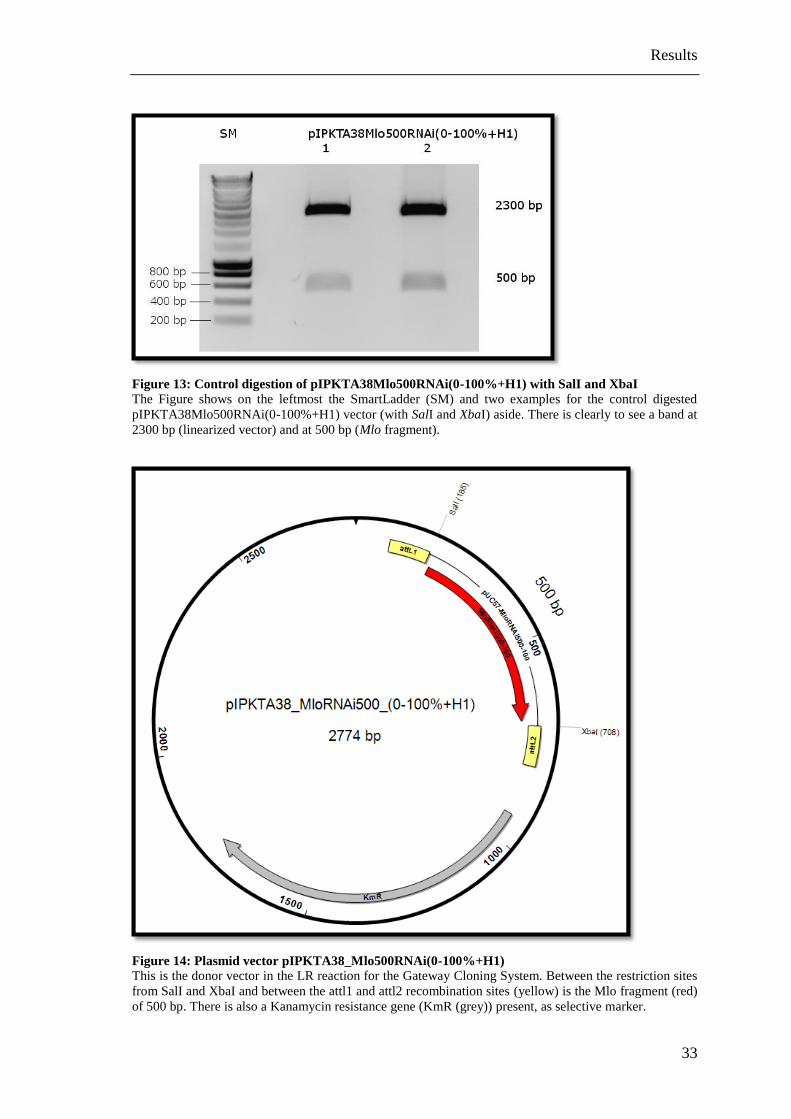
Figure 13: Control digestion of pIPKTA38Mlo500RNAi(0-100%+H1) with SalI and XbaI
The Figure shows on the leftmost the SmartLadder (SM) and two examples for the control digested
pIPKTA38Mlo500RNAi(0-100%+H1) vector (with SalI and XbaI) aside. There is clearly to see a band at
2300 bp (linearized vector) and at 500 bp (Mlo fragment).
Figure 14: Plasmid vector pIPKTA38_Mlo500RNAi(0-100%+H1)
This is the donor vector in the LR reaction for the Gateway Cloning System. Between the restriction sites
from SalI and XbaI and between the attl1 and attl2 recombination sites (yellow) is the Mlo fragment (red)
of 500 bp. There is also a Kanamycin resistance gene (KmR (grey)) present, as selective marker.
Results
34
3.3.2 Plasmid vector pIPKTA30NMlo500RNAi(0-100%+H1)
The Mlo fragments of pIPKTA38MloRNAi(0-100%+H1) were transferred into the
destination Vector pIPKTA30N by Gateway LR recombination reaction. Figure 15
shows agarose gel analysis of the obtained pIPKTA30N clones digested by EcoRV.
Each of the twelve resulting constructs carries two inverted repeats of the Mlo
fragments separated by an intron (the second intron of the wheat RGA2 gene). The
constructs contain the promoter and terminator sequences of 35S RNA of Cauliflower
mosaic virus, as well as beta-lactamase gene for ampicillin resistance (Figure 16)
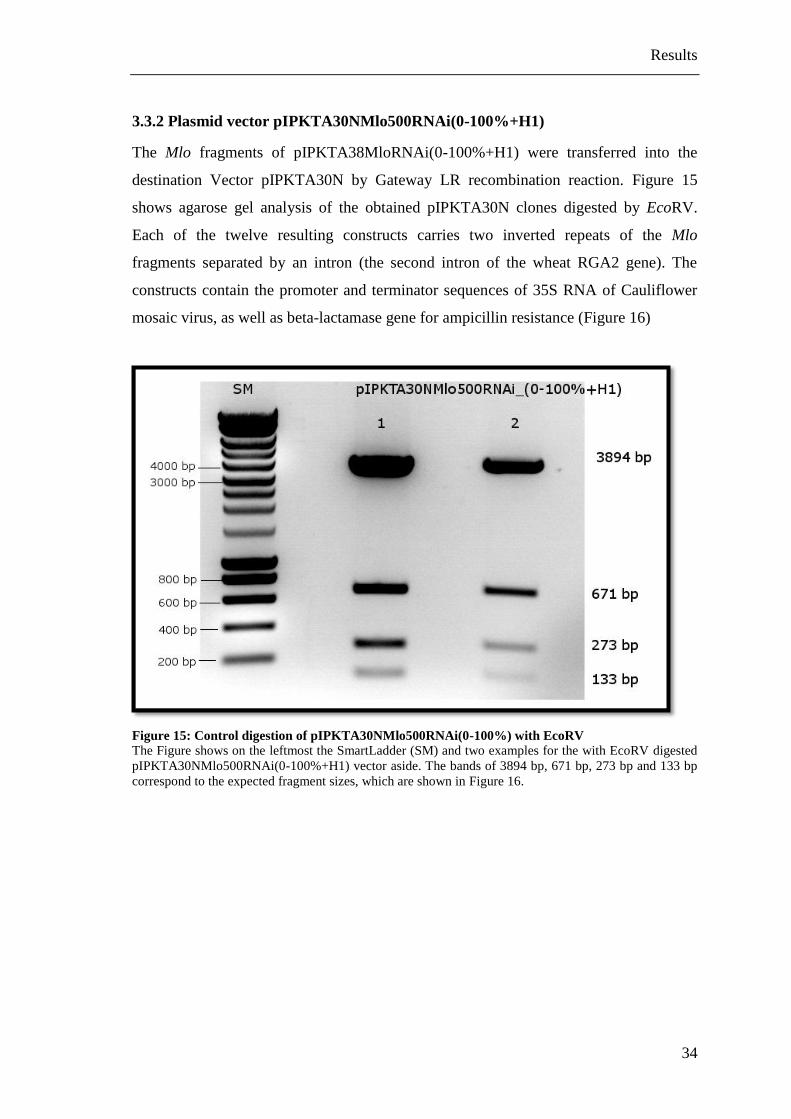
Figure 15: Control digestion of pIPKTA30NMlo500RNAi(0-100%) with EcoRV
The Figure shows on the leftmost the SmartLadder (SM) and two examples for the with EcoRV digested
pIPKTA30NMlo500RNAi(0-100%+H1) vector aside. The bands of 3894 bp, 671 bp, 273 bp and 133 bp
correspond to the expected fragment sizes, which are shown in Figure 16.
Results
35
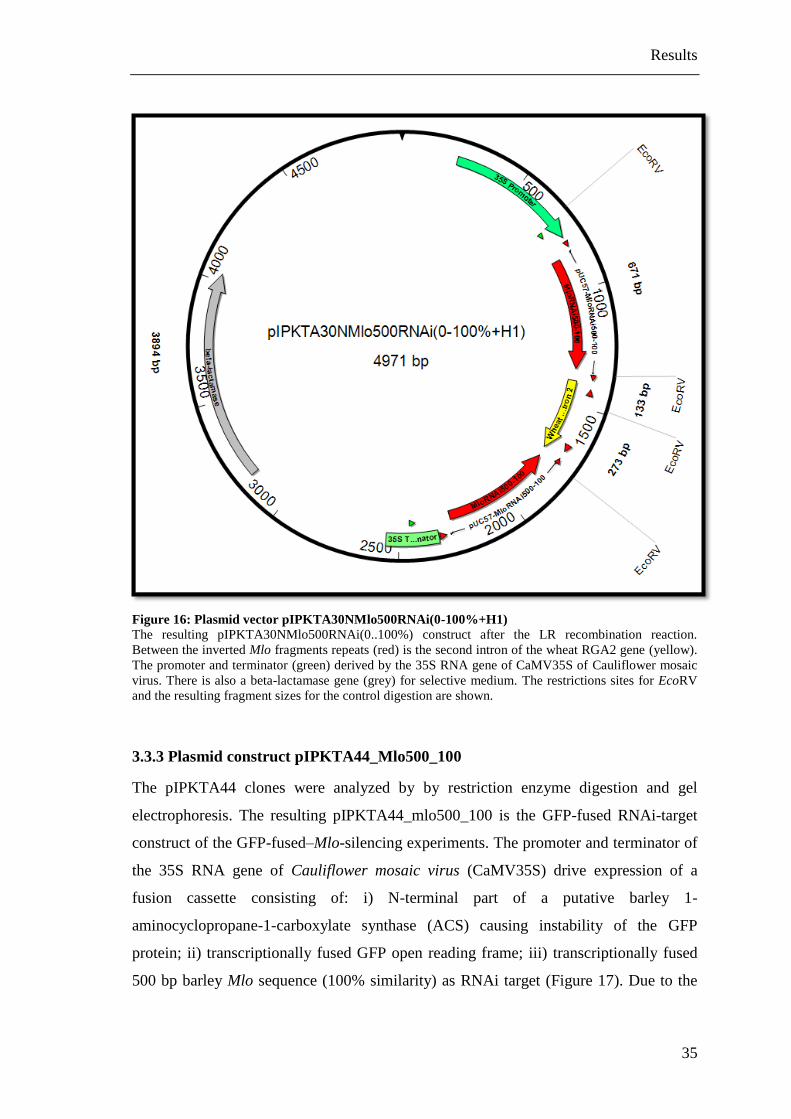
Figure 16: Plasmid vector pIPKTA30NMlo500RNAi(0-100%+H1)
The resulting pIPKTA30NMlo500RNAi(0..100%) construct after the LR recombination reaction.
Between the inverted Mlo fragments repeats (red) is the second intron of the wheat RGA2 gene (yellow).
The promoter and terminator (green) derived by the 35S RNA gene of CaMV35S of Cauliflower mosaic
virus. There is also a beta-lactamase gene (grey) for selective medium. The restrictions sites for EcoRV
and the resulting fragment sizes for the control digestion are shown.
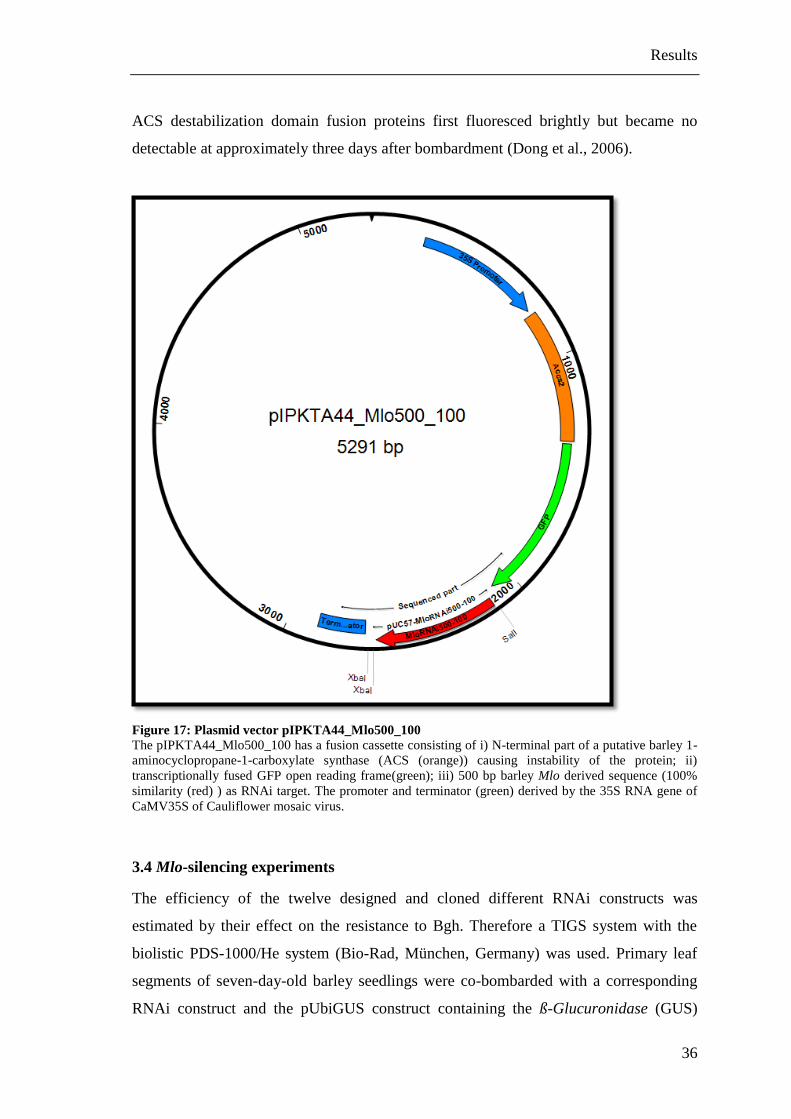
3.3.3 Plasmid construct pIPKTA44_Mlo500_100
The pIPKTA44 clones were analyzed by by restriction enzyme digestion and gel
electrophoresis. The resulting pIPKTA44_mlo500_100 is the GFP-fused RNAi-target
construct of the GFP-fused–Mlo-silencing experiments. The promoter and terminator of
the 35S RNA gene of Cauliflower mosaic virus (CaMV35S) drive expression of a
fusion cassette consisting of: i) N-terminal part of a putative barley 1-
aminocyclopropane-1-carboxylate synthase (ACS) causing instability of the GFP
protein; ii) transcriptionally fused GFP open reading frame; iii) transcriptionally fused
500 bp barley Mlo sequence (100% similarity) as RNAi target (Figure 17). Due to the
Results
36
ACS destabilization domain fusion proteins first fluoresced brightly but became no
detectable at approximately three days after bombardment (Dong et al., 2006).
Figure 17: Plasmid vector pIPKTA44_Mlo500_100
The pIPKTA44_Mlo500_100 has a fusion cassette consisting of i) N-terminal part of a putative barley 1-
aminocyclopropane-1-carboxylate synthase (ACS (orange)) causing instability of the protein; ii)
transcriptionally fused GFP open reading frame(green); iii) 500 bp barley Mlo derived sequence (100%
similarity (red) ) as RNAi target. The promoter and terminator (green) derived by the 35S RNA gene of
CaMV35S of Cauliflower mosaic virus.
3.4 Mlo-silencing experiments
The efficiency of the twelve designed and cloned different RNAi constructs was
estimated by their effect on the resistance to Bgh. Therefore a TIGS system with the
biolistic PDS-1000/He system (Bio-Rad, München, Germany) was used. Primary leaf
segments of seven-day-old barley seedlings were co-bombarded with a corresponding
RNAi construct and the pUbiGUS construct containing the ß-Glucuronidase (GUS)
Results
37
gene under control of the maize Ubiquitin promoter as a reporter gene for the
transformed cells (Schweizer et al., 1999). The empty pIPKTA30N RNAi vector was
bombarded three times in each experiment as internal control. Furthermore a pIPKTA36
construct as positive control for RNAi-mediated gene silencing of the Mlo gene, which
should result in resistance against Bgh and the pIPKTA30N_SNAP34RNAi construct
which should increase cellular susceptibility against Bgh, were used. (Douchkov et al.,
2005). The pipetting scheme for the Mlo-silencing experiments can be seen in Table 6.
Three days after bombardment the leaves were inoculated with Bgh and stained 72 hpi
with X-Gluc solution and distained with TCA solution 24 hours after X-Gluc. The
leaves were analyzed by light microscopy. Counting GUS-stained cells and the number
of GUS-stained cells bearing at least one haustorium leads to the susceptibility index
(SI). These SI were normalized to the empty pIPKTA30N RNAi vector per experiment.
Data based on less than 50 counted GUS cells per shooting were removed, resulting in
five to seven independent experiments for the Mlo-silencing experiments. Finally a
statistical analysis of the data was done. The results can be seen in Table 10 and Figure
18. The control constructs produced the effect as expected and described in (Douchkov
et al., 2005).
The standard Mlo-silencing pIPKTA36 construct induced a strong resistance to Bgh as
expected. The pIPKTA30N_SNAP34RNAi construct showed a clear susceptibility-
enhancing effect to Bgh also according to the prediction. This was also confirmed as
statistically significant using a two sided t-test for both constructs. Furthermore the
pIPKTA30N_Mlo500RNAi_100 construct with the 100% similarity sequence and the
pIPKTA30N_Mlo500RNAi-H1 construct with the Mlo-H1 sequence showed a
resistance-enhancing effect similar to those of the positive control (pIPKTA36). The
effect of the 100% similarity pIPKTA30N_Mlo500RNAi_100 construct was significant
in two sided t-test and the effect from the homologue pIPKTA30N_Mlo500RNAi-H1
construct was significant in one-sided t-test. Upon mutagenesis the RNAi effect
decreased very rapidly. Thus the designed 90% similarity
pIPKTA30N_Mlo500RNAi_90 construct with just 10% less similarity in comparison to
the 100% similarity pIPKTA30N_Mlo500RNAi_100 construct produced only a very
small, non significant effect. The other designed RNAi constructs with a lower
Results
38
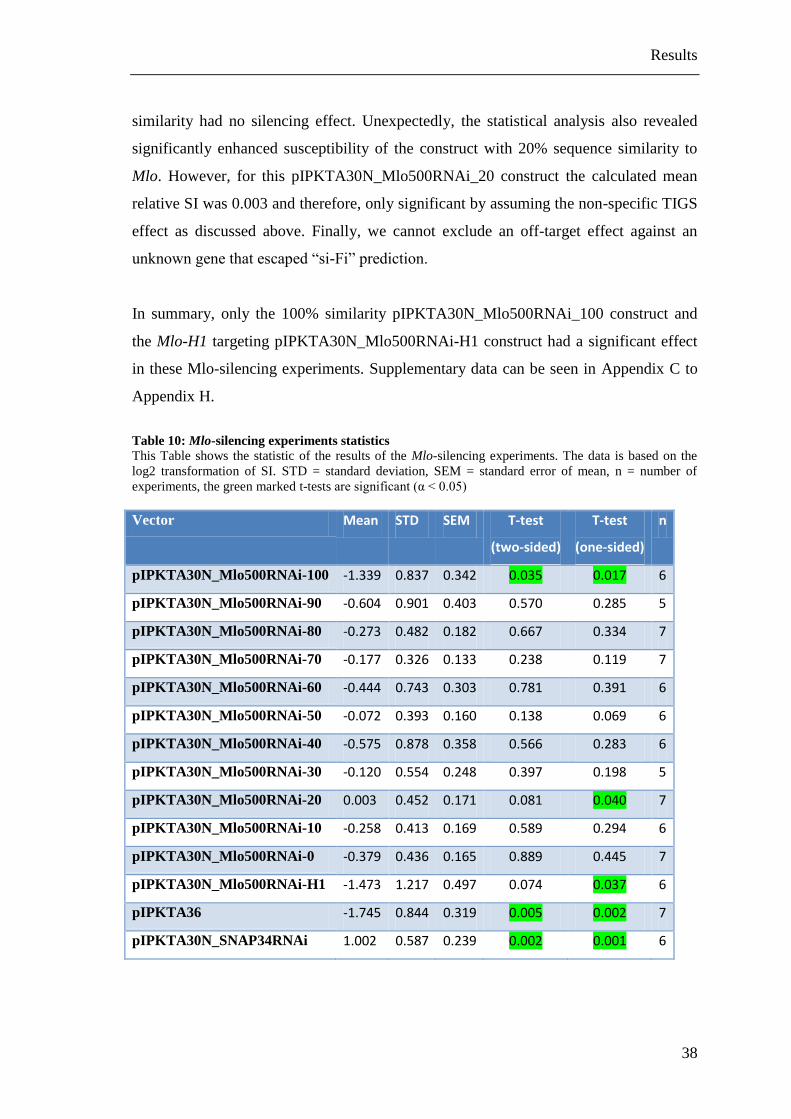
similarity had no silencing effect. Unexpectedly, the statistical analysis also revealed
significantly enhanced susceptibility of the construct with 20% sequence similarity to
Mlo. However, for this pIPKTA30N_Mlo500RNAi_20 construct the calculated mean
relative SI was 0.003 and therefore, only significant by assuming the non-specific TIGS
effect as discussed above. Finally, we cannot exclude an off-target effect against an
unknown gene that escaped “si-Fi” prediction.
In summary, only the 100% similarity pIPKTA30N_Mlo500RNAi_100 construct and
the Mlo-H1 targeting pIPKTA30N_Mlo500RNAi-H1 construct had a significant effect
in these Mlo-silencing experiments. Supplementary data can be seen in Appendix C to
Appendix H.
Table 10: Mlo-silencing experiments statistics
This Table shows the statistic of the results of the Mlo-silencing experiments. The data is based on the
log2 transformation of SI. STD = standard deviation, SEM = standard error of mean, n = number of
experiments, the green marked t-tests are significant (α < 0.05)
Vector Mean STD SEM T-test
(two-sided)
T-test
(one-sided)
n
pIPKTA30N_Mlo500RNAi-100 -1.339 0.837 0.342 0.035 0.017 6
pIPKTA30N_Mlo500RNAi-90 -0.604 0.901 0.403 0.570 0.285 5
pIPKTA30N_Mlo500RNAi-80 -0.273 0.482 0.182 0.667 0.334 7
pIPKTA30N_Mlo500RNAi-70 -0.177 0.326 0.133 0.238 0.119 7
pIPKTA30N_Mlo500RNAi-60 -0.444 0.743 0.303 0.781 0.391 6
pIPKTA30N_Mlo500RNAi-50 -0.072 0.393 0.160 0.138 0.069 6
pIPKTA30N_Mlo500RNAi-40 -0.575 0.878 0.358 0.566 0.283 6
pIPKTA30N_Mlo500RNAi-30 -0.120 0.554 0.248 0.397 0.198 5
pIPKTA30N_Mlo500RNAi-20 0.003 0.452 0.171 0.081 0.040 7
pIPKTA30N_Mlo500RNAi-10 -0.258 0.413 0.169 0.589 0.294 6
pIPKTA30N_Mlo500RNAi-0 -0.379 0.436 0.165 0.889 0.445 7
pIPKTA30N_Mlo500RNAi-H1 -1.473 1.217 0.497 0.074 0.037 6
pIPKTA36 -1.745 0.844 0.319 0.005 0.002 7
pIPKTA30N_SNAP34RNAi 1.002 0.587 0.239 0.002 0.001 6
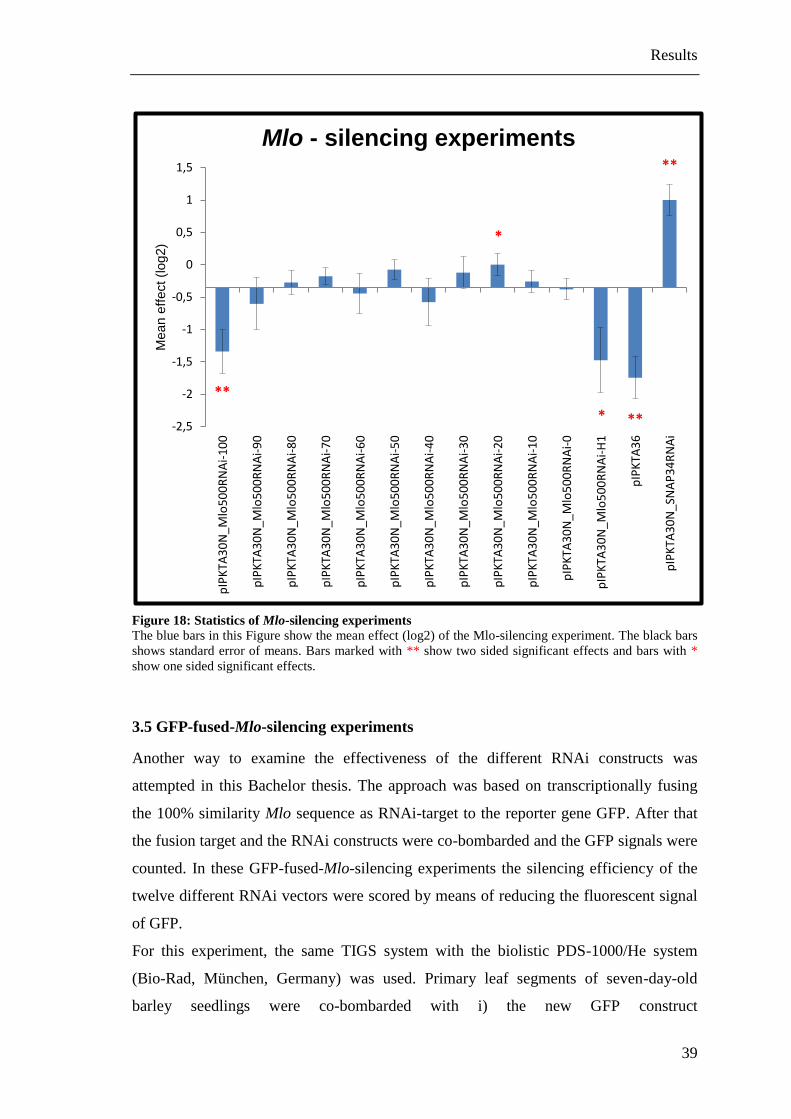
Results
39
Figure 18: Statistics of Mlo-silencing experiments
The blue bars in this Figure show the mean effect (log2) of the Mlo-silencing experiment. The black bars
shows standard error of means. Bars marked with ** show two sided significant effects and bars with *
show one sided significant effects.
3.5 GFP-fused-Mlo-silencing experiments
Another way to examine the effectiveness of the different RNAi constructs was
attempted in this Bachelor thesis. The approach was based on transcriptionally fusing
the 100% similarity Mlo sequence as RNAi-target to the reporter gene GFP. After that
the fusion target and the RNAi constructs were co-bombarded and the GFP signals were
counted. In these GFP-fused-Mlo-silencing experiments the silencing efficiency of the
twelve different RNAi vectors were scored by means of reducing the fluorescent signal
of GFP.
For this experiment, the same TIGS system with the biolistic PDS-1000/He system
(Bio-Rad, München, Germany) was used. Primary leaf segments of seven-day-old
barley seedlings were co-bombarded with i) the new GFP construct
**
*
* **
**
-2,5
-2
-1,5
-1
-0,5
0
0,5
1
1,5
pIP
KTA
30
N_M
lo5
00
RN
Ai-
10
0
pIP
KTA
30
N_M
lo5
00
RN
Ai-
90
pIP
KTA
30
N_M
lo5
00
RN
Ai-
80
pIP
KTA
30
N_M
lo5
00
RN
Ai-
70
pIP
KTA
30
N_M
lo5
00
RN
Ai-
60
pIP
KTA
30
N_M
lo5
00
RN
Ai-
50
pIP
KTA
30
N_M
lo5
00
RN
Ai-
40
pIP
KTA
30
N_M
lo5
00
RN
Ai-
30
pIP
KTA
30
N_M
lo5
00
RN
Ai-
20
pIP
KTA
30
N_M
lo5
00
RN
Ai-
10
pIP
KTA
30
N_M
lo5
00
RN
Ai-
0
pIP
KTA
30
N_M
lo5
00
RN
Ai-
H1
pIP
KTA
36
pIP
KTA
30
N_S
NA
P3
4R
NA
i
Mean e
ffect (log2)
Mlo - silencing experiments
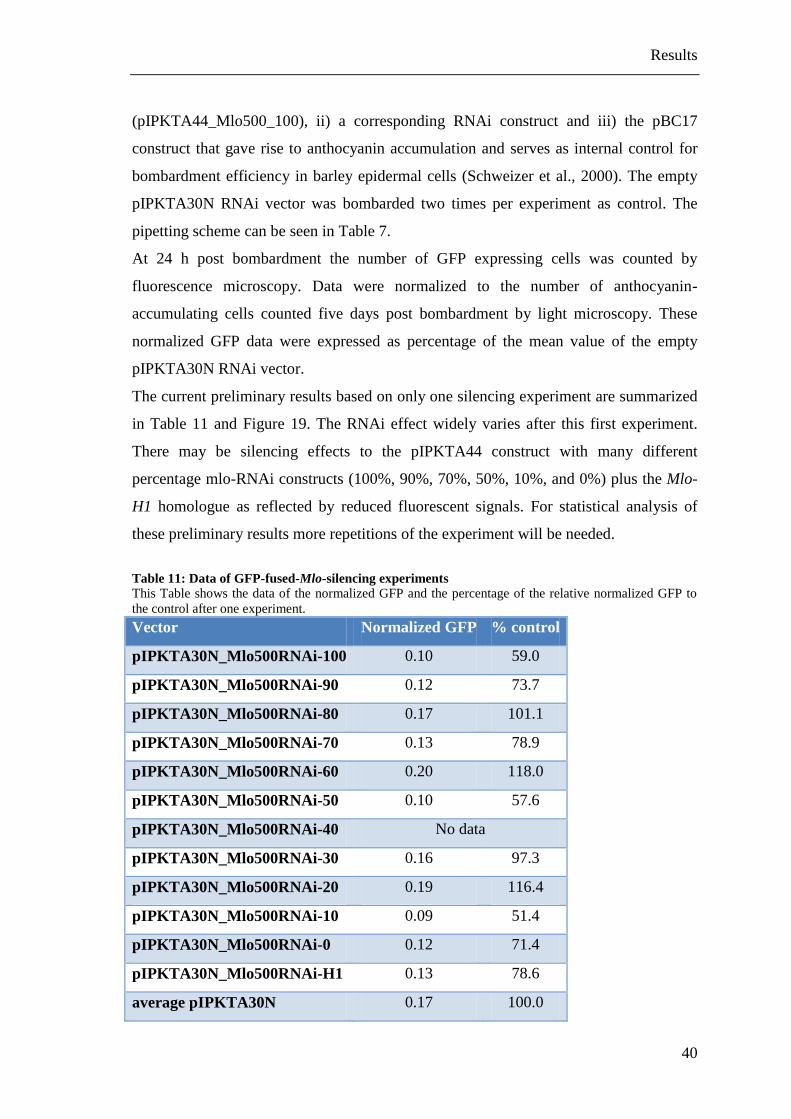
Results
40
(pIPKTA44_Mlo500_100), ii) a corresponding RNAi construct and iii) the pBC17
construct that gave rise to anthocyanin accumulation and serves as internal control for
bombardment efficiency in barley epidermal cells (Schweizer et al., 2000). The empty
pIPKTA30N RNAi vector was bombarded two times per experiment as control. The
pipetting scheme can be seen in Table 7.
At 24 h post bombardment the number of GFP expressing cells was counted by
fluorescence microscopy. Data were normalized to the number of anthocyanin-
accumulating cells counted five days post bombardment by light microscopy. These
normalized GFP data were expressed as percentage of the mean value of the empty
pIPKTA30N RNAi vector.
The current preliminary results based on only one silencing experiment are summarized
in Table 11 and Figure 19. The RNAi effect widely varies after this first experiment.
There may be silencing effects to the pIPKTA44 construct with many different
percentage mlo-RNAi constructs (100%, 90%, 70%, 50%, 10%, and 0%) plus the Mlo-
H1 homologue as reflected by reduced fluorescent signals. For statistical analysis of
these preliminary results more repetitions of the experiment will be needed.
Table 11: Data of GFP-fused-Mlo-silencing experiments
This Table shows the data of the normalized GFP and the percentage of the relative normalized GFP to
the control after one experiment.
Vector Normalized GFP % control
pIPKTA30N_Mlo500RNAi-100 0.10 59.0
pIPKTA30N_Mlo500RNAi-90 0.12 73.7
pIPKTA30N_Mlo500RNAi-80 0.17 101.1
pIPKTA30N_Mlo500RNAi-70 0.13 78.9
pIPKTA30N_Mlo500RNAi-60 0.20 118.0
pIPKTA30N_Mlo500RNAi-50 0.10 57.6
pIPKTA30N_Mlo500RNAi-40 No data
pIPKTA30N_Mlo500RNAi-30 0.16 97.3
pIPKTA30N_Mlo500RNAi-20 0.19 116.4
pIPKTA30N_Mlo500RNAi-10 0.09 51.4
pIPKTA30N_Mlo500RNAi-0 0.12 71.4
pIPKTA30N_Mlo500RNAi-H1 0.13 78.6
average pIPKTA30N 0.17 100.0
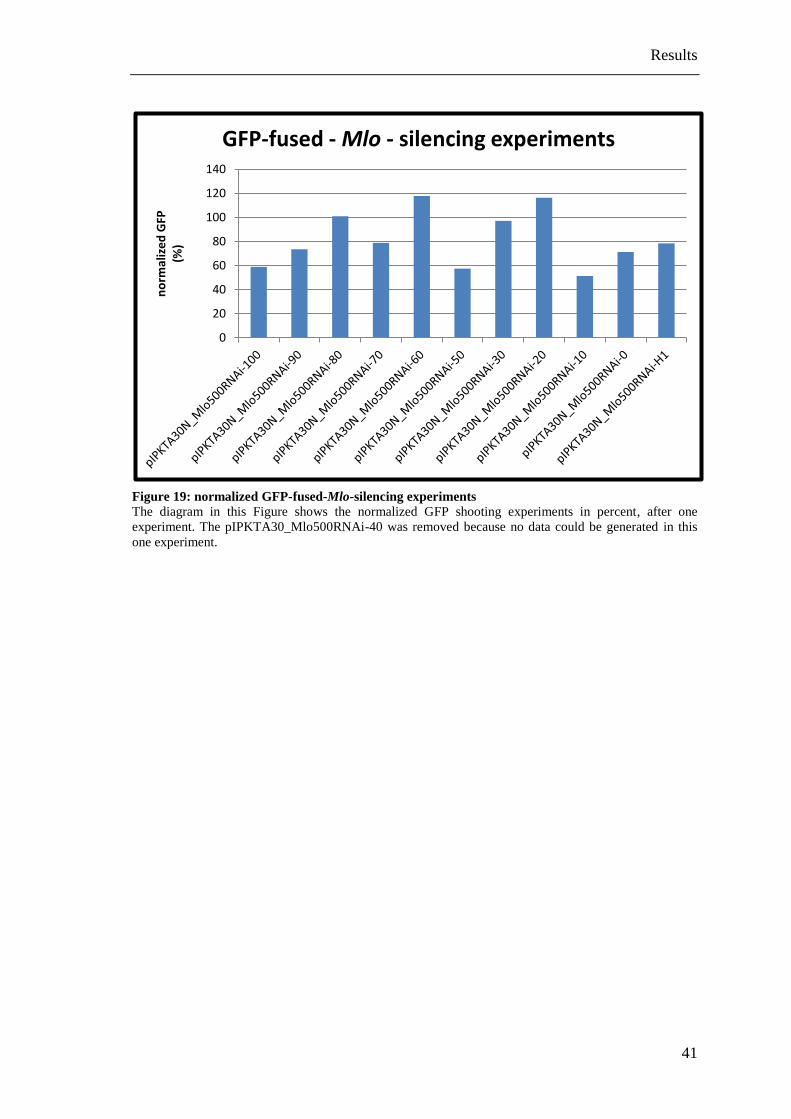
Results
41
Figure 19: normalized GFP-fused-Mlo-silencing experiments
The diagram in this Figure shows the normalized GFP shooting experiments in percent, after one
experiment. The pIPKTA30_Mlo500RNAi-40 was removed because no data could be generated in this
one experiment.
0
20
40
60
80
100
120
140 n
orm
aliz
ed
GFP
(%
)
GFP-fused - Mlo - silencing experiments
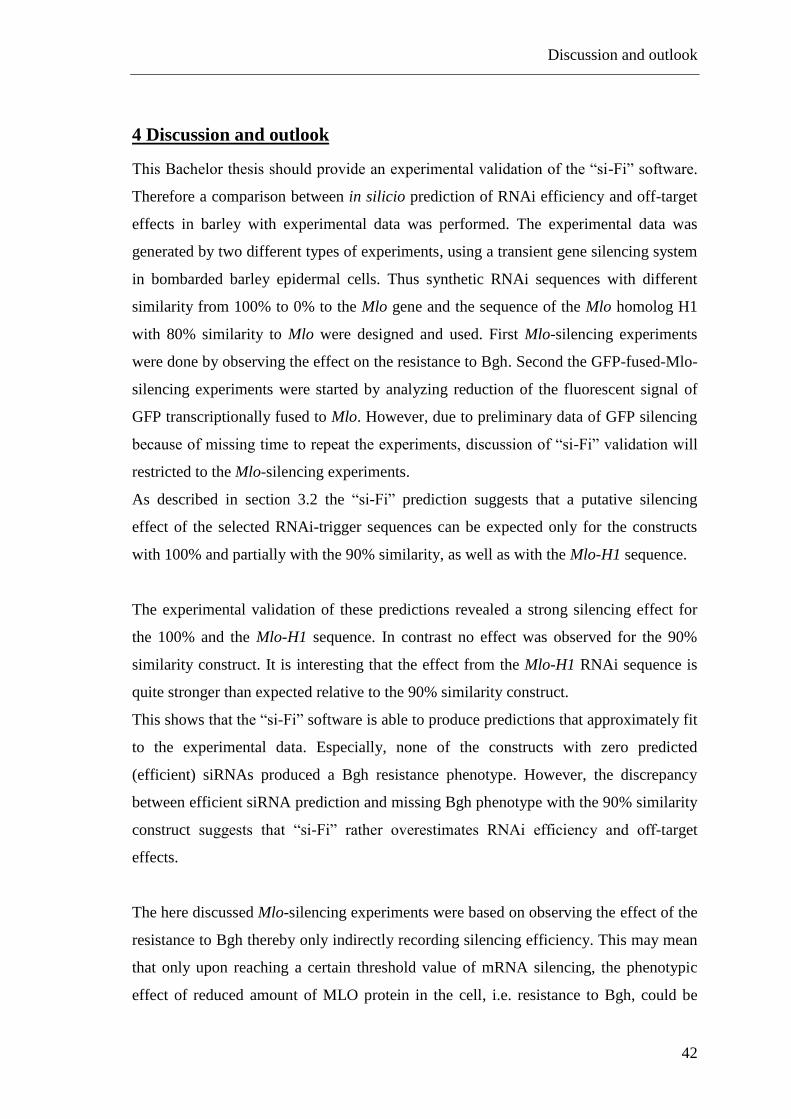
Discussion and outlook
42
4 Discussion and outlook
This Bachelor thesis should provide an experimental validation of the “si-Fi” software.
Therefore a comparison between in silicio prediction of RNAi efficiency and off-target
effects in barley with experimental data was performed. The experimental data was
generated by two different types of experiments, using a transient gene silencing system
in bombarded barley epidermal cells. Thus synthetic RNAi sequences with different
similarity from 100% to 0% to the Mlo gene and the sequence of the Mlo homolog H1
with 80% similarity to Mlo were designed and used. First Mlo-silencing experiments
were done by observing the effect on the resistance to Bgh. Second the GFP-fused-Mlo-
silencing experiments were started by analyzing reduction of the fluorescent signal of
GFP transcriptionally fused to Mlo. However, due to preliminary data of GFP silencing
because of missing time to repeat the experiments, discussion of “si-Fi” validation will
restricted to the Mlo-silencing experiments.
As described in section 3.2 the “si-Fi” prediction suggests that a putative silencing
effect of the selected RNAi-trigger sequences can be expected only for the constructs
with 100% and partially with the 90% similarity, as well as with the Mlo-H1 sequence.
The experimental validation of these predictions revealed a strong silencing effect for
the 100% and the Mlo-H1 sequence. In contrast no effect was observed for the 90%
similarity construct. It is interesting that the effect from the Mlo-H1 RNAi sequence is
quite stronger than expected relative to the 90% similarity construct.
This shows that the “si-Fi” software is able to produce predictions that approximately fit
to the experimental data. Especially, none of the constructs with zero predicted
(efficient) siRNAs produced a Bgh resistance phenotype. However, the discrepancy
between efficient siRNA prediction and missing Bgh phenotype with the 90% similarity
construct suggests that “si-Fi” rather overestimates RNAi efficiency and off-target
effects.
The here discussed Mlo-silencing experiments were based on observing the effect of the
resistance to Bgh thereby only indirectly recording silencing efficiency. This may mean
that only upon reaching a certain threshold value of mRNA silencing, the phenotypic
effect of reduced amount of MLO protein in the cell, i.e. resistance to Bgh, could be
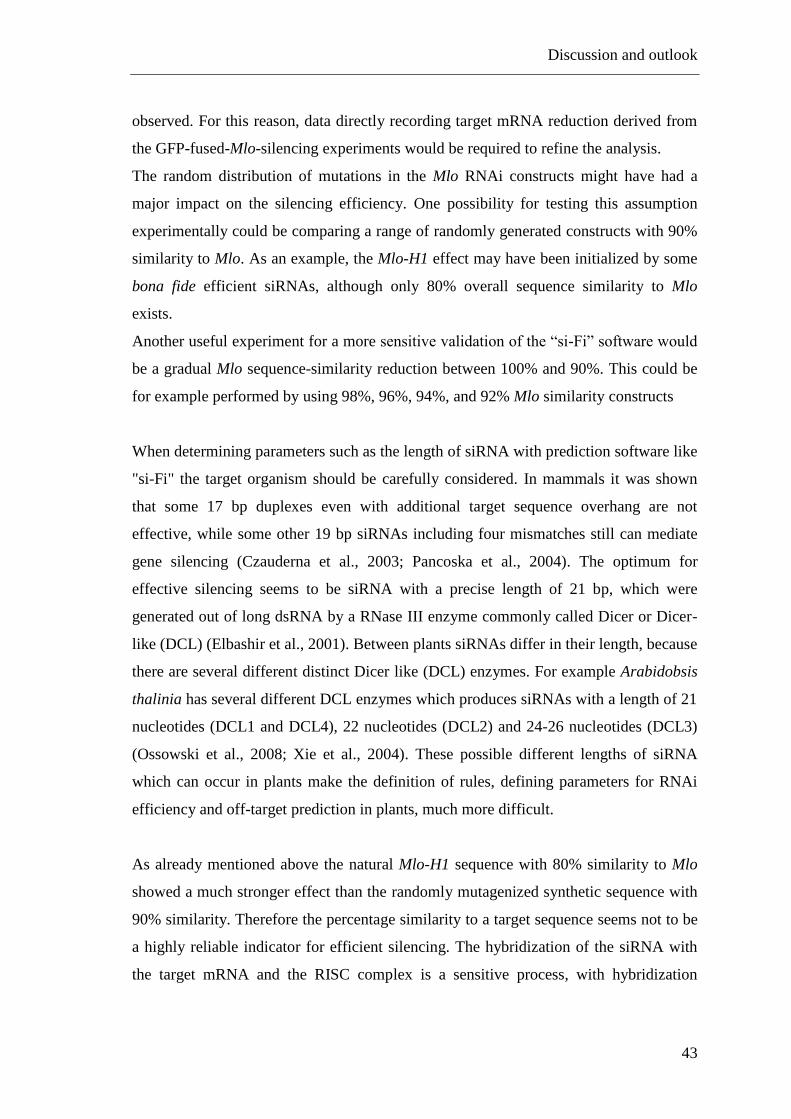
Discussion and outlook
43
observed. For this reason, data directly recording target mRNA reduction derived from
the GFP-fused-Mlo-silencing experiments would be required to refine the analysis.
The random distribution of mutations in the Mlo RNAi constructs might have had a
major impact on the silencing efficiency. One possibility for testing this assumption
experimentally could be comparing a range of randomly generated constructs with 90%
similarity to Mlo. As an example, the Mlo-H1 effect may have been initialized by some
bona fide efficient siRNAs, although only 80% overall sequence similarity to Mlo
exists.
Another useful experiment for a more sensitive validation of the “si-Fi” software would
be a gradual Mlo sequence-similarity reduction between 100% and 90%. This could be
for example performed by using 98%, 96%, 94%, and 92% Mlo similarity constructs
When determining parameters such as the length of siRNA with prediction software like
"si-Fi" the target organism should be carefully considered. In mammals it was shown
that some 17 bp duplexes even with additional target sequence overhang are not
effective, while some other 19 bp siRNAs including four mismatches still can mediate
gene silencing (Czauderna et al., 2003; Pancoska et al., 2004). The optimum for
effective silencing seems to be siRNA with a precise length of 21 bp, which were
generated out of long dsRNA by a RNase III enzyme commonly called Dicer or Dicer-
like (DCL) (Elbashir et al., 2001). Between plants siRNAs differ in their length, because
there are several different distinct Dicer like (DCL) enzymes. For example Arabidobsis
thalinia has several different DCL enzymes which produces siRNAs with a length of 21
nucleotides (DCL1 and DCL4), 22 nucleotides (DCL2) and 24-26 nucleotides (DCL3)
(Ossowski et al., 2008; Xie et al., 2004). These possible different lengths of siRNA
which can occur in plants make the definition of rules, defining parameters for RNAi
efficiency and off-target prediction in plants, much more difficult.
As already mentioned above the natural Mlo-H1 sequence with 80% similarity to Mlo
showed a much stronger effect than the randomly mutagenized synthetic sequence with
90% similarity. Therefore the percentage similarity to a target sequence seems not to be
a highly reliable indicator for efficient silencing. The hybridization of the siRNA with
the target mRNA and the RISC complex is a sensitive process, with hybridization
Discussion and outlook
44
thermodynamics as crucial factors. For example the silencing effect may depend on the
position of the siRNA along the target mRNA. Characterized by its secondary structure
including loop and stem regions. In addition the nucleotide sequence is an interesting
factor. Single nucleotide positions are often essential for binding processes and
position-specific mutations can significantly change stability. As it was investigated by
(Pancoska et al., 2004) the siRNA efficiency is "based upon the contextual similarity
and predicted thermodynamic stability". But especially for plants the factors which
influence the activity of the RNAi processes are complex and to a large extent
undefined. Thus it seems to be increasingly important to generate bona-fide efficient
siRNA out of the long dsRNA. The “si-Fi” software currently does not consider these
structural aspects determining hybridization conformations. This could explain the false
positive prediction for the 90% similarity construct. Regardless to this the amount of
siRNA may also have an impact on the silencing effect.
It would be very interesting if further research can test if Mlo-H1 is expressed or not.
And, if it is expressed, which role it might play in the barley-powdery mildew
interaction. At least as far as public transcriptional data of barley are concerned Mlo-H1
appears not or very lowly or specifically expressed. Therefore, it appears more likely
that the RNAi effect of Mlo-H1 was due to off-targeting Mlo. The initial sequence of
Mlo-H1 was derived from a genomic Lambda clone of barley (GenBank: Z95496.1),
which does not provide clues as to its expression. It appears to be localized to
chromosome 4HL based on genetic anchoring of whole-genome shotgun sequences, and
might therefore be a tandem duplicate of Mlo, which also maps to the same
chromosome arm (The International Barley Genome Sequencing Consortium, 2012).
To test whether the protein encoded by Mlo-H1 really plays a role in the barley-
powdery mildew interaction, a transient Mlo-H1 overexpression experiment using the
same experimental system as described here may be informative.
In summary, the “si-Fi” software can be used for off-target prediction, while its
usefulness for optimizing RNAi constructs with high efficiency may be limited.
Summary
45
5 Summary
RNAi is an ancient natural antiviral (siRNA) and gene-regulatory (miRNA) mechanism
that directs silencing of gene expression in a sequence-specific manner. The silencing of
target genes is generally achieved by cutting and degradation of the target mRNA. It can
also results from a translational blockade of the intact mRNA by miRNA or from a
direct attack on the (promoter) DNA resulting in a transcriptional blockade (Agrawal et
al., 2003).
Until now there are no versatile tools for defining parameters for RNAi efficiency and
off-target prediction in plants. This Bachelor thesis should provide an experimental
validation of the “si-Fi” software, which is designed for RNAi off-target search and
silencing efficiency prediction. The aim of this work is a comparison between in silicio
prediction of RNAi efficiency and off-target effects in plants with experimental data.
For this task a transient gene silencing system in bombarded barley epidermal cells and
the software “si-Fi”, developed by the working group Pathogen-Stress Genomics at
IPK, was used.
The experiments were based on using synthetic DNA with different levels of similarity
to the original Mlo gene of barley that were used as RNAi trigger. The Mlo gene is a
negative regulator of cell death. Mutation or silencing of the Mlo gene confers strong
resistance to powdery mildew fungi, which provides an easy observable and
quantifiable phenotype or reduced Mlo function.
A perfect match to the Mlo sequence (100% similarity) and 10 further sequences with
decreasing similarity (from 90% to 0% in 10% steps approximately) where designed
with a length of 500 bp. In addition a sequence derived from the MLO protein
homologue Mlo-H1 gene of barley sharing approximately 80% similarity to the Mlo
gene was also included to the experiment as natural sequence with potential off-target
effect on Mlo. With these designed sequences the in silico prediction was performed
using software “si-Fi”.
The twelve synthetic fragments were cut out of the delivery vector (pUC57) by
restriction enzymes XbaI and SalI. The excised fragments were inserted to the
Gateway™ entry vector pIPKTA38, and transferred by LR recombination reaction to
the destination RNAi vector pIPKTA30N.
Summary
46
The efficiency of the different RNAi constructs was estimated by their effect on the
resistance of bombarded, transformed epidermal cells to Bgh (Mlo-silencing
experiments).
In addition to the approach above, the 100% similarity Mlo sequence was
transcriptionally fused to an instable GFP reporter, and used as a target of the RNAi
constructs. The silencing efficiency of the RNAi constructs was scored by means of
reducing the fluorescent signal of GFP (GFP-fused-Mlo-silencing experiments).
The “si-Fi” prediction suggests that a putative silencing effect of the selected RNAi-
trigger sequences can be expected only for the constructs with 100% and partially with
the 90% similarity to Mlo, as well as with the Mlo-H1 sequence.
Data of the GFP-fused-Mlo-silencing experiments showed principal feasibility of direct
off-target testing, but would require further repetitions for a detailed discussion.
The Mlo-silencing experiments showed strong silencing effects for the 100% similarity
and the Mlo-H1 sequences. In contrast no effect was observed for the 90% similarity
construct despite off target predictions by “si-Fi”. It is noticeable that the effect from the
Mlo-H1 sequence was stronger than for the 90% similarity sequence, although it shared
only 80% similarity with Mlo. This suggests that the precise sequence and position of
off-target siRNAs play a considerable role in RNAi efficiency. In conclusion, “si-Fi”
can be used for off-target prediction although it may be rather overestimate off-target
effects.
List of References
47
List of References
[URL 1] (Accessed 08/08/2013) unknown author: “RNA interference ( RNAi ) basics
and essential publication”
http://www.gene-quantification.de/rnai.html
[URL 2] (Accessed 08/08/2013) Stefanie Lück, Dimitar Douchkov
http://labtools.ipk-gatersleben.de/other.html
[URL 3] (Accessed 08/08/2013) unknown author: “DNASTAR Software for life
scientists”
http://www.dnastar.com/
[URL 4] (Accessed 08/08/2013) unknown author: “About GIMP”
http://www.gimp.org/about/introduction.html
[URL 5] (Accessed 08/08/2013) unknown author: “SmartLadder”:
https://secure.eurogentec.com/product/research-smartladder.html
[URL 6] (Accessed 06/27/2013) Böhlenius H and Thordal-Christensen H “Study
extrahaustorial membrane formation”
http://jobbank.ku.dk/job/117213/institut-for-plante-/msc-bsc-project-in-defence-
genetics
[URL 7] (Accessed 07/11/2013) Hans Lohninger: “Nalimov-Test”
http://www.statistics4u.com/fundstat_germ/ee_nalimov_outliertest.html
[URL 8] (Accessed 07/11/2013) unknown author: “scipy.stats.ttest_1samp“
http://docs.scipy.org/doc/scipy/reference/generated/scipy.stats.ttest_1samp.html
List of References
48
[URL 9] (Accessed 07/15/2013) unknown author: “Bowtie An ultrafast memory-
efficient short read aligner”
http://bowtie-bio.sourceforge.net/manual.shtml
[URL 10] (Accessed 07/31/2013) ClustalW2
http://www.ebi.ac.uk/Tools/msa/clustalw2/
[URL 11] (Accessed 07/31/2013) Steve Wanamaker, Timothy Close: “HarvEST”
http://harvest.ucr.edu/
Agrawal, N., Dasaradhi, P., Mohmmed, A., Malhotra, P., Bhatnagar, R. K., &
Mukherjee, S. K. (2003). RNA interference: biology, mechanism, and applications.
Microbiology and Molecular Biology Reviews, 67, 657–685.
Baum, T., Navarro-Quezada, A., Knogge, W., Douchkov, D., Schweizer, P., & Seiffert,
U. (2011). HyphArea--automated analysis of spatiotemporal fungal patterns.
Journal of plant physiology, 168, 72–8.
Bio-Rad Laboratories. (n.d.). Biolistic PDS-1000/He Delivery System (pp. 1–47).
Blaszczyk, J., Tropea, J. E., Bubunenko, M., Routzahn, K. M., Waugh, D. S., Court, D.
L., & Ji, X. (2001). Crystallographic and modeling studies of RNase III suggest a
mechanism for double-stranded RNA cleavage. Structure (London, England :
1993), 9, 1225–36.
Both, M., Csukai, M., Stumpf, M., & Spanu, P. D. (2005). Gene expression profiles of
Blumeria graminis indicate dynamic changes to primary metabolism during
development of an obligate biotrophic pathogen. The Plant Cell …, 17, 2107–2122.
List of References
49
Büschges, R., Hollricher, K., Panstruga, R., Simons, G., Wolter, M., Frijters, a, …
Schulze-Lefert, P. (1997). The barley Mlo gene: a novel control element of plant
pathogen resistance. Cell, 88, 695–705.
Cogoni, C., Irelan, J., Schumacher, M., Schmidhauser, T., Selker, E., & Macino, G.
(1996). silencing of the al-1 gene in vegetative cells of Neurospora is mediated by
a cytoplasmic effector and does not depend on DNA-DNA interactions or DNA
methylation. The EMBO journal, 15, 3153–3163.
Czauderna, F., Fechtner, M., Dames, S., Aygün, H., Klippel, A., Pronk, G. J., …
Kaufmann, J. (2003). Structural variations and stabilising modifications of
synthetic siRNAs in mammalian cells. Nucleic Acids Research, 31, 2705–2716.
Dean, R., Kan, J. A. N. A. L. V. A. N., Pretorius, Z. A., Hammond-kosack, K. I. M. E.,
Pietro, A. D. I., Spanu, P. D., … Foster, G. D. (2012). The Top 10 fungal
pathogens in molecular plant pathology, 13, 414–430.
Devoto, A., Hartmann, H. A., Piffanelli, P., Elliott, C., Simmons, C., Taramino, G., …
Panstruga, R. (2003). Molecular phylogeny and evolution of the plant-specific
seven-transmembrane MLO family. Journal of molecular evolution, 56, 77–88.
Devoto, A., Piffanelli, P., Nilsson, I., Wallin, E., Panstruga, R., Heijne, G. Von, &
Schulze-lefert, P. (1999). Topology , Subcellular Localization , and Sequence
Diversity of the Mlo Family in Plants. The Journal of Biological Chemistry, 274,
34993–35004.
Dong, W., Nowara, D., & Schweizer, P. (2006). Protein polyubiquitination plays a role
in basal host resistance of barley. The Plant Cell Online, 18, 3321–3331.
Douchkov, D., Nowara, D., Zierold, U., & Schweizer, P. (2005). A high-throughput
gene-silencing system for the functional assessment of defense-related genes in
barley epidermal cells. Molecular plant-microbe interactions : MPMI, 18, 755–
761.
List of References
50
Elbashir, S. M., Lendeckel, W., & Tuschl, T. (2001). RNA interference is mediated by
21- and 22-nucleotide RNAs. Genes & Development, 15, 188–200.
Fire, A., Xu, S., Montgomery, M., & Kostas, S. (1998). Potent and specific genetic
interference by double-stranded RNA in Caenorhabditis elegans. nature, 391, 806–
811.
Gong, W., Ren, Y., Xu, Q., Wang, Y., Lin, D., Zhou, H., & Li, T. (2006). Integrated
siRNA design based on surveying of features associated with high RNAi
effectiveness. BMC bioinformatics, 7, 516.
Halford, N. G., & Shewry, P. R. (2000). Genetically modified crops: methodology,
benefits, regulation and public concerns. British medical bulletin, 56, 62–73.
Hammond, S. M., Boettcher, S., Caudy, A. A., Kobayashi, R., & Hannon, G. J. (2001).
Argonaute2, a link between genetic and biochemical analyses of RNAi. Science,
293, 1146–1150.
Humphry, M., Consonni, C., & Panstruga, R. (2006). mlo - based powdery mildew
immunity : silver bullet or simply non-host resistance ? Molecular Plant
Pathology, 7, 605–610.
Ingelbrecht, I., Van Houdt, H., Van Montagu, M., & Depicker, a. (1994).
Posttranscriptional silencing of reporter transgenes in tobacco correlates with DNA
methylation. Proceedings of the National Academy of Sciences of the United States
of America, 91, 10502–6.
Kim, V. (2005). Small RNAs: classification, biogenesis, and function. Mol Cells, 19, 1–
15.
Langmead, B., Trapnell, C., Pop, M., & Salzberg, S. L. (2009). Ultrafast and memory-
efficient alignment of short DNA sequences to the human genome. Genome
biology, 10, R25.
List of References
51
Lipardi, C., Wei, Q., & Paterson, B. M. (2001). RNAi as random degradative PCR:
siRNA primers convert mRNA into dsRNAs that are degraded to generate new
siRNAs. Cell, 107, 297–307.
Madden, T. (n.d.). Chapter 16 : The BLAST Sequence Analysis Tool. In The NCBI
Handbook (pp. 1–15).
Mette, M. F., Aufsatz, W., van der Winden, J., Matzke, M. a, & Matzke, a J. (2000).
Transcriptional silencing and promoter methylation triggered by double-stranded
RNA. The EMBO journal, 19, 5194–201.
Naito, Y., Yamada, T., Matsumiya, T., Ui-Tei, K., Saigo, K., & Morishita, S. (2005).
dsCheck: highly sensitive off-target search software for double-stranded RNA-
mediated RNA interference. Nucleic acids research, 33, W589–91.
Naito, Y., Yamada, T., Ui-Tei, K., Morishita, S., & Saigo, K. (2004). siDirect: highly
effective, target-specific siRNA design software for mammalian RNA interference.
Nucleic Acids Research, 32, W124–9.
Napoli, C., Lemieux, C., & Jorgensen, R. (1990). Introduction of a Chimeric Chalcone
Synthase Gene into Petunia Results in Reversible Co-Suppression of Homologous
Genes in trans. The Plant cell, 2, 279–289.
Ossowski, S., Schwab, R., & Weigel, D. (2008). Gene silencing in plants using artificial
microRNAs and other small RNAs. The Plant journal : for cell and molecular
biology, 53, 674–90.
Pancoska, P., Moravek, Z., & Moll, U. M. (2004). Efficient RNA interference depends
on global context of the target sequence: quantitative analysis of silencing
efficiency using Eulerian graph representation of siRNA. Nucleic acids research,
32, 1469–79.
Pei, Y., & Tuschl, T. (2006). On the art of identifying effective and specific siRNAs.
Nature methods, 3, 1–7.
List of References
52
Piffanelli, P., Zhou, F., & Casais, C. (2002). The barley MLO modulator of defense and
cell death is responsive to biotic and abiotic stress stimuli. Plant physiology, 129,
1076–1085.
Schweizer, P, Pokorny, J., Schulze-Lefert, P., & Dudler, R. (2000). Technical advance.
Double-stranded RNA interferes with gene function at the single-cell level in
cereals. The Plant journal : for cell and molecular biology, 24, 895–903.
Schweizer, Patrick, Pokorny, J., Abderhalden, O., & Dudler, R. (1999). A Transient
Assay System for the Functional Assessment of Defense-Related Genes in Wheat.
Molecular Plant-Microbe Interactions, 12, 647–654.
Senthil-kumar, M., & Mysore, K. S. (2011). RNAi and Plant Gene Function Analysis.
(H. Kodama & A. Komamine, Eds.), 744, 13–25.
The International Barley Genome Sequencing Consortium, Mayer, K. F. X., Waugh, R.,
Brown, J. W. S., Schulman, A., Langridge, P., … Stein, N. (2012). A physical,
genetic and functional sequence assembly of the barley genome. Nature, 491, 711–
716.
The UniProt Consortium. (2013). Update on activities at the Universal Protein Resource
(UniProt) in 2013. Nucleic acids research, 41, D43–7.
Ui-Tei, K., Naito, Y., Takahashi, F., Haraguchi, T., Ohki-Hamazaki, H., Juni, A., …
Saigo, K. (2004). Guidelines for the selection of highly effective siRNA sequences
for mammalian and chick RNA interference. Nucleic acids research, 32, 936–48.
Xie, Z., Johansen, L. K., Gustafson, A. M., Kasschau, K. D., Lellis, A. D., Zilberman,
D., … Carrington, J. C. (2004). Genetic and Functional Diversification of Small
RNA Pathways in Plants. PLoS Biol, 2, e104.
Xu, P., Zhang, Y., Kang, L., Roossinck, M. J., & Mysore, K. S. (2006). Computational
estimation and experimental verification of off-target silencing during
posttranscriptional gene silencing in plants. Plant physiology, 142, 429–40.
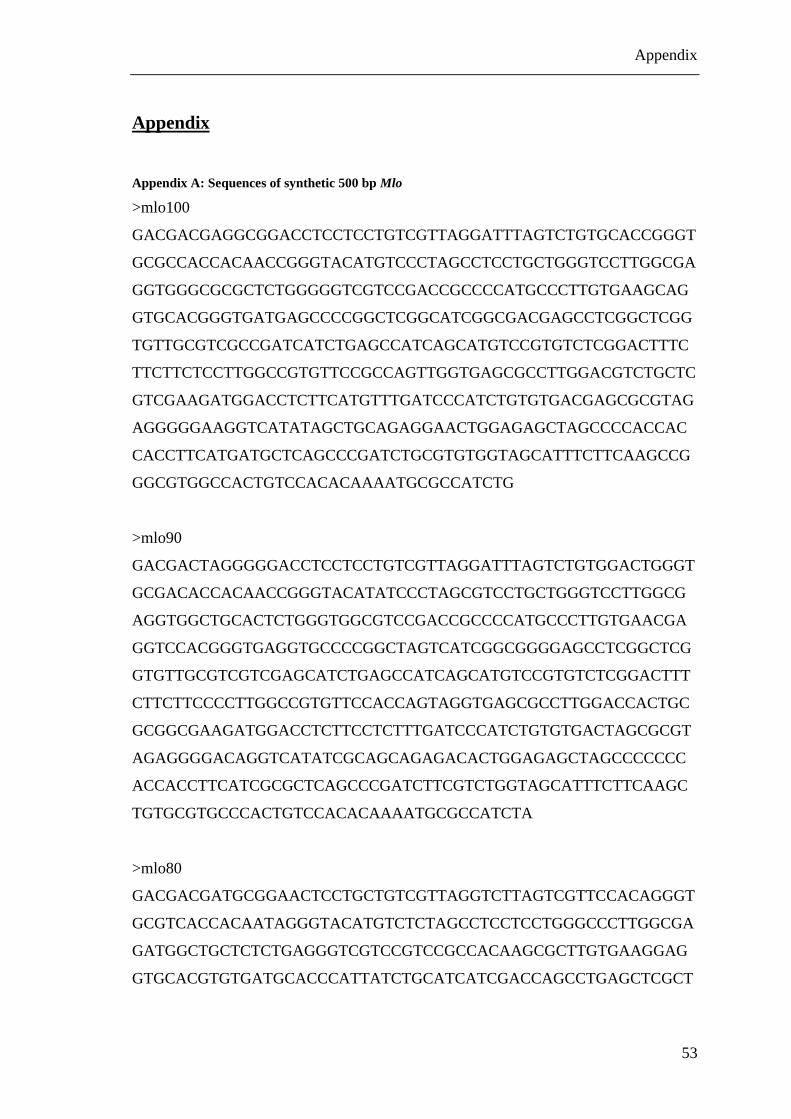
Appendix
53
Appendix
Appendix A: Sequences of synthetic 500 bp Mlo
>mlo100
GACGACGAGGCGGACCTCCTCCTGTCGTTAGGATTTAGTCTGTGCACCGGGT
GCGCCACCACAACCGGGTACATGTCCCTAGCCTCCTGCTGGGTCCTTGGCGA
GGTGGGCGCGCTCTGGGGGTCGTCCGACCGCCCCATGCCCTTGTGAAGCAG
GTGCACGGGTGATGAGCCCCGGCTCGGCATCGGCGACGAGCCTCGGCTCGG
TGTTGCGTCGCCGATCATCTGAGCCATCAGCATGTCCGTGTCTCGGACTTTC
TTCTTCTCCTTGGCCGTGTTCCGCCAGTTGGTGAGCGCCTTGGACGTCTGCTC
GTCGAAGATGGACCTCTTCATGTTTGATCCCATCTGTGTGACGAGCGCGTAG
AGGGGGAAGGTCATATAGCTGCAGAGGAACTGGAGAGCTAGCCCCACCAC
CACCTTCATGATGCTCAGCCCGATCTGCGTGTGGTAGCATTTCTTCAAGCCG
GGCGTGGCCACTGTCCACACAAAATGCGCCATCTG
>mlo90
GACGACTAGGGGGACCTCCTCCTGTCGTTAGGATTTAGTCTGTGGACTGGGT
GCGACACCACAACCGGGTACATATCCCTAGCGTCCTGCTGGGTCCTTGGCG
AGGTGGCTGCACTCTGGGTGGCGTCCGACCGCCCCATGCCCTTGTGAACGA
GGTCCACGGGTGAGGTGCCCCGGCTAGTCATCGGCGGGGAGCCTCGGCTCG
GTGTTGCGTCGTCGAGCATCTGAGCCATCAGCATGTCCGTGTCTCGGACTTT
CTTCTTCCCCTTGGCCGTGTTCCACCAGTAGGTGAGCGCCTTGGACCACTGC
GCGGCGAAGATGGACCTCTTCCTCTTTGATCCCATCTGTGTGACTAGCGCGT
AGAGGGGACAGGTCATATCGCAGCAGAGACACTGGAGAGCTAGCCCCCCC
ACCACCTTCATCGCGCTCAGCCCGATCTTCGTCTGGTAGCATTTCTTCAAGC
TGTGCGTGCCCACTGTCCACACAAAATGCGCCATCTA
>mlo80
GACGACGATGCGGAACTCCTGCTGTCGTTAGGTCTTAGTCGTTCCACAGGGT
GCGTCACCACAATAGGGTACATGTCTCTAGCCTCCTCCTGGGCCCTTGGCGA
GATGGCTGCTCTCTGAGGGTCGTCCGTCCGCCACAAGCGCTTGTGAAGGAG
GTGCACGTGTGATGCACCCATTATCTGCATCATCGACCAGCCTGAGCTCGCT
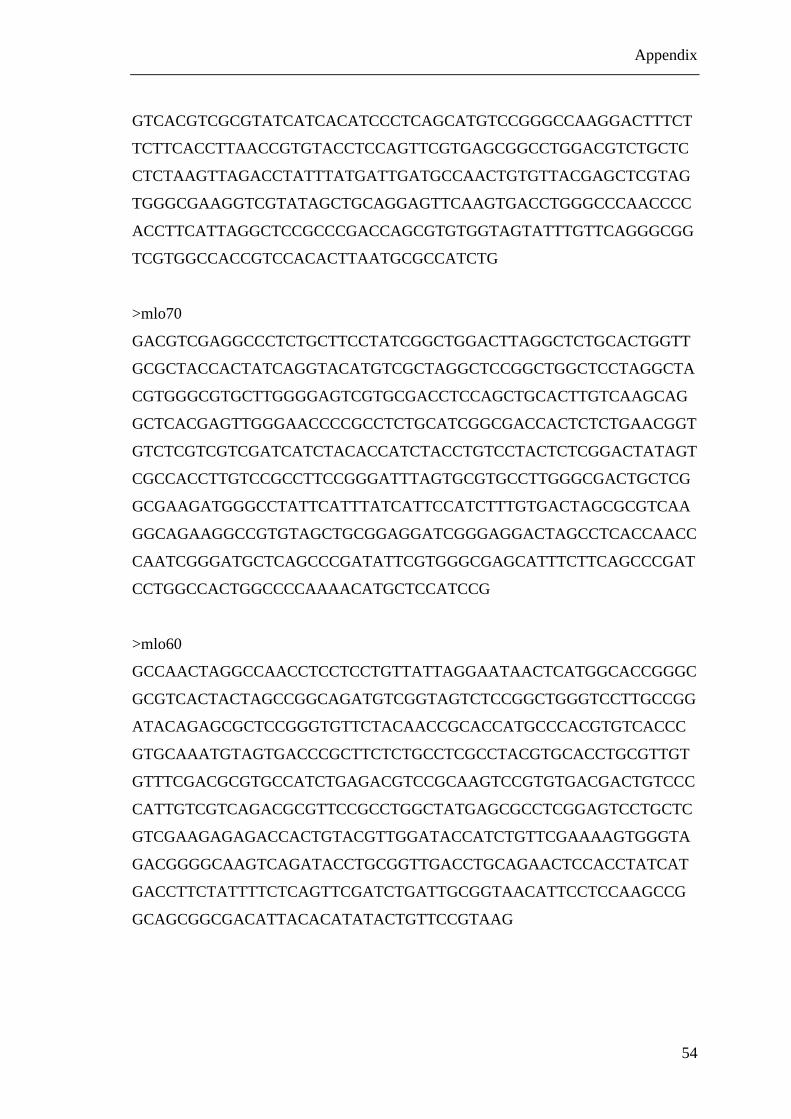
Appendix
54
GTCACGTCGCGTATCATCACATCCCTCAGCATGTCCGGGCCAAGGACTTTCT
TCTTCACCTTAACCGTGTACCTCCAGTTCGTGAGCGGCCTGGACGTCTGCTC
CTCTAAGTTAGACCTATTTATGATTGATGCCAACTGTGTTACGAGCTCGTAG
TGGGCGAAGGTCGTATAGCTGCAGGAGTTCAAGTGACCTGGGCCCAACCCC
ACCTTCATTAGGCTCCGCCCGACCAGCGTGTGGTAGTATTTGTTCAGGGCGG
TCGTGGCCACCGTCCACACTTAATGCGCCATCTG
>mlo70
GACGTCGAGGCCCTCTGCTTCCTATCGGCTGGACTTAGGCTCTGCACTGGTT
GCGCTACCACTATCAGGTACATGTCGCTAGGCTCCGGCTGGCTCCTAGGCTA
CGTGGGCGTGCTTGGGGAGTCGTGCGACCTCCAGCTGCACTTGTCAAGCAG
GCTCACGAGTTGGGAACCCCGCCTCTGCATCGGCGACCACTCTCTGAACGGT
GTCTCGTCGTCGATCATCTACACCATCTACCTGTCCTACTCTCGGACTATAGT
CGCCACCTTGTCCGCCTTCCGGGATTTAGTGCGTGCCTTGGGCGACTGCTCG
GCGAAGATGGGCCTATTCATTTATCATTCCATCTTTGTGACTAGCGCGTCAA
GGCAGAAGGCCGTGTAGCTGCGGAGGATCGGGAGGACTAGCCTCACCAACC
CAATCGGGATGCTCAGCCCGATATTCGTGGGCGAGCATTTCTTCAGCCCGAT
CCTGGCCACTGGCCCCAAAACATGCTCCATCCG
>mlo60
GCCAACTAGGCCAACCTCCTCCTGTTATTAGGAATAACTCATGGCACCGGGC
GCGTCACTACTAGCCGGCAGATGTCGGTAGTCTCCGGCTGGGTCCTTGCCGG
ATACAGAGCGCTCCGGGTGTTCTACAACCGCACCATGCCCACGTGTCACCC
GTGCAAATGTAGTGACCCGCTTCTCTGCCTCGCCTACGTGCACCTGCGTTGT
GTTTCGACGCGTGCCATCTGAGACGTCCGCAAGTCCGTGTGACGACTGTCCC
CATTGTCGTCAGACGCGTTCCGCCTGGCTATGAGCGCCTCGGAGTCCTGCTC
GTCGAAGAGAGACCACTGTACGTTGGATACCATCTGTTCGAAAAGTGGGTA
GACGGGGCAAGTCAGATACCTGCGGTTGACCTGCAGAACTCCACCTATCAT
GACCTTCTATTTTCTCAGTTCGATCTGATTGCGGTAACATTCCTCCAAGCCG
GCAGCGGCGACATTACACATATACTGTTCCGTAAG
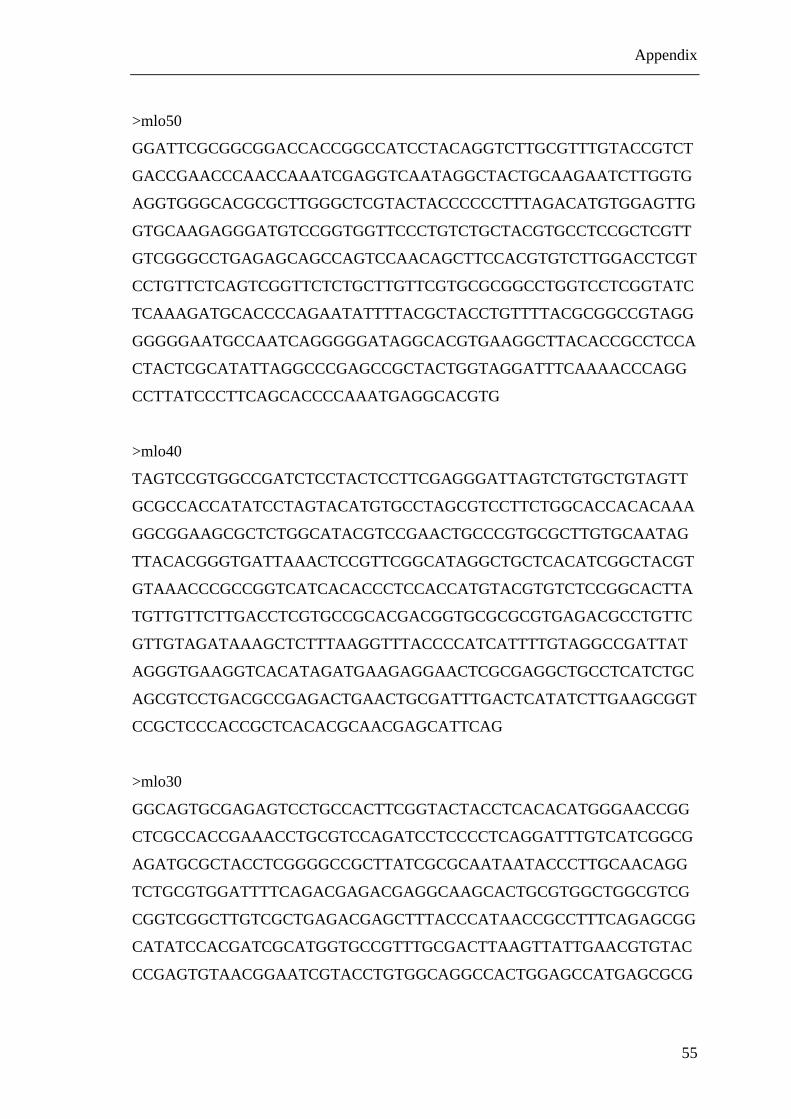
Appendix
55
>mlo50
GGATTCGCGGCGGACCACCGGCCATCCTACAGGTCTTGCGTTTGTACCGTCT
GACCGAACCCAACCAAATCGAGGTCAATAGGCTACTGCAAGAATCTTGGTG
AGGTGGGCACGCGCTTGGGCTCGTACTACCCCCCTTTAGACATGTGGAGTTG
GTGCAAGAGGGATGTCCGGTGGTTCCCTGTCTGCTACGTGCCTCCGCTCGTT
GTCGGGCCTGAGAGCAGCCAGTCCAACAGCTTCCACGTGTCTTGGACCTCGT
CCTGTTCTCAGTCGGTTCTCTGCTTGTTCGTGCGCGGCCTGGTCCTCGGTATC
TCAAAGATGCACCCCAGAATATTTTACGCTACCTGTTTTACGCGGCCGTAGG
GGGGGAATGCCAATCAGGGGGATAGGCACGTGAAGGCTTACACCGCCTCCA
CTACTCGCATATTAGGCCCGAGCCGCTACTGGTAGGATTTCAAAACCCAGG
CCTTATCCCTTCAGCACCCCAAATGAGGCACGTG
>mlo40
TAGTCCGTGGCCGATCTCCTACTCCTTCGAGGGATTAGTCTGTGCTGTAGTT
GCGCCACCATATCCTAGTACATGTGCCTAGCGTCCTTCTGGCACCACACAAA
GGCGGAAGCGCTCTGGCATACGTCCGAACTGCCCGTGCGCTTGTGCAATAG
TTACACGGGTGATTAAACTCCGTTCGGCATAGGCTGCTCACATCGGCTACGT
GTAAACCCGCCGGTCATCACACCCTCCACCATGTACGTGTCTCCGGCACTTA
TGTTGTTCTTGACCTCGTGCCGCACGACGGTGCGCGCGTGAGACGCCTGTTC
GTTGTAGATAAAGCTCTTTAAGGTTTACCCCATCATTTTGTAGGCCGATTAT
AGGGTGAAGGTCACATAGATGAAGAGGAACTCGCGAGGCTGCCTCATCTGC
AGCGTCCTGACGCCGAGACTGAACTGCGATTTGACTCATATCTTGAAGCGGT
CCGCTCCCACCGCTCACACGCAACGAGCATTCAG
>mlo30
GGCAGTGCGAGAGTCCTGCCACTTCGGTACTACCTCACACATGGGAACCGG
CTCGCCACCGAAACCTGCGTCCAGATCCTCCCCTCAGGATTTGTCATCGGCG
AGATGCGCTACCTCGGGGCCGCTTATCGCGCAATAATACCCTTGCAACAGG
TCTGCGTGGATTTTCAGACGAGACGAGGCAAGCACTGCGTGGCTGGCGTCG
CGGTCGGCTTGTCGCTGAGACGAGCTTTACCCATAACCGCCTTTCAGAGCGG
CATATCCACGATCGCATGGTGCCGTTTGCGACTTAAGTTATTGAACGTGTAC
CCGAGTGTAACGGAATCGTACCTGTGGCAGGCCACTGGAGCCATGAGCGCG
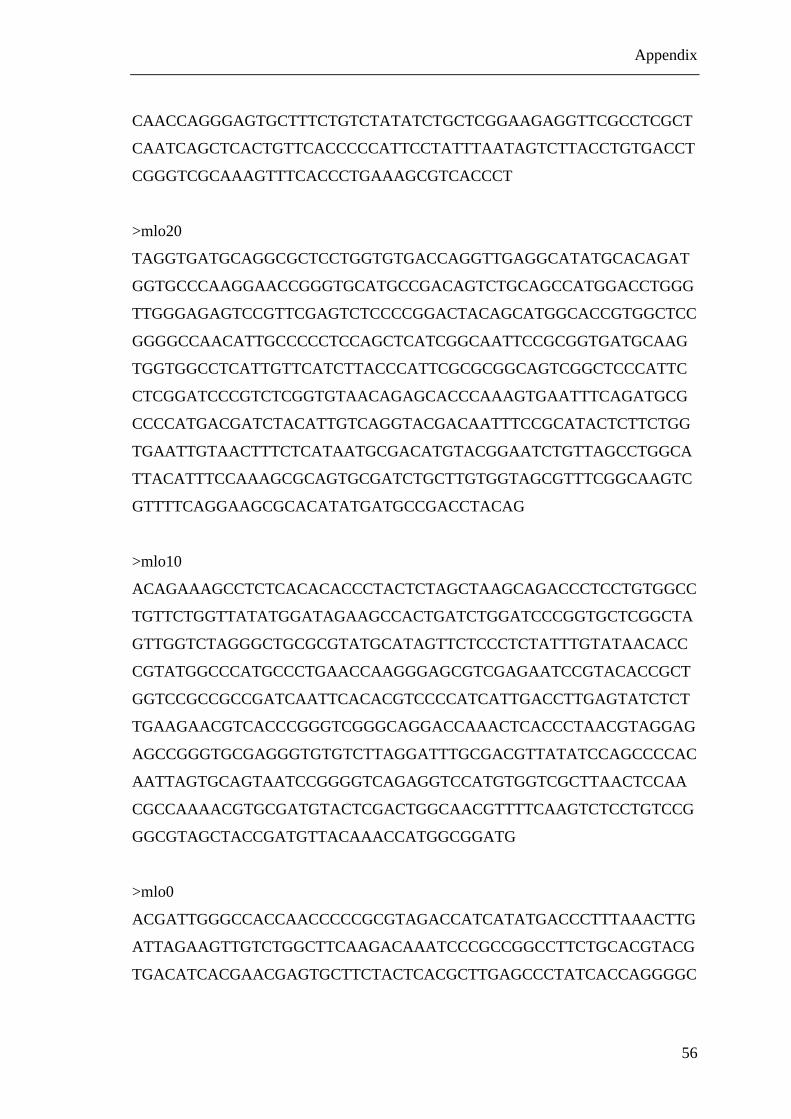
Appendix
56
CAACCAGGGAGTGCTTTCTGTCTATATCTGCTCGGAAGAGGTTCGCCTCGCT
CAATCAGCTCACTGTTCACCCCCATTCCTATTTAATAGTCTTACCTGTGACCT
CGGGTCGCAAAGTTTCACCCTGAAAGCGTCACCCT
>mlo20
TAGGTGATGCAGGCGCTCCTGGTGTGACCAGGTTGAGGCATATGCACAGAT
GGTGCCCAAGGAACCGGGTGCATGCCGACAGTCTGCAGCCATGGACCTGGG
TTGGGAGAGTCCGTTCGAGTCTCCCCGGACTACAGCATGGCACCGTGGCTCC
GGGGCCAACATTGCCCCCTCCAGCTCATCGGCAATTCCGCGGTGATGCAAG
TGGTGGCCTCATTGTTCATCTTACCCATTCGCGCGGCAGTCGGCTCCCATTC
CTCGGATCCCGTCTCGGTGTAACAGAGCACCCAAAGTGAATTTCAGATGCG
CCCCATGACGATCTACATTGTCAGGTACGACAATTTCCGCATACTCTTCTGG
TGAATTGTAACTTTCTCATAATGCGACATGTACGGAATCTGTTAGCCTGGCA
TTACATTTCCAAAGCGCAGTGCGATCTGCTTGTGGTAGCGTTTCGGCAAGTC
GTTTTCAGGAAGCGCACATATGATGCCGACCTACAG
>mlo10
ACAGAAAGCCTCTCACACACCCTACTCTAGCTAAGCAGACCCTCCTGTGGCC
TGTTCTGGTTATATGGATAGAAGCCACTGATCTGGATCCCGGTGCTCGGCTA
GTTGGTCTAGGGCTGCGCGTATGCATAGTTCTCCCTCTATTTGTATAACACC
CGTATGGCCCATGCCCTGAACCAAGGGAGCGTCGAGAATCCGTACACCGCT
GGTCCGCCGCCGATCAATTCACACGTCCCCATCATTGACCTTGAGTATCTCT
TGAAGAACGTCACCCGGGTCGGGCAGGACCAAACTCACCCTAACGTAGGAG
AGCCGGGTGCGAGGGTGTGTCTTAGGATTTGCGACGTTATATCCAGCCCCAC
AATTAGTGCAGTAATCCGGGGTCAGAGGTCCATGTGGTCGCTTAACTCCAA
CGCCAAAACGTGCGATGTACTCGACTGGCAACGTTTTCAAGTCTCCTGTCCG
GGCGTAGCTACCGATGTTACAAACCATGGCGGATG
>mlo0
ACGATTGGGCCACCAACCCCCGCGTAGACCATCATATGACCCTTTAAACTTG
ATTAGAAGTTGTCTGGCTTCAAGACAAATCCCGCCGGCCTTCTGCACGTACG
TGACATCACGAACGAGTGCTTCTACTCACGCTTGAGCCCTATCACCAGGGGC
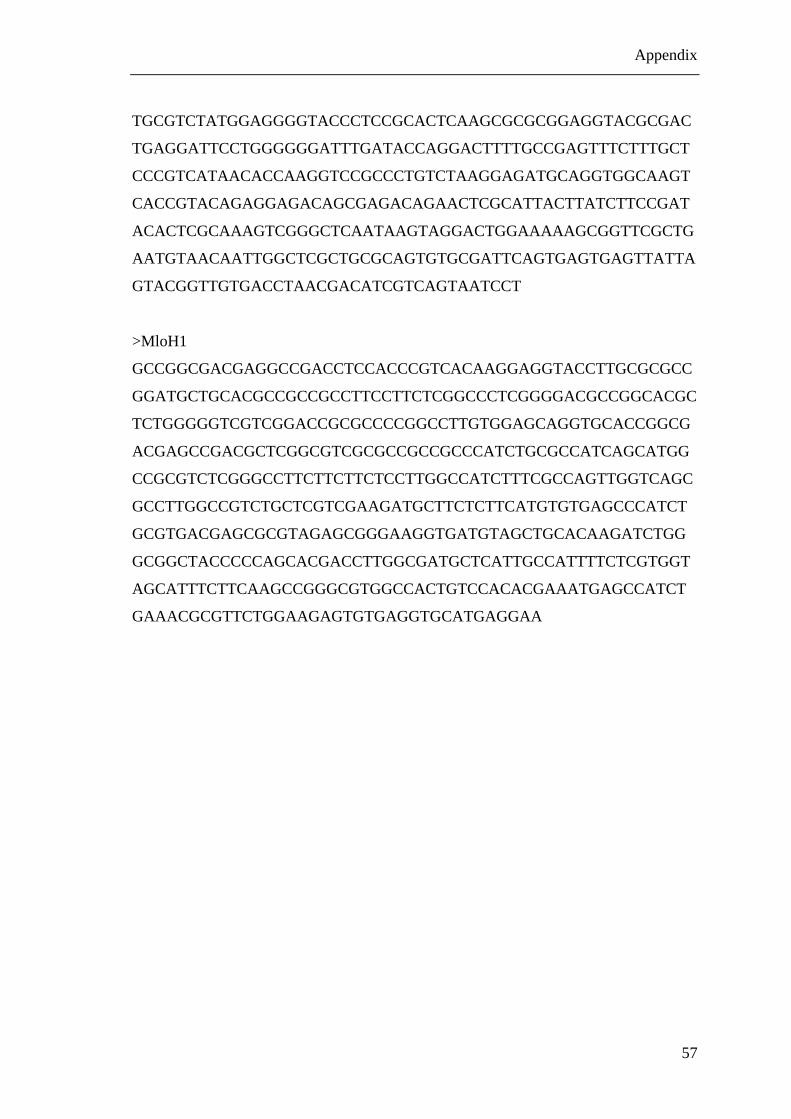
Appendix
57
TGCGTCTATGGAGGGGTACCCTCCGCACTCAAGCGCGCGGAGGTACGCGAC
TGAGGATTCCTGGGGGGATTTGATACCAGGACTTTTGCCGAGTTTCTTTGCT
CCCGTCATAACACCAAGGTCCGCCCTGTCTAAGGAGATGCAGGTGGCAAGT
CACCGTACAGAGGAGACAGCGAGACAGAACTCGCATTACTTATCTTCCGAT
ACACTCGCAAAGTCGGGCTCAATAAGTAGGACTGGAAAAAGCGGTTCGCTG
AATGTAACAATTGGCTCGCTGCGCAGTGTGCGATTCAGTGAGTGAGTTATTA
GTACGGTTGTGACCTAACGACATCGTCAGTAATCCT
>MloH1
GCCGGCGACGAGGCCGACCTCCACCCGTCACAAGGAGGTACCTTGCGCGCC
GGATGCTGCACGCCGCCGCCTTCCTTCTCGGCCCTCGGGGACGCCGGCACGC
TCTGGGGGTCGTCGGACCGCGCCCCGGCCTTGTGGAGCAGGTGCACCGGCG
ACGAGCCGACGCTCGGCGTCGCGCCGCCGCCCATCTGCGCCATCAGCATGG
CCGCGTCTCGGGCCTTCTTCTTCTCCTTGGCCATCTTTCGCCAGTTGGTCAGC
GCCTTGGCCGTCTGCTCGTCGAAGATGCTTCTCTTCATGTGTGAGCCCATCT
GCGTGACGAGCGCGTAGAGCGGGAAGGTGATGTAGCTGCACAAGATCTGG
GCGGCTACCCCCAGCACGACCTTGGCGATGCTCATTGCCATTTTCTCGTGGT
AGCATTTCTTCAAGCCGGGCGTGGCCACTGTCCACACGAAATGAGCCATCT
GAAACGCGTTCTGGAAGAGTGTGAGGTGCATGAGGAA
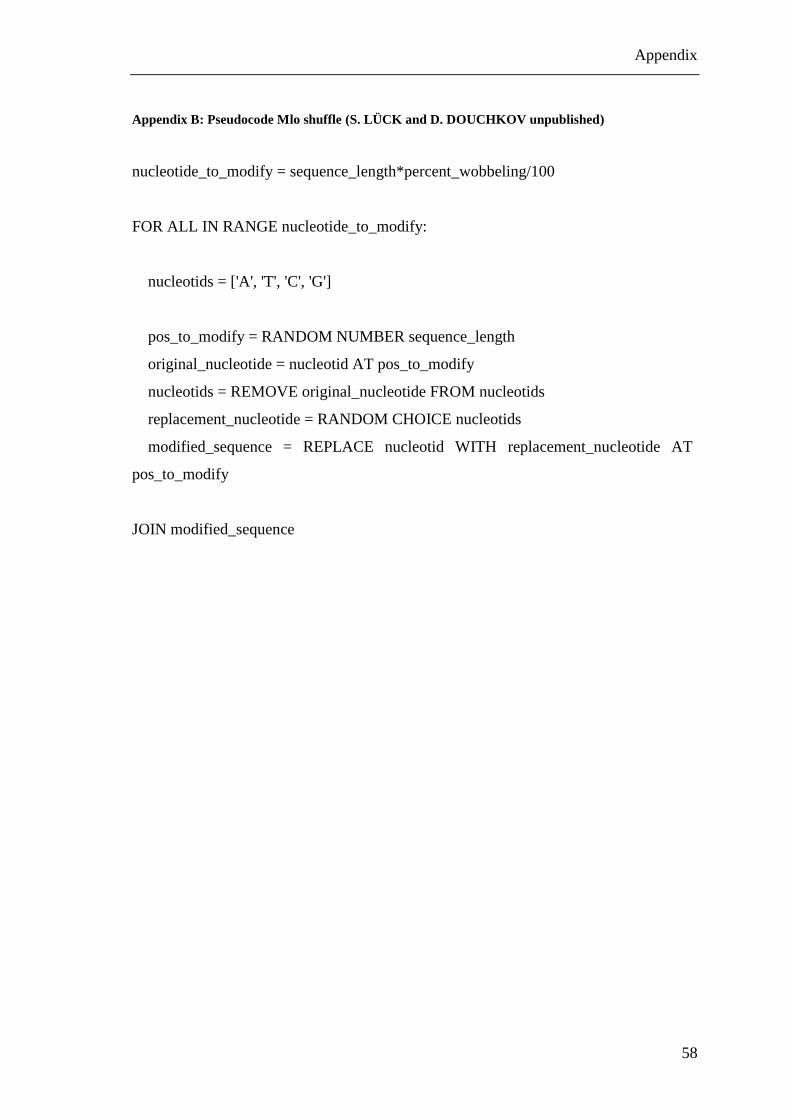
Appendix
58
Appendix B: Pseudocode Mlo shuffle (S. LÜCK and D. DOUCHKOV unpublished)
nucleotide_to_modify = sequence_length*percent_wobbeling/100
FOR ALL IN RANGE nucleotide_to_modify:
nucleotids = ['A', 'T', 'C', 'G']
pos_to_modify = RANDOM NUMBER sequence_length
original_nucleotide = nucleotid AT pos_to_modify
nucleotids = REMOVE original_nucleotide FROM nucleotids
replacement_nucleotide = RANDOM CHOICE nucleotids
modified_sequence = REPLACE nucleotid WITH replacement_nucleotide AT
pos_to_modify
JOIN modified_sequence
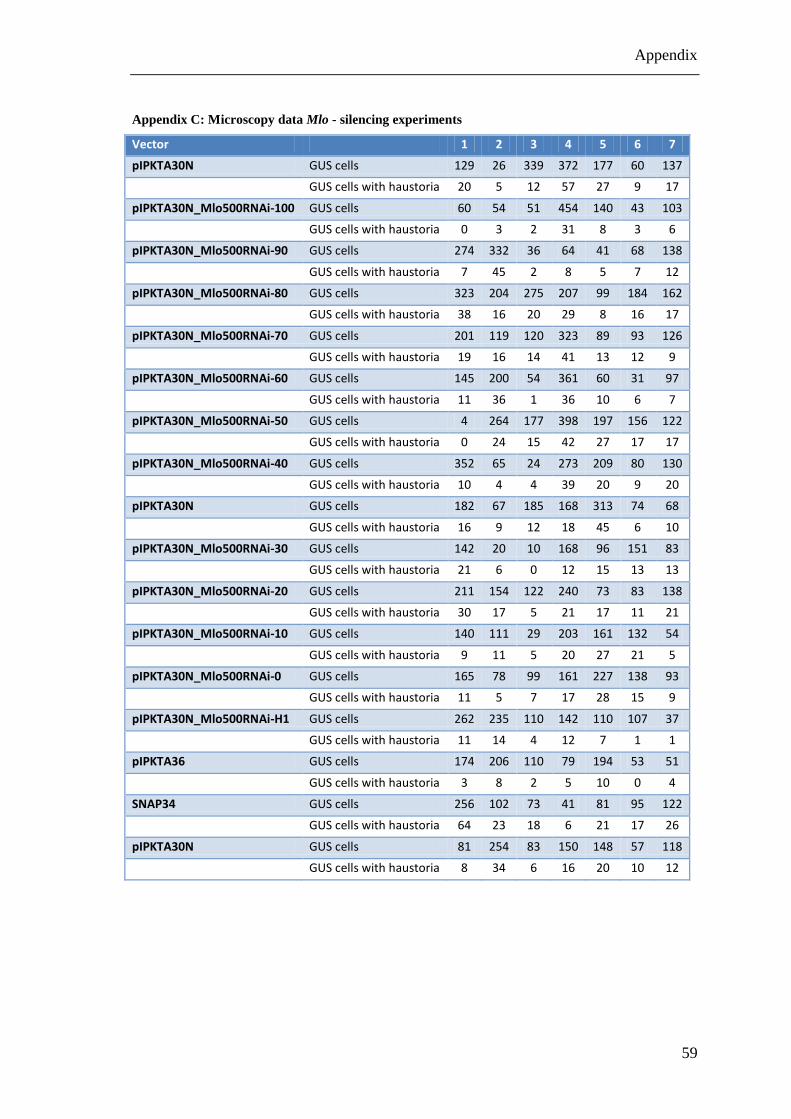
Appendix
59
Appendix C: Microscopy data Mlo - silencing experiments
Vector 1 2 3 4 5 6 7
pIPKTA30N GUS cells 129 26 339 372 177 60 137
GUS cells with haustoria 20 5 12 57 27 9 17
pIPKTA30N_Mlo500RNAi-100 GUS cells 60 54 51 454 140 43 103
GUS cells with haustoria 0 3 2 31 8 3 6
pIPKTA30N_Mlo500RNAi-90 GUS cells 274 332 36 64 41 68 138
GUS cells with haustoria 7 45 2 8 5 7 12
pIPKTA30N_Mlo500RNAi-80 GUS cells 323 204 275 207 99 184 162
GUS cells with haustoria 38 16 20 29 8 16 17
pIPKTA30N_Mlo500RNAi-70 GUS cells 201 119 120 323 89 93 126
GUS cells with haustoria 19 16 14 41 13 12 9
pIPKTA30N_Mlo500RNAi-60 GUS cells 145 200 54 361 60 31 97
GUS cells with haustoria 11 36 1 36 10 6 7
pIPKTA30N_Mlo500RNAi-50 GUS cells 4 264 177 398 197 156 122
GUS cells with haustoria 0 24 15 42 27 17 17
pIPKTA30N_Mlo500RNAi-40 GUS cells 352 65 24 273 209 80 130
GUS cells with haustoria 10 4 4 39 20 9 20
pIPKTA30N GUS cells 182 67 185 168 313 74 68
GUS cells with haustoria 16 9 12 18 45 6 10
pIPKTA30N_Mlo500RNAi-30 GUS cells 142 20 10 168 96 151 83
GUS cells with haustoria 21 6 0 12 15 13 13
pIPKTA30N_Mlo500RNAi-20 GUS cells 211 154 122 240 73 83 138
GUS cells with haustoria 30 17 5 21 17 11 21
pIPKTA30N_Mlo500RNAi-10 GUS cells 140 111 29 203 161 132 54
GUS cells with haustoria 9 11 5 20 27 21 5
pIPKTA30N_Mlo500RNAi-0 GUS cells 165 78 99 161 227 138 93
GUS cells with haustoria 11 5 7 17 28 15 9
pIPKTA30N_Mlo500RNAi-H1 GUS cells 262 235 110 142 110 107 37
GUS cells with haustoria 11 14 4 12 7 1 1
pIPKTA36 GUS cells 174 206 110 79 194 53 51
GUS cells with haustoria 3 8 2 5 10 0 4
SNAP34 GUS cells 256 102 73 41 81 95 122
GUS cells with haustoria 64 23 18 6 21 17 26
pIPKTA30N GUS cells 81 254 83 150 148 57 118
GUS cells with haustoria 8 34 6 16 20 10 12
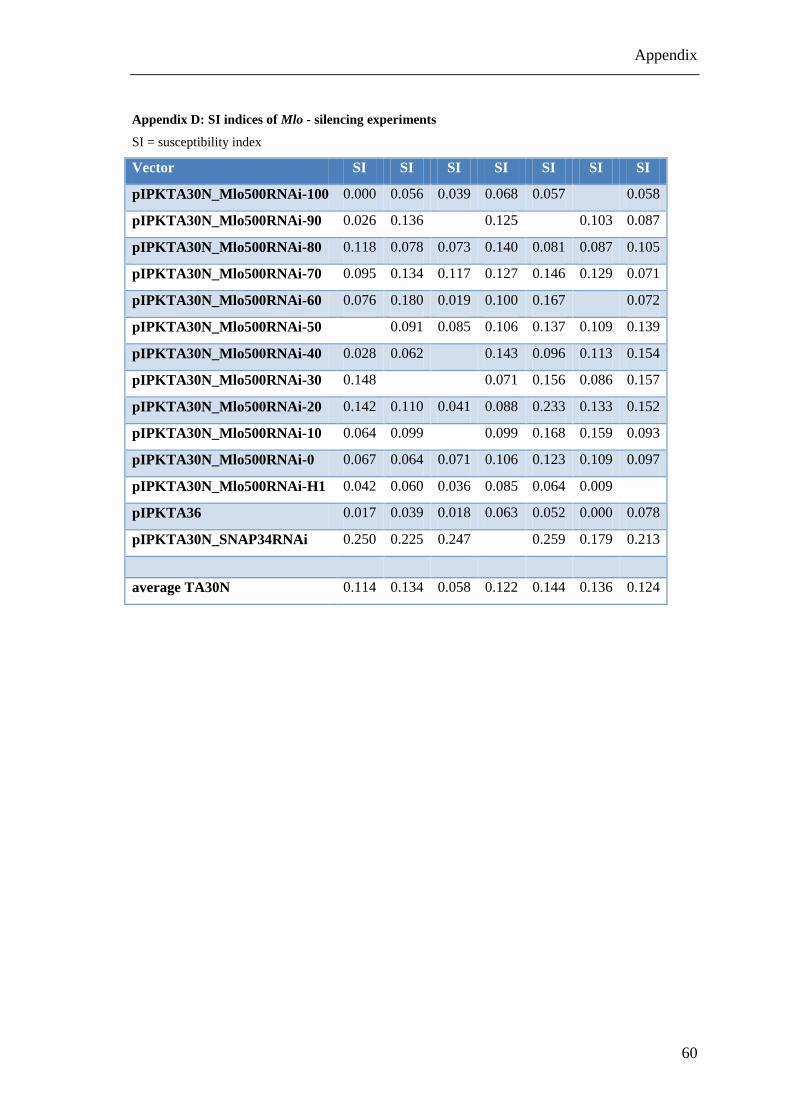
Appendix
60
Appendix D: SI indices of Mlo - silencing experiments
SI = susceptibility index
Vector SI SI SI SI SI SI SI
pIPKTA30N_Mlo500RNAi-100 0.000 0.056 0.039 0.068 0.057 0.058
pIPKTA30N_Mlo500RNAi-90 0.026 0.136 0.125 0.103 0.087
pIPKTA30N_Mlo500RNAi-80 0.118 0.078 0.073 0.140 0.081 0.087 0.105
pIPKTA30N_Mlo500RNAi-70 0.095 0.134 0.117 0.127 0.146 0.129 0.071
pIPKTA30N_Mlo500RNAi-60 0.076 0.180 0.019 0.100 0.167 0.072
pIPKTA30N_Mlo500RNAi-50 0.091 0.085 0.106 0.137 0.109 0.139
pIPKTA30N_Mlo500RNAi-40 0.028 0.062 0.143 0.096 0.113 0.154
pIPKTA30N_Mlo500RNAi-30 0.148 0.071 0.156 0.086 0.157
pIPKTA30N_Mlo500RNAi-20 0.142 0.110 0.041 0.088 0.233 0.133 0.152
pIPKTA30N_Mlo500RNAi-10 0.064 0.099 0.099 0.168 0.159 0.093
pIPKTA30N_Mlo500RNAi-0 0.067 0.064 0.071 0.106 0.123 0.109 0.097
pIPKTA30N_Mlo500RNAi-H1 0.042 0.060 0.036 0.085 0.064 0.009
pIPKTA36 0.017 0.039 0.018 0.063 0.052 0.000 0.078
pIPKTA30N_SNAP34RNAi 0.250 0.225 0.247 0.259 0.179 0.213
average TA30N 0.114 0.134 0.058 0.122 0.144 0.136 0.124
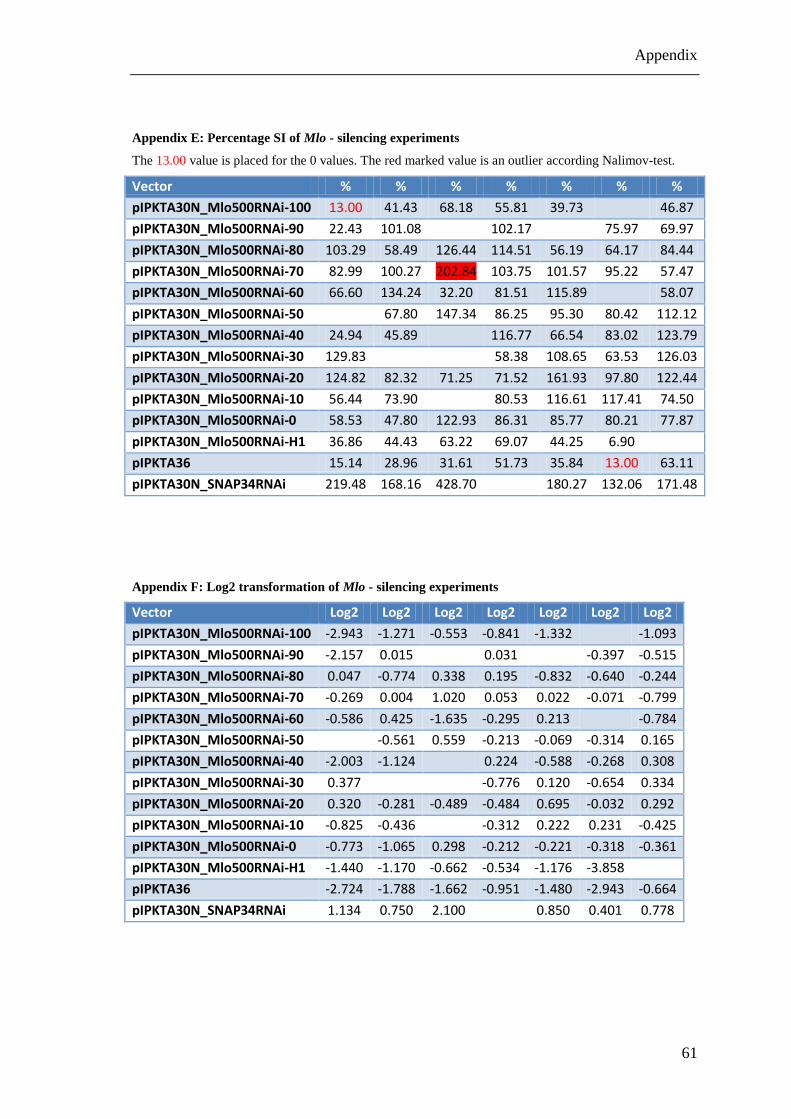
Appendix
61
Appendix E: Percentage SI of Mlo - silencing experiments
The 13.00 value is placed for the 0 values. The red marked value is an outlier according Nalimov-test.
Vector % % % % % % %
pIPKTA30N_Mlo500RNAi-100 13.00 41.43 68.18 55.81 39.73 46.87
pIPKTA30N_Mlo500RNAi-90 22.43 101.08 102.17 75.97 69.97
pIPKTA30N_Mlo500RNAi-80 103.29 58.49 126.44 114.51 56.19 64.17 84.44
pIPKTA30N_Mlo500RNAi-70 82.99 100.27 202.84 103.75 101.57 95.22 57.47
pIPKTA30N_Mlo500RNAi-60 66.60 134.24 32.20 81.51 115.89 58.07
pIPKTA30N_Mlo500RNAi-50 67.80 147.34 86.25 95.30 80.42 112.12
pIPKTA30N_Mlo500RNAi-40 24.94 45.89 116.77 66.54 83.02 123.79
pIPKTA30N_Mlo500RNAi-30 129.83 58.38 108.65 63.53 126.03
pIPKTA30N_Mlo500RNAi-20 124.82 82.32 71.25 71.52 161.93 97.80 122.44
pIPKTA30N_Mlo500RNAi-10 56.44 73.90 80.53 116.61 117.41 74.50
pIPKTA30N_Mlo500RNAi-0 58.53 47.80 122.93 86.31 85.77 80.21 77.87
pIPKTA30N_Mlo500RNAi-H1 36.86 44.43 63.22 69.07 44.25 6.90
pIPKTA36 15.14 28.96 31.61 51.73 35.84 13.00 63.11
pIPKTA30N_SNAP34RNAi 219.48 168.16 428.70 180.27 132.06 171.48
Appendix F: Log2 transformation of Mlo - silencing experiments
Vector Log2 Log2 Log2 Log2 Log2 Log2 Log2
pIPKTA30N_Mlo500RNAi-100 -2.943 -1.271 -0.553 -0.841 -1.332 -1.093
pIPKTA30N_Mlo500RNAi-90 -2.157 0.015 0.031 -0.397 -0.515
pIPKTA30N_Mlo500RNAi-80 0.047 -0.774 0.338 0.195 -0.832 -0.640 -0.244
pIPKTA30N_Mlo500RNAi-70 -0.269 0.004 1.020 0.053 0.022 -0.071 -0.799
pIPKTA30N_Mlo500RNAi-60 -0.586 0.425 -1.635 -0.295 0.213 -0.784
pIPKTA30N_Mlo500RNAi-50 -0.561 0.559 -0.213 -0.069 -0.314 0.165
pIPKTA30N_Mlo500RNAi-40 -2.003 -1.124 0.224 -0.588 -0.268 0.308
pIPKTA30N_Mlo500RNAi-30 0.377 -0.776 0.120 -0.654 0.334
pIPKTA30N_Mlo500RNAi-20 0.320 -0.281 -0.489 -0.484 0.695 -0.032 0.292
pIPKTA30N_Mlo500RNAi-10 -0.825 -0.436 -0.312 0.222 0.231 -0.425
pIPKTA30N_Mlo500RNAi-0 -0.773 -1.065 0.298 -0.212 -0.221 -0.318 -0.361
pIPKTA30N_Mlo500RNAi-H1 -1.440 -1.170 -0.662 -0.534 -1.176 -3.858
pIPKTA36 -2.724 -1.788 -1.662 -0.951 -1.480 -2.943 -0.664
pIPKTA30N_SNAP34RNAi 1.134 0.750 2.100 0.850 0.401 0.778
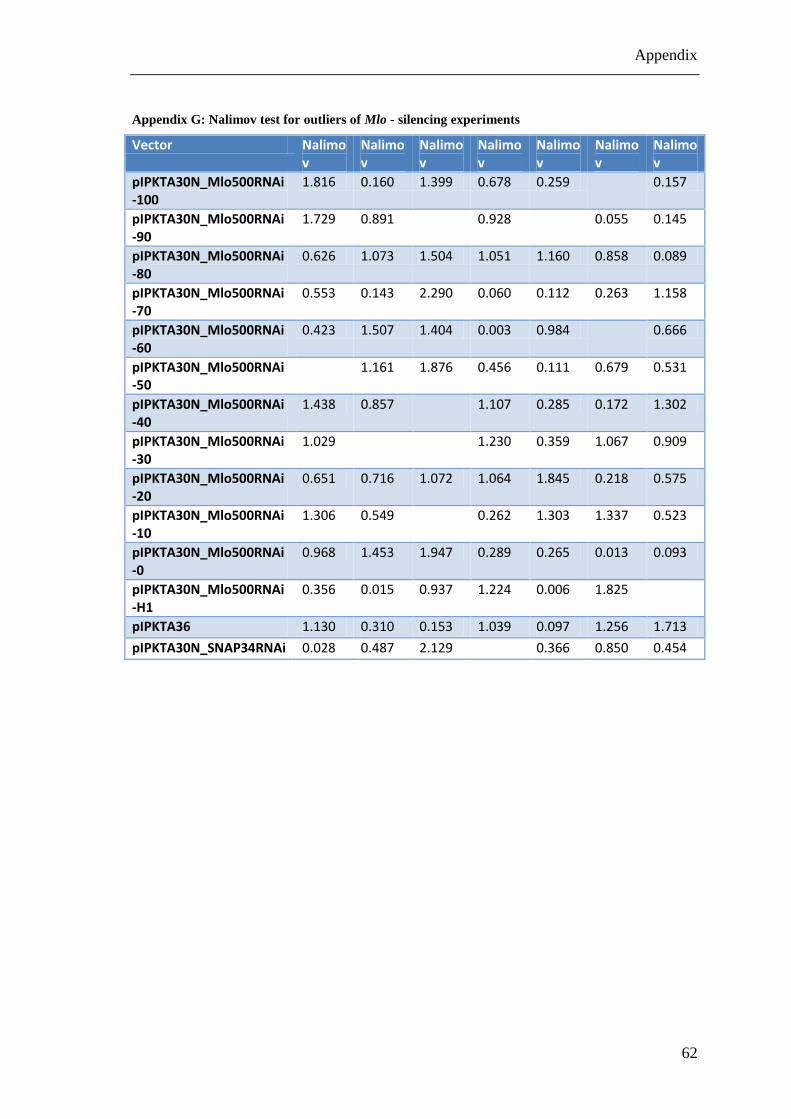
Appendix
62
Appendix G: Nalimov test for outliers of Mlo - silencing experiments
Vector Nalimov
Nalimov
Nalimov
Nalimov
Nalimov
Nalimov
Nalimov
pIPKTA30N_Mlo500RNAi-100
1.816 0.160 1.399 0.678 0.259 0.157
pIPKTA30N_Mlo500RNAi-90
1.729 0.891 0.928 0.055 0.145
pIPKTA30N_Mlo500RNAi-80
0.626 1.073 1.504 1.051 1.160 0.858 0.089
pIPKTA30N_Mlo500RNAi-70
0.553 0.143 2.290 0.060 0.112 0.263 1.158
pIPKTA30N_Mlo500RNAi-60
0.423 1.507 1.404 0.003 0.984 0.666
pIPKTA30N_Mlo500RNAi-50
1.161 1.876 0.456 0.111 0.679 0.531
pIPKTA30N_Mlo500RNAi-40
1.438 0.857 1.107 0.285 0.172 1.302
pIPKTA30N_Mlo500RNAi-30
1.029 1.230 0.359 1.067 0.909
pIPKTA30N_Mlo500RNAi-20
0.651 0.716 1.072 1.064 1.845 0.218 0.575
pIPKTA30N_Mlo500RNAi-10
1.306 0.549 0.262 1.303 1.337 0.523
pIPKTA30N_Mlo500RNAi-0
0.968 1.453 1.947 0.289 0.265 0.013 0.093
pIPKTA30N_Mlo500RNAi-H1
0.356 0.015 0.937 1.224 0.006 1.825
pIPKTA36 1.130 0.310 0.153 1.039 0.097 1.256 1.713
pIPKTA30N_SNAP34RNAi 0.028 0.487 2.129 0.366 0.850 0.454
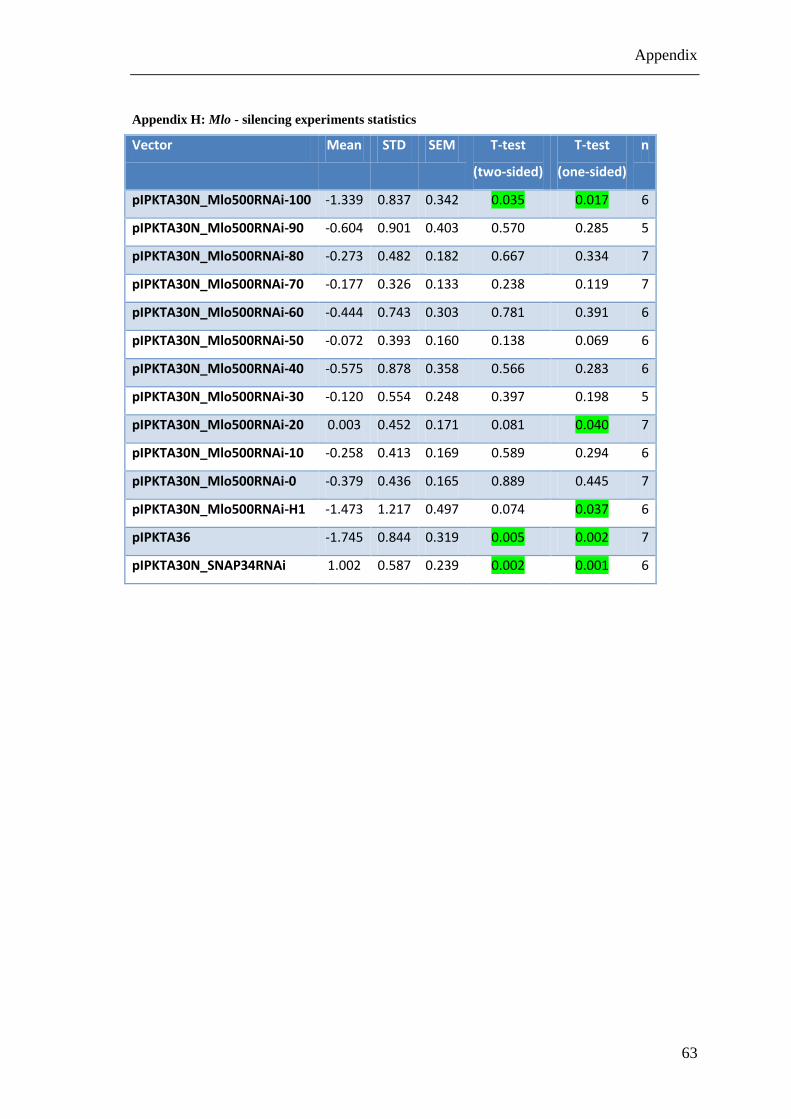
Appendix
63
Appendix H: Mlo - silencing experiments statistics
Vector Mean STD SEM T-test
(two-sided)
T-test
(one-sided)
n
pIPKTA30N_Mlo500RNAi-100 -1.339 0.837 0.342 0.035 0.017 6
pIPKTA30N_Mlo500RNAi-90 -0.604 0.901 0.403 0.570 0.285 5
pIPKTA30N_Mlo500RNAi-80 -0.273 0.482 0.182 0.667 0.334 7
pIPKTA30N_Mlo500RNAi-70 -0.177 0.326 0.133 0.238 0.119 7
pIPKTA30N_Mlo500RNAi-60 -0.444 0.743 0.303 0.781 0.391 6
pIPKTA30N_Mlo500RNAi-50 -0.072 0.393 0.160 0.138 0.069 6
pIPKTA30N_Mlo500RNAi-40 -0.575 0.878 0.358 0.566 0.283 6
pIPKTA30N_Mlo500RNAi-30 -0.120 0.554 0.248 0.397 0.198 5
pIPKTA30N_Mlo500RNAi-20 0.003 0.452 0.171 0.081 0.040 7
pIPKTA30N_Mlo500RNAi-10 -0.258 0.413 0.169 0.589 0.294 6
pIPKTA30N_Mlo500RNAi-0 -0.379 0.436 0.165 0.889 0.445 7
pIPKTA30N_Mlo500RNAi-H1 -1.473 1.217 0.497 0.074 0.037 6
pIPKTA36 -1.745 0.844 0.319 0.005 0.002 7
pIPKTA30N_SNAP34RNAi 1.002 0.587 0.239 0.002 0.001 6
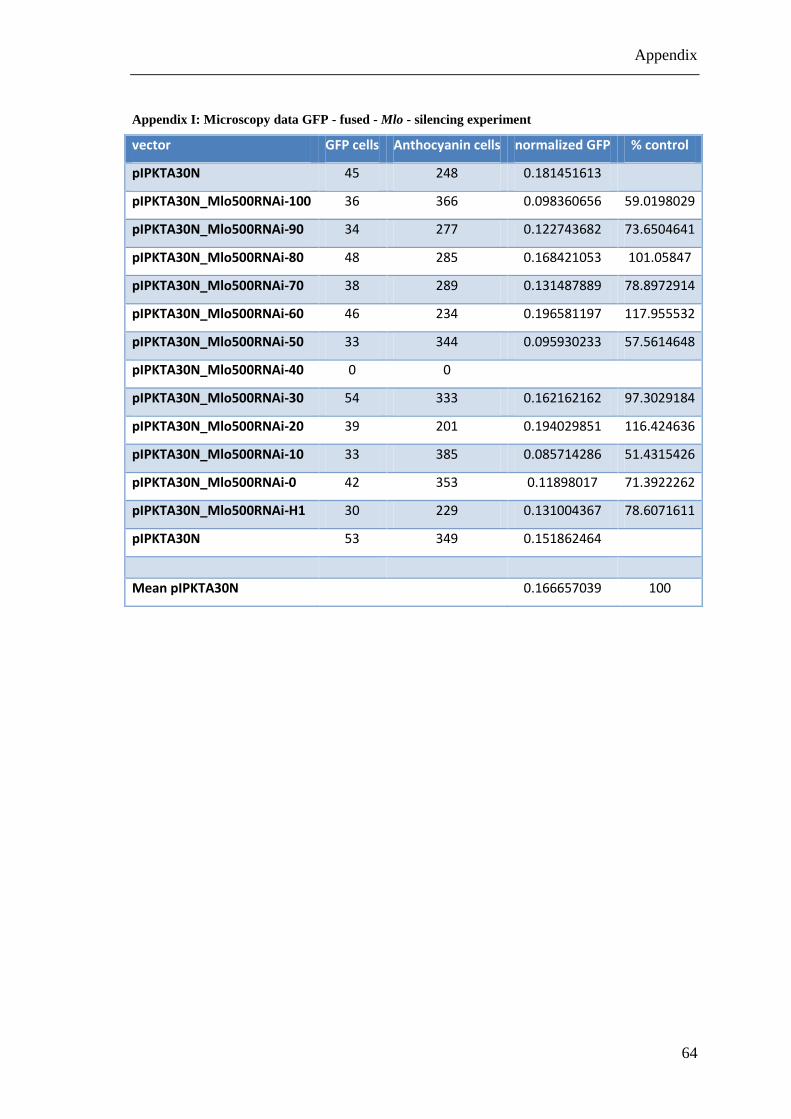
Appendix
64
Appendix I: Microscopy data GFP - fused - Mlo - silencing experiment
vector GFP cells Anthocyanin cells normalized GFP % control
pIPKTA30N 45 248 0.181451613
pIPKTA30N_Mlo500RNAi-100 36 366 0.098360656 59.0198029
pIPKTA30N_Mlo500RNAi-90 34 277 0.122743682 73.6504641
pIPKTA30N_Mlo500RNAi-80 48 285 0.168421053 101.05847
pIPKTA30N_Mlo500RNAi-70 38 289 0.131487889 78.8972914
pIPKTA30N_Mlo500RNAi-60 46 234 0.196581197 117.955532
pIPKTA30N_Mlo500RNAi-50 33 344 0.095930233 57.5614648
pIPKTA30N_Mlo500RNAi-40 0 0
pIPKTA30N_Mlo500RNAi-30 54 333 0.162162162 97.3029184
pIPKTA30N_Mlo500RNAi-20 39 201 0.194029851 116.424636
pIPKTA30N_Mlo500RNAi-10 33 385 0.085714286 51.4315426
pIPKTA30N_Mlo500RNAi-0 42 353 0.11898017 71.3922262
pIPKTA30N_Mlo500RNAi-H1 30 229 0.131004367 78.6071611
pIPKTA30N 53 349 0.151862464
Mean pIPKTA30N 0.166657039 100
Statement of authorship
65
Statement of authorship
I hereby certify that this bachelor thesis presented here has been composed by myself
and is the result of my own investigations, unless otherwise acknowledged in the text.
All references and all sources of information have been specifically acknowledged. This
thesis has not been submitted, either in part or whole, for a degree at this or any other
University. This work has not been published.
Mittweida, 21th
August 2013
Tino Kreszies