Embed Size (px)
Citation preview

i
EFFECTS OF HEAVY METAL ON MUDFLAT ECOSYSTEM
BY
LEUNG MAAN SZE, MICHELLE
STUDENT NO.:14677040
環境及資源管理社會科學學士 (榮譽 )學位
課程
BACHELOR OF SOCIAL SCIENCES (HONS)
IN
ENVIRONMENT AND RESOURCES
MANAGEMENT
April/2016
畢業論文
PROJECT

ii
AN HONOURS PROJECT SUBMITTED IN PARTIAL FULFILLMENT
OF THE REQUIREMENTS FOR THE DEGREE OF
BACHELOR OF SOCIAL SCIENCES (HONOURS) IN
ENVIRONMENT AND RESOURCES MANAGEMENT
HONG KONG BAPTIST UNIVERSITY
APRIL / 2016
Effects of heavy metal on mudflat ecosystem
BY
LEUNG MAAN SZE, MICHELLE
STUDENT NO. 14677040

iii
HONG KONG BAPTIST UNIVERSITY
April /2016
We hereby recommend that the Honours Project by Miss.
Leung Maan Sze, Michelle entitled "Effects of environmental
pollutants on intertidal mudflat ecosystem" be accepted in partial
fulfilment of the requirements for the Bachelor of Social Sciences
(Honours) in Environment and Resources Management.
Dr. Wei Xi Chief Adviser Second Examiner
Overall Grade :

i
Acknowledgements
I would like to express my gratitude to Dr. X. Wei who gave valuable advice
and guidance on my Honours Project and provided assistance in laboratory
work. Thanks are given to Dr. H. C. Chim and Dr. K. L. Chow whose provided
assistance in laboratory work also. I would also like to thanks Mr. C. H. Yeung,
technician of Geography Department who provided equipment for conducting
fieldwork. And thanks are given to my friends: Vicky Lau and Vitus Li who
offered assistance in my fieldwork described in this Honours Project.
_________________
Student’s signature
Date:_____________

ii
Abstract
Environmental pollutants like heavy metals can have different pathways to
discharge into water and sediment. Impact of heavy metal on the mudflat’s
ecosystem was studied in Ha Pak Nai and San Tau. Concentration of heavy
metal in water, composition of grain size in sediment were tested and number of
species and individual of crabs and snails were counted in this study. The
concentrations of heavy metal in water were similar in Ha Pak Nai and San Tau.
The physical parameters of water in two study areas was similar while the
amount of conductivity was higher in San Tau than Ha Pak Nai by 13161.5
µS/cm. Mean percentage of silt sediment in Ha Pak Nai was more than in San
Tau by 29.7%. Both the communities of crabs and snails were different in the
two study area. More crabs species were investigated in Ha Pak Nai while more
snails species were investigated in San Tau. Dominance index was also
calculated by using the crabs and snails. Dominance index was 0.76 in Ha Pak
Nai and 0.21 in San Tau. To reduce the heavy metal contamination in mudflat, a
better management is needed.
8761

iii
TABLE OF CONTENT
Page
Acknowledgement i
Abstract ii
Table of Content iii
List of Tables v
List of Figures vi
CHAPTER 1 INTRODUCTION
1.1 Background 1
1.2 Introduction of Study Area 3
1.2.1 Ha Pak Nai 3
1.2.2 San Tau 3
CHAPTER 2 LITERATURE REVIEW
2.1 Global Situation of Heavy Metal Contamination in Mudflat and
Mangrove
5
2.2 Hong Kong Situation of Heavy Metal Contamination in
Mangrove
6
2.3 The effect of sediment on heavy metal contamination 7
2.4 Biological Effect 8
2.5 Ecological Effect 10
2.6 Filling the Gap 13
2.7 Objectives 13
2.8 Hypothesis 14
CHAPTER 3 METHODOLOGY
3.1 Fieldwork 15
3.2 Water Sample Collection 15
3.2.1 Date and Time 15
3.2.2 Sampling Sites 16
3.2.3 On-site Preparation 16
3.3 Sediment Samples Collection 16
3.3.1 Date and Time 17
3.3.2 Sampling Sites 17
3.3.3 On-site Preparation 17
3.4 Sampling of Organisms 17
3.5 Laboratory Analysis 18
3.5.1 Grain Size Analysis 19
3.5.2 Heavy Metal in Water 20
3.6 Calculation and Statistical Analysis 20

iv
CHAPTER 4 RESULTS
4.1 Physical Parameters in Water 21
4.1.1 Dissolved Oxygen 21
4.1.2 Conductivity 22
4.1.3 pH Value 23
4.2 Composition of Grain Size in Sediment 24
4.2.1 Gravel 24
4.2.2 Sand 25
4.2.3 Silt 26
4.3 Heavy Metal Concentrations in Water 27
4.3.1 Chromium (Cr) 27
4.3.2 Arsenic (As) 28
4.3.3 Cadmium (Cd) 29
4.3.4 Lead (Pb) 30
4.3.5 Mercury (Hg) 30
4.4 Abundance of Species 31
4.4.1 Abundance of Crabs 31
4.4.2 Abundance of Snails 32
4.4.3 Biodiversity Index 32
CHAPTER 5 DISCUSSION 34
CHAPTER 6 CONCLUSION 46

v
List of Tables
Table 1 (a) Species and total number of individual of crabs in study
areas
34
Table 1 (b) Species and total number of individual of snail in study
areas
34
Table 2 Simpson’s Index of Ha Pak Nai and San Tau 34
Table 3 Data of different parameters in monitoring station DS3
and NS6
44

vi
List of Figures
Figure 1 Location of study areas 4
Figure 2 Transect setting for the sampling of organisms 18
Figure 3 Dissolved oxygen level at the two study areas during
October and November (PN: Ha Pak Nai; ST: San Tau)
22
Figure 4 Conductivity at the two study areas during October and
November (PN: Ha Pak Nai; ST: San Tau)
23
Figure 5 pH value at the two study areas during October and
November (PN: Ha Pak Nai; ST: San Tau)
24
Figure 6 Mean percentage of gravel in sediment samples at the
two study areas (PN: Ha Pak Nai; ST: San Tau)
25
Figure 7 Mean percentage of sand in sediment samples at the two
study areas (PN: Ha Pak Nai; ST: San Tau)
26
Figure 8 Mean percentage of silt in sediment samples at the two
study areas (PN: Ha Pak Nai; ST: San Tau)
27
Figure 9 Mean concentration of chromium in water samples at
the two study areas (PN: Ha Pak Nai; ST: San Tau)
28
Figure 10 Mean concentration of arsenic in water samples at the
two study areas (PN: Ha Pak Nai; ST: San Tau)
29
Figure 11 Mean concentration of cadmium in water samples at the
two study areas (PN: Ha Pak Nai; ST: San Tau)
30
Figure 12 Mean concentration of Lead in water samples at the two
study areas (PN: Ha Pak Nai; ST: San Tau)
31
Figure 13 Mean concentration of Mercury in water samples at the
two study areas (PN: Ha Pak Nai; ST: San Tau)
32
Figure 14 Spatial distribution of heavy metal in marine sediment
in Hong Kong
39

1
CHAPTER 1 INTRODUCTION
1.1 Background
Mudflat, also as tidal flat, is a type of coastal wetland. It is a flat and low-lying
habitat. Most mudflats are finding in intertidal areas because they are affected
by the tidal and so called intertidal mudflat. They are exposed during low tide
and submerged during high tide (Pande and Nayak, 2013). In Hong Kong, there
are many intertidal mudflats in different district such as Luk Keng in New
Territories, Tsim Bei Tsui in Deep Bay area, Nai Chung in Sai Kung and Tai Ho
Wan in Lantau Island (Tam and Wong, 2000). Water and sediments with mud,
silt, clay and some gravel are the major elements of mudflat, the sediments are
originated by land and sea (Pande and Nayak, 2013). Mudflat is one of the
biomes having high productive.
Mudflat has a very high biodiversity because it supports many animals such as
crabs and worms etc. and plants such as mangroves and seagrass can also be
found in intertidal mudflat. Infauna inside mudflat support the feeding species
such as crustaceans, fish and molluscs (Cheung et al., 2008), which provide
food sources to these higher trophic level of organisms (Rahmanpour,
Ghorghani and Ashtiyani, 2014). Mudflat is important to different organisms
especially migratory birds and shorebirds. Migratory birds will migrate a long

2
distance to breed and take rest, they stop at mudflats or estuaries to refuel in
winter. As mudflat has a high biodiversity, crustaceans, infauna organisms and
fish are the food sources for those migratory birds and shorebirds. In Hong
Kong, about 50000 wintering waterbirds fed on Deep Bay intertidal mudflat
when they passing through Hong Kong in every winter (WWF, unknown).
However, rapid expansion of population size had occurred and causing
urbanization and industrialization in Hong Kong. Due to the rapid development,
pollution problem is serious from the past until now. Some of the mudflats are
near the human activities and thus they are receiving many environmental
pollutants. Heavy metals, excess nutrients are some of the environmental
pollutants. Heavy metals are one of the environmental pollutants that mudflats
are received. Due to heavy metals have persistent toxic effect, they are
classified as hazardous pollutants in environment, even they are at a low
concentration (Marcovecchio and Ferrer, 2005). Heavy metals will uptake by
different organisms and accumulate in their bodies. Heavy metal
bioaccumulation occurs with the food chain structure. In Hong Kong, people
like going to estuarine environment such as Tung Chung Bay and Shui Hau to
dig clam. They will uptake the heavy metal if they eat the seafood which contain
high concentration of heavy metals. There are various factors to affect the

3
concentration of heavy metals in mudflats like the sediment size. This study is
examining the heavy metal in water and assessing the effect of heavy metal on
mudflat ecosystem of two mudflats in Hong Kong
1.2 Introduction of Study Area
The mudflats in Ha Pak Nai and San Tau were chosen for studying the heavy
metal contamination and their ecosystem. Ha Pak Nai and San Tau are both
located the western part of Hong Kong. The location of Ha Pak Nai and San
Tau is shown in Figure 1.
1.2.1 Ha Pak Nai
Ha Pak Nai is located at Yuen Long. It is in the district of Deep Bay (Tam and
Wong, 2000). Also, it is near Sheng Zheng Bay and Pearl River. The area of Ha
Pak Nai is about 18 ha.
One seagrass species can be found in Ha Pak Nai. There are mangroves in Ha
Pak Nai. However, the area of mangroves in Ha Pak Nai is small, it has 0.71 ha
only (Tam and Wong, 2000).
1.2.2 San Tau
San Tan is located at the west of Tung Chung Bay on north Lantau Island. The
area of San Tau is about 2.7 ha. It is a mix of silt and sand. Also, it was

4
designated as a ‘Site of Special Scientific Interest’ (SSSI) in 1994 (Green Power,
unknown).
Two seagrass species can be found in San Tau -- Halophila ovalis and Zostera
japonica. The seagrass bed provide food and shelter for snails, crabs and
mudskippers etc. (Green Power, unknown). Apart from seagrass bed,
mangroves are also found in San Tau. The area of mangroves in San Tau
contain 2.14 ha of the total area (Tam and Wong, 2000).
Figure 1. Location of study areas

5
CHAPTER 2 LITERATURE REVIEW
2.1 Global Situation of Heavy Metal Contamination in Mudflat and
Mangrove
Heavy metal contamination in both mudflat and mangrove were studied in
many countries.
In Singapore, six types of metals including Cd, Cr, Cu, Ni, Pb and Zn were
tested in the sediment of mangrove. The mean of concentration of Cd, Cr, Cu,
Ni, Pb and Zn were 1.87 µg/g, 84.7 µg/g, 344 µg/g, 38.3 µg/g, 158 µg/g and
313 µg/g respectively (Cuong et al., 2005).
The fluxes of Cd, Cu, Hg, and Pb were investigated from the sediment of
intertidal mudflat in the three coastal lagoons in Mexican Pacific
(Ruiz-Fernández et al., 2009).
In the upper gulf of Thailand, Chaiyara et al., (2013) found that the
concentration of Zn was the highest metal concentration in the sediment.
Concentrations of heavy metals were different in dry season and wet season.
Concentration of Cu was highest in dry season while concentration of Pb was
highest in dry season.
The rapid growth of economic development in China resulted by increasing
the pollution in mangrove. Concentrations of different metals including Cu, Zn,

6
Cd and Pb in the sediment of mangrove in Guangdong and Fujian were higher
than in Guangxi and Hainan (Wang et al., 2013).
2.2 Hong Kong Situation of Heavy Metal Contamination in Mangrove
In Hong Kong, heavy metal contaminations in the surface sediment of 18
mangrove swamps distributed in different region were studied by Tam and
Wong (2000). Different location of mangrove swamps had different
concentration of heavy metals. The 18 mangrove swamps were divided into
four groups. Three mangrove swamps located in Deep Bay region were in the
first group. The mangrove swamps in this group had high heavy metal
concentration. Ho Chung, Sam Mun Tsai, Tolo Pond and Nai Chung were the
second group. These four mangrove swamps were the polluted swamps which
receiving different anthropogenic effluent. The third group were relatively
clean including Tai Ho Wan and Yi O. Both of them located at Lantau Island.
Nine of the mangrove swamps were the fourth group which were
uncontaminated such as Hoi Ha Wan and Lai Chi Wo. These mangrove
swamps were having the lowest concentration of heavy metals because they
were far from urban area or within the country park area, so they received less
human influence (Tam and Wong, 2000).

7
2.3 The Effect of Sediment on Heavy Metal Contamination
Sediment acts a sink of different environmental pollutants so it has an
important role to assess the metal contamination in aquatic environment.
Sediment type, organic content were the factors to influence the concentration
of metals in sediment (Ahn et al., 1994). Heavy metal contamination was
found in both mudflat and mangrove sediment in India. The mudflat in Ulhas
Estuary was dominated a high value of total nitrogen while the mangrove in
Thane Creek was dominated by total organic carbon and total phosphorus.
There was strong correlation between total nitrogen and the metals found in
Ulhas Estuary. This was because adsorption, formation of organic complexes
and biological degradation etc. were causing deposition and remobilization of
trace metals in the environment rich in organic matter (Fernandes and Nayak,
2012). However, worms might be more tolerant to the metal-originated stress
in a higher organic content of sediment because the bioavailability of metals
could be reduced and the sediment had higher organic carbon to had a better
nutritional conditions stated by Ahn et al. (1994).

8
2.4 Biological Effect
Heavy metal contamination in sediment would cause the accumulation of
heavy metal in organisms. Heavy metal accumulation in organisms were
investigated in different studies.
In Hong Kong, heavy metal contamination was found in bivalves at Ting Kok
(Chen, 2003). But higher metal concentration in molluscs in Pearl River Delta
Region was higher than in Hong Kong (Fang et al., 2001). The highest
concentration of heavy metal found in bivalves was the oysters. For any
organisms, absorption of Cu and Zn was stronger than Pb and Ni, the sequence
was Zn>Cu>Pb>Ni. Thus, the contamination level of Zn was higher than Cu
2.5 to 18 times at the same organism. However, the absorption of heavy metal
of various organisms were different. The oysters had a high level
concentration of Zn. Other organisms such as clams under bivalves had a
lower level of heavy metal that oysters. Bivalves especially oyster, was
absorbed heavy metals easier than the other types of organisms. Oyster had a
higher level of heavy metal contamination than others bivalves organisms
because of the different of feeding. Oysters were filter feeder, they would
absorb a large amount of water and feed the algae. As they absorbed very large
amount of water, they would also absorb heavy metal from water more easily.

9
Although the heavy metal contamination at Ting Kok was relatively lower, the
heavy metal would accumulate in the bivalves (Chen, 2003). Size of
organisms could affect the concentrations of heavy metals in their bodies. Ahn
et al. (1994) stated that smaller polychaetes accumulated more metals per unit
body weight that the larger polychaetes.
Some organisms could appear in high heavy metal contamination. Ahn et al.
(1994) found that a dominant polychaete species was disappeared in a lower
metal contamination of the sediment while appeared in a higher heavy metal
contamination of the sediment. It was because many factors could affect the
availability for biological uptake the metals and the survival of affected
organisms (Ahn et al., 1994). Gender was the other factors to affect the
accumulation of heavy metal (Na and Park, 2012). There were differences of
the mean concentration of heavy metals in the gender of crabs investigated by
Na and Park (2012). Some of the non-essential metals (As, Cd and Pb) were
higher in females than in males.
However, some of the organisms were expected to have a high concentration
of heavy metal. Raising levels of Cu and Zn in shellfish and Cu level in
crustaceans were expected because these metals play an important role in the
metabolic processes (Cuong et al., 2005).

10
Bioaccumulation was another effect to influence the uptake of heavy metal by
organisms. Higher bioaccumulation factor ranges were found in Cd, Cu and
Zn and there was potential biomagnification. Cu and Zn were essential for
hemocyanin and enzymatic activities for the crustaceans. Bioaccumulation
factor of Cd was high because Cd was not regulate and accumulation was not
occur at all concentrations. There was positive correlation between the levels
of Cd, Cu, Ni and Pb in crabs and those levels of metals in sediments found in
the study. Thus, crabs could also be the bioindicators of environmental
systems where having the diverse and variable pollution sources (Na and Park,
2012).
2.5 Ecological Effect
Heavy metal contamination in sediment would also affect the communities
and ecosystem of mudflat and mangrove. Benthic communities such as
gastropod and crabs were contributed in monitoring the environment and
assessment of heavy metal and organic contamination in estuaries (Amin et al.,
2009). In Indonesia, strong negative correlations were found between the
concentrations of Cd, Cu, Zn and Ni in sediments and the numbers of
gastropod species and abundance of gastropod in the study by Amin et al.
(2009). When the concentration of heavy metals increased, decline of the

11
abundance of gastropod occurred. Moreover, only two species of polychaete
were sampled in the sampling sites of a tidal flat of Korea (Ahn et al., 1994).
Metals could reduce the abundance, reduce the species diversity and change
the community composition to the benthic communities. The significance
impact of contaminated sediments to the benthic communities was the death of
organisms (Amin et al., 2009).
Bioavailable concentration of heavy metals from sediment, vegetation and
organisms was transferred by food chains (Villhena and Coasta, 2013).
Concentrations of Ni, Cu, Zn, As and Hg etc. in crabs were higher than the
leaves, indicated the bioaccumulation of those metals (Villhena and Coasta,
2013).
Some of the crustaceans were sensitive to the pollution including heavy metal.
Absence of two important species – C. volutator and C. carinata in Fal estuary
was investigated by Warwick (2000). The reason of absence of these two
species was the pollution and resulted in the change of microbenthic
assemblages in Fal estuary.
Mai Po, located in the northwestern part of Hong Kong, was facing heavy
metal contamination also. Lizhe et al. (2003) found that intertidal mudflats at
Mai Po were slightly polluted by using species diversity index, biotic

12
coefficient and macrofauna pollution index. There were heavy metal
contamination in both mangrove, benthic microgastropods and waterbirds
found in Mai Po.
High level of Cu and Zn contamination in sediment was found. The northern
and southern ends of wetland in Mai Po were identified as hot spots of
contamination. Different organisms and mangrove roots were having the heavy
metal contamination. Heavy metals contaminations were found in mangrove
root by Ong che (1999). Concentrations of different metals were vary in
different mangrove species because their uptake systems were not the same.
Mai Po mudflat infauna community had a low species richness. Only two
species of gastropod found in the mudflat including Sermyla riqueti and
Stenothyra devalis. High Zn accumulation in Sermyla riqueti had found in the
study by Lai et al. (2005). Accumulation of Cu was especially high in the
species of Stenothyra devalis, showing bioaccumulation. There were two
factors affecting bioaccumulation of heavy metal in the microgastropod. One
was the physical factors in sediment. Another was the metabolic factors.
Growth of organisms reflected the environmental condition. Pollution and
organic matter in the sediments were major toxicity factors in the survival and
growth of gastropod like Sermyla tornatella (Liang, 2007). Apart from the

13
mangrove organisms, feathers of Ardeids in Mai Po was also discovered that
having heavy metal contamination. The concentration of Pb and Hg were higher
than the other metals in Ardeids’ feathers found by Connell et al. (2001).
2.6 Filling the Gap
Heavy metal contamination had been investigated lots in Hong Kong. Effect
of heavy metal on mudflat ecosystem had investigated in other foreign
countries while there is no study in Hong Kong.
2.7 Objectives
There are seven objectives in this study:
1. To assess the concentration of heavy metal in water of the two mudflats.
2. To compare the concentration of heavy metal in water of the two mudflats.
3. To assess the grain size distribution in sediment of the two mudflats.
4. To study the relationship between grain size of the sediments and
concentration of heavy metal.
5. To identify the impact of heavy metal on mudflats’ ecosystem and compare
the differences of crabs and snails’ communities.
6. To identify other factors that influence the concentration of heavy metal
which did not cover in the study.
7. To evaluate the policy on mudflat protection and give suggestions to

14
improve heavy metal pollution in Hong Kong’s mudflats.
2.8 Hypothesis
Six hypothesis were made:
1. The concentration of heavy metal in water in Ha Pak Nai is higher than in
San Tau.
2. Pollution is high in both Ha Pak Nai and San Tau.
3. Physical parameters of water do not have relationship with the heavy metal
concentration.
4. Sediment in Ha Pak Nai will have a higher percentage of fine particles.
5. More species and individual of crabs find in Ha Pak Nai.
6. More species and individual of snails find in San Tau.

15
CHAPTER 3 METHODOLOGY
3.1 Fieldwork
Sampling of organisms, water samples and sediment samples were collected in
low tide mainly in October and November. Fieldwork days were decided by
tidal change according to Hong Kong Observatory. With the reference of tidal
change given by Hong Kong Observatory, eight days were decided for the
fieldworks. The tidal of those eight days were also lower than 0.5 m. Four days
were decided in October and four days were decided in November. The two
field sites -- Ha Pak Nai and San Tau, both would go for four times. In the
fieldwork, one water sample and two sediment samples were taken in the two
field sites respectively. Also, sampling of organisms was conducted after the
collection of water sample and sediment samples.
3.2 Water Sample Collection
One water sample was collected for heavy metal analysis in each field site.
Volume of 800 mL of water would collect. Water sample was collected when
the tide was not in the lowest.
3.2.1 Date and Time
Eight dates in October and November were selected for water sample collection
at each field site, which were 10th, 24th of October and 7th, 21st of November in

16
2015 would go to Ha Pak Nai for sampling and 11th, 25th of October and 8th,
22nd of November in 2015 would go to San Tau for sampling. No specific of
time for water sampling and the time of water sample collection were different
in each date because the collection time was according to the tidal changes.
3.2.2 Sampling Sites
Sample site of water sample in the first time of fieldwork was selected randomly
in both field site. Then, GPS was recorded for the remaining fieldworks. The
remaining fieldworks of the two field sites would use the same sample site as
the first time of collection.
3.2.3 On-Site Preparation
Apart from water sample collection for heavy metal analysis, four parameters
would collect using multi-prob including temperature, dissolved oxygen,
conductivity and pH.
3.3 Sediment samples collection
Two sediment samples were collected for grain size analysis in each field site.
Around 700 g of sediment would collect. Sediment samples were collected after
the water sample collection.

17
3.3.1 Date and Time
The dates for the sediment samples collection were same as the water sample
collection. Same as collection of water sample, there was no specific of time for
collection and the time of sediment samples collection were different in each
date because the sediment samples were conducted in the lowest tide on that
date when the sediment was not covered by water.
3.3.2 Sampling Sites
Sample sites of sediment samples in the first time of fieldwork were also
selected randomly in both field site and GPS was recorded for the remaining
fieldworks. The remaining fieldworks of the two field sites would use the same
sample sites as the first time of collection same as water sample collection.
3.3.3 On-site Preparation
Sediment samples were collected the surface sediment, 5 cm of the surface
sediment (Tam and Wong, 2000) would collect by using shovel for the grain
size analysis.
3.4 Sampling of Organisms
A systematic sampling was used to count the organisms. Two transects would
be used for organisms sampling at each field site. Same as waster sample and
sediment samples collection, the locations of two transects were selected

18
randomly in the first time of sampling at the two field sites and GPS was
recorded for the next field dates. 25 m of transect was used in each sampling. In
each transect, a 0.5 m x 0.5 m of quadrat was used for the sampling of
organisms. Ten quadrats would place in each transect, sampling would conduct
in the separation 2.5 m of the previous quadrat. Transect setting is shown in
Figure 2. There were two main types of organisms which were crabs and snails
were counted in this study. The individual number of crabs and snails and the
number of species of crabs and snails would counted within the quadrats at both
field sites. Sampling of organisms was used for comparison of their
assemblages between Ha Pak Nai and San Tau.
Figure 2. Transect setting for the sampling of organisms
3.5 Laboratory Analysis
Two laboratory analysis are focused in this study. One is the heavy metal
analysis for the water samples. Another is the grain size analysis for the
sediment samples.

19
3.5.1 Grain Size Analysis
The grain size analysis of the sediment samples were tested with the shaker. Six
size of sieves including 10 mm, 4 mm, 3 mm, 2 mm, 0.5 mm, 0.25 mm, 0.212
mm and base pan were used in grain size analysis. Before sieving the sediment,
there were some pretreatments. Because there were some non-geological
materials inside the sediment samples such as wood and snails. The first step
was to take away all the materials that were not the silt and sand in each sample.
After taking away all the non-geological materials, put the sample in a large
beaker, one beaker for one sample, and wash the sediment samples using tap
water. After washing the sediment samples, weighed the tin trays and poured
the sample in the tin tray and weighed again. Put all the trays in oven set at 70
℃ for a week. Once two days, shake the trays to ensure even drying across each
tray.
After drying, put the selected size of sieves in order, the smallest mesh size
(0.212 mm) on the base pan and the biggest mesh size (10 mm) on the top.
Poured the sample into the 10 mm sieve. Closed the lid and put the stack onto
the shaker. Tightened with the belt and shake for 2 minutes. After 2 minutes,
poured the samples on each sieve onto a paper and recorded the weight of the

20
samples on each sieve and base pan. Cleaned the sieves and repeated the steps
with other sediment samples (Reddy, unknown).
3.5.2 Heavy Metal Concentration in Water
For the analysis of heavy metal concentration in water, HNO3 was added to
dilute in a suitable concentration. The suitable concentration for testing
cadmium, chromium, lead, arsenic was 1.0 µg/mL while the suitable
concentration for testing mercury was 0.10 µg/mL. ICP-MS was used to test
the concentration of heavy metal in water sample.
3.6 Calculation and Statistical Analysis
Simpson dominance index was used to calculate the biodiversity index of two
study areas in this study:
D = ∑ 𝑛(𝑛−1)
𝑁(𝑁−1) , where D is biodiversity index; n is the total number of
organism of a particular species, N is the total number of organisms of all
species (Simpson, 1949)

21
CHAPTER 4 RESULTS
4.1 Physical Parameters in Water
The record of three physical parameters (dissolved oxygen, conductivity and
pH) in water in each study area are shown in Appendix 1 and 2.
4.1.1 Dissolved Oxygen Level
Figure 3 shows that the dissolved oxygen varies in each field date. In all of the
fieldworks at Ha Pak Nai, the highest dissolved oxygen recorded was 7.5
mg/L and the lowest dissolved oxygen recorded was 5.34 mg/L, with the mean
of 6.81 mg/L. At San Tau, the highest dissolved oxygen recorded was 8.04
mg/L and the lowest dissolved oxygen recorded was 5.8 mg/L, with the mean
of 7.41 mg/L.
Generally, there was a decreasing trend of dissolved oxygen and increased
little in the last field date at Ha Pak Nai while there was an increasing trend of
dissolved oxygen and decreased little in the last field date at San Tau.

22
Figure 3. Dissolved oxygen level at the two study areas during October and
November (PN: Ha Pak Nai; ST: San Tau)
4.1.2 Conductivity
Figure 4 shows that the conductivity varies in each field date. In all of the
fieldworks at Ha Pak Nai, the highest conductivity recorded was 41440 µS/cm
and the lowest conductivity recorded was 18907 µS/cm, with the mean of
25274.5 µS/cm. At San Tau, the highest conductivity recorded was 45200
µS/cm and the lowest conductivity recorded was 31500 µS/cm, with the mean
of 38436 µS/cm.
Generally, the trend of conductivity between Ha Pak Nai and San Tau is
similar. Both Ha Pak Nai and San Tau had the highest conductivity at the first
week of November.
0
1
2
3
4
5
6
7
8
9
1 0 - 1 1 / 1 0 / 1 5 2 4 - 2 5 / 1 0 / 1 5 7 - 8 / 1 1 / 1 5 2 1 - 2 2 / 1 1 / 1 5
DO
(M
G/L
)
DATE
DISSOLVED OXYGEN LEVEL
PN ST

23
Figure 4. Conductivity at the two study areas during October and November
(PN: Ha Pak Nai; ST: San Tau)
4.1.3 pH Value
Figure 5 shows that the pH value varies in each field date. In all of the
fieldworks at Ha Pak Nai, the highest pH value recorded was 8.25 and the
lowest pH value recorded was 7.95, with the mean of 8.095. At San Tau, the
highest pH value recorded was 8.48 and the lowest pH value recorded was
7.81, with the mean of 8.05.
Similar to the conductivity, the trend of pH value between Ha Pak Nai and San
Tau is similar. Both Ha Pak Nai and San Tau had the highest pH value at the
first week of November.
0
10000
20000
30000
40000
50000
1 0 - 1 1 / 1 0 / 1 5 2 4 - 2 5 / 1 0 / 1 5 7 - 8 / 1 1 / 1 5 2 1 - 2 2 / 1 1 / 1 5
CO
ND
UC
TIV
ITY
(ΜS/
CM
)
DATE
CONDUCTIVITY
PN ST

24
Figure 5. pH value at the two study areas during October and November (PN:
Ha Pak Nai; ST: San Tau)
4.2 Composition of Grain Size in Sediment
Tables of percentage of gravel, sand and silt of each field date at two study
areas are shown in Appendix 3 and 4.
4.2.1 Gravel
Figure 6 shows that the mean percentage of gravel in the sediment samples at
the two study areas. Mean percentage of gravel was higher at Ha Pak Nai than
at San Tau. The mean percentage of gravel in the sediment was about 7.7% at
Ha Pak Nai and about 3.7% at San Tau.
7.6
7.7
7.8
7.9
8
8.1
8.2
8.3
8.4
8.5
1 0 - 1 1 / 1 0 / 1 5 2 4 - 2 5 / 1 0 / 1 5 7 - 8 / 1 1 / 1 5 2 1 - 2 2 / 1 1 / 1 5
PH
DATE
PH VALUE
PN ST

25
Figure 6. Mean percentage of gravel in sediment samples at the two study
areas (PN: Ha Pak Nai; ST: San Tau)
4.2.2 Sand
Figure 7 shows that the mean percentage of sand in the sediment samples at
the two study areas. Mean percentage of sand was higher at San Tau than at
Ha Pak Nai. The mean percentage of sand in the sediment was about 37.6% at
Ha Pak Nai and about 71.1% at San Tau.
0
1
2
3
4
5
6
7
8
9
PN ST
Per
cen
tage
(%)
Gravel

26
Figure 7. Mean percentage of sand in sediment samples at the two study areas
(PN: Ha Pak Nai; ST: San Tau)
4.2.3 Silt
Figure 8 shows that the mean percentage of silt in the sediment samples at the
two study areas. Mean percentage of silt was higher at Ha Pak Nai than at San
Tau. The mean percentage of silt in the sediment was about 54.8% at Ha Pak
Nai and about 25.1% at San Tau.
0
10
20
30
40
50
60
70
80
PN ST
Per
cen
tage
(%)
Sand

27
Figure 8. Mean percentage of silt in sediment samples at the two study areas
(PN: Ha Pak Nai; ST: San Tau)
4.3 Heavy Metal Concentrations in Water
Five heavy metals including chromium(Cr), arsenic (As), cadmium (Cd), lead
(Pb) and mercury (Hg) were tested from the water sample at the two study
areas. The concentration of heavy metals of each water sample in two study
areas are shown in Appendix 5 and 6.
4.3.1 Chromium (Cr)
Figure 9 shows that the mean concentration of chromium in water samples at
the two study areas. Mean concentration of chromim in water at Ha Pak Nai
was higher than at San Tau. The mean concentration of chromium in water
was 0.001 mg/L at Ha Pak Nai and 0.0005 mg/L at San Tau.
0
10
20
30
40
50
60
PN ST
Per
cen
tage
(%)
Silt

28
Figure 9. Mean concentration of chromium in water samples at the two study
areas (PN: Ha Pak Nai; ST: San Tau)
4.3.2 Arsenic (As)
Figure 10 shows that the mean concentration of arsenic in water samples at the
two study areas. Mean concentration of arsenic in water at San Tau was higher
than at Ha Pak Nai. The mean concentration of arsenic in water was 0.00275
mg/L at Ha Pak Nai and 0.003 mg/L at San Tau.
0
0.0002
0.0004
0.0006
0.0008
0.001
0.0012
PN ST
Ch
ron
miu
m (m
g/L)
Chromium (Cr)

29
Figure 10. Mean concntration of arsenic in water samples at the two study
areas (PN: Ha Pak Nai; ST: San Tau)
4.3.3 Cadmium (Cd)
Figure 11 shows that the mean concnetration of cadmium in water samples at
the two study areas. Mean concentration of cadmium in water at Ha Pak Nai
and San Tau were the same. The mean concentration of cadmium in water was
0.0005 mg/L at Ha Pak Nai and San Tau.
0.0026
0.00265
0.0027
0.00275
0.0028
0.00285
0.0029
0.00295
0.003
0.00305
PN ST
Ars
enic
(mg/
L)
Arsenic (As)

30
Figure 11. Mean concentration of cadmium in water samples at the two study
areas (PN: Ha Pak Nai; ST: San Tau)
4.3.4 Lead (Pb)
Figure 12 shows that the mean concentration of lead in water samples at the
two study areas. Mean concentration of lead in water at Ha Pak Nai and San
Tau were the same. The mean concentration of lead in water was 0.0005 mg/L
at Ha Pak Nai and San Tau.
0
0.0001
0.0002
0.0003
0.0004
0.0005
0.0006
PN ST
Cad
miu
m (m
g/L)
Cadmium (Cd)

31
Figure 12. Mean concentration of lead in water samples at the two study areas
(PN: Ha Pak Nai; ST: San Tau)
4.3.5 Mercury (Hg)
Figure 13 shows that the mean concentration of lead in water samples at the
two study areas. Mean concentration of lead in water at Ha Pak Nai and San
Tau were the same. The mean concentration of lead in water was 0.000025
mg/L at Ha Pak Nai and San Tau.
0
0.0001
0.0002
0.0003
0.0004
0.0005
0.0006
PN ST
Lead
(m
g/L)
Lead (Pb)

32
Figure 13. Mean concentration of mercury in water samples at the two study
areas (PN: Ha Pak Nai; ST: San Tau)
4.4 Abundance of Species
The whole data of the number of individual and species recorded in fieldwork
were shown in Appendix 7 to 10.
4.4.1 Abundance of Crabs
Table 1 (a) shows that the species of crabs and the number of individual of that
crabs found at Ha Pak Nai and San Tau. The table of sampling of crabs in the
transect and quadrat in all fieldworks are shown in the Appendix. There were
three species found in Ha Pak Nai including Metaplax longipes, Philyra
carinata and Uca borealis. Uca borealis was the highest abundance found in
Ha Pak Nai than the other others. At San Tau, only one species of crab found
which was Clibanarius longitarsus. Both the number of species and the total
0
0.000005
0.00001
0.000015
0.00002
0.000025
0.00003
PN ST
Me
rcu
ry (m
g/L)
Mercury (Hg)
33
number of individual of crabs were higher at Ha Pak Nai than at San Tau.
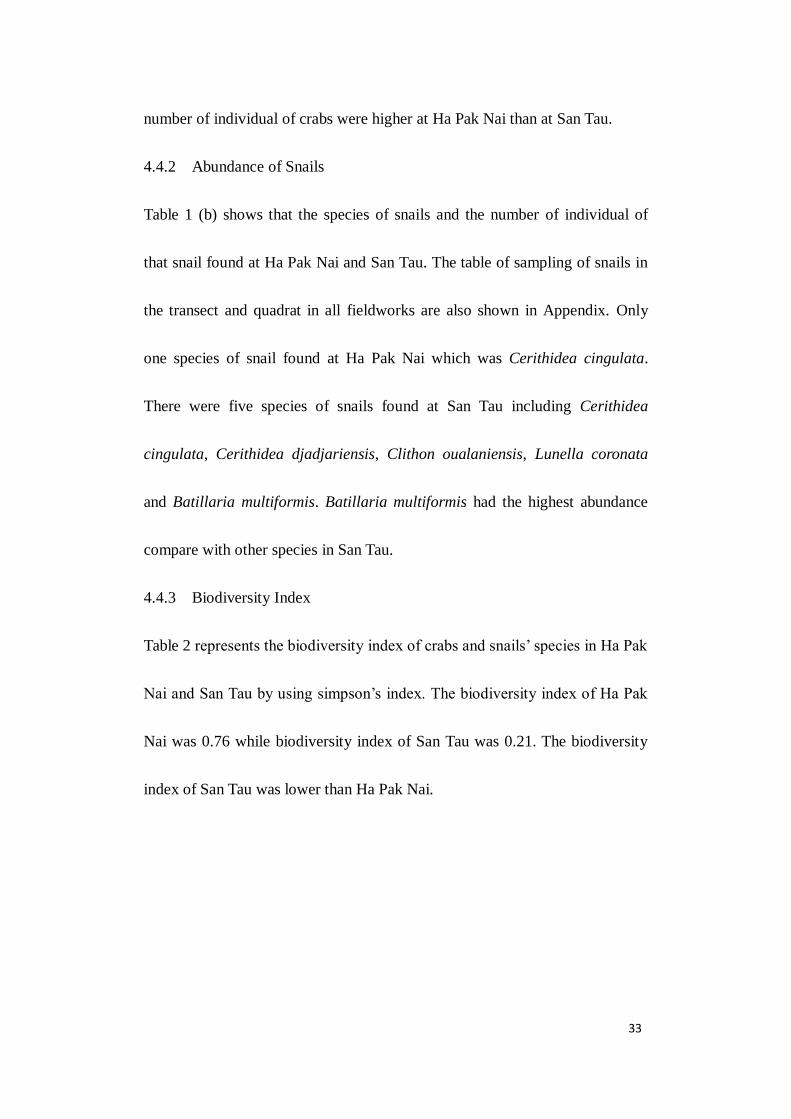
4.4.2 Abundance of Snails
Table 1 (b) shows that the species of snails and the number of individual of
that snail found at Ha Pak Nai and San Tau. The table of sampling of snails in
the transect and quadrat in all fieldworks are also shown in Appendix. Only
one species of snail found at Ha Pak Nai which was Cerithidea cingulata.
There were five species of snails found at San Tau including Cerithidea
cingulata, Cerithidea djadjariensis, Clithon oualaniensis, Lunella coronata
and Batillaria multiformis. Batillaria multiformis had the highest abundance
compare with other species in San Tau.
4.4.3 Biodiversity Index
Table 2 represents the biodiversity index of crabs and snails’ species in Ha Pak
Nai and San Tau by using simpson’s index. The biodiversity index of Ha Pak
Nai was 0.76 while biodiversity index of San Tau was 0.21. The biodiversity
index of San Tau was lower than Ha Pak Nai.

34
Table 1 (a) & (b). Species and total number of individual of crabs and snails
at Ha Pak Nai and San Tau
Table 1 (a). Species and total number of individual of crabs in study areas
Study area Species name Number of individual
Ha Pak Nai Metaplax longipes 4
Philyra carinata 26
Uca borealis 342
San Tau Clibanarius longitarsus 87
Table 1 (b). Species and total number of individual of snails in study areas
Study area Species name Number of individual
Ha Pak Nai Cerithidea cingulata 21
San Tau Cerithidea cingulata 1293
Cerithidea djadjariensis 1265
Clithon oualaniensis 457
Lunella coronata 928
Batillaria multiformis 1422
Table 2. Simpson’s Index of Ha Pak Nai and San Tau
Study area Simpson’s Index
Ha Pak Nai 0.76
San Tau 0.21
.

35
CHAPTER 5 DISCUSSION
Abundance of crabs and snails Total number of individual and species of crabs
counted more at Ha Pak Nai than at San Tau. Uca spp. was the dominant species
of crab found at Ha Pak Nai in the four field dates. Although Ha Pak Nai is near
Shenzhen and receives pollutants discharging from Shenzhen, the sewage did
not stress the abundance of crabs. Same finding in East Africa was represented
in the research by Cannicci et al. (2009), higher biomass of crabs founded in
peri-urban sites which received urban wastewater than non-urban sites and the
abundance of crabs was increased in peri-urban sites. The research was also
found that the dominance of Uca spp. was increasing in the sewage dumping
areas. There were two reasons of the large number of fiddler crab at Ha Pak Nai.
The first reason was the characteristics of sediment, which could influence the
distribution of crabs (Cannicci et al., 2009). Uca spp. of the fiddler crabs are
mainly existing in muddy sediment. Smaller Uca borealis occurred sediment s
with fine particles (Shin et al., 2004). The second reason was the nutrient
concentration of the sewage discharging from Shenzhen City and river.
Increasing the concentration could increase the bacteria and benthic diatoms
and the fiddler crabs would feed them. Discharging suitable sewage could
stimulate the growth of benthic organisms (Penha-Lopes et al., 2009).

36
Moreover, some crabs such as sesarmid crabs had a high tolerance to the
sewage (Cannicci et al., 2009) and heavy metal could influence the distribution
of fiddler crabs (Mokhtari et al., 2015). Crustaceans had the detoxification
storage mechanisms in some organs by using physiological and biochemical to
protect the tissues and other organs from the harmful effects of the metals
(Marsden and Rainbow, 2004). But sesarmid crabs did not discover in the
sampling sites at both Ha Pak Nai and San Tau.
Total number of individual and species of snails counted more at San Tau than
at Ha Pak Nai. Negative relationship between heavy metal concentration in
sediment and the number of gastropod and number of gastropod species
Indonesia was found by Amin et al. (2009). It was meaning that when metals
concentration increased, the number of gastropod decreased. If the snails
exposure to the toxic environment in a long period, mortality would increase
(Ramakritinan, Chandurvelan & Kumaraguru, 2012). Moreover, biodiversity
index could reflect the pollution status. Smaller number of Simpson Index
represents higher species diversity. High species diversity represented low
impact or unpolluted status. Simpson Index in San Tau was lower showed that
San Tau had higher species diversity than Ha Pak Nai. Higher heavy metal
contamination at Ha Pak Nai than at San Tau researched by Zhou et al. (2007).

37
Because heavy metals contamination in sediment was higher at Ha Pak Nai, the
abundance and the number of species was lower than San Tau. Gastropod had
contact with sediments directly. Also, they were immobile and had fewer
capacity to escape the impacts caused by pollutants. On the other hand, Cu and
Zn were the most harmful metals to the population of gastropod and
contaminated sediments which had high toxicity would cause the death of
gastropod.
The findings of the biomass of crabs and snails were same as the hypothesis.
Concentration of heavy metal might not affect the number of crabs while affect
the number of snails.
Sediment grain size The mean percentage of silt in the sediment at Ha Pak Nai
was more than at San Tau. Fine particles are the major element in sediment at
Ha Pak Nai while sand is the major element in sediment at San Tau. Particle size
of the sediment is one of the methods to assess the metal contamination in
aquatic systems. Because the sampling sites at Ha Pak Nai and San Tau were
also located on intertidal mudflat, these areas would be covered by water when
there were high tide. Many metals were deposited into sediment under the water
(Chaiyara et al., 2013). On the other hand, many studies found that higher
contamination of heavy metals occurred in the sediment which had more clay

38
and fine particle in both mudflat and mangrove. For example, Tam and Wong
(2000) stated that heavy metals were easier to bond in clay and silt fraction of
sediment than sand fraction of sediment. Heavy metal contamination is
occurred in sediment with high percentage of silt and clay because the fractions
of these types of sediments are more chemically active than larger sediment
(Rahmanpour et al., 2014). Moreover, heavy metals will be removed from water
and transported to the sediment rapidly (Rahmanpour et al., 2014) and absorbed
by clay and silt.
Zhou et al. (2007) were using the GIS to find out the spatial distribution of
heavy metals including Zn, Pb, Cd, Cu, V and Fe of the marine sediments in
Hong Kong. Results showed that the concentration of these heavy metals were
higher at Ha Pak Nai than at San Tau. The findings studied by Zhou et al. (2007)
is shown in Figure 14.
The percentage of silt in sediment was larger at Ha Pak Nai found in this study
same as to the hypothesis. Because fine particles have a potential to absorb
heavy metals (Rahmanpour et al., 2014) and concentration of metals are
increasing from sand to silt (Tam and Wong, 2000). It is estimated that metals
contamination in sediment was higher at Ha Pak Nai than at San Tau. Although
concentration of heavy metals in sediment did not conduct in this study, higher

39
metals contamination in sediment at Ha Pak Nai was showed in the research by
Zhou et al. (2007) and have this inference.
Figure 14. Spatial distribution of heavy metal in marine sediment in Hong
Kong
(Source: Zhou et al., 2007)
Heavy metals in water The mean concentration of each heavy metal in water
was similar at Ha Pak Nai and San Tau. Also, the findings were low and not
significant. The findings were different with the hypothesis. There are two
possible reasons of the low metal concentration in water. The first reason is the
variation of daily and seasonal fluctuations (Lau and Chu, 1999) such as tidal
and monsoon. The water sampling sites of the two study areas were near the sea

40
also, the metal levels would be decreased because of the seawater. Seawater had
a lower metal content than fresh water and had a dilution effect (Lau and Chu,
1999). On the other hand, the magnitude of the concentration of contaminants
was lower in water than in sediment (Fernandes and Nayak, 2012). In the study
conducted by Chaiyara et al. (2013), they found that the concentration of heavy
metals including cadmium, Copper, Lead and Zinc in water in the three rivers of
the upper Gulf of Thailand were lower than in the sediment. The statement
stated by Fernandes and Nayak (2012) supported the finding in this study.
Furthermore, the possible reason of the concentration of heavy metal in water
was similar at both Ha Pak Nai and San Tau might be the concentration of
heavy metals in water at San Tau were increasing in the recent year.
Construction of Hong Kong-Zhuhai-Macao Bridge aims to connect Hong Kong,
Zhuhai and Macao. Hong Kong Link Road was near the mudflat at San Tau. A
layout plan of Hong Kong Link Road is shown in Appendix 11. The
construction of Hong Kong Link Road was started in 2012 (Highways
Department, 2016). There was a news about the illegal discharge of sewage and
construction materials during the construction works in 2015 (Apple, 2015).
Those sewage might contain toxic pollutants such as heavy metals. Moreover,
dredging of seabed would conduct during the construction. Dredging would flip

41
the sediment, suspended sediment would increase and the contaminants would
release to the water (Lau and Chu, 1999), so causing water pollution and
contamination. Thus, the construction of Hong Kong Link Road may cause
water pollution and contamination and increase the concentration of heavy
metals in the water near San Tau.
Although the findings of heavy metals in water were not significant and
different with the expectation. The findings showed that heavy metal
contamination in water was not serious at both Ha Pak Nai and San Tau during
October and November. Dilution effect by the seawater would affect the
concentration of heavy metal and the construction of Hong Kong Link Road
may increase the concentration of heavy metals in water at San Tau in the
future.
Relationship between water parameters and heavy metals Although the
results of the correlation of water parameters and heavy metal were not
comparable, the physical parameters of water were having effect on the
concentration of heavy metal. In overall data, dissolved oxygen in San Tau were
higher than in Ha Pak Nai except the first field date. The amount of dissolved
oxygen would affect the metals release. From the experiment done by Atkinson
et al. (2007), releasing of lead from the sediment was greater in low dissolved

42
oxygen. They found that the concentration of dissolved lead remained less than
5 µg L-1 in high and middle dissolved oxygen while remained a mean of 50 µg
L-1 in low dissolved oxygen. This observation was explained by slower rate of
oxidative precipitation and removing of Fe(II) and Mn(II) ions since they
diffused by the sediment-water interface (Atkinson et al., 2007). The mean
conductivity in San Tau was higher than in Ha Pak Nai. Electrical conductivity
increased when discharging of industrial wastes (Yalcin et al., 2008). High
conductivity in San Tau might cause by the sewage and pollutants from the
construction of Hong Kong-Zhuhai-Macao Bridge while the result of the
conductivity in Ha Pak Nai might cause by the sewage discharge from Pearl
River and Shenzhen River. The mean of pH value in Ha Pak Nai and San Tau
were similar (Figure), both study areas had mean of pH value of 8. Kar et al.
(2008) investigated that no significant correlation between concentration of
heavy metals and the pH value of water.
Organic matter in sediment Organic content in sediment could affect the heavy
metal contamination in sediment. Organic matter includes nitrogen, phosphorus
and organic carbon. Although organic content in sediment did not test in this
study, Environmental Protection Department (EPD) had the data of different
parameters of marine sediment. Ha Pak Nai is located in Deep Bay Water

43
Control Zone while San Tau is located in North Western Water Control Zone.
The nearest monitoring station of Ha Pak Nai is DS3 and nearest monitoring
station of San Tau is NS6. The data of concentration of different metals,
ammonia nitrogen and total phosphorus in monitoring station DS3 and NS6 in
Table 3. From the table, the amount of ammonia nitrogen in monitoring station
NS6 was lower than DS3 while total phosphorus m was higher than DS3. In
overall, the organic content in monitoring station NS6 was higher than DS3.
Also, concentration of those heavy metal in monitoring station NS6 were higher
than DS6. It might due to the high organic content. Higher organic matter
content in sediment would absorb heavy metal easily. Deposition and
remobilization of trace metals occurred in the sediment which abundant in
organic matter (Fernandes and Nayak, 2012). Some of the metals such as
copper, lead and cadmium have high affinity with organic matter (Ahn et al.,
1994). It means that sediment with abundant organic matter will absorb more
Cu, Pb and Cd.
In the past, the organic content (ammonia nitrogen and phosphorus) in
monitoring station DS3 near Ha Pak Nai were much higher than in 2014 and
higher than the monitoring station NS6. In recent year, the pollution situation
was improved because Shenzhen government collaborate with Hong Kong

44
government to reduce the pollution and reduce the operation of pig farms in
2005 to 2008 (Environmental Protection Department, 2014).
Table 3. Data of different parameters in monitoring station DS3 and NS6
As Cd Cr Cu Fe Pb
DS3 8.55 0.05 24.5 24 35500 26
NS6 15 0.15 36 30.5 38000 39
Hg Ni V Zn N P
DS3 0.085 15.5 30 101 6 235
NS6 0.12 21 49.5 100 3.47 250
*Units for both metals, N and P are mg/kg
(Source: Environmental Protection Department, 2014)
Source of heavy metal Sources of heavy metal can be come from both natural
and anthropogenic activities. Cu, Cr and Zn were coming from anthropogenic
impacts; Al, Ba, Mn, V and Fe were coming from natural sources; Cd, Hg, Ni
and Pb were coming from anthropogenic activities or rock materials (Zhou et al.,
2007). Both Ha Pak Nai and San Tau are located at the western part of Hong
Kong. The pollutants of San Tau were mainly from local discharges and surface
run-off from North Lantau (Environmental Protection Department, 2014).
Apart from local discharges, the western part of Hong Kong is receiving
discharges from Shenzhen River (Environmental Protection Department, 2014).
More anthropogenic impacts occurred in Ha Pak Nai than San Tau (Zhou et al.,
2007) because Ha Pak Nai is nearer to the Shenzhen River. Due to the rapid

45
economic development in Shenzhen, many factories were built to increase the
industrial activities. Sewage from factories would discharge into river and flew
into Hong Kong’s water zone through Shenzhen River and Pearl River.
Management and sustainable use of mudflat in Hong Kong Even heavy metal
contamination do not have the impact on the ecosystem immediately, heavy
metal can stay in the sediment in the long time and will affect the communities
and ecosystem. Although San Tau was listed as SSSI, there was no specific
protection strategies to these SSSIs in Hong Kong (Chen, 2003). In EU, there
were different strategies to strengthen the protection of SSSIs. For example,
establishment of the Countryside and Rights of Way Act (Foster et al., 2014). In
the case of Hong Kong, government should establish different strategies to
protect the SSSIs. Also, one of the study areas -- Ha Pak Nai, should also list
into SSSI. Moreover, to reduce the pollutants into water and sediment, sewage
should be treated first and monitor the illegal discharge.
Several improvements were discovered in this study. Results found from this
study were not significant because the sample numbers were not much enough.
The limited time and storage materials resulted fieldworks were conducted four
times in each study areas. On the other hand, concentration of heavy metal and

46
organic content in sediment did not cover in this study because of the limited
laboratory equipment.
In this study, crabs and snails were the two organisms that studied in terms of
biological and ecological aspects. Sampling could conduct more if there was
enough time and benthic communities can be studied in the further study to
have more comprehensive study on mudflat ecosystem.
Those parameters that did not study are important to investigate the heavy metal
contamination and will consist in the further study.

47
CHAPTER 6 CONCLUSION
Three physical parameters (dissolved oxygen, conductivity and pH) of water,
grain size analysis of sediment, heavy metal in water and biomass of crabs and
snails were studied. A better understanding of various factors could influence
the concentration of heavy metal in water and sediment, the effect of heavy
metal to the distribution of crabs and snails and different sources of heavy
metals were investigated from this study.
No relationship amongst the physical parameters of water and heavy metal
concentrations could be investigated in this study. But the amount of electrical
conductivity could show the level of waste discharge while the level of
dissolved oxygen could affect the release and remain of metal ions. There was
only no relationship between the pH value of water and concentration of heavy
metal.
Concentration of heavy metals in water were not high found in this study as
there were various factors to influence the heavy metal concentration. However,
the construction of Hong Kong Link Road might increase the heavy metal
concentrations in water.
Grain size of the sediment and organic matter content were the major factors to
affect the adsorption of heavy metal. Sediment especially with more fine

48
particles and high organic matter content would adsorb more heavy metals due
to the surface area and the affinity.
The level of heavy metal contamination would affect the communities and
ecosystem of mudflat in long term. Many organisms could be the bioindicators
to reflect the heavy metal contamination. The community of crabs might not be
changed due to their detoxification mechanisms and their tolerance. However,
the level of heavy metal contamination would affect the community of snails
because they had a direct contact with sediments.
Sources of heavy metal were vary in different mudflat, could be anthropogenic
and natural. Anthropogenic impacts were the major source of heavy metal in
this decade due to the rapid development like the two study areas in this study.
Organisms are having many connections between sediment and other
organisms and have a chain effect. Government should take an active role to
have a better management and reduce the releasing of toxic environmental
pollutants into mudflat which aims to have a sustainable use of mudflat.

49
Ap
pen
dix
1. T
able
of
physi
cal
par
amet
ers
in w
ater
rec
ord
ed i
n H
a P
ak N
ai

50
Ap
pen
dix
2. T
able
of
physi
cal
par
amet
ers
in w
ater
rec
ord
ed i
n S
an T
au
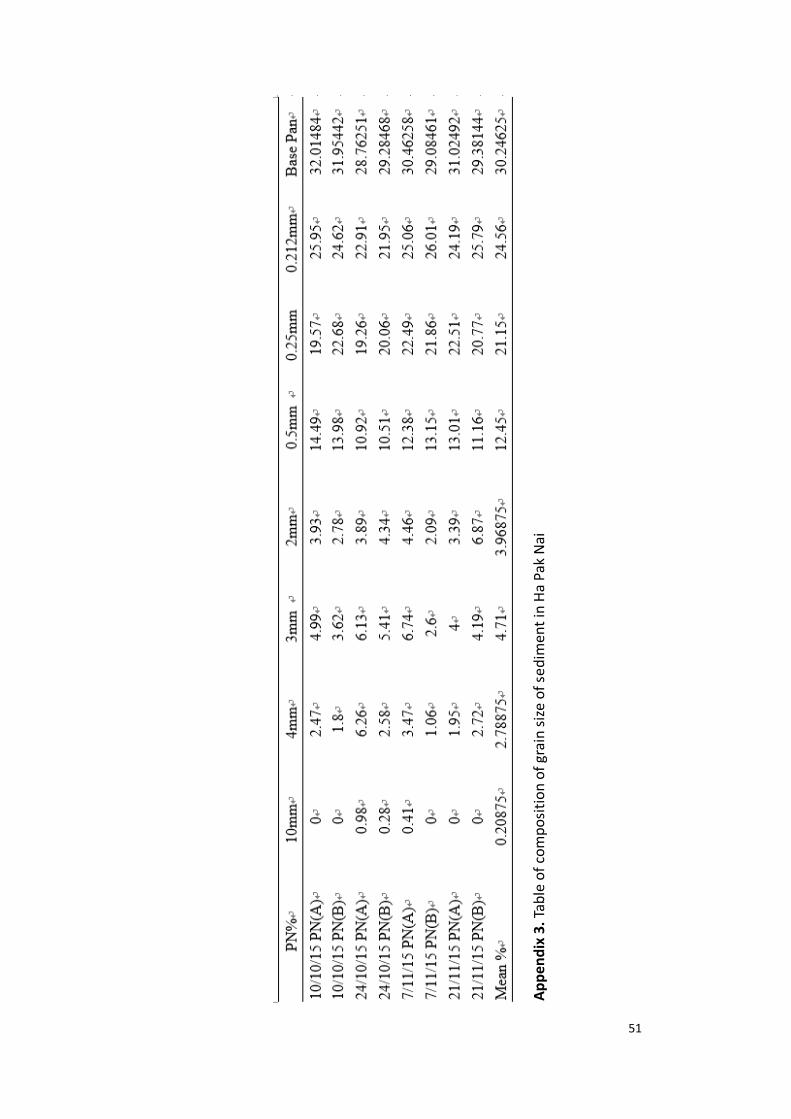
51
Ap
pen
dix
3. T
able
of
com
po
siti
on
of
grai
n s
ize
of
sed
imen
t in
Ha
Pak
Nai

52
Ap
pen
dix
4. T
able
of
com
po
siti
on
of
grai
n s
ize
of
sed
imen
t in
San
Tau

53
Ap
pen
dix
5. C
on
cen
trat
ion
of
hea
vy m
etal
in w
ater
sam
ple
of
Ha
Pak
Nai
*Un
it o
f h
eavy
met
al c
on
cen
trat
ion
is m
g/L
.

54
Ap
pen
dix
6. C
on
cen
trat
ion
of
hea
vy m
etal
in w
ater
sam
ple
of
San
Tau
*Un
it o
f h
eavy
met
al c
on
cen
trat
ion
is m
g/L
.

55
Ap
pen
dix
7. T
able
of
nu
mb
er
of
crab
s co
un
ted
in H
a Pa
k N
ai

56
Ap
pen
dix
8. T
able
of
nu
mb
er
of
crab
s co
un
ted
in S
an T
au

57
Ap
pen
dix
9. T
able
of
nu
mb
er
of
snai
ls c
ou
nte
d in
Ha
Pak
Nai

58
Ap
pen
dix
10.
Tab
le o
f n
um
ber
of
snai
ls c
ou
nte
d in
San
Tau

59
Ap
pen
dix
11.
Lay
ou
t p
lan
of
Ho
ng
Ko
ng
Lin
k R
oad

60
References
Ahn, I. Y., Kang, Y. C., & Choi, J. W. (1995). The influence of industrial
effluents on intertidal benthic communities in Panweol, Kyeonggi Bay
(Yellow Sea) on the west coast of Korea. Marine Pollution Bulletin, 30(3),
200-206.
Amin, B., Ismail, A., Arshad, A., Yap, C. K., & Kamarudin, M. S. (2009).
Gastropod assemblages as indicators of sediment metal contamination in
mangroves of Dumai, Sumatra, Indonesia. Water, air, and soil
pollution,201(1-4), 9-18.
Apple (2015). 港珠澳橋工程排污入海 中國建築涉違法.
Available: http://hk.apple.nextmedia.com/realtime/news/20151002/54267982
Access: 12th March 2016
Atkinson, C. A., Jolley, D. F., & Simpson, S. L. (2007). Effect of overlying water
pH, dissolved oxygen, salinity and sediment disturbances on metal release and
sequestration from metal contaminated marine sediments.Chemosphere, 69(9),
1428-1437.
Cannicci, S., Bartolini, F., Dahdouh-Guebas, F., Fratini, S., Litulo, C., Macia,
A., ... & Paula, J. (2009). Effects of urban wastewater on crab and mollusc
assemblages in equatorial and subtropical mangroves of East Africa.Estuarine,
Coastal and Shelf Science, 84(3), 305-317.
Chaiyara, R., Ngoendee, M., & Kruatrachue, M. (2013). Accumulation of Cd, Cu,
Pb, and Zn in water, sediments, and mangrove crabs (Sesarma mederi) in the
upper Gulf of Thailand. Science Asia, 39, 376-383.
Che, R. O. (1999). Concentration of 7 heavy metals in sediments and
mangrove root samples from Mai Po, Hong Kong. Marine Pollution
Bulletin,39(1), 269-279.
Chen, X. Y. (2003). Heavy metals contents in sediments, mangroves and
bivalves from Ting Kok, Hong Kong. CHINA ENVIRONMENTAL
SCIENCE-CHINESE EDITION-, 23(5), 480-484.

61
Cheung, K. L., Liu, C. C., Xu, W. Z., Chueng, S. G., & Shin, P. K. (2008).
Macrobenthic communities in a sub-tropical man-made mudflat. Marine
pollution bulletin, 56(6), 1226-1230.
Cuong, D. T., Bayen, S., Wurl, O., Subramanian, K., Wong, K. K. S., Sivasothi,
N., & Obbard, J. P. (2005). Heavy metal contamination in mangrove habitats
of Singapore. Marine Pollution Bulletin, 50(12), 1732-1738.
Environmental Protection Department (2014). Marine Water Quality Data.
Available: http://epic.epd.gov.hk/EPICRIVER/marine/?lang=en
Access: 27th March 2016
Environmental Protection Department (2014). Marine Water Quality in Hong
Kong in 2014.
Available:
http://wqrc.epd.gov.hk/pdf/water-quality/annual-report/MarineReport2014eng.
Access: 27th March 2016
Fang, Z. Q., Cheung, R. Y. H., & Wong, M. H. (2001). Heavy metal
concentrations in edible bivalves and gastropods available in major markets of
the Pearl River Delta. Journal of Environmental Sciences, 13(2), 210-217.
Fernandes, L. L., & Nayak, G. N. (2012). Heavy metals contamination in
mudflat and mangrove sediments (Mumbai, India). Chemistry and
Ecology,28(5), 435-455.
Foster, N. M., Hudson, M. D., Bray, S., & Nicholls, R. J. (2014). Research,
policy and practice for the conservation and sustainable use of intertidal
mudflats and saltmarshes in the Solent from 1800 to 2016. Environmental
Science & Policy, 38, 59-71.
Green Power (Unknown). Sau Tau Beach – Sanctuary for Hong Kong’s rare
sea-grass.
Available:
http://www.greenpower.org.hk/html/eng/classroom/sssi/c_e_sssi_santaubeach.
asp
Access: 10th January 2016

62
Highways Department (2016). Hong Kong Link Road (HKLR).
Available:
https://www.hyd.gov.hk/en/road_and_railway/hzmb_projects/6787th/index.ht
ml
Access: 9th March 2016
Kar, D., Sur, P., Mandai, S. K., Saha, T., & Kole, R. K. (2008). Assessment of
heavy metal pollution in surface water. International Journal of
Environmental Science & Technology, 5(1), 119-124.
Lai, M. Y., Shen, P. P., Zhao, Z., Zhou, H., & Gu, J. D. (2005). Concentrations
of heavy metals in the benthic microgastropods Sermyla riqueti and
Stenothyra devalis at the Mai Po Inner Deep Bay Ramsar site of Hong
Kong. Bulletin of environmental contamination and toxicology, 74(6),
1065-1071.
Lam, J. C., Tanabe, S., Lam, M. H., & Lam, P. K. (2005). Risk to breeding
success of waterbirds by contaminants in Hong Kong: evidence from trace
elements in eggs. Environmental pollution, 135(3), 481-490.
Lau, S. S. S., & Chu, L. M. (2000). The significance of sediment
contamination in a coastal wetland, Hong Kong, China. Water Research,34(2),
379-386.
Liang, Y. (2007). Field assessment of sediment toxicities within a subtropical
estuarine wetland in Hong Kong, using a local gastropod (Sermyla
tornatella).Bulletin of environmental contamination and toxicology, 78(6),
494-498.
Marcovecchio, J., & Ferrer, L. (2005). Distribution and geochemical
partitioning of heavy metals in sediments of the Bahía Blanca Estuary,
Argentina. Journal of Coastal Research, 826-834.
Marsden, I. D., & Rainbow, P. S. (2004). Does the accumulation of trace
metals in crustaceans affect their ecology—the amphipod example?. Journal
of Experimental Marine Biology and Ecology, 300(1), 373-408.

63
Mokhtari, M., Ghaffar, M. A., Usup, G., & Cob, Z. C. (2015). Determination
of key environmental factors responsible for distribution patterns of fiddler
crabs in a tropical mangrove ecosystem. PloS one, 10(1), e0117467.
Na, C. K., & Park, H. J. (2012). Distribution of heavy metals in tidal flat
sediments and their bioaccumulation in the crab Macrophthalmus japonicas in
the coastal areas of Korea. Geosciences Journal, 16(2), 153-164
Pande, A., & Nayak, G. N. (2013). Understanding distribution and abundance
of metals with space and time in estuarine mudflat sedimentary
environment.Environmental earth sciences, 70(6), 2561-2575.
Penha-Lopes, G., Bartolini, F., Limbu, S., Cannicci, S., Kristensen, E., &
Paula, J. (2009). Are fiddler crabs potentially useful ecosystem engineers in
mangrove wastewater wetlands?. Marine Pollution Bulletin, 58(11),
1694-1703.
Rahmanpour, S., Ghorghani, N. F., & Ashtiyani, S. M. L. (2014). Heavy metal
in water and aquatic organisms from different intertidal ecosystems, Persian
Gulf. Environmental monitoring and assessment, 186(9), 5401-5409.
Ramakritinan, C. M., Chandurvelan, R., & Kumaraguru, A. K. (2012). Acute
toxicity of metals: Cu, Pb, Cd, Hg and Zn on marine molluscs, Cerithedia
cingulata G., and Modiolus philippinarum H. Indian journal of geo-marine
sciences, 41(2), 141-145.
Reddy, K. (Unknown). Grain Size Analysis. UIC
Ruiz-Fernández, A. C., Frignani, M., Hillaire-Marcel, C., Ghaleb, B., Arvizu,
M. D., Raygoza-Viera, J. R., & Páez-Osuna, F. (2009). Trace metals (Cd, Cu,
Hg, and Pb) accumulation recorded in the intertidal mudflat sediments of three
coastal lagoons in the Gulf of California, Mexico. Estuaries and Coasts, 32(3),
551-564.
Shin, P. K. S., Yiu, M. W., & Cheung, S. G. (2004). Behavioural adaptations of
the fiddler crabs Uca vocans borealis (Crane) and Uca lactea lactea (De Haan)
for coexistence on an intertidal shore. Marine and Freshwater Behaviour and
Physiology, 37(3), 147-160.

64
Simpson, E. H. (1949). The measure of diversity. Nature, 163, 688
Tam, N. F. Y., & Wong, Y. S. (2000). Spatial variation of heavy metals in
surface sediments of Hong Kong mangrove swamps. Environmental
Pollution, 110(2), 195-205.
Tam, N. F. Y., & Wong, Y. S. (2000). Hong Kong Mangroves. City University
of Hong Kong, Hong Kong
Tam, N. Y., & Wong, T. Y. (2003). Using benthic macrofauna to assess
environmental quality of four intertidal mudflats in Hong Kong and Shenzhen
Coast. Acta Oceanologica Sinica, 22(2), 309-319.
Vilhena, M. S., Costa, M. L., & Berredo, J. F. (2013). Accumulation and
transfer of Hg, As, Se, and other metals in the
sediment-vegetation-crab-human food chain in the coastal zone of the northern
Brazilian state of Pará (Amazonia). Environmental geochemistry and
health, 35(4), 477-494.
Wang, Y., Qiu, Q., Xin, G., Yang, Z., Zheng, J., Ye, Z., & Li, S. (2013). Heavy
metal contamination in a vulnerable mangrove swamp in South
China.Environmental monitoring and assessment, 185(7), 5775-5787.
Warwick, R. M. (2001). Evidence for the effects of metal contamination on the
intertidal macrobenthic assemblages of the Fal estuary. Marine Pollution
Bulletin, 42(2), 145-148.
World Wild Fund (unknown). Mai Po Wetland Habitats Fact sheet –
Inter-tidal Mudflat.
Available:
Access: 1st February 2016
Yalcin, M. G., Aydin, O., & Elhatip, H. (2008). Heavy metal contents and the
water quality of Karasu Creek in Nigde, Turkey. Environmental monitoring
and assessment, 137(1-3), 169-178.

65
Zhang, Z. W., Xu, X. R., Sun, Y. X., Yu, S., Chen, Y. S., & Peng, J. X. (2014).
Heavy metal and organic contaminants in mangrove ecosystems of China: a
review. Environmental Science and Pollution Research, 21(20), 11938-11950.
Zhou, F., Guo, H., & Hao, Z. (2007). Spatial distribution of heavy metals in
Hong Kong’s marine sediments and their human impacts: a GIS-based
chemometric approach. Marine Pollution Bulletin, 54(9), 1372-1384.