Embed Size (px)
Citation preview

93
6BABIES’ HEALTH: MORTALITY AND
MORBIDITY DURING PREGNANCY AND IN THE FIRST YEAR OF LIFE

6. BABIES’ HEALTH: MORTALITY AND MORBIDITY DURING PREGNANCY AND IN THE FIRST YEAR OF LIFE
COREFetal mortality rate by gestational age, birth weight, and plurality (C1)
Neonatal mortality rate by gestational age, birth weight, and plurality (C2) Infant mortality rate by gestational age, birth weight, and plurality (C3)
Distribution of birth weight by vital status, gestational age, and plurality (C4) Distribution of gestational age by vital status and plurality (C5)
RECOMMENDED INDICATORS NOT INCLUDED IN THIS REPORTPrevalence of selected congenital anomalies (R1)
Distribution of 5-minute Apgar scores as a percentage of live births (R2) Fetal and neonatal deaths due to congenital anomalies (R3)
Prevalence of cerebral palsy (R4)
Outcomes related to the health of babies in the first year of life, specifically mortality rates, are often used as proxy measures of the health status of a population or of the quality of the perinatal healthcare system. The main contributory factors to perinatal death include congenital anomalies, very preterm birth, and fetal growth restriction. Maternal age, parity, multiple pregnancy, maternal conditions such as preeclampsia and diabetes, socioeconomic and migration status, and behaviours such as smoking are well-known risk factors for perinatal mortality and morbidity in high-income countries. The quality of care during pregnancy, delivery, and the neonatal period also influences babies’ chances of mortality and morbidity.
The Euro-Peristat indicators of child health include five core indicators, which are presented in this report, and four recommended indicators. The recommended indicators are: prevalence ofselectedcongenitalanomalies(providedbyEUROCATcongenitalanomalyregistries)(R1);distributionof5-minuteApgarscoresasapercentageoflivebirths(R2);fetalandneonataldeathsduetocongenitalanomalies(R3);andprevalenceofcerebralpalsy(providedbySCPEcerebralpalsy registries) (R4).
EUROPEAN PERINATAL HEALTH REPORT
94

C1. FETAL MORTALITY
JUSTIFICATIONOver the past decade, clinicians, researchers, public health advocates, and parents’ groups have raised the profile of fetal mortality, also called stillbirth, as a public health problem. Several key publications have alerted the international community to the lack of attention to stillbirths in maternal and child health policies, the wide gaps in knowledge about how best to prevent them, and the unacknowledged suffering faced by bereaved parents.1-3
Stillbirths account for more than half of all deaths occurring in the perinatal period, which begins at 22 weeks of gestation.4 The causes of fetal death are multiple and include congenital anomalies, fetal growth restriction, abruption associated with placental pathologies, preterm birth, and other maternal complications of pregnancy, as well as infections.2,5 However, between 30 and 50% of fetal deaths remain unexplained, and this gap impedes the development of prevention strategies.5 Routine use of post-mortem and histological examinations would reduce this proportion, but post-mortem rates are reported to be declining in many countries.2
The principal modifiable risk factors for stillbirth include obesity and overweight, smoking, and older maternal age.6 Women having their first birth face a higher risk of stillbirth as do women with multifetal pregnancies. Because fetal growth restriction accounts for a high proportion of fetal deaths, better detection and management of these cases might be an effective preventive strategy.2, 6 Audits of fetal deaths have also called attention to the contribution of suboptimal care to their occurrence.7 Finally, women’s risks of stillbirths are correlated with their socioeconomic status. For example, stillbirth rates for women with low educational levels can be twice as high as those with high educational levels.8
METHODOLOGICAL ISSUES IN THE CALCULATION, REPORTING, AND INTERPRETATION OF THE INDICATORThe differences between countries in gestational age and birthweight criteria for reporting fetal deaths as stillbirths complicates international comparisons.4,9 It is therefore necessary to calculate fetal mortality rates by gestational age and birth weight to derive comparable indicators when registration limits differ. Because of these differences between countries, the World Health Organization has recommended limiting international comparisons to third trimester stillbirths, defined by a birthweight cutoff of 1000 g or a gestational age cutoff of 28 completed weeks.10 Euro-Peristat chose to use the gestational age cutoff of 28 completed weeks for its comparisons, as opposed to a birthweight cutoff, because criteria for registration of stillbirths in most countries are based on gestational age. Furthermore, as fetal growth restriction is related to stillbirth, a birthweight cutoff excludes a larger proportion of fetal deaths than a gestational age cutoff does.9
While the use of a gestational age limit of 28 weeks has been necessary to ensure valid comparisons, it excludes the high proportion of stillbirths before 28 weeks. Recent work by Euro-Peristat shows that adopting a cutoff of 24 weeks is feasible in many European countries and would allow reliable comparisons of stillbirth rates.11 This work showed, however, that reporting of stillbirths at 22 and 23 weeks is still highly variable and concluded that these deaths should still be excluded from international comparisons to ensure comparability. In this report, therefore, we have used both a 28- and a 24-week threshold for our main comparisons. All data, starting at 22 weeks, are reported in the summary tables.
95

Differences in policies and practices related to terminations of pregnancy at or after 22 weeks of gestation also affect fetal mortality rates.12 There are several different approaches to recording and reporting terminations of pregnancy in European countries. Terminations can be registered asfetaldeathsandreportedinfetalmortalityrates;theycanalsoberecordedinaseparatedata system (ie, in an abortion registry), or not recorded at all. In some countries, terminations at or after 22 weeks are illegal or very rare. Describing each country’s approach is important for comparing stillbirth indicators, and countries should be able to distinguish between spontaneous stillbirths and terminations. Further, while it is important to recognise the loss to parents of babies through terminations for congenital anomaly, the large variation in the timing of screening and regulations in Europe also makes it necessary to exclude them from stillbirth rates in cross-country comparisons.
A final issue to consider in reporting and interpreting stillbirth rates is country size. Because stillbirths are rare events, countries with small numbers of annual births, such as Cyprus, Iceland, Luxembourg, and Malta, experience greater year-to-year random fluctuations and will have wider confidence intervals around rates.
DEFINITION AND PRESENTATION OF INDICATORSThe fetal mortality rate is defined as the number of fetal deaths at or after 22 completed weeks of gestation in a given year, expressed per 1000 live births and stillbirths in the same period. When gestational age is missing, Euro-Peristat requests that fetal deaths be included if they have a birth weight of 500 g or more. Fetal mortality rates overall are presented in Summary Table C1, but also for births 1000 g or more and at or after both 28 and 24 completed weeks of gestation. Stillbirth rates are presented with and without terminations of pregnancy in the summary tables, but the rates presented in the figures in this section are calculated without terminations to improve comparability between countries. Because terminations were included in the fetal mortality rate we reported for 2010, the comparisons between 2010 and 2015 here use the 2015 rates with terminations included.
DATA SOURCES AND AVAILABILITY OF INDICATORS IN EUROPEAN COUNTRIESMost participating countries and regions were able to provide data on fetal deaths according to the Euro-Peristat definition, as Table C1.1 shows. When countries could not provide data on fetal deaths according to our definition, they were asked to give data applying their own inclusion limits (also shown in Table C1.1). In France, data were provided from hospital discharge data as well as from the periodic national perinatal survey. As the hospital discharge data were not available for 2010, the periodic survey data are used for comparisons over time.
Countries that could only provide data with a birthweight cutoff of 500 g, as opposed to gestational age, were Austria, Belgium, the Czech Republic, Germany, Poland, and Slovenia. Countries that could only provide stillbirths starting at 24 weeks, as opposed to 22 weeks, were Ireland, England, Wales, Northern Ireland, and Hungary. Spain provided data based on a 180-day cutoff, while Bulgaria used 800 g and/or 26 weeks. Note that these cutoffs relate to the data sources used for the Euro-Peristat report – for instance, Italy uses an official registration threshold of 180 days, but records stillbirths below this threshold in another register that is also used to provide data. In Scotland, as in the other countries of the United Kingdom, only fetal deaths at 24 or more completed weeks of gestation are legally registrable as stillbirths, but fetal deaths at 22 and 23 weeks of gestation can be ascertained from hospital data. Information was therefore provided for all fetal deaths from 22 weeks onwards. These differences in recording practices
EUROPEAN PERINATAL HEALTH REPORT
96
mostly affect births at 22 and 23 weeks, which is why a threshold of at least 24 weeks is used for the data presented in this section. However, all data are presented in the summary tables.
Table C1.1 also indicates the ability to identify terminations of pregnancy when these take place at or after 22 weeks. Most countries either do not allow terminations after 22 weeks or were able to provide data on the numbers of stillbirths after excluding terminations. The exceptions were Belgium, the Netherlands, and Cyprus, where terminations cannot be distinguished from spontaneous stillbirths.
In most countries, information on gestational age was missing for between 0 and 3% of stillbirths. Exceptions were Spain (11.7%), Cyprus (22.6%), the Netherlands (4.3%), and Slovakia (3.8%). A larger number of countries had proportions of missing data exceeding 3% for birth weight: Spain (15.6%), France (22.4%), Italy (25.7%), Cyprus (29.0%), Luxembourg (3.3%), Hungary (22.4%), Netherlands (6.6%), Slovakia (3.8%), Finland (3.5%), Scotland (13.3%) and Northern Ireland (4.9%). Because cases with missing data are not included when a gestational age or birthweight limit is imposed, rates in countries with substantial missing data should be interpreted with caution.
RESULTSAs Figure C1.1 shows, stillbirth rates at or after 28 weeks of gestation in 2015 were 2.2 per 1000 total births or lower in Cyprus, Iceland, Denmark, Finland, and the Netherlands. At the higher end, Bulgaria had a rate of 5.7, while Hungary, Romania, Slovakia, Latvia, and Ireland had rates of 3.4 or higher. Some countries with rates at the extremes had a small number of total births, as indicatedinparenthesesafterthecountryname;theirratesarethereforemoresubjecttorandomvariation.
The general ranking of countries is similar regardless of whether the gestational age threshold was 24 or 28 weeks of gestation. There were some exceptions, notably Belgium where terminations cannot be excluded from the total number of deaths and terminations are more likely to occur at the lower gestational ages. France also has a higher number of stillbirths from 24 to 27 weeks than would be expected from its stillbirth rates at 28 weeks or higher, but terminations do not explain this, as they are not included. The notably small numbers of stillbirths from 24 to 27 weeks in some countries, particularly Romania and Slovakia, suggest under-reporting at these gestational ages.
CHANGE IN FETAL MORTALITY RATES BETWEEN 2010 AND 2015 Figure C1.2 displays rates at and after 28 weeks in 2010 and 2015. The figure reveals highly variable changes between 2010 and 2015. To help assess these changes, Figure C1.3 presents risk ratios, giving the percentage change over time as well as confidence intervals to show the uncertainty around these estimates. The pooled risk ratio estimate between 2010 and 2015 was 0.95 (95% confidence intervals: 0.90-0.99), with statistically significant heterogeneity across countries. This graph shows that some countries experienced significant declines, some had stable rates, while rates rose in a few.
97

KEY POINTS• Almostallcountrieshavestillbirthratesbetween2.0and3.5per1000totalbirthsatandafter
28 weeks of gestation and between 2.5 and 4.5 per 1000 total births at and after 24 weeks of gestation. Accordingly, there were around 60-80% more stillbirths in the countries with the higher rates than in those with the lower rates.
• Overall,stillbirthratesfellbetween2010and2015,buttrendswereveryheterogeneous.Some countries experienced significant reductions in their stillbirth rates, including the Netherlands, Poland, Scotland, and England and Wales, whereas rates were stable or increased elsewhere.
• Thisheterogeneityinchangesinstillbirthratesin2010and2015callsformoreinvestigationof the health policies and changes in practices in the countries where stillbirth rates declined.
REFERENCES1. Lawn JE, Blencowe H, Waiswa P, et al. Stillbirths: rates, risk factors, and acceleration towards
2030. Lancet.2016;387(10018):587-603.
2. Flenady V, Wojcieszek AM, Middleton P, et al. Stillbirths: recall to action in high-income countries. Lancet.2016;387(10019):691-702.
3. Flenady V, Middleton P, Smith GC, et al. Stillbirths: the way forward in high-income countries. Lancet.2011;377(9778):1703-1717.
4. Mohangoo AD, Buitendijk SE, Szamotulska K, et al. Gestational age patterns of fetal and neonatal mortality in Europe: results from the Euro-Peristat project. PLoS One. 2011;6(11):e24727.
5. Reinebrant HE, Leisher SH, Coory M, et al. Making stillbirths visible: a systematic review of globally reported causes of stillbirth. BJOG.2018;125(2):212-224.
6. Page JM, Silver RM. Interventions to prevent stillbirth. Semin Fetal Neonatal Med. 2017;22(3):135-145.
7. Norris T, Manktelow BN, Smith LK, Draper ES. Causes and temporal changes in nationally collected stillbirth audit data in high-resource settings. Semin Fetal Neonatal Med. 2017;22(3):118-128.
8. Zeitlin J, Mortensen L, Prunet C, et al. Socioeconomic inequalities in stillbirth rates in Europe: measuring the gap using routine data from the Euro-Peristat Project. BMC Pregnancy Childbirth. 2016;16:15.
9. Mohangoo AD, Blondel B, Gissler M, et al. International comparisons of fetal and neonatal mortality rates in high-income countries: should exclusion thresholds be based on birth weight or gestational age? PLoS One.2013;8(5):e64869.
10. WHO. http://www.who.int/maternal_child_adolescent/epidemiology/stillbirth/en. (accessed 01/05/2018).
11. Smith LK, Hindori-Mohangoo AD, Delnord M, et al. Quantifying the burden of stillbirths before 28 weeks of completed gestational age in high-income countries: a population-based study of 19 European countries. Lancet.2018;S0140-6736(18)31651-9.
12. Blondel B, Cuttini M, Hindori-Mohangoo AD, et al. How do late terminations of pregnancy affect comparisons of stillbirth rates in Europe? Analyses of aggregated routine data from the Euro-Peristat Project. BJOG.2018;125(2):226-234.
EUROPEAN PERINATAL HEALTH REPORT
98

Table C1.1 Ability to provide stillbirth data according to Euro-Peristat’s inclusion criteria and ability to remove terminations of pregnancy from stillbirth statistics
Inclusion criteria No terminations of pregnancy** or can exclude terminations
Terminations of pregnancy cannot be excluded
Euro-Peristat criteria*:
≥22 weeks of gestational age or if
gestational age is missing, ≥500 grams
Denmark, Estonia, France, Croatia, Latvia,
Lithuania, Luxembourg, Greece, Romania,
Malta, Portugal, Slovakia, Finland,
Sweden, Norway, Iceland, Switzerland,
Italy***, UK (Scotland)
Netherlands, Cyprus
Use of other criteria:
≥ 500 grams Austria, Czech Republic, Germany,
Poland, Slovenia
Belgium
≥ 24 weeks Ireland, Hungary, UK (England and Wales,
Northern Ireland)
≥ 180 days Spain
≥ 800 grams/26 weeks Bulgaria: 800 grams and/or 26 weeks
Note: * Registration and recording guidelines differ in this group of countries, but all are able to provide stillbirth data starting at 22 weeks of gestation. ** Or terminations are rare above the registration limit for stillbirths and unlikely to affect stillbirth statistics. *** 180 days or more for stillbirths and < 180 days for spontaneous abortions, but have been combined for this report.
99
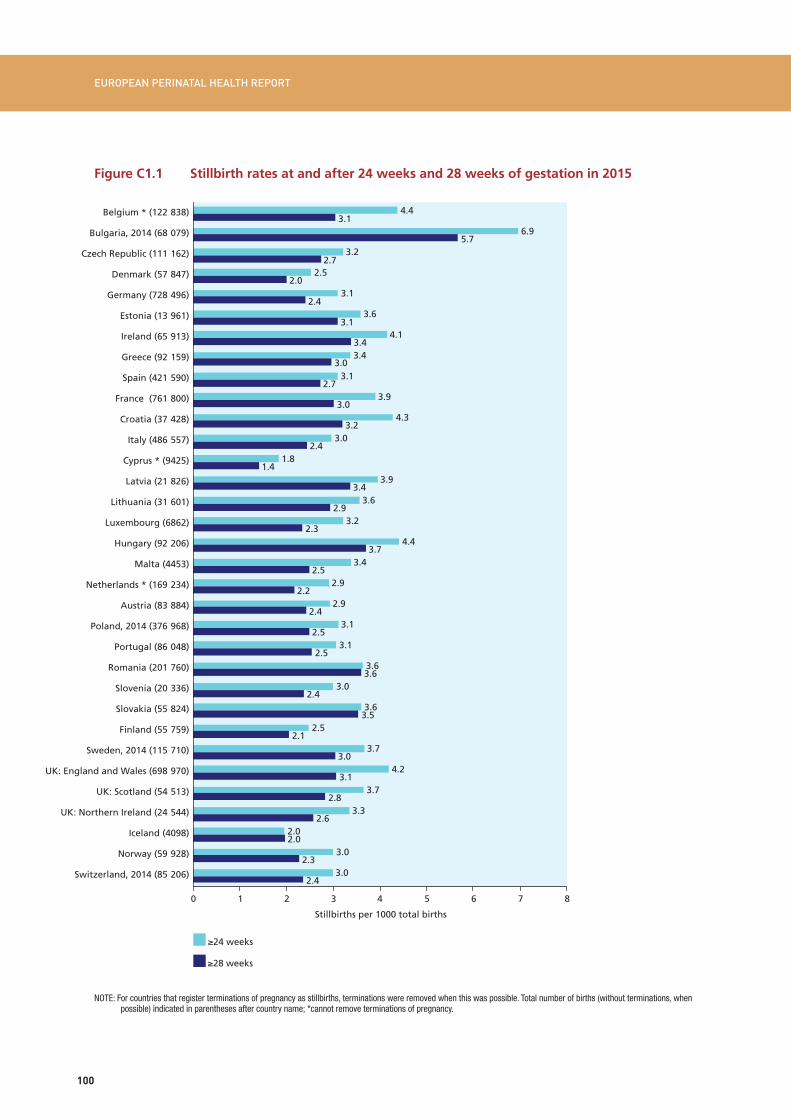
Figure C1.1 Stillbirth rates at and after 24 weeks and 28 weeks of gestation in 2015
NOTE: For countries that register terminations of pregnancy as stillbirths, terminations were removed when this was possible. Total number of births (without terminations, when possible) indicated in parentheses after country name; *cannot remove terminations of pregnancy.
EUROPEAN PERINATAL HEALTH REPORT
100
Stillbirths per 1000 total births
Belgium * (122-838)
Bulgaria, 2014 (68-079)
Czech Republic (111-162)
Denmark (57-847)
Germany (728-496)
Estonia (13-961)
Ireland (65-913)
Greece (92-159)
Spain (421-590)
France (761-800)
Croatia (37-428)
Italy (486-557)
Cyprus * (9425)
Latvia (21-826)
Lithuania (31-601)
Luxembourg (6862)
Hungary (92-206)
Malta (4453)
Netherlands * (169-234)
Austria (83-884)
Poland, 2014 (376-968)
Portugal (86-048)
Romania (201-760)
Slovenia (20-336)
Slovakia (55-824)
Finland (55-759)
Sweden, 2014 (115-710)
UK: England and Wales (698-970)
UK: Scotland (54-513)
UK: Northern Ireland (24-544)
Iceland (4098)
Norway (59-928)
Switzerland, 2014 (85-206)
24 weeks
28 weeks
0 1 2 3 4 5 6 7 8
4.4
6.9
3.2
2.5
3.1
3.6
4.1
3.4
3.1
3.9
4.3
3.0
1.8
3.9
3.6
3.2
4.4
3.4
2.9
2.9
3.1
3.1
3.6
3.0
3.6
2.5
3.7
4.2
3.7
3.3
2.0
3.0
3.0
3.1
5.7
2.7
2.0
2.4
3.1
3.4
3.0
2.7
3.0
3.2
2.4
1.4
3.4
2.9
2.3
3.7
2.5
2.2
2.4
2.5
2.5
3.6
2.4
3.5
2.1
3.0
3.1
2.8
2.6
2.0
2.3
2.4

Figure C1.2 Stillbirth rates at and after 28 weeks of gestation in 2010 and 2015
NOTE: Data for Luxembourg, France, Slovenia, England & Wales, Scotland, and Switzerland differ between Figure C1.1. and C1.2. because rates in C1.1 were calculated without terminations, while those for C1.2 were calculated including terminations. These differences are generally small, except for France.12 Data from France come from a different source than that used in Figure C1.1.
First-period data not from 2010: Greece 2009, Cyprus 2007. Second-period data not from 2015: Bulgaria 2014, Poland 2014, Sweden 2014, Switzerland 2014.
101
3.2
2.3
2.3
2.7
3.7
3.5
2.6
4.3
2.4
2.3
4.1
3.4
2.9
3.4
3.5
2.9
2.5
3.0
2.4
4.0
3.3
3.1
2.0
2.8
3.8
3.6
3.4
1.8
2.7
2.1
3.1
2.0
2.4
3.1
3.4
3.0
2.7
4.8
2.4
1.4
3.4
2.9
3.9
3.7
2.5
2.2
2.4
2.5
2.5
3.6
3.6
3.5
2.1
3.0
3.2
2.9
2.6
2.0
2.3
2.5
2010
2015
Stillbirths per 1000 total births
Belgium
Denmark
Germany
Estonia
Ireland
Greece
Spain
France, Survey
Italy
Cyprus
Latvia
Lithuania
Luxembourg
Hungary
Malta
Netherlands
Austria
Poland
Portugal
Romania
Slovenia
Slovakia
Finland
Sweden
UK: England and Wales
UK: Scotland
UK: Northern Ireland
Iceland
Norway
Switzerland
0 1 2 3 4 5 6

C1.3 Comparison of stillbirth rates at and after 28 weeks, 2010 and 2015 (risk ratios and 95% confidence intervals)
NOTE: Overall random effects estimate 0.94 (95% CI: 0.89-99). I² = 65.3% Chi squared tests of heterogeneity = 83.61 (d.f. = 29), p<0.001. First-period data not from 2010: Greece 2009, Cyprus 2007. Second period data not from 2015: Poland 2014, Sweden 2014, Switzerland 2014.
EUROPEAN PERINATAL HEALTH REPORT
102
10 .5 1 21.5Risk ratios with 95% confidence intervals
Cyprus
Malta
UK: Northern Ireland
Netherlands
UK: Scotland
Latvia
Poland
UK: England and Wales
Greece
Norway
Denmark
Romania
Lithuania
Ireland
Belgium
Austria
Spain
Italy
Finland
Iceland
Portugal
Slovenia
Hungary
Germany
France, Survey
Sweden
Estonia
Slovakia
Switzerland
Luxembourg
0.63 (0.31, 1.28)
0.71 (0.32, 1.57)
0.75 (0.54, 1.03)
0.75 (0.65, 0.86)
0.79 (0.64, 0.97)
0.82 (0.59, 1.12)
0.84 (0.77, 0.91)
0.85 (0.64, 1.12)
0.85 (0.81, 0.90)
0.85 (0.73, 1.00)
0.86 (0.69, 1.08)
0.87 (0.68, 1.10)
0.90 (0.82, 1.00)
0.93 (0.78, 1.10)
0.95 (0.83, 1.09)
0.98 (0.80, 1.19)
1.03 (0.94, 1.12)
1.03 (0.95, 1.11)
1.05 (0.81, 1.35)
1.06 (0.41, 2.75)
1.07 (0.89, 1.28)
1.07 (0.77, 1.48)
1.08 (0.92, 1.26)
1.08 (1.01, 1.16)
1.10 (0.78, 1.55)
1.10 (0.95, 1.28)
1.14 (0.74, 1.73)
1.14 (0.93, 1.40)
1.16 (0.95, 1.42)
1.35 (0.75, 2.43)

C2 NEONATAL MORTALITY
JUSTIFICATIONThe neonatal mortality rate is a key indicator of health and care during pregnancy and birth. Neonatal deaths are deaths 0-27 days after live birth. They are often subdivided by timing of death into early neonatal deaths, 0-6 days after live birth, and late neonatal deaths, 7-27 days after live birth. The principal causes of neonatal death in high-income countries are congenital anomalies1 and complications associated with very preterm birth (see C5). Babies from multiple pregnancies have neonatal mortality rates 4-6 times higher than singletons, primarily because they are born at lower gestational ages.2 Neonatal deaths can also be associated with suboptimal care, including factors related to health care and the healthcare system. For very preterm births, birth in a maternity ward with an on-site neonatal intensive care unit is associated with lower mortality,3 while delivery in a less specialised maternity unit or in midwife-led care can offer women with uncomplicated pregnancies levels of adverse outcome that are at least as good, combined with lower intervention rates.4
The first European Perinatal Health Report showed wide variations in neonatal mortality rates in participating countries in 2004, and the second European Perinatal Health Report described their persistence in 2010.5, 6 In addition, countries differed in their patterns of early and late neonatal deaths. In 2004, new member states of the European Union had high early and late neonatal mortality rates, while in other countries patterns of either low early with high late or high early and low late rates were observed.7 Similar patterns persisted in 2010. Large declines in neonatal mortality rates in participating countries between 2004 and 2010 affected all gestational ages and were observed in both high- and low-mortality countries.8 Neonatal mortality rates due to congenital anomalies remained higher in some countries where terminations of pregnancy were not legal.9
The wide variation in gestational age-specific neonatal mortality rates at 22-23 weeks in 2004 suggested that not all births and deaths occurring very early in the neonatal period were systematically included, and this too persisted in 2010. This finding was unsurprising as even within countries, the reporting of births as stillbirths or live births at these extremely preterm gestational ages can show substantial heterogeneity that suggests differential reporting thresholds and practices.10 Variations in neonatal mortality rates between countries may also reflect differences in policies between European countries related to the resuscitation of babies at the limit of viability.10
DEFINITION AND PRESENTATION OF INDICATORSData on neonatal deaths are compiled by timing of death, gestational age, birth weight, and plurality and used to construct annual and cohort mortality rates. The annual neonatal mortality rate is defined as the number of deaths during the neonatal period after live birth at or after 22 completed weeks of gestation occurring during the year, expressed as a rate per 1000 live births in the same year. The cohort neonatal mortality rate is defined as the number of neonatal deaths among babies born at or after 22 completed weeks of gestation in a given year, expressed as a rate per 1000 live births in the same year. When gestational-age data were missing, births and deaths were included if they had a birth weight of at least 500 g. If both gestational age and birth weight were missing, the birth or death was not included. In some countries, however, births and deaths with missing gestational age and birth weight could be included if they were known to have occurred at 22 or more weeks of gestation.
103

Usually the annual and cohort neonatal death rates are very similar as they only reflect differences at the beginning and end of the year. However, differences can be more marked in countries with a small population or when comparing neonatal mortality rates by subgroups. To obtain cohort rates, information about births and deaths need to be available in the same source. Although not all countries currently have this data available, Euro-Peristat recommends this minimal linkage for all countries.11 This report provides both annual and cohort rates in the summary tables. When only one neonatal mortality rate is shown and both cohort and annual rates are available, we used the cohort rate.
DATA SOURCES AND AVAILABILITY OF INDICATORS IN EUROPEAN COUNTRIESAll participating countries were able to provide some data for neonatal deaths. Data were from 2014 in Bulgaria, Poland, Sweden, England and Wales, and Switzerland. Data about deaths but not births were available from UK confidential enquiries. Thirteen countries or regions provided only annual neonatal deaths, 12 provided both annual and cohort neonatal deaths, and 9 submitted only cohort neonatal death data. Differences among the 12 countries where annual and cohort neonatal mortality rates could be compared were minimal except in Scotland, where difficulties in linking deaths (in particular, early neonatal deaths) back to the corresponding birth record meant that the cohort neonatal mortality rate systematically underestimated the actual rate. For this reason, the annual neonatal mortality rate (produced from unlinked data and hence complete) is preferred for Scotland. Germany, Greece, Italy, Spain, and Portugal were unable to provide data on neonatal deaths by gestational age, and the data for Hungary divided all gestational ages into only two groups: 24-31 weeks and at and after 31 weeks. Germany, Greece, Spain, Italy, and Portugal were unable to contribute data by birth weight, and Bulgaria, Germany, Greece, Spain, and Hungary could not contribute data by plurality. Data from Ireland concerned only early neonatal deaths.
In many countries, there were no or few (<4%) missing data for the gestational age of neonatal deaths. Exceptions included Belgium (5.8%), the Czech Republic (6.5%), Luxembourg (22.2%), and Romania (20.5%). In France, 14.0% of the data were missing, but Euro-Peristat received data corrected for the missing cases. Proportions of missing birthweight data greater than 4% were reported in Belgium (6.3%), Denmark (10.1%), France (13.1%), Lithuania (4.1%), Luxembourg (27.3%), and England and Wales (12.0%). Cases with missing data are not included when a gestational age or birthweight limit is imposed, therefore rates in countries with high missing data rates should be interpreted with caution. For countries with more than 10% missing for gestational age, we estimate rates corrected for missing cases in the text below.
METHODOLOGICAL ISSUES IN THE CALCULATION, REPORTING, AND INTERPRETATION OF THE INDICATORSComparisons of neonatal mortality rates at early gestational ages must be combined with analyses of fetal mortality rates, since it is possible that some early neonatal deaths may be recorded as fetal deaths and vice versa. Some registration and data recording systems impose a lower limit of 500 grams for inclusion of births. This can create limitations in comparing neonatal mortality rates at low gestational ages. Nonetheless, because of the differences in the recording of births before 24 weeks, Euro-Peristat recommends that comparative analyses use a 24-week threshold.7, 12
Neonatal deaths are rare events. Therefore, in countries with a small number of annual births, such as Cyprus, Iceland, Luxembourg, and Malta, year-to-year random fluctuations are naturally greater and the confidence intervals around their rates wide.
EUROPEAN PERINATAL HEALTH REPORT
104

RESULTSNeonatal mortality rates ranged from 1.2 per 1000 live births in Iceland to 4.3 per 1000 in Romania and 4.4 per 1000 in Bulgaria, as seen in Figure C2.1, which shows neonatal mortality rates subdivided by timing of death into early and late neonatal mortality rates. Between 63.3 and 87.5% of all neonatal deaths in participating countries occurred during the early neonatal period. In Bulgaria and Romania, late neonatal mortality rates exceeded 1.0 per 1000 live births.
After the exclusion of births and deaths before 24 weeks of gestation, neonatal mortality rates ranged from 0.4 per 1000 live births in Slovenia to 4.3 in Bulgaria, as shown in Figure C2.2. Bulgaria, Malta, Romania, and Northern Ireland had rates exceeding 3.0 per 1000 at gestations of 24 weeks or more. In contrast, the Czech Republic, Denmark, Estonia, Cyprus, Luxembourg, Austria, Slovenia, Finland, Sweden, Norway, and Iceland had rates below 1.5 per 1000 live births. Note that some countries had high proportions of missing data for gestational age, which led to excluding some cases from these rates. If data are corrected, under the assumption that missing data are distributed according to the observed gestational age distribution, rates at or over 24 weeks of gestation are: 1.7 instead of 1.6 in Belgium, 1.3 instead of 1.2 in the Czech Republic, 1.4 instead of 1.2 in Luxembourg, and 4.2 instead of 3.5 in Romania. Countries where terminations of pregnancy were either not legal, as in Malta and the Irish Republic, or not usually available, as in Northern Ireland, were among those with high neonatal mortality rates, probably attributable to deaths from lethal congenital anomalies.
Babies born before 28 weeks of gestation or weighing less than 1000 grams accounted for approximately 40% of all neonatal deaths, as shown in Figure C2.3, which combines all countries for which data were available for neonatal deaths at or after 22 weeks of gestation. Data were not available by gestational age for Germany, Ireland, Greece, Spain, Italy, Portugal, or Scotland. Slightly over a quarter of the deaths were of term babies, while 18.9% were born at 22-23 weeks of gestation and 12.8% had a birth weight less than 500 grams.
COMPARISON WITH 2010 DATA Comparisons of neonatal mortality rates at or after 24 completed weeks of gestation in 2010 and 2015 were possible for 22 European countries and are presented in Figures C2.4 and C2.5. Neonatal mortality rates declined in most countries. The largest absolute decreases in rates were seen in Slovenia, Latvia, Malta, Romania, and Poland. With the exception of Slovenia, these countries had higher rates in 2010 than many other European countries. When viewed as percentage changes, as in Figure C2.5, Slovenia, Iceland, Latvia, Norway, and the Czech Republic reduced their rates by 25% or more. However, the confidence interval in Iceland was wide, and the difference not significant. The pooled estimate of the risk ratio between 2010 and 2015 for neonatal mortality at or after 24 weeks was 0.85 (95% confidence interval 0.80-0.91) in the 22 countries that could provide data. This risk ratio was negative, but less pronounced for neonatal mortality at or after 22 weeks of gestation in 26 countries providing data. Heterogeneity between the countries was significant in both comparisons.
105
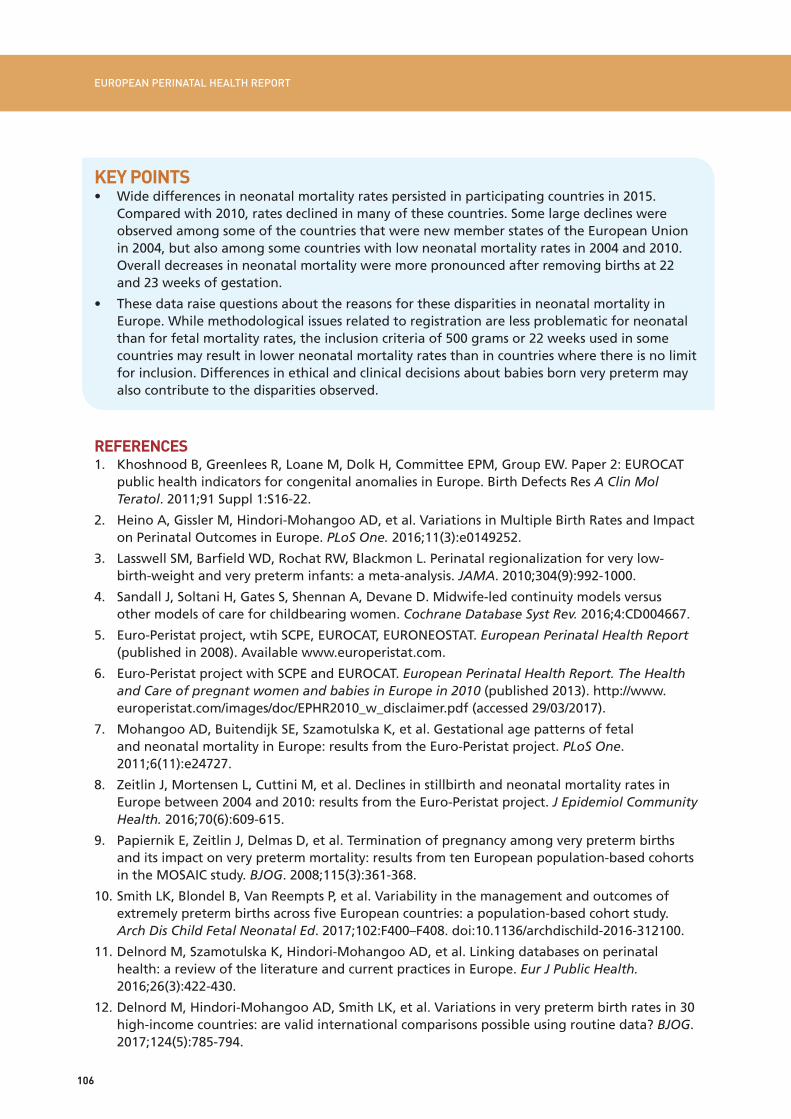
KEY POINTS• Widedifferencesinneonatalmortalityratespersistedinparticipatingcountriesin2015.
Compared with 2010, rates declined in many of these countries. Some large declines were observed among some of the countries that were new member states of the European Union in 2004, but also among some countries with low neonatal mortality rates in 2004 and 2010. Overall decreases in neonatal mortality were more pronounced after removing births at 22 and 23 weeks of gestation.
• ThesedataraisequestionsaboutthereasonsforthesedisparitiesinneonatalmortalityinEurope. While methodological issues related to registration are less problematic for neonatal than for fetal mortality rates, the inclusion criteria of 500 grams or 22 weeks used in some countries may result in lower neonatal mortality rates than in countries where there is no limit for inclusion. Differences in ethical and clinical decisions about babies born very preterm may also contribute to the disparities observed.
REFERENCES1. Khoshnood B, Greenlees R, Loane M, Dolk H, Committee EPM, Group EW. Paper 2: EUROCAT
public health indicators for congenital anomalies in Europe. Birth Defects Res A Clin Mol Teratol.2011;91Suppl1:S16-22.
2. Heino A, Gissler M, Hindori-Mohangoo AD, et al. Variations in Multiple Birth Rates and Impact on Perinatal Outcomes in Europe. PLoS One.2016;11(3):e0149252.
3. Lasswell SM, Barfield WD, Rochat RW, Blackmon L. Perinatal regionalization for very low-birth-weight and very preterm infants: a meta-analysis. JAMA.2010;304(9):992-1000.
4. Sandall J, Soltani H, Gates S, Shennan A, Devane D. Midwife-led continuity models versus other models of care for childbearing women. Cochrane Database Syst Rev.2016;4:CD004667.
5. Euro-Peristat project, wtih SCPE, EUROCAT, EURONEOSTAT. European Perinatal Health Report (published in 2008). Available www.europeristat.com.
6. Euro-Peristat project with SCPE and EUROCAT. European Perinatal Health Report. The Health and Care of pregnant women and babies in Europe in 2010 (published 2013). http://www.europeristat.com/images/doc/EPHR2010_w_disclaimer.pdf (accessed 29/03/2017).
7. Mohangoo AD, Buitendijk SE, Szamotulska K, et al. Gestational age patterns of fetal and neonatal mortality in Europe: results from the Euro-Peristat project. PLoS One. 2011;6(11):e24727.
8. Zeitlin J, Mortensen L, Cuttini M, et al. Declines in stillbirth and neonatal mortality rates in Europe between 2004 and 2010: results from the Euro-Peristat project. J Epidemiol Community Health.2016;70(6):609-615.
9. Papiernik E, Zeitlin J, Delmas D, et al. Termination of pregnancy among very preterm births and its impact on very preterm mortality: results from ten European population-based cohorts in the MOSAIC study. BJOG.2008;115(3):361-368.
10. Smith LK, Blondel B, Van Reempts P, et al. Variability in the management and outcomes of extremely preterm births across five European countries: a population-based cohort study. Arch Dis Child Fetal Neonatal Ed.2017;102:F400–F408.doi:10.1136/archdischild-2016-312100.
11. Delnord M, Szamotulska K, Hindori-Mohangoo AD, et al. Linking databases on perinatal health: a review of the literature and current practices in Europe. Eur J Public Health. 2016;26(3):422-430.
12. Delnord M, Hindori-Mohangoo AD, Smith LK, et al. Variations in very preterm birth rates in 30 high-income countries: are valid international comparisons possible using routine data? BJOG. 2017;124(5):785-794.
EUROPEAN PERINATAL HEALTH REPORT
106
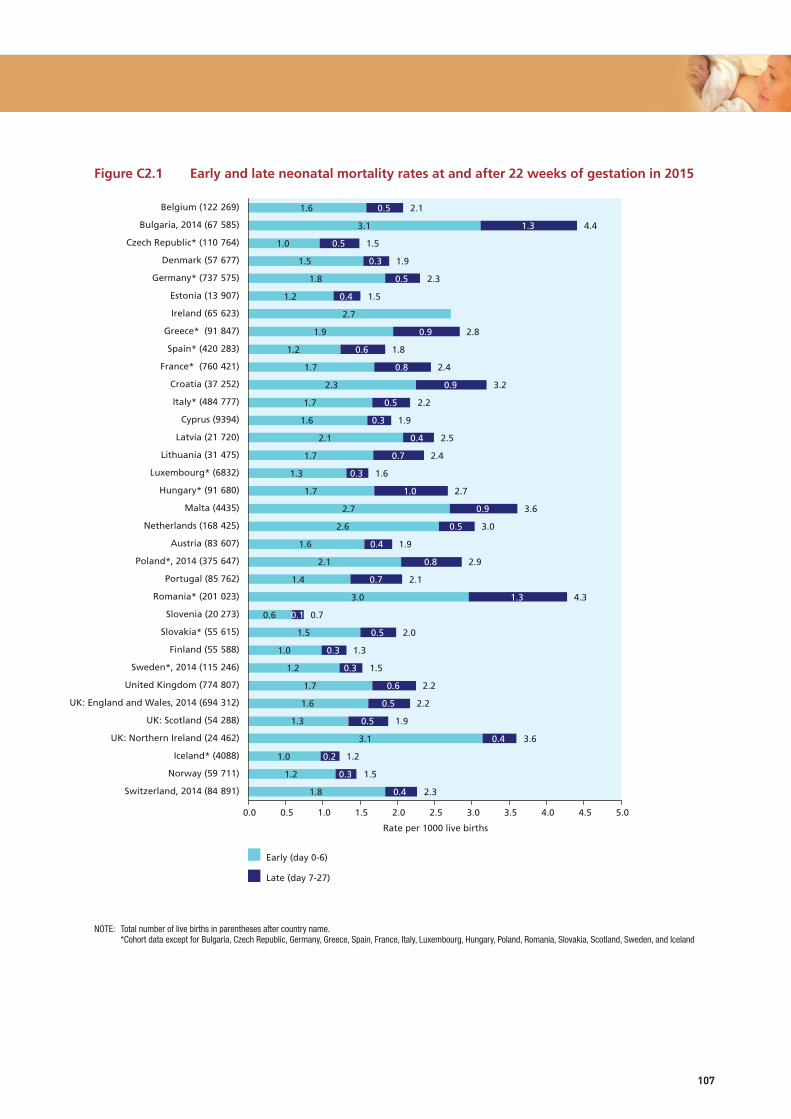
Figure C2.1 Early and late neonatal mortality rates at and after 22 weeks of gestation in 2015
NOTE: Total number of live births in parentheses after country name. *Cohort data except for Bulgaria, Czech Republic, Germany, Greece, Spain, France, Italy, Luxembourg, Hungary, Poland, Romania, Slovakia, Scotland, Sweden, and Iceland
107
Early (day 0-6)
Late (day 7-27)
Rate per 1000 live births
Switzerland, 2014 (84-891)
Norway (59-711)
Iceland* (4088)
UK: Northern Ireland (24-462)
UK: Scotland (54-288)
UK: England and Wales, 2014 (694-312)
United Kingdom (774-807)
Sweden*, 2014 (115-246)
Finland (55-588)
Slovakia* (55-615)
Slovenia (20 273)
Romania* (201-023)
Portugal (85 762)
Poland*, 2014 (375-647)
Austria (83-607)
Netherlands (168-425)
Malta (4435)
Hungary* (91-680)
Luxembourg* (6832)
Lithuania (31-475)
Latvia (21-720)
Cyprus (9394)
Italy* (484-777)
Croatia (37-252)
France* (760-421)
Spain* (420-283)
Greece* (91-847)
Ireland (65-623)
Estonia (13-907)
Germany* (737-575)
Denmark (57-677)
Czech Republic* (110-764)
Bulgaria, 2014 (67-585)
Belgium (122-269)
0.0 0.5 1.0 1.5 2.0 2.5 3.0 3.5 4.0 4.5 5.0
1.8
1.2
1.0
3.1
1.3
1.6
1.7
1.2
1.0
1.5
0.6
3.0
1.4
2.1
1.6
2.6
2.7
1.7
1.3
1.7
2.1
1.6
1.7
2.3
1.7
1.2
1.9
2.7
1.2
1.8
1.5
1.0
3.1
1.6
0.4
0.3
0.2
0.4
0.5
0.5
0.6
0.3
0.3
0.5
0.1
1.3
0.7
0.8
0.4
0.5
0.9
1.0
0.3
0.7
0.4
0.3
0.5
0.9
0.8
0.6
0.9
0.4
0.5
0.3
0.5
1.3
0.5
2.3
1.5
1.2
3.6
1.9
2.2
2.2
1.5
1.3
2.0
0.7
4.3
2.1
2.9
1.9
3.0
3.6
2.7
1.6
2.4
2.5
1.9
2.2
3.2
2.4
1.8
2.8
1.5
2.3
1.9
1.5
4.4
2.1

Figure C2.2 Neonatal mortality rates at and after 22 and 24 weeks of gestation in 2015
NOTE: * More than 5% data missing for gestational age: Belgium (5.8%), the Czech Republic (6.5%), Luxembourg (22.2%), Romania (20.5%); see text for estimated corrected rates. These cases are excluded from rates calculated for births 24 weeks and later.
EUROPEAN PERINATAL HEALTH REPORT
108
Belgium*
Bulgaria, 2014
Czech Republic*
Denmark
Germany
Estonia
Ireland
Greece
Spain
France
Croatia
Italy
Cyprus
Latvia
Lithuania
Luxembourg*
Hungary
Malta
Netherlands
Austria
Poland, 2014
Portugal
Romania*
Slovenia
Slovakia
Finland
Sweden, 2014
United Kingdom
UK: England and Wales, 2014
UK: Scotland
UK: Northern Ireland
Iceland
Norway
Switzerland, 2014
0.0 0.5 1.0 1.5 2.0 2.5 3.0 3.5 4.0 4.5 5.0
22 weeks or more
24 weeks or more
2.1
4.4
1.5
1.9
2.3
1.5
2.8
1.8
2.4
3.2
2.2
1.9
2.5
2.4
1.6
2.7
3.6
3.0
1.9
2.9
2.1
4.3
0.7
2.0
1.3
1.5
2.2
2.2
1.9
3.6
1.2
1.5
2.3
1.6
4.3
1.2
1.4
1.2
2.1
2.7
1.3
2.2
2.0
1.2
2.4
3.2
2.0
1.4
2.4
3.5
0.4
1.9
1.2
1.3
1.6
3.3
0.5
1.2
1.8

Figure C2.3 Distribution of neonatal deaths by gestational age (A) and by birth weight (B) for all births at and after 22 weeks of gestation for all countries contributing data in 2015
A. By gestational age group B. By birthweight group
109
Neonatal deaths
Weeks
0%
10%
20%
30%
40%
50%
60%
70%
80%
90%
100%
22-23
24-27
28-31
32-36
> 37
18.9
26.3
12.1
16.2
26.5
Grams
Neonatal deaths 0%
10%
20%
30%
40%
50%
60%
70%
80%
90%
100%
<500
500-999
1000-1499
1500-2499
2500
12.8
36.0
10.4
16.6
23.9

EUROPEAN PERINATAL HEALTH REPORT
110
C2.4 Neonatal mortality rates at and after 24 weeks of gestation in 2010 and 2015
NOTE: First-period data not from 2010: Greece 2009, Cyprus 2007. Second-period data not from 2015: Bulgaria 2014, Poland 2014, Sweden 2014, Switzerland 2014, UK: England and Wales 2014.
10.6
12
3.1
7.6
2.5
2.6
3.3
2.9
3.4
4.0
2.7
3.5
3.8
3.1
2.1
4.3
3.5
2.3
4.2
5.2
3.5
2.3
4.2
3.0
7.4
1.7
2.0
1.7
2.3
3.2
2.9
5.1
1.5
2.2
3.0
2.7
1.8
2.1
2.5
3.3
1.5
3.8
1.2
4.7
2.8
1.8
3.7
5.4
1.3
1.9
1.5
2.0
2.7
0.7
1.9
2.5
0 1 2 3 4 5 6 7 8 9
Belgium (122,240)
Bulgaria, 2014 (67,585)
Czech Republic (110,764)
Denmark (57,677)
Germany (737,575)
Estonia (13,907)
Ireland (65,623)
Greece (91,847)
Spain (420,283)
France (760,421)
Croatia (37,252)
Italy (484,777)
Cyprus (9,394)
Latvia (21,720)
Lithuania (31,475)
Luxembourg (6,832)
Hungary (91,680)
Malta (4,435)
Netherlands (168,425)
Austria (83,607)
Poland, 2014 (375,647)
Portugal (85,762)
Romania (201,023)
Slovenia (20,273)
Slovakia (55,615)
Finland (55,588)
Sweden, 2014 (115,246)
United Kingdom
UK: England and Wales, 2014 (694,312)
UK: Scotland (54,288)
UK: Northern Ireland (24,462)
Iceland (4,088)
Norway (59,711)
Switzerland, 2014 (84,891)
Rate per 1000 live births 2010
2015
1.9
1.6
1.5
1.3
2.1
3.3
2.3
1.2
4.0
2.2
1.7
3.1
4.3
1.1
1.8
1.3
1.3
2.0
3.0
0.8
1.6
1.9
1.6
1.2
1.4
1.2
2.1
2.2
2.0
1.2
3.2
2.0
1.4
2.4
3.5
0.4
1.9
1.2
1.3
1.6
3.3
0.5
1.2
1.8
0 1 2 3 4 5
Belgium
Czech Republic
Denmark
Estonia
France
Latvia
Lithuania
Luxembourg
Malta
Netherlands
Austria
Poland
Romania
Slovenia
Slovakia
Finland
Sweden
UK: England and Wales
UK: Northern Ireland
Iceland
Norway
Switzerland

111
C2.5 Comparison of neonatal mortality rates at and after 24 weeks of gestation, 2010 and 2015 (risk ratios and 95% confidence intervals)
NOTE: Pooled random effects estimate 0.85 (95% CI: 0.80-91). I² = 50.7% Chi squared tests of heterogeneity = 42.57 (d.f. = 21), p=0.004. Second period data not from 2015: Poland 2014, Sweden 2014, Switzerland 2014, UK: England and Wales 2014.
10 .5 1 1.5 2Risk ratios with 95% confidence intervals
Slovenia
Iceland
Latvia
Norway
Czech Republic
Poland
Malta
Austria
Romania
UK: England and Wales
Belgium
Netherlands
Lithuania
Finland
Denmark
Switzerland
Luxembourg
Estonia
France
Sweden
Slovakia
UK: Northern Ireland
0.35 (0.16, 0.78)
0.60 (0.11, 3.26)
0.67 (0.46, 0.98)
0.73 (0.54, 0.99)
0.74 (0.59, 0.93)
0.79 (0.73, 0.86)
0.79 (0.39, 1.62)
0.81 (0.63, 1.04)
0.82 (0.74, 0.90)
0.84 (0.77, 0.91)
0.84 (0.70, 1.02)
0.89 (0.77, 1.04)
0.90 (0.64, 1.26)
0.91 (0.65, 1.26)
0.94 (0.70, 1.26)
0.95 (0.75, 1.19)
0.95 (0.36, 2.54)
0.97 (0.51, 1.84)
0.99 (0.93, 1.06)
1.01 (0.80, 1.27)
1.08 (0.82, 1.42)
1.10 (0.80, 1.51)

EUROPEAN PERINATAL HEALTH REPORT
112
C2.6 Comparison of neonatal mortality rates at and after 22 weeks of gestation, 2010 and 2015 (risk ratios and 95% confidence intervals)
NOTE: Pooled random effects estimate: 0.90 (95% CI: 0.85-0.94). I-squared = 66.8% Chi squared tests of heterogeneity = 87.39 (d.f. = 29), p < 0.001. First-period data not from 2010: Cyprus 2007. Second-period data not from 2015: Poland 2014, Sweden 2014, Switzerland 2014, UK: England and Wales 2014.
10 .5 1 21.5Risk ratios with 95% confidence intervals
Slovenia
Latvia
UK: Scotland
Hungary
Romania
Estonia
Malta
Poland
UK: England and Wales
Spain
Finland
Luxembourg
Italy
Lithuania
Czech Republic
Switzerland
Austria
Netherlands
Norway
Belgium
UK: Northern Ireland
Sweden
Denmark
Iceland
Germany
France
Slovakia
Greece
Cyprus
Portugal
0.41 (0.23, 0.75)
0.69 (0.48, 0.98)
0.75 (0.58, 0.96)
0.77 (0.65, 0.91)
0.78 (0.72, 0.85)
0.80 (0.46, 1.39)
0.81 (0.41, 1.58)
0.82 (0.75, 0.88)
0.85 (0.80, 0.91)
0.87 (0.79, 0.96)
0.87 (0.64, 1.19)
0.87 (0.39, 1.98)
0.88 (0.81, 0.95)
0.88 (0.65, 1.21)
0.88 (0.72, 1.09)
0.89 (0.73, 1.08)
0.89 (0.72, 1.11)
0.92 (0.82, 1.03)
0.93 (0.70, 1.24)
0.95 (0.80, 1.13)
0.96 (0.72, 1.28)
0.98 (0.80, 1.20)
0.98 (0.76, 1.27)
1.00 (0.30, 3.26)
1.01 (0.94, 1.08)
1.04 (0.98, 1.11)
1.08 (0.82, 1.41)
1.14 (0.97, 1.35)
1.17 (0.58, 2.36)
1.25 (1.02, 1.55)
113
C3 INFANT MORTALITY
JUSTIFICATIONThe infant mortality rate, which measures the number of deaths before one year of age after live birth per 1000 live births, is a widely used measure of population health. Although it extends beyond the perinatal period, the Euro-Peristat group includes infant mortality as a core indicator because it reflects the longer-term consequences of perinatal morbidity. Measuring deaths beyond the neonatal period is particularly relevant for very preterm or low birthweight babies or babies with congenital anomalies, as they remain at higher risk of death throughout their first year of life.1,2 While most infant deaths attributable to perinatal causes occur soon after birth, some very ill babies admitted to neonatal units may survive the neonatal period but die later in their first year of life. Furthermore, developments in neonatal care for these high-risk babies can influence the proportions of infant deaths occurring after the neonatal period and affect comparisons of mortality over time and between countries.3 In a study of all US full term infant deaths in 2010-2012, perinatal conditions and congenital anomalies accounted for almost 99% of all early neonatal deaths and almost two thirds of late neonatal deaths. Nonetheless, 63.5% of infant deaths occurred during the post-neonatal period, and 60% of them were due to sudden unexpected death in infancy, while perinatal conditions and congenital anomalies accounted for barely 20%.4 The post-neonatal mortality rate is more highly correlated with social factors than the neonatal mortality rate is.5 Infant mortality is therefore an indicator of both the quality of medical care and the effectiveness of services and policies aimed at the reduction of health inequalities.
DEFINITION AND PRESENTATION OF INDICATORData about infant deaths are compiled on both an annual and a cohort basis, subdivided by gestational age, birth weight, and plurality. They are presented in Summary Table C3. The annual infant mortality rate is defined as the number of infant deaths 0-364 days after live birth at or after 22 completed weeks of gestation occurring in 2015, expressed as a rate per 1000 live births occurring in 2015. The cohort infant mortality rate is defined as the number of deaths 0-364 days after live birth at or after 22 completed weeks of gestation among babies born in 2015, expressed as a rate per 1000 live births in 2015. Euro-Peristat inclusion rules state that when gestational age is missing, deaths should be included if the birth weight is equal to or over 500 grams. To standardise comparisons, Euro-Peristat also calculates the infant mortality rate after removing births at very early gestational ages (22 and 23 weeks, see C2 for full discussion).
DATA SOURCES AND AVAILABILITY OF INDICATOR IN EUROPEAN COUNTRIESAll countries provided data on the infant mortality rate. Data from Bulgaria, Poland, Sweden, England and Wales, and Switzerland were from 2014. As with neonatal mortality, we used cohort mortality rates when these were available (Austria, Belgium, Croatia, Cyprus, Denmark, Estonia, Finland, Latvia, Lithuania, Malta, Norway, Slovenia, Switzerland, and the countries of the UK). For other countries we used annual rates. For the countries that had both (Croatia, Cyprus, Estonia, Austria, Finland, Latvia, Lithuania, Norway, and Switzerland), differences were small except in Scotland, as mentioned In section C2, above, Scotland’s difficulties in linking deaths (in particular early neonatal deaths) back to the corresponding birth record meant that the cohort infant mortality rate systematically underestimated the actual rate. For this reason, the annual infant mortality rate (produced from unlinked data and hence complete) is preferred for Scotland. Of the 33 participating countries, 23 countries were able to provide infant mortality rates subdivided by gestational age and 24 by birth weight, numbers similar to those able to provide these data in 2010.

EUROPEAN PERINATAL HEALTH REPORT
114
Most countries had small proportions of missing data for gestational age (<3%), with some exceptions in Romania (26.3% of deaths had gestational age missing), the Czech Republic (19.1%), and Luxembourg (43.8%, but few deaths). Cases with missing data are not included when a gestational age or birthweight limit is imposed, therefore rates in countries with high rates of missing data should be interpreted cautiously. For countries with more than 10% missing data for gestational age, we provide an estimate of corrected rates in the text below.
METHODOLOGICAL ISSUES IN THE CALCULATION, REPORTING, AND INTERPRETATION OF THE INDICATORMost participating countries had no lower gestational age or birthweight limit for registration of live births in 2015. This made it possible to provide data about live births based on the Euro-Peristat definition of 22+ weeks of gestation for countries that collect infant deaths by gestational age. A few countries specified limits – France, where live birth registration starts at 22 weeks or 500 grams, and Ireland, where the published reports include data only on births 500 grams or more, although live births with lower birth weights can be registered legally and were provided to Euro-Peristat when born at or after the 22 week of gestation limit. In Norway, live births and stillbirths are registered starting at 16 weeks of gestation, but births before 22 weeks with a birth weight under 500 grams are considered to be spontaneous abortions.
In many European countries, data about infant deaths after the perinatal period come from general death registration systems, which do not usually include information about birth characteristics. If gestational age is not recorded it is not possible to check adherence to the Euro-Peristat inclusion criteria or to undertake more complete analyses of the infant mortality rate. For this reason Euro-Peristat strongly recommends linking birth and death records to obtain complete information about infant deaths by gestational age, birth weight, and plurality.6
An additional note concerns Luxembourg, where it is estimated that about 14% of child deaths occur abroad, reflecting transfer for care to specialized centres in neighbouring countries. Cause of death registers are not notified about these deaths and they are not included in the statistics presented here.
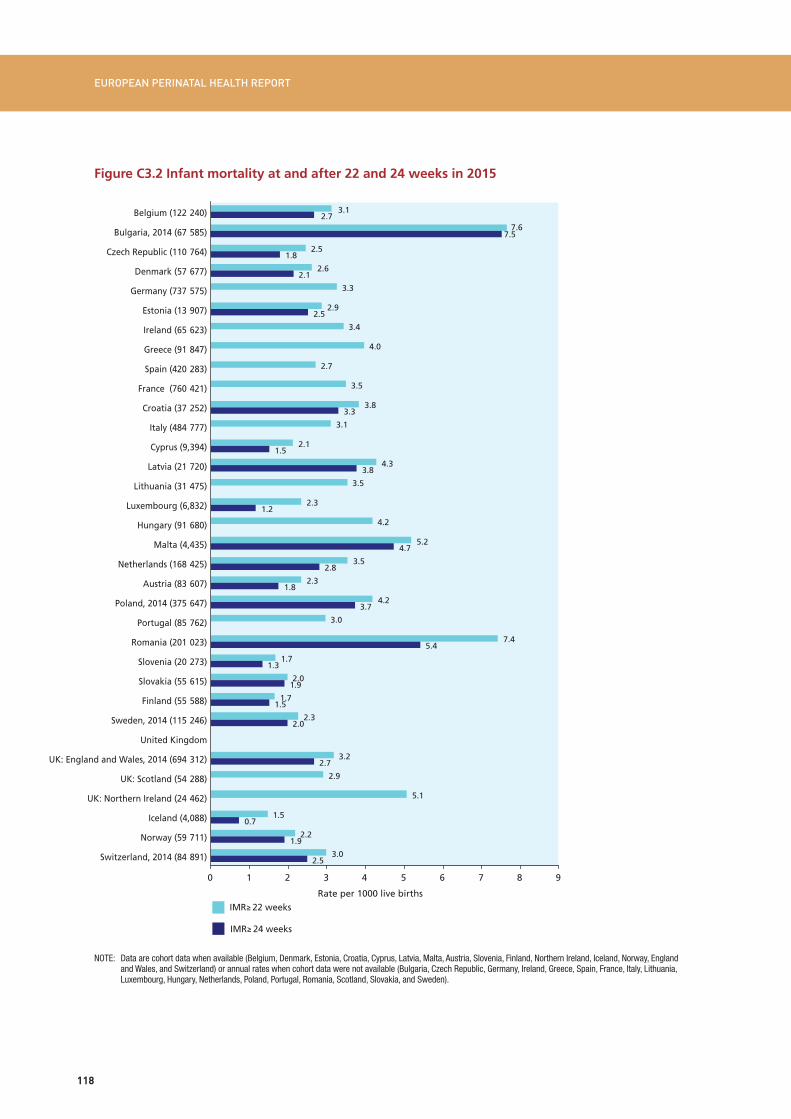
RESULTSAs shown in Figure C3.1, infant mortality rates at or after 22 completed weeks of gestation in 2015 varied widely, ranging from 1.5 per 1000 live births in Iceland to 5.2 in Malta, 5.1 in Northern Ireland, 7.4 in Romania, and 7.6 in Bulgaria. The median rate was 3.1, with an IQR of 2.3 to 3.8. Bulgaria and Romania, relatively new members of the European Union, had very high infant mortality rates, similar to those observed among the new member states of the European Union in the 2004 data collection. Although not at this level, rates were high in Malta, where termination of pregnancy is illegal, and in Northern Ireland, where the legislation enabling legal abortion in the rest of the UK does not apply.
When infant mortality rates were computed with a threshold of 24 weeks, rates were reduced by between 0.1 and 0.7 per 1000 live births. For the 21 countries that could provide this information, the median infant mortality rate with this threshold was 2.3 with an IQR of 1.8 to 3.3. Among these countries taken together, 12.1% of infant deaths thus occurred after live birth at 22 and 23 weeks. Six point one percent of infant deaths involved babies who weighed less than 500 grams at birth. Overall two thirds of all deaths were of babies born before term or with a birth weight less than 2500 grams. Note that some countries had high proportions
115
of missing data for gestational age, which resulted in the exclusion of some cases from these rates. If data are corrected, under the assumption that missing data are distributed according to the observed gestational age distribution, rates at or after 24 weeks of gestation are: 2.1 instead of 1.8 in the Czech Republic, 1.7 instead of 1.2 in Luxembourg, and 6.8 instead of 5.4 in Romania.
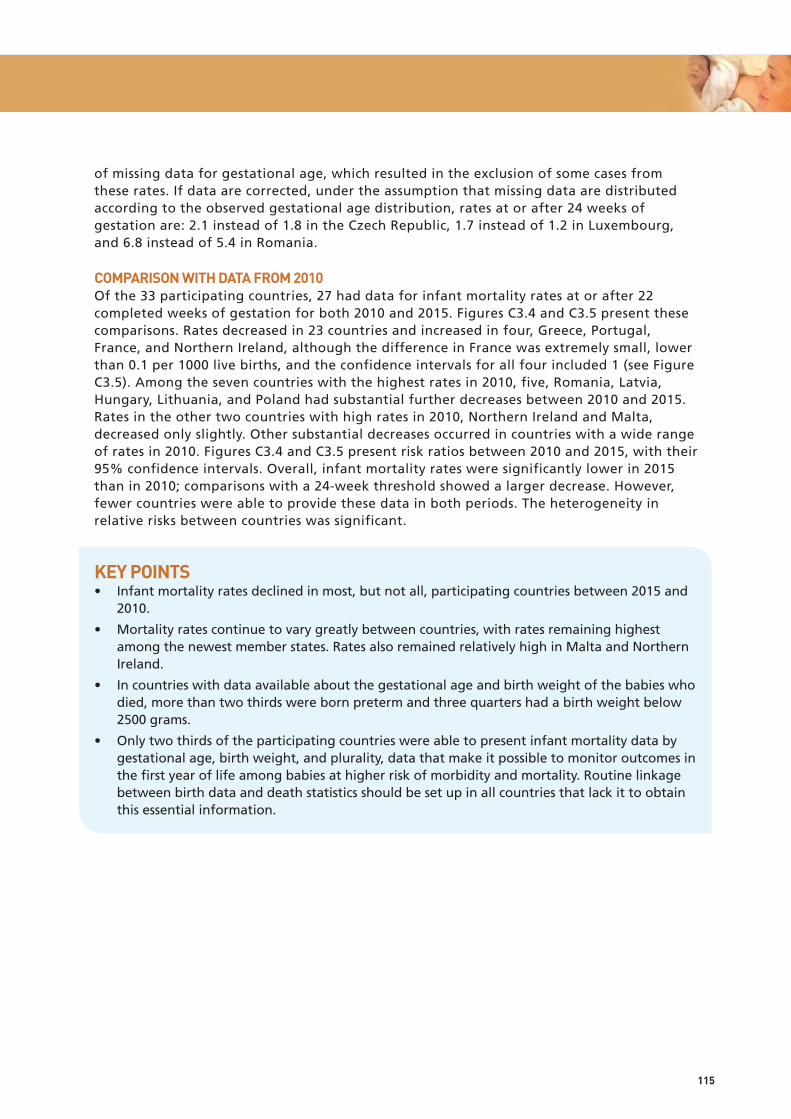
COMPARISON WITH DATA FROM 2010 Of the 33 participating countries, 27 had data for infant mortality rates at or after 22 completed weeks of gestation for both 2010 and 2015. Figures C3.4 and C3.5 present these comparisons. Rates decreased in 23 countries and increased in four, Greece, Portugal, France, and Northern Ireland, although the difference in France was extremely small, lower than 0.1 per 1000 live births, and the confidence intervals for all four included 1 (see Figure C3.5). Among the seven countries with the highest rates in 2010, five, Romania, Latvia, Hungary, Lithuania, and Poland had substantial further decreases between 2010 and 2015. Rates in the other two countries with high rates in 2010, Northern Ireland and Malta, decreased only slightly. Other substantial decreases occurred in countries with a wide range of rates in 2010. Figures C3.4 and C3.5 present risk ratios between 2010 and 2015, with their 95% confidence intervals. Overall, infant mortality rates were significantly lower in 2015 thanin2010;comparisonswitha24-weekthresholdshowedalargerdecrease.However,fewer countries were able to provide these data in both periods. The heterogeneity in relative risks between countries was significant.
KEY POINTS• Infantmortalityratesdeclinedinmost,butnotall,participatingcountriesbetween2015and
2010.
• Mortalityratescontinuetovarygreatlybetweencountries,withratesremaininghighestamong the newest member states. Rates also remained relatively high in Malta and Northern Ireland.
• Incountrieswithdataavailableaboutthegestationalageandbirthweightofthebabieswhodied, more than two thirds were born preterm and three quarters had a birth weight below 2500 grams.
• Onlytwothirdsoftheparticipatingcountrieswereabletopresentinfantmortalitydatabygestational age, birth weight, and plurality, data that make it possible to monitor outcomes in the first year of life among babies at higher risk of morbidity and mortality. Routine linkage between birth data and death statistics should be set up in all countries that lack it to obtain this essential information.

EUROPEAN PERINATAL HEALTH REPORT
116
REFERENCES 1. MacDorman MF, Matthews TJ, Mohangoo AD, et al. International comparisons of infant
mortality and related factors: United States and Europe, 2010. Natl Vital Stat Rep. 2014;63(5):1-6.
2. Watkins WJ, Kotecha SJ, Kotecha S. All-Cause Mortality of Low Birthweight Infants in Infancy, Childhood, and Adolescence: Population Study of England and Wales. PLoS Med. 2016;13(5):e1002018.doi:10.1371/journal.pmed.1002018.
3. Helenius K, Sjors G, Shah PS, et al. Survival in Very Preterm Infants: An International Comparison of 10 National Neonatal Networks. Pediatrics.2017;140(6)doi:10.1542/peds.2017-1264.
4. Bairoliya N, Fink G. Causes of death and infant mortality rates among full-term births in the United States between 2010 and 2012: An observational study. PLoS Med. 2018;15(3):e1002531.doi:10.1371/journal.pmed.1002531.
5. Singh GK, Kogan MD. Persistent socioeconomic disparities in infant, neonatal, and postneonatal mortality rates in the United States, 1969-2001. Pediatrics.2007;119(4):e928-39.doi: 10.1542/peds.2005-2181.
6. Delnord M, Szamotulska K, Hindori-Mohangoo AD, et al. Linking databases on perinatal health: a review of the literature and current practices in Europe. Eur J Public Health. 2016;26(3):422-30.doi:10.1093/eurpub/ckv231.

117
Figure C3.1 Infant mortality rates at and after 22 weeks of gestation in 2015
Note: Data are cohort data when available (Belgium, Denmark, Estonia, Croatia, Cyprus, Latvia, Malta, Austria, Slovenia, Finland, Northern Ireland, Iceland, Norway, England and Wales, and Switzerland) or annual rates when cohort data were not provided (Bulgaria, Czech Republic, Germany, Ireland, Greece, Spain, France, Italy, Lithuania, Luxembourg, Hungary, Netherlands, Poland, Portugal, Romania, Slovakia, and Sweden) and for Scotland due to incomplete reporting for cohort deaths. The total number of live births is given in parentheses after country name; data from Bulgaria, Poland, Sweden, and Switzerland are from 2014.
10.6
12
Rate per 1000 live births
3.1
7.6
2.5
2.6
3.3
2.9
3.4
4.0
2.7
3.5
3.8
3.1
2.1
4.3
3.5
2.3
4.2
5.2
3.5
2.3
4.2
3.0
7.4
1.7
2.0
1.7
2.3
3.2
2.9
5.1
1.5
2.2
3.0
0.0 1.0 2.0 3.0 4.0 5.0 6.0 7.0 8.0 9.0
Belgium (122-240)
Bulgaria, 2014 (67-585)
Czech Republic (110-764)
Denmark (57-677)
Germany (737-575)
Estonia (13-907)
Ireland (65-623)
Greece (91-847)
Spain (420-283)
France (760-421)
Croatia (37-252)
Italy (484-777)
Cyprus (9394)
Latvia (21-720)
Lithuania (31-475)
Luxembourg (6832)
Hungary (91-680)
Malta (4435)
Netherlands (168-425)
Austria (83-607)
Poland, 2014 (375-647)
Portugal (85-762)
Romania (201-023)
Slovenia (20-273)
Slovakia (55-615)
Finland (55-588)
Sweden, 2014 (115-246)
United Kingdom
UK: England and Wales, 2014 (694-312)
UK: Scotland (54-288)
UK: Northern Ireland (24-462)
Iceland (4088)
Norway (59-711)
Switzerland, 2014 (84-891)
EUROPEAN PERINATAL HEALTH REPORT
118
Figure C3.2 Infant mortality at and after 22 and 24 weeks in 2015
NOTE: Data are cohort data when available (Belgium, Denmark, Estonia, Croatia, Cyprus, Latvia, Malta, Austria, Slovenia, Finland, Northern Ireland, Iceland, Norway, England and Wales, and Switzerland) or annual rates when cohort data were not available (Bulgaria, Czech Republic, Germany, Ireland, Greece, Spain, France, Italy, Lithuania, Luxembourg, Hungary, Netherlands, Poland, Portugal, Romania, Scotland, Slovakia, and Sweden).
10.6
12
3.1
7.6
2.5
2.6
3.3
2.9
3.4
4.0
2.7
3.5
3.8
3.1
2.1
4.3
3.5
2.3
4.2
5.2
3.5
2.3
4.2
3.0
7.4
1.7
2.0
1.7
2.3
3.2
2.9
5.1
1.5
2.2
3.0
2.7
1.8
2.1
2.5
3.3
1.5
3.8
1.2
4.7
2.8
1.8
3.7
5.4
1.3
1.9
1.5
2.0
2.7
0.7
1.9
2.5
0 1 2 3 4 5 6 7 8 9
Belgium (122-240)
Bulgaria, 2014 (67-585)
Czech Republic (110-764)
Denmark (57-677)
Germany (737-575)
Estonia (13-907)
Ireland (65-623)
Greece (91-847)
Spain (420-283)
France (760-421)
Croatia (37-252)
Italy (484-777)
Cyprus (9,394)
Latvia (21-720)
Lithuania (31-475)
Luxembourg (6,832)
Hungary (91-680)
Malta (4,435)
Netherlands (168-425)
Austria (83-607)
Poland, 2014 (375-647)
Portugal (85-762)
Romania (201-023)
Slovenia (20-273)
Slovakia (55-615)
Finland (55-588)
Sweden, 2014 (115-246)
United Kingdom
UK: England and Wales, 2014 (694-312)
UK: Scotland (54-288)
UK: Northern Ireland (24-462)
Iceland (4,088)
Norway (59-711)
Switzerland, 2014 (84-891)
Rate per 1000 live births IMR 22 weeks
IMR 24 weeks
7.5

119
Figure C3.3 Distribution of infant deaths by gestational age (A) and by birth weight (B) for all births at or after 22 weeks of gestation for all countries contributing data in 2015
A. By gestational age group B. By birthweight group
NOTES: Calculated for 22 countries (by gestational age) and 21 countries (by birth weight), representing about 2.4 million births.
infant deaths
Weeks Grams
0%
10%
20%
30%
40%
50%
60%
70%
80%
90%
100%
22-23
24-27
28-31
32-36
> 37
infant deaths 0%
10%
20%
30%
40%
50%
60%
70%
80%
90%
100%
<500
500-999
1000-1499
1500-2499
2500
12.1
22.0
11.8
17.7
36.4
6.1
30.8
9.4
17.9
35.7

EUROPEAN PERINATAL HEALTH REPORT
120
C3.4 Infant mortality rates at and after 22 weeks of gestation in 2010 and 2015
NOTE: First-period data not from 2010: Cyprus 2007.
Second-period data not from 2015: Bulgaria 2014, Poland 2014, Sweden 2014, Switzerland 2014, UK: England and Wales 2014.
2010
2015
10.6
12
3.4
2.7
2.7
3.4
3.2
3.8
3.5
3.4
3.1
5.5
4.5
2.8
5.3
5.5
3.8
3.4
5.0
2.5
9.8
2.9
2.2
2.4
3.8
3.7
4.8
2.3
2.5
3.2
3.1
2.5
2.6
3.3
2.9
3.4
4.0
2.7
3.5
3.1
2.1
4.3
4.2
2.3
4.2
5.2
3.5
2.3
4.2
3.0
7.4
1.7
2.0
1.7
2.3
3.2
2.9
5.1
1.5
2.2
3.0
0 2 4 6 8 10 12
Belgium
Czech Republic
Denmark
Germany
Estonia
Ireland
Greece
Spain
France
Italy
Cyprus
Latvia
Lithuania
Luxembourg
Hungary
Malta
Netherlands
Austria
Poland
Portugal
Romania
Slovenia
Slovakia
Finland
Sweden
United Kingdom
UK: England and Wales
UK: Scotland
UK: Northern Ireland
Iceland
Norway
Switzerland
Rate per 1000 live births

121
C3.5 Comparison of infant mortality rates at and after 22 weeks of gestation, 2010 and 2015 (risk ratios and 95% confidence intervals)
NOTE: Pooled random effect estimate: 0.88 (95% CI: 0.84-0.93). I2 = 71.5% Chi squared test for heterogeneity: 94.70 (d.f. = 27), p <0.000. First-period data not from 2010: Greece 2009, Cyprus 2007. Second-period data not from 2015: Bulgaria 2014, Poland 2014, Sweden 2014, UK: England and Wales 2014 and Switzerland 2014.
10 .5 1 1.5 2Risk ratios with 95% confidence intervals
Slovenia
Iceland
Cyprus
Austria
Romania
Finland
Latvia
Hungary
UK: Scotland
UK: England and Wales
Poland
Luxembourg
Norway
Estonia
Italy
Czech Republic
Belgium
Lithuania
Sweden
Netherlands
Switzerland
Malta
Germany
Denmark
France
Greece
UK: Northern Ireland
Portugal
0.58 (0.39, 0.89)
0.65 (0.24, 1.76)
0.68 (0.38, 1.20)
0.70 (0.58, 0.84)
0.76 (0.71, 0.81)
0.77 (0.59, 1.00)
0.77 (0.59, 1.02)
0.78 (0.69, 0.90)
0.78 (0.64, 0.96)
0.83 (0.79, 0.88)
0.84 (0.79, 0.90)
0.85 (0.43, 1.66)
0.89 (0.70, 1.12)
0.89 (0.59, 1.35)
0.90 (0.84, 0.97)
0.91 (0.78, 1.07)
0.92 (0.80, 1.06)
0.93 (0.73, 1.18)
0.93 (0.79, 1.11)
0.94 (0.84, 1.05)
0.95 (0.79, 1.12)
0.95 (0.53, 1.70)
0.95 (0.90, 1.00)
0.99 (0.79, 1.23)
1.01 (0.95, 1.06)
1.04 (0.91, 1.20)
1.05 (0.82, 1.34)
1.16 (0.98, 1.38)

EUROPEAN PERINATAL HEALTH REPORT
122
Figure C3.6 Comparison of infant mortality rates at and after 24 weeks of gestation, 2010 and 2015 (risk ratios and 95% confidence intervals)
NOTE: Data from Czech Republic and Romania corrected for missing observations. Pooled random effects estimate: 0.84 (95% CI: 0.78-0.90). I2 = 55.3% Chi squared test for heterogeneity= 33.56 (d.f. = 15), p= 0.004. First-period data not from 2010: Greece 2009, Cyprus 2007. Second-period data not from 2015: Bulgaria 2014, Poland 2014, Sweden 2014, Switzerland 2014, UK: England and Wales 2014.
10 .5 1 1.5 2Risk ratios with 95% confidence intervals
Iceland
Austria
Finland
Slovenia
Latvia
Czech Republic
UK: England and Wales
Poland
Norway
Sweden
Malta
Luxembourg
Denmark
Romania
Switzerland
Estonia
0.40 (0.11, 1.47)
0.62 (0.51, 0.77)
0.73 (0.56, 0.97)
0.74 (0.46, 1.21)
0.77 (0.57, 1.03)
0.81 (0.68, 0.96)
0.82 (0.77, 0.87)
0.83 (0.77, 0.88)
0.89 (0.69, 1.14)
0.94 (0.79, 1.13)
0.95 (0.52, 1.75)
0.95 (0.36, 2.54)
0.96 (0.76, 1.23)
0.97 (0.90, 1.04)
0.98 (0.81, 1.19)
1.17 (0.73, 1.88)

123
C4. DISTRIBUTION OF BIRTH WEIGHT
JUSTIFICATIONThe proportion of low-birthweight babies, defined as those weighing less than 2500 grams at birth, is a widely used indicator for assessing their risk of adverse perinatal outcomes. Babies with a low birth weight are at higher risk of poor perinatal outcome and of long-term cognitive and motor impairments than babies with higher birth weights.1, 2 Babies with very low birth weights, weighing less than 1500 grams, face the highest short- and long-term risks.3 Birth weight is included in many national and international data systems and it is therefore possible to compare the percentage of babies with low birth weight over diverse geographic areas and to assess trends over time.
Infants with low birth weight include those born preterm (see C5) as well as children with fetal growth restriction, regardless of their gestational age at delivery. As with preterm births, low birth weight is more common among multiple births than singletons (see C7). Growth restriction is associated with many adverse perinatal health outcomes and short- and long-term impairments, including risks of high blood pressure, ischemic heart diseases, other cardiovascular diseases, diabetes, and metabolic syndromes in adulthood.4, 5
Some maternal and fetal characteristics are known risk factors for both preterm birth and growth restriction. Mothers with pre-existing conditions, chronic diseases, and known pregnancy-related disease, such as preeclampsia, are at higher risk, as are fetuses with congenital anomalies and pregnancies with reduced uteroplacental flow. Maternal smoking and low socioeconomic status also contribute significantly to preterm birth and fetal growth impairment.6 Management of fetal growth restriction during pregnancy involves monitoring the fetus and, if needed, carrying out an indicated early delivery.7
On the other side of the birthweight spectrum, macrosomia, usually defined as a high birth weight of 4500 grams and over, is also associated with pregnancy complications and adverse perinatal health outcomes, including shoulder dystocia, neonatal morbidity, and caesarean delivery.8, 9 Mothers with diabetes are known to be at higher risk of having a macrosomic fetus. The risk of diabetes is also related to a higher proportion of older mothers in many countries.
METHODOLOGICAL ISSUES IN THE CALCULATION, REPORTING, AND INTERPRETATION OF THE INDICATORWide availability of the distribution of birth weight across countries and in international databases provides information about the percentages of infants at risk of mortality and morbidity. One of the advantages of this indicator is that it is more easily measured than gestational age (see C5) in various high and low income settings. Nonetheless, because the distribution of birth weight in a given country reflects both the distribution of gestational age and the pattern of fetal growth, differences between countries are harder to interpret. To eliminate the impact of varying gestational age at birth, the percentage of newborns who are small-for-gestational-age or large-for gestational-age may be used to investigate fetal growth. No consensus currently exists, however, on international standards for determining birth weight percentiles across European populations. The debate centres on whether all countries should use one global standard or construct their own national references.10 This is an important area for future research in Europe, as growth restriction is a major perinatal health concern, and we lack tools for monitoring its prevalence and trends over times, especially between countries.

EUROPEAN PERINATAL HEALTH REPORT
124
DEFINITION AND PRESENTATION OF INDICATORThis indicator is defined as the number of births within a given birth weight interval, expressed as a proportion of all registered live births and stillbirths. It is computed by vital status at birth, gestational age, and plurality. The indicators selected for inclusion in this summary are live births weighing less than 1500 and 2500 grams. Indicators presented by pregnancy type (multiples versus singletons) can be found in the summary tables in Appendix B. We focus on live births because their registration is more homogenous in Europe than that of stillbirths, so that this indicator will be more useful for comparisons (see C1).
DATA SOURCES AND AVAILABILITY OF INDICATOR IN EUROPEAN COUNTRIESThis indicator was available in all countries. Data on the birth weight distribution in France are now derived from hospital discharge data, but for comparisons we use data from the French perinatal survey, which were also used in 2010. Cyprus also changed data sources (from a survey to routine collection) between 2010 and 2015.
RESULTSAs Figure C4.1 shows, the prevalence of low-birthweight less than 2500 grams in participating countries ranged from 4.2% to 10.6% of live births, with lower rates in Estonia, Finland, Sweden, Iceland, Latvia, Lithuania, and Norway and higher rates in Romania, Spain, Hungary, Portugal, Greece, Bulgaria, and Cyprus. Very low birth weight under 1500 grams occurred in 0.6% to about 1.4% of live births.
The geographic pattern of the percentage of low-birthweight babies can be seen in Figure C4.2, with the highest percentages of low birth weights (under 2500 grams) in southern and eastern European countries. The lowest percentages of very low birth weight infants, less than 4.5% of live births, were in the Nordic and Baltic countries. Figure C4.3 shows a geographic pattern of high birth weight symmetric to that of low birth weight: the highest percentages of high birth weight (4500 grams or more) were found in the Nordic and Baltic countries, and the lowest percentages in southern Europe, especially in Greece and Cyprus, both countries where these rare high birth weights account for only 0.2% of live births.
Between 2010 and 2015, some countries experienced moderate but significant relative reductions in their percentages of low birth weight babies, ranging from 2% to 9%, as shown inFiguresC4.4andC4.5;thesecountriesincludedNorway,Greece,Austria,Slovakia,Germany,and Romania. Other countries experienced increases of a similar magnitude (Spain, Poland, Italy, Scotland, and Portugal). Increases of 10% or more over percentages in 2010 were observed in Iceland, France, Ireland, and Northern Ireland. When all participating countries were considered together, there was no common trend over time – the pooled risk ratio is estimated at 1.00 – and high heterogeneity was observed in the risk ratios from country to country.

125
KEY POINTS• Thepercentageoflowbirthweightinparticipatingcountriesvariesbyafactoroftwo;some
of this reflects differences in preterm birth, as shown by some patterns in common with rates of preterm birth.
• Thisindicatorshowsmarkedgeographicalvariationthatmayreflectphysiologicaldifferencesinbirthweight;theseshouldbetakenintoconsiderationwheninterpretingbetween-countrydifferences.
• Giventheperinatalandlong-termhealthimpactsofsuboptimalfetalgrowth,researchis needed on how best to measure and compare fetal growth restriction throughout the countries of Europe.
REFERENCES1. McIntire DD, Bloom SL, Casey BM, Leveno KJ. Birth weight in relation to morbidity and
mortality among newborn infants. N Engl J Med.1999;340(16):1234-1238.
2. Jarvis S, Glinianaia SV, Torrioli MG, et al. Cerebral palsy and intrauterine growth in single births: European collaborative study. Lancet.2003;362(9390):1106-1111.
3. Pascal A, Govaert P, Oostra A, Naulaers G, Ortibus E, Van den Broeck C. Neurodevelopmental outcome in very preterm and very-low-birthweight infants born over the past decade: a meta-analytic review. Dev Med Child Neurol.2018;60(4):342-355.
4. Barker DJ. In utero programming of chronic disease. Clin Sci (Lond).1998;95(2):115-128.
5. Hovi P, Vohr B, Ment LR, et al. Blood Pressure in Young Adults Born at Very Low Birth Weight: Adults Born Preterm International Collaboration. Hypertension.2016;68(4):880-887.
6. Kramer MS, Seguin L, Lydon J, Goulet L. Socio-economic disparities in pregnancy outcome: why do the poor fare so poorly? Paediatr Perinat Epidemiol. 2000;14(3):194-210.
7. Figueras F, Caradeux J, Crispi F, Eixarch E, Peguero A, Gratacos E. Diagnosis and surveillance of late-onset fetal growth restriction. Am J Obstet Gynecol.2018;218(2S):S790-S802e791.
8. Mendez-Figueroa H, Truong VTT, Pedroza C, Chauhan SP. Large for Gestational Age Infants and Adverse Outcomes among Uncomplicated Pregnancies at Term. Am J Perinatol. 2017;34(7):655-662.
9. Weissmann-Brenner A, Simchen MJ, Zilberberg E, et al. Maternal and neonatal outcomes of large for gestational age pregnancies. Acta Obstet Gynecol Scand. 2012;91(7):844-849.
10. Zeitlin J, Bonamy AE, Piedvache A, et al. Variation in term birthweight across European countries affects the prevalence of small for gestational age among very preterm infants. Acta Paediatr.2017;106(9):1447-1455.

EUROPEAN PERINATAL HEALTH REPORT
126
Figure C4.1 Percentage of live births with birth weights < 1500 grams and 1500-2499 grams
NOTE: Number of live births with data on birth weight in parentheses after country name
Percentage of live births
1.0
0.9
0.8
1.1
1.1
1.2
0.9
0.8
1.0
1.1
1.1
1.0
1.1
1.2
1.1
0.9
1.4
1.1
0.8
0.9
1.1
1.0
0.9
1.0
1.0
1.3
1.1
1.1
1.3
0.9
1.1
1.1
1.1
6.2
5.3
5.3
6.3
7.1
6.4
4.8
5.0
6.0
6.4
7.4
7.0
6.2
6.7
5.8
5.8
7.3
6.3
4.6
4.8
10.9
6.6
5.6
6.1
6.6
10.1
5.4
4.7
7.2
5.3
6.4
6.3
7.0
7.2
6.2
6.1
7.4
8.2
7.6
5.6
5.8
7.0
7.5
8.4
8.0
7.3
7.8
6.9
6.8
8.7
7.3
5.4
5.8
12.0
7.6
6.5
7.1
7.6
11.3
6.5
5.7
8.5
6.2
7.5
7.4
8.1
0 2 4 6 8 10 12 14
Switzerland, 2014 (84,891)
Norway (59,711)
Iceland (4,088)
UK: Northern Ireland (24,462)
UK: Scotland (54,288)
UK: England and Wales (696,057)
Sweden, 2014 (115,246)
Finland (55,588)
Slovakia (55,615)
Slovenia (20,273)
Romania (201,023)
Portugal (85,762)
Poland, 2014 (375,647)
Austria (83,607)
Netherlands (168,425)
Malta (4,435)
Hungary (91,680)
Luxembourg (6,832)
Lithuania (31,475)
Latvia (21,720)
Cyprus (9,394)
Italy (484,777)
Croatia (37,252)
France (758,056)
Spain (420,283)
Greece (91,847)
Ireland (65,623)
Estonia (13,907)
Germany (725,937)
Denmark (57,677)
Czech Republic (110,764)
Bulgaria, 2014 (67,585)
Belgium (122,269)
<32 weeks
32-36 weeks
Percentage of live births
0.9
0.8
0.7
0.9
0.9
1.0
0.8
0.6
1.0
1.0
0.9
1.0
0.9
1.0
1.0
1.0
1.4
0.9
0.7
0.7
1.2
1.0
0.8
1.0
1.0
1.1
0.9
0.8
1.3
0.8
1.2
1.4
0.9
5.5
3.7
3.6
5.4
5.9
6.0
3.5
3.6
6.7
5.4
7.0
7.9
5.0
5.5
5.1
5.3
7.1
5.8
3.8
3.8
9.4
6.4
4.3
6.4
7.4
8.2
4.8
3.3
5.7
4.2
6.6
8.5
6.0
6.3
4.5
4.4
6.3
6.8
7.0
4.3
4.2
7.7
6.4
7.8
8.9
5.9
6.5
6.1
6.3
8.5
6.7
4.5
4.5
10.6
7.4
5.1
7.4
8.3
9.3
5.7
4.2
7.0
5.0
7.8
9.8
6.9
0 2 4 6 8 10 12
Switzerland, 2014 (84-881)
Norway (59-710)
Iceland (4088)
UK: Northern Ireland (24-440)
UK: Scotland (54-231)
UK: Eng and Wales (683-997)
Sweden, 2014 (115-210)
Finland (55-537)
Slovakia (55-615)
Slovenia (20-273)
Romania (201-023)
Portugal (85-727)
Poland, 2014 (375-638)
Austria (83-607)
Netherlands (168-007)
Malta (4431)
Hungary (91-645)
Luxembourg (6831)
Lithuania (28-896)
Latvia (21-720)
Cyprus (9-358)
Italy (484-399)
Croatia (37-252)
France (759-099)
Spain (398-786)
Greece (90-772)
Ireland (65-623)
Estonia (13-906)
-
Germany (725-913)
Denmark (57-227)
Czech Republic (109-141)
Bulgaria, 2014 (64-813)
Belgium (120-600)
<1500 grams
1500 to 2499 grams
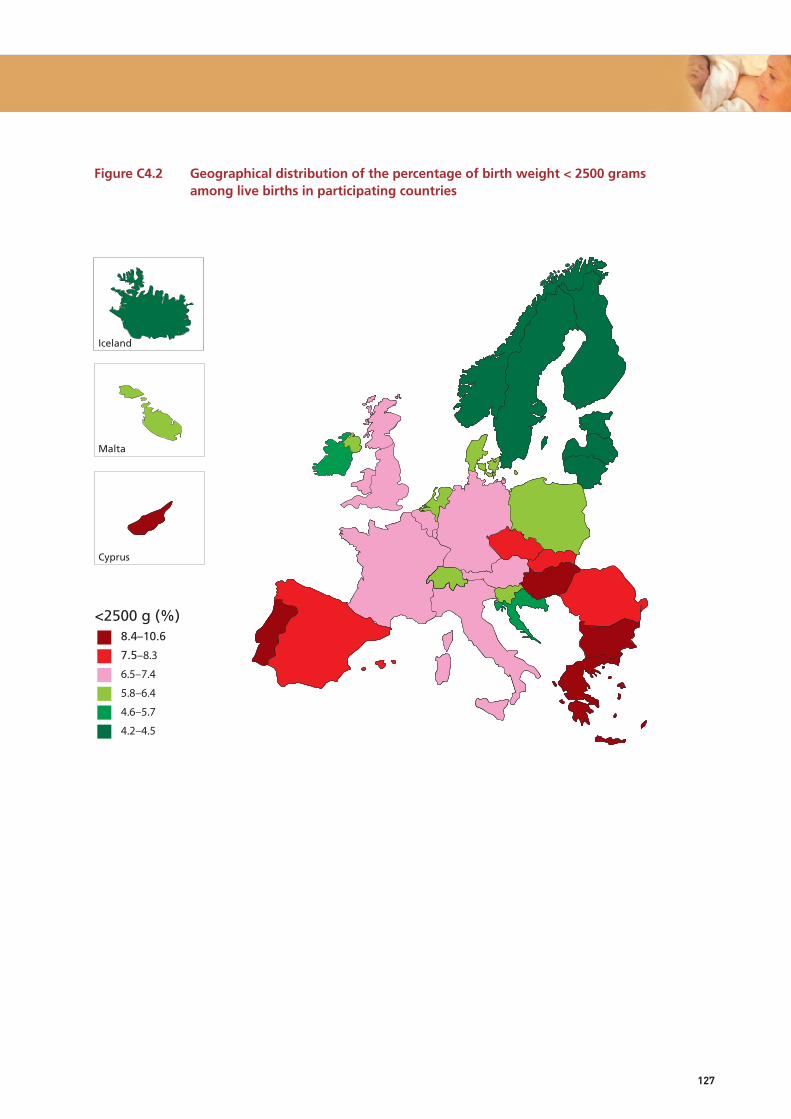
127
Figure C4.2 Geographical distribution of the percentage of birth weight < 2500 grams among live births in participating countries
n.s sig. %8.4–10.6
7.5–8.3
6.5–7.4
5.8–6.4
4.6–5.7
4.2–4.5
<2500 g (%)
Iceland
Malta
Cyprus

EUROPEAN PERINATAL HEALTH REPORT
128
Figure C4.3 Geographical distribution of the percentage of birth weight ≥ 4500 grams among live births in participating countries
n.s sig. %2.6–4.3
1.5–2.5
1.0–1.4
0.8–0.9
0.6–0.7
0.2–0.5
> 4500 g %
Iceland
Malta
Cyprus

129
Figure C4.4 Percentage of live births with birth weight < 2500 grams in 2010 and 2015
NOTES: *Second-period data not from 2015: Poland 2014, Sweden 2014, Switzerland 2014. **First-period data not from 2010: Cyprus 2007.
2010
2015
7.0
7.5
5.1
7.2
4.0
5.1
10.0
8.7
6.4
7.1
9.8
4.8
4.6
6.7
8.6
7.2
6.2
7.0
5.7
8.3
8.0
6.3
8.1
4.3
4.2
7.0
6.5
5.7
3.4
4.9
6.5
6.9
7.8
5.0
7.0
4.2
5.7
9.3
8.3
7.5
7.4
10.6
4.5
4.5
6.7
8.5
6.3
6.1
6.5
5.9
8.9
7.8
6.4
7.7
4.2
4.3
7.0
6.8
6.3
4.4
4.5
6.3
0 2 4 6 8 10 12
Belgium
Czech Republic
Denmark
Germany
Estonia
Ireland
Greece
Spain
France, Survey
Italy
Cyprus**
Latvia
Lithuania
Luxembourg
Hungary
Malta
Netherlands
Austria
Poland*
Portugal
Romania
Slovenia
Slovakia
Finland
Sweden*
UK: England and Wales
UK: Scotland
UK: Northern Ireland
Iceland
Norway
Switzerland*
Percentage of live births

EUROPEAN PERINATAL HEALTH REPORT
130
Figure C4.5 Comparison of percentages of live births with birth weight < 2500 grams, 2010 and 2015 (risk ratios and 95% confidence intervals)
NOTE: Random effects estimate of pooled RR: 1.00 (95% CI: 0.99, 1.02). I2=89.4% Chi squared test of heterogeneity: 258.90 (d.f. = 30), p = <0.001. First-period data not from 2010: Cyprus 2007. Second-period data not from 2015: Bulgaria 2014, Poland 2014, Sweden 2014, Switzerland 2014.
1.5 .75 1 1.25 1.5Risk ratios with 95% confidence intervals
Malta
Norway
Greece
Austria
Latvia
Slovakia
Lithuania
Germany
Netherlands
Finland
Switzerland*
Romania
Denmark
Belgium
Luxembourg
Hungary
UK: England and Wales
Slovenia
Sweden*
Spain
Czech Republic
Estonia
Poland*
Italy
UK: Scotland
Portugal
Cyprus**
UK: Northern Ireland
Ireland
France, Survey
Iceland
0.87 (0.74, 1.02)
0.91 (0.87, 0.96)
0.93 (0.91, 0.95)
0.93 (0.90, 0.96)
0.93 (0.85, 1.02)
0.94 (0.91, 0.98)
0.97 (0.90, 1.04)
0.97 (0.96, 0.98)
0.97 (0.95, 1.00)
0.97 (0.92, 1.03)
0.97 (0.94, 1.01)
0.98 (0.96, 1.00)
0.98 (0.93, 1.03)
0.99 (0.96, 1.02)
1.00 (0.88, 1.13)
1.00 (0.97, 1.03)
1.00 (0.99, 1.02)
1.02 (0.94, 1.09)
1.03 (0.99, 1.07)
1.03 (1.01, 1.04)
1.03 (1.00, 1.06)
1.04 (0.93, 1.16)
1.04 (1.02, 1.06)
1.04 (1.03, 1.06)
1.05 (1.01, 1.10)
1.07 (1.04, 1.10)
1.08 (0.99, 1.18)
1.10 (1.03, 1.18)
1.12 (1.07, 1.17)
1.17 (1.07, 1.28)
1.30 (1.05, 1.59)

131
C5 DISTRIBUTION OF GESTATIONAL AGE
JUSTIFICATIONPreterm newborns, born before 37 completed weeks of gestation, are at higher risk of mortality, morbidity, and impaired motor and cognitive development in childhood than infants born at term.1 In high-income countries, about three quarters of all neonatal deaths occur to the 6% to 12% of infants born before 37 weeks.2 Preterm birth predisposes children to higher risks of chronic diseases and mortality later in life.
Health and developmental risks increase with decreasing gestational age, and very preterm babies born before 32 weeks of gestation are the most vulnerable, with rates of infant mortality between 10% and 15% and of cerebral palsy between 5% and 10%.1 However, babies with moderate or late preterm births (32 to 36 weeks of gestation) also have worse health and developmental outcomes than term babies.3, 4
Preterm births follow spontaneous preterm labour or premature rupture of membranes in about two thirds of cases.5, 6 Indicated preterm births occur in about one-third of cases and result from a medical decision when there are fetal complications, such as fetal growth restriction, or maternal complications, such as severe preeclampsia.6 Clinical risk factors for preterm birth include previous preterm birth, infection, inflammation, hypertensive and vascular disorders, diabetes, a shortened cervix, and placentation disorders. In many cases, however, the cause of the preterm birth remains unknown.5
Although the survival of preterm infants has improved markedly over recent decades due to medical advances in neonatal care, progress in the prevention of preterm birth has been limited.7 A WHO survey published in 2012 suggested that globally preterm births may be rising,8 but within Europe, countries report heterogeneous trends.9 Population factors related to risks of preterm birth include the incidence of multiple pregnancy (see C7), higher maternal age (C8), and both low and high maternal body mass index (R12).10 Evidence also suggests that practices related to indicated delivery and obstetric intervention within countries affect variations in the preterm birth rate. There is mounting evidence that targeting population-based social and environmental determinants of early delivery such as stress, air pollution, smoking, and education, could inform new paradigms for prevention.10, 11
While most research on gestational age distribution has focused on preterm births, which are at highest risk, early term birth at 37-38 weeks and post-term birth (42+ weeks) also confer additional risks compared with full term birth (39 to 41 weeks).12 In many countries, policies to induce delivery before 42 weeks have led to declines in the post-term birth rate, although there are substantial variations.13
DEFINITION AND PRESENTATION OF INDICATORThis indicator is defined as the number of live births and fetal deaths at each completed week of gestation (starting from 22 weeks), expressed as a proportion of all live births and stillbirths. The gestationalagedistributionispresentedasfollows:22-36weeksofgestation(pretermbirths);37-38(earlyterm),39-41weeks(fulltermbirths);42ormoreweeks(post-term).Pretermbirthscanbe subdivided as 22-27 weeks (extremely preterm), 28-31 weeks (very preterm), and 32-36 weeks (moderate and late preterm combined). This indicator is calculated by vital status at birth and plurality.
EUROPEAN PERINATAL HEALTH REPORT
132
The summary indicators presented below are calculated for live births. We focus on live births becausetheirregistrationismorehomogenousinEuropethanthatof stillbirths;theythereforeprovide a more comparable indicator (for a discussion of this issue, see C1). The complete distribution of gestational age for total births is provided in the summary tables in Appendix B.
DATA SOURCES AND AVAILABILITY OF INDICATOR IN EUROPEAN COUNTRIESThis indicator is available in all participating countries. In France, national data are available from hospital discharge data, but comparisons across time are based on a national survey, which was also the data source in 2010. Cyprus also changed data sources between these two periods.
METHODOLOGICAL ISSUES IN THE CALCULATION, REPORTING, AND INTERPRETATION OF THE INDICATOREuro-Peristat requests data on gestational age based on the best obstetrical estimate, which combines clinical and ultrasound data. However, we do not know how this best estimate is derived, and it may vary by country as well as between health providers within countries. Ultrasound is widely used for dating pregnancies in Europe, however, and most women receive care in the first trimester of pregnancy. The method of determining gestational age can influencethereportedgestationalagedistribution;useofultrasoundestimatestendstoshiftthedistribution towards earlier gestations and increase the reported preterm birth rate, although not all studies have found this to be the case.10 Research about the methods used within Europe for determining gestational age and their impact on the gestational age distribution should be undertaken to better elucidate the comparability of this indicator. An analysis of the Euro-Peristat data showed that for very preterm births, it is preferable to begin comparisons of births from 24 weeks of gestation onward.14
RESULTSAs shown in Figure C5.1, the preterm birth rate for live births varied from about 6% to 12% in participating countries. Lower preterm birth rates (below 6.5%) were observed in Norway, Denmark, Latvia, Finland, Estonia, Sweden, Iceland, and Lithuania, and higher rates (at or above 8.5%) in Germany, Greece, Hungary, and Cyprus. Rates were around 8% in Belgium, Romania, Portugal, Austria, England and Wales, Scotland, Italy, Bulgaria, the Czech Republic, Poland, Spain, Slovenia, Northern Ireland, and Luxembourg. Very preterm births, that is, births before 32 weeks of gestational age, accounted for about 1% of live births (range: 0.8 to 1.4%).
Figure C5.2 provides the full gestational age distribution and shows that the extent of variation for early term live births between countries is similar in magnitude to the variation in preterm birth rates. Rates varied by more than two-fold – between 16% and 44%. Rates were lowest (less than or equal to 18%) in Lithuania, Iceland, Latvia, Estonia, and Finland, and highest (above 27%) in Greece, Romania, Italy, Luxembourg, Malta, and Cyprus. Countries with higher early term rates tended also to have higher preterm birth rates.
The percentage of preterm births ranged between 4 and 9% among singletons and from 38 to 70% among multiples (See summary tables C5_B). Similar variations in preterm birth rates between countries were observed for both singleton and multiple births, with the exception of Romania where a relatively high proportion of singleton preterm births was accompanied by a relatively low proportion of multiple preterm births. Conversely, Slovenia had a relatively low proportion of singleton preterm births and a relatively high proportion of multiple preterm births.

133
Proportions of preterm live births were similar to those in 2010 for many of the countries. Differences between rates in 2010 and 2015 ranged between -0.8 and +1.5 percentage points, as shown in Figure C5.4. Relative changes in the percentages of preterm live births are shown in Figure C5.5, which also provides 95% confidence intervals for these changes. These percentages were more than 5% higher in 2015 than in 2010 in Portugal, England and Wales, Poland, Ireland, France, Cyprus, Scotland, and Iceland. Significant declines were seen in the Netherlands, Austria, the Czech Republic, Spain, Sweden, and Germany. Overall, the pooled estimate of relative change between the two years was 1.02 with a 95% confidence interval from 0.99-1.04.
KEY POINTS• Gestationalageisanessentialindicatorofperinatalhealthbutisstillnotcurrentlyincluded
in international data sets, although the data are available almost everywhere and should be routinely reported.
• TherearewidedifferencesinthepercentagesofpretermandearlytermbirthsbetweenEuropean countries. These have been confirmed in other international studies in data from 1996-2010. Heterogeneous patterns of changes in early delivery between 2010 and 2015 raise questions about policies and practices associated with changes and challenge us to rethink current preventive approaches.

EUROPEAN PERINATAL HEALTH REPORT
134
REFERENCES1. Saigal S, Doyle LW. An overview of mortality and sequelae of preterm birth from infancy to
adulthood. Lancet.2008;371(9608):261-269.
2. Euro-Peristat project with SCPE and EUROCAT. European Perinatal Health Report. The Health and Care of pregnant women and babies in Europe in 2010. http://www.europeristat.com/images/doc/EPHR2010_w_disclaimer.pdf (accessed 29/03/2017).
3. Boyle EM, Poulsen G, Field DJ, et al. Effects of gestational age at birth on health outcomes at 3 and 5 years of age: population based cohort study. BMJ.2012;344:e896.
4. Kramer MS, Demissie K, Yang H, Platt RW, Sauve R, Liston R. The contribution of mild and moderate preterm birth to infant mortality. Fetal and Infant Health Study Group of the Canadian Perinatal Surveillance System. JAMA.2000;284(7):843-849.
5. Goldenberg RL, Culhane JF, Iams JD, Romero R. Epidemiology and causes of preterm birth. Lancet.2008;371(9606):75-84.
6. Goldenberg RL, Gravett MG, Iams J, et al. The preterm birth syndrome: issues to consider in creating a classification system. Am J Obstetr Gynecol.2012;206(2):113-118.
7. Chang HH, Larson J, Blencowe H, et al. Preventing preterm births: analysis of trends and potential reductions with interventions in 39 countries with very high human development index. Lancet.2013;381(9862):223-234.
8. Blencowe H, Cousens S, Oestergaard MZ, et al. National, regional, and worldwide estimates of preterm birth rates in the year 2010 with time trends since 1990 for selected countries: a systematic analysis and implications. Lancet.2012;379(9832):2162-2172.
9. Zeitlin J, Szamotulska K, Drewniak N, et al. Preterm birth time trends in Europe: a study of 19 countries. BJOG.2013;120(11):1356-1365.
10. Delnord M, Blondel B, Zeitlin J. What contributes to disparities in the preterm birth rate in European countries? Curr Opin Obstet Gynecol. 2015;27(2):133-142.
11. Delnord M, Mortensen L, Hindori-Mohangoo AD, et al. International variations in the gestational age distribution of births: an ecological study in 34 high-income countries. Eur J Public Health.2018;28(2):303-309.
12. Delnord M, Zeitlin J. Epidemiology of late preterm and early term births – An international perspective. Semin Fetal Neonatal Med. in press.
13. Zeitlin J, Blondel B, Alexander S, Breart G, Group P. Variation in rates of postterm birth in Europe: reality or artefact? BJOG.2007;114(9):1097-1103.
14. Delnord M, Hindori-Mohangoo AD, Smith LK, et al. Variations in very preterm birth rates in 30 high-income countries: are valid international comparisons possible using routine data? BJOG. 2017;124(5):785-794.
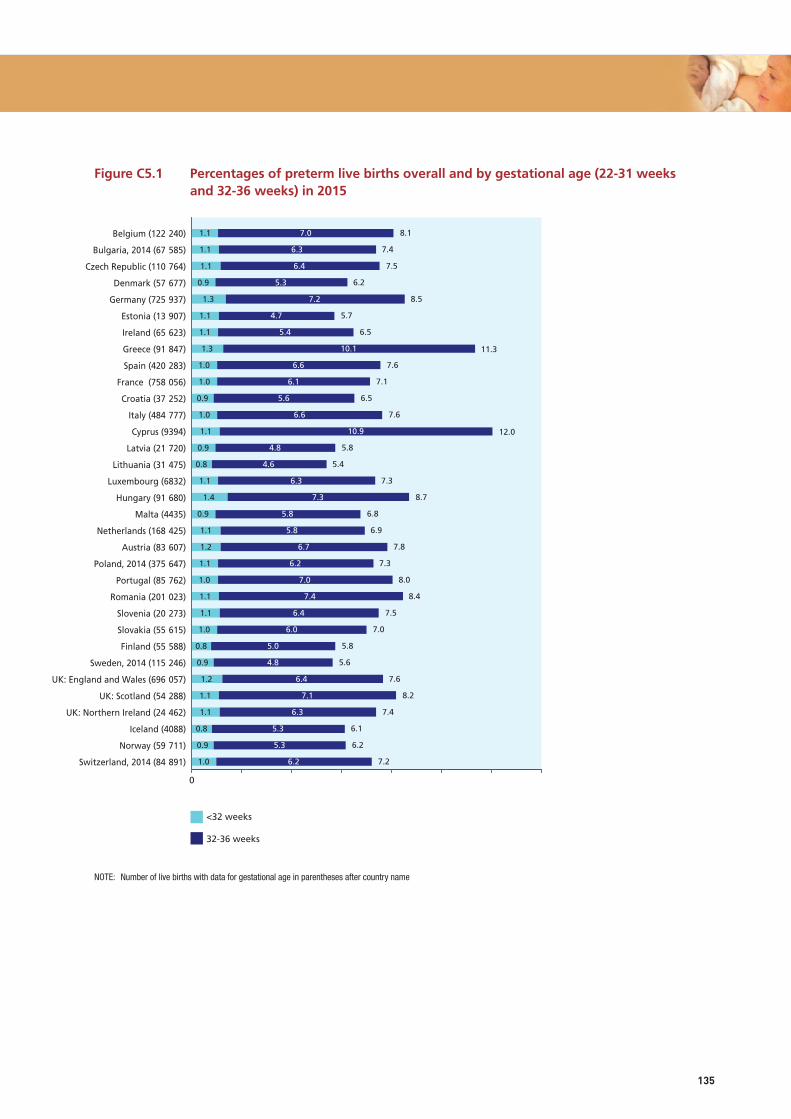
135
Figure C5.1 Percentages of preterm live births overall and by gestational age (22-31 weeks and 32-36 weeks) in 2015
NOTE: Number of live births with data for gestational age in parentheses after country name
2010
2015
7.9
8.1
6.4
8.8
5.7
5.7
11.2
8.0
6.6
7.4
10.5
5.8
5.4
8.1
8.9
7.2
7.5
8.4
6.6
7.7
8.2
7.2
7.1
5.6
5.9
7.1
7.0
7.2
5.2
6.3
7.1
8.1
7.5
6.2
8.5
5.7
6.5
11.3
7.6
7.5
7.6
12.0
5.8
5.4
7.3
8.7
6.8
6.9
7.8
7.3
8.0
8.4
7.5
7.0
5.8
5.6
7.6
8.2
7.4
6.1
6.2
7.2
0 2 4 6 8 10 12 14
Belgium
Czech Republic
Denmark
Germany
Estonia
Ireland
Greece
Spain
France, Survey
Italy
Cyprus
Latvia
Lithuania
Luxembourg
Hungary
Malta
Netherlands
Austria
Poland
Portugal
Romania
Slovenia
Slovakia
Finland
Sweden
UK: England and Wales
UK: Scotland
UK: Northern Ireland
Iceland
Norway
Switzerland
Percentage of live births
1.0
0.9
0.8
1.1
1.1
1.2
0.9
0.8
1.0
1.1
1.1
1.0
1.1
1.2
1.1
0.9
1.4
1.1
0.8
0.9
1.1
1.0
0.9
1.0
1.0
1.3
1.1
1.1
1.3
0.9
1.1
1.1
1.1
6.2
5.3
5.3
6.3
7.1
6.4
4.8
5.0
6.0
6.4
7.4
7.0
6.2
6.7
5.8
5.8
7.3
6.3
4.6
4.8
10.9
6.6
5.6
6.1
6.6
10.1
5.4
4.7
7.2
5.3
6.4
6.3
7.0
7.2
6.2
6.1
7.4
8.2
7.6
5.6
5.8
7.0
7.5
8.4
8.0
7.3
7.8
6.9
6.8
8.7
7.3
5.4
5.8
12.0
7.6
6.5
7.1
7.6
11.3
6.5
5.7
8.5
6.2
7.5
7.4
8.1
0 2 4 6 8 10 12 14
Switzerland, 2014 (84-891)
Norway (59-711)
Iceland (4088)
UK: Northern Ireland (24-462)
UK: Scotland (54-288)
UK: England and Wales (696-057)
Sweden, 2014 (115-246)
Finland (55-588)
Slovakia (55-615)
Slovenia (20-273)
Romania (201-023)
Portugal (85-762)
Poland, 2014 (375-647)
Austria (83-607)
Netherlands (168-425)
Malta (4435)
Hungary (91-680)
Luxembourg (6832)
Lithuania (31-475)
Latvia (21-720)
Cyprus (9394)
Italy (484-777)
Croatia (37-252)
France (758-056)
Spain (420-283)
Greece (91-847)
Ireland (65-623)
Estonia (13-907)
Germany (725-937)
Denmark (57-677)
Czech Republic (110-764)
Bulgaria, 2014 (67-585)
Belgium (122-240)
<32 weeks
32-36 weeks

EUROPEAN PERINATAL HEALTH REPORT
136
Figure C5.2 Percentages of preterm, early term, full term, and post-term live births in 2015
85.6
68.8
67.4
60.2
45.9
16.8
88.4
80.8
56.6
74.5
86.6
65.2
83.5
81.0
83.0
74.0
71.0
64.0
57.6
10.3
12.9
13.1
8.5
8.1
48.9
8.5
7.2
11.9
33.4
13.5
37.9
Yes, exclusively
Yes, mixed
Yes, all (no detail)
0.0 20.0 40.0 60.0 80.0 100.0
Belgium
Czech Republic
Denmark
Germany
Estonia
Ireland
Greece
Spain
ES:Catalonia
ES: Valencia
France
Italy
Cyprus
Latvia
Lithuania
Luxembourg
Hungary
Malta
Netherlands
Austria
Poland
Portugal
Romania
Slovenia
Slovakia
Finland
Sweden
United Kingdom
UK: England
UK: Wales
UK: Scotland
UK: Northern Ireland
Iceland
Norway
Switzerland
Percentages of newborn babies
8.1
7.4
7.5
6.2
8.5
5.7
6.5
11.3
7.6
7.1
6.5
7.6
12.0
5.8
5.4
7.3
8.7
6.8
6.9
7.8
7.3
8.0
8.4
7.5
7.0
5.8
5.6
7.6
8.2
7.4
6.1
6.2
7.2
26.7
21.5
19.1
18.8
25.4
17.8
19.1
43.7
23.1
21.6
21.9
27.8
43.7
17.7
16.4
30.2
26.5
30.6
23.6
24.5
22.1
27.0
27.3
19.8
20.9
18.0
18.5
20.8
19.6
20.5
16.8
18.3
26.5
65.1
70.5
70.2
72.9
65.6
73.9
72.1
45.0
67.7
70.4
69.5
63.7
44.1
75.4
78.2
62.4
64.6
62.5
68.2
67.3
69.1
64.8
63.7
72.0
71.5
72.3
68.8
68.9
70.3
71.3
75.2
71.7
65.7
0.2
0.6
3.1
2.1
0.5
2.6
2.4
1.6
0.8
2.0
0.9
0.2
1.1
0.1
0.1
0.2
0.2
1.3
0.4
1.5
0.1
0.6
0.7
0.6
4.0
7.0
2.7
1.9
0.8
1.9
3.8
0.5
0 10 20 30 40 50 60 70 80 90 100
Belgium
Bulgaria, 2014
Czech Republic
Denmark
Germany
Estonia
Ireland
Greece*
Spain
France
Croatia
Italy
Cyprus
Latvia
Lithuania
Luxembourg
Hungary
Malta
Netherlands
Austria
Poland, 2014
Portugal
Romania
Slovenia
Slovakia
Finland
Sweden, 2014
UK: England and Wales
UK: Scotland
UK: Northern Ireland
Iceland
Norway
Switzerland, 2014
Percentage of live births
<37 weeks 37-38 weeks 39-41 weeks 42 weeks <500
500-1499
1500-2999
3000-4999
Other
Home
0.0 10.0 20.0 30.0 40.0 50.0 60.0 70.0 80.0 90.0 100.0
Belgium
BE: Brussels
BE: Flanders
BE: Wallonia
Czech Republic
Denmark
Germany
Estonia
Ireland
Greece
Spain
ES: Valencia
France
Italy
Cyprus
Latvia
Lithuania
Luxembourg
Hungary
Malta
Netherlands
Austria
Poland
Portugal
Romania
Slovenia
Slovakia
Finland
Sweden
United Kingdom
UK: England
UK: Wales
UK: Scotland
UK: Northern Ireland
Iceland
Norway
Switzerland
Percentage of total births
5000
NOTE: * For Greece, 39-41 weeks and ≥42 weeks classes are grouped

137
Figure C5.3 Geographical distribution of preterm births among live births in Europe
n.s sig. %8.2–12.0
7.6–8.1
7.3–7.5
6.6–7.2
5.9–6.5
5.4–5.8
<37 weeks of gestation (%)
Iceland
Malta
Cyprus

EUROPEAN PERINATAL HEALTH REPORT
138
Figure C5.4 Percentages of live preterm births in 2010 and 2015
NOTE: First-period data not from 2010: Cyprus 2007. Second-period data not from 2015: Bulgaria 2014, Poland 2014, Sweden 2014,Switzerland 2014.
2010
2015
7.9
8.1
6.4
8.8
5.7
5.7
11.2
8.0
6.6
7.4
10.5
5.8
5.4
8.1
8.9
7.2
7.5
8.4
6.6
7.7
8.2
7.2
7.1
5.6
5.9
7.1
7.0
7.2
5.2
6.3
7.1
8.1
7.5
6.2
8.5
5.7
6.5
11.3
7.6
7.5
7.6
12.0
5.8
5.4
7.3
8.7
6.8
6.9
7.8
7.3
8.0
8.4
7.5
7.0
5.8
5.6
7.6
8.2
7.4
6.1
6.2
7.2
0 2 4 6 8 10 12 14
Belgium
Czech Republic
Denmark
Germany
Estonia
Ireland
Greece
Spain
France, Survey
Italy
Cyprus
Latvia
Lithuania
Luxembourg
Hungary
Malta
Netherlands
Austria
Poland
Portugal
Romania
Slovenia
Slovakia
Finland
Sweden
UK: England and Wales
UK: Scotland
UK: Northern Ireland
Iceland
Norway
Switzerland
Percentage of live births

139
Figure C5.5 Comparison of live preterm birth rates, 2010 and 2015 (risk ratios and 95% confidence intervals)
NOTE: Pooled random effects estimate: 1.02 (95% CI: 0.99-1.04). I2=95.0%, Chi squared tests of heterogeneity: 605.2 (d.f. = 30), p <0.001. First-period data not from 2010: Cyprus 2007. Second-period data not from 2015: Bulgaria 2014, Poland 2014, Sweden 2014, Switzerland 2014.
1.5 .75 1 1.25 1.5Risk ratios with 95% confidence intervals
Luxembourg
Netherlands
Austria
Czech Republic
Malta
Spain
Sweden
Germany
Denmark
Norway
Hungary
Slovakia
Lithuania
Latvia
Estonia
Greece
Switzerland
Finland
Belgium
Romania
UK: Northern Ireland
Italy
Slovenia
Portugal
UK: England and Wales
Poland
Ireland
France, Survey
Cyprus
UK: Scotland
Iceland
0.90 (0.80, 1.02)
0.92 (0.90, 0.94)
0.93 (0.90, 0.96)
0.93 (0.91, 0.96)
0.94 (0.80, 1.10)
0.94 (0.93, 0.96)
0.96 (0.93, 0.99)
0.97 (0.96, 0.98)
0.97 (0.93, 1.02)
0.98 (0.94, 1.02)
0.98 (0.95, 1.01)
0.99 (0.95, 1.03)
0.99 (0.93, 1.06)
1.00 (0.92, 1.08)
1.01 (0.92, 1.11)
1.01 (0.99, 1.04)
1.02 (0.99, 1.06)
1.02 (0.97, 1.07)
1.02 (1.00, 1.05)
1.03 (1.00, 1.05)
1.03 (0.97, 1.10)
1.03 (1.02, 1.05)
1.04 (0.97, 1.11)
1.05 (1.01, 1.08)
1.08 (1.06, 1.09)
1.11 (1.09, 1.13)
1.13 (1.09, 1.18)
1.15 (1.05, 1.25)
1.15 (1.06, 1.25)
1.17 (1.12, 1.22)
1.17 (0.99, 1.39)

EUROPEAN PERINATAL HEALTH REPORT
140