Embed Size (px)
Citation preview

BAA (SP) LimitedResults for three months ended 31 March 2010April 2010

2
• Strong financial performance
• Solid operational performance despite terrorism, snow and strikes
• Strategic issues stable since rapid developments of Q4 2009
• £28 million post-Q1 one-off impact of volcano
Total passenger traffic +0.2%
Heathrow passenger traffic +1.6%
Heathrow underlying traffic +3.0%
NRI per passenger +10.7%
Revenue +5.5%
Adjusted EBITDA +3.3%
Underlying Adjusted EBITDA +18.7%
Capital expenditure £208.0m
Net debt £8,612.2m
RAB £12,034.0m
Key financial highlights
Investment and financing
Q1 2010 highlights
Traffic and retail performance
See page 20 for notes and defined terms

3
Eyjafjallajøkull
• London airports closed from 1200hrs on 15 April to 2200hrs on 20 April
• Normal airline schedules re-established from 22 April
• April passenger traffic impact (up to 25 April vs 2009)
– Heathrow: -1.2 million
– Stansted: -0.4 million
• Estimated £28 million Adjusted EBITDA reduction
– 3% of 2009 Adjusted EBITDA
• Strong liquidity position
...thanks for the superb
support in the terminal with
your people supporting all
airlines with direct
customer
communications...
(Top 5 Heathrow airline)
Your support, consistency
of information, hard work
and tireless efforts were
much appreciated and went
a long way to help us plan
as best as possible.
(Top 5 Heathrow airline)
Other airport websites
should look at yours to get
an idea of how best to
inform passengers.
Excellent job!
(Passenger feedback on
www.heathrowairport.com)
You guys have been great.
Keep up the good work in
informing us. I wish other
organisations were as
responsive.
(Feedback on Heathrow
Twitter page)

4
Heathrow security queuing (<5 minutes)
94.0%
96.0%
98.0%
100.0%
Jan-0
9
Feb-0
9
Mar-
09
Apr-
09
May-0
9
Jun-0
9
Jul-
09
Aug-0
9
Sep-0
9
Oct-
09
Nov-0
9
Dec-0
9
Jan-1
0
Feb-1
0
Mar-
10
• Key external influences on Q1 2010 service standards:
– Delta 253
– severe winter weather
– BA industrial action
Heathrow departure punctuality
50%
55%
60%
65%
70%
75%
80%
85%
90%
Jan-0
9
Feb-0
9
Mar-
09
Apr-
09
May-0
9
Jun-0
9
Jul-09
Aug-0
9
Sep-0
9
Oct-
09
Nov-0
9
Dec-0
9
Jan-1
0
Feb-1
0
Mar-
10(f
ligh
ts d
ep
art
ing
wit
hin
15 m
inu
tes o
f sch
edu
le)
Service standard
Moving annual average
Moving annual average
Solid service performance despite external pressures
Heathrow baggage misconnect rate
0
5
10
15
20
25
30
35
Jan-0
9
Feb-0
9
Mar-
09
Apr-
09
May-0
9
Jun-0
9
Jul-
09
Aug-0
9
Sep-0
9
Oct-
09
Nov-0
9
Dec-0
9
Jan-1
0
Feb-1
0
Mar-
10
(pe
r 1
,00
0 p
as
se
ng
ers
)
Moving annual average

5
Capital transformation programme progressing
• Heathrow (£203.0 million spent)
– improving operations whilst progressing ‘brownfield’ investment
– some disruption from severe winter weather
– demolition of old Terminal 2 commenced and to be complete by end 2010
– Terminal 5C on track to open early 2011
– integrated baggage system progresses
– 4 airline relocations completed
• Stansted (£5.0 million spent)
– modest investment on modernising existing infrastructure in current quinquennium

6
See page 20 for notes and defined terms
Passenger traffic trends continue to improve
2009 (m) 2010 (m) Change
By airport
Heathrow 14.4 14.6 +1.6%
Stansted 4.1 3.9 -4.7%
Total 18.5 18.6 +0.2%
By market served
UK 1.6 1.5 -7.6%
Europe 9.1 9.1 +0.3%
Long haul 7.8 7.9 +1.7%
Total 18.5 18.6 +0.2%
Three months ended 31 March
Passenger traffic (Q1 2010 v Q1 2009)
+1.6%
+1.7%
• Passenger traffic up 0.2% to 18.6 million (2009: 18.5 million)
• Year on year comparison complicated by
– winter weather in both years
– BA industrial action
• Underlying performance
– Heathrow: +3.0%
– total: +1.1%
• Return of origin and destination traffic at Heathrow
– benefits retail and rail income

7
Heathrow’s performance remains resilient
Change in passenger traffic in year ended 31 March 2010
-4.7%
-2.8%
-1.5%
0.2% 0.3%
-6.0%
-5.0%
-4.0%
-3.0%
-2.0%
-1.0%
0.0%
1.0%
2.0%
Schiphol Charles de
Gaulle
Frankfurt Madrid Heathrow

8
Key priorities
Address policy and regulatory issues
Making every journey better
Focus on Heathrow

9
A good start to 2010
(figures in £m) Q1 2009 Q1 2010 Change
Turnover 432.2 456.1 5.5%
Adjusted operating costs 263.7 282.0 6.9%
Adjusted EBITDA 168.5 174.1 3.3%
Underlying Adjusted EBITDA 147.1 174.6 18.7%
Net debt 8,579.0 8,612.2 0.4%
RAB (Regulatory Asset Base) 11,743.9 12,034.0 2.5%
+18.7%
See page 20 for notes and defined terms
+3.3%
+6.9%
+5.5%
+0.4%
+2.5%

10
207.6 212.9
24.4 25.8
Q1 2009 Q1 2010
Heathrow
+2.6%
Stansted
+5.7%
+2.9%
• Increased aeronautical income supports substantial investment
– 2.9% reported growth
– 8.7% underlying growth
• Heathrow up underlying 9.1%
• Underlying growth adjusts for £12.5 million of Q1 2009 income due to phasing of tariff increases
232.0238.7
Aeronautical income continues to grow

11
40.6 45.8
31.434.9
14.2
14.9
Q1 2009 Q1 2010
+10.9% +10.7%
Airside and
landside shops
+12.8%
Other
Car parking
+11.1%
+4.9%
• Net retail income per passenger up 10.7% to £5.15
– Heathrow: +11.3%
– Stansted: +5.6%
• Key growth categories
– duty and tax free
– airside specialist shops
– bureaux de change
– catering
• Key growth drivers
– increased Heathrow origin and destination traffic
– improved passenger experience from relocating airlines to Terminal 4
– luxury goods demand
ChangeChange per passenger
+12.6%
+11.0%
+4.8%
Analysis of underlying net retail income
86.2
95.6
An excellent start to 2010 for retail
See page 20 for notes and defined terms

12
263.7
277.0
8.9
5.0
Q1 2009 Q1 2010
+6.9%
Underlying cost discipline maintained
Analysis of adjusted operating costs
See page 20 for notes and defined terms
• Adjusted operating costs up 6.9%
• Key drivers
– employment – non-cash pension service costs
– intra-group – central overhead re-allocation from Gatwick
– utilities – electricity unit costs
• Underlying adjusted operating costs up 1.6%
+1.6%
Additional pension service
charges vs 2009
Add central overheads charged to
Gatwick
Underlying
Reported

13
Significant reduction in non-cash exceptional items and fair
value adjustments
Q1 2009
(£m)
Q1 2010
(£m)
Exceptional item: share of change in BAA Airports pension scheme deficit 21.5 38.5
Exceptional item: accelerated depreciation on Heathrow Terminal 1/2 24.1 14.0
Fair value loss on financial instruments 165.0 15.0
Other exceptional items 0.0 2.1
Total 210.6 69.6

14
Interest payable and interest paid reconciliation
Q1 2009
(figures in £m) TotalSP
debenture
External
debtTotal
Net interest payable (profit and loss account) (327.2) (18.7) (177.3) (196.0)
Fair value loss on financial instruments 165.0 0.0 15.0 15.0
Net interest payable net of fair value loss/(gain) (162.2) (18.7) (162.3) (181.0)
Amortisation of financing fees and fair value adjustments 27.5 0.0 12.5 12.5
Interest capitalised (5.5) 0.0 (4.7) (4.7)
Underlying net interest payable (profit and loss account) (140.2) (18.7) (154.5) (173.2)
Other adjustments to reconcile to interest paid
Derivative interest prepayment amortisation 37.1 0.0 35.8 35.8
Movement in interest accruals/other (39.5) 0.8 33.6 34.4)
Net interest paid (cash flow statement) (142.6) (17.9) (85.1) (103.0)
Q1 2010
15
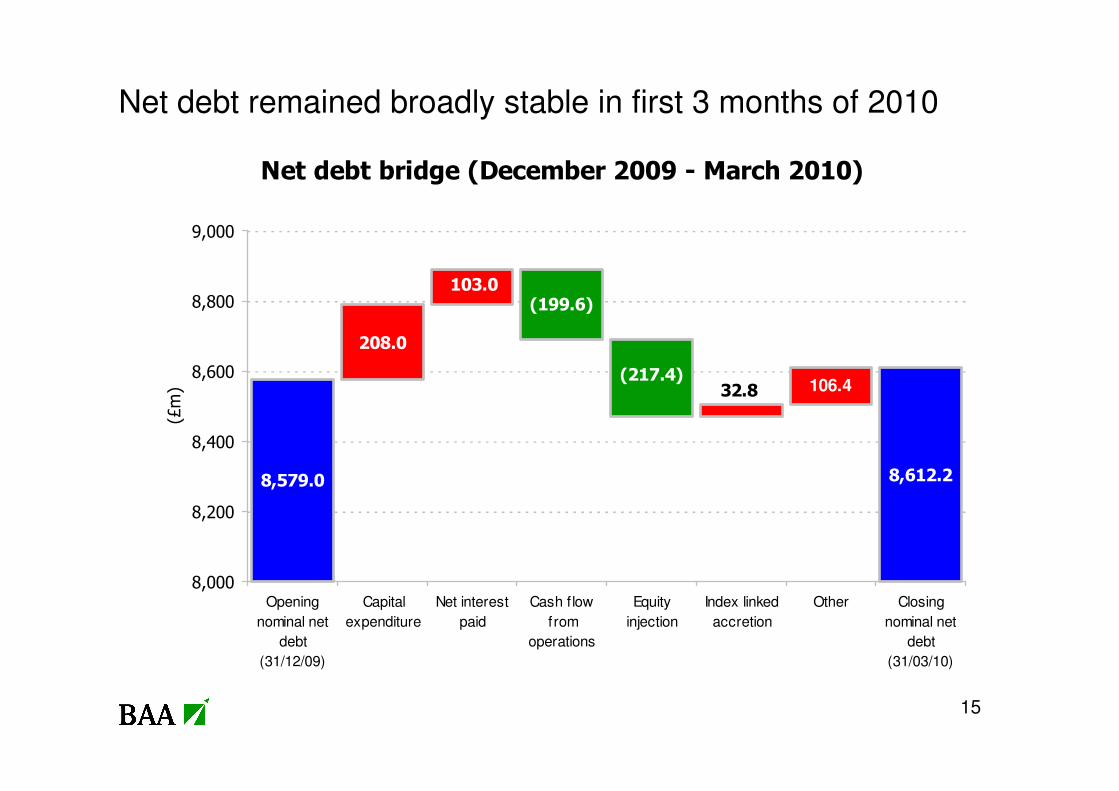
Net debt remained broadly stable in first 3 months of 2010
Net debt bridge (December 2009 - March 2010)
8,579.0 8,612.2
106.4
(199.6)103.0
208.0
(217.4)32.8
8,000
8,200
8,400
8,600
8,800
9,000
Opening
nominal net
debt
(31/12/09)
Capital
expenditure
Net interest
paid
Cash flow
from
operations
Equity
injection
Index linked
accretion
Other Closing
nominal net
debt
(31/03/10)
(£m)

16
(figures in £m unless otherwise stated) 30 September 2009 31 December 2009 31 March 2010Trigger
levels
Ratio inputs
Senior nominal net debt 8,771.0 7,919.6 7,952.8 n/a
Junior nominal net debt 9,771.0 8,579.0 8,612.2 n/a
Regulatory Asset Base 13,155.7 11,743.9 12,034.0 n/a
Ratios
Senior RAR 0.667x 0.674x 0.661x >0.700x
Junior RAR 0.743x 0.731x 0.716x >0.850x
Gearing ratios (RAR)
See page 20 for notes and defined terms
Further headroom against gearing ratios

17
• Strong financial performance
• Continued momentum in retail activities
• £28 million post-Q1 one-off impact of volcanic ash disruption
• Excluding this disruption, 2010 outlook in line with expectations
Conclusion

Appendix

19
Debt outstanding at
31 March 2010
Amount
Local
currency
S&P/Fitch
Rating Maturity
Senior (Class A) (£m) (m) (£m)
Bonds 680.2 999.9 680.2 A-/A- 2012/14
396.4 396.4 396.4 A-/A- 2013/15
512.9 749.9 512.9 A-/A- 2014/16
299.9 299.9 299.9 A-/A- 2016/18
510.2 750.0 510.2 A-/A- 2018/20
249.8 249.8 249.8 A-/A- 2021/23
749.6 749.6 749.6 A-/A- 2023/25
700.0 700.0 700.0 A-/A- 2026/28
199.9 199.9 199.9 A-/A- 2028/30
900.0 900.0 900.0 A-/A- 2031/33
237.9 237.9 237.9 A-/A- 2039/41
Total bonds 5,436.8 5,436.8
Bank debt Refinancing Facility 1,624.0 1,624.0 1,624.0 A-/A- 2011/13
EIB Facility 363.1 363.1 363.1 A-/A- 2010/22
Capex Facility 520.0 2,300.0 2,300.0 n/a 2013
Working Capital Facility 0.0 50.0 50.0 n/a 2013
Total bank debt 2,507.1 4,337.1
Total senior debt 7,943.9 9,773.9
Junior (Class B)
Bank debt Refinancing Facility 659.4 659.4 659.4 BBB/BBB 2011/13
Capex Facility 0.0 400.0 400.0 n/a 2013
Total junior debt 659.4 1,059.4
Gross debt 8,603.3 10,833.3
Cash (47.0)
Index-linked derivative accretion 55.9
Net debt 8,612.2
Amount and features of available facilities
Net debt is calculated on a nominal basis excluding intra-BAA group loans and restricted cash and including index-linked derivative accretion
Nominal net debt at 31 March 2010

20
Notes and defined terms• Page 2
– Percentage changes are relative to three months ended 31 March 2009
– All figures are for continuing operations only, i.e. excluding Gatwick
– Adjusted EBITDA is earnings before interest, tax, depreciation and amortisation and exceptional items
– NRI: net retail income; RAB: Regulatory Asset Base
– Net debt is calculated on a nominal basis excluding intra-BAA group loans and restricted cash and including index-linked derivative accretion
• Page 6– Totals and percentage change calculated using un-rounded passenger numbers
– European traffic includes North African charter traffic
• Page 9– Adjusted operating costs exclude depreciation and exceptional items
– Adjusted EBITDA is earnings before interest, tax, depreciation and amortisation and exceptional items
– Underlying Adjusted EBITDA adjusts reported Adjusted EBITDA in 2010 for £4.5 million of income under Gatwick transitional services agreements and £5.0 million in additional pension service costs and in 2009 for £12.5 million in aeronautical income due to phasing of tariff increases and £8.9 million of intra-group charges previously applied to Gatwick
– 2009 net debt and RAB figures are as at 31 December 2009
– RAB figure at 31 March 2010 is provisional with final figures to be published in the regulatory accounts for the year ended 31 March 2010
– Net debt is calculated on a nominal basis excluding intra-BAA group loans and restricted cash and including index-linked derivative accretion
• Page 11– Analysis excludes £2.9 million in non-recurring car parking income at Heathrow in three months ended 31 March 2009
• Page 12– Adjusted operating costs exclude depreciation and exceptional items
– Underlying adjusted operating costs in 2009 adds £8.9 million of intra-group charges previously applied to Gatwick and in 2010 deducts £5.0 million in additional pension service costs
• Page 16– Gearing ratio is the ratio of nominal net debt (including index-linked derivative accretion) to RAB. Net debt at 31 December 2009 and 31 March 2010
excludes £143.0 million in restricted cash from the Gatwick disposal held in escrow to meet potential pension commutation payments
– RAB figure at 31 March 2010 is provisional with final figures to be published in the regulatory accounts for the year ended 31 March 2010
– Senior gearing ratio could be reduced by utilising the currently undrawn junior tranche of capital expenditure facility
21
•This material contains certain tables and other statistical analyses (the “Statistical Information”) which have been prepared in reliance on publicly available information and may be subject to rounding. Numerous assumptions were used in preparing the Statistical Information, which may or may not be reflected herein. Actual events may differ from those assumed and changes to any assumptions may have a material impact on the position or results shown by the Statistical Information. As such, no assurance can be given as to the Statistical Information’s accuracy, appropriateness or completeness in any particular context; nor as to whether the Statistical Information and/or the assumptions upon which it is based reflect present market conditions orfuture market performance. The Statistical Information should not be construed as either projections or predictions nor should any information herein be relied upon as legal, tax, financial or accounting advice. BAA does not make any representation or warranty as to the accuracy or completeness of the Statistical Information.
•These materials contain statements that are not purely historical in nature, but are “forward-looking statements”. These include, among other things, projections, forecasts, estimates of income, yield and return, and future performance targets. These forward-looking statements are based upon certain assumptions, not all of which are stated. Future events are difficult to predict and are beyond BAA’s control. Actual future events may differ from those assumed. All forward-looking statements are based on information available on the date hereof and neither BAA nor any of its affiliates or advisers assumes any duty to update any forward-looking statements. Accordingly, there can be no assurance that estimated returns or projections will be realised, that forward-looking statements will materialise or that actual returns or results will not be materially lower that those presented.
•This material should not be construed as an offer or solicitation to buy or sell any securities, or any interest in any securities, and nothing herein should be construed as a recommendation or advice to invest in any securities.
•This document has been sent to you in electronic form. You are reminded that documents transmitted via this medium may be altered or changed during the process of electronic transmission and consequently neither BAA nor any person who controls it (nor any director, officer, employee not agent of it or affiliate or adviser of such person) accepts any liability or responsibility whatsoever in respect of the difference between the document sent to you in electronic format and the hard copy version available to you upon request from BAA.
•Any reference to “BAA” will include any of its affiliated associated companies and their respective directors, representatives or employees and/or any persons connected with them.
Disclaimer