Embed Size (px)
Citation preview

B6: Check-In/Check-Out Systems
Therese SandomierskiFlorida’s PBS:RtIB Project
Exemplar Presenters: Tim Loversky, Nathan JarotLakewood School, District 300, Carpentersville, IL

2
What to Expect
• Brief description of CICO– Not a detailed implementation guide
• Overview of systems-level supports needed to ensure effective Tier 2 interventions– RtI Framework
• Tim & Nathan: One school’s story
• Q&A

3
Tier 2 for Behavior
• For students who need support beyond what is provided by the universal system– Can expect ~10-15% (Gresham, 2004; Walker et. al., 1996)
• Most schools already implement Tier 2 interventions– Lack a systematic approach– What constitutes a “Tier 2” intervention?
• Most Tier 2 interventions aren’t well-researched (McIntosh et. al, 2009)

4
Tier 2 Supports are Most Effective When:
• Similar implementation across students
• All staff are trained on the interventions
• Continuously available
• Quick access
• Consistent with school-wide expectations
• Based on function
• Data used continuously for progress monitoring(OSEP, 2005)

5
Why CICO?• Meets all OSEP guidelines• Growing evidence base
– Filter et. al., 2007– Hawken & Horner, 2003– March & Horner, 2002– McCurdy, Kunsch, & Reibstein, 2007– Todd et. al., 2008– And more!
• Effective, easy, cost-efficient• “Standard Protocol” approach?

Universal PBSClassroom-Level PBS
CICO
Classroom Consultations
Adjusted CICOsSmall Groups
PTRWraparound
ERASE FBA/BIP
Monitoring the Progress & Outcomes
of Students
Monitoring the Progress & Outcomes
of the System
Continuum of Services

7
What Does CICO Look Like?
• Daily positive adult contact– First thing in the morning, last thing in the afternoon– ALWAYS positive!
• Bernard, 1995; Biglan, 1995; Furlong & Morrison, 2000; Masten, Best, & Garmezy, 1990; Metzler et al., 1998
• Builds on the school-wide expectations– Teacher feedback throughout the day
• Pre-corrections, earned praise
• Home/School partnership

8
Responding to Problem Behavior in Schools, 2nd Edition:
The Behavior Education ProgramDeanne A. Crone
Leanne S. HawkenRobert H. Horner

Example Check-in RecordFrom Crone et. al, 2004
Check-in Leader:Date:
Check-in Check-out
Student Name
Paper Pencil Notebook DPR Parent Copy
DPR School Copy
% Daily Points
John A.
Richard C.
Donald R.
70
92
?

Adapted from Crone, Horner & Hawken (2004)
Points Possible: ______
Points Received: ______
% of Points: ______
Goal Achieved? Y N
Daily Progress Report
Name: __________________________ Date: ____________
Rating Scale: 3=Good day 2= Mixed day 1=Will try harder tomorrow
GOALS:
Teacher Comments: I really like how…____________________________________________________________________________________________________________________________________________________________________________________________________________________________________________________________________________________________________________________________
HR 1st 2nd 3rd 4th L 5th 6th
BE RESPECTFUL
BE RESPONSIBLE
BE ON TIME
Parent Signature(s) and Comments: _______________________________________________

11
First Step: Laying the Foundation
• Tier 1 System in place– Fidelity: BoQ 70+; SET 80/80– Most students receive 0-1 office discipline referrals (ODRs)
– Consistent teaching, rewarding, discipline
• Disaggregated data– By ethnicity, disability– Identify classroom-level needs
• Tier 2 data system in place/identifiedHawken & Horner, 2003; Walker, et. al., 1996

12
Team Structure: Necessary Roles
• Communication with Tier 1, Tier 3, and academics
• Behavioral expertise
• Knowledge of interventions, legal guidelines
• Resource allocation
• Data systems: screening, progress monitoring, evaluation

13
Identifying Students
• ODRs are not enough• Combination of screening measures, ODRs
– Who collects, analyses data?
• Staff may be reluctant to refer at first– Label/Stigma– Lack of resources (programs, money, time)– Implications for training/roll-out
Walker, Cheney, Stage, Blum & Horner, 2005

14
Screening Measures• ODRs, Attendance, other data….
• Participation in Tier 1 systems– Token tracking, attendance at events
• Teacher Nomination Process
• Grade-Level Team Nomination process
• Normed Measures

15
Prioritizing Students• Contact with Tier 1 system• Multiple referrals, settings• Number of teachers nominating for support• Academics, attendance• Function of behavior/Identified Needs• Turbulence factor• Other risk factors
• Poor peer relations• Low self-esteem• Few resources/little support

16
Intervention Selection – “EBPs?”
• Based on function of behavior, identified needs
• Comprehensive data based decision making vs. “I think it might work”/opinion
• Research and theory to support intervention use (i.e., similar population, demographics, setting, etc.)
• Ongoing evaluation of fidelity, use of intervention, and outcomes

17
Intervention Integrity• Permanent products
– CICO: Sample check-in records, Behavior Report Cards (Hawken & Horner, 2003)
– Worksheets, posters, etc…
• Intervention-Specific (BEP, Steps to Respect)
• Checklists (Iovannone, 2009)
– Self-Assessments– Outside Observer Assessments
• Student outcomes guide use

18
Using DBRCs to Progress Monitor
• Chafouleas et. al. (2007):– External observers vs. teachers
• DBRC completed by external observers similar to direct observation by external observers
• Degree of effectiveness (strength of response) may be dependent on rater
– Appropriate for initial levels of progress monitoring

19
Progress Monitoring: Students• Gresham (2005); • Cheney, Flower, & Templeton (2008):
– *Percentage of change (percentage difference from successful days in baseline to successful days in treatment)
– Absolute change (D baseline mean to treatment mean)– Effect size (considers standard deviation of baseline)– Percent non-overlapping data points-PND (percent of
intervention points over highest baseline point)– Reliable Change Index-RCI (considers variability in
distribution of change scores)
• Decision points for behavior: there are none

20
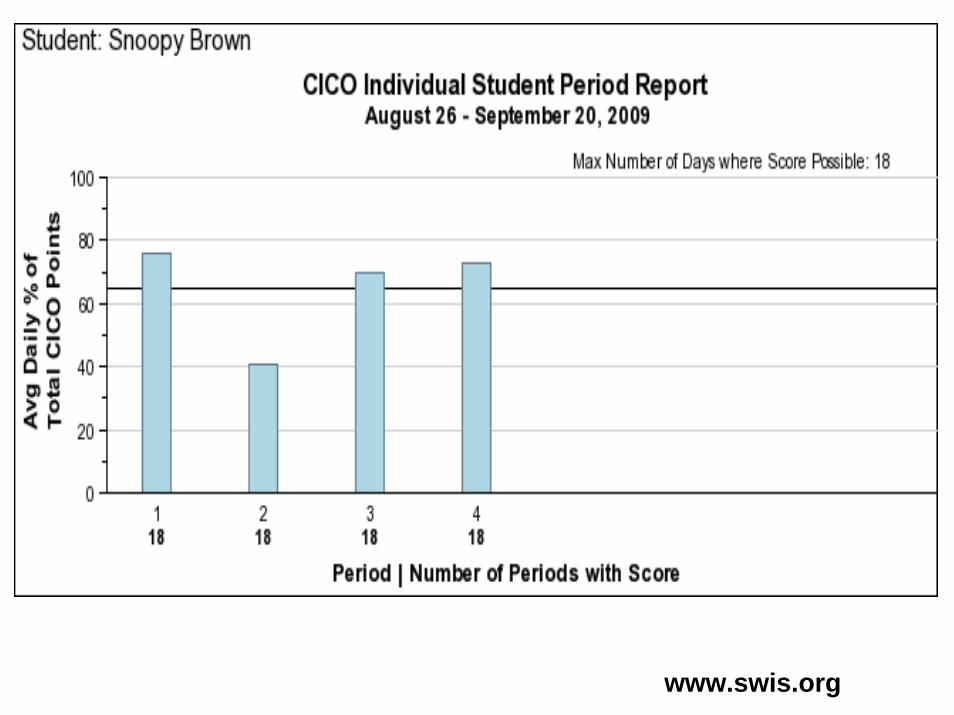
Progress Monitoring: System
• Tier 2 is unique (McIntosh, Campbell, Carter, & Dickey 2009):– Is lack of response due to:
• Intensity of intervention – does s/he need more?• Match of intervention – was it the right treatment?
• Implementation of the intervention• Overall effectiveness of the intervention – is it
working for anyone?

www.swis.org

www.swis.org

www.swis.org

www.swis.org
www.swis.org

www.swis.org

27
Effective Tier 2 Systems
• Ensure critical systems-level features are in place– Benchmarks for Advanced Tiers (BAT)– PBS Implementation Checklist (PIC)– Checklist for Individual Student Systems (CISS)– Individual Student Systems Evaluation Tool (ISSET)
• Make data-based decisions for choice of interventions– Function– Evidence Base
• Watch your data

28
ReferencesCheney, D., Flower, A., & Templeton, T. (2008). Applying Response to
Intervention metrics in the social domain for students at-risk of developing emotional or behavioral disorders. Journal of Special Education, 42(2), 108-126.
Filter, K.J., McKenna, M.K., Benedit, E.A., Horner, R.H., Todd, A.W., & Watson, J. (2007). Check-in/Check-out: A post-hoc evaluation of an efficient, Tier II-level targeted intervention for reducing problem behavior in schools. Education and Treatmentof Children, 30(1), 69-84.
Gresham, F.M. (2004). Current status and future directions of school-based behavioral interventions. School Psychology Review, 33(3), 326-343.
Hawken, L.S., & Horner, R.H. (2003). Evaluation of a targeted intervention within a schoolwide system of behavior support. Journal of Behavioral Education, 12(3), 225-240.

29
ReferencesIovannone, R. (2009). What’s worked in measuring fidelity, PTR Research.
Personal communication. Contact lead presenter for additional information.
March, R.E., & Horner, R.H. (2002). Feasibility and contributions of functional behavioral assessment in schools. Journal of Emotional and Behavioral Disorders, 10, 158-170.
McCurdy, B.L., Kunsch, C., & Reibstein, S. (2007). Tier II prevention in the urban school: Implementing the Behavior Education Program. Preventing School Failure, 12-19.
McIntosh, K., Campbell, A., Russell-Carter, D., & Dickey, C. (2009). Differential effects of a Tier Two behavior intervention based on function of problem behavior. Journal of Positive Behavior Interventions, 11(2), 82-93.

30
ReferencesTodd, A.W., Kaufman, A., Meyer, G., & Horner, R.H. (2008). The effects of
a targeted intervention to reduce problem behaviors: Elementary school implementation of Check-In/Check-Out. Journal of Positive Behavioral Interventions, 10, 46-55.
Walker, B., Cheney, D., Stage, S., Blum, C., Horner, R. (2005). School-Wide screening and Positive Behavior Supports: Identifying and supporting students at risk for school failure. Journal of Positive Behavior Interventions, 7, 194-204.
Walker, H. M., Horner, R. H., Sugai, G., Bullis, M., Sprague, J. R., Bricker, D., et al. (1996). Integrated approaches to preventing antisocial behavior patterns among school-age children and youth. Journal of Emotional and Behavioral Disorders, 4, 194- 209.

31
Thank You for Attending!
http://flpbs.fmhi.usf.edu
Exemplar Presenters: Tim Loversky, Nathan Jarot
Lakewood School, District 300, Carpentersville, IL