Embed Size (px)
Citation preview

B TECH PROJECT 2012
D E P A R T M E N T O F C I V I L
E N G I N E E R I N G , N I T
R o u r k e l a
A T h e s i s S u b m i t t e d b y
M A Y U R E S H P A N D A
1 0 8 C E 0 1 2
A STUDY ON THE
QUALITY OF THE
WATER RESOURCES
OF CUTTACK CITY

B TECH PROJECT 2012 1
DEPARTMENT OF CIVIL ENGINEERING, NIT Rourkela
A STUDY ON THE QUALITY OF
THE WATER-RESOURCES
OF CUTTACK CITY
A THESIS SUBMITTED FOR THE PARTIAL FULFILMENT OF REQUIREMENTS FOR
DEGREE OF BACHELOR OF TECHNOLOGY IN CIVIL ENGINEERING
BY
MAYURESH PANDA (108CE012)
UNDER THE GUIDANCE OF
Prof. S. JENA
DEPARTMENT OF CIVIL ENGINEERING
NIT ROURKELA
ROURKELA-769008.

B TECH PROJECT 2012 2
DEPARTMENT OF CIVIL ENGINEERING, NIT Rourkela
CERTIFICATE OF APPROVAL
It is certified that the thesis entitled A STUDY ON
THE QUALITY OF THE WATER-RESOURCES OF
CUTTACK CITY submitted by Mr. Mayuresh Panda (108CE012)
has been strictly carried out under my supervision for partial
fulfillment of requirements for the Degree of Bachelors of
Technology in Civil Engineering from National Institute of
Technology, Rourkela, and this work has not been plagiarised from
elsewhere to the best of my knowledge.
..................................................
Prof S. Jena
Assistant Professor
Department of Civil Engineering
National Institute of Technology, Rourkela

B TECH PROJECT 2012 3
DEPARTMENT OF CIVIL ENGINEERING, NIT Rourkela
ACKNOWLEDGEMENT
I am really privileged to have done my project work
under the supervision of Sri S. Jena whose invaluable advise , apt
mentoring and guidance as well as support throughout my project
kept me on the right track and to act according to my potential.
I would also like to offer my sincere gratitude to
Prof. Ramakar Jha for his excellent tips for my project from time to
time.
Last but not the least, I would also like to express
my obligations to the Environmental Engineering laboratory assistant,
without whose help I could never have finished the project in this
stipulated time period .
MAYURESH PANDA
108CE012

B TECH PROJECT 2012 4
DEPARTMENT OF CIVIL ENGINEERING, NIT Rourkela
CONTENTS
Certificate………………………………………………………..2
Acknowledgement……………………………………………….3
Contents………………………………………………………….4
List of Figures
1.1…………. Map of Cuttack
3.1…………. Sampling Stations
5.1…………. Parameters for Kathajodi 2007
5.2…………. Parameters for Kathajodi 2008
5.3…………. Parameters for Kathajodi 2009
5.4…………. Parameters for Kathajodi 2010
5.5…………. Year wise pH comparison for Kathajodi
5.6…………. Year wise Total Solids comparison for Kathajodi
5.7…………. Year wise DO comparison for Kathajodi
5.8…………. Year wise BOD comparison for Kathajodi
5.9…………. Comparison of year wise data for Mundali
5.10………... Comparison of year wise data for Purighat
5.11………... Comparison of year wise data for Khannagar
5.12………... Comparison of year wise data for Gopalpur
5.13………... Parameters for Mahanadi 2007
5.14………... Parameters for Mahanadi 2008
B TECH PROJECT 2012 5
DEPARTMENT OF CIVIL ENGINEERING, NIT Rourkela
5.15………. Parameters for Mahanadi 2009
5.16………. Parameters for Mahanadi 2010
5.17………. Year wise pH and Total Solids for Mahanadi
5.18………. Year wise DO and BOD for Mahanadi
5.19………. Comparison of year wise data for Chahata Ghat
5.20………. Comparison of year wise data for Gadgadia Ghat
5.21………. Comparison of year wise data for Zobra
5.22………. Comparison of year wise data for Kanheipur
List of Tables
5.1……….. Results of 1st Sampling for Kathajodi
5.2……….. Results of 2nd
Sampling for Kathajodi
5.3……….. Results of 3rd
Sampling for Kathajodi
5.4……….. Results of 4th
Sampling for Kathajodi
5.5……….. Results of 1st Sampling for Mahanadi
5.6……….. Results of 2nd
Sampling for Mahanadi
5.7……….. Results of 3rd
Sampling for Mahanadi
5.8……….. Results of 4th
Sampling for Mahanadi
5.9……….. Results of Groundwater Analysis
Abstract…………………………………………………………..7
Chapters :
1. Introduction…………………………………………………..8
1.1 Need of the Study
1.2 Objective of the Study
B TECH PROJECT 2012 6
DEPARTMENT OF CIVIL ENGINEERING, NIT Rourkela
2. Literature Review……………………………………………11
3. Sampling Techniques………………………………………..13
3.1 Study Area
3.2 Sampling Procedures
4. Experiments…………………………………………………17
4.1 Parameters
4.2 Analysis
4.2.1 Analysis method for pH
4.2.2 Analysis method for Turbidity
4.2.3 Analysis method for DO
4.2.4 Analysis method for BOD
4.2.5 Analysis method for Total Solids
4.2.6 Analysis method for Hardness
4.2.7 Analysis method for Iron
4.2.8 Analysis method for Chloride
5. Results and Discussions……………………………………25
5.1 Project Work
5.2 Results
5.2.1 Project Kathajodi
5.2.1.1 Sampling Results
5.2.1.2 OSPCB Data Analysis
5.2.2 Project Mahanadi
5.2.2.1 Sampling Results
5.2.2.2 OSPCB Data Analysis
B TECH PROJECT 2012 7
DEPARTMENT OF CIVIL ENGINEERING, NIT Rourkela
5.2.3 Sampling Results for Ground Water
5.3 Discussions
6. Conclusion………………………………………………….53
7. References………………………………………………….55

B TECH PROJECT 2012 8
DEPARTMENT OF CIVIL ENGINEERING, NIT Rourkela
ABSTRACT
. Cuttack is a delta surrounded by the Mahanadi and the Kathajodi
rivers on the eastern coast of Odisha. It has been the heart of all business activities and
many industries of the state on account of easy access and its location from the old days. As
the days passed by, the city constantly experienced a penetrating population from the
outskirts as well as from various parts of the state. Due to the presence of rivers on both the
sides, the city is restricted to expand its land area and it has been the sole reason for such a
thickly populated scenario now-a-days. According to the 2011 census, the population
density of Cuttack is about 666/km2 and the population of the city is 26,18,764.
The chemical and poisonous effluents from the industries are also
heavily affecting the atmosphere and water sources which are the surface water and ground
water. The surface water mainly constitutes of the Kathajodi and Mahanadi rivers. There
also lie a considerable amount of non-point sources on both the sides of these two rivers
which can never be neglected as they have a typical impact on the water quality. These
sources discharge into the rivers in plenty due to the lack of stringent rules and regulations.
As the city collects its water from the two rivers and a considerable
amount of population depends upon the river directly for their daily use, a study has
become necessary in the present days to determine suitability of these river water for
health and industrial purposes.
Keywords : Cuttack, Mahanadi, Kathajodi, Pollution

B TECH PROJECT 2012 9
DEPARTMENT OF CIVIL ENGINEERING, NIT Rourkela
CHAPTER 1
INTRODUCTION

B TECH PROJECT 2012 10
DEPARTMENT OF CIVIL ENGINEERING, NIT Rourkela
1.1 Need of the Study :
Our planet Earth is a live planet because of some special ingredients out of
which water plays a great role. Water has been considered as the most important and vital
resource for the upbringing of the biological sphere as well as the human civilisation. The
other agents which are responsible for the biosphere on globe are Air, Heat, Soil and Sky. All
these agents are linked in between themselves to a much greater extent and any
irregularities in one of them affects others as well. Along with the progress of our
civilisation, this resource has begun being polluted and its quality started depleting due to
various reasons like the onset of industry, domestic wastes, runoff from urban areas, urban
and rural garbage.
With the onset and progress of human civilisation, it has constantly been
observed that the coastal areas as well as the river banks have been the most populated
spots on account of the availability of ample water resources for the maintenance of daily
life along with farming and other climatic advantages. The cities and towns always have
shown a rising trend of population because of the easy earning sources due to the various
industries which are set up to meet the increasing demand of the growing civilisation.
Because of this, day by day the urban areas are being more densely populated and as a
result, the surrounding areas of the cities are suffering from various kinds of pollutions like
the air pollution, water pollution, soil pollution and many more due to the sewage, garbage,
dumps and barnyard manures etc.
Similarly, Cuttack is a delta surrounded by the Mahanadi and the Kathajodi
rivers on the eastern coast of Odisha. It has been the heart of all business activities and
many industries of the state on account of easy access and its location from the old days.
The chemical and poisonous effluents from the industries are also heavily affecting the
atmosphere and water sources which are the surface water and ground water. The surface
water mainly constitutes of the Kathajodi and Mahanadi rivers.
There also lie a considerable amount of non-point sources on both the
sides of these two rivers which can never be neglected as they have a typical impact on the

B TECH PROJECT 2012 11
DEPARTMENT OF CIVIL ENGINEERING, NIT Rourkela
water quality. These sources discharge into the rivers in plenty due to the lack of stringent
rules and regulations.
1.2 Objective of the Study :
The chief and primary sources of water supply to the city are the two
rivers. Their water is used as the main domestic supply through municipality pipes and its
use spreads across various fields of life in the city. A considerable amount of the population
uses the river water directly for fulfilling their daily demands. Considering the requirement
of the availability of pure water which meets the public standards for the daily use purpose,
the water of these rivers as well as the ground water must be pure and clean which doesn’t
have the potential to cause any threat for the health of people.
A few studies have been carried out to determine the water quality of
these rivers for the purpose of finding out the suitability of their domestic and industrial
use. So, the sole purpose of this study is to assess the present scenario of water quality of
the two rivers as well as the ground water of the Cuttack city. This has been shown in the
following map.
Fig 1.1

B TECH PROJECT 2012 12
DEPARTMENT OF CIVIL ENGINEERING, NIT Rourkela
Chapter 2
LITERATURE
REVIEW

B TECH PROJECT 2012 13
DEPARTMENT OF CIVIL ENGINEERING, NIT Rourkela
As mentioned earlier, a few studies have been carried out regarding
the surface and ground water quality of Cuttack city. A study carried out by the researchers
shows that the ground water of Cuttack city collected near drains exceeded the value
recommended by IS:10500 for NO3- and Na+ (Das, Sahoo and Sinha ; 2008 ).
Another study by the researchers of Banki Autonomous College
reveals that the surface water quality is a bit acidic mainly at the both ends of the city due
to the presence of industry. Higher values of bicarbonates also indicate the hardness of the
surface water (Das et al ; 2009).
In another study, it has been found out that there is severe
concentration of dissolved metal in the water due to heavy pollution on account of
industrial pollution. The salinity played a major role in the water chemistry. The major
reasons behind the pollution were the agricultural inputs and industrial effluents (Chauhan
and Ramanathan ; 2008).
A group of researchers from Bhubaneswar state that the
deoxygenation rate of the lotic water of the city was much higher than the reoxygenation
rate (Das and Acharya ; 2003).
The ‘Odisha State Pollution Control Board’ also conducts annual tests
before, on and after Kartik Purnima to determine the parameters like pH, Total dissolved
solids, Dissolved Oxygen (DO), Biochemical Oxygen Demand (BOD) etc. which can be used as
a handy source of information.

B TECH PROJECT 2012 14
DEPARTMENT OF CIVIL ENGINEERING, NIT Rourkela
Chapter 3
SAMPLING
TECHNIQUES

B TECH PROJECT 2012 15
DEPARTMENT OF CIVIL ENGINEERING, NIT Rourkela
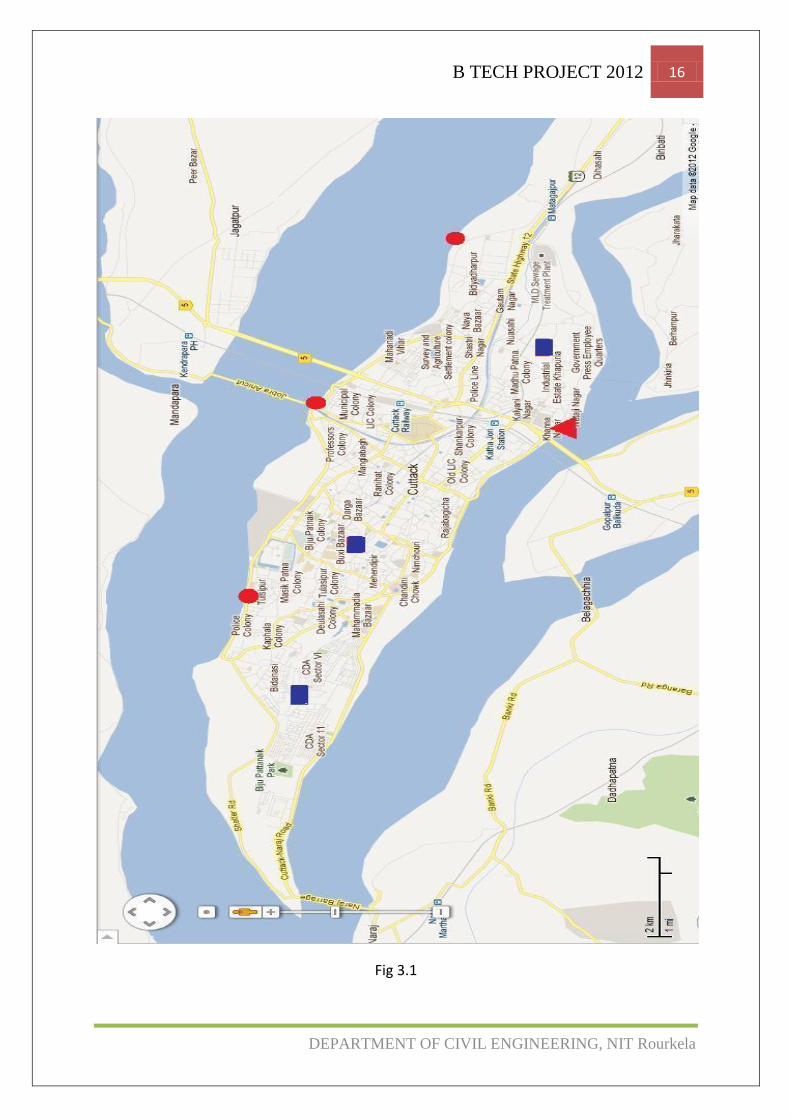
3.1 Study Area :
For having a thorough knowledge about the present scenario, the
project work was divided into three categories which were carried out in the due course of
time. The parts which constitute the project are :.
1. Study of the Kathajodi River
2. Study of the Mahanadi River
3. Study of Ground Water.
The sampling site for the Kathajodi river was Khannagar and those
for the Mahanadi were Gadgadia ghat, Zobra and Kanheipur. The ground water samples
were collected from Madhupatna, Buxibazar and Bidanasi. The sampling stations have been
highlighted in the following map. The Mahanadi flows on the northern side and the
Kathajodi is on the southern side. The rectangles depict the ground water sampling stations.
B TECH PROJECT 2012 16
DEPARTMENT OF CIVIL ENGINEERING, NIT Rourkela
Fig 3.1

B TECH PROJECT 2012 17
DEPARTMENT OF CIVIL ENGINEERING, NIT Rourkela
3.2 Sampling Procedure :
The samples were collected on a monthly basis for both the rivers. They
were normally collected in the afternoons in two plastic non-reacting bottles of 2litres
capacity each. Immediately after sampling, preservatives were added to them and the
bottles were recapped and sealed by the application of hot molten wax. These sealed
bottles were put in a thermocol box and the box was put inside a deep fridge till it was
carried to NIT Rourkela for carrying out the laboratory analysis. Sodium thiosulphate
preservatives were used for sampling in tablet forms.
General Rules of Sampling :
Take some extra care to avoid the contamination of the water sample and the container.
Don’ts :
Contaminate the bottle by the touching the inside of bottle.
Contaminate the bottle lid through touching the inside.
Put the bottle lid on the ground while doing sampling.
Rinse the bottle before sampling .
Transport the aquatic facility water samples with other water samples .
Sampling Collection Procedure :
1. If wearing the long sleeve shirt, roll sleeves of the shirt up past elbow
2. Take a labelled sterile the 250ml sample bottle. Make sure that you keep the lid on the bottle .
3. Hold sterile bottle in hand near it’s base, and carefully remove and hold cap with the other hand. Don’t touch the inside of the cap when sampling.
4. Tip enough water from bottle to leave air space of about 1-2 cm from rim of the bottle.
5. Carefully replace the cap immediately .

B TECH PROJECT 2012 18
DEPARTMENT OF CIVIL ENGINEERING, NIT Rourkela
Chapter 4
EXPERIMENTS
B TECH PROJECT 2012 19
DEPARTMENT OF CIVIL ENGINEERING, NIT Rourkela
4.1 Experiment Parameters :
After the samples were preserved and brought to the laboratory, various
experimental analysis were carried out on them in order to determine the water quality.
The parameters for which tests were conducted include the following viz.
Test for alkalinity i.e. pH Test
Test for Turbidity
Test for Dissolved Oxygen (DO)
Test for Biochemical Oxygen Demand (BOD)
Test for Total Solids
Test for Hardness
Test for Iron content
Test for Chloride content
The experiments were carried out at the Environmental Engineering
Laboratory of Civil Engineering Department . The DO and BOD are the parameters of great
importance and are interrelated. BOD shows us the presence of micro organisms in a water
body. Turbidity, Total Solids and Hardness directly give us a measure to decide whether the
water meets the desirable and required conditions or not.
B TECH PROJECT 2012 20
DEPARTMENT OF CIVIL ENGINEERING, NIT Rourkela
4.2 Analysis :
The basic purpose of conducting the analysis work is to compare the
results for various parameters of the given water sample with the IS:10500 drinking water
standard and as well as the required steps can also be taken for disinfection and others
purposes.
4.2.1 Analysis method for pH :
The pH value of the water sample is nothing but the logarithm of the
reciprocal of hydrogen ions activity present in moles per litre. For neutral sample, it is
generally found to be around 7. If it is less than 7, the sample is considered to be acidic and
for the opposite case, it is taken as basic. For general water, ph ranges between 6 to 8.
Procedure :
- The pH value of a given water sample can be measured directly in modern days by
using a pH meter.
- A beaker or glass in association with a calomel electrode is dipped into the water and
it detects the concentration of Hydrogen ion.
- The meter is pre calibrated by using standard solution of known pH values and can
be used directly to read the value.
4.2.2 Analysis method for Turbidity :
Turbidity is caused in natural waters by finely divided suspended particles
of clay, silt, sand or some organic materials. The standard unit for turbidity is that turbidity
which is produced by mixing 1mg of finely divided silica (SiO2) in distilled water.
The apparatus used for measuring Turbidity of water sample is
‘Nephelometer’ which uses the principle of scattering of light. In this instrument, the sample
scatters the light that impinges on it. The scattered light is measured by photometers which
are kept at right angles to the original direction of the light. The unit used for the
measurement of Turbidity is known as the Nephelometric Turbidity Unit (NTU).
B TECH PROJECT 2012 21
DEPARTMENT OF CIVIL ENGINEERING, NIT Rourkela
Procedure :
- A small beaker is used for testing the sample inside the Nephelometer.
- It is first properly cleaned and filled with distilled water.
- The beaker containing distilled water is kept inside the instrument and the value is
adjusted to zero.
- The sample of water is then replaced in the beaker and test is carried out.
- The value of Turbidity is displayed on the monitor and it is taken down.
4.2.3 Analysis Method for Dissolved Oxygen :
Dissolved Oxygen in a water sample is detrmined by following Winkler’s
method. The saturation DO value is the maximum dissolved oxygen which a given water can
contain at a given temperature and pressure. In this principle, the water sample to be tested
is mixed with manganese sulphate (MnSO4) and an alkali iodide reagent. The Mn2+ ions
released from MnSO4 react with OH- ions of water to form white precipitate if no dissolved
oxygen is present otherwise they give rise to a red precipitate.
Mn2+ + 2OH- Mn(OH)2 (white precipitate)
Mn2+ + 2OH- + ½ O2 MnO2 (red precipitate) + H2O
MnO2 then oxidises I- ion to Iodine (I2).The amount of I2 is estimated from
titration with the N/40 Sodium Thiosulphate. The expected DO value for suitability in
domestic use is 4-8mg/ltr.
Procedure :
- The 300ml BOD bottle is rinsed and filled with 100ml of the sample.
- 2ml of manganrse sulphate and 2ml of azide alkali potassium iodide is added to the
water.
- If red precipitate is formed then 2ml of concentrated sulphuric acid is added for the
formation of iodide.

B TECH PROJECT 2012 22
DEPARTMENT OF CIVIL ENGINEERING, NIT Rourkela
- Then it is titrated against the N/40 sodium thiosulphate solution using starch
indicator until the blue colour just disappears.
4.2.4 Analysis Method for Biochemical Oxygen Demand (BOD) :
BOD shows us the the extent of micro-organisms present and their
behaviour in a water-sample. It gives the value of the amount of oxygen required for
complete biological decomposition of waste and organic matter present in water thereby
reducing the carbonaceous material from the water.
BOD is measured using the Oxytop measuring instrument. The oxytop
measuring system is based upon pressure measurement which notes the pressure by
perizoresistive electronic sensors. It can note the features like automatic temperature
detection, data logging and measuring range value.
Procedure :
- The BOD bottle is properly rinsed first.
- The oxygen saturation is then exactly measured.
- The magnetic stirring rod is put in the bottle.
- 2 sodium hydroxide tablets are put into the rubber quiver with a tweezer.
- Oxytop is screwed directly on the top of the bottle.
- The bottle is kept for 5 days at 200C.
- The oxytop automatically starts measuring the oxygen consumption/
- This recorded value is then converted to BOD520 value with the help of standard
tables.

B TECH PROJECT 2012 23
DEPARTMENT OF CIVIL ENGINEERING, NIT Rourkela
4.2.5 Analysis Methods for Total Solids :
The total amount of solids consists of the suspended solids with the
dissolved solids. The total solids in a sample can be determined by evaporating the water
sample and weighing the left residue. The amount of suspended solids is obtained by
filtering the water sample and weighing the residue left on the filter paper. The difference
between the total solids and the suspended solids gives the amount of dissolved solids.
Procedure :
- The crucible is cleaned at first and then put on an oven.
- Then it is placed on the desiccator until it cools and then the weight is taken.
- 100ml of sample are taken in the crucible dish and it is placed in an oven for 24
hours.
- Then it is taken out of the oven and the weights are noted down.
4.2.6 Analysis method for Hardness of water :
Hardness of water is that characteristic which prevents the formation of
sufficient foam. The hardness is usually caused by the presence of calcium and magnesium
present in water which for scum by reaction with floc. Hard water are undesirable because
they lead to greater soap consumption. Carbonate hardness is caused by the divalent
metallic ions principally of Ca2+ and Mg2+ while sulphates, chlorides and nitrates cause non-
carbonate hardness.
Procedure :
- 50 ml of the sample was pipetted into the burette.
- The standard soap solution was added in small proportion at first shaking vigorously
after each addition.

B TECH PROJECT 2012 24
DEPARTMENT OF CIVIL ENGINEERING, NIT Rourkela
- As the end point was approached, the quantity added should be reduced to 0.1ml
per each addition.
- After a permanent lather was produced, the amount of soap solution used was
recorded.
- The addition of soap continued if lather disappeared again.
- It was continued until the amount of soap solution was able enough to create a
lather that could last up to 5 minutes.
4.2.7 Analysis Method for Iron content :
Iron in water exists as ferrite and ferric ions. Iron is very important for a
healthy body and the deficiency of this nutrient results in anaemia. Higher concentratrion of
iron in water can cause staining of fondry and porcelain when used in industry. The iron
content of surface water seldom reaches 1mg/ltr.
Procedure :
- Four volumetric flasks are chosen and cleaned thoroughly.
- 100ml of distilled water is taken in each of them.
- Fe solution was mixed to make 1,2,3,4 ppm solution in the samples.
- These samples were tested in the absorption spectrometer to get the plot of
absorbance ~ concentration.
- With the help of the graph obtained from the above step, the river water sample
was tested and directly it gave the concentration of iron in the sample.

B TECH PROJECT 2012 25
DEPARTMENT OF CIVIL ENGINEERING, NIT Rourkela
4.2.8 Analysis Method for Chloride Content :
Chlorides are widely found in all water samples and reasonable amount
of chlorides are not harmful though they cause a threat if the concentration surpasses
250mg/ltr. The principle of chloride detection works on the following outlines : This method
uses Silver Nitrate (AgNO3) because silver ions combine with chloride ion to produce a white
precipitate of Silver Chloride (AgCl). The end point is determined by using potassium
chromate indicator. Chromate ions combine with silver ions to form a reddish brown
precipitate of silver chromate. This gives the evidence that all chloride has been
precipitated.
Procedure :
- 50ml of sample is pipetted in two porcelain dishes.
- 1 ml of potassium chromate indicator was added.
- Standard silver nitrate solution was added to the sample with constant stirring until
a permanent reddish colour appears.
- The amount of AgNO3 used was noted and from this the chloride is calculated.

B TECH PROJECT 2012 26
DEPARTMENT OF CIVIL ENGINEERING, NIT Rourkela
Chapter 5
RESULTS &
DISCUSSIONS

B TECH PROJECT 2012 27
DEPARTMENT OF CIVIL ENGINEERING, NIT Rourkela
5.1 Project Work :
The chief part of the project work consists of monthly sampling of the
Kathajodi and the Mahanadi river . The samples were preserved and carried to the
Environmental engineering laboratory of NIT Rourkela and subsequent tests were carried
out on the samples in a period of hardly two days. For these times, the samples are kept in a
deep fridge with proper measures.
The project work and its results can be broadly classified into three parts
namely :
- Project Kathajodi
- Project Mahanadi
- Ground Water Survey
5.2 Results :
The results obtained for different parameters from the timely monthly
samplings and subsequent tests are expressed through the following tables and graphs. The
data for the last 10 years were also collected from the office of ‘Odisha State Pollution
Control Board’ and the data of last 4 years were analysed through the help of various charts.
5.2.1 Project Kathajodi :
It consists of two parts namely (i) Sampling Results and (ii) OSPCB Data.

B TECH PROJECT 2012 28
DEPARTMENT OF CIVIL ENGINEERING, NIT Rourkela
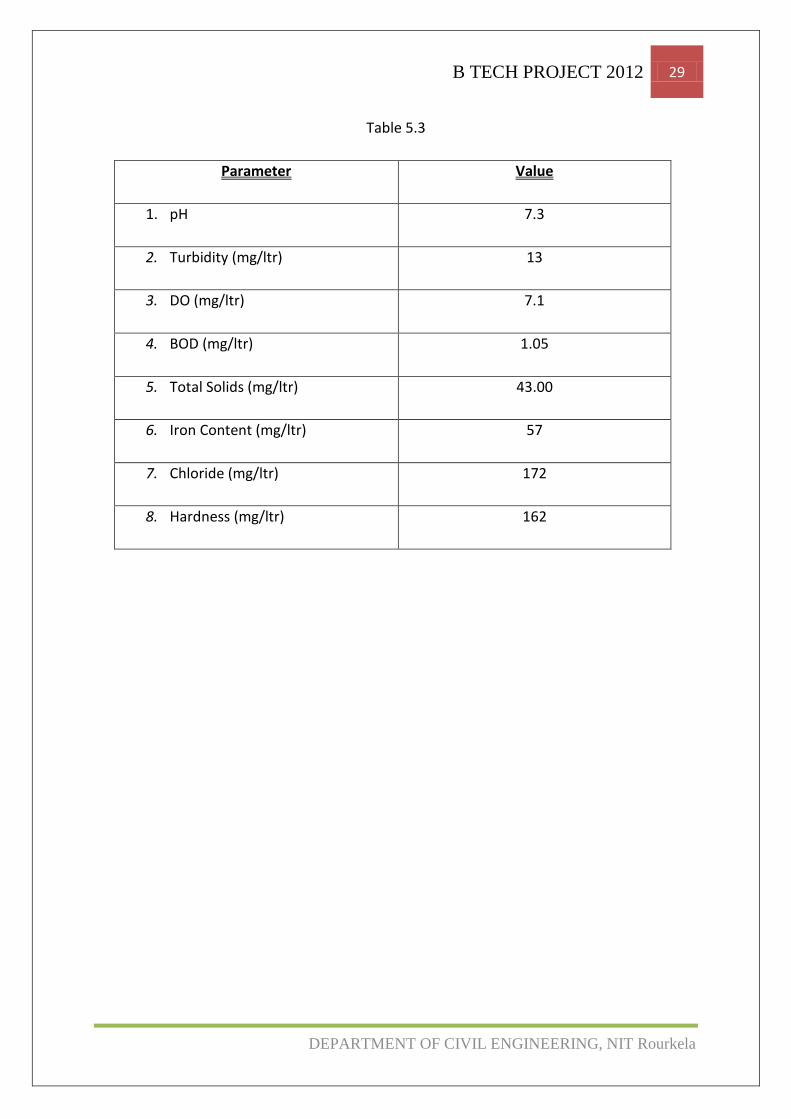
5.2.1.1 Sampling Results :
Table 5.1
Parameter Value
1. pH 7.4
2. Turbidity (mg/ltr) 21.0
3. DO (mg/ltr) 7.5
4. BOD (mg/ltr) 1.08
Table 5.2
Parameter Value
1. pH 7.3
2. Turbidity (mg/ltr) 13
3. DO (mg/ltr) 7.1
4. BOD (mg/ltr) 1.05
5. Total Solids (mg/ltr) 43.00
6. Iron Content (mg/ltr) 57
7. Chloride (mg/ltr) 172
8. Hardness (mg/ltr) 162
B TECH PROJECT 2012 29
DEPARTMENT OF CIVIL ENGINEERING, NIT Rourkela
Table 5.3
Parameter Value
1. pH 7.3
2. Turbidity (mg/ltr) 13
3. DO (mg/ltr) 7.1
4. BOD (mg/ltr) 1.05
5. Total Solids (mg/ltr) 43.00
6. Iron Content (mg/ltr) 57
7. Chloride (mg/ltr) 172
8. Hardness (mg/ltr) 162

B TECH PROJECT 2012 30
DEPARTMENT OF CIVIL ENGINEERING, NIT Rourkela
Table 5.4
Parameter Value
1. pH 7.3
2. Turbidity (NTU) 18
3. DO (mg/ltr) 7.2
4. BOD (mg/ltr) 1.47
5. Total Solids (mg/ltr) 39.10
6. Iron Content (mg/ltr) 65
7. Chloride (mg/ltr) 178
8. Hardness (mg/ltr) 142

B TECH PROJECT 2012 31
DEPARTMENT OF CIVIL ENGINEERING, NIT Rourkela
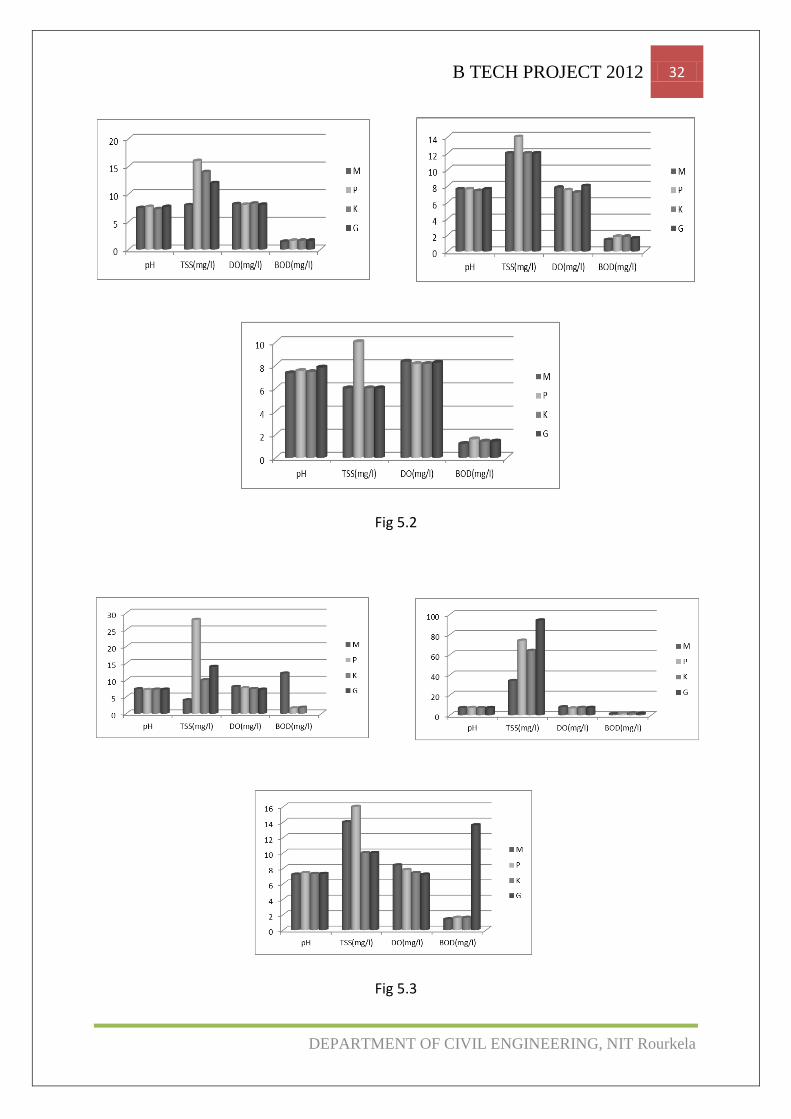
5.2.1.2 OSPCB Data Analysis :
OSPCB conducts 3 tests annualy for the Kathajodi and the Mahanadi
rivers. The three tests are carried out before, on and after Kartik Purnima. The data
expressed here through graphs have been collected from 4 stations viz. Mundali (M),
Purighat (P), Khannagar (K) and Gopalpur (G) for the years 2007, 2008, 2009 and 2010. The
parameters are pH, Total Solids (TSS), Dissolved Oxygen (DO) and Biochemical Oxygen
Demand (BOD). The results have been expressed in the following charts.
Fig 5.1
B TECH PROJECT 2012 32
DEPARTMENT OF CIVIL ENGINEERING, NIT Rourkela
Fig 5.2
Fig 5.3

B TECH PROJECT 2012 33
DEPARTMENT OF CIVIL ENGINEERING, NIT Rourkela
Fig 5.4
The BOD and Turbidity are showing much higher values in some cases
especially at Gopalpur. The causes might be that Gopalpur is a huge village and people are
directly dependent on the river for their maintenance of daily life. Another cause might be
that as it lies at one end of the city so obviously the concentration of the pollutants is higher
at this place.

B TECH PROJECT 2012 34
DEPARTMENT OF CIVIL ENGINEERING, NIT Rourkela
Fig 5.5
Fig 5.6

B TECH PROJECT 2012 35
DEPARTMENT OF CIVIL ENGINEERING, NIT Rourkela
Fig 5.7
Fig 5.8

B TECH PROJECT 2012 36
DEPARTMENT OF CIVIL ENGINEERING, NIT Rourkela
Fig 5.9

B TECH PROJECT 2012 37
DEPARTMENT OF CIVIL ENGINEERING, NIT Rourkela
Fig 5.10

B TECH PROJECT 2012 38
DEPARTMENT OF CIVIL ENGINEERING, NIT Rourkela
Fig 5.11
B TECH PROJECT 2012 39
DEPARTMENT OF CIVIL ENGINEERING, NIT Rourkela
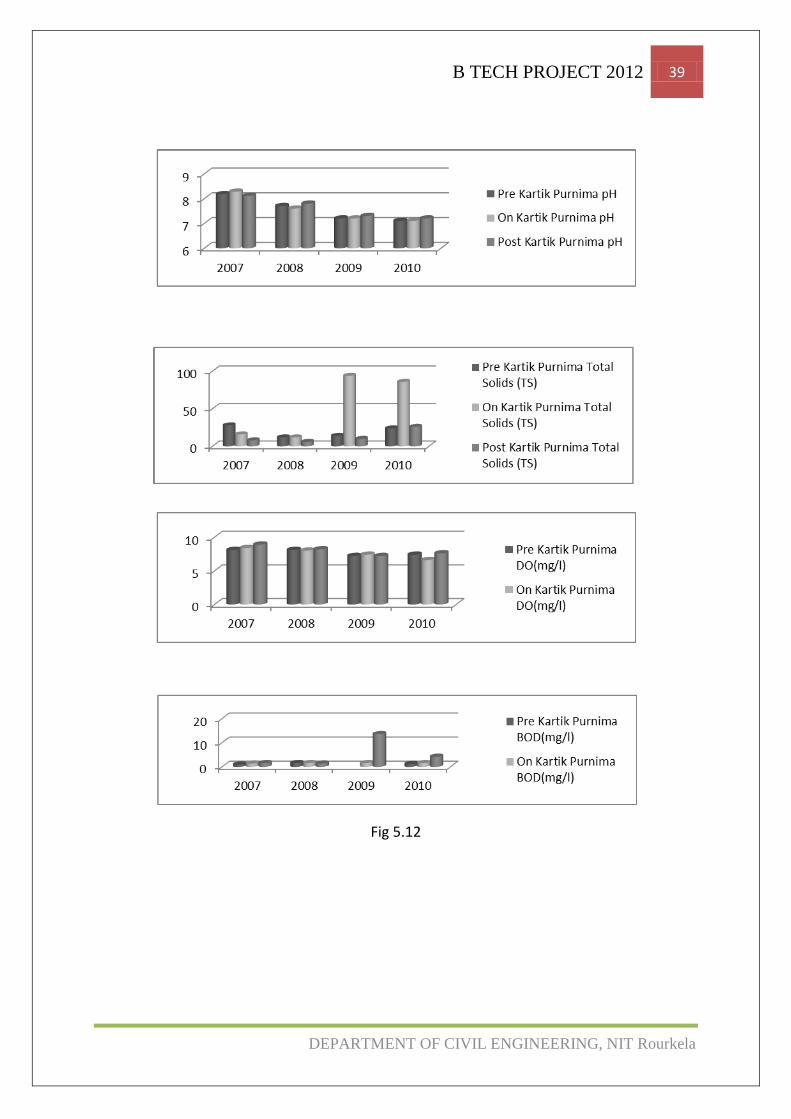
Fig 5.12

B TECH PROJECT 2012 40
DEPARTMENT OF CIVIL ENGINEERING, NIT Rourkela
5.2.2 Project Mahanadi :
Like Kathajodi, Project Mahanadi also consists of two parts namely
(i)Sampling Results (ii)OSPCB data analysis.
5.2.2.1 Sampling Results :
After the completion of sampling and tests for the river Kathajodi , the
project work for the 8th semester was the sampling and finally fitting a model for evaluating
the the effect of population of Cuttack city on the water quality of the Mahanadi and the
Kathajodi with the passage of time.
This time, unlike Kathajodi , 3 sampling points were chosen throughout
the whole stretch of the Mahanadi in Cuttack which are nearly equidistant viz. Gadgadia
ghat, Zobra and Kanheipur . The distance between Gadgadia ghat and Zobra is 6kms and
that between Zobra and Kanheipur is nearly 7.5kms .
Table 5.5
Sampling Point pH Turbidty
NTU
DO
Mg/ltr
BOD
Mg/ltr
Total
Solids
Mg/ltr
Iron
Content
Mg/ltr
Hardnes
Mg/ltr
Chloride
Mg/ltr
Gadgadia ghat 6.7 58 8.2 1.3 39.90 84 146 131
Zobra 6.9 22 8.0 1.8 40.06 68 153 146
Kanheipur 6.9 18 8.6 2.0 34.74 77 169 152

B TECH PROJECT 2012 41
DEPARTMENT OF CIVIL ENGINEERING, NIT Rourkela
Table 5.6
Sampling Point pH Turbidty
NTU
DO
Mg/ltr
BOD
Mg/ltr
Total
Solids
Mg/ltr
Iron
Content
Mg/ltr
Hardnes
Mg/ltr
Chloride
Mg/ltr
Gadgadia ghat 6.85 32 8.1 1.3 38.75 76 168 122
Zobra 6.65 18 8.2 1.5 41.22 39 152 143
Kanheipur 6.9 21 7.8 1.75 34.82 61 131 127
Table 5.7
Sampling Point pH Turbidty
NTU
DO
Mg/ltr
BOD
Mg/ltr
Total
Solids
Mg/ltr
Hardnes
Mg/ltr
Iron
Content
Mg/ltr
Chloride
Mg/ltr
Gadgadia ghat 7.3 28 7.4 1.6 35.25 142 57 97
Zobra 6.9 26 8.2 1.3 34.17 196 34 121
Kanheipur 6.9 21 7.8 1.75 34.82 181 81 103

B TECH PROJECT 2012 42
DEPARTMENT OF CIVIL ENGINEERING, NIT Rourkela
Table 5.8
Sampling Point pH Turbidty
NTU
DO
Mg/ltr
BOD
Mg/ltr
Total
Solids
Mg/ltr
Hardnes
Mg/ltr
Iron
Content
Mg/ltr
Chloride
Mg/ltr
Gadgadia ghat 7.5 26 7.2 1.2 28 124 57 87
Zobra 7.3 30 7.8 1.4 29.8 174 34 91
Kanheipur 8.1 21 8.1 1.8 41.1 169 81 94
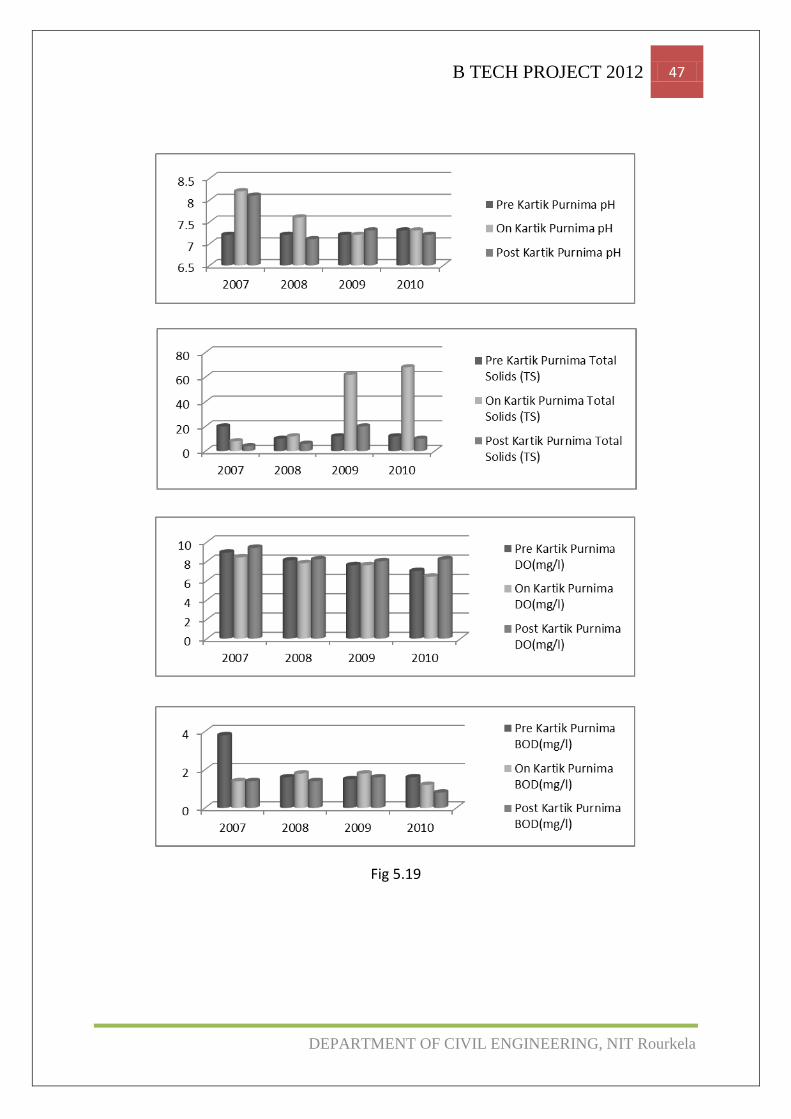
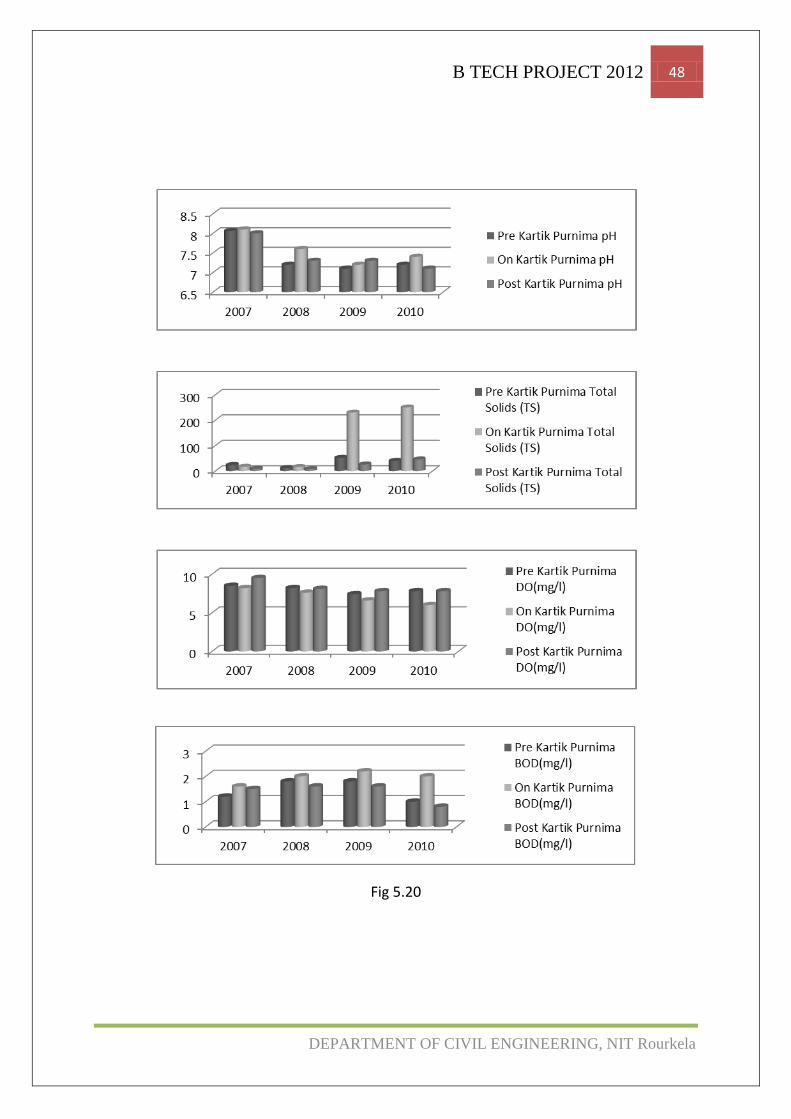
5.2.2.2 OSPCB Data Analysis :
OSPCB conducts 3 tests annualy for the Kathajodi and the Mahanadi
rivers. The three tests are carried out before, on and after Kartik Purnima. The data
expressed here through graphs have been collected from 4 stations viz. Chahata Ghat (C),
Gadgadia ghat (G), Zobra (Z) and Kanheipur (K) for the years 2007, 2008, 2009 and 2010. The
parameters are pH, Total Solids (TSS), Dissolved Oxygen (DO) and Biochemical Oxygen
Demand (BOD). The results have been expressed in the following charts.

B TECH PROJECT 2012 43
DEPARTMENT OF CIVIL ENGINEERING, NIT Rourkela
Fig 5.13
Fig 5.14

B TECH PROJECT 2012 44
DEPARTMENT OF CIVIL ENGINEERING, NIT Rourkela
Fig 5.15
Fig 5.16

B TECH PROJECT 2012 45
DEPARTMENT OF CIVIL ENGINEERING, NIT Rourkela
Fig 5.17

B TECH PROJECT 2012 46
DEPARTMENT OF CIVIL ENGINEERING, NIT Rourkela
Fig 5.18
B TECH PROJECT 2012 47
DEPARTMENT OF CIVIL ENGINEERING, NIT Rourkela
Fig 5.19
B TECH PROJECT 2012 48
DEPARTMENT OF CIVIL ENGINEERING, NIT Rourkela
Fig 5.20

B TECH PROJECT 2012 49
DEPARTMENT OF CIVIL ENGINEERING, NIT Rourkela
Fig 5.21

B TECH PROJECT 2012 50
DEPARTMENT OF CIVIL ENGINEERING, NIT Rourkela
Fig 5.22

B TECH PROJECT 2012 51
DEPARTMENT OF CIVIL ENGINEERING, NIT Rourkela
5.2.3 Sampling Analysis of Ground Water :
Due to various discrepancies, only 1 sampling and test could be carried
out. The stations were Madhupatna, Buxibazar and Bidanasi lying within the city. The results
were compared with the values obtained from Odisha State Pollution Control Board. It is
presented in the following table.
Table 5.9
Parameter Madhupatna Buxibazar Bidanasi Ground Water
Board
pH 7.3 7.9 6.9 7.2
Turbidity (NTU) 19 14 18 12
Total Solids(ppm) 1129 1412 1285 1048
Hardness (ppm) 128 157 192 148
Sodium (ppm) 304 408 322 298
Sulphate (ppm) 132 108 146 122
Chloride (ppm) 211 199 198 208

B TECH PROJECT 2012 52
DEPARTMENT OF CIVIL ENGINEERING, NIT Rourkela
5.3 Discussions :
The parameters which were tested for the rivers Kathajodi and
Mahanadi generally always lied in between the prescribed values only except some
anomalies. The reason behind these exceptions can be attributed to various facts e.g. faulty
methods of sampling, faulty analysis, considerable increase in the activity of the population
on some particular days like Kartik Purnima, effluents on a particular time of a day or week
etc.
For Kathajodi river, the Gopalpur sampling site showed the most
exceptions as it is a village and people directly depend on the river for their daily activities
because of which BOD at times was too high as compared to the other points. Turbidity also
constantly gives a higher value for all the sampling points on the particular day of Kartik
Purnima on account of the boat floating culture of the state on the same day and access to
the river increases exponentially on that festival.
Similarly, for Mahanadi river, the Gadgadia ghat sampling site showed the
maximum number of anomalies. The cause behind this can be attributed to the fact that
there lie 2-3 villages surrounding this area and people are directly dependent on the river
for their life. Turbidity also constantly gives a higher value for all the sampling points on the
particular day of Kartik Purnima on account of the boat floating culture of the state on the
same day and access to the river increases exponentially on that festival.

B TECH PROJECT 2012 53
DEPARTMENT OF CIVIL ENGINEERING, NIT Rourkela
Chapter 6
CONCLUSION

B TECH PROJECT 2012 54
DEPARTMENT OF CIVIL ENGINEERING, NIT Rourkela
Neglecting a few anomalies, generally all the parameters lied within the
prescribed range though some of them are showing an increasing trend day by day viz.
turbidity, BOD etc. which is obviously a threat for a dangerous tomorrow. Till they have not
got the potential to cause any threat to the health. But if the present trend of effluent
discharge from industry, garbage dumping, usage of barnyard manure etc. goes on, then it
will surely cause a havoc within the next 10-15 years. The population of the city will be
affected to a much greater extent as the rivers on the two sides are the main water-
supplying units for such a thickly populated urbanization.
So, the preventive measures must be taken and implemented strictly from
right now to get a control over the situation. It must be remembered that ”A STITCH IN TIME
SAVES NINE”.

B TECH PROJECT 2012 55
DEPARTMENT OF CIVIL ENGINEERING, NIT Rourkela
CHAPTER 7
REFERENCES
B TECH PROJECT 2012 56
DEPARTMENT OF CIVIL ENGINEERING, NIT Rourkela
REFERENCES :
[1] Fresenius, W. Quentin, K. E. and Scheider, “WATER ANALYSIS – A PRACTICAL GUIDE TO
PHYSICOCHEMICAL, CHEMICAL AND MICROBIOLOGICAL WATER EXAMINATION AND
QUALITY ASSURANCE”, Springer Verlag, pp. 804
[2] DAS J. and ACHARYA B.C. “HYDROLOGY AND ASSESSMENT OF SURFACE WATER
QUALITY IN CUTTACK CITY, INDIA”, Mineralogy and Metallography Department,
Regional Research Laboratory, Bhubaneswar (CSIR)
[3] CHAUHAN R. and RAMANATHAN AL, “EVALUATION OF WATER QUALITY OF THE
RIVERS IN THE EAST COAST OF INDIA”, School of Environmental Sciences, Jawaharlal
Nehru University, New Delhi.
[4] REZA R. and SINGH G. “HEAVY METAL CONTAMINATION AND ITS INDEXING APPrOACH
TO RIVER WATER”, Department of Environmental Science and Engineering, Indian
School of Mines, Dhanbad-826004, Jharkhand, India.
[5] DRINKING WATER SPECIFICATION: IS: 10500
[6] David, A. (1963). Report on fisheries survey of river Gandak (North Bihar). Sur. Rep. Cent.
Inl. Fish Res. Inst. Barrackpore, 1: 24.
[7] http://www.slideshare.net/ishan_trivedi2005/permissible-limits-of-water-pollutants-in-
drinking-water
[8] Environmental Health Directorate, Department of Health Western Australia.
[9] Hem, J. D. 1985. Study and Interpretation of chemical characteristics of natural water,
U.S.G.S. Water supply Publication. pp. 2254-2264.