Embed Size (px)
Citation preview

Managed By
B INVESTMENTS – 9M19 EARNINGS RELEASE
17 NOVEMBER 2019

I. Key Updates

3
KEY UPDATES | PORTFOLIO COMPANIES UPDATES
Company Key Updates
TOTAL Egypt is on track to finalize the construction of 7 new stations in 2019; (i) 2 new stations opened in2Q19, (ii) construction of another 2 stations completed in 3Q19 pending finalizing the licensing process tocommence operations, and (iii) another 3 stations currently under construction expected to be completedbefore year-end
TOTAL Egypt was awarded new contracts in 3Q19: (i) renewal of lubricants contract with an automotivedealer, (ii) a new lubricants contract in the industrial segment, and (iii) 9 new contracts in the CommercialSales segment
Note (1): In November 2019, Ebtikar increased its stake in Masary to 69.8%
In 3Q19, Giza Systems’ was awarded new projects worth EGP 1.4bn, a record high for a single quarter, whichconsist of key integration projects awarded in Egypt and Saudi Arabia as well as a USD 6mn project in Uganda,showing further expansion in the company’s geographical coverage
The company was also awarded the largest Smart Water Meters project in Saudi Arabia for a value of c. USD30mn in 2Q19
Ebtikar’s injected capital reached EGP 727mn, of which EGP 150mn has been deployed by B Investments
During 3Q19, Ebtikar increased its stake in Masary from 35.7% to 65.5%¹
Tamweel Holding launched its auto finance business line
Tamweel Mortgage is currently ranked 2nd in YTD loan originations (EGP 403mn) as per the Financial RegulatoryAuthority (FRA) 3Q19 Mortgage Report
Infinity Solar’s 3 solar energy generating plants are all currently operational and generating income
The three assets have collected all billed dues from the Ministry of Electricity
In 2019, Gourmet launched 4 new stores, increasing its retail area by c. 75% to reach a total area of c. 2,000sqm:
2 stores in Alexandria (first permanent expansion outside of Cairo)
1 seasonal store on the North Coast (Stella)
1 permanent store in East Cairo (Water Way 2)
II. 9M19 Financial Highlights
5
9M19 FINANCIAL HIGHLIGHTS | CONSOLIDATED FINANCIAL PERFORMANCE
Revenues
EGP mn
172
246187 187
2017 9M182018 9M19
+43%
EGP 187mn
Revenues
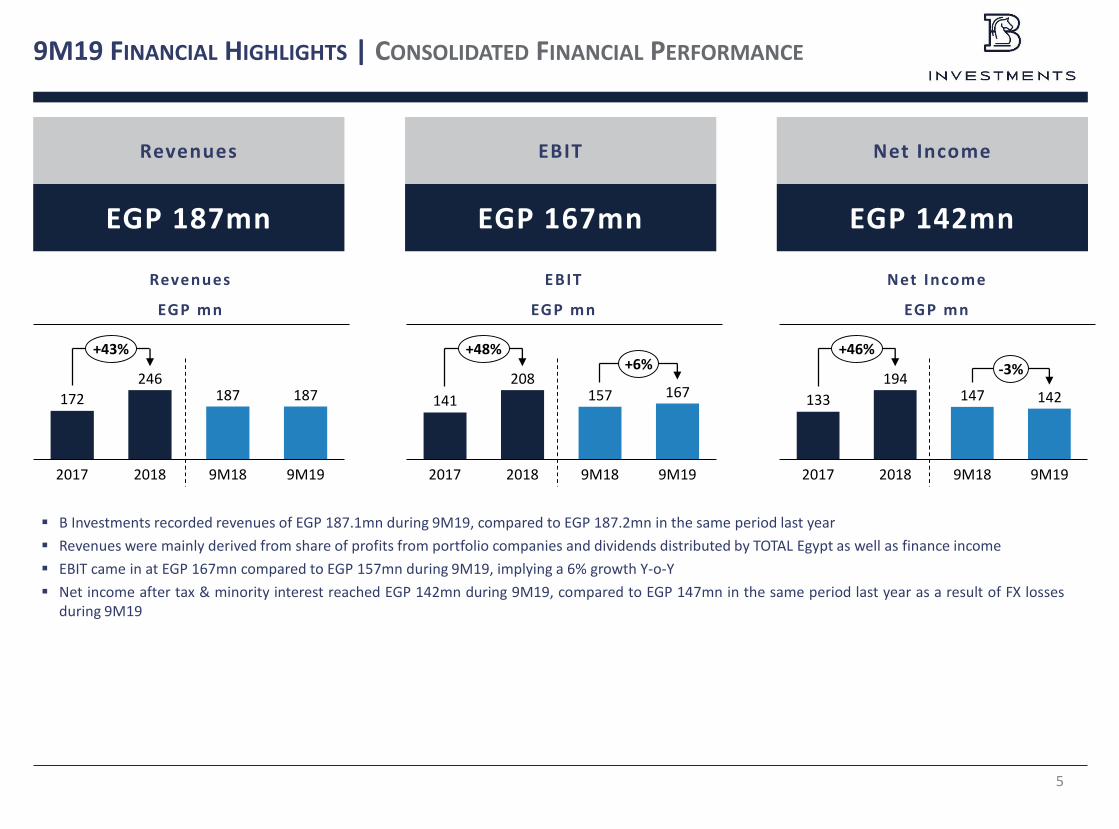
B Investments recorded revenues of EGP 187.1mn during 9M19, compared to EGP 187.2mn in the same period last year
Revenues were mainly derived from share of profits from portfolio companies and dividends distributed by TOTAL Egypt as well as finance income
EBIT came in at EGP 167mn compared to EGP 157mn during 9M19, implying a 6% growth Y-o-Y
Net income after tax & minority interest reached EGP 142mn during 9M19, compared to EGP 147mn in the same period last year as a result of FX lossesduring 9M19
EBIT
EGP mn
Net Income
EGP mn
141
208157 167
2017 9M182018 9M19
+48%+6%
133
194147 142
20182017 9M199M18
+46%
-3%
EGP 167mn
EBIT
EGP 142mn
Net Income

6
9M19 FINANCIAL HIGHLIGHTS | CONSOLIDATED FINANCIAL POSITION
Note (1): Portfolio companies are recorded on B Investments’ financial statements at book value (i.e. not recorded at market value)
Assets ¹
EGP mn
Liabi l i t ies
EGP mn
Cash & Cash Equivalents
EGP mn
Equity
EGP mn
1,0671,709 1,738
2017 2018 30-Sep-19
1,0141,663 1,701
2017 2018 30-Sep-19
200
504409
2017 2018 30-Sep-19
4941
30
20182017 30-Sep-19
EGP 1,738mn
Assets
EGP 30mn
Liabil ities
EGP 1,701mn
Equity
EGP 409mn
Cash & Cash Equivalents
B Investments assets amounted to EGP 1,738mn on September 30th 2019 compared to EGP 1,709mn on December 31st 2018, primarily due to solidperformance of its portfolio investments
B Investments continues to have no interest-bearing debt
Total equity grew to EGP 1,701mn as of September 30th 2019

7
9M19 FINANCIAL HIGHLIGHTS | CONSOLIDATED INCOME STATEMENT
EGP mn 2017 2018 9M18 9M19
Revenues
Dividend Income from Available for Sale Investments 22.6 26.2 26.2 27.7
Group's Share of Profits of Joint Venture and Associate Entities 104.1 126.3 91.1 96.5
Finance Income 34.3 84.2 61.2 60.7
Reverse of Impairment in Notes Receivable 3.2 - - -
Provisions no Longer Required - 2.5 2.5 -
FX Gain - 1.8 1.9 -
Capital Gains - - - 1.6
Other Income 7.4 4.5 4.3 0.6
Total Revenues 171.6 245.5 187.2 187.1
Expenses
Management Fees (11.7) (16.3) (11.6) (13.9)
Consulting Fees (10.7) (16.3) (12.8) (5.5)
BOD Allowance - (0.2) (0.2) (0.1)
Depreciation of Investment Properties (0.3) (0.3) (0.2) (0.3)
FX Gains (Losses) (4.0) - - (16.7)
Provisions (2.5) - - -
Total Expenses (29.2) (33.1) (24.9) (36.5)
Impairment in Debtors (3.1) - - -
Impairment In Assets (2.7) - - -
Impairment in other debit balances - (3.0) (3.0) -
Net Profit Before Tax 136.6 209.4 159.3 150.5
Income Tax (18.4) (14.4) (11.0) (12.3)
Deferred Tax 13.4 (0.5) (0.4) 4.5
Net Profit After Tax 131.7 194.5 147.8 142.7
Minority Interest (1.5) 0.6 0.8 0.7
Net Profit After Tax and Minority Interest 133.2 193.9 147.0 142.1

8
9M19 FINANCIAL HIGHLIGHTS | CONSOLIDATED BALANCE SHEET
Note (1): Loans to Associates is a shareholder loan extended to the project companies of Infinity Solar
EGP mn 2017 2018 9M19Non-current assetsIntangible Assets 2.7 2.7 2.4 Investments in Associates 314.6 389.8 433.2 Available for Sale Investments 141.3 141.3 141.3 Investments in Joint Ventures 190.8 427.4 504.7 Investment Properties 113.5 113.3 66.6 Loans to Associates¹ 94.7 105.3 102.8
Projects Under Construction - 7.9 24.2 Total-Non Current Assets 857.6 1,187.6 1,275.2
Current AssetsTreasury Bills 105.5 416.7 336.6 Due from Related Parties 1.2 1.2 4.1 Other Debit Balances 8.2 15.5 30.5 Cash and Cash at Banks 95.0 87.7 72.0
Debtors from Selling Investment Properties - - 19.2
Total Current Assets 209.8 521.1 462.5 Total Assets 1,067.4 1,708.8 1,737.7 EquityIssued and Paid-up Capital 584.5 800.1 800.1 Reserves 38.7 280.1 261.8 Retained Earnings 257.6 388.5 497.4 Net Profit for the Period 133.2 193.9 142.1 Equity attributable to shareholders of the parent company 1,014.0 1,662.6 1,701.5 Minority Interest 4.4 5.1 6.0 Total Equity 1,018.5 1,667.7 1,707.5
Non-Current LiabilitiesDeferred Tax Liability 8.9 9.4 4.9 Total Non-Current Liabilities 8.9 9.4 4.9
Current LiabilitiesDue to Related Parties 3.0 5.0 4.7 Accounts Payable and Other Credit Balances 8.3 6.6 4.6 Income Tax 18.4 13.2 12.3 Provisions 10.4 6.8 3.6 Total Current Liabilities 40.0 31.6 25.3 Total Equity and Liabilities 1,067.4 1,708.8 1,737.7

III. Portfolio Companies

10Note (1): Ebtikar is considered a greenfield transaction as it is a holding company established by B Investments as the designated vehicle to invest in the Non-Banking Financial Services sector, yet all of its investments other than Vitas Misr are growth capital and buyout transactions
Sector
Company
Descr ip t ion
Transact ion Type
Real Estate
Madinet Nasr for Housing & Development (“MNHD”) is one of Egypt’s leading and most profitable listed mixed-use real estate developers
The company caters to the growing middle and upper-middle market demand
MNHD has a sizeable land bank; 9mn sqm at premium locations
Buyout
Oi l & Gas
One of the largest downstream private sector players in Egypt with a network of 235 retail stations
In partnership with B Investments, TOTAL Egypt acquired Shell and Chevron’s downstream networks in Egypt
TOTAL Egypt operates four business lines: retail network, commercial & industrial, aviation and lubricants
Growth Capital
IT System Integrat ion
Giza Systems is one of the leading systems integration and engineering services (IT / BPO) platforms in Egypt, the Middle East and Africa
The company offers a vast range of mission critical IT based solutions to a range of industries, aiding clients’ efficiency and effectiveness in running operations
Management Buyout
Non-Banking
F inanc ia l Ser v ices
Ebitkar is a designated vehicle to invest in the Non-Banking Financial Services sectorthrough a partnership between B Investments and MM Group For Industry And International Trade
Ebtikar is invested in electronic payments (Bee & Masary), microfinance (Vitas Misr), leasing, mortgage, factoring and auto finance (Tamweel Group)
Greenfield¹ / Growth Capital
Renewable Energy
A portfolio of three solar power generation plants located in Ben Ban, Egypt with a total capacity of 130MW
The project is in partnership with Infinity Solar Energy SAE; a local solar power plant developer and ib vogt; an international solar developer established in Germany
The three solar energy generating plants are all currently operational and generating income
Growth Capital
Manufacturing
Management Buyout
Food & Beverage
Established in 1888, BĒARD is one of the world’s leading Swiss brand names in the flatware and hollowware industry
The company leverages on the vibrant hospitality sector in Egypt
Growth Capital
The Gourmet Group is comprised of 2 companies in the F&B sector: Gourmet Egypt (GE), a food retailer with 13 stores across Egypt; and Gourmet Food Solutions (GFS), which is comprised of 2food manufacturing and processing facilities that cater to GE as well as to other F&B clients
PORTFOLIO COMPANIES
11
PORTFOLIO COMPANIES | MNHD
Margin %
EBITDA (EGP mn)
295 3071,154 1,277 1,559 1,207 822
20152014 2016 9M1820182017 9M19
-32%
C A G R : 5 2 %
40% 40% 57% 52% 56% 57%
Pre-Sales(EGP mn)
Net Revenues (EGP mn)
744 771
2,0142,428
2,7832,060
1,439
20152014 2016 2017 9M182018 9M19
-30%
1,039 823
3,425
5,163 5,495
3,842 3,736
2014 20172015 2016 2018 9M199M18
-3%
C A G R : 5 2 %
Net Income(EGP mn)
EPS (EGP)
203 262
767 932 1,085840
626
201720152014 2016 2018 9M18 9M19
-26%
C A G R : 5 2 %
27% 34% 38% 38% 39% 43%
0.21 0.27
0.770.84 0.82
0.530.37
9M18 9M1920172014 2015 20182016
-30%
C A G R : 4 0 %
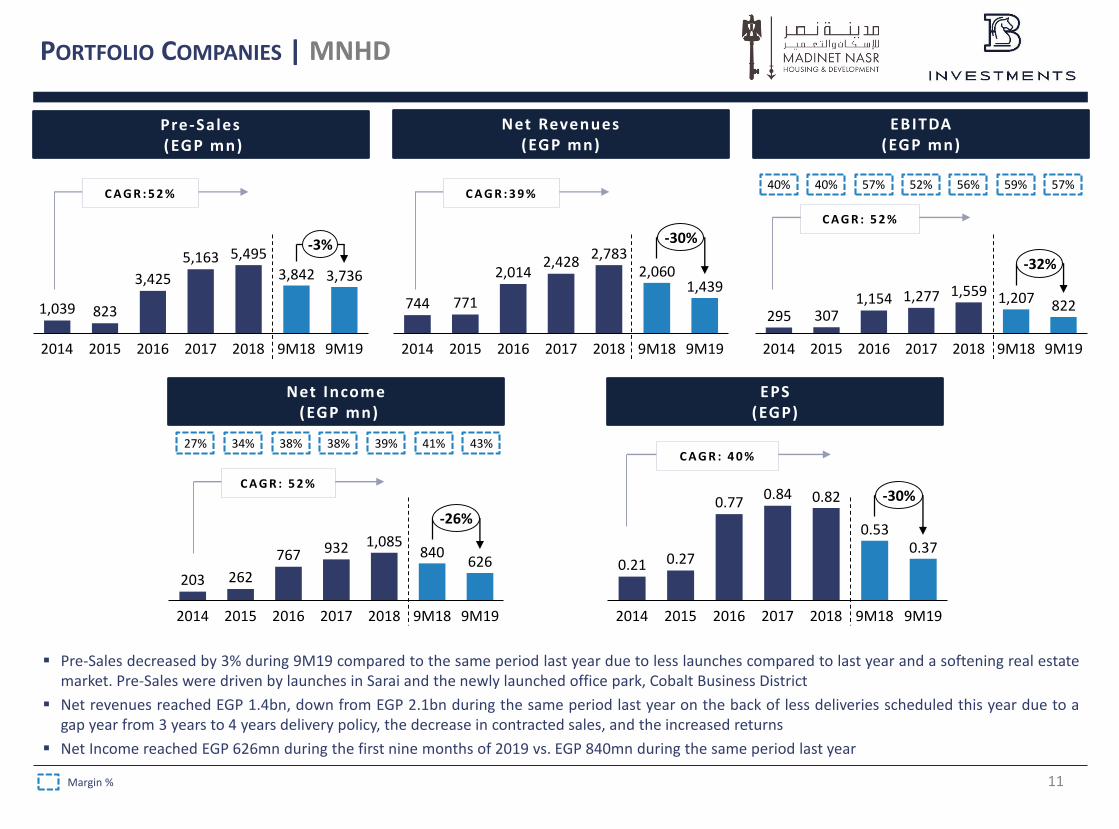
Pre-Sales decreased by 3% during 9M19 compared to the same period last year due to less launches compared to last year and a softening real estatemarket. Pre-Sales were driven by launches in Sarai and the newly launched office park, Cobalt Business District
Net revenues reached EGP 1.4bn, down from EGP 2.1bn during the same period last year on the back of less deliveries scheduled this year due to agap year from 3 years to 4 years delivery policy, the decrease in contracted sales, and the increased returns
Net Income reached EGP 626mn during the first nine months of 2019 vs. EGP 840mn during the same period last year
59%
41%
C A G R : 3 9 %

12FY figures are based on audited financial statements which are prepared using Egyptian GAAP accounting standards9M figures are based on management accounts which are prepared using IFRS i.e. adjusted for employee profit share
PORTFOLIO COMPANIES | TOTAL EGYPT
TOTAL Egypt recorded revenues of EGP 18.2bn during 9M19 recording a Y-o-Y growth of 23%
The growth in revenues is attributed to the recent increase in fuel prices that took place in July 2019
8,959
15,130
20,787
14,805
18,203
9M182016 2017 2018 9M19
+23%
Revenues(EGP mn)
910
1,442 1,514
1,1501,341
20172016 2018 9M18 9M19
+17%
Gross Profit (EGP mn)

13
PORTFOLIO COMPANIES | GIZA SYSTEMS
Backlog 1
(EGP mn)Revenues (EGP mn)
Gross Profit (EGP mn)
39% 39%
51% 49%784 1,049
1,8122,206 2,539
3,704
2015 2016 201920182017 4Q19
8621,226
1,9992,368
1,245
2,245
2015 9M182016 2017 9M192018
+80%
140 173
335414
270345
9M182015 2016 20182017 9M19
+28%
61 78
178215
125164
2015 20172016 2018 9M18 9M19
+31%
29
63
91116
6885
20172015 9M192016 9M182018
+24%
C A G R : 4 0 %
EBITDA (EGP mn)
Net Income(EGP mn)
Giza Systems’ backlog as of September 30th 2019 reached EGP 3.7bn, driven by securing a significant amount of new awards during 9M19
Giza Systems was awarded new contracts worth EGP 1.4bn in 3Q19 which was the highest awards for a single quarter, signaling strong growth goinginto FY 2020
Revenues for 9M19 came in at EGP 2,245mn representing 80% Y-o-Y growth
C A G R : 4 3 %
C A G R : 5 3 % C A G R : 5 8 %
Note (1): Backlog refers to the total value of projects on hand at the beginning of each year/period (January 1st for every full year)
Key Updates
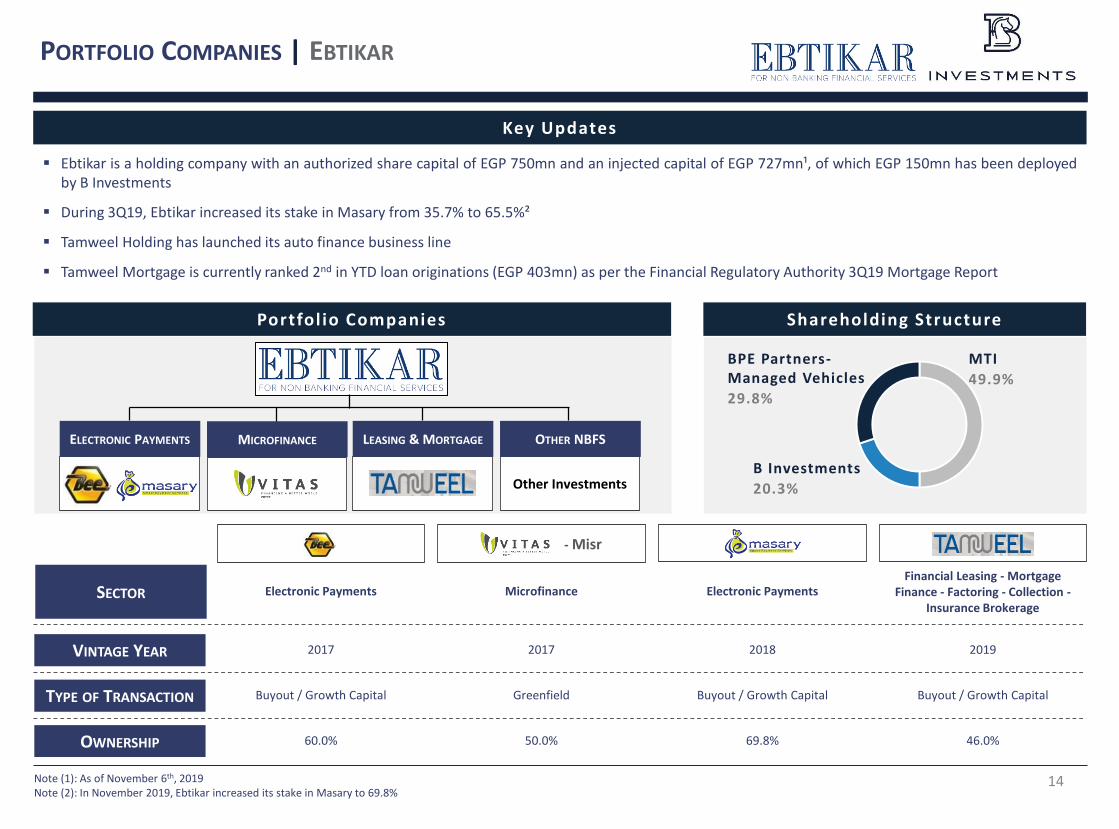
PORTFOLIO COMPANIES | EBTIKAR
14
Ebtikar is a holding company with an authorized share capital of EGP 750mn and an injected capital of EGP 727mn¹, of which EGP 150mn has been deployedby B Investments
During 3Q19, Ebtikar increased its stake in Masary from 35.7% to 65.5%²
Tamweel Holding has launched its auto finance business line
Tamweel Mortgage is currently ranked 2nd in YTD loan originations (EGP 403mn) as per the Financial Regulatory Authority 3Q19 Mortgage Report
Note (1): As of November 6th, 2019Note (2): In November 2019, Ebtikar increased its stake in Masary to 69.8%
Shareholding Structure
MTI
49.9%
BPE Partners-Managed Vehicles
29.8%
B Investments
20.3%
- Misr
SECTOR Electronic Payments Microfinance Electronic PaymentsFinancial Leasing - Mortgage
Finance - Factoring - Collection -Insurance Brokerage
VINTAGE YEAR 2017 2017 2018 2019
TYPE OF TRANSACTION Buyout / Growth Capital Greenfield Buyout / Growth Capital Buyout / Growth Capital
OWNERSHIP 60.0% 50.0% 69.8% 46.0%
Portfol io Companies
ELECTRONIC PAYMENTS MICROFINANCE LEASING & MORTGAGE
Other Investments
OTHER NBFS

15
PORTFOLIO COMPANIES | INFINITY SOLAR ASSETS
Note (1): Commercial Operation Date
Partners & Stakeholders
A portfolio of three solar power generation plants located in Ben Ban,Egypt with a total capacity of 130MW
The total cost of the projects is USD 190mn and is financed throughequity and debt from international development finance institutionsincluding European Bank for Reconstruction and Development (EBRD)and the International Finance Corporation (IFC)
The assets have secured long term sales agreements with the Egyptiangovernment and payments are secured by the Ministry of Finance
Company Overview Status Update
• Project Size: 30MW
• B Investments and BPE-managed-vehicles total share ownership: 30%
MMID
• Project Size: 50MW
• B Investments and BPE-managed-vehicles total share ownership: 30%
BSEP
• Project Size: 50MW
• B Investments and BPE-managed-vehicles total share ownership: 15%
PHOENIX
Power Generation - Solar Energy
130MW
MMID, BSEP, and Phoenix are all currently operational
The assets are generating revenues with positive cash flows and areon-track to issue dividends by year-end
The three assets have collected all billed dues from the Ministry ofElectricity
Commenced Construction
Mechanical Completion
Energization COD¹
MMIDThe 1st project to commence
operation in its vicinity
PhoenixBSEP
Aerial Pictures

16
PORTFOLIO COMPANIES | GOURMET EGYPT
Gourmet Egypt posted 9M19 revenues of EGP 357mn, up from EGP 278mn in 9M18, representing a 28% growth Y-o-Y
The company posted net income in 9M19 of EGP 8mn, compared to a net loss of EGP 1mn during the same period last year
Gourmet currently operates 13 stores across Egypt offering a wide range of groceries, high quality fresh produce and exclusive in-
house developed and manufactured products
During the first 9 months of 2019, Gourmet successfully opened 4 new stores, increasing its retail area by c. 75% to reach a
total area of c. 2,000 sqm
148
237
389
278
357
20182016 9M182017 9M19
+28%
Number of Stores
-7
3
-1
8
9M192017 2018 9M18
Figures for 2016, 2017, 2018, and 9M18 are based on normalized consolidated accounts; 9M19 figures are based on audited accounts
Revenues(EGP mn)
Net Income(EGP mn)
9 4
4
2020 TotalOct-18
17
2019
New stores expected to openC A G R : 6 2 %

17
PORTFOLIO COMPANIES | BĒARD
Metalart Key Financial Highl ights Key Updates
During 9M19, the company recorded revenues of EGP 25mn compared toEGP 22mn during the same period last year
The growth in revenue is attributed to the increase in hotel orders to thecompany on the back of the improvement in tourism; the company is ontrack to reach EGP 36mn in revenues this year
The company also conducts follow-up orders and repairs services in orderto increase its aftersales revenues
Net income for the period came in at EGP 2.3mn, representing a Y-o-Y dropof 30%, equivalent of EGP 1mn, due to increased operational costs, mainlysalaries and other G&A expenses
Following the recent trend in the market, the company started usingcolored stainless steel to produce colored flatware and hollowware ratherthan copper and stainless steel
CopperFlatware
Stainless Steel Flatware
Colored SteelFlatware
Metalart Shareholding Structure New Market Opportunit ies
Metalart is studying moving towards producing colored stainless steel flatware through purchasing of the new coloring machine
RevenueEGP mn
Gross ProfitEGP mn
Operating IncomeEGP mn
Net IncomeEGP mn
23.5 30.321.8 25.3
2017 2018 9M18 9M19
+29% +16%
9.6 13.3 9.9 8.9
2017 2018 9M18 9M19
+39%
-10%
2.84.4 4.3 3.2
20182017 9M18 9M19
+57%-26%
2.1 3.2 3.3 2.3
9M192017 2018 9M18
+52%-30%

18
IR CONTACTS
Omar El LabbanHead of Investor RelationsEmail: [email protected] #: +2 (02) 24610304
Omar AltmannInvestor Relations OfficerEmail: [email protected] #: +2 (02) 24610316
Ramy MahfouzInvestor Relations OfficerEmail: [email protected] #: +2 (02) 24610319
B Investments Holding S.A.ENile City Towers, South Tower, 7th Floor,2005A Corniche El Nil, Cairo 11221, Egypt
www.binvestmentsegypt.com

ManagedBy